Determinants of plant community composition of remnant biancane badlands: a hierarchical approach to quantify species-environment relationships S. Maccherini, M. Marignani, M. Gioria, M. Renzi, D. Rocchini, E. Santi, D. Torri, J. Tundo & O. Honnay Keywords Bromus erectus grasslands; Conservation; Cultural landscape; Habitat degradation; Multi-scale approach; Remnant vegetation; Variation partitioning Abbreviations DEM = Digital Elevation Model; NDVI = Normalized Difference Vegetation Index; NIR = Near-infrared; RDA = Redundancy Analysis. Nomenclature Pignatti (1982) and Conti et al. (2005) for Artemisia caerulescens subsp. cretacea Received 26 February 2010 Accepted 11 February 2011 Co-ordinating Editor: Meelis Partel Maccherini, S. (corresponding author, [email protected]) BIOCONNET, Biodiversity and Conservation Network, Department of Environmental Science ‘G.Sarfatti’, University of Siena, Via P.A. Mattioli 4, I–53100 Siena, Italy Santi, E. ([email protected]): IRPI-CNR, Via Madonna Alta 126, I–06128 Perugia, Italy Marignani, M. ([email protected]): Department of Environmental Biology, ‘Sapienza’ University of Rome, Piazzale Aldo Moro 5, I–00185 Rome, Italy Gioria, M. ([email protected]): School of Agriculture, Food Science and Veterinary Medicine, University College Dublin, Belfield, Dublin 4, Ireland Renzi, M. ([email protected]): Research Centre for lagoon ecology, fisheries and acquaculture, University of Siena, Polo Universitario Grossetano, via Lungolago dei Pescatori, I–58015 Orbetello, Italy Rocchini, D. ([email protected], [email protected]): Fondazione Edmund Mach, Research and Innovation Centre, Department of Biodiversity and Molecular Ecology, GIS and Remote Sensing Unit, Via E. Mach 1, 38010 S. Michele all’Adige (TN), Italy Torri, D. ([email protected]): IRPI-CNR, Via Madonna Alta 126, I–06128 Perugia, Italy Tundo, J. ([email protected]) & Honnay, O. ([email protected]): Laboratory of Plant Ecology, Biology Department, University of Leuven, Arenbergpark 31, B–3001 Heverlee, Belgium. Abstract Question: Which environmental variables best explain patterns in the vegeta- tion of biancane badlands? What is the role of spatial scales in structuring the vegetation of biancane badlands within the agricultural matrix? Location: Five biancane badlands in Central Italy (Tuscany). Methods: An object-oriented approach on high-resolution multispectral images was used to classify physiognomic vegetation types in five biancane badlands. Within each badland, data on vascular plant species abundance were collected using a stratified random design. Variation partitioning based on partial redundancy analysis was used to evaluate the contribution of three sets of environmental predictors, recorded at the spatial scales of plot, patch and biancane badland in explaining patterns in plant community composition. Results: Environmental variables included in the final model – electrical conductivity and carbon/nitrogen ratio (plot scale), shape index (patch scale) and area (biancane badland scale) – accounted for 15.5% of the total variation in plant community composition. Soil characteristics measured at the plot level explained the majority of variation. In the smallest badlands, Bromus erectus perennial grasslands were absent, while annual grasslands, linked with harsh soil conditions (i.e. high soil salinity), were not affected by either the surface area of biancane badlands or by the soil nitrogen availability. Conclusions: The identification of the major predictors of patterns in remnant vegetation requires conducting investigations at multiple spatial scale. Manage- ment strategies should operate at different spatial scale, preventing any further reduction in the size of existing badlands and relying on habitat- instead of area-focused conservation practices. Introduction Modern agriculture represents a major threat to global biodiversity (McIntyre & Hobbs 1999; Mazzoleni et al. 2004) because of the interaction of two main processes: (1) loss of natural and semi-natural habitats to agriculture and subsequent habitat fragmentation (2) habitat degra- dation (Firbank et al. 2008). These processes operate at different spatial scales and have led to a general decrease in habitat heterogeneity within the agricultural landscape (Tscharntke et al. 2005). At the landscape/regional level, Applied Vegetation Science 14 (2011) 378–387 378 Applied Vegetation Science Doi: 10.1111/j.1654-109X.2011.01131.x r 2011 International Association for Vegetation Science

Welcome message from author
This document is posted to help you gain knowledge. Please leave a comment to let me know what you think about it! Share it to your friends and learn new things together.
Transcript
Determinants of plant community composition ofremnant biancane badlands: a hierarchical approach toquantify species-environment relationships
S. Maccherini, M. Marignani, M. Gioria, M. Renzi, D. Rocchini, E. Santi, D. Torri, J. Tundo &O. Honnay
Keywords
Bromus erectus grasslands; Conservation;
Cultural landscape; Habitat degradation;
Multi-scale approach; Remnant vegetation;
Variation partitioning
Abbreviations
DEM = Digital Elevation Model; NDVI =
Normalized Difference Vegetation Index;
NIR = Near-infrared; RDA = Redundancy
Analysis.
Nomenclature
Pignatti (1982) and Conti et al. (2005) for
Artemisia caerulescens subsp. cretacea
Received 26 February 2010
Accepted 11 February 2011
Co-ordinating Editor: Meelis Partel
Maccherini, S. (corresponding author,
[email protected]) BIOCONNET, Biodiversity
and Conservation Network, Department of
Environmental Science ‘G.Sarfatti’, University of
Siena, Via P.A. Mattioli 4, I–53100 Siena, Italy
Santi, E. ([email protected]): IRPI-CNR, Via
Madonna Alta 126, I–06128 Perugia, Italy
Marignani, M. ([email protected]):
Department of Environmental Biology, ‘Sapienza’
University of Rome, Piazzale Aldo Moro 5, I–00185
Rome, Italy
Gioria, M. ([email protected]):
School of Agriculture, Food Science and
Veterinary Medicine, University College Dublin,
Belfield, Dublin 4, Ireland
Renzi, M. ([email protected]): Research Centre for
lagoon ecology, fisheries and acquaculture,
University of Siena, Polo Universitario Grossetano,
via Lungolago dei Pescatori, I–58015 Orbetello, Italy
Rocchini, D. ([email protected],
[email protected]): Fondazione Edmund
Mach, Research and Innovation Centre,
Department of Biodiversity and Molecular Ecology,
GIS and Remote Sensing Unit, Via E. Mach 1, 38010
S. Michele all’Adige (TN), Italy
Torri, D. ([email protected]): IRPI-CNR, Via Madonna
Alta 126, I–06128 Perugia, Italy
Tundo, J. ([email protected]) & Honnay, O.
([email protected]): Laboratory of
Plant Ecology, Biology Department, University of
Leuven, Arenbergpark 31, B–3001 Heverlee,
Belgium.
Abstract
Question: Which environmental variables best explain patterns in the vegeta-
tion of biancane badlands? What is the role of spatial scales in structuring the
vegetation of biancane badlands within the agricultural matrix?
Location: Five biancane badlands in Central Italy (Tuscany).
Methods: An object-oriented approach on high-resolution multispectral
images was used to classify physiognomic vegetation types in five biancane
badlands. Within each badland, data on vascular plant species abundance were
collected using a stratified random design. Variation partitioning based on
partial redundancy analysis was used to evaluate the contribution of three sets
of environmental predictors, recorded at the spatial scales of plot, patch and
biancane badland in explaining patterns in plant community composition.
Results: Environmental variables included in the final model – electrical
conductivity and carbon/nitrogen ratio (plot scale), shape index (patch scale)
and area (biancane badland scale) – accounted for 15.5% of the total variation
in plant community composition. Soil characteristics measured at the plot level
explained the majority of variation. In the smallest badlands, Bromus erectus
perennial grasslands were absent, while annual grasslands, linked with harsh
soil conditions (i.e. high soil salinity), were not affected by either the surface
area of biancane badlands or by the soil nitrogen availability.
Conclusions: The identification of the major predictors of patterns in remnant
vegetation requires conducting investigations at multiple spatial scale. Manage-
ment strategies should operate at different spatial scale, preventing any further
reduction in the size of existing badlands and relying on habitat- instead of
area-focused conservation practices.
Introduction
Modern agriculture represents a major threat to global
biodiversity (McIntyre & Hobbs 1999; Mazzoleni et al.
2004) because of the interaction of two main processes:
(1) loss of natural and semi-natural habitats to agriculture
and subsequent habitat fragmentation (2) habitat degra-
dation (Firbank et al. 2008). These processes operate at
different spatial scales and have led to a general decrease
in habitat heterogeneity within the agricultural landscape
(Tscharntke et al. 2005). At the landscape/regional level,
Applied Vegetation Science 14 (2011) 378–387
378Applied Vegetation Science
Doi: 10.1111/j.1654-109X.2011.01131.x r 2011 International Association for Vegetation Science
larger farm units have resulted in larger areas under
similar management systems (Firbank et al. 2008). At the
level of farm/fields, there has been a general decrease in
crop diversity, a removal of non-farmed areas such as
ponds and non-farmed field margins, as well as an
increase in field size and subsequent loss of field margins.
Within fields, practices such as increases in nutrient and
pesticides input have resulted in habitat degradation and
eutrophication (Tscharntke et al. 2005; Firbank et al.
2008).
Changes within the agricultural matrix, at the land-
scape level, as well as within and between fields, have had
detrimental effects on remnant vegetation, which has
often become confined to small, fragmented patches,
provoking loss of biodiversity (Benton 2001; Berendse et
al. 2004; Cousins et al. 2007; Fisher & Lindenmayer
2007). A considerable number of studies have character-
ized the effects of habitat fragmentation on animal popu-
lations (see Fisher & Lindenmayer 2007 for a review) and
temperate forest plant species (Honnay et al. 1999; God-
efroid & Koedam 2003; Hobbs & Yates 2003; Kolb &
Diekmann 2005; Rosati et al. 2010), although these
investigations mainly focused on relatively homogeneous
habitat patches and not on complex remnant patches
with more than one vegetation type. In grassland ecosys-
tems, the impact of changes in local environmental vari-
ables and management practices, including increases in
soil nutrient levels and destruction of natural and semi-
natural landscape features appear to be the major deter-
minants of plant community patterns in remnant grass-
land communities, while the role of factors such as patch
shape and dimension, that tend to operate at level of
landscape, appear to be only secondary (Wright et al.
2003; Helm et al. 2006; Rocchini et al. 2006; Klimek et al.
2007, 2008; Marini et al. 2007, 2008).
Biancane badlands are listed on the UNESCO World
Heritage list as valuable cultural landscape supporting
several plant communities of high conservation interest,
a number of endemic species (Chiarucci et al. 1995), as
well as Bromus erectus grasslands, habitats considered of
European concern (Festuco-Brometalia priority habitats,
European Commission 1992). The major threats to the
biodiversity of biancane badlands are natural vegetation
succession and intensification of agricultural practices.
Over the past 50 ys, agricultural activities have progres-
sively transformed this cultural landscape through land
reclamation for arable cultivation and field enlargement.
These changes have led to a general homogenization of
these landscapes, with a strong contraction of the remain-
ing badlands, which became confined to small, sometimes
protected, areas scattered within an intensively farmed
landscape. Disruptions of these intensely-dissected land-
scapes have in turn resulted in changes in plant community
composition because of the spread of generalist plant
species that occupy broad environmental ranges, leading
to a general decline in plant diversity (Marignani et al.
2008). Recent studies on the invertebrate fauna in these
landscapes have shown that the extent of the fields of
biancane badlands is the primary determinant of orthop-
teran species richness, together with habitat diversity
(Marini et al. 2010).
In this study, we aimed to identify the local and
regional environmental variables and processes that are
most important in determining patterns in the vegetation
of biancane badlands. As the species–environment rela-
tionships are known to vary with scale of observation and
because of the high heterogeneity of biancane landscape,
we used a range of environmental predictors that were
classified at three spatial scales (plot, patch and badland).
Specifically, remote sensing techniques were employed to
optimize our vegetation sampling design, and partitioning
of variation was used to evaluate the contribution of spatial
scale in determining vegetation patterns in such land-
scapes. This information is central to the development of
sound management and conservation strategies aimed at
protecting the diversity of the biancane badlands.
Methods
Study area
The study area is located in the district of Asciano
(centroid coordinates: longitude 1113100300 E, latitude
4311500300 N, datum ED50), a 215 km2 area situated in
Crete Senesi, near Siena, central Italy (Fig. 1). The overall
area of the Crete Senesi includes the basins of the Asso,
Ombrone and Arbia rivers, north of Montalcino and
Pienza and south of Siena covering an area of 320 km2.
The hilly parts of this landscape are characterized by
outcrops that are mainly composed of Pliocenic marine
sediments, while valleys are typically formed by recent
fluvial deposits (Guasparri 1978). The typical morphology
of this landscape originates from the erosion of claystone,
which results in particular forms of erosion and includes
biancane badlands, balze, vertical facies, calanchi, eroded
claystone hill sides and domes (Phillips 1998; Marignani
et al. 2008). Badlands represent unique geomorphological
features that often develop on unconsolidated or poorly
cemented materials, usually present in arid and semi-arid
areas, with alternating wet and dry periods (Bryan & Yair
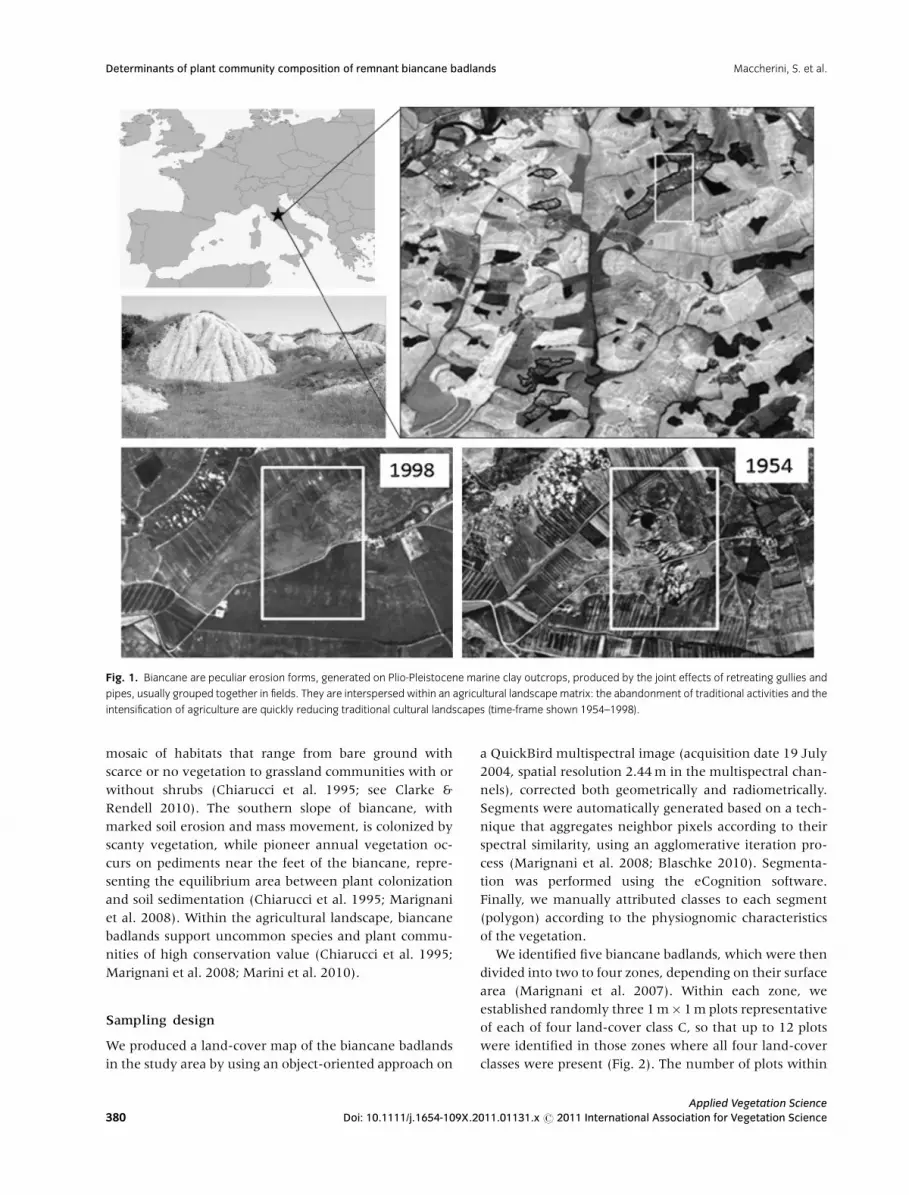
1982). Biancane are badlands that are found specifically
in central and south of Italy and consist of dome-shaped
forms, generally less than 20 m high, which can often be
found grouped into fields (Fig. 1, Guasparri 1978; Ra-
glione et al. 1980; Alexander 1982). In biancane bad-
lands, erosion has cut through a single substratum of Plio-
Pleistocenic marine clays causing its differentiation into a
Maccherini, S. et al. Determinants of plant community composition of remnant biancane badlands
Applied Vegetation Science
Doi: 10.1111/j.1654-109X.2011.01131.x r 2011 International Association for Vegetation Science 379
mosaic of habitats that range from bare ground with
scarce or no vegetation to grassland communities with or
without shrubs (Chiarucci et al. 1995; see Clarke &
Rendell 2010). The southern slope of biancane, with
marked soil erosion and mass movement, is colonized by
scanty vegetation, while pioneer annual vegetation oc-
curs on pediments near the feet of the biancane, repre-
senting the equilibrium area between plant colonization
and soil sedimentation (Chiarucci et al. 1995; Marignani
et al. 2008). Within the agricultural landscape, biancane
badlands support uncommon species and plant commu-
nities of high conservation value (Chiarucci et al. 1995;
Marignani et al. 2008; Marini et al. 2010).
Sampling design
We produced a land-cover map of the biancane badlands
in the study area by using an object-oriented approach on
a QuickBird multispectral image (acquisition date 19 July
2004, spatial resolution 2.44 m in the multispectral chan-
nels), corrected both geometrically and radiometrically.
Segments were automatically generated based on a tech-
nique that aggregates neighbor pixels according to their
spectral similarity, using an agglomerative iteration pro-
cess (Marignani et al. 2008; Blaschke 2010). Segmenta-
tion was performed using the eCognition software.
Finally, we manually attributed classes to each segment
(polygon) according to the physiognomic characteristics
of the vegetation.
We identified five biancane badlands, which were then
divided into two to four zones, depending on their surface
area (Marignani et al. 2007). Within each zone, we
established randomly three 1 m� 1 m plots representative
of each of four land-cover class C, so that up to 12 plots
were identified in those zones where all four land-cover
classes were present (Fig. 2). The number of plots within
Fig. 1. Biancane are peculiar erosion forms, generated on Plio-Pleistocene marine clay outcrops, produced by the joint effects of retreating gullies and
pipes, usually grouped together in fields. They are interspersed within an agricultural landscape matrix: the abandonment of traditional activities and the
intensification of agriculture are quickly reducing traditional cultural landscapes (time-frame shown 1954–1998).
Determinants of plant community composition of remnant biancane badlands Maccherini, S. et al.
380Applied Vegetation Science
Doi: 10.1111/j.1654-109X.2011.01131.x r 2011 International Association for Vegetation Science
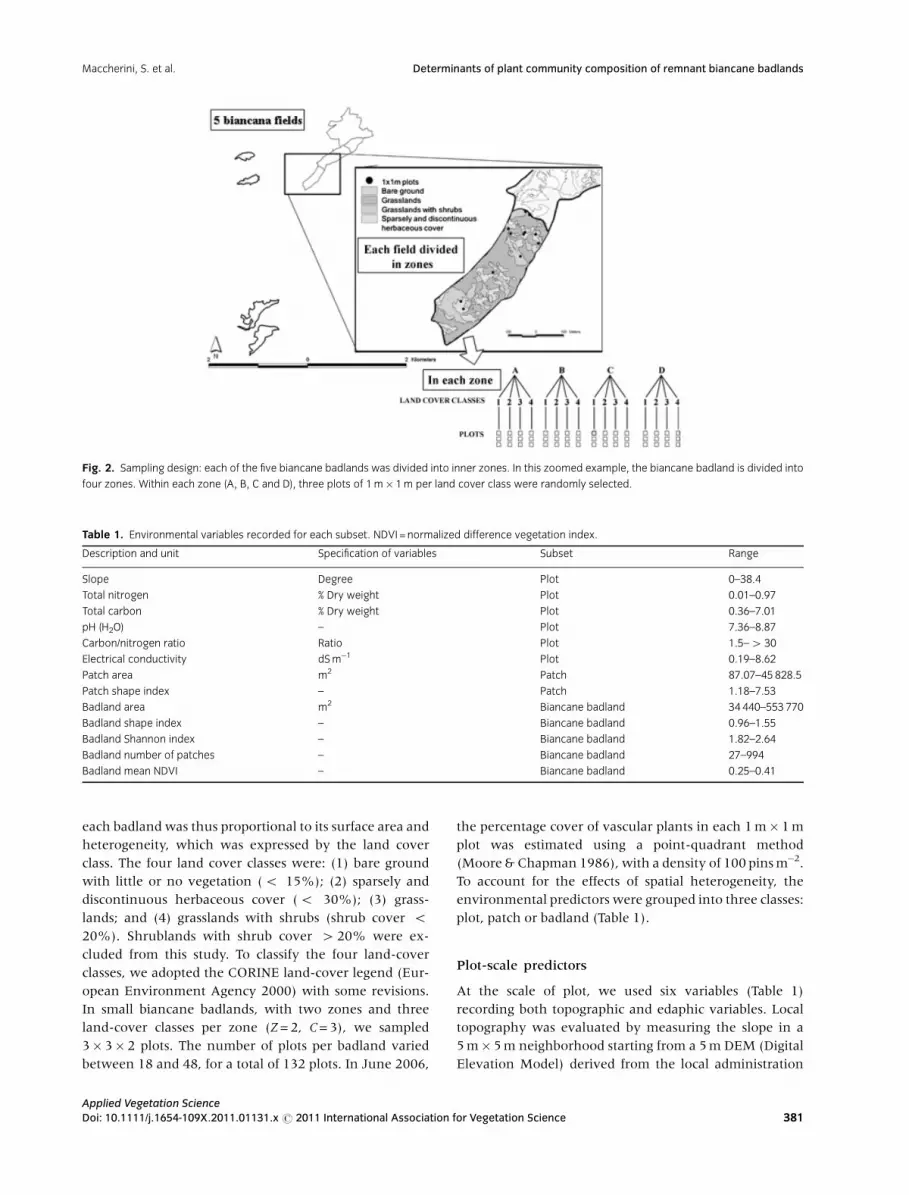
each badland was thus proportional to its surface area and
heterogeneity, which was expressed by the land cover
class. The four land cover classes were: (1) bare ground
with little or no vegetation (o 15%); (2) sparsely and
discontinuous herbaceous cover (o 30%); (3) grass-
lands; and (4) grasslands with shrubs (shrub cover o20%). Shrublands with shrub cover 420% were ex-
cluded from this study. To classify the four land-cover
classes, we adopted the CORINE land-cover legend (Eur-
opean Environment Agency 2000) with some revisions.
In small biancane badlands, with two zones and three
land-cover classes per zone (Z = 2, C = 3), we sampled
3� 3� 2 plots. The number of plots per badland varied
between 18 and 48, for a total of 132 plots. In June 2006,
the percentage cover of vascular plants in each 1 m� 1 m
plot was estimated using a point-quadrant method
(Moore & Chapman 1986), with a density of 100 pins m�2.
To account for the effects of spatial heterogeneity, the
environmental predictors were grouped into three classes:
plot, patch or badland (Table 1).
Plot-scale predictors
At the scale of plot, we used six variables (Table 1)
recording both topographic and edaphic variables. Local
topography was evaluated by measuring the slope in a
5 m� 5 m neighborhood starting from a 5 m DEM (Digital
Elevation Model) derived from the local administration
Fig. 2. Sampling design: each of the five biancane badlands was divided into inner zones. In this zoomed example, the biancane badland is divided into
four zones. Within each zone (A, B, C and D), three plots of 1 m� 1 m per land cover class were randomly selected.
Table 1. Environmental variables recorded for each subset. NDVI = normalized difference vegetation index.
Description and unit Specification of variables Subset Range
Slope Degree Plot 0–38.4
Total nitrogen % Dry weight Plot 0.01–0.97
Total carbon % Dry weight Plot 0.36–7.01
pH (H2O) – Plot 7.36–8.87
Carbon/nitrogen ratio Ratio Plot 1.5–4 30
Electrical conductivity dS m�1 Plot 0.19–8.62
Patch area m2 Patch 87.07–45 828.5
Patch shape index – Patch 1.18–7.53
Badland area m2 Biancane badland 34 440–553 770
Badland shape index – Biancane badland 0.96–1.55
Badland Shannon index – Biancane badland 1.82–2.64
Badland number of patches – Biancane badland 27–994
Badland mean NDVI – Biancane badland 0.25–0.41
Maccherini, S. et al. Determinants of plant community composition of remnant biancane badlands
Applied Vegetation Science
Doi: 10.1111/j.1654-109X.2011.01131.x r 2011 International Association for Vegetation Science 381

topographic map of the area (scale of 1:5000). In each
plot, we took one soil sample, which was then sieved
using a 2-mm diameter mesh sieve and oven-dried at
105 1C for 2 days (Benton 2001). Dried sediments were
analysed in triplicate by direct total flash combustion
using a CHNS (carbon, hydrogen, nitrogen and sulphur)
analyser with a thermo-conductivity detector TCD (mod.
CHN/O 200; Perkin Elmer Inc., Waltham, MA, USA), to
determine average total organic carbon (TOC) and total
nitrogen (TN). When N was undetectable, an arbitrary
value of 0.01 was assigned. We then calculated the C/N
ratio as well as indices of soil N availability (Schroth &
Sinclair 2003), while pH levels and electrical conductivity
(EC, dS m�1) were measured in leached water using two
pre-calibrated electronic probes (WTW I 430 and WTW I
340 multimeter, respectively; WTWs, Weilheim, DE).
Patch-scale predictors
At patch scale we used two variables (Table 1). The patch
shape index was calculated as an indicator of habitat
fragmentation, expressed at the level of patch i, as follows:
SI ¼ Pi=ð2ppAiÞ; ð1Þ
where Pi and Ai represent the perimeter and area of the
patch i, respectively. SI directly estimates the complexity of
the shape, also called compactness, of individual patches
(see McGarigal & Marks 1995). The more the patches are
elongated and complex, the higher the shape index.
Badland scale predictors
At the biancane badland scale we used five variables
(Table 1). Plant biomass was estimated using the mean
normalized difference vegetation index (NDVI), a nor-
malized ratio of NIR (near infrared) and red bands. This
vegetation index is based on (i) the high reflectance by
vegetation in the NIR that is linked to scattering processes
at the leaf scale (leaf shape and size), water content of the
vegetation, overall plant architecture, and density of
vegetation cover, as well as on (ii) the low reflectance in
the Red due to the absorption by chloroplasts for photo-
synthesis (Lillesand et al. 2004). The NDVI varies theore-
tically from � 1 (low biomass) and 1 (high biomass). The
mean NDVI was derived from the QuickBird image.
The diversity of the vegetation at the level of badland
was measured using the Shannon diversity index (Shan-
non & Weaver 1962; Boltzmann 1872), which was calcu-
lated as follows:
H0 ¼ �XM
c�1
ðPc ln PcÞ; ð2Þ
where M, number of land cover classes (c); Pc, the
proportion of the area occupied by each land cover class.
Data analysis
Three-way nested ANOVA was carried out to test if soil
characteristics measured at the plot level differed among
biancane badland (fixed factor), zone (fixed factor nested
within biancane badland) and land-cover classes (fixed
factor crossed with zone and biancane badland).
We used variation partitioning to decompose the varia-
tion in plant species composition of biancane badlands
plant communities into a number of independent compo-
nents reflecting the relative importance of multiple sets of
predictors, measured at different spatial scales, and their
joint effects (Borcard et al. 1992). This method is useful to
analyse hierarchically structured landscape data, by ex-
plicitly evaluating the contribution of sets of factors that
had been measured at different spatial scale to the struc-
ture of biotic communities (Cushman & McGarigal
2002).To date, hierarchical partitioning has been used
sporadically to assess plant–environmental relationships
in grassland ecosystems (Marini et al. 2008).
The variation in plant species composition was decom-
posed into the three sets of explanatory variables, one for
each spatial scale (i.e. plot, patch and biancane badland).
Partial regression analyses for each set of explanatory
variables were performed using redundancy analysis
(RDA; ter Braak 1988, see Borcard et al. 1992) and
partitioning was based on an adjusted R2 statistic (Radj2 ,
see Peres-Neto et al. 2006). The significance of the first
ordination axis and that of all the axes was tested using
499 Monte Carlo permutations.
Before data analyses, each set of explanatory variables
was analysed separately using multiple regression analy-
sis to obtain a subset of significative variables that may
explain the residual variation in each model (for complete
results see the Supporting Information, Appendix S1).
Regression analyses were performed using a permuta-
tional forward procedure of model selection proposed by
Blanchet et al. (2008). This procedure was used because it
overcomes two major problems: (1) an inflated Type I
error rate and (2) the overestimation of the overall
variance explained by the model, by applying a permuta-
tion of residuals under a reduced model. The forward
selection procedure used in this study is based on two
stopping criteria: (1) the alpha significance level (here set
at 0.05), and (2) the adjusted coefficient of multiple
determination (Radj2 ) calculated using all explanatory vari-
ables. Only significant variables (Po0.05) were included
in the final models. Unconstrained ordination (principal
component analysis) was performed to understand how
much of the plant species composition data can be
explained by the selected set of environmental variables
(Leps & Smilauer 2003). For a list of selected explanatory
variables used in the final model, see Table 3.
Determinants of plant community composition of remnant biancane badlands Maccherini, S. et al.
382Applied Vegetation Science
Doi: 10.1111/j.1654-109X.2011.01131.x r 2011 International Association for Vegetation Science
Partial redundancy analyses were performed with the
subset of selected environmental variables to estimate the
fraction of variation of dependent variable (plant species
composition) that can be attributed to each environmen-
tal variables by treating the explanatory environmental
variables as covariables. This method of variation parti-
tioning allowed determining the following eight different
components: (1) conditional effect of plot predictors (Pl);
(2) conditional effect of patch predictors (Pa); (3) condi-
tional effect badland predictors (B); (4) variation ex-
plained by plot and patch predictors (Pl \ Pa); (5)
variation explained by plot and badland predictors
(Pl \ B); (6) variation explained by patch and badland
predictors (Pa \ B); (7) variation explained by the three
components (Pl \ Pa \ B); and (8) variation not ex-
plained by the explanatory variables included in the
analysis. The shared variation components were obtained
by subtraction within the variation partitioning approach.
Before multivariate analyses, species abundance data
were log(x11) transformed and electrical conductivity
values was log-transformed. Statistical analyses were
performed using the software CANOCO for Windows (v.
4.5, ter Braak & Smilauer 2002) and R for Windows (v.
2.9.2 R Development Core Team 2009). Multiple regres-
sion analysis based on the forward procedure proposed by
Blanchet et al. (2008) was conducted using the ‘‘forward.-
sel’’ function available in the R ‘‘packfor’’ library (Dray
2004); variation partitioning analysis was performed
using the ‘‘varpart’’ function in the ‘‘vegan’’ library (Oksa-
nen et al. 2011).
Results
A total of 117 species were collected from 111 plots within
five biancane badlands. Overall, we identified 21 empty
plots, represented by bare ground with no vegetation,
particularly on the southern slopes, and sparse vegetation
characterized by substantial soil erosion and mass move-
ment (typical clayey Xerorthents, Chiarucci et al. 1995).
While the annual grassland type supporting the endemic
species Artemisia caerulescens subsp. cretacea (Fiori) Br.-
Catt. & Gubell and empty plots were present in all five
badlands, grasslands with scrubs were absent from the
smaller biancane badlands.
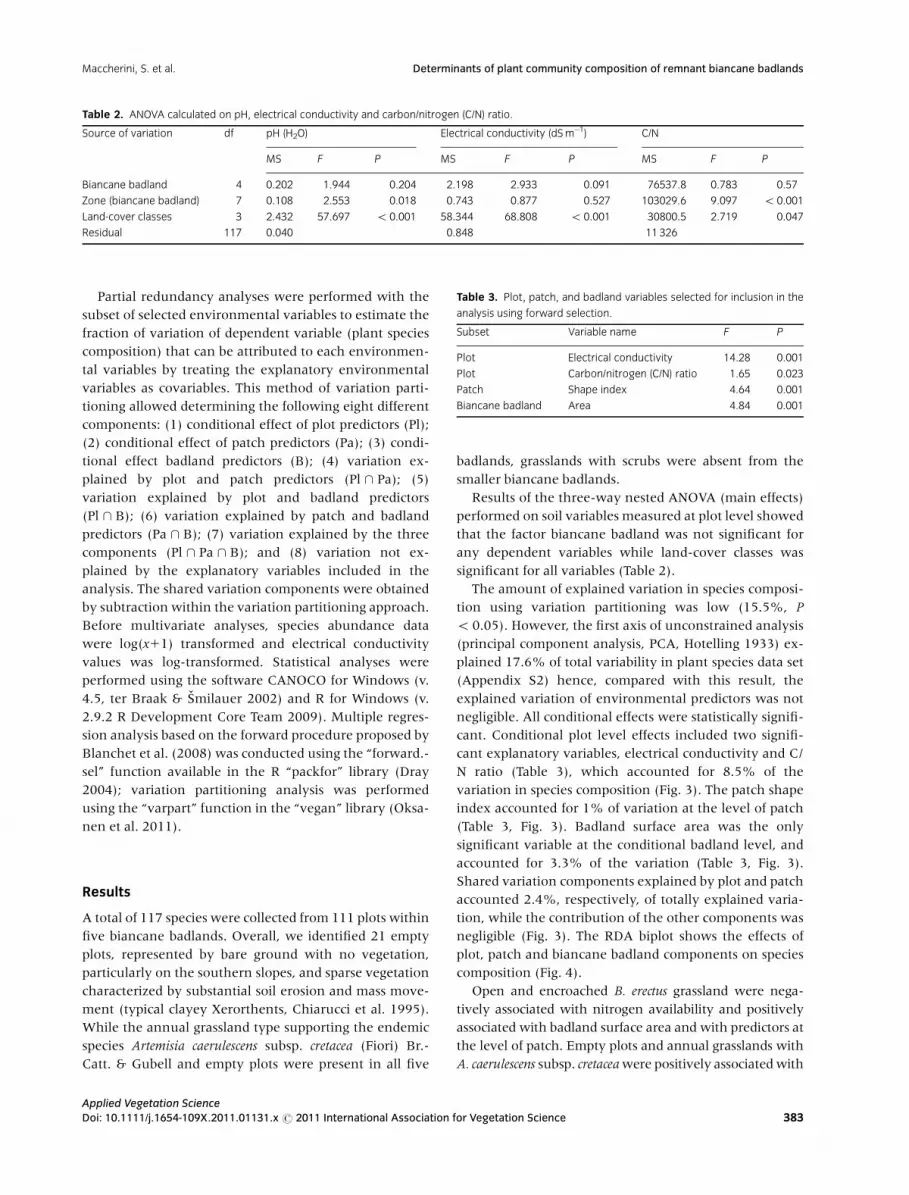
Results of the three-way nested ANOVA (main effects)
performed on soil variables measured at plot level showed
that the factor biancane badland was not significant for
any dependent variables while land-cover classes was
significant for all variables (Table 2).
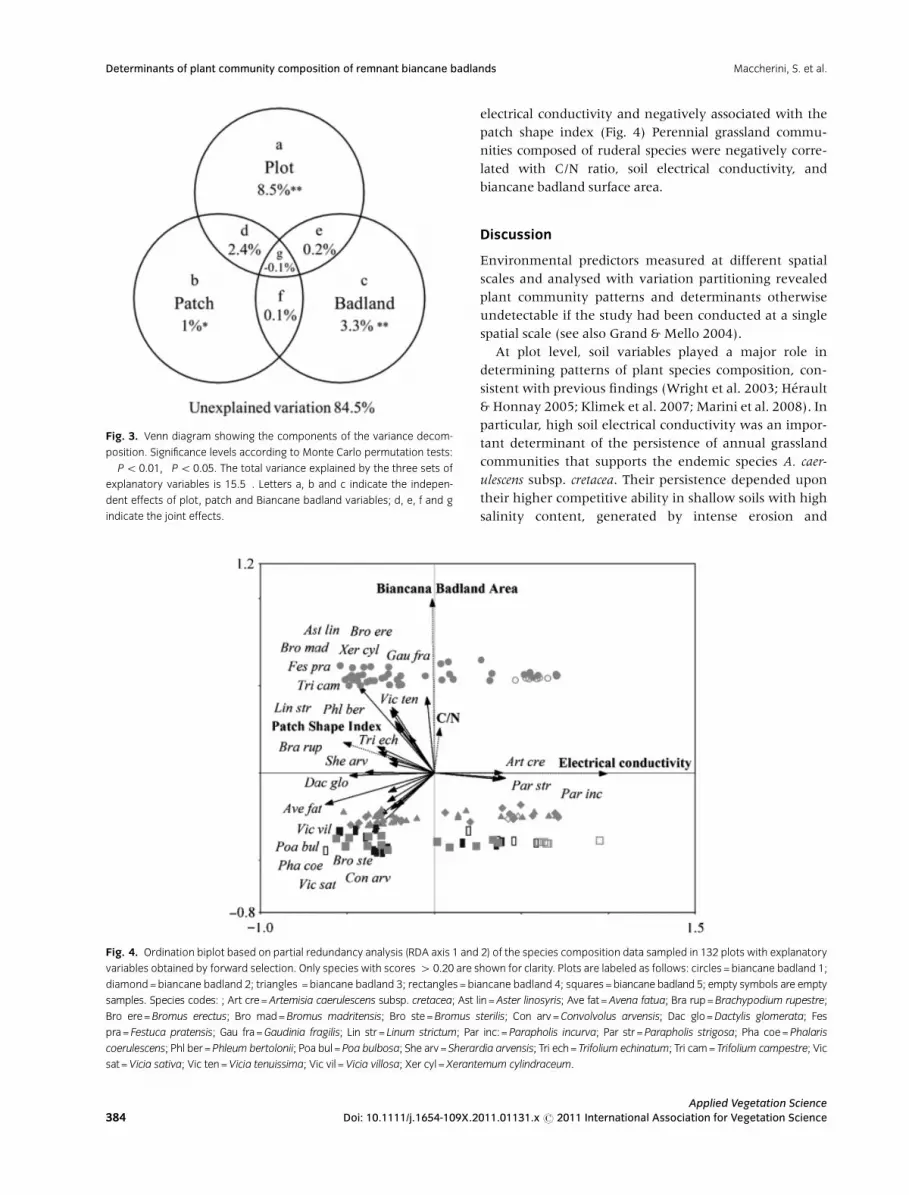
The amount of explained variation in species composi-
tion using variation partitioning was low (15.5%, P
o0.05). However, the first axis of unconstrained analysis
(principal component analysis, PCA, Hotelling 1933) ex-
plained 17.6% of total variability in plant species data set
(Appendix S2) hence, compared with this result, the
explained variation of environmental predictors was not
negligible. All conditional effects were statistically signifi-
cant. Conditional plot level effects included two signifi-
cant explanatory variables, electrical conductivity and C/
N ratio (Table 3), which accounted for 8.5% of the
variation in species composition (Fig. 3). The patch shape
index accounted for 1% of variation at the level of patch
(Table 3, Fig. 3). Badland surface area was the only
significant variable at the conditional badland level, and
accounted for 3.3% of the variation (Table 3, Fig. 3).
Shared variation components explained by plot and patch
accounted 2.4%, respectively, of totally explained varia-
tion, while the contribution of the other components was
negligible (Fig. 3). The RDA biplot shows the effects of
plot, patch and biancane badland components on species
composition (Fig. 4).
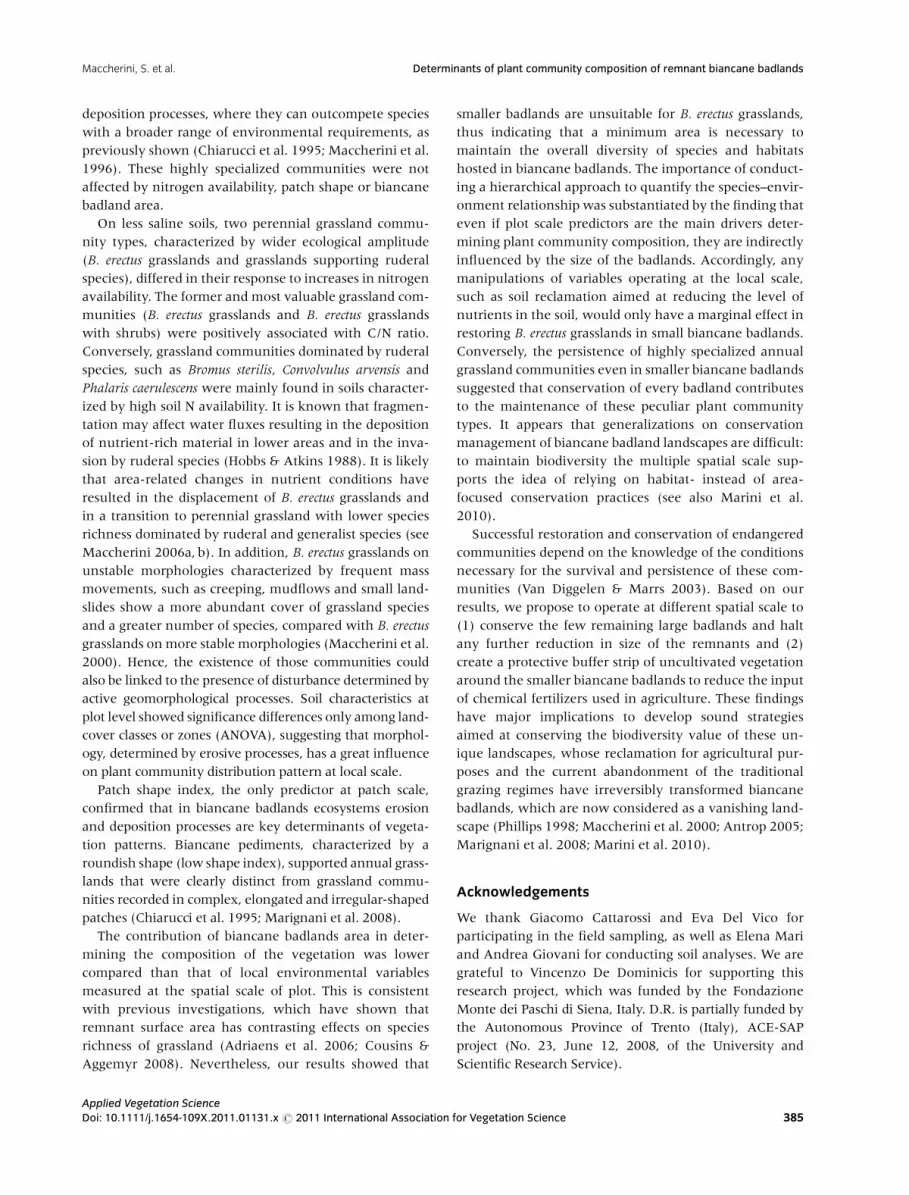
Open and encroached B. erectus grassland were nega-
tively associated with nitrogen availability and positively
associated with badland surface area and with predictors at
the level of patch. Empty plots and annual grasslands with
A. caerulescens subsp. cretacea were positively associated with
Table 2. ANOVA calculated on pH, electrical conductivity and carbon/nitrogen (C/N) ratio.
Source of variation df pH (H2O) Electrical conductivity (dS m�1) C/N
MS F P MS F P MS F P
Biancane badland 4 0.202 1.944 0.204 2.198 2.933 0.091 76537.8 0.783 0.57
Zone (biancane badland) 7 0.108 2.553 0.018 0.743 0.877 0.527 103029.6 9.097 o 0.001
Land-cover classes 3 2.432 57.697 o 0.001 58.344 68.808 o 0.001 30800.5 2.719 0.047
Residual 117 0.040 0.848 11 326
Table 3. Plot, patch, and badland variables selected for inclusion in the
analysis using forward selection.
Subset Variable name F P
Plot Electrical conductivity 14.28 0.001
Plot Carbon/nitrogen (C/N) ratio 1.65 0.023
Patch Shape index 4.64 0.001
Biancane badland Area 4.84 0.001
Maccherini, S. et al. Determinants of plant community composition of remnant biancane badlands
Applied Vegetation Science
Doi: 10.1111/j.1654-109X.2011.01131.x r 2011 International Association for Vegetation Science 383
electrical conductivity and negatively associated with the
patch shape index (Fig. 4) Perennial grassland commu-
nities composed of ruderal species were negatively corre-
lated with C/N ratio, soil electrical conductivity, and
biancane badland surface area.
Discussion
Environmental predictors measured at different spatial
scales and analysed with variation partitioning revealed
plant community patterns and determinants otherwise
undetectable if the study had been conducted at a single
spatial scale (see also Grand & Mello 2004).
At plot level, soil variables played a major role in
determining patterns of plant species composition, con-
sistent with previous findings (Wright et al. 2003; Herault
& Honnay 2005; Klimek et al. 2007; Marini et al. 2008). In
particular, high soil electrical conductivity was an impor-
tant determinant of the persistence of annual grassland
communities that supports the endemic species A. caer-
ulescens subsp. cretacea. Their persistence depended upon
their higher competitive ability in shallow soils with high
salinity content, generated by intense erosion and
Fig. 3. Venn diagram showing the components of the variance decom-
position. Significance levels according to Monte Carlo permutation tests:��Po 0.01, �Po 0.05. The total variance explained by the three sets of
explanatory variables is 15.5�. Letters a, b and c indicate the indepen-
dent effects of plot, patch and Biancane badland variables; d, e, f and g
indicate the joint effects.
Fig. 4. Ordination biplot based on partial redundancy analysis (RDA axis 1 and 2) of the species composition data sampled in 132 plots with explanatory
variables obtained by forward selection. Only species with scores 4 0.20 are shown for clarity. Plots are labeled as follows: circles = biancane badland 1;
diamond = biancane badland 2; triangles = biancane badland 3; rectangles = biancane badland 4; squares = biancane badland 5; empty symbols are empty
samples. Species codes: ; Art cre = Artemisia caerulescens subsp. cretacea; Ast lin = Aster linosyris; Ave fat = Avena fatua; Bra rup = Brachypodium rupestre;
Bro ere = Bromus erectus; Bro mad = Bromus madritensis; Bro ste = Bromus sterilis; Con arv = Convolvolus arvensis; Dac glo = Dactylis glomerata; Fes
pra = Festuca pratensis; Gau fra = Gaudinia fragilis; Lin str = Linum strictum; Par inc: = Parapholis incurva; Par str = Parapholis strigosa; Pha coe = Phalaris
coerulescens; Phl ber = Phleum bertolonii; Poa bul = Poa bulbosa; She arv = Sherardia arvensis; Tri ech = Trifolium echinatum; Tri cam = Trifolium campestre; Vic
sat = Vicia sativa; Vic ten = Vicia tenuissima; Vic vil = Vicia villosa; Xer cyl = Xerantemum cylindraceum.
Determinants of plant community composition of remnant biancane badlands Maccherini, S. et al.
384Applied Vegetation Science
Doi: 10.1111/j.1654-109X.2011.01131.x r 2011 International Association for Vegetation Science
deposition processes, where they can outcompete species
with a broader range of environmental requirements, as
previously shown (Chiarucci et al. 1995; Maccherini et al.
1996). These highly specialized communities were not
affected by nitrogen availability, patch shape or biancane
badland area.
On less saline soils, two perennial grassland commu-
nity types, characterized by wider ecological amplitude
(B. erectus grasslands and grasslands supporting ruderal
species), differed in their response to increases in nitrogen
availability. The former and most valuable grassland com-
munities (B. erectus grasslands and B. erectus grasslands
with shrubs) were positively associated with C/N ratio.
Conversely, grassland communities dominated by ruderal
species, such as Bromus sterilis, Convolvulus arvensis and
Phalaris caerulescens were mainly found in soils character-
ized by high soil N availability. It is known that fragmen-
tation may affect water fluxes resulting in the deposition
of nutrient-rich material in lower areas and in the inva-
sion by ruderal species (Hobbs & Atkins 1988). It is likely
that area-related changes in nutrient conditions have
resulted in the displacement of B. erectus grasslands and
in a transition to perennial grassland with lower species
richness dominated by ruderal and generalist species (see
Maccherini 2006a, b). In addition, B. erectus grasslands on
unstable morphologies characterized by frequent mass
movements, such as creeping, mudflows and small land-
slides show a more abundant cover of grassland species
and a greater number of species, compared with B. erectus
grasslands on more stable morphologies (Maccherini et al.
2000). Hence, the existence of those communities could
also be linked to the presence of disturbance determined by
active geomorphological processes. Soil characteristics at
plot level showed significance differences only among land-
cover classes or zones (ANOVA), suggesting that morphol-
ogy, determined by erosive processes, has a great influence
on plant community distribution pattern at local scale.
Patch shape index, the only predictor at patch scale,
confirmed that in biancane badlands ecosystems erosion
and deposition processes are key determinants of vegeta-
tion patterns. Biancane pediments, characterized by a
roundish shape (low shape index), supported annual grass-
lands that were clearly distinct from grassland commu-
nities recorded in complex, elongated and irregular-shaped
patches (Chiarucci et al. 1995; Marignani et al. 2008).
The contribution of biancane badlands area in deter-
mining the composition of the vegetation was lower
compared than that of local environmental variables
measured at the spatial scale of plot. This is consistent
with previous investigations, which have shown that
remnant surface area has contrasting effects on species
richness of grassland (Adriaens et al. 2006; Cousins &
Aggemyr 2008). Nevertheless, our results showed that
smaller badlands are unsuitable for B. erectus grasslands,
thus indicating that a minimum area is necessary to
maintain the overall diversity of species and habitats
hosted in biancane badlands. The importance of conduct-
ing a hierarchical approach to quantify the species–envir-
onment relationship was substantiated by the finding that
even if plot scale predictors are the main drivers deter-
mining plant community composition, they are indirectly
influenced by the size of the badlands. Accordingly, any
manipulations of variables operating at the local scale,
such as soil reclamation aimed at reducing the level of
nutrients in the soil, would only have a marginal effect in
restoring B. erectus grasslands in small biancane badlands.
Conversely, the persistence of highly specialized annual
grassland communities even in smaller biancane badlands
suggested that conservation of every badland contributes
to the maintenance of these peculiar plant community
types. It appears that generalizations on conservation
management of biancane badland landscapes are difficult:
to maintain biodiversity the multiple spatial scale sup-
ports the idea of relying on habitat- instead of area-
focused conservation practices (see also Marini et al.
2010).
Successful restoration and conservation of endangered
communities depend on the knowledge of the conditions
necessary for the survival and persistence of these com-
munities (Van Diggelen & Marrs 2003). Based on our
results, we propose to operate at different spatial scale to
(1) conserve the few remaining large badlands and halt
any further reduction in size of the remnants and (2)
create a protective buffer strip of uncultivated vegetation
around the smaller biancane badlands to reduce the input
of chemical fertilizers used in agriculture. These findings
have major implications to develop sound strategies
aimed at conserving the biodiversity value of these un-
ique landscapes, whose reclamation for agricultural pur-
poses and the current abandonment of the traditional
grazing regimes have irreversibly transformed biancane
badlands, which are now considered as a vanishing land-
scape (Phillips 1998; Maccherini et al. 2000; Antrop 2005;
Marignani et al. 2008; Marini et al. 2010).
Acknowledgements
We thank Giacomo Cattarossi and Eva Del Vico for
participating in the field sampling, as well as Elena Mari
and Andrea Giovani for conducting soil analyses. We are
grateful to Vincenzo De Dominicis for supporting this
research project, which was funded by the Fondazione
Monte dei Paschi di Siena, Italy. D.R. is partially funded by
the Autonomous Province of Trento (Italy), ACE-SAP
project (No. 23, June 12, 2008, of the University and
Scientific Research Service).
Maccherini, S. et al. Determinants of plant community composition of remnant biancane badlands
Applied Vegetation Science
Doi: 10.1111/j.1654-109X.2011.01131.x r 2011 International Association for Vegetation Science 385
References
Adriaens, D., Honnay, O. & Hermy, M. 2006. No evidence of a
plant extinction debt in highly fragmented calcareous
grasslands in Belgium. Biological Conservation 133: 212–224.
Alexander, D. 1982. Differences between ‘calanchi’ and
‘biancane’ badlands in Italy. In: Bryan, R.B. & Yair, A.
(eds.) Badland geomorphology and piping. pp. 71–87. Geo
abstracts, Norwich, UK.
Antrop, M. 2005. Why landscapes of the past are important for
the future. Landscape and Urban Planning 70: 21–34.
Benton, J.J. 2001. Laboratory guide for conducting soil tests and
plant analysis. CRC press LLC, Boca Raton, FL, US, 196pp.
Berendse, F., Chamberlain, D., Kleijn, D. & Schekkerman, H.
2004. Declining biodiversity in agricultural landscapes and
the effectiveness of agri-environment schemes. Ambio 8:
499–502.
Blanchet, F.G., Legendre, P. & Borcard, D. 2008. Forward
selection of explanatory variables. Ecology 89: 2623–2632.
Blaschke, T. 2010. Object based image analysis for remote
sensing. ISPRS Journal of Photogrammetry and Remote Sensing
65: 2–16.
Boltzmann, L. 1872. Weitere Studien uber das Warmegleich-
gewicht unter Gasmolekulen. Wiener Berichte 66: 275–370.
Borcard, D., Legendre, P. & Drapeau, P. 1992. Partialling out the
spatial component of ecological variation. Ecology 73:
1045–1055.
Bryan, R.B. & Yair, A. 1982. Perspectives on studies of badland
geomorphology. In: Bryan, R.B. & Yair, A. (eds.) Badland
geomorphology and piping. pp. 1–12. Geo abstracts, Norwich,
UK.
Chiarucci, A., De Dominicis, V., Ristori, J. & Calzolari, C. 1995.
Biancana badland vegetation in relation to morphology and
soil in Orcia valley, central Italy. Phytocoenologia 25: 69–87.
Clarke, M.L. & Rendell, H.M. 2010. Climate-driven decrease in
erosion in extant Mediterranean badlands. Earth Surface
Processes and Landforms 35: 1281–1288.
Conti, F., Abbate, G., Alessandrini, A. & Blasi, C. (eds.) 2005.
An annotated checklist of the Italian vascular flora. Palombi
Editori, Roma, IT.
Cousins, S.A.O. & Aggemyr, E. 2008. The influence of field shape,
area and surrounding landscape on plant species richness in
grazed ex-fields. Biological Conservation 141: 126–135.
Cousins, S.A.O., Ohlson, H. & Eriksson, O. 2007. Effects of
historical and present fragmentation on plant species
diversity in semi-natural grasslands in Swedish rural
landscapes. Landscape Ecology 22: 723–730.
Cushman, S.A. & McGarigal, K. 2002. Hierarchical, multi-scale
decomposition of species–environment relationships.
Landscape Ecology 17: 637–646.
Dray, S. 2004. Packfor. R package, Version 10.0-6.
European Commission. 1992. European Community Directive 92/
43/EEC. http://www.jncc.gov.uk.
European Environment Agency. 2000. CORINE Land Cover
Technical – Guide Addendum2000, EEA, Copenhagen.
Firbank, L., Petit, S., Smart, S., Blain, A. & Fuller, R.J. 2008.
Assessing the impacts of agricultural intensification on
biodiversity: a British perspective. Philosophical Transactions
of the Royal Society B 363: 777–787.
Fisher, J. & Lindenmayer, D.B. 2007. Landscape modification
and habitat fragmentation: a synthesis. Global Ecology and
Biogeography 16: 265–280.
Godefroid, S. & Koedam, N. 2003. How important are large vs.
small forest remnants for the conservation of the woodland
flora in an urban context? Global Ecology and Biogeography
12: 287–298.
Grand, J. & Mello, M.J. 2004. A multi-scale analysis of
species–environment relationships: rare moths in a pitch
pine–scrub oak (Pinus rigida–Quercus ilicifolia) community.
Biological Conservation 119: 495–506.
Guasparri, G. 1978. Calanchi e biancane nel territorio senese:
studio geomorfologico. L’Universo 58: 97–140.
Helm, A., Hanski, I. & Partel, M. 2006. Slow response of plant
species richness to habitat loss and fragmentation. Ecology
Letters 9: 72–77.
Herault, B. & Honnay, O. 2005. The relative importance of local,
regional and historical factors determining the distribution
of plants in fragmented riverine forests: an emergent group
approach. Journal of Biogeography 32: 2069–2081.
Hobbs, R.J. & Atkins, L. 1988. The effect of disturbance and
nutrient addition on native and introduced annuals in the
Western Australian wheatbelt. Australian Journal Ecology
13: 171–179.
Hobbs, R.J. & Yates, C.J. 2003. Impacts of ecosystem
fragmentation on plant populations: generalising the
idiosyncratic. Australian Journal Botany 51: 471–488.
Honnay, O., Endels, P., Vereecken, H.E. & Hermy, M. 1999. The
role of patch area and habitat diversity in explaining native
plant species richness in disturbed suburban forest patches
in northern Belgium. Diversity and Distributions 5: 129–141.
Hotelling, H. 1933. Analysis of a complex of statistical variables
into principal component. Journal of Educational Psychology
24: 417–441, 498–520.
Klimek, S., Kemmermann, A.R.G., Hofmann, M. & Isselstein, J.
2007. Plant species richness and composition in managed
grasslands: the relative importance of field management and
environmental factors. Biological Conservation 134: 559–570.
Klimek, S., Marini, L., Hofmann, M. & Isselstein, J. 2008.
Additive partitioning of plant diversity with respect to
grassland management regime, fertilisation and abiotic
factors. Basic and Applied Ecology 9: 626–634.
Kolb, A. & Diekmann, M. 2005. Effects of life-history traits on
responses of plant species to forest fragmentation.
Conservation Biology 19: 929–938.
Leps, J. & Smilauer, P. 2003. Multivariate analysis of ecological
data using CANOCO. Cambridge University Press,
Cambridge, UK.
Lillesand, T.M., Kiefer, R.W. & Chipman, J.W. 2004. Remote
sensing and image interpretation. 5th ed. John Wiley & Sons,
New York, NY, US.
Determinants of plant community composition of remnant biancane badlands Maccherini, S. et al.
386Applied Vegetation Science
Doi: 10.1111/j.1654-109X.2011.01131.x r 2011 International Association for Vegetation Science

Maccherini, S. 2006a. Factors associated with species richness
in a remnant calcareous grassland. Grassland Science 52:
181–184.
Maccherini, S. 2006b. Small-scale spatial structure in a
remnant calcareous grassland. Belgian Journal of Botany
139: 103–114.
Maccherini, S., Chiarucci, A., Torri, D., Ristori, J. & De
Dominicis, V. 1996. Influence of salt content of Pliocene
clay soil on the emergence of six grasses. Israel Journal of
Plant Sciences 44: 29–36.
Maccherini, S., Chiarucci, A. & De Dominicis, V. 2000.
Structure and species diversity of Bromus erectus grassland
of biancane badlands. Belgian Journal of Botany 133: 3–14.
Marignani, M., Del Vico, E. & Maccherini, S. 2007. Spatial scale
and sampling size affect the concordance between
remotely sensed information and plant community
discrimination in restoration monitoring. Biodiversity and
Conservation 16: 3851–3861.
Marignani, M., Rocchini, D., Torri, D., Chiarucci, A. &
Maccherini, S. 2008. Planning restoration in a cultural
landscape in Italy using an object-based approach and
historical analysis. Landscape and Urban Planning 84:
28–37.
Marini, L., Scotton, M., Klimek, S., Isselstein, J. & Pecile, A.
2007. Effects of local factors on plant species richness and
composition of Alpine meadows. Agriculture, Ecosystems &
Environment 119: 281–288.
Marini, L., Scotton, M., Klimek, S. & Pecile, A. 2008. Patterns
of plant species richness in Alpine hay meadows: local vs.
landscape controls. Basic and Applied Ecology 9: 365–372.
Marini, L., Bommarco, R., Fontana, P. & Battisti, A. 2010.
Disentangling area and habitat diversity effects on
orthopteran species with contrasting mobility. Biological
Conservation 143: 2164–2171.
Mazzoleni, S., Di Pasquale, G., Mulligan, M., Di Martino, P. &
Rego, F. (eds.) 2004. Recent dynamics of Mediterranean
vegetation and landscape. John Wiley and Sons, Chichester,
UK.
McGarigal, K. & Marks, B.J. 1995. FRAGSTATS: spatial pattern
analysis program for quantifying landscape structure. General
Technical Report PNW-GTR-351, Portland, US Department
of Agriculture, Forest Service, Pacific Northwest Research
Station.
McIntyre, S. & Hobbs, R. 1999. A framework for conceptualizing
human effects on landscapes and its relevance to management
and research models. Conservation Biology 13: 1282–1292.
Moore, P.D. & Chapman, S.B. 1986. Methods in plant ecology.
Blackwell Scientific Publications, Oxford, UK.
Oksanen, J., Blanchet, F.G., Kindt, R., Legendre, P., O’Hara,
R.B., Simpson, G.L., Solymos, P., Stevens, M.H.H. & Wagner,
H. 2011. vegan: Community Ecology Package. R package
Version 1.17-6. http://CRAN.R-project.org/package=vegan
Peres-Neto, P., Legendre, P., Dray, S. & Borcard, D. 2006.
Variation partitioning of species data matrices: estimation
and comparison of fractions. Ecology 87: 2614–2625.
Pignatti, S. 1982. Flora d’Italia. Vol. 1, 2 and 3, Edagricole,
Bologna, IT.
Phillips, C.P. 1998. The badlands of Italy: a vanishing
landscape? Applied Geography 18: 243–257.
Raglione, M., Sfalanga, M. & Torri, D. 1980. Misura dell’erosione
in un ambiente argilloso della Calabria. Annali Istituto
Sperimentale Studio e Difesa del Suolo XI: 159–181.
Rocchini, D., Perry, G.L.W., Salerno, M., Maccherini, S. &
Chiarucci, A. 2006. Landscape change and the dynamics
of open formations in a natural reserve. Landscape and
Urban Planning 77: 167–177.
Rosati, L., Fipaldini, M., Marignani, M. & Blasi, C. 2010. Effects
of fragmentation on vascular plant diversity in a
Mediterranean forest archipelago. Plant Biosystem 144:
38–46.
Schroth, G. & Sinclair, F.L. 2003. Trees, crops and soil fertility
concepts and research methods. CABI Publishing, Wallingford,
UK.
Shannon, C.E. & Weaver, W. 1962. The mathematical theory of
communication. University of Illinois Press, Urbana, IL, US.
ter Braak, C.J.F. 1988. Partial canonical correspondence
analysis. In: Bock, H.H. (ed.) Classification and related
methods of data analysis. pp. 551–558. North-Holland,
Amsterdam, NL.
ter Braak, C.J.F. & Smilauer, P. 2002. CANOCO reference manual
and CanoDraw for Windows user’s guide: software for canonical
community ordination. Microcomputer Power, 4.5, Ithaca,
NY, US.
Tscharntke, T., Klein, A.M., Kruess, A., Steffan-Dewenter, I. &
Thies, C. 2005. Landscape perspectives on agricultural
intensification and biodiversity – ecosystem service
management. Ecology Letters 8: 857–874.
Van Diggelen, R. & Marrs, R.H. 2003. Restoring plant
communities – introduction. Applied Vegetation Science 6:
106–110.
Wright, J.P., Flecker, A.S. & Jones, C.G. 2003. Local vs.
landscape controls on plant species richness in beaver
meadows. Ecology 84: 3162–3173.
Supporting Information
Additional supporting information may be found in the
online version of this article:
Appendix S1. Results of the forward selection for
plot, patch, and badland variables.
Appendix S2. Results of the ordination analysis,
including principal component analysis (PCA), RDA, and
the Monte Carlo permutation test.
Please note: Wiley-Blackwell are not responsible for
the content or functionality of any supporting materials
supplied by the authors. Any queries (other than missing
material) should be directed to the corresponding author
for the article.
Maccherini, S. et al. Determinants of plant community composition of remnant biancane badlands
Applied Vegetation Science
Doi: 10.1111/j.1654-109X.2011.01131.x r 2011 International Association for Vegetation Science 387
Related Documents