1 LUBS3320 International Business Dissertation Determinants of patent innovation of Central and Eastern Europe knowledge intensive firms: the roles of R&D expenditure and internationalisation Dissertation supervisor: Dr Elizabeth Yi Wang Student ID: Word Count: 9989

Welcome message from author
This document is posted to help you gain knowledge. Please leave a comment to let me know what you think about it! Share it to your friends and learn new things together.
Transcript
1
LUBS3320 International Business Dissertation
Determinants of patent innovation of Central and
Eastern Europe knowledge intensive firms: the roles of
R&D expenditure and internationalisation
Dissertation supervisor: Dr Elizabeth Yi Wang
Student ID:
Word Count: 9989

2
Table of Contents
Acknowledgements ............................................................................................................... 3
List of Tables.......................................................................................................................... 4
List of Figures ........................................................................................................................ 5
Abbreviations ......................................................................................................................... 6
Chapter 1 Introduction........................................................................................................... 7
Chapter 2 Background .......................................................................................................... 9
2.1. Importance of Innovation ........................................................................................... 9
2.2. Central and Eastern Europe Economies ................................................................ 10
2.3. General Knowledge ................................................................................................. 13
2.3.1 Patents ................................................................................................................ 13
2.3.2. Internationalisation ............................................................................................ 14
2.3.3. R&D Expenditure............................................................................................... 14
Chapter 3 Literature Review ............................................................................................... 16
3.1. Innovation and Patent Relationship ........................................................................ 16
3.2. Benefits and Drawbacks of Patenting .................................................................... 18
3.3. Determinants of Patenting ....................................................................................... 19
3.4. Hypotheses ............................................................................................................... 21
Chapter 4 Methods .............................................................................................................. 29
4.1. Sample and Data...................................................................................................... 29
4.2. Measures .................................................................................................................. 32
4.2.1. Dependent Variable .......................................................................................... 32
4.2.2. Independent Variables ...................................................................................... 33
4.2.3. Control Variables ............................................................................................... 34
Chapter 5 Results ................................................................................................................ 36
5.1. Empirical Findings .................................................................................................... 36
5.2. Further Analysis - Internationalisation .................................................................... 42
Chapter 6 Conclusions ........................................................................................................ 47
6.1 Conclusions ............................................................................................................... 47
6.2. Implications ............................................................................................................... 48
6.3 Limitations and Future Research ............................................................................. 49
List of References: .............................................................................................................. 51
Appendix I ............................................................................................................................ 56

3
Acknowledgements
I would like express my greatest gratitude to my supervisor Dr Elizabeth Yi
Wang who encouraged, inspired and motivated me during the process of this
dissertation. I am thankful for the opportunity to work on such an interesting
topic. I want to thank my supervisor that she shared her valuable knowledge
and provided me with initial ideas and tools to start and develop the research.
The guidance, support and goodwill have been much appreciated.
Additionally, I would like to give a special thanks to my family and friends for
their great support and encouragement while writing the dissertation.

4
List of Tables
Table 1: R&D intensive companies (EU 2004).................................................. 30
Table 2: Descriptive statistics and correlation matrix ........................................ 36
Table 3: Regression analysis results ................................................................ 38

5
List of Figures
Figure1: Gross Domestic expenditure on R&D ................................................ 10
Figure 2: Average GDP growth rates 2003-2012 .............................................. 11
Figure 3: R&D expenditure as a % of GDP ....................................................... 12
Figure 4: CEE knowledge intensive companies’ internationalisation ................ 43
Figure 5: GEO Chart of CEE knowledge intensive firms international spread .. 44
Figure 6: The growth of international activities.................................................. 45

6
Abbreviations
R&D –Research and Development
CEE – Central and Eastern Europe
EU – European Union
GDP – Gross Domestic Product
OECD - The Organisation for Economic Co-operation and Development
MNE – Multinational Enterprise

7
Chapter 1 Introduction
Rapidly changing technologies, global downturns, decreasing transportation
cost and merging consumer preferences around the world are just few of the
topics, which attract much attention from researchers. All mentioned topics are
interrelated and more or less relate to innovation and firms’ ability to gain
competitive advantage by satisfying special customer needs or even creating
new market by satisfying latent needs. Everybody recognises that innovation is
essential for each company, however, it is not clear why some companies
manage to benefit from innovative efforts and others do not.
In order to understand this phenomenon, the first step is to understand what
factors determines larger or smaller innovation output. Therefore, our main
research question concentrates on the determinants of patent innovations,
which we use as a measure of companies’ innovative efforts. We aim to answer
the research question by identifying the influence of Research and
Development (R&D) expenditure and the degree of internationalisation on
innovation output. We concentrate specifically on Central and Eastern Europe
(CEE) region firms in order to contribute to innovation literature by expanding its
geographical scope.
To answer our research question we analyse existing literature and propose 3
hypotheses. We use quantitative panel data analysis based on the top
knowledge intensive firms from CEE region. We employ a regression analysis
to test whether our selected determinants, i.e. R&D expenditure and degree of
internationalisation, which are supported by other scholars’ studies conducted
mainly in developed countries, are valid and have similar effect in the case of
CEE countries.
8
We argue that it is important to look at the CEE companies and expect to
provide useful business insights, which are specific to the CEE and also
encourage further research to be conducted on the region, as we believe it has
a growing future potential.
In line with other research, we found that R&D expenditure is one of the most
significant determinants of patent innovation. Interestingly, analysing
internationalisation role in the relationship we found that it is important variable
both in terms of influencing innovation output on its own as well as providing
greater benefits by moderating the R&D expenditure and patent innovation
relationship. Many studies found mixed results on internationalisation (e.g.
Higon et al., 2011; Tsang et al., 2008) therefore we suggest that it might be a
country or in our case region specific feature.
In the next, Background, chapter we explain why innovation is an important field
of study, provide reasoning why we choose to look at the CEE region and
introduce key terms, which will be used throughout the study. The third chapter
will review the broad existing literature on innovation by concentrating on
determinants of innovation output. We will conclude the chapter by proposing
three hypotheses for our study. The fourth chapter will describe the methods,
which we employ to test our hypotheses. We will describe sample, variables
and analysis employed. In the fifth chapter, we will present the results
generated, relate it with existing literature and suggest how our results are
unique compared to other studies. In the sixth chapter, we conclude our
findings and draw the implications of our research to the innovation literature
and more importantly to the CEE firms. We will finalise the chapter by
explaining the limitations of the study and suggesting areas for future research.

9
Chapter 2 Background
In this chapter, we discuss why innovation is important in the current economy
both for business and governments, highlight why we are interested in CEE
economies and provide some basic explanations on key terms used in our
study.
2.1. Importance of Innovation
“Innovation is regarded as the introduction of products and processes that are
new to the context of the location but not necessarily new to the world as a
whole” (Collinson and Morgan, 2009, p. 46). It is widely acknowledged that
innovation plays a vital role not only at companies’ level but also at countries’
and regional levels (Storey and Salaman, 2005). Therefore, governments are
trying to find new or better ways to attract or retain innovation in their countries
by creating new policies and calls for action. A good example is ‘EUROPE 2020
Strategy', which highlights the importance of smart growth; meaning
information, education and innovation fostering (Fontaine, 2010). The overall
aim of this strategy, in terms of innovation, is to increase total European Union
(EU) R&D expenditure to 3% of the EU’s Gross Domestic Product (GDP)
(Europe 2020, 2014). However, each country within the European Union is
different and unique and, therefore, the R&D intensity as well as the amount
each country spends varies greatly. Figure 1 below shows how the percentage
of GDP spent on R&D varies across the Europe (pale yellow colour - low
expenditure, the expenditure is increasing towards green, where dark green is
the highest level of expenditure on R&D). We can clearly see that majority of
CEE countries spend less on R&D, as yellow colour dominates on the right
(East) side of the map, compared to Western countries, where green colour

10
dominates. This indicates that there is a gap between CEE and Western Europe
economies and therefore the relationship between inputs and outputs of
innovation might be different and worthwhile investigating.
Figure1: Gross Domestic expenditure on R&D (Eurostat, 2014)
2.2. Central and Eastern Europe Economies
It has been 10 years since the majority of CEE economies joined the EU. Many
of these countries are very different from the other EUs’ member states, not
only because its’ development level but also unique history, with rapid transition
from inefficient state planned economy to competitive market economy (Porter
& Ketels, 2013).

11
CEE economies attracted many foreign investors’ attention before and after the
accession to the EU. The main reasons for this were cheaper but well educated
labour and a good geographical position of the countries (Tondl & Vuksic,
2003). Foreign direct investment (FDI) and other types of investments, like the
EU’s structural funds, influenced the rapid GDP growth rates of the majority of
CEE countries. In the long term the majority of the CEE countries were
experiencing considerably higher growth rates than Eurozone countries (see
Figure 2). As you can see, few of the CEE economies, i.e. Lithuania, Poland
and Slovak Republic were experiencing even higher growth rates than the world
overall.
Figure 2: Average GDP growth rates 2003-2012 (Economic Scorecard, 2014)
The increasing GDP growth rate suggest that countries are catching up,
however, nobody can deny that the gap between Western and Eastern
12
countries is still obvious and much more work needs to be done to bridge this
gap.
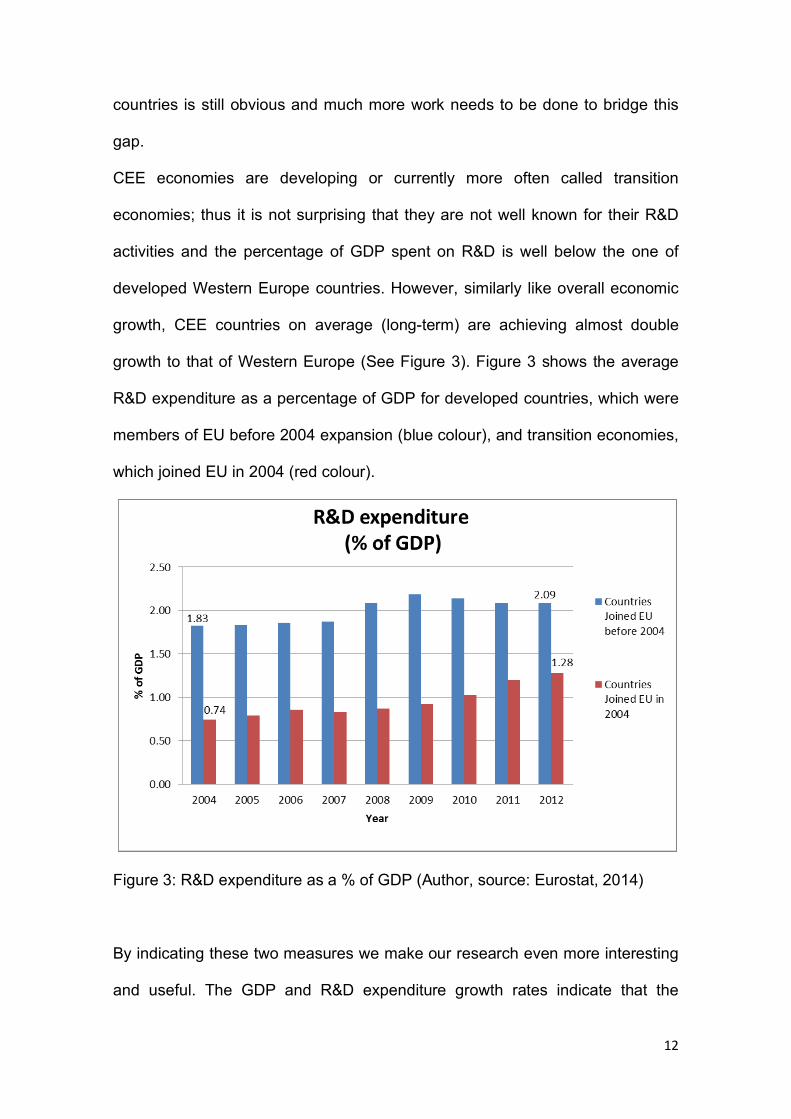
CEE economies are developing or currently more often called transition
economies; thus it is not surprising that they are not well known for their R&D
activities and the percentage of GDP spent on R&D is well below the one of
developed Western Europe countries. However, similarly like overall economic
growth, CEE countries on average (long-term) are achieving almost double
growth to that of Western Europe (See Figure 3). Figure 3 shows the average
R&D expenditure as a percentage of GDP for developed countries, which were
members of EU before 2004 expansion (blue colour), and transition economies,
which joined EU in 2004 (red colour).
Figure 3: R&D expenditure as a % of GDP (Author, source: Eurostat, 2014)
By indicating these two measures we make our research even more interesting
and useful. The GDP and R&D expenditure growth rates indicate that the

13
regional economic integration with 10 years of institutional convergences
positively affected both the CEE economies and the firms within it. In addition to
this, the area is also known for strong academic traditions where few of the
oldest universities were established, for example, the University of Prague
(Czech Republic) or the Jagiellonian University (Poland) (WIPO, 2014). Thus,
these countries have a deep pool of well-educated people and the region has
strong capacity for producing and expanding knowledge. Therefore, we think
that CEE has a high future potential and because there is not much research
done on innovation activities in this region, we believe that our study will provide
interesting, useful and most importantly specific to the CEE region insights both
for business and policy makers.
2.3. General Knowledge
Before we start looking at the literature and the determinants of patent
innovation, we believe that it is important to explain key terms and processes
associated with our study.
2.3.1 Patents
“A patent is a document, issued by an authorized governmental agency,
granting the right to exclude anyone else from the production or use of specific
new device, apparatus, or process for a stated number of years” (Griliches,
1990 p.288). In order to obtain patent rights a company, an individual or a public
body needs to prove that the invention is novel, involve inventive activities and
can be applied in industry (OECD, 2001). Generally the process of gaining
patent rights starts with filling the application form, which covers how things
work, what they do, how they are made and what they are made from. Later on,
the patent office examines the application, i.e. whether it meets all the legal

14
requirements. Finally, the decision whether patent can be granted or not is
being made (OECD, 2001). The original purpose of granting patent rights is to
encourage innovation (OECD, 2009). Patent provides an inventor with the
exclusive, almost monopoly, rights to the invention, usually for around 20 years.
It means that an inventor has 20 years to commercialise the invention, get
returns on initial investment and earn profit, which can be seen as an
encouragement to innovate more in the future. Also, by making information
publicly available the further continuous developments are encouraged, and this
way more inventions are created (OECD, 2009). Therefore, patent rights are
useful for individuals, companies and overall development of economies.
2.3.2. Internationalisation
According to Daniels et al. (2011), the internationalisation is the process when
company decides increasing their commitments to international business. It
means that companies operate and perform their commercial transactions in
more than one country and, therefore, the internationalisation is the process by
which the number of countries is increased. There are many different ways how
to serve foreign markets, which are accompanied with different advantages and
disadvantages, and all of them are widely discussed in international business
literature. However, for our study the key is to understand that, by
internationalisation, we mean a company's expansion to different economies.
2.3.3. R&D Expenditure
According to OECD iLibrary (2011) R&D expenditure is one of the most widely
used measures of innovation inputs. R&D expenditure as a percentage of the
GDP is a country level measure and is referred as R&D intensity (OECD
iLibrary, 2011). Even though it is useful to measure R&D at the country level

15
and various policies, like already mentioned Europe 2020, are created to
encourage innovation, a major contributor to the innovation growth remains
private business companies, which accounts for about 70% of all R&D
performed in OECD area (OECD iLibrary, 2011). It shows that individual
companies play a critical role in countries' innovation processes and, therefore,
it provide good reasoning to base our study on individual firms data and their
yearly R&D expenditure.
In chapter 2, we discussed why innovation is an important topic to explore, why
it is important to look at CEE countries and explained key terms, which will be
used throughout the study. We begin the next chapter with a review of the
literature describing and investigating the innovation field of study and conclude
by proposing three hypotheses for our study.

16
Chapter 3 Literature Review
The purpose of this chapter is to review existing literature related to the study,
explain what has been investigated so far and propose the hypotheses. First of
all, the innovation and patent relationship is discussed. Next the existing
literature on the benefits and drawbacks to the business of using patents is
reviewed. In addition to this, we also look at the key determinants, which
influence companies’ decisions to patent and conclude the chapter by
proposing three hypotheses for the study.
3.1. Innovation and Patent Relationship
Globalisation, rapid technological change, growing competition from low-wages
economies, reduced transport and communication costs and other factors make
new products and processes essential to compete in the current climate (Nieto
and Rodriguez, 2011). Therefore, companies are forced to innovate and protect
their knowledge in order to survive. It is widely known that firms benefit from
R&D efforts. Innovation allows firms to develop and license new products and
processes, become more competitive and, consequently, increase their
financial performance (Kafouros et al., 2008). However, the extent of benefits
varies greatly between the firms (Hall et al., 2009). The majority of the literature
splits innovation into two main categories, i.e. product and process innovation
(e.g. Fontana et al., 2013, Cohen et al., 2000; Arundel & Kabla, 1998). It is
generally argued that a product innovation is about creating new or improving
quality of existing products, in order to increase market share, while the process
innovation is usually driven by the aim to reduce costs, especially when
competition in the market is high (Baldwin et al., 2002). Many people believe
that patent rights are the key to protect and explore returns on innovation
17
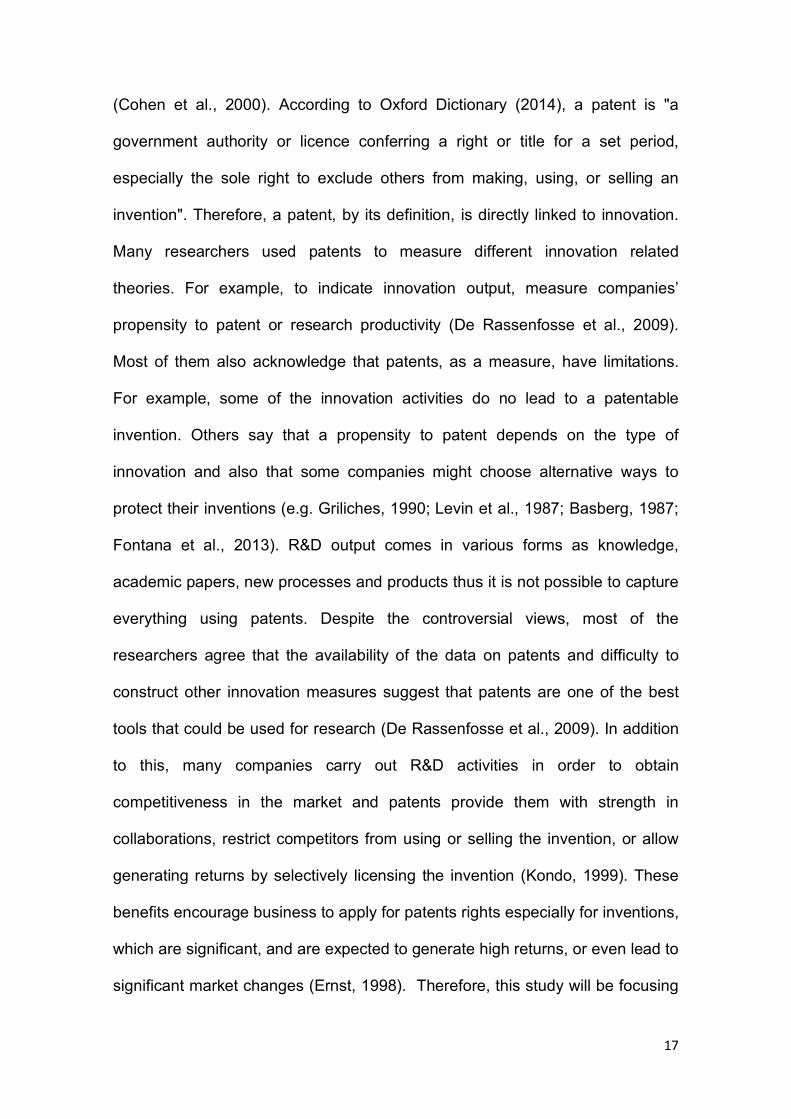
(Cohen et al., 2000). According to Oxford Dictionary (2014), a patent is "a
government authority or licence conferring a right or title for a set period,
especially the sole right to exclude others from making, using, or selling an
invention". Therefore, a patent, by its definition, is directly linked to innovation.
Many researchers used patents to measure different innovation related
theories. For example, to indicate innovation output, measure companies’
propensity to patent or research productivity (De Rassenfosse et al., 2009).
Most of them also acknowledge that patents, as a measure, have limitations.
For example, some of the innovation activities do no lead to a patentable
invention. Others say that a propensity to patent depends on the type of
innovation and also that some companies might choose alternative ways to
protect their inventions (e.g. Griliches, 1990; Levin et al., 1987; Basberg, 1987;
Fontana et al., 2013). R&D output comes in various forms as knowledge,
academic papers, new processes and products thus it is not possible to capture
everything using patents. Despite the controversial views, most of the
researchers agree that the availability of the data on patents and difficulty to
construct other innovation measures suggest that patents are one of the best
tools that could be used for research (De Rassenfosse et al., 2009). In addition
to this, many companies carry out R&D activities in order to obtain
competitiveness in the market and patents provide them with strength in
collaborations, restrict competitors from using or selling the invention, or allow
generating returns by selectively licensing the invention (Kondo, 1999). These
benefits encourage business to apply for patents rights especially for inventions,
which are significant, and are expected to generate high returns, or even lead to
significant market changes (Ernst, 1998). Therefore, this study will be focusing

18
on patents as an innovation output and investigate how different factors, i.e.
R&D expenditure and internationalisation will impact the patent innovation of the
CEE firms.
3.2. Benefits and Drawbacks of Patenting
Before we try to understand what benefits patents bring for each business, first,
we need to understand that each business is, at least to some extent, profit-
seeking and, therefore, a key aspect to each firm is to get returns on innovation
(Baldwin et al., 2002). There are few different ways how patenting can benefit
the company and help to get returns. The original and most obvious motive to
patent is to protect one’s innovation from imitation and this way secure earnings
to cover the expenses (Blind et al., 2009). Patents can also be seen as
instruments to secure the future’s technological space by preventing imitation.
In addition, literature suggests that a good patent portfolio helps in
collaborations to generate licencing revenues or financing (Hall and Ziedonis,
2001). Also, some companies use it as initiatives or as a performance indicator
to reward researchers (Blind et al., 2006).
On the other hand, there are four main reasons well summarised by Basberg
(1987) why companies choose not to patent. First of all, not all inventions can
be patented, for example, due to the patent laws on certain industries, which
might differ from country to country (Basberg, 1987). Second, the reasons
influencing the decision to patent refers to economic expectations, as the cost
to apply and get a patent right is usually high, sometimes returns on innovation
might not even outweigh the cost (Basberg, 1987). It is especially the case
when the inventor is not sure about the success of commercialization of the
invention, therefore; it might be preferable to keep it as a secret. Thirdly, the

19
assumption that competitors can easily “invent around” reduces benefits of
having a patent, and fourth, innovation life cycles, i.e. in the case when it is long
or extremely short it is preferable to keep it a secret, rather than patent
(Basberg, 1987). Later, scholars like Cohen et al. (2000) argued that the lack of
novelty and the fact that information needs to be disclosed also impact
companies' decision not to patent. Therefore, it is up to each business to
decide, which factors are the most important to determine their choice regarding
patents.
3.3. Determinants of Patenting
The question, why some companies choose to patent their inventions and
others do not, have been investigated for decades, and there is still no clear
answer. In the literature there is a clear separation between the process and
product innovation (e.g. Fontana et al., 2013; Cohen et al., 2000; Arundel and
Kabla, 1998). Peeters et al. (2006) identified that it is more difficult to imitate
new processes than products, mainly because processes require specific
people related know-how; therefore processes are less likely to be patented.
Traditional determinants of patenting include firm size and market power.
Schumpeter (1942) was one of the first researchers who hypothesized that
larger firms are more innovative. It might be due to the opportunity to exploit
economies of scale, synergies and spillovers between different departments as
well as because large companies can easier get financing for their projects
(Peeters et al., 2006). Van Ophem et al. (2001) found a positive effect between
the firm size and the patent portfolio; however, they concluded that the
relationship between patent applications and firm size remains controversial.
Another factor, which is considered to be influencing patenting behaviour, is

20
market power, or competition. There are two schools of thoughts where one
argues that companies with higher market power invest less in innovation
activities, as the gains, which they would get from innovation, would only
replace current gains (Arrow, 1962). However, Nielsen (2001) found that the
market power positively affects the number of patents the company generates.
According to the researcher, the more powerful companies invest more in
innovation as they face less or none competition to exploit the inventions. In
addition to this, there are evidences that firms in certain, mostly technologically
intensive, industries tend to patent more than others (e.g. Mansfield, 1986;
Baldvin et al., 2002). Others argue that patenting strategies depend on country
specific factors and even more specifically on design of local patent system,
science and technology policies or education system (De Rassenfosse et al.,
2009). International business literature looks from internationalisation point of
view and hypothesises that companies with a higher degree of
internationalisation face more competition in different markets and at the same
time generate more knowledge, consequently, the internationalisation positively
influences innovation performance (e.g. Tsang et al., 2008; Higon et al., 2011
and Kafouros et al., 2008). However, Peeters et al. (2006) found that the
relationship between internationalisation and innovation performance is
insignificant.
As we can see there are many factors, which influence or might influence
companies’ patent innovation. Nevertheless, the majority of the reviewed
studies are based on developed countries, whereas this paper aims to look at
the number of countries, which are neighbouring Western Europe developed
economies but are transition economies (i.e. Central and Easter Europe

21
countries) and identify the relationship between patents and R&D expenditure
as well as the role of the internationalisation in this relationship.
3.4. Hypotheses
Many researchers have investigated the importance of R&D expenditure. It
attracts much attention from scholars as well as from the business mainly
because it is usually one of the highest costs innovative companies have to
bear. Thus, it is important to understand how investments in R&D activities are
related to the R&D output and overall performance of the firm. However, this
relationship is not always clear because of the difficulty to define and measure
R&D output. The output can take various forms, for example, research articles,
know-how, new products, new processes, etc. (Kondo, 1999). One of the
common measures for innovation output is patents counts, which will be used
for this study. Kondo (1999) suggests that patents are related to R&D
expenditure either directly, meaning that the increase in expenditure on R&D
leads to the higher number of patents; or indirectly, through increase in
technology stock, which consequently expands an invention frontier and finally
influences the number of patents generated. The clear positive relationship
between R&D expenditure and number of patents generated has been
confirmed by many researchers (e.g. Kondo, 1999; Ernst, 1998). Some of the
researchers look at this relationship in even greater detail by splitting the
amount of research and amount of development expenditure and analysing the
relationship with a number of patents and quality of patents generated (Ernst,
1998).
Within this field of study there are publications, which suggest that R&D
expenditure is just indirectly linked to the number of patents a company
22
generates (Fontana et al., 2013). They suggest that there is a clear relationship
between R&D expenditure and inventions, which intensity is moderated by
productivity effect, and, on the other hand, there is also a relationship between
inventions and patents, which is moderated by propensity to patent effect (De
Rassenfosse et al., 2009), and, therefore, it is argued that the relationship is not
as straightforward as we might expect.
Even though much research has been done on this area, best to our
knowledge, there was no research based on CEE R&D intensive companies. It
is important to look at these firms, which originated from countries with different
background, which went through a fundamental economic and industrial reform
accompanied with significant institutional change (Radosevic & Yoruk, 2013).
Thus, it is interesting to find out whether institutional convergence of countries
with very different levels of development leads to convergence in outcomes in
terms of R&D at individual companies’ level.
Our study tests whether a direct, clear relationship between R&D expenditure
and patents exists. In relation to the majority of research, which suggested that
the relationship is strongly positive, we expect to confirm the same approach for
the CEE companies.
Hypothesis 1: R&D expenditure positively influences the patent
innovation of knowledge intensive Central and Eastern European firm.
It is known that multinational enterprises incur more costs than their domestic
counterparts as widely dispersed business units make coordination and
management more complex and, therefore, transaction costs increase. Also,
depending on the geographical distance, communication between different units

23
might be negatively affected in terms of frequency, quality and speed (Kafouros
et al., 2008), as a result, a greater possibility of information leakages might arise
(Fisch, 2003). The increase in costs also depends on the “liability of
foreignness”, which mainly refers to the level of institutional distance between
home and host economy (Sofka & Zimmermann, 2008). Higon et al. (2011)
compared domestic multinational enterprises (MNEs) and foreign MNEs and
found that R&D returns of domestic ones outperform those of international
competitors based in the market. Consequently it provides evidence for “liability
of foreignness” effect; which means that foreignness negatively influences R&D
returns.
Despite the drawbacks and risks created by internationalisation, empirical
research proves that there are many benefits rising from the higher level of
internationalisation of a firm. For example, it is argued that knowledge is
produced and diffused within particular geographic location and, therefore, just
companies, which have a presence in a particular geographic area, where the
information is produced, can benefit from that knowledge (Almeida & Kogut,
1999). Thus, firms that engage only into domestic activities have limited or no
access to technologies and knowledge generated outside its geographic
boundary (Kafouros & Forsans, 2012). In addition, international business
literature suggests that MNEs have certain ownership advantages over its
domestic counterparts in the markets it serves or intends to serve (Higon et al.,
2011) and this helps them to cover the higher cost incurred by having presence
in many international markets. Dunning (1993) explains these ownership
advantages as MNEs ability to exploit scope economies; others, like Barlett &
Ghoshal (2002), add that benefits occur due to superior management and

24
technological capabilities, where efforts of many units are combined to create
synergies. To add, by having multiple units in different locations MNEs are able
to exploit country specific resources, enjoy the benefits of worldwide learning
(Tsang et al., 2008) and also balance risk by avoiding business cycles and
economic fluctuations that are specific to a single market (Kafouros, 2008). It is
especially important for our sample companies, which are based in CEE
economies. It is well known that development level of these economies is lower
than Western Europe countries but due to the regional integration R&D
intensive companies are forced to compete, at least to a certain extent, with all
companies within European Union. In order to get a competitive advantage or at
least be able to compete these companies have to seek knowledge from foreign
markets as the home market is just trying to catch up. It is also argued that the
higher degree of internationalisation increases the company’s innovative
capacity because MNEs are able utilise knowledge and ideas from many
countries and broader group of clients, suppliers, universities and other
research institutions (Kafouros, 2006). According to the indicators presented in
Eurostat (2011), the majority of the population in CEE countries are well
educated; thus, it is easier for CEE companies to apply knowledge generated
abroad. One more benefit of multinationality is flexibility; firms can shift their
innovation activities to the places that are most conductive and have best
routines for both the development and commercialisation of new technology
(Zander, 1998). Therefore, it might be that even though the sample companies
are registered and have operational headquarters in CEE countries, the
knowledge centres might be based outside the region and this way
internationalisation would increase innovation performance of firms. Also, large
25
MNEs have ability to create competition between different business units and
this way increase or at least sustain the level of innovation and its significance
in terms of returns (Zander, 1998). Even though we should not forget that the
success or failure of the internationalisation and its effect on innovation
depends on individual company’s strategies and managerial capabilities
(Kylaheiko et al., 2011), the findings, mentioned above, suggest that the
internationalisation positively influences innovation performance, meaning that
companies, which have a presence in many markets innovate more. At the
same time internationalisation increases the risk of imitation and more
complicated control of inventions, which leads to a need for legal innovation
protection (Peeters et al., 2006). Baldwin et al. (2002) found that the use of
patents is related to the internationalisation of the firm and that foreign owned
firms are more likely to use patents, in order to protect their inventions.
Consequently, as more inventions are created, and the need for the invention
protection increases it is more likely that the degree of the internationalisation
will positively affect the number of patents in the firm’s patent portfolio.
Therefore, we suggest the following:
Hypothesis 2: The degree of internationalisation positively influences the
patent innovation of a knowledge intensive Central and Eastern European
firm.
However, not all researchers agree that the degree of internationalisation has
an impact or at least a direct impact on innovation output or number of patents
companies generate. For example, Peeters et al. (2006) argued that the degree
of internationalisation on its own, after accounting for other related variables like
size and competition, has no significant effect on patenting behaviour of the
26
firms. Therefore, the relationship between internationalisation and patenting
remains controversial. However, other scholars looked at this phenomenon from
the different point of view and argued that the role of innovation and
technological capabilities determines firm’s internationalisation and performance
relationship (Kylaheiko et al., 2011). More interestingly for our purpose Kafouros
et al. (2008) found that depending on the level of internationalisation, influence
on R&D expenditure is not always the same. It means that even though
companies put similar resources in to their innovation activities, the output is
different depending on the degree of the internationalisation.
It is especially important to understand this relationship as competition on R&D
is constantly increasing, and the length of product life cycles decreases;
meaning that it becomes more difficult to obtain the returns on R&D investments
(Kafouros et al., 2008). Some authors, therefore, argue that internationalisation
is a must for innovative firms in order to be able to exploit fully and capture all
possible returns from innovation activities (e.g. Saarenketo, 2004; Kafouros et
al., 2008). The opportunities to leverage innovations capabilities and abilities to
identify and exploit knowledge spillovers from competitors’ innovations in
international markets influenced the recent trend towards more globalised and
integrated approach to R&D (Cantwell et al., 2004). It is obvious that each
company is trying to minimize their R&D expenditure and at the same time
maximize the gains from it. Kotabe et al. (2002) found that international firms
can charge higher prices for their products. Therefore, by charging higher prices
and spreading the cost around many different units in the world as well as by
establishing R&D facilities in countries where capital, land and scientific
knowledge are cheap (Kafouros et al., 2008) MNEs can reduce innovation

27
costs, increase speed of returns and consequently increase their competitive
advantage over its rivals.
According to neoclassical economics, any produced knowledge becomes a
public good and, therefore, spillover effects are highly possible. It diminishes
firms' ability to appropriate the benefits from its innovation. Internationalisation
increases the risk of knowledge leakages as processes are more difficult to
manage and coordinate. Sanna Randaccio & Veugelers (2007) found that
depending on a level of knowledge in the local economy it is possible that
spillovers from the company might be even higher than those coming to the
business. Therefore, it is important to have appropriate mechanisms, like
patents, to protect innovations and generate returns. In addition to this, large
MNEs with globally dispersed operations, more diversified scope of business
and a wider range of products are in a better position to identify future needs
and, therefore, it is more likely that the created R&D output will be patented to
protect intellectual property rights as the output will reach many markets quickly
and this way appropriate more returns from the invention (Tsang et al., 2008).
Therefore, we suggest that internationalisation is a significant variable in the
innovation process and propose another hypothesis where the level of
internationalisation plays a mediating role.
Hypothesis 3: The benefits of R&D expenditure on patent innovation are
stronger when a central and eastern European firm has a higher degree of
internationalisation.

28
In chapter 3, we have reviewed the existing literature on patent innovation and
proposed hypotheses for our study. The following chapter will describe the
methods, which will be used for the hypotheses testing.

29
Chapter 4 Methods
In this chapter, we describe the data and sample, i.e. how it was collected and
what sources were used. We also introduce the empirical methods and provide
reasoning behind our choice of dependent, independent and control variables.
4.1. Sample and Data
To test the hypotheses empirically, we used a firm level panel data set. The
panel data set, which includes 9 years, is important for our study as it enables
identifying changes specific to the company’s innovation strategy rather than
overall economic, industry, region or period tendencies (Kafouros & Forsans,
2012). Also, as one of our variables is internationalisation, it is important to
capture it across the time and see how changes in the level of
internationalisation activities affect patent innovation (Kafouros et al., 2008).
Finally, the panel data helps to avoid bias created by changes in the business
cycle and any business instabilities, which might be caused by recessions or
revivals (Kafouros, 2005).
To collect data, the study uses three sources. First of all, in order to identify our
sample we used ‘The EU Industrial R&D Investment Scoreboard’ for years 2004
to 2012. It is a register published by the Department for Innovation, Universities
& Skills and the Department for Business, Enterprise and Regulatory Reform on
an annual basis and is available for public access. We collected all the reports
for years 2004 to 2012 added together and using country description conducted
analysis to identify R&D intensive companies from countries, which joined the
EU in 2004. We identified 28 companies in 8 countries (See Table 1).

30
Country No of companies
Bulgaria 1Czech Republic 6Hungary 3Latvia 1Malta 2Poland 9Slovakia 1Slovenia 5Total 28
Table 1: R&D intensive companies (EU 2004) - from countries, which joined the EU in 2004 (Author, source: IRI, 2013)
Companies in the scoreboard are allocated to countries according to their
registered office (IRI, 2013). Therefore, in some cases it might be different to
the country where their headquarters are located. In order to avoid
misinterpretation of the data, we used companies’ annual reports to make sure
that the headquarters of each company is located in the same country where
company is registered. This way we make sure that the key activities are
happening in one of the CEE countries. In the cases when the location of
headquarters was not clear we removed companies from our sample to avoid
possible bias. As our study focus is only CEE economies, two R&D intensive
companies from Malta were also eliminated from the sample. In addition, we
dropped companies, which were acquired by other foreign companies during
our selected period.
We are also aware about the limitations of using patents as a measure of
innovation output; therefore, we decided that our sample companies should be
just those, which have at least one patent during the selected period. This way
we acknowledge that patents are not the only way to protect the invention and,
therefore, we concluded that companies that invest heavily in R&D but do not
31
have any patents are either using different appropriability mechanism to
generate returns on innovation or they are not producing any significant
innovation output, which could be patented. Either way our data would not be
able to capture the outcomes and therefore we chose to look at smaller but
more accurate sample of companies. After applying all the criteria to the
companies our final sample consists of 8 companies, from 6 different industries
and 5 CEE countries.
The ‘EU Industrial R&D Investment Scoreboard’ not only provides information
about R&D expenditure and country but also additional information on industry,
net sales, total number of employees, capital expenditure, etc. (IRI, 2013).
Therefore, it formed a basis for our study. However, in the cases when
companies had been dropped from the scoreboard for few years or we needed
additional information, for example, degree of internationalisation or company
age we have used companies’ annual reports. The annual reports were used to
conduct the ‘EU Industrial R&D Investment Score Board’, therefore this way we
got a full data set from consistent data sources. In order to identify the number
of patents each company holds we used European Patent Office database,
which was also used by many other researchers as a reliable source (e.g.
Earnst, 1998, Fontana et al., 2013, De Rassenfosse & van Pottelsberghe,
2009). The overall sample covers the period of 2004-2012, as 2004 were a year
when CEE countries joined the EU and 2012 are the latest data available on
‘EU Industrial R&D Investment Scoreboard’. Therefore, the overall number of
observations is 72.

32
4.2. Measures
In the following section we will describe variables used for our study.
4.2.1. Dependent Variable
The study uses quantitative data analysis. To give meaning to our data we
employ a linear regression analysis, which was used in many other research
papers in order to understand the determining factors of patent innovation (e.g.
Kafouros et al., 2008, Tsang et al., 2008). As we concentrate on finding the
determinants of patent innovation our dependent variable of this model is
Number of Patents generated by the company in a particular year. We count a
number of patents by searching for applicant – the company in the European
Patent Office database, and restricting publication date to the period of 2004-
2012. This way we capture both patents, which are already granted to the
companies, as well as patent applications. We are aware of the fact that patent
applications need to go through a review and that patent rights might not be
eventually granted to the company. Nevertheless, we are analysing a recent
data, and because it takes around 4 years for a patent to be granted, we argue
that, patent applications are a good proxy of innovation output. Moreover, the
high cost of applying for a patent is an important factor, which suggests that
companies should apply for patents just when they are confident about the
uniqueness and are willing to generate returns on the invention (Fontana et al.,
2013). Also, it is important to include patent application as according to Kondo
(1999) due to the time gap between actual investment and granted patent
rights, it makes more sense to use patent applications, not only patents granted,
when analysing relationship between R&D expenditure and patents. Therefore,

33
by looking at patents based on first publication date we can relate more closely
to the companies’ activities in that year with their patent innovations.
4.2.2. Independent Variables
Based on our hypotheses we chose two independent variables, which we
believe are the key determinants of patent innovation.
4.2.2.1. R&D Expenditure
Our study identifies how much each company spends on its R&D activities each
year using the data available from the ‘EU Industrial R&D Investment
Scoreboard’ or applying methodology used by the scoreboard on annual
companies’ reports for those, which dropped from the scoreboard for few years
in the sample period. The methodology used in scoreboard is explained in each
scoreboard document appendixes and available online (IRI, 2013). The R&D
expenditure included is the cash investment of the business and does not
include R&D undertaken under contracts with customers, such as government
or other companies (IRI, 2013). Scoreboard uses consolidated companies’
annual reports to collect the data. Therefore, it is an ideal measure for our
purpose because we are looking at individual companies and the data refers to
the overall investment on R&D of a particular company, regardless of where the
actual R&D activity was performed. It means that we are not restricting our
sample to particular sector or territory, just concentrating on the fact that the
company is registered and managed from one of the CEE economies.
4.2.2.2. Degree of Internationalisation
In our study, we investigate whether the degree of internationalisation
influences the patent innovation of the firm. Based on internationalisation
34
theory, which explains the benefits of internationalisation to the company’s
innovation performance we suggest measuring the degree of
internationalisation in terms of breadth i.e. the number of countries the company
operates in, which is in line with measures employed by other studies (e.g.
Kotabe et al., 2002). We used companies’ annual reports, which include a
report on either geographical segmentation or if it was too high level, i.e. based
on regions rather than countries; we also used reports, which showed all group
companies and simply counted the units and the locations of the units in the
group.
4.2.3. Control Variables
We employ control variables, which are acknowledged within wide innovation
literature as important determinants of innovation output, but which are not the
key to answer our research question.
4.2.3.1. Size of the Company
It goes back to the early research of innovation and so called Schumpeterian
(1942) hypothesis that large firms innovate more. Also, large firms are more
likely to have established capable legal departments for handling patent
applications (Baldwin et al., 2002). On the other hand, it is argued that when
firms grow large their innovations tend to be less efficient, as the scale and
scope economies may be exhausted before a firm becomes large (Levin and
Reiss, 1988). Even though the results are mixed on the influence of size on
patent innovation we want to ensure that our study are not biased by size
variable and, therefore, we use a dummy that is valued 1 when company's
annual net sales are above and 0 when below the median sales of the whole
sample.

35
4.2.3.1. Pharmaceuticals Industry
Many researchers found evidence that patent innovation is more dominant in a
pharmaceuticals’ industry than in other industries (e.g. Tsang et al., 2008;
Kondo, 1999; Arundel &Kabla, 1998). Based on the findings in the literature and
the fact that our sample includes 3 firms from this industry we introduce a
dummy variable that takes value 1 when industry is pharmaceuticals and all the
other industries takes value 0. This way we are able to control for the industry
with the highest propensity to patent and the highest number of companies in
the sample.
4.2.3.1. Age
It has also been claimed that the age of the company can influence the patent
innovation. Peeters et al. (2006) argued that, on the one hand, younger
companies have no significant market power and, therefore, they have a higher
need for patent protection. On the other hand, older companies usually have
more innovations, which need to be protected; therefore, they generate more
patents. Even though the relationship is not clear, the variable itself is important
and thus we will account for it in our study. To measure the variable we used
the age of the company for each year in our sample.
In chapter 4, we explained why we are using panel data, how we came up with
our sample of 8 companies and described each of the variables used for the
study.
36
Chapter 5 Results
In this chapter, we present and explain the results of our study as well as
discuss how it fits within other research conducted in the innovation field of
study.
5.1. Empirical Findings
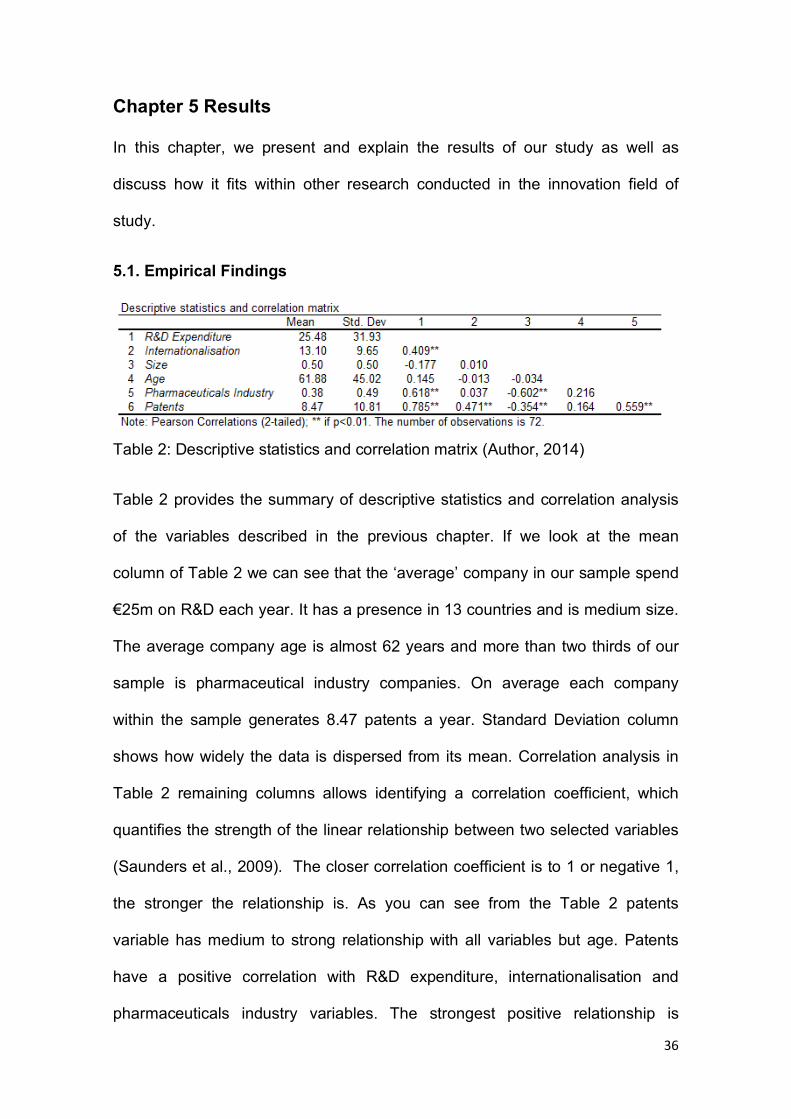
Table 2: Descriptive statistics and correlation matrix (Author, 2014)
Table 2 provides the summary of descriptive statistics and correlation analysis
of the variables described in the previous chapter. If we look at the mean
column of Table 2 we can see that the ‘average’ company in our sample spend
€25m on R&D each year. It has a presence in 13 countries and is medium size.
The average company age is almost 62 years and more than two thirds of our
sample is pharmaceutical industry companies. On average each company
within the sample generates 8.47 patents a year. Standard Deviation column
shows how widely the data is dispersed from its mean. Correlation analysis in
Table 2 remaining columns allows identifying a correlation coefficient, which
quantifies the strength of the linear relationship between two selected variables
(Saunders et al., 2009). The closer correlation coefficient is to 1 or negative 1,
the stronger the relationship is. As you can see from the Table 2 patents
variable has medium to strong relationship with all variables but age. Patents
have a positive correlation with R&D expenditure, internationalisation and
pharmaceuticals industry variables. The strongest positive relationship is

37
between patents and R&D expenditure. Positive relationship suggests that
increase or decrease in variables, e.g. R&D expenditure, increase or decrease
other variable in the relationship, e.g. number of patents, accordingly.
Interestingly, company size is the only variable, which has a negative
correlation with patents. It means that the increase in business size decreases
the number of patents generated. However, this relationship is not very strong.
Running correlation analysis also helps ensuring that there are no collinearity
issues, i.e. absence of correlation between variables, as all correlation
coefficients are below 0.90 (Saunders et al., 2009). The correlation matrix
provides useful primary insights, but it is just an overall measure of the strength
of association and does not reflect the extent to which any particular
independent variable is associated with the dependent variable.
We employ a regression analysis in order to test dependency between
variables. Table 3 presents the regression analysis results using 4 different
models. We used Model 1 to test whether our control variables, i.e. size, age
and pharmaceuticals’ industry, are important in explaining patent innovations.
The results show that, among control variables, the most significant is
pharmaceuticals’ industry one. Overall, all control variables explain just 0.285
(adjusted R2) of the relationship. The goodness fit (adjusted R2) describes how
well the relationship is explained by quantifying it 0 – if the model does not
explain anything and going towards 1 - fully explained dependency relationship.
Therefore, Model 1 serves us as a baseline model.
38
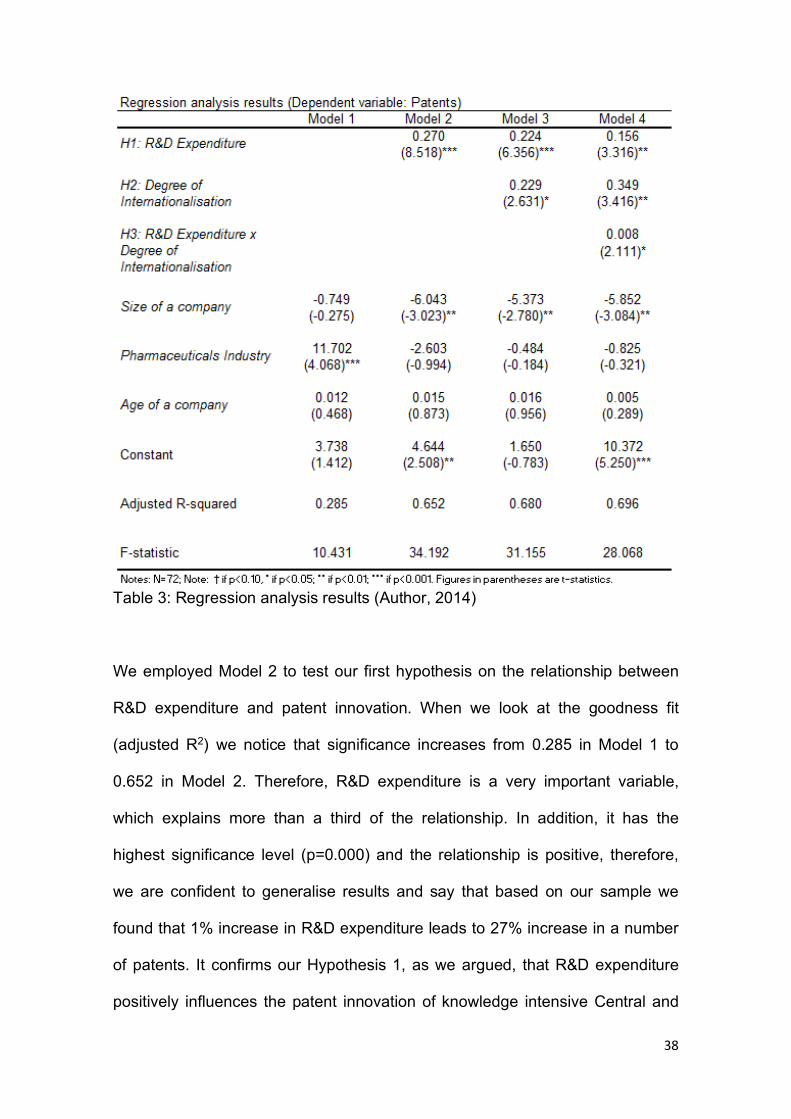
Table 3: Regression analysis results (Author, 2014)
We employed Model 2 to test our first hypothesis on the relationship between
R&D expenditure and patent innovation. When we look at the goodness fit
(adjusted R2) we notice that significance increases from 0.285 in Model 1 to
0.652 in Model 2. Therefore, R&D expenditure is a very important variable,
which explains more than a third of the relationship. In addition, it has the
highest significance level (p=0.000) and the relationship is positive, therefore,
we are confident to generalise results and say that based on our sample we
found that 1% increase in R&D expenditure leads to 27% increase in a number
of patents. It confirms our Hypothesis 1, as we argued, that R&D expenditure
positively influences the patent innovation of knowledge intensive Central and

39
Eastern European firm. Many authors who analysed this relationship found that
the relationship between R&D expenditure and patents is significant and
positive. For example, Kondo (1999) found that 1% increase leads to 1.4%
increase in patents. Others, like Peeters et al. (2006) analysed companies
probability of having patent portfolios and found that 1% increase in R&D
budget leads to 5% increase in the probability that a company will have patent
portfolio. When they looked at the direct relationship with patents they found
that 1% increase leads just to 0.7% increase in patent (Peeters et al., 2006).
Therefore, our results are in line with other authors in terms that the relationship
is significant and positive; however, the effect on patents is much higher than
other studies. Our findings suggest that CEE companies generate more patents
with same 1% increase in R&D expenditure. There might be few reasons why
this happened. First of all, our sample is based on CEE region, and we were
expecting to generate new insights specific to the region. It is known that the
labour cost in the CEE region is lower than in developed economies; however,
the labour is well educated (Eurostat, 2014). These are very important facts as
according to Hall and Lerner (2010) more than 50% of total expenditure on R&D
is spend on researchers' and innovators' salaries. Thus, if we consider these
facts together it becomes easier to understand that CEE companies need to
spend less on researchers and innovators salaries as labour cost is lower in the
region. Also, because the region has well educated specialist the inventors’
efficiency is similar despite the country of origin; therefore, CEE companies
generate more patents when amount of investment remains constant. In
addition to this, our sample is based on the most knowledge intensive
companies from the region. We made sure that they use patents as a mean for
40
the invention protection. It means that we capture the majority of the innovation
output and therefore, the strict criteria of our sample might influence the
strength of the effect in this relationship.
Overall, we can confirm that R&D expenditure is a very important positive
determinant of innovation output for CEE companies, however in order to
confirm that CEE companies are more efficient in generating innovation output
further research would be needed.
Model 3 allows us to test Hypothesis 2, which suggests that the degree of
internationalisation positively influences the patent innovation of a knowledge
intensive CEE firm. If we look at the goodness fit (adjusted R2), there is an
increase of 0.028 from Model 2 to Model 3 meaning that internationalisation
provides additional explanation on patent innovation. The relationship between
innovation and number of patents is positive and significant (p=0.011). This way
we confirm our Hypothesis 2 suggesting that the internationalisation, in terms of
number of countries the company is present; positively affects the patent
innovation, i.e. 1% increase in internationalisation leads to 22.9% increase in a
number of patents. There are quite a few studies, which analysed the degree of
internationalisation, foreignness of a company or multinationality of a firm,
however, the results are mixed. For example, when Peeters et al. (2006) looked
at foreign ownership and level of internationalisation they found that these
factors do not influence patenting behaviour significantly. Baldwin et al. (2002)
argued that foreign owned firms perform more R&D but just because they are
larger and more powerful, not because they are international. On the other
hand, Higon and Atolin (2012) results are more in line with our results as they
found that multinational companies generate higher R&D returns than purely

41
domestic companies. It is also in line with results of Kafouros et al. (2008) and
Tsang et al. (2008). The reasons why we see a clear and strong relationship
might be the use of different methods to measure innovation input and output as
well as the development level and unique position of CEE countries. In the
international business literature, it is known that companies from less developed
countries seek knowledge by establishing a presence in more developed
economies. CEE companies’ market increased significantly after countries
joined the EU. The companies had to adapt quickly and learn to compete with
other companies from developed world if they wanted to survive. This might be
the reason why internationalisation is so important for our sample companies
and why the effects are significant and positive unlike in few other studies.
Therefore, we can argue that companies from CEE benefit from
internationalisation.
Model 4 introduce the moderated regression analysis, which is based on
interaction model in order to test Hypothesis 3. To use interaction model we
mean-centred the independent variables for R&D expenditure and
internationalisation, so that interpretability could be increased, and we would
avoid potential multicollinearity issues. We ran Model 4 and found that
interaction model between R&D expenditure and internationalisation has a
positive effect on a number of patents generated by each firm. Therefore, we
can confirm that Hypothesis 3 is empirically supported, meaning that the
benefits of R&D expenditure on patent innovation are stronger when a CEE firm
has a higher degree of internationalisation. As both hypotheses 2 and 3 are
confirmed, we can argue that internationalisation plays an important role in
patent innovation for CEE firms. Kafouros et al. (2008) found that more

42
internationalised companies outperform less internationalised competitors when
other factors remain constant. This is important as our results also show that
the degree of internationalisation not only influence the number of patents
generated but also provide a competitive advantage over other firms with very
similar characteristics but lower degree of internationalisation. The main
reasons are that more international companies generate more and broader
knowledge, can spread the R&D cost over many markets and generate more
returns quicker by introducing the invention to many markets.
5.2. Further Analysis - Internationalisation
As we mentioned before our sample consists of 8 companies from 5 CEE
economies. The degree of internationalisation of these companies varies from 3
to 34 host countries. The countries that are home to the most internationalised
companies are Hungary and Slovenia. The graph demonstrates how widely
CEE knowledge intensive companies are internationalised and which countries
are the most popular host destinations.
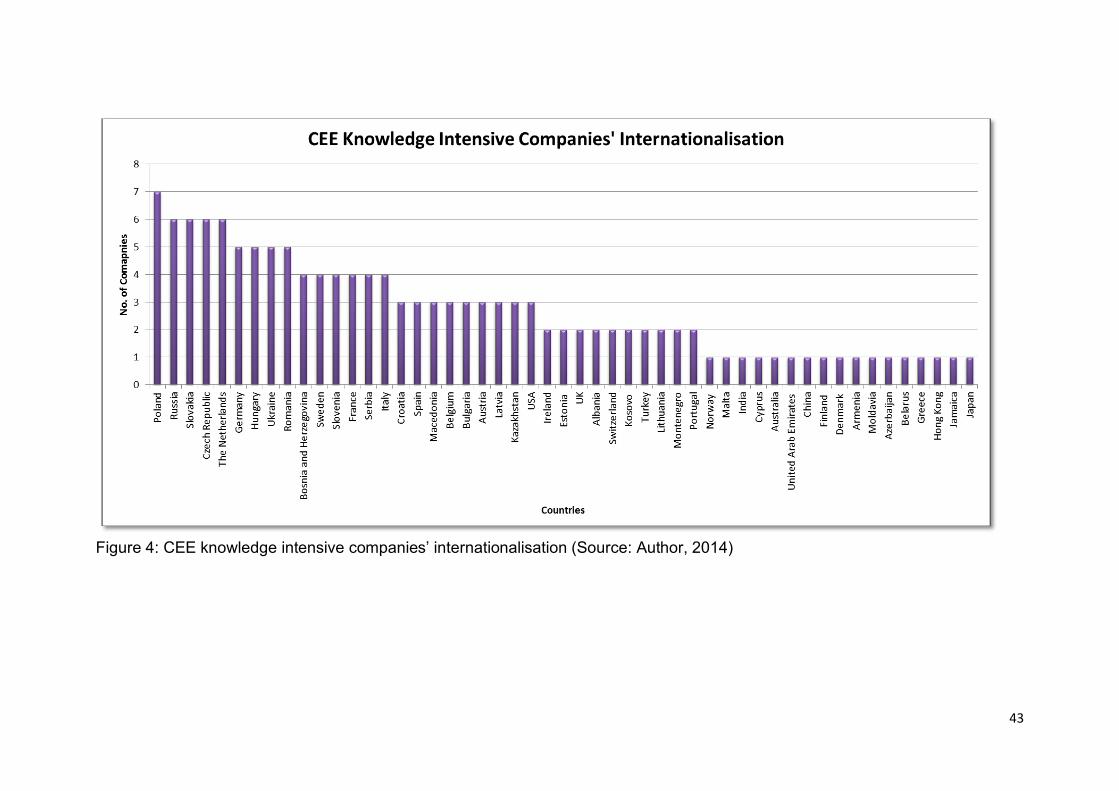
43
Figure 4: CEE knowledge intensive companies’ internationalisation (Source: Author, 2014)

44
As you can see from the graph there are 51 countries and the leading host
locations are Poland (7), Czech Republic (6), Russia (6), Slovakia (6) and The
Netherlands (6). It is in line with internationalisation literature, which suggests
that the majority of the companies expand to the neighbouring countries first
and just in the later stages chose to internationalise to more distant places
(Daniels et al., 2011). Also, we can see that the majority of the countries are
European countries and that the overall concentration, around 64% of all
activities, is based in Europe.
Figure 5: GEO Chart of CEE knowledge intensive firms international spread
(Author, 2014). (Interactive GEO Chart available at:
http://savedbythegoog.appspot.com/?id=797827c4aba47186ebd4ab04bff5e6c0
3aa5b8bc )
The geographical chart helps us to visualise how widely the CEE companies
are internationalised. We cannot ignore the fact that Russia is an important
market for CEE companies. 6 out of 8 companies in our sample have

45
subsidiaries in Russia. Despite the market size of Russia, we argue that the
main reason for an expansion to Russia is close historical relationship. Just one
of the companies in our sample was established after the Soviet Union broke
down. It implies that some of the important parts of the business might be
dependent on specific resources that Russia has to offer, and; therefore, the
majority of the CEE companies continued conducting business in Russia.
Figure 6: The growth of international activities (Author, 2014)
Another interesting factor about our sample companies is that majority of them
increased their international activities significantly after the accession to the EU
in 2004. The Figure 6 shows how each company’s international activities were
growing over the selected period. Probably the steepest overall increase can be
seen between 2004 -2005, where the overall breadth of our sample companies
increased by 20 countries. We can see that some of the companies were
growing internationally more than others; however we cannot deny the overall
rapid international expansion. This can be associated to both the opportunities,
0
20
40
60
80
100
120
140
160
2004 2005 2006 2007 2008 2009 2010 2011 2012
Degr
ee o
f Int
erna
tiona
lisat
ion
(No.
of C
ount
ries)
Year
The Growth of International Activities
FD FA FB FC FE FF FG FHCompany
Year
Sum of INTERNATIONALISATION

46
which were created by ‘Four Freedoms’ of regional economic integration as it
made international expansion within the EU easier, as well as threats, which
arose due to increased exposure to the big European market and competitors
from developed world. These factors make CEE region interesting and
important to analyse as well as confirms our findings that internationalisation
plays a very important role in patent innovation of CEE knowledge intensive
companies.
In this chapter we have presented and explained the results of our study. We
explained how our findings relate to existing innovation literature as well as to
the overall conditions of the region.

47
Chapter 6 Conclusions
The last chapter of our study summarises our key findings and proposes
implications to both business managers and policy makers. We also
acknowledge the limitations of our research and suggest the areas that would
be interesting for future research.
6.1 Conclusions
Our study contributes to the literature by investigating the dependence
relationship between patent innovations, R&D expenditure and providing
support for the role of the internationalisation based on CEE knowledge
intensive companies sample. The patent innovation is measured by a number of
patents, both applications and granted, held by the firm. Three main hypotheses
were formulated to help us understand how significant R&D expenditure and
internationalisation are in determining patent innovations. The first one
concerns with R&D expenditure and its impact on patents. The second one
suggests looking at the direct relationship between internationalisation, in terms
of geographical breadth, and patents. By employing the third hypothesis, we
argue that internationalisation also works as a moderator in the R&D
expenditure and patent innovation relationship. The companies with the same
R&D expenditure, but the higher degree of internationalisation will benefit more,
in terms of innovation output.
We found that the most significant determinant for patent innovation is R&D
expenditure, which is in line with other authors who analysed this relationship
(Kondo, 1999; Ernst, 1998). The internationalisation variable was analysed

48
using two different models. First of all, we used linear regression analysis to
identify whether internationalisation has a direct impact on patent innovation.
We found that the relationship is significant and that more international
companies are able to generate more patents than others. Many scholars who
analysed this relationship found mixed results (e.g. Kafouros et al, 2008; Higon
et al., 2011) however, we argue that internationalisation has a greater and
clearer impact on our sample knowledge intensive companies as they have to
seek for knowledge from developed economies, that is not available in their
home transitioning country, in order to be able to compete with other R&D
intensive companies. To test Hypothesis 3, we employed moderated
regression analysis and found that internationalisation not only influences
patent innovation directly, but also acts as a moderator to increase the benefits
from innovation effort. This means that companies, which are more
internationalised than others generate better results from their innovation effort,
when the input efforts are equal. The findings give us useful and specific to CEE
companies results, which benefit both businessmen and policy makers.
6.2. Implications
In order to conclude our study, it is important to mention what implications our
findings have on managers and policy makers. Like many other authors, we
suggest that managers should understand the importance of R&D expenditure
on innovation output as cutting down the R&D budgets even during a financial
downturn might have a severe impact on company's future competitiveness and
overall performance (Earnst, 1998; Kondo, 1999). However, our study focused
only on the knowledge intensive firms and, therefore, we do not have any
evidence that high investment in R&D activities would benefit low-technology
49
companies. R&D expenditure is not only influential determinant for innovation
output; internationalisation plays a very important role too. Therefore, we
suggest that managers need focus equally on both innovation efforts and also
look for a potential market expansion options in order to benefit more from the
innovation efforts. It is especially important when home countries cannot
provide superior knowledge required for the innovation. From a policy
perspective, our study suggests that the policy makers need to understand that
it is not enough to encourage companies to conduct more R&D activities in their
home country; there should also be appropriate systems in place that would
allow them to engage in global collaborations, expand internationally and
encourage to seek superior knowledge that eventually will raise the national
technological capability.
6.3 Limitations and Future Research
Like other studies, our research also suffers from several limitations. First of all,
small sample size to some extent limits our ability to generalise the results,
therefore, further research could be conducted on a larger sample of the firms
from CEE. Also, the existing literature suggest that patent related indicators are
not perfect because they are dependent on company's strategy, whether to use
patents as a means of innovation protection or not. Therefore, it would be
interesting to use other measures of innovation output, like new product sales,
to provide more insights for the CEE companies. In terms of R&D expenditure, it
would be really useful to get further insights and analyse whether the lower cost
of labour, in terms of R&D, can be seen as a competitive advantage of CEE
companies. Furthermore, it would be interesting to look at these companies in
more detail and find out, for example, what type of innovation most of the

50
companies are conducting, whether they are really trying to catch up with
companies from developed economies or actually by having high levels of
international presence they are able to compete on the legal grounds despite
their origins. In our study, internationalisation was measured in terms of number
of countries despite the development level. However, it would be really
interesting to see whether the direction of internationalisation e.g. to more
developed countries influence patent innovation differently.
As you can see, there are many interesting topics to be covered on the CEE
region therefore we believe that by this study we acknowledged that CEE
countries and companies are to some extent different from those in the rest of
Europe, identified key variables determining patent innovation output, provided
specific insights for managers and policy makers and hopefully encouraged
future studies.
51
List of References:
Almeida, P., Kogut, B. 1999. Localization of knowledge and the mobility of
engineers in regional networks. Management Science. 45, pp.905–917.
Arrow, K. 1962. Economic welfare and the allocation of resources for invention. In: Nelson RR (ed). The rate and direction of inventive activity. Princeton: Princeton University Press.
Arundel, A., Kabla, I., 1998. What percentage of innovations are patented? Empirical estimates for European firms. Research Policy. 27, pp.127–141.
Baldwin J.R., Hanel P., Sabourin D. 2002. Determinants of innovative activity in Canadian manufacturing firms. In: Kleinknecht A., Mohnen P. (ed). Innovation and firm performance: econometric explorations of survey data. New York: Palgrave.
Bartlett, C.A., Ghoshal, S. 2002. Managing Across Borders: The Transnational Solution. Boston: Harvard Business School.
Basberg, B.L., 1987. Patents and the measurement of technological change: a survey of the literature. Research Policy. 16, pp.131–141.
Blind K., Cremers K., Mueller E. 2009. The influence of strategic patenting on companies’ patent portfolios. Research Policy. 38, pp. 428–436.
Blind, K., Edler, J., Frietsch, R., Schmoch, U. 2006. Motives to patent: empirical evidence from Germany. Research Policy. 35, pp. 655–672.
Cantwell, J. A., Dunning, J. H., Janne, O. E. M. 2004. Towards a technology-seeking explanation of US direct investment in the United Kingdom. Journal of International Management. 10, pp.5–20.
Cohen, W.M., Nelson, R.R., Walsh, J.P., 2000. Protecting their intellectual assets: appropriability conditions and why US manufacturing firms patent (or not). In: NBER working paper no. 7552.
Collinson, S., Morgan, G. 2009. Images of the multinational firm. West Sussex: John Wiley & Sons Ltd.
Daniels, J.D., Radebaugh, L.H., Sullivan, D.P. 2011. International business: environments and operations. 13th edition. London: Pearson.
De Rassenfosse, G., van Pottelsberghe de la Potterie, B. 2009. A policy insight into the R&D-patent relationship. Research Policy. 38, pp. 779–792.
52
Dunning, J.H. 1993. Multinational Enterprises and the Global Economy. New York: Addison-Wesley.
Economic Scorecard. 2014. Economic Scorecard, PwC, British Embassy Warsaw. [ONLINE]. [Accessed 09 April 2014]. Available at: http://economicscorecard.eu/
Ernst, H. 1998. Industrial research as a source of important patents. Research Policy. 27, pp.1–15.
Europe 2020. 2014. Europe 2020 in a nutshell - targets. [Online]. [Accessed on: 01 April 2014]. Available at: http://ec.europa.eu/europe2020/europe-2020-in-a-nutshell/targets/index_en.htm
Eurostat. 2011. Education statistics at regional level. [Online]. [Accessed on: 03 April 2014]. Available at: http://epp.eurostat.ec.europa.eu/statistics_explained/index.php/Education_statistics_at_regional_level
Eurostat. 2014. Eurostat - Tables, Graphs and Maps Interface (TGM) map. [ONLINE]. [Accessed 09 April 2014]. Available at: http://epp.eurostat.ec.europa.eu/tgm/mapToolClosed.do;jsessionid=9ea7d07d30dbd7fcd3b26a8b49f8b904a94e18d2d2de.e34MbxeSaxaSc40LbNiMbxeNb3eLe0?tab=map&init=1&plugin=0&language=en&pcode=t2020_20&toolbox=types .
Fisch, J.H. 2003. Optimal dispersion of R&D activities in multinational corporations with a genetic algorithm. Research Policy. 32, pp.1381–1396.
Fontaine, P. 2010. Europe in 12 lessons. Luxembourg: Publication Office of the European Union.
Fontana, R., Nuvolari, A., Shimizu, H., Vezzulli A. 2013. Reassessing patent
propensity: evidence from a data set of R&D awards. Research Policy. 42, pp. 1780-1792.
Griliches, Z. 1990. Patents statistics as economic indicators. A survey. Journal of Economic Literature. 28, pp.1661–1707.
Hall, B. H., Lerner, J. 2010. The financing of R&D and innovation. In Hall B. H., Rosenberg, N. (Eds), Handbook of the economics of innovation, pp. 609–640. Amsterdam: Elsevier-North Holland.
Hall, B.H., Ziedonis, R.M. 2001. The patent paradox revisited: an empirical
study of patenting in the U.S. semiconductor industry 1979–1995. Journal of Economics. 32, pp. 101–128.
53
Higón, D. A., Antolín, M. M. 2012. Multinationality, foreignness and institutional distance in the relation between R&D and productivity. Research Policy. 41, pp.592-601.
Higón, D. A., Antolín, M. M., Mañez, J. A. 2011. Multinationals, R&D, and productivity: evidence for UK manufacturing firms. Industrial and Corporate Change. 20, pp. 641-659.
IRI. 2013. The 2013 EU Industrial R&D Investment Scoreboard. [Online]. [Accessed on: 03 April 2014]. Available at: http://iri.jrc.ec.europa.eu/scoreboard13.html
Kafouros, M.I. 2008. Economic returns to industrial research. Journal of Business Research, 61, pp. 868–876.
Kafouros, M.I., 2006. The impact of the Internet on R&D-efficiency: theory and evidence. Technovation. 26, pp. 827–835.
Kafouros, M.I., Buckley, P.J., Sharp, J.A., Wang, C. 2008. The role of internationalization in explaining innovation performance. Technovation. 28, pp. 63–74.
Kafouros, M.I., Forsans, N. 2012. The role of open innovation in emerging economies: do companies profit from the scientific knowledge of others?. Journal of World Business. 47, pp. 362–370
Kafouros, M.I.. 2005. R&D and productivity growth: evidence from the UK. Economics of Innovation and New Technology. 14, pp. 479–497.
Kondo, M. 1999. R&D dynamics of creating patents in the Japanese industry. Research Policy. 28, pp. 587–600.
Kotabe, M., Srinivasan, S.S., Aulakh, P.S. 2002. Multinationality and firm performance: the moderating role of R&D and marketing capabilities. Journal of International Business Studies. 33, pp. 79–97.
Kylaheiko, K., Jantunen, A., Puumalainen, K., Saarenketo, S., Tuppura, A. 2011 Innovation and internationalization as growth strategies: the role of technological capabilities and appropriability. International Business Review. 20, pp. 508–520.
Levin, R.C., Klevorick, A.K., Nelson, R.R., Winter, S.G. 1987. Appropriating the returns from industrial research and development. Brookings Papers on Economic Activity. 3, pp. 783–831.
Levin, R.C., Reiss, P.C. 1988. Cost-reducing and demand-creating R&D with spillovers. Journal of Economics. 19, pp. 538-556.

54
Mansfield, E. 1986. Patents and innovation: an empirical study. Management Science. 32, pp. 173–181.
Nielsen, A.O. 2001. Patenting, R&D and market structure: manufacturing firms in Denmark. Technology Forecast Society Change. 66, pp.47–58.
Nieto, M.J., Rodriguez, A. 2011. Offshoring of R&D: Looking Abroad to Improve Innovation Performance. Journal of International Business Studies. 42, pp.345-361.
OECD iLibrary. 2011. Statistics: OECD Science, Technology and Industry Scoreboard. [ONLINE]. [Accessed 10 April 2014]. Available at: http://www.oecd-ilibrary.org/sites/sti_scoreboard-2011-en/02/05/index.html?itemId=/content/chapter/sti_scoreboard-2011-16-en
OECD. 2001. Using Patent Counts for Cross-Country Comparisons of Technology Output. [ONLINE]. [Accessed 10 April 2014]. Available at: http://www.oecd.org/sti/inno/21682515.pdf
OECD.2009. OECD Patent Statistics Manual. [ONLINE]. [Accessed 10 April 2014]. Available at: http://browse.oecdbookshop.org/oecd/pdfs/free/9209021e.pdf
Oxford dictionary (British & World English). 2014. Patent: definition of patent in Oxford dictionary (British & World English). [ONLINE]. . [Accessed 15 March 2014]. Available at: http://www.oxforddictionaries.com/definition/english/patent
Peeters, C., van Pottelsberghe de la Potterie, B. 2006. Innovation strategy and the patenting behavior of firms. Journal of Evolutionary Economics. 16, pp. 109–135.
Porter M., E., Ketels C. 2013. European Integration: Meeting the Competitiveness Challenge. [Case Study]. Boston: Harvard Business School Publishing.
Radosevic, S., Yoruk, E. 2013. Global shifts in world science base? A comparative analysis of Central and Eastern Europe within world’s regions. [Online]. Working papers. [Accessed on: 03 April 2014]. Available at: http://www.grincoh.eu/working-papers?filter%5B%5D=&filter%5B%5D=&filter%5B%5D=&wp=3&task=&product=&institution=
Saarenketo, S. 2004. Born global approach to internationalization of high technology small firms – antecedents and management challenges. In During, W., Oakey, R., & Kauser, S. (Eds.), New technology-based firms in the new millennium (Vol. III, pp. 301–317). Oxford: Elsevier.

55
Sanna-Randaccio, F., Veugelers, R., 2007. Multinational knowledge spillovers with decentralised R&D: a game-theoretic approach. Journal of International Business Studies. 38, pp. 47–63.
Saunders, M., Lewis P., Thornhill, A. 2009. Research methods for business students. 5th Edition. Harlow: Financial Times Prentice Hall.
Schumpeter J.A. 1942. Capitalism, socialism and democracy. New York: Harper.
Sofka, W., Zimmermann, J. 2008. Regional economic stress as moderator of liability of foreignness. Journal of International Management. 14, pp.155–172.
Storey, J., Salaman, G. 2005. Managers of Innovation: Insights into making innovation happen. Oxford: Blackwell Publishing.
Tondl G., Vuksic G. 2003. What makes regions in Eastern Europe catching up? The role of foreign investment, human resources and geography.[Online] . Viena: Center for European Integration Studies. [Accessed on: 03 April 2014]. Available at: http://epub.wu.ac.at/274/1/document.pdf
Tsang, E. W. K., Yip, P. S. L., Heng Toh, M. 2008. The impact of R&D on value added for domestic and foreign firms in a newly industrialized economy. International Business Review. 17, pp. 423–441.
van Ophem, H., Brouwer, E., Kleinknecht, A., Mohnen, P. 2001. The mutual relation between patents and R&D. In: Kleinknecht, A., Mohnen, P. (ed) Innovation and firm performance: econometric explorations of survey data. New York: Palgrave.
Varga, A., Sebestyén, T. 2013. Innovation in Central and Eastern European Regions: Does EU Framework Program participation lead to better innovative performance? [Online]. [Accessed on: 04/04/2014]. Available at: http://www.grincoh.eu/working-papers?filter%5B%5D=&filter%5B%5D=&filter%5B%5D=&wp=3&task=&product=&institution=
WIPO. 2014. Harnessing Central and Eastern Europe’s innovative potential. [ONLINE]. [Accessed 04 April 2014]. Available at: http://www.wipo.int/wipo_magazine/en/2013/01/article_0008.html
Zander, I. 1998. The evolution of technological capabilities in the multinational corporation—Dispersion, duplication and potential advantages from multinationality. Research Policy. 27, pp.17–35.
56
Appendix I
All the data and working files, which confirm the originality of the dissertation, are in the memory stick attached to the hard copy of the dissertation.
There are two folders, one called ‘Internationalisation and Patents’, it contains files with information about each company’s internationalisation and number of patents it generates each year, another is called ‘R&D intensity in EU’, which contains all R&D industrial scoreboard reports, also files where reports are merged together and analysed. There is a separate Excel file called ‘Full data set’. It has few different versions of collected data, which was used in SPSS to run regression analysis and also some sheets where additional analysis was performed and figures were generated. Finally, there is also an electronic version of the dissertation.
Related Documents