Determinants of MAP Violations Ayelet Israeli*, Eric T. Anderson**, and Anne T. Coughlan*** September 2011 *Doctoral Student, Marketing Department, Kellogg School of Management, Northwestern University, Evanston IL, 60208; Corresponding Author; [email protected] **Hartmarx Professor of Marketing, Marketing Department, Kellogg School of Management, Northwestern University, Evanston IL, 60208; [email protected] ***J.L. & Helen Kellogg Professor of Marketing, Marketing Department, Kellogg School of Management, Northwestern University, Evanston IL, 60208; a- [email protected] . We thank Wes Shepherd and Eugene Zelek or helpful comments on this paper. Errors remain the responsibility of the authors.

Welcome message from author
This document is posted to help you gain knowledge. Please leave a comment to let me know what you think about it! Share it to your friends and learn new things together.
Transcript

Determinants of MAP Violations
Ayelet Israeli*, Eric T. Anderson**, and Anne T. Coughlan***
September 2011
*Doctoral Student, Marketing Department, Kellogg School of Management, Northwestern University, Evanston IL, 60208; Corresponding Author; [email protected]
**Hartmarx Professor of Marketing, Marketing Department, Kellogg School of Management, Northwestern University, Evanston IL, 60208; [email protected]
***J.L. & Helen Kellogg Professor of Marketing, Marketing Department, Kellogg School of Management, Northwestern University, Evanston IL, 60208; [email protected] .
We thank Wes Shepherd and Eugene Zelek or helpful comments on this paper. Errors remain the responsibility of the authors.
2
Determinants of MAP Violations
ABSTRACT
Manufacturers in many industries frequently use vertical price policies, such as minimum advertised price (MAP), to influence prices set by downstream firms. While vertical pricing policies are common practice they have received little empirical attention. In this paper, we study a unique database that allows us to empirically investigate the effectiveness of MAP policies. We use agency theory and consumer search theory to develop empirical predictions about whether a MAP violation occurs and the extent of a MAP violation. We show that MAP violations vary significantly across both products and retailers and are systematically related to monitoring, incentives, bonding and price obfuscation. Specifically, we find that higher prices, free shipping, larger assortment size and authorization to distribute are associated with lower violation rates. In contrast, high distribution intensity is associated with higher violation rates. We also show that retailers are more likely to violate MAP when the policy is expected to expire soon. When a pricing violation occurs, we show that the extent of violation (offered price relative to MAP) is less when shipping is free, retailers are authorized, and distribution is more intensive.

3
1. Introduction Manufacturers often use vertical price policies, such as minimum advertised price (MAP), to influence downstream prices of channel partners, such as retailers and distributors. These policies are very common in many industries, including electronics (e.g. Sony, Bose), video games (e.g. Nintendo), housewares (e.g. Viking, Sub Zero), sporting goods (e.g. Callaway, Taylor Made), computers (e.g. HP), toys (e.g. Activision Blizzard, LeapFrog), marine equipment (e.g. JL Marine), motor sports (e.g. GPR Stabalizer) and plumbing (e.g. Brasstech). Vertical pricing policies can set minimum prices, maximum prices or target prices for channel partners and establish a set of rewards and punishments for compliance with the policy. While these types of pricing policies are widely used in practice, there has been virtually no systematic empirical investigation of them. To date, published empirical evidence largely consists of anecdotes that document MAP violations (Pereira 2008) and a single lab experiment (Charness and Chen 2009). In this paper, we analyze a unique dataset that includes prices of hundreds of products that are sold by hundreds of retailers to empirically investigate compliance with MAP policies. This large dataset was provided by a third party that tracks online retail prices to assist manufacturers with enforcement of MAP policies. The third party monitors prices on a frequent basis (at least daily), which allows us to accurately determine when a MAP violation occurs and the depth of violation. Empirically, we find tremendous variation in MAP violations across both retailers and products. At the extremes, 39% of retailers never violate MAP on any products and 19% of retailers violate MAP on all products that they offer. To explain this variation, we develop a set of theoretical predictions that are grounded in agency theory (Milgrom and Roberts 1992) and consumer search theory (Stigler 1961, Ellison and Ellison 2009). Our goal is to understand which factors may explain whether a MAP violation occurs and the extent of a MAP violation. In other words, what can explain why a retailer like AceToolOnline offers a heavy duty battery pack at a price $20 below MAP (Pereira 2008)? Further, what factors can explain why the violation is $20 below MAP and not a larger or smaller amount? Agency theory points to three conditions that together set the stage for moral hazard to occur (Milgrom and Roberts 1992): a conflict of interest between parties; a basis for benefits if contract terms are fulfilled by the parties; and incomplete observability of the other party’s performance, along with an incomplete ability to enforce the contract terms. All of these conditions are met in a manufacturer-retailer relationship that includes a MAP policy, which is itself a rule imposed by the manufacturer that restricts retailer behavior. There is a clear basis for benefits if all retailers hew to the MAP policy, as this will lead to higher margins for all retailers and the ability to provide customer service at a profit. The manufacturer and its retailers have conflicting interests, however; the manufacturer seeks maximum profit across the sum of all retailers’ sales, while each individual retailer wishes to maximize only its own profit – in a world where it may be able to free ride on the service provision of other retailers. Finally, it is not trivial for the manufacturer to verify MAP compliance in all circumstances.

4
Given these problems, moral hazard (i.e., a retailer’s violation of the manufacturer’s MAP policy) can be managed with the use of monitoring, incentives, and/or requiring the posting of a bond from the potentially offending partner. Clearly, the manufacturer that invests in monitoring the pricing actions of its retailers is more likely to uncover MAP violations; the threat of discovery can then be a deterrent to violating behavior. Along with the mere threat of discovery, the use of an incentive for compliance – and an associated penalty for non-compliance – reduces the retailer’s incentive to violate MAP. Finally, the retailer who has a great deal to lose (i.e., who has in effect posted a bond) is one who is least likely to violate MAP. In our empirical analysis, we observe variations in all three of the tools described above. A manufacturer’s ability to monitor is reflected in our data by the breadth or intensity of distribution of a particular product: the more selective is a product’s distribution, the greater is the manufacturer’s ability to monitor each retailer’s pricing practices. Our data also reveal whether a retailer has been designated an authorized retailer for the manufacturer’s product. If so, the manufacturer offers various incentives not available to unauthorized retailers, including trade promotions, cooperative advertising funds, and the honoring of product warranties. The presence or absence of authorization is therefore a measure of the incentive offered by the manufacturer for MAP compliance. Another measure of the amount of incentive for MAP compliance is the temporal proximity to discontinuation of the MAP policy. For example, a MAP policy may be used when a product is new to the market but the MAP policy may be removed a few months later. When less time remains before a manufacturer removes a MAP policy from a particular product, the disincentive to violate MAP decreases. Finally, we observe variation in retailers’ posting of bonds through variations in the number of SKUs of the focal manufacturer carried by the retailer. The broader the product line carried by the retailer, the greater the potential loss, should that retailer violate MAP and suffer the manufacturer’s penalty for doing so. Our predictions also rely on consumer search theory, which recognizes that consumers often make purchase decisions with limited information. A number of authors have recognized that consumers do not always search all available options (Stigler 1961; Stahl 1989, 1996; Hong and Shum 2006; Mehta, Rajiv and Srinivasan 2003, and others), and therefore purchase with incomplete information. In addition, some firms engage in a strategy of price obfuscation, which makes it challenging even for motivated consumers to search for price information; this serves to increase the retailer’s full margin on a sale (Ellison and Ellison 2009). One example of such obfuscation occurs when charges for shipping, handling, taxes or other fees are not made readily apparent to buyers as they make their purchase decisions. In some cases, these hidden fees may be revealed only after the purchase or very late in the decision process. The incentive to engage in such price obfuscation is greater, the lower is the retailer’s listed product price, because it is a means of recouping some of the retail margin lost by lowering retail prices below MAP levels. Thus, we expect retailers that purposefully obfuscate the full consumer price (including shipping, etc.) are more likely to be MAP violators than those who do not. Empirically, we find strong support for these theoretical predictions. We find that MAP violations are more likely when a product is in broader distribution and sold via more retailers. We also find that unauthorized retailers are significantly more likely to violate MAP than are authorized ones. In contrast,
5
a retailer that offers a broader assortment of a manufacturer’s product line is less likely to violate MAP. We also find that a retailer is more likely to violate MAP when the MAP policy is expiring in the near future. Together, these are consistent with the agency-theoretic predictions concerning monitoring, incentives and bonding as mechanisms to control moral hazard. Finally, the norm among retailers in our empirical application is for retailers to offer free shipping. Empirically, we find that retailers who depart from this norm by charging for shipping are significantly more likely to violate MAP. This result is consistent with consumer search theory, because shipping fees are typically not disclosed until the sale is almost complete. We investigate not only the incidence of MAP violations, but the depth of violation (i.e. the amount by which the posted price is less than the MAP price). If larger MAP violations are easier to detect or more likely to be enforced, then the same factors that lead to MAP compliance should also affect the depth of violation. Our results show that the depth of price violation is significantly less when a retailer is authorized, which is consistent with this interpretation. We also find that MAP violations are smaller in depth when the product is intensely distributed, which is an unexpected finding. While broader distribution leads to a greater frequency of violations, the percentage depth of violations (among the violators) is smaller. One possible explanation for this finding is that demand for these products is more price-sensitive and thus there is less need for a deep discount to attract customers. Finally, if a retailer charges for shipping, then the depth of MAP violation is greater than if shipping is free. This result is consistent with our predictions regarding price obfuscation. In addition to the theoretical contribution of this work, our results also have policy implications for manufacturers seeking increased MAP compliance. In particular, many MAP violations stem from channel management issues that can be controlled by the manufacturer. For example, a substantial proportion of MAP violations are due to unauthorized distribution and elimination of these retailers should increase overall MAP compliance. Channel programs that encourage retailers to adopt a broader assortment of the manufacturer’s product may also increase MAP compliance. However, we caution that this policy implication rests on a causal interpretation of our findings. Overall, our results suggest that manufacturers seeking to improve MAP compliance should evaluate channel monitoring programs, channel member incentives, and the prevalence of bonds posted by retailers selling their products. The remainder of the paper is organized as follows. In Section 2 we review the related literature. In Section 3 we develop predictions concerning MAP violation incidence and depth. In Section 4 we discuss our raw data, operationalize our predictions and present empirical regularities in the data. In Section 5 we present an empirical data analysis testing our hypotheses, and in Section 6 we conclude and discuss future research. 2. Vertical Price Restraints Resale Price Maintenance (RPM) and Minimum Advertised Price (MAP) are two vertical price restraints that are commonly used by manufacturers in the United States. From a legal perspective, it is important

6
to distinguish between whether a manufacturer uses a vertical pricing policy or agreement. A policy is a unilateral offer by the manufacturer while an agreement is developed jointly with one or more retailers, which is important from an anti-trust perspective. Henry and Zelek (2003) provide an excellent summary of this issue. If one studies vertical price agreements, one may need to consider that the observed price is the result of a bargaining process between a manufacturer and retailers. In this paper, we focus only on MAP policies where the MAP price is unilaterally determined by the manufacturer. In turn, the decision to comply with the MAP policy is a unilateral decision of the retailer. Manufacturer rationales for MAP policies include controlling downstream prices, controlling and coordinating the retail channel, controlling the product’s perceived brand image, and preventing products from being used as loss-leaders. Effective price restraints maintain higher retail prices, which protects retailer gross margins and thus allows retailers to give service and augment the basic product profitably. Such restraints therefore are effective in battling discount retailers who may offer low prices but not the services required to sustain the brand. From a consumer point of view, the retail price of a product subject to vertical restraints may be higher than in their absence; but the higher price can be acceptable to consumer segments that value increased service and product augmentation. In addition, vertical price restraints can be used for the positioning and support of new products. By setting a minimum downstream price, the manufacturer informs the retailer about its valuation of the new product and signals the appropriate retail pricing strategy to the retailer. Moreover, at the beginning of the product life cycle, many products require more technical and trained selling, which requires a higher retail margin; this too explains the value of minimum downstream pricing policies. MAP is a promotional policy under which a manufacturer unilaterally declares a minimum price below which a complying retailer does not advertise a product. In return for compliance, a retailer receives promotional payments such as co-op advertising funds from the manufacturer. Even when a MAP policy is promulgated by the manufacturer, each retailer remains free to set its actual retail price above, below, or at the MAP level; if it chooses to price below the MAP level, it foregoes the benefits associated with MAP compliance. Some MAP policies also specify penalties for violation by an authorized retailer, such as withdrawal of access to one or more of the manufacturer’s products either permanently or for a period of time. For example, a retailer that violates MAP on a single Taylor Made golf driver may lose access to all Taylor Made products (Henry and Zelek (2003)). The distinction between RPM and MAP is primarily with respect to the scope of prices covered by the policy. RPM typically covers all prices offered by a retailer while MAP covers only advertised prices. For example, a MAP policy may cover prices advertised via television, radio and print but not in-store prices. Under a MAP policy, a retailer may be able to negotiate with a consumer or offer a price below MAP to her, yet still be classified as complying with the MAP policy, as long as this takes place within the confines of the physical store or possibly on the phone. In an online marketplace, this distinction in coverage has become blurred due to a broad interpretation of advertising. If a manufacturer’s MAP policy indicates that all online prices are advertised prices, then from a practical perspective RPM and MAP are equivalent. In some cases, a retailer may display a price below MAP only after the product has been placed in a shopping cart or may indicate “call for price” or “click for price” on the website. Some

7
manufacturers consider this behavior to be compliant with the MAP policy (see the marked section of Panasonic’s MAP policy in Technical Appendix B), while others view this as a MAP violation (see the marked section of Drinkwell’s MAP policy in Technical Appendix B). Whether these pricing tactics constitute a violation is idiosyncratic to each manufacturer, as “advertised price” is specifically defined within each manufacturer’s MAP policy. The academic literature on vertical price restraints has been primarily theoretical and has focused on RPM rather than on MAP. The first set of arguments for the economic optimality of RPM centered around service and quality provision. Telser’s (1960) “Service Argument” explains how minimum RPM can be used to solve the problem of discount retailers free riding on the efforts of high service retailers. The paper suggests that RPM increases the success of new branded products, which by their very nature benefit from superior marketing expenditures on persuasion, sales training, promotion, and service. Marvel and McCafferty’s (1984) “Quality Certification” argument is similar, where service is replaced by quality or style certification. Mathewson and Winter (1984) show that minimum RPM, together with another tool (franchise fees or quantity forcing), can achieve the first-best solution in the presence of double marginalization together with spillovers between retailers (e.g., where an increase in one outlet’s price increases demand in other outlets). Romano (1994) shows that both minimum and maximum RPM can solve a double moral hazard problem, where both the manufacturer and the retailer choose a non-price feature (“quality” and “promotion”). Klein and Murphy (1988) argue that the service argument does not explain many cases where RPM appears. They suggest that there is a principal-agent problem where the retailer can influence the final quality of the product and has an incentive to provide lower quality than the manufacturer would prefer. Minimum RPM, control over number of dealers and the right to terminate dealers can resolve this problem by giving retailers a quality-related profit stream that they risk losing if the manufacturer is not happy with the quality of service. Other research studies proposing rationales for RPM use two important properties: first, that successful implementation of RPM completely eliminates price competition and therefore enhances service/quality competition; and second, that the assurance of a margin or a price above the competitive solution gives the retailer an incentive to participate in the channel. O’Brien and Shaffer (1992) use maximum RPM1
1 Minimum RPM might also solve the problem, under additional conditions.
to solve a possible problem of opportunism of the manufacturer and one retailer (colluding and cutting prices) when the contracts are unobservable. Winter (1993) uses heterogeneity in consumers’ opportunity cost of time as a driver for minimum RPM. Bolton and Bonanno (1988) use similar arguments when the retailer can choose quality and consumers are heterogeneous in their demands for quality. Perry and Besanko (1991) show that in an environment of exclusive dealers, manufacturers can use minimum RPM to convince retailers to carry their products, by setting a price higher than the optimal price in competition. Deneckere, Marvel and Peck (1996, 1997) show that under demand uncertainty, manufacturers are better off with RPM, by not allowing discounters to enter the market or by preventing retailers from offering markdowns. The authors argue that products that are best fit to their model are those where the demand is uncertain, retailers must order inventories before the demand is realized and products are expensive to hold for a future period. Rey and Tirole (1986) show

8
that RPM can provide perfect insurance to retailers under demand uncertainty. Gould and Preston (1965) use the “outlets hypothesis” and predict that RPM would increase the number of retailers, since margins are larger. Several papers explore the relationship between collusions or cartels and RPM as well as the welfare implications of RPM. Telser (1960) identifies a “Manufacturer Cartel Argument” which explains why a group of manufacturers would use RPM. Yamey (1952) identifies a retailer cartel, where retailers want to protect themselves from discounters by colluding and convincing manufacturers to apply RPM. Asker and Bar-Isaac (2011) show that an incumbent manufacturer can exclude a more efficient entrant by employing RPM and colluding with the retailers in the market. Marvel and McCafferty (1985) and Comanor (1985) examine welfare effects of RPM in different cases and show that it may be welfare enhancing or reducing, depending on the circumstances. There are several empirical studies of RPM policies as well. Ippolito (1991) examines 203 lawsuits that went to trial and involved allegations of vertical price fixing, in the years 1976-1982. She finds that no single theory is capable of explaining RPM, and many cases are consistent with several theories. She finds that collusion can explain less than 15% of the cases. Gilligan (1986) uses an event study approach to study the effect of antitrust investigations or complaints on firms’ stock value. He finds that on average, the antitrust challenges reduced the return to firms over the announcement period by 1.4%. Next, the author tests the effect of distribution and manufacturing concentration levels and market share on the share price response from the first test. The results are consistent with several theories on RPM. More recently, Bailey and Leonard (2010) use a natural experiment (a statute that prohibited RPM in Maryland) to analyze the effect of RPM on prices. They find that the prohibition did not affect prices of video-games, but their methodology is subject to some caveats. For example, they did not observe whether the video games were subject to RPM policies to begin with. Only two analytical studies, Kali (1998) and Cetinkaya (2009), compare the properties of MAP and RPM. Kali (1998) views MAP as a vertical constraint that closely resembles RPM, and models MAP as a combination of RPM and a cooperative advertising subsidy. He shows that each instrument alone cannot maximize a channel’s profit, although the combined use of RPM and MAP does maximize the channel’s profit. Conversely, Cetinkaya (2009) models MAP and RPM as different instruments. His analysis focuses on social welfare and horizontal service externalities. Under his model, MAP can ensure optimal levels of retail service and duplicates the welfare outcome of vertical integration regardless of the level of service externality, whereas RPM leads to sub-optimal levels of retail service if used without applying another vertical restraint (such as a franchise fee). Charness and Chen (2009) use a controlled laboratory experiment to study the effect of MAP contracts on retailers’ behavior, including contract violation. Their study includes several types of MAP contracts, such as contracts with forward looking penalties versus penalties with retroactive components, contracts where the penalty is denying retailer access to the product versus ones with only monetary punishment, and contracts with a linked-product design where violation on one product triggers a penalty of other products. They find that 1) a forward-looking penalty is less effective than penalties

9
that are also retroactive; 2) more severe penalties are associated with higher retail margins; and 3) linked-MAP is less effective than individual-product MAP. In sum, the literature on RPM and MAP policies focuses mainly on RPM rather than MAP, and offers many theoretical explanations for RPM’s existence, profitability, channel coordination properties, and effects on consumer welfare. Appropriately-designed RPM policies are predicted to provide incentives for retailers to provide service, improve retailing quality, and control profit-reducing retail discounting. However, they do not typically focus on incentives to violate the vertical restraint policy or explicitly consider imperfect monitoring and control mechanisms. Empirical evidence is sparser on either RPM or MAP policies, with no empirical study of retailer pricing behavior under MAP in a real-world situation. Our research contributes to and builds upon the existing literature by conducting a theory-driven, empirical study of retailer behavior in the presence of MAP policies, including both incidence and depth of MAP violations. We use a unique, detailed database of a manufacturer’s broad line of hundreds of product SKUs, sold by hundreds of retailers, operating various online retail outlets including own online site, sales through Amazon.com, and sales through eBay. Our data include unauthorized retailers as well as authorized retailers, and thus are not restricted to observations of retailers with whom the manufacturer has chosen to partner. For every SKU/retailer/outlet-type combination, we observe both MAP price and actual retail price, at least once per day, over a one-year period, for an extremely detailed and disaggregated view of pricing and retailing behavior. These data permit us to describe actual pricing behavior under MAP and to investigate whether actual retail behavior rejects, or is consistent with, theoretical predictions. 3. Theoretical Predictions Although not specifically developed to consider MAP policy formulation or management, the agency theory literature provides solutions to moral hazard problems that we use to develop several hypotheses about retail pricing behavior in the presence of MAP policies. These ideas are reflected in Marketing studies of channel relationship management from a transaction cost analysis perspective.2
2 A full review of the Marketing literature on distribution channel relationships is beyond the scope of this paper, but the references here exemplify the issues and insights that are applicable to our research focus.
For example, the basis for cooperation in an agency relationship may involve future considerations as well as current ones, as Heide and Miner (1992) investigate. They consider the “shadow of the future,” meaning the future value of a relationship, as an asset whose value is best protected by cooperative channel behavior today. The agency theory literature also investigates channel members’ ability to preserve performance outcomes in the face of incentives for opportunistic behavior by other channel members (see for example Stump and Heide 1996, and Jap and Anderson 2003). The transaction cost analysis concept of opportunism (self-interest seeking with guile) is analogous to the threats to performance resulting from a divergence in channel members’ interests, combined with unobservability of channel partners’ performance levels, in the agency-theoretic paradigm. Jap and Anderson (2003)

10
show that even at high levels of opportunism, bilateral idiosyncratic investments by the channel partners over time – analogous to the agency-theoretic concept of the posting of a bond – continue to preserve performance outcomes and the expectation of future benefits from the channel relationship. An agency-theoretic approach further suggests that manufacturers can influence the pricing behavior of their downstream retailers through rules that are backed by monitoring, incentives, and/or the posting of bonds. Consistent with agency theory, we expect that the manufacturer’s ability to monitor retailer behavior will positively influence compliance with MAP, as our first set of predictions states:
Hypothesis 1A: A retailer is more likely to violate MAP when it is more difficult for the manufacturer to monitor the retailer’s pricing behavior.
Hypothesis 1B: The depth of a retailer’s MAP violation is greater when it is more difficult for the manufacturer to monitor the retailer’s pricing behavior.
The use of incentives in our setting is evident through a manufacturer’s unilateral establishment of a minimum advertised pricing rule that authorized retailers must agree to follow in order to earn benefits or avoid penalties. Rewards for MAP compliance, and punishments for MAP violations, are therefore both predicted to increase compliance:
Hypothesis 2A: A retailer is less likely to violate MAP when the rewards for complying, or equivalently the punishments for violating, are greater.
Hypothesis 2B: The depth of a retailer’s MAP violation is lower when the rewards for complying, or equivalently the punishments for violating, are greater.
In addition to monitoring and incentives, requiring the retailer to post bonds is another tool to manage the moral hazard problem, as reflected in the hypotheses below:
Hypothesis 3A: A MAP violation is less likely to occur when a retailer posts a bond to the manufacturer.
Hypothesis 3B: The depth of a MAP violation is lower when a retailer posts a bond to the manufacturer.
In our empirical setting, the posting of a bond is not a manufacturer requirement but is a retailer choice. This follows from the fact that violation of MAP on one product can lead to termination of retail access to all products. In this situation, a retailer offering multiple products from the same manufacturer has implicitly posted a bond, whose value is commensurate with the loss in profit due to loss of access to those products in the event of a MAP violation.

11
Consumer search theory acknowledges that search is costly, and therefore consumers might not engage in search or might limit their consideration set when searching for low prices (for theoretical and empirical research modeling pricing in the presence of search costs or empirically estimating search cost, see among others Stigler 1961; Stahl 1989, 1996; Hong and Shum 2006; and Mehta, Rajiv and Srinivasan 2003). Ellison and Ellison (2009) show how retailers strategically obfuscate prices and make it more difficult for consumers to find the final transaction price. For example, online retailers may postpone the revelation of shipping and handling costs, taxes or other add-on fees in the online buying process. This allows retailers to attract consumers by advertising lower product prices, even though the full transaction price could be considerably higher due to the additional hidden costs. To recoup profitability in the face of a discounted margin, the MAP-violating retailer is predicted to engage in a price obfuscation strategy. This leads to the final set of hypotheses:
Hypothesis 4A: A MAP violation is more likely when a retailer uses price obfuscation.
Hypothesis 4B: The depth of a MAP violation is higher when a retailer uses price obfuscation.
4. Data The data for this study are provided by Channel IQ, a company that monitors MAP policies and collects data about actual online prices for their manufacturer clients. The database includes one manufacturer with two main product categories (electronics and an additional non-electronic3 category), that sells 226 unique product SKUs4 through 960 different online retailers5 over the period January 25, 2010 – January 24, 2011. In all, the database includes 1,246,895 daily observations of 10,357 different SKU x retailer x marketplace different combinations.6
The manufacturer-set floor price in the database is called the “MAP price.” Other information included in the database is the marketplace where the product is offered (Amazon, eBay or a retailer’s own website); the condition of the product (new, used, or refurbished; we restrict our analysis to new products only); whether or not the retailer is authorized; shipping rates; whether or not the price is available to consumers before selecting the product; and the web link where the data was taken from. Detailed explanation of the variables available in the database appears in Table 1.
Channel IQ collects its information by scanning the Internet, searching for websites that sell the manufacturer’s SKUs that are subject to a MAP policy. In addition, they receive information from the manufacturer regarding MAP price and the identity of authorized dealers; their Internet search also uncovers unauthorized retailers of the manufacturer’s SKUs. A SKU’s MAP price can theoretically
3 For confidentiality purposes, we cannot reveal the product types in this category. 4 Initially, there are 258 unique SKUs; however after dropping cases where the MAP price was 0, only 226 SKUs are left. 5 Initially, there are 1,866 unique sellers; however, after dropping observations where the condition of the item is not new, only 1,096 retailers remain. Limiting SKUs to cases where the MAP price is greater than 0 yields 960 retailers. 6 Initially, the data include 1,744,622 observations. However, after the initial cleanup of cases where the condition of the item is not new, or where the MAP price is zero, 1,569,888 observations are left. When collapsing the data into daily observations, 1,246,895 observations are left.

12
change over time, as a manufacturer updates the policy or offers a periodic discount. The current database reports only the latest MAP price for each SKU, so that we may not observe all MAP price changes. However, in a subset of the data, we have separate observations of MAP pricing for the first and second six-month periods of our data span. In this subset, 31 SKUs7
report different MAP prices across the two six-month periods, allowing us to investigate retailer MAP violation behaviors as a MAP policy changes over time.
Some retailer/SKU price information is collected every few hours, while other information is collected only once a day. To balance the data, we therefore aggregate all retailer/SKU/outlet data up to the daily level.8
We define each observation to be SKU x retailer x marketplace rather than SKU x retailer to observe different behaviors in different outlets (own online store; sales through Amazon.com; and sales through eBay), on the same day, for a specific retailer, for a specific SKU. Each of our 960 retailers might be selling on its own online website; on Amazon.com; or on eBay. Thus, if a retailer uses all three online retail outlets, its sale of a particular SKU would have three observations: one for the own online outlet, one for the Amazon.com outlet, and one for the eBay outlet. Of our 960 retailers, 856 of them sell through only one outlet; 81 of them sell through two outlets; and 23 of them sell through all three outlets. Note also that while the data provide information on prices for used or refurbished products, we include only new products in our data analysis, since the manufacturer’s pricing policies apply only to new products.
We then collapse the data into a single observation for each SKU x retailer x marketplace combination, resulting in 10,357 observations. That is, we compute average measures across the entire period for each observation. We temporally aggregate the data because for over 92% of our observations there is no temporal price variation. Therefore, compliance with MAP for a retailer-SKU-marketplace combination does not vary much over time. The database includes a variable that indicates whether or not the price of a product is available to consumers before selecting the product. As mentioned above, some manufacturers allow retailers to post prices below MAP when the price is not on the main webpage, but can be seen if the consumers takes some action (such as placing the product in his/her cart) to observe the price (Desai, Krishnamoorthy and Sainam, 2010). Overall, less than one percent of the observations had unavailable prices.9
Due to the small occurrence of this state in the database, we have omitted this variable from our analysis.
7 There are 15 additional SKUs that match in the two six-month data subsets. However, they have no operative MAP price in either six-month period of our data. These SKUs are used later to test our hypotheses about retailer incentives and monitoring, but are not used through the main part of our analysis. 8 When doing so, if there are two or more observations in the same day from the same retailer-SKU-market combination with different prices, we choose the lowest price of that day. That is, since we are interested in retailers’ daily behavior and the daily probability of a violation, the “worst” behavior in the day is of interest. 9 The percent of “unavailable price” observations was less than 0.77% before collapsing the data into daily observations. Among daily observations, only 0.72% reported an “unavailable price”. Only 22 out of 960 retailers ever used the “unavailable price” option, with 20 of the 22 using it only on Amazon.com (one of the 20 being Amazon itself).
13
Variable Definitions and Operationalization We compute a variety of measures in our database. We first define a MAP violation as occurring if an observed price is below the MAP price. In the aggregated data we compute the average percent of violations over the entire period of the database. For example, if a particular retailer-SKU-marketplace combination has 300 observations over the period of a year, and 60 of them presented a price below MAP, we record a violation rate for that observation of 20%. Similarly, the depth of violation is the number of percentage points below MAP at which the product was priced.10
In the aggregated data, the depth of violation is averaged only over non-complying observations. The average percentage of violations in the database is 31.2%, and the average depth of violations is 14.5%.
We also define measures that capture SKU-specific and product-specific characteristics. For SKUs, we obtain measures of distribution intensity and product category. We define the distribution intensity of each SKU as the total number of retailers that hold that SKU. We obtain SKU category information from Amazon.com and the manufacturer website, to determine whether the product is in the electronics category. For each retailer, we define assortment size as the total number of SKUs that a specific retailer sells. Regarding shipping charges, we define a dummy variable that indicates whether there are shipping fees for the specific SKU x retailer x marketplace combination. Table 2 displays the summary statistics of these measures and other variables in the database. Table A1 in the Technical Appendix displays a correlation matrix of these variables and measures. Our database allows us to operationalize monitoring, incentives, bonding and price obfuscation to test our hypotheses. One factor that is expected to influence a manufacturer’s ability to monitor is the breadth of distribution. When a product is sold via a small number of retail outlets, then monitoring is much easier. However, when a product is sold via many outlets it becomes more costly and difficult to monitor each retailer’s behavior. As monitoring becomes less stringent, each retailer is more likely to violate MAP. We use distribution intensity to test Hypotheses 1A and 1B, and thus expect distribution breadth to increase the likelihood, and depth, of MAP violations. In our setting, the manufacturer offers numerous incentives to MAP-complying authorized retailers including financial support for marketing collateral such as brochures and cooperative advertising programs. In addition, authorized retailers are allowed to perform post-sale repairs for customers that do not invalidate the manufacturer’s product warranty. Overall, manufacturers offer many financial incentives to their authorized retailers. We caution that authorized retailers also offer reciprocal rewards to the manufacturer. For example, authorized retailers often carry additional inventory to provide timely delivery to customers. Authorized retailers may also invest in training of salespeople and technicians that is specific to the manufacturer. Thus, becoming an authorized dealer is also evidence of commitment by the retailer to the manufacturer. Overall, an authorized dealer has incentives to comply with MAP that stem from the financial rewards of compliance, as well as from the expected losses ensuing from non-compliance. We use retailer distribution authorization to test Hypotheses 2A and 2B,
10 For the example above, suppose that the MAP price is $100, and that 30 of the violations are priced at $95 and the other 30 violations are priced at $85. We have a 20% violation rate (60/300). To calculate the violation depth condition on violation, we use the 60 violating observations to arrive at an average violation depth of 10%. Thus, for this example, the violation rate is 20%, and the violation depth is 10%.

14
hypothesizing that authorized retailers are less likely to violate MAP than unauthorized retailers; and, if they do violate MAP, we hypothesize that the depth of the violation is less for authorized than for unauthorized dealers. In some categories like electronics, MAP is used on new products and is phased out over time.11
When a MAP policy expiration date is imminent, both the incidence and the depth of MAP violations are expected to increase, because the “shadow of the future” represented by the value of future punishment is weakened when the future life of a MAP policy is short. We therefore use imminence of MAP expiration to test Hypotheses 2A and 2B.
We use assortment size held by the retailer as a proxy for bonding. A broad assortment implies a large bond posted by the retailer, whose penalty value is the future profit stream from selling the manufacturer’s products over the penalty period (including the foregone financial value of the promotional incentives offered by the manufacturer to compliant retailers). We thus use assortment size to test Hypotheses 3A and 3B, and expect a broader assortment size to reduce both the incidence and the depth of MAP violations. We use a dummy variable for the presence of a positive shipping charge as a proxy for price obfuscation. Most of our retailers (83% of observations – see Table 2) offer free shipping, which would lead consumers to expect free shipping if not informed otherwise. Therefore, a retailer could try to engage in price obfuscation by hiding the fact they charge for shipping or postponing the revelation of the charge to a late step in the search and shopping process. We thus use the shipping charge variable to test Hypotheses 4A and 4B, and expect its sign to be positive for both the incidence and depth of MAP violations. A summary of our hypotheses, their operationalizations, and their predicted signs appears in Table 3. In our models, we include MAP price, a product category dummy variable (Electronics) and marketplace dummy variables (Amazon, eBay) as controls. While we do not have any strong a priori theoretical predictions regarding these variables they do help to explain some of the variation in MAP violations. Descriptive Statistics Table 4 presents the average percent of violation and the average depth of violations by different values of our dummy variables. The emergent observation is that both the incidence of violations and the depth of violations are higher when there is a shipping charge compared to no charge (supporting Hypotheses 4A and 4B), are higher in the electronics category compared to non-electronics, and are lower for authorized retailers than for unauthorized retailers (supporting Hypotheses 2A and 2B). While we find that unauthorized retailers tend to violate MAP much more than authorized retailers, it is quite surprising that their violation rate is only 54% and not 100%. As unauthorized retailers they do not benefit from, and thus have no reason to obey, the MAP policy or any of the manufacturer’s policies in the first place. One reason for unauthorized retailers nevertheless to comply with MAP is to avoid being
11 This is also the common practice at Hewlett-Packard, according to Charness and Chen (2002).

15
traced and eliminated by the manufacturers. A quote by Ted Cohen, eBay’s vice president of global government relations, supports this conclusion. In a WSJ article from 2008 (Pereira 2008), Cohen states: “They (manufacturers and price enforcing agencies) take down the web sites only of the unauthorized resellers that are selling at discount, but don’t bother unauthorized sellers if they’re selling at MAP. This suggests manufacturers are only interested in keeping prices up…” In addition, we observe systematic differences across the various marketplaces. eBay is the marketplace with the highest percentage of violations (44.0%), followed by Amazon (33.1%), and then a retailer’s own website (28.1%). A pairwise comparison between these markets shows that the violation percentage is significantly different across markets. The pattern persists for depth of violations, with eBay showing the greatest depth of violations with an average of 16.9%, followed by Amazon with 14.5% and a retailer’s own website with 13.9%. The differences between eBay and each of the other marketplaces are pairwise significant, but that between Amazon and a retailer’s own website is not. Chart 1 plots the distribution of violations by retailers as well as by the number of products they sell. That is, for each percentage of violations, the chart plots what fraction of the retailers have this violation rate, and how many of the manufacturer’s products on average they carry. Panel A of the chart includes all the retailers in the database. The panel reveals that about 20% of the retailers always comply, about 40% always violate and the rest of the retailers sometimes comply and sometimes violate. While 20% of the retailers comply, they represent a small fraction of the database, because retailers in this group hold on average only 3.3 SKUs. Similarly, the 40% of retailers that always violate MAP hold only 2.1 SKUs on average. The emerging picture from this plot is that the more SKUs the retailer holds, the lower is the rate of violations. Larger assortment size, as represented by the number of SKUs carried by a retailer, is associated with lower violation rates. This is consistent with our hypothesis that bonding leads to lower violations rate (Hypothesis 3A). To examine the impact of manufacturer authorization, we recreate the same charts for authorized retailers (Panel B) and unauthorized retailers (Panel C). These plots reveal two key differences: that (i) the authorized retailers sell many more products than do unauthorized retailers and (ii) their distribution of MAP violations is skewed to lower violation rates. Most of the authorized retailers have 0%-25% violation rates. On the other hand, most of the unauthorized retailers either never violate or always violate, and there are few observations with a violation percentage of between 0% and 100%. This is consistent with our hypothesis about incentives (2A), which predicts lower violation rates for retailers whose rewards from complying are greater (as is true for authorized, versus unauthorized, retailers). The retailers with a violation rate strictly between 0% and 100% are those that sometimes violate and sometimes comply with the MAP policy. While not shown in the charts, additional analysis shows that these are generally multi-product retailers who choose a subset of products for compliance and a subset
16
of products for violation. Specifically, 60% of the SKUs of those in this group are always in compliance and 22% are always in violation. Chart 2 plots the distribution of the mean violation rate by SKU, as well as the corresponding number of retailers selling those SKUs for all retailers (Panel A), authorized retailers (Panel B) and unauthorized retailers (Panel C). In Panel A, the left axis indicates the percent of SKUs sold at different violation rates. We note that there are very few SKUs that have more than a 60% violation rate. The right axis indicates the number of retailers selling SKUs with a specific violation rate. The density of our data can be approximated by multiplying the data indicated by the blue bars with the data indicated by the red line. For example, while there are over 60 retailers selling SKUs with a violation rate of 75% to 80%, this group accounts for less than 1% of SKUs. Hence, they represent a small fraction of the overall data. In contrast, among SKUs with violation rates of 20-25%, the number of retailers averages over 40 and more than 16% of SKUs fall into this category (and about 17% of the data). Indeed, the greatest fraction (about 70%) of our data lies in the regions with 5% to 35% violation rates (i.e., the left half of Panel A). Within this region of Panel A, we see that products that are sold by a greater number of retailers have a higher violation rate. This is consistent with Hypothesis 1A, stating that violation rates are higher when it is harder to monitor, that is when there is higher distribution intensity. Panel B includes only authorized retailers and Panel C includes only unauthorized retailers. Similar to Chart 1, the main difference between authorized and unauthorized retailers is that the authorized retailers’ violations are skewed towards zero. Most of the SKUs sold by authorized retailers have 0%-30% violation rates. On the other hand, the plot of SKUs using only unauthorized retailers has observations more evenly distributed over the full range of violations. Interestingly, while 13% of the SKUs sold by unauthorized retailers are always in compliance with MAP, there are almost no SKUs with violations between 0% and 10%. This implies that on average, unauthorized retailers that choose to violate MAP pricing, do so by more than 10%. Definition of Violations One of the challenges in our data is to define what a violation is. Up to this point in the discussion, we have defined a violation in the strictest manner possible, namely as any price below MAP. However, it may be reasonable to suspect that manufacturers allow retailers to price a certain percentage below MAP, or that they overlook small deviations below MAP, without imposing penalties. Therefore, we investigate violations at different percentage levels below MAP. Table 5 displays the average percentage of violations when a violation is defined as a price that is at least 0%, 1%, 2.5% or 5% below MAP. When we relax the MAP violation criterion to categorize any price at least 1% below MAP as a violation, we find that the average violation rate decreases from 31.2% to 25.5%. Some of the reasons for such a substantial change could be price endings (MAP was set to $X.99
17
and the retailer used $X.90), retailers being uninformed of the MAP price, or perhaps believing that such a small deviation would not be noticed or acted upon by the manufacturer.12
To gain a better understanding of the violation behavior we construct a measure that demonstrates how the number and depth of violations change when the definition of violation changes. We name this measure the “MAP Violation Index” (MVI). The index is displayed as a chart (see for example MVI computed for the entire dataset in Panel A of Chart 3), where the horizontal axis is “percent below MAP” and the vertical axis is “percent of violations”. Each point in the graph indicates the violation rate if we are willing to tolerate up to an X percent deviation below MAP price. For example, the MAP price of an item might be $19.99. At X=0, we compute the percent of prices that are below $19.99; at X=10%, we compute the percent of prices that are below ($19.99 x (1-10%)). Performing this calculation for all values of X allows us to create an MVI chart. An advantage of this approach is that we can study a variety of cuts of the data, for any subset of SKUs or retailers, as demonstrated in Chart 3. When analyzing the chart, we are interested in the shape of the curve as this informs us about many aspects of MAP violations. For example, if the MVI chart is horizontal from X=0 to X=X*, then this implies that there are no observed pricing violations in this range. This informs us that if a retailer violates MAP, the depth of violation is always large. In contrast, a steep, vertical slope around X=0 informs us that there are many small violations of MAP. Finally, the maximum depth of MAP violation is the point where the MVI curve first intersects the X-axis (i.e., the point where violations are zero). Thus, the MVI charts allow us to summarize both the depth and frequency of MAP violations. Chart 3A reveals some interesting facts. First, we clearly see the substantial change in violation rate between 0% and 1% allowed deviation below MAP price. Second, after 1%, the line continues to decrease quite smoothly. This indicates that retailer MAP violations occur at many price levels. If retailers “bunched” in the sense that they chose the same percent violation (e.g. 5% below MAP) then the MVI curve would exhibit discontinuities. We do not observe this in the data. To examine the relation between retailer and product characteristics and MAP violations, we create MVI plots for a set of characterizations. When the data are not discrete, we use a median split to divide the sample into two groups. We further indicate when the lines in each plot significantly differ from each other using null region plots. 13
Chart 3B plots MVI by assortment size, which is measured as number of products sold by the retailer. Higher brand commitment is associated with lower violation rates, due to the ability to reliably enforce and monitor, as predicted by Hypothesis 3A.
12 For completeness, we recreated Table 4 for each of these definitions of MAP violation and this does not reveal any new insights. This analysis is available from the Authors. 13 Null region plots are not reported in this document and are available upon request.

18
Chart 3C plots MVI by distribution intensity via a median split of the data, with distribution intensity measured as the number of retailers selling the specific SKU. Counterintuitively, higher distribution intensity is associated with lower violation rates, although the lines significantly differ from each other only in the range of 15% to 40% below MAP. We therefore consider other cuts of the data, for example, categorizing intensive distribution as more than 10 retailers selling the product. With this data split, we now observe a positive relationship between distribution intensity and violation rates, particularly for moderate violation depths.14
We thus find that less intense distribution is generally associated with higher compliance rates, consistent with Hypothesis 1A about monitoring.
Chart 3D displays MVI for items with high and low MAP prices. This chart demonstrates that items with lower MAP prices are associated with higher violation rates. Chart 3E plots MVI by market and demonstrates that the violation rate on eBay is the highest, followed by Amazon and then by own website. In this case, the qualitative differences we find between violation rates in the markets at 0% below MAP are persistent until a threshold percentage of about 40% between own website and the other marketplaces, and until 20% when comparing Amazon and eBay. Chart 3F plots MVI by product category, where products are defined as “Electronics” and “Other.” Electronics have substantially higher violation rates compared to the “Other” category. Charts 3G and 3H plot MVI for authorized versus unauthorized retailers and for products sold with free shipping versus shipping charge. Authorized retailers have much higher compliance rates compared to unauthorized (consistent with Hypothesis 2A), and sales with free shipping are associated with higher compliance rates compared to cases where there is a charge for shipping (consistent with Hypothesis 4A). In the authorized plot, we see that the depth of violations among the groups is very different. While the violation rate of the authorized group is close to zero starting about 40% deviation below MAP, for the unauthorized group the violation rate drops to zero only close to 100% deviation below MAP. This finding is consistent with Hypothesis 2B which predicts lower depth of violations for retailers whose rewards from complying are greater (as is true for authorized, versus unauthorized, retailers). To complete our exploratory analysis, we estimated univariate models for each of the variables of interest. The results of this analysis are provided in Tables A2 and A3 in the Technical Appendix. These univariate results are consistent with the findings uncovered in our MVI plots. We now turn to a series of multivariate models that allow us to jointly control for many different variables.
14 Specifically, half of all violations involve pricing up to 10.2% below MAP (see Table 2), and in this group, the positive relationship between distribution intensity and violation rates holds.

19
5. Data Analysis General Model Structure In our multivariate approach, we assume the following general model:
𝑦𝑟𝑠𝑚 = 𝛼 + 𝛽𝑚𝑚𝑎𝑝𝑠 + 𝛽𝑐𝑎𝑠𝑠𝑜𝑟𝑡𝑟 + 𝛽𝑑𝑑𝑖𝑠𝑡𝑠 + 𝛽𝑠𝑠ℎ𝑖𝑝𝑝𝑖𝑛𝑔𝑟𝑠𝑚 + 𝛽𝑎𝑎𝑢𝑡ℎ𝑜𝑟𝑖𝑧𝑒𝑑𝑟 + 𝜃𝑋𝑟𝑠𝑚 + 𝜖𝑟𝑠𝑚
where the dependent variable, 𝑦𝑟𝑠𝑚, is either the percent of violations or the depth of violations for SKU s, retailer r and market m. The independent variable 𝑚𝑎𝑝𝑠 is the MAP price for SKU s, 𝑎𝑠𝑠𝑜𝑟𝑡𝑟 is the assortment size of retailer r, 𝑑𝑖𝑠𝑡𝑠 is the distribution intensity for SKU s, 𝑠ℎ𝑖𝑝𝑝𝑖𝑛𝑔𝑟𝑠𝑚 indicates whether there is a shipping charge for SKU s and retailer r in market m, and 𝑎𝑢𝑡ℎ𝑜𝑟𝑖𝑧𝑒𝑑𝑟 indicates whether retailer r is an authorized dealer of the manufacturer. 𝑋𝑟𝑠𝑚 are control variables that include market indicators and a category indicator, and 𝜖𝑟𝑠𝑚 is the error term. We begin with an analysis of the violation rate and then turn to the depth of violation. Violation Rate For the violation rate, we estimate a series of models to demonstrate that our main results are robust. As the dependent variable, percent violations, ranges from 0 to 1, we estimate a linear probability model using OLS. We estimate three versions of the OLS model. First, we cluster standard errors by retailer but do not include retailer or product fixed effects in the model. Second, we include retailer fixed effects and third we include product fixed effects. In the latter models, we cluster the standard errors by the fixed effects. We also estimate this model in a logit framework, where we model the probability of a violation and treat the dependent measure as binary.15
More specifically, if the price is greater than or equal to MAP then y=0 and otherwise y=1. We estimate the same series of models that we did in the OLS model: no fixed effects, retailer fixed effects and product fixed effects. Note that when we include fixed effects in the logit model we lose some observations if there is no variation in the dependent measure when the dummy variable equals one. This explains why the sample size varies across logit models.
Table 6 presents our main results for percent of MAP violations for both OLS and logit models. We focus our discussion on the models that do not include retailer or product fixed effects. In the logit model, we find that distribution intensity is associated with a higher likelihood of MAP violation, which is consistent with Hypothesis 1A about monitoring. That is, when distribution is more intense, it is harder to monitor retailers’ compliance, and they are more likely to violate MAP. While we find statistically significant support for this result in our logit model, there is only directional support for this result in the OLS model. Using the logit results, we see that the likelihood to violate increases by 0.4% for every 10 additional retailers that carry the product. Overall, we conclude that there is weak empirical support for Hypothesis 1A.
15We replicate the analysis using Tobit and Probit in Table A4 of the Appendix.
20
We also find that authorized retailers are less likely to violate MAP, which is consistent with Hypothesis 2A. That is, authorization confers gains on a retailer, and Hypothesis 2A posits that the higher are such gains from compliance, the higher we expect MAP compliance to be. This result is robust to both the OLS and logit model specifications and is also large in magnitude. The MAP violation rate is 26% lower for authorized than for unauthorized retailers, which is the largest effect in our data. We find that higher assortment size is associated with fewer MAP violations, which is consistent with Hypothesis 3A. When the assortment size is larger, a retailer is more committed to the manufacturer and the brand by posting a bond and thus we expect higher compliance with MAP. Using the OLS results, we see that there is a 2% lower violation rate for every 10 additional products carried by the retailer. Recall from our data description that the median number of products offered is 41 (see Table 2) but this ranges from 1 to 163. So, if a retailer offers 51 products, we expect to see a 2% reduction in the MAP violation rate. Lastly, we find that retailers who charge for shipping tend to violate MAP more than those who do not charge for shipping, which is consistent with Hypothesis 4A. Recognizing that free shipping is a common practice, this finding is consistent with our hypothesis that retailers who violate MAP also tend to use price obfuscation to recoup lost margins. The effect size is relatively large as the MAP violation rate increases by as much as 12% among retailers who charge for shipping. We also find that lower MAP prices are associated with a higher violation rate. Initially, we included this simply as a control variable. However, if manufacturers enforce MAP pricing less forcefully on lower-priced items, then this result can be viewed cautiously as support for Hypothesis 1A concerning the effect of manufacturer monitoring on MAP violations. We also estimate models that account for retailer fixed effects and SKU fixed effects. When we include the retailer fixed effects, we lose the variables Assortment Size and Authorized Retailer as these do not vary within retailer. Shipping fees do vary within retailers since the shipping charge may be specific to an item. Importantly, we see that the Charge for Shipping variable remains positive and significant in the retailer fixed effects models for both OLS and logit specifications. Thus, our support for Hypothesis 4A is confirmed even when we account for systematic differences among retailers. In addition, the MAP price continues to be negative and significant, which is consistent with the previous results. In the SKU fixed effects models, we control for any systematic factors in violations within a SKU. When we estimate these models, we lose the MAP price and Distribution intensity variables as these do not vary within SKU. Reassuringly, the Assortment Size, Charge for Shipping and Authorized Retailer variables remain significant in the SKU fixed effects models. Again, this suggests that there is still support for Hypotheses 2A, 3A and 4A after controlling for systematic violations for each product. As a sensitivity analysis, we conduct our analysis using different threshold definitions of MAP violation. Specifically, we perform the analysis using definition of violations as starting at more than 1%, more

21
than 2.5%, and more than 5% below the MAP price. The rationale for this sensitivity analysis is that a manufacturer may only enforce large violations – a one cent violation of MAP may not be enforced, for example. The percent of violations varies across these definitions as was previously shown in Table 5. The results for the OLS regression are presented in Table 7 and overall are consistent with those in Table 6. Assortment size, charging for shipping and authorized retailer variables continue to be significant in each model. This demonstrates that our main findings are robust to alternative definitions of a MAP violation. Depth of Violations The results for depth of MAP violations are presented in Table 8. Recall that in these analyses we only consider observations where the observed price is less than the MAP price. We then measure the percentage depth of violation. Similar to the previous results, we estimate the OLS models with and without retailer fixed effects and SKU fixed effects. We fail to find support for Hypothesis 1B regarding the effect of distribution intensity on the depth of MAP violation. When the product is more intensely distributed then we observe a smaller depth of violation. This is opposite of what we predicted and the effect is statistically significant in the model without fixed effects. Empirically, we find that the depth of violations is 0.3% lower for every 10 additional retailers who sell the product. This effect disappears when we include retailer fixed effects in the model, which suggests that distribution intensity may systematically vary among retailers. In particular, some retailers may sell items with greater (lower) distribution intensity and have lower (higher) violation rates. One possible explanation for why the depth of violation is lower among these retailers is that they may face more price elastic demand. In other words, these retailers may sell more popular items for which customers are very price sensitive. If true, then small violations in MAP may be very effective and a retailer may not need to offer a large discount to attract consumers. Consistent with Hypothesis 2B we find that authorized retailers who violate MAP tend to have a smaller violation depth. The effect size of authorized retailers is large: authorized retailers have a 9% lower violation depth compared to unauthorized retailers. This result is consistent with prediction that a retailers price will account for possible punishments for violating MAP. We do not find support for Hypothesis 3B as Assortment Size is not statistically significant in Table 8. This suggests that larger retail assortments are not associated with systematically smaller violations of MAP. Finally, consistent with Hypothesis 4B, we find that retailers who tend to use price obfuscation also exhibit greater violation depth than those offering free shipping. The coefficient for Charge for Shipping is positive and significant in each of our models. When retailers charge for shipping, the depth of violation is 2.5% larger compared to retailers who offer free shipping. Again, we expect these type of retailer to recoup this lost product margin via their shipping fee.

22
MAP Expiration Another feature of MAP policies is that they are typically not permanent. In particular, it is common for new products to have a MAP policy that is later removed. We observe this type of variation in MAP policies in our data, which allows us to examine the differences between products that are closer to the expiration of their MAP policy versus products that are still subject to a MAP policy. Those that are close to the expiration of their MAP policy period are likely to be more mature products for which a MAP policy is not as effective or necessary. To perform this analysis, we split our data into two six month time periods and we restrict our analysis to products that are sold in both time periods. In the first time period, all of the products have a MAP price but in the second half of the data the MAP price is removed for 15 products. The final dataset contains 5,030 SKU x retailer x marketplace combinations, with 200 unique SKUs and 371 different retailers and focuses on MAP violations and depth of violation in the first six month period. In our analysis, we include an additional dummy variable to indicate the subset of products for which MAP expires in the second time period. We label this variable Expire. The other variables in our models are identical to those in our previous analyses (see Tables 6 and 8). Table 9 displays the results. The main finding from this analysis is that the effect of Expire is positive and significant in the percent violations model. Thus, the likelihood of violation increases when a MAP policy is set to expire in the near future. The effect of MAP expiration on the percentage of violations is large. Products for which MAP is expiring are 9% more likely to have violations than comparable products where MAP is not expiring. We do not see any impact of MAP expiration on the depth of violation. The increase in violation rates on products with expiring MAP is consistent with Hypothesis 2A. That is, when the MAP policy is expected to expire there may be lower expected loss from violating the MAP price. The expected losses could be lower due to the perceptions of less rigorous manufacturer enforcement of MAP. Further, the expected duration of any punishment may be shorter if the MAP policy is soon to expire. Both factors may contribute to greater violation rates on these items. 6. Conclusions Manufacturers have used vertical pricing policies for nearly one hundred years in the United States and their use is now widespread. In addition, there have been decades of theoretical research in this area. But, there has been virtually no systematic empirical analysis of vertical pricing policies. In this paper, we develop a series of testable predictions about retail compliance with MAP that is grounded in agency theory and consumer search theory. We test our predictions on a unique database that includes hundreds of products and hundreds of retailers. Overall, we find strong support for the notion that retailers respond to rewards for MAP compliance and punishments for violating MAP. In particular, we find that authorized retailers are much more compliant
23
with MAP; when they violate MAP the depth of violation is much smaller in magnitude than for unauthorized retailers. We interpret this as evidence that authorized retailers are attentive to the benefits (and losses) of MAP compliance (violation). In addition, we find that when a MAP policy is set to expire in the near future there is a substantial increase in violation rates. This suggests when the expected future punishments diminish, there is less compliance with MAP. We hypothesized that when a retailer carries a broad assortment of the manufacturer’s products then it effectively posts a bond. This creates an incentive to comply with MAP since a violation on a single product may jeopardize the entire product line. We find strong empirical support for this prediction. Our research also recognizes that finding the lowest price is costly for consumers. We hypothesized that retailers who violate MAP and offer very low prices may try to recoup some margin by charging a shipping fee. We find strong empirical support for this prediction. Retailers who charge for shipping are more likely to violate MAP and offer slightly larger discounts. We do not find support for what one may call the “leaky bucket” theory of distribution. That is, when products are in broad distribution and leak into the hands of many unauthorized retailers, then we might expect MAP violations to increase. The empirical support for this prediction is weak. Surprisingly, our analysis shows that non-authorized retailers are relatively compliant. One might expect these retailers to violate on 100% of their prices since they are not authorized outlets. But, our data reject this extreme behavior. What forces are causing these retailers to comply with MAP remains an open question. One speculation is that repeated violations of MAP may result in detection by the manufacturer. A manufacturer may then tighten the distribution channel so that the retailer does not receive unauthorized inventory. This implicit threat may put upward pressure on prices and reduce MAP violations. Future research is required to fully test this conjecture. We caution that the results in this paper should not be interpreted as causal metrics but rather as an in-depth description of the marketplace. For manufacturers, our findings can be cautiously used to help improve MAP compliance. In particular, two of the most important factors for MAP compliance are (i) retailer authorization and (ii) broad retail assortment. Manufacturers should be wary of unauthorized retailers who carry limited assortment. Presumably these retailers are less committed to the manufacturer and are also much more likely to violate MAP. Vertical pricing policies are important tool for manufacturers to coordinate their distribution channel. However, managers have had limited access to data that can help them understand the effectiveness of these policies. This research was spurred by the availability of extensive new data. We anticipate that this will become an important area of future research for academics, managers and policy makers.
24
REFERENCES Asker, John and Heski Bar-Isaac (working paper 2011), “Exclusionary Minimum Resale Price Maintenance”, NYU Stern. Bailey, Elizabeth M. and Gregory K. Leonard (2010), “Minimum Resale Price Maintenance: Some Empirical Evidence from Maryland”, The B.E. Journal of Economic Analysis & Policy, Vol. 10, No. 1 (Contributions), Article 17. Bergen, Mark, Shanranu Dutta and Orville C. Walker, Jr (1992), “Agency Relationship in Marketing: A Review of the Implications and Applications of Agency and Related Theories”, Journal of Marketing, Vol. 56, No. 3, pp. 1-24. Bolton, Patrick and Giacomo Bonanno (1988), “Vertical Restraints in a Model of Vertical Differentiation”, The Quarterly Journal of Economics, Vol. 103, No. 3, pp. 555-570. Cetinkaya, Volkan (2009), “Essays on Vertical Restraints and Vertical Integration”, An Economics PhD Dissertation submitted to the Graduate School-New Brunswick Rutgers, The State University of New Jersey. Charness, Gary and Kay-Yut Chen (2002), “Minimum Advertised-Price Policy Rules and Retailer Behavior: An Experiment by Hewlett-Packard”, Interfaces, Vol. 32, No. 5, Experimental Economics in Practice, pp. 62-73.
Comanor, William S. (1985), “Vertical Price-Fixing, Vertical Market Restrictions, and the New Antitrust Policy”, Harvard Law Review, Vol. 98, No. 5, pp. 983-1002. Deneckere, Raymond, Howard P. Marvel and James Peck (1996), “Demand Uncertainty, Inventories, and Resale Price Maintenance”, The Quarterly Journal of Economics, Vol. 111, No. 3, pp. 885-913. Deneckere, Raymond, Howard P. Marvel and James Peck (1997), “Demand Uncertainty and Price Maintenance: Markdowns as Destructive Competition”, The American Economic Review, Vol. 87, No. 4, pp. 619-641. Desai, Preyas, Anand Krishnamoorthy and Preethika Sainam (2010), ““Call for Prices”: Strategic Implications of Raising Consumers’ Costs”, Marketing Science, Vol 29, No. 1, 158-174. Ellison, Glenn and Sara F. Ellison (2009), “Search, Obfuscation, and Price Elasticities”, Econometrica, Vol. 77, No. 2, pp. 427-452. Gilligan Thomas W. (1986), “The Competitive Effects of Resale Price Maintenance”, The RAND Journal of Economics, Vol. 17, No. 4, pp. 544-556.

25
Gould, J. R. and E. Preston (1965), “The Resale Price Maintenance and Retail Outlets”, Economica, Vol. 32, No. 127, pp. 302-312. Heide, Jan B. and Anne S. Miner (1992), “The Shadow of the Future: Effects of Anticipated Interaction and Frequency of Contact on Buyer-Seller Cooperation”, The Academy of Management Journal, Vol. 35, No. 2, pp. 265-291. Henry, Brian R. and Eugene F. Zelek, Jr. (2003), “Establishing and Maintaining an Effective Minimum Resale Price Policy: A Colgate How-To”, Antitrust magazine, Summer, pp. 8-17. Hong, Han, and Matthew Shum (2006), “Using price distributions to estimate search costs”, RAND Journal of Economics, Vol. 37, No. 2, pp. 257–275. Ippolito, Pauline M. (1991), “Resale Price Policy: Empirical Evidence from Litigation”, Journal of Law and Economics, Vol. 34, No. 2, pp. 263-294. Jap, Sandy D. and Erin Anderson, “Safeguarding Interorganizational Performance and Continuity Under Ex Post Opportunism”, Management Science, Vol. 49, No. 12, pp. 1684-1701. Kali, Raja (1998), “Minimum Advertised Price”, Journal of Economics & Management Strategy, Vol. 7, pp. 647-668. Klein Benjamin and Kevin M. Murphy (1988), “Vertical Restraints as Contract Enforcement Mechanisms”, Journal of Law and Economics, Vol. 31, No. 2, pp. 265-297. Marvel, Howard P. and Stephen McCafferty (1984), “Resale Price Maintenance and Quality Certification”, The RAND Journal of Economics, Vol. 15, No. 3, pp. 346-359. Marvel, Howard P. and Stephen McCafferty (1985), “The Welfare Effects of Resale Price Maintenance”, Journal of Law and Economics, Vol. 28, No. 2, Antitrust and Economic Efficiency: A Conference Sponsored by the Hoover Institution, pp. 363-379. Mathewson, G. F. and Ralph A. Winter (1984), “An Economic Theory of Vertical Restraints”, The RAND Journal of Economics, Vol. 15, No. 1, pp. 27-38. Mehta, Nitin, Surendra Rajiv, and Kannan Srinivasan (2003), “Price Uncertainty and Consumer Search: A Structural Model of Consideration Set Formation”, Marketing Science, Vol. 22 No. 1, pp. 58–84. Milgrom, Paul and John Roberts (1992), “Economics, Organization and Management”, Prentice Hall. O’Brien, Daniel P. and Greg Shaffer (1992), “Vertical Control with Bilateral Contracts”, The RAND Journal of Economics, Vol. 23 (3, Autumn), pp. 299-308.

26
Pereira, Joseph (2008), “Discounters, Monitors Face Battle on Minimum Pricing”, Wall Street Journal (December 4) Perry, Martin K. and David Besanko (1991), “Resale Price Maintenance and Manufacturer Competition for Exclusive Dealerships”, The Journal of Industrial Economics, Vol. 39 (5, September), pp. 517-544. Rey, Patrick and Jean Tirole (1986), “The Logic of Vertical Restraints”, The American Economic Review, Vol. 76, No. 5, pp. 921-939.
Romano, Richard E. (1994), “Double Moral Hazard and Resale Price Maintenance”, The RAND Journal of Economics, Vol. 25 (3, Autumn), pp. 455-466. Sheffet, Mary Jane and Debra L. Scammon (1985), “Resale Price Maintenance: Is It Safe to Suggest Retail Prices?”, Journal of Marketing, Vol. 49, No. 4, pp. 82-91. Stahl, Dale O. II (1989), “Oligopolistic Pricing With Sequential Consumer Search”, American Economic Review, Vol. 79, No. 4, pp. 700–712. Stahl, Dale O. II (1996), “Oligopolistic Pricing With Sequential Consumer Search and Heterogeneous Search Costs”, International Journal of Industrial Organization, Vol. 14, No. 2, pp. 243–268. Stigler, George J. (1961), “The Economics of Information”, Journal of Political Economy, Vol. 69, No. 3, pp. 213–225. Stump, Rodney L., Jan B. Heide (1996), “Controlling supplier opportunism in industrial relations”, Journal of Marketing Research, Vol. 33, No. 4, pp. 431-441. Telser, Lester G. (1960), “Why Should Manufacturers Want Fair Trade?”, Journal of Law and Economics, Vol. 3 (October), pp. 86-105. Winter, Ralph A. (1993), “Vertical Control and Price Versus Nonprice Competition”, The Quarterly Journal of Economics, Vol. 108 (1, February), pp. 61-76. Yamey, B. S. (1952), “The Origins of Resale Price Maintenance: A Study of Three Branches of Retail Trade”, The Economic Journal, Vol. 62, No. 247, pp. 522-545. Zelek, Eugene F., Jr. (2002), “The Legal Framework for Pricing”, in Thomas T. Nagle and Reed K. Holden, The Strategy and Tactics of Pricing, 3rd edition, Prentice-Hall.

27
CHARTS CHART 1
Retailers Violation Rate The chart plots the distribution of violations for retailers as well as the corresponding number of products offered by the retailer, for the 960 retailers. % Retailers indicates what fraction of the retailers have the specific average violation rate, and #SKU sold by a retailer indicates what is the average number of SKUs sold by retailers with the specific violation rate. Average violation rate for retailer is the average violation rate of that retailer across all observations. For example, 20% of the retailers always comply (0% violation rate), and these retailers hold 3.3 SKUs on average. Panel A includes data using all retailers, Panel B includes only authorized retailers and Panel C includes only the unauthorized retailers.
PANEL A – All Retailers
0
5
10
15
20
25
30
35
40
45
0%
5%
10%
15%
20%
25%
30%
35%
40%
45%
# SKUs sold by a retailer
% Retailers
% Retailer Violation
% Retailers # SKUs
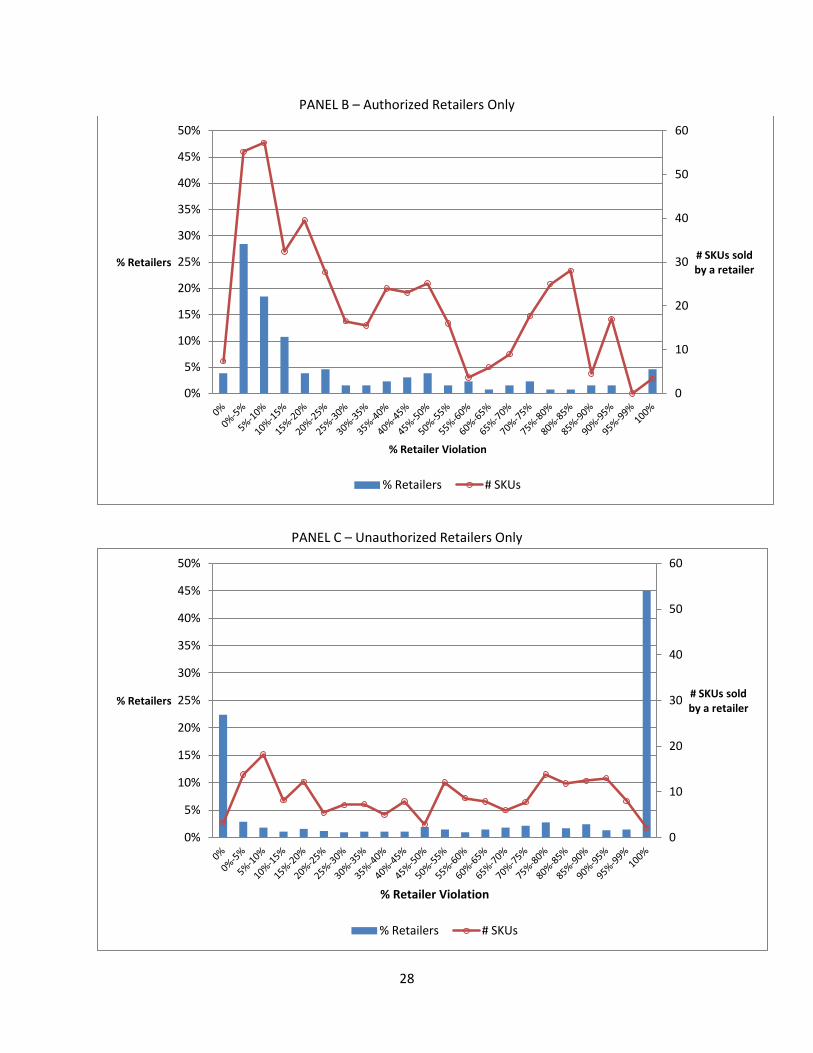
28
PANEL B – Authorized Retailers Only
PANEL C – Unauthorized Retailers Only
0
10
20
30
40
50
60
0%
5%
10%
15%
20%
25%
30%
35%
40%
45%
50%
# SKUs sold by a retailer
% Retailers
% Retailer Violation
% Retailers # SKUs
0
10
20
30
40
50
60
0%
5%
10%
15%
20%
25%
30%
35%
40%
45%
50%
# SKUs sold by a retailer
% Retailers
% Retailer Violation
% Retailers # SKUs

29
CHART 2 SKU Violation Rates
The chart plots the distribution of violations for SKUS as well as the corresponding number of retailers selling that SKU, for the 226 SKUs. % SKUs indicates what fraction of the SKUs has the specific violation rate, and #Retailers Selling SKU indicates what the average number of retailers that offer the SKU with the specific violation rate is. Average violation rate for SKU is the average violation rate for that SKU across all observations. For example, 4.4% of the SKUs have no violations (0% violation rate), and are offered by 5.5 retailer on average. Panel A includes data using all retailers, Panel B includes only authorized retailers and Panel C includes only the unauthorized retailers.
PANEL A – All Retailers
0
10
20
30
40
50
60
70
0.0%
2.0%
4.0%
6.0%
8.0%
10.0%
12.0%
14.0%
16.0%
18.0%
# Retailers selling SKU
% SKUs
% Violations for SKU
% SKUs # Retailers
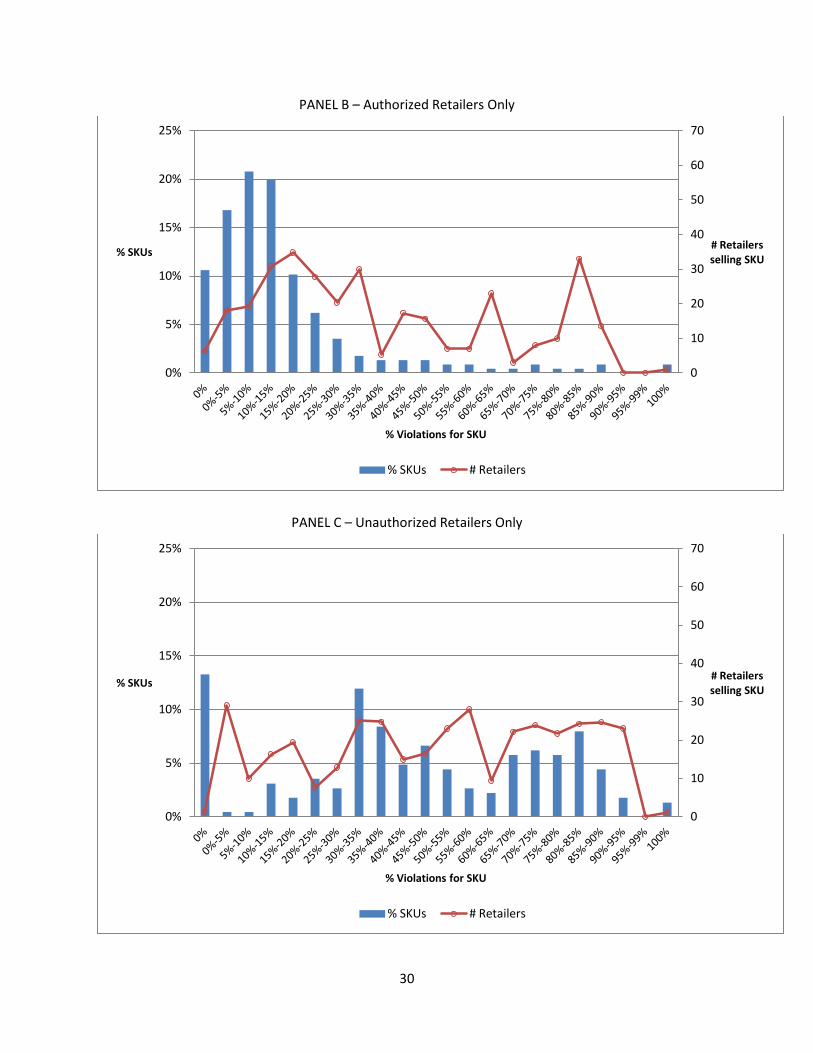
30
PANEL B – Authorized Retailers Only
PANEL C – Unauthorized Retailers Only
0
10
20
30
40
50
60
70
0%
5%
10%
15%
20%
25%
# Retailers selling SKU
% SKUs
% Violations for SKU
% SKUs # Retailers
0
10
20
30
40
50
60
70
0%
5%
10%
15%
20%
25%
# Retailers selling SKU
% SKUs
% Violations for SKU
% SKUs # Retailers

31
Chart 3 MAP Violation Index (MVI) Charts
The horizontal axis is “percent below MAP” and the vertical axis is “percent of violations.” Each point in the plot indicates what is the percent of violations if we assume that the manufacturer tolerates an up-to-X percent deviation below MAP without categorizing it as a violation. For example, in Panel A, zero is the actual percent of violations in the data (31.2%) and 1% deviation below MAP reduces the percent of observations categorized as violations to 25.5%. At a threshold of 50% deviation below MAP, only 1% of observations would be categorized as violating MAP.
Panel A - MVI for the entire Database
Panel B - MVI by Assortment size
0%
5%
10%
15%
20%
25%
30%
35%
0% 10% 20% 30% 40% 50% 60% 70% 80% 90% 100%
Perc
ent o
f Vio
lati
ons
Percent Below MAP
0%
5%
10%
15%
20%
25%
30%
35%
40%
45%
50%
0% 10% 20% 30% 40% 50% 60% 70% 80% 90% 100%
Perc
ent o
f Vio
lati
ons
Percent Below MAP
#SKUs Sold by Retailer <= 41 #SKUs Sold by Retailer > 41
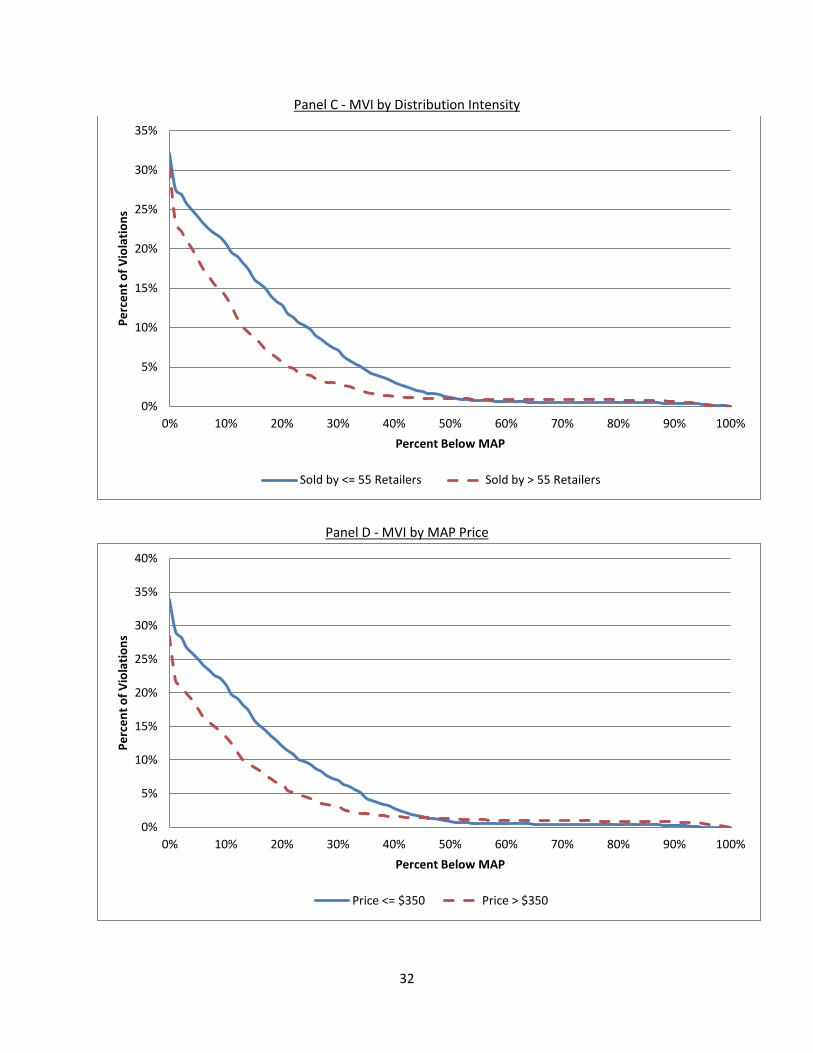
32
Panel C - MVI by Distribution Intensity
Panel D - MVI by MAP Price
0%
5%
10%
15%
20%
25%
30%
35%
0% 10% 20% 30% 40% 50% 60% 70% 80% 90% 100%
Perc
ent o
f Vio
lati
ons
Percent Below MAP
Sold by <= 55 Retailers Sold by > 55 Retailers
0%
5%
10%
15%
20%
25%
30%
35%
40%
0% 10% 20% 30% 40% 50% 60% 70% 80% 90% 100%
Perc
ent o
f Vio
lati
ons
Percent Below MAP
Price <= $350 Price > $350

33
Panel E - MVI by Market
Panel F - MVI by Category
0%
5%
10%
15%
20%
25%
30%
35%
40%
45%
50%
0% 10% 20% 30% 40% 50% 60% 70% 80% 90% 100%
Perc
ent o
f Vio
lati
ons
Percent Below MAP
eBay Amazon.com Own Website
0%
5%
10%
15%
20%
25%
30%
35%
40%
45%
50%
0% 10% 20% 30% 40% 50% 60% 70% 80% 90% 100%
Perc
ent o
f Vio
lati
ons
Percent Below MAP
Electronics Category Other Category

34
Panel G - MVI by Authorized
Panel H - MVI by Shipping
0%
10%
20%
30%
40%
50%
60%
0% 10% 20% 30% 40% 50% 60% 70% 80% 90% 100%
Perc
ent o
f Vio
lati
ons
Percent Below MAP
Authorized Unauthorized
0%
10%
20%
30%
40%
50%
60%
0% 10% 20% 30% 40% 50% 60% 70% 80% 90% 100%
Perc
ent o
f Vio
lati
ons
Percent Below MAP
Free Shipping Charge for Shipping

35
TABLES TABLE 1
Variable Definitions
Each observation in the raw database describes a quote of a price for a certain product by a certain retailer, and has the following variables:
Variable Name Description MAP Manufacturer-set MAP price for the certain product SKU SKU identifier of the product Retailer name Name of the retailer selling the product Price Price the product is sold for by the retailer Condition Product condition - New/Used/Refurbished/etc Price available A TRUE/FALSE dummy indicating whether the price is available as is on the
website (TRUE) or the user has to actively ask for the price by adding it to cart for example (FALSE)
Marketplace Website where the product is sold – retailers own website / Amazon marketplace / eBay, etc
Shipping rate Shipping rate for the product Authorized A TRUE/FALSE dummy indicating whether the retailer is an authorized
distributer of the product Web link web link where the specific quote for the product and retailer was found Date and time Time of the quote
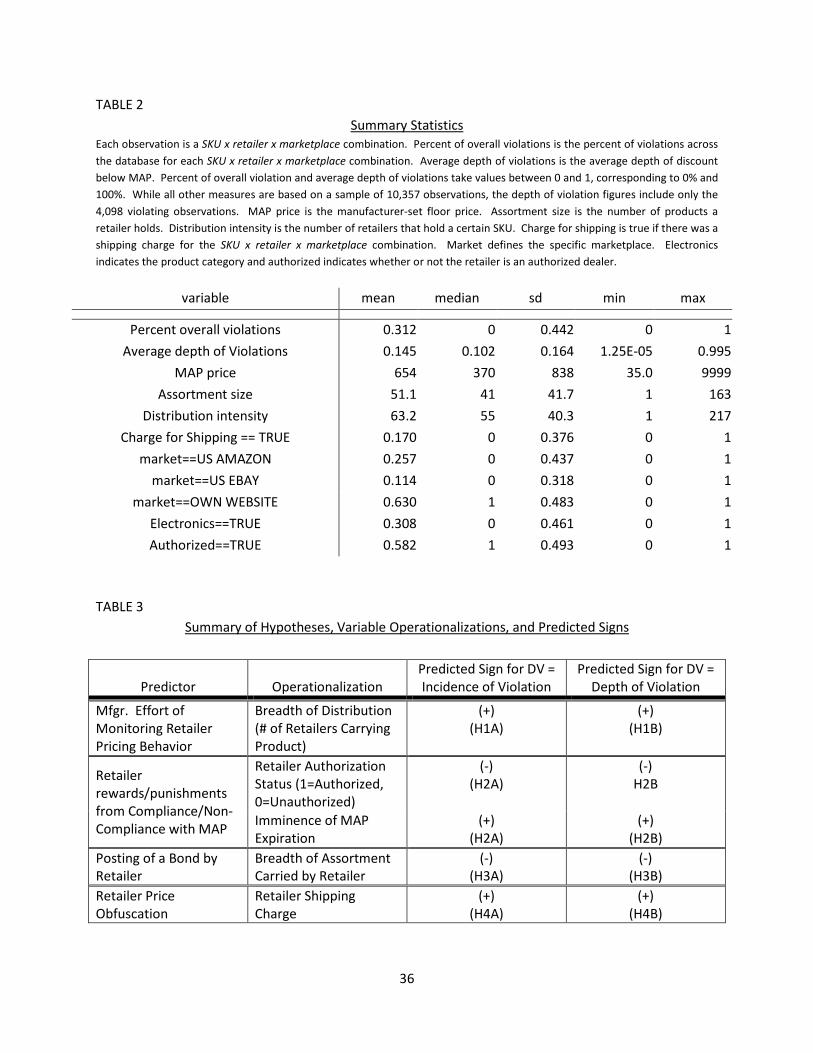
36
TABLE 2 Summary Statistics
Each observation is a SKU x retailer x marketplace combination. Percent of overall violations is the percent of violations across the database for each SKU x retailer x marketplace combination. Average depth of violations is the average depth of discount below MAP. Percent of overall violation and average depth of violations take values between 0 and 1, corresponding to 0% and 100%. While all other measures are based on a sample of 10,357 observations, the depth of violation figures include only the 4,098 violating observations. MAP price is the manufacturer-set floor price. Assortment size is the number of products a retailer holds. Distribution intensity is the number of retailers that hold a certain SKU. Charge for shipping is true if there was a shipping charge for the SKU x retailer x marketplace combination. Market defines the specific marketplace. Electronics indicates the product category and authorized indicates whether or not the retailer is an authorized dealer.
variable mean median sd min max
Percent overall violations 0.312 0 0.442 0 1
Average depth of Violations 0.145 0.102 0.164 1.25E-05 0.995
MAP price 654 370 838 35.0 9999
Assortment size 51.1 41 41.7 1 163
Distribution intensity 63.2 55 40.3 1 217
Charge for Shipping == TRUE 0.170 0 0.376 0 1
market==US AMAZON 0.257 0 0.437 0 1
market==US EBAY 0.114 0 0.318 0 1
market==OWN WEBSITE 0.630 1 0.483 0 1
Electronics==TRUE 0.308 0 0.461 0 1
Authorized==TRUE 0.582 1 0.493 0 1 TABLE 3
Summary of Hypotheses, Variable Operationalizations, and Predicted Signs
Predictor Operationalization Predicted Sign for DV = Incidence of Violation
Predicted Sign for DV = Depth of Violation
Mfgr. Effort of Monitoring Retailer Pricing Behavior
Breadth of Distribution (# of Retailers Carrying Product)
(+) (H1A)
(+) (H1B)
Retailer rewards/punishments from Compliance/Non-Compliance with MAP
Retailer Authorization Status (1=Authorized, 0=Unauthorized)
(-) (H2A)
(-) H2B
Imminence of MAP Expiration
(+) (H2A)
(+) (H2B)
Posting of a Bond by Retailer
Breadth of Assortment Carried by Retailer
(-) (H3A)
(-) (H3B)
Retailer Price Obfuscation
Retailer Shipping Charge
(+) (H4A)
(+) (H4B)

37
TABLE 4 Average Violations and Depth of Violations with respect to Dummy Variables
Percent of overall violations is the percent of violations across the database for each SKU x retailer x marketplace combination. Average depth of violations is the average depth of discount below MAP. t-stats correspond to a t-test of equality of means across each of the two groups.
Dependent Variable Variable Yes No t-stat16
% of Violations
Free Shipping? 27.2% 50.8% -19.1
Electronics Product? 44.4% 25.3% -19.6
Authorized Retailer? 14.7% 54.0% 46.5
Depth of Violations Free Shipping? 13.5% 17.3% -6.89
Electronics Product? 20.4% 10.4% -20.9
Authorized Retailer? 9.08% 17.9% 19.2
TABLE 5
Summary Statistics – Different Definitions of Violations Each observation is a SKU x retailer x marketplace combination. Percent of violations is the percent of violations across the database for each SKU x retailer x marketplace combination. Violation at x% below MAP is defined as a case where the advertised online price is lower than x% below MAP. As a comparison, statistics for violations at 0% below MAP are displayed again.
variable mean median sd min max
% violations at 0% below MAP 0.312 0 0.442 0 1
% violations at 1% below MAP 0.255 0 0.420 0 1
% violations at 2.5% below MAP 0.239 0 0.410 0 1
% violations at 5% below MAP 0.213 0 0.393 0 1
16 All p-values < 10-5

38
TABLE 6 Violation Rate - Multivariate Results
The dependent variable is the average percent of violations at 0% deviation below MAP for the OLS model and an indicator whether or not there are violations for the SKU x retailer x marketplace combination. The model is: 𝑦𝑠𝑟𝑚 = 𝛼 +𝛽𝑚𝑚𝑎𝑝𝑠 + 𝛽𝑐𝑐𝑜𝑚𝑚𝑖𝑡𝑟 + 𝛽𝑑𝑑𝑖𝑠𝑡𝑠 + 𝛽𝑠𝑠ℎ𝑖𝑝𝑝𝑖𝑛𝑔𝑠𝑟𝑚 + 𝛽𝑎𝑎𝑢𝑡ℎ𝑜𝑟𝑖𝑧𝑒𝑑𝑟 + 𝜃𝑋𝑠𝑟𝑚 + 𝜖𝑠𝑟𝑚. Where: The dependent variable is either the percent of violations (OLS) or an indicator of violations (Logit) for SKU s, retailer r and market m. Regarding the independent variables, maps is the map price for SKU s, commitr is the assortment size of retailer r, dists is distribution intensity for SKU s, shippingsrm indicates whether there is a shipping charge for SKU s and retailer r in market m, authorizedr indicates whether retailer r is an authorized dealer of the manufacturer. Xsrm are control variables that include market indicators and a category indicator, srm is the standard unobserved economic error term. The errors are clustered by retailer in the models without fixed effects, and by the fixed effect variable in the fixed effect model.
OLS LOGIT
CLUSTER BY RETAILER RETAILER FE SKU FE
CLUSTER BY RETAILER RETAILER FE SKU FE
Map price -1.6E-05** -1.55E-05***
-0.0002*** -0.0002***
(6.58e-06) (5.58e-06)
(4.39E-05) (4.19E-05) Assortment size -0.002***
-0.002*** -0.009***
-0.009***
(0.0004)
(0.0002) (0.003)
(0.001)
Distribution intensity 0.0002 6.33E-05
0.002** 0.002*
(0.0002) (0.0002)
(0.001) (0.001) Charge for Shipping == TRUE 0.123*** 0.091*** 0.110*** 0.562*** 0.708*** 0.536***
(0.029) (0.022) (0.013) (0.155) (0.102) (0.065)
market==US AMAZON -0.03 -0.025 -0.020* -0.14 -0.231** -0.126**
(0.025) (0.015) (0.011) (0.173) (0.095) (0.059)
market==US EBAY 0.043 -0.008 0.050*** 0.059 -0.364** 0.104
(0.034) (0.024) (0.018) (0.170) (0.163) (0.074)
Electronics==TRUE 0.131*** 0.101***
0.626*** 0.630***
(0.027) (0.022)
(0.128) (0.095) Authorized==TRUE -0.264***
-0.245*** -0.716***
-0.690***
(0.047)
(0.018) (0.225)
(0.058)
Constant 0.483*** 0.279*** 0.517*** 0.109
(0.038) (0.016) (0.012) (0.186) R-squared 0.24 0.604 0.33
N. of cases 10357 10357 10357 10357 8630 10297
RMSE 0.385 0.292 0.366 LL -4810 -1428 -4158 -6186 -3513 -5292
* p<0.10, ** p<0.05, *** p<0.01

39
TABLE 7 Violation Rate Sensitivity Analysis - Multivariate Results
The dependent variable is the average percent of violations at X% deviation below MAP. The model is: ysrm = α +βmmaps + βccommitr + βddists + βsshippingsrm + βaauthorizedr + θXsrm + srm. Where: The dependent variable is the
percent of violations at X% below MAP for SKU s, retailer r and market m. Violation at x% below MAP is defined as a case where the advertised online price is lower than x% below MAP. Regarding the independent variables, maps is the map price for SKU s, commitr is the assortment size of retailer r, dists is distribution intensity for SKU s, shippingsrm indicates whether there is a shipping charge for SKU s and retailer r in market m, authorizedr indicates whether retailer r is an authorized dealer of the manufacturer. Xsrm are control variables that include market indicators and a category indicator, srm is the standard unobserved economic error term. The errors are clustered by retailer.
OLS 0% OLS 1% OLS 2.5% OLS 5%
Map price -1.6E-05** -1.61E-05** -1.54E-05*** -1.36E-05**
(6.58e-06) (6.34e-06) (5.78e-06) (5.66e-06)
Assortment size -0.002*** -0.001** -0.001*** -0.001***
(0.0004) (0.0004) (0.0003) (0.0003)
Distribution intensity 0.0002 3.29E-05 3.08E-05 8.80E-05
(0.0002) (0.0001) (0.0001) (0.0001)
Charge for Shipping == TRUE 0.123*** 0.132*** 0.136*** 0.129***
(0.029) (0.029) (0.028) (0.027)
market==US AMAZON -0.03 -0.036 -0.028 -0.026
(0.025) (0.024) (0.023) (0.021)
market==US EBAY 0.043 0.035 0.047 0.057*
(0.034) (0.033) (0.032) (0.031)
Electronics==TRUE 0.131*** 0.165*** 0.179*** 0.201***
(0.027) (0.026) (0.025) (0.025)
Authorized==TRUE -0.264*** -0.306*** -0.260*** -0.228***
(0.047) (0.045) (0.040) (0.036)
Constant 0.483*** 0.416*** 0.372*** 0.309***
(0.038) (0.036) (0.032) (0.029)
R-squared 0.24 0.274 0.26 0.25
N. of cases 10357 10357 10357 10357
RMSE 0.385 0.358 0.353 0.341
LL -4810 -4057 -3903 -3540
* p<0.10, ** p<0.05, *** p<0.01
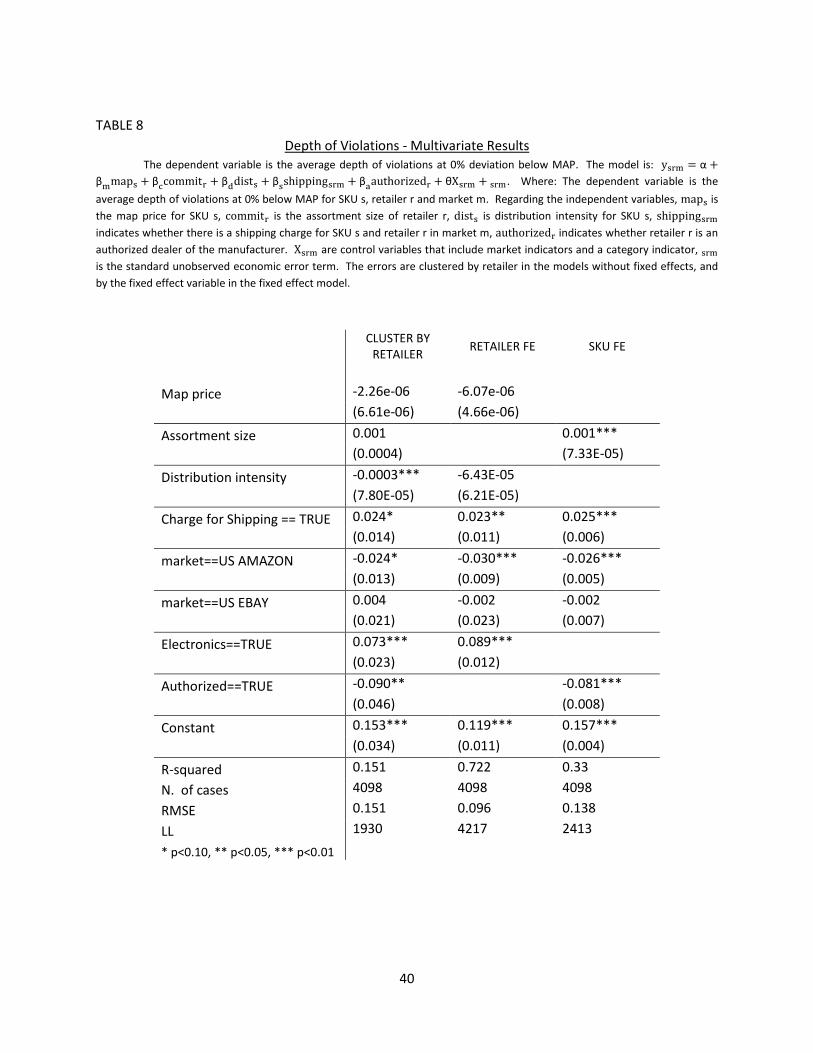
40
TABLE 8
Depth of Violations - Multivariate Results The dependent variable is the average depth of violations at 0% deviation below MAP. The model is: ysrm = α +
βmmaps + βccommitr + βddists + βsshippingsrm + βaauthorizedr + θXsrm + srm. Where: The dependent variable is the
average depth of violations at 0% below MAP for SKU s, retailer r and market m. Regarding the independent variables, maps is the map price for SKU s, commitr is the assortment size of retailer r, dists is distribution intensity for SKU s, shippingsrm indicates whether there is a shipping charge for SKU s and retailer r in market m, authorizedr indicates whether retailer r is an authorized dealer of the manufacturer. Xsrm are control variables that include market indicators and a category indicator, srm is the standard unobserved economic error term. The errors are clustered by retailer in the models without fixed effects, and by the fixed effect variable in the fixed effect model.
CLUSTER BY RETAILER
RETAILER FE SKU FE
Map price -2.26e-06 -6.07e-06
(6.61e-06) (4.66e-06)
Assortment size 0.001 0.001***
(0.0004) (7.33E-05)
Distribution intensity -0.0003*** -6.43E-05
(7.80E-05) (6.21E-05)
Charge for Shipping == TRUE 0.024* 0.023** 0.025***
(0.014) (0.011) (0.006)
market==US AMAZON -0.024* -0.030*** -0.026***
(0.013) (0.009) (0.005)
market==US EBAY 0.004 -0.002 -0.002
(0.021) (0.023) (0.007)
Electronics==TRUE 0.073*** 0.089***
(0.023) (0.012)
Authorized==TRUE -0.090** -0.081***
(0.046) (0.008)
Constant 0.153*** 0.119*** 0.157***
(0.034) (0.011) (0.004)
R-squared 0.151 0.722 0.33
N. of cases 4098 4098 4098
RMSE 0.151 0.096 0.138
LL 1930 4217 2413
* p<0.10, ** p<0.05, *** p<0.01
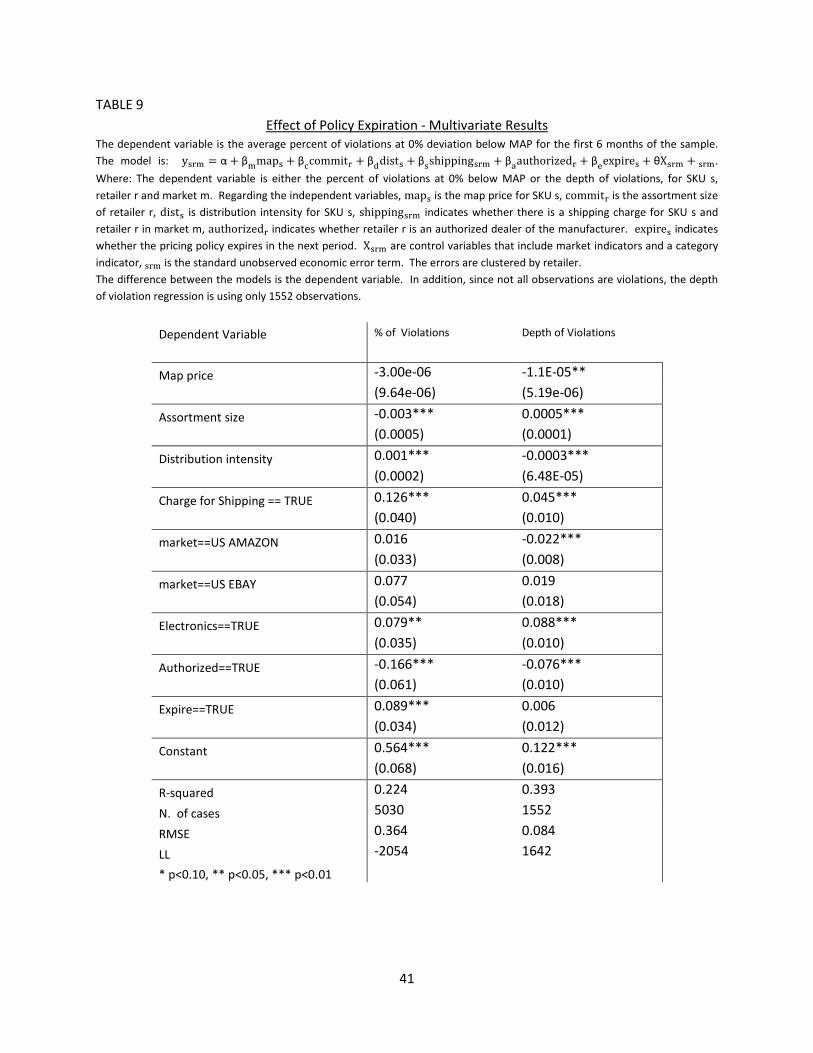
41
TABLE 9 Effect of Policy Expiration - Multivariate Results
The dependent variable is the average percent of violations at 0% deviation below MAP for the first 6 months of the sample. The model is: ysrm = α + βmmaps + βccommitr + βddists + βsshippingsrm + βaauthorizedr + βeexpires + θXsrm + srm.
Where: The dependent variable is either the percent of violations at 0% below MAP or the depth of violations, for SKU s, retailer r and market m. Regarding the independent variables, maps is the map price for SKU s, commitr is the assortment size of retailer r, dists is distribution intensity for SKU s, shippingsrm indicates whether there is a shipping charge for SKU s and retailer r in market m, authorizedr indicates whether retailer r is an authorized dealer of the manufacturer. expires indicates whether the pricing policy expires in the next period. Xsrm are control variables that include market indicators and a category indicator, srm is the standard unobserved economic error term. The errors are clustered by retailer. The difference between the models is the dependent variable. In addition, since not all observations are violations, the depth of violation regression is using only 1552 observations.
Dependent Variable % of Violations Depth of Violations
Map price -3.00e-06 -1.1E-05**
(9.64e-06) (5.19e-06)
Assortment size -0.003*** 0.0005***
(0.0005) (0.0001)
Distribution intensity 0.001*** -0.0003***
(0.0002) (6.48E-05)
Charge for Shipping == TRUE 0.126*** 0.045***
(0.040) (0.010)
market==US AMAZON 0.016 -0.022***
(0.033) (0.008)
market==US EBAY 0.077 0.019
(0.054) (0.018)
Electronics==TRUE 0.079** 0.088***
(0.035) (0.010)
Authorized==TRUE -0.166*** -0.076***
(0.061) (0.010)
Expire==TRUE 0.089*** 0.006
(0.034) (0.012)
Constant 0.564*** 0.122***
(0.068) (0.016)
R-squared 0.224 0.393
N. of cases 5030 1552
RMSE 0.364 0.084
LL -2054 1642
* p<0.10, ** p<0.05, *** p<0.01
Related Documents