Determinants of Improved Maize Seed and Fertilizer use In Kenya: Policy Implications James O Ouma a , Hugo De Groote b & George Owuor c a Kenya Agricultural Research Institute, Embu P.O.Box 27, Embu, Kenya b International maize and Wheat improvement Centre (CIMMYT), Nairobi, Kenya c Egerton University, Njoro, Kenya Contributed paper prepared for presentation at the International Association of Agricultural Economists Conference, Gold Coast, Australia, August 12-18, 2006 Copyright© 2006 by James O Ouma, Hugo De Groote & George Owuor. All rights reserved. Readers may make verbatim copies of this document for non-commercial purposes by any means, provided that this copyright notice appears on all such copies 1

Welcome message from author
This document is posted to help you gain knowledge. Please leave a comment to let me know what you think about it! Share it to your friends and learn new things together.
Transcript
Determinants of Improved Maize Seed and Fertilizer use In Kenya: Policy Implications
James O Oumaa, Hugo De Grooteb & George Owuorc
aKenya Agricultural Research Institute, Embu P.O.Box 27, Embu, Kenya bInternational maize and Wheat improvement Centre (CIMMYT), Nairobi, Kenya
cEgerton University, Njoro, Kenya
Contributed paper prepared for presentation at the International Association of Agricultural Economists Conference, Gold Coast, Australia,
August 12-18, 2006
Copyright© 2006 by James O Ouma, Hugo De Groote & George Owuor. All rights reserved. Readers may make verbatim copies of this document for non-commercial
purposes by any means, provided that this copyright notice appears on all such copies
1
Determinants of Improved Maize Seed and Fertilizer use In Kenya: Policy Implications
James O Ouma, Hugo De Groote1 & George Owuor2
Kenya Agricultural Research Institute, Embu P.O.Box 27, Embu, Kenya [email protected]
Abstract
Maize is a key food crop in Kenya. While maize yields increased from 1.25 t ha-1 in early
1960s to over 2 tonnes in 1982, they fell below 1.5 t ha-1 in 2000. Given the limited land
area, there is no doubt that Kenya will have to rely more on modern technologies for
increased yields .Use of improved maize varieties and fertilizers will therefore continue
to be critical inputs for improving productivity. To improve production, it is important to
understand factors determining adoption and intensity of use of modern technologies. A
stratified 2-stage sampling design was used to select 1800 households, subsequently
interviewed by means of structured questionnaire. Econometric models were used to
explore factors influencing adoption and intensity of use of the improved varieties and
fertilizer. Access to credit was positively related to adoption and intensity of use of the
two inputs. Extension contacts positively influenced the likelihood of adoption of
improved maize seed, while amount of planting fertilizer used positively influenced both
the adoption and intensity of use of improved varieties. Distance to market negatively
determined the adoption and intensity of use of fertilizer. In addition gender and access to
hired labour had negative impacts on the intensity of use of fertilizer. There is need to
think of alternative sources of credit to farmers and also revamp the existing extension
service (including privatization in the long term) for efficient delivery of information.
Key words: Maize, adoption, improved seed, fertilizer, credit, extension, Kenya.
1 International maize and wheat improvement centre (CIMMTY), Nairobi, Kenya 2 Egerton University, Njoro, Kenya
2
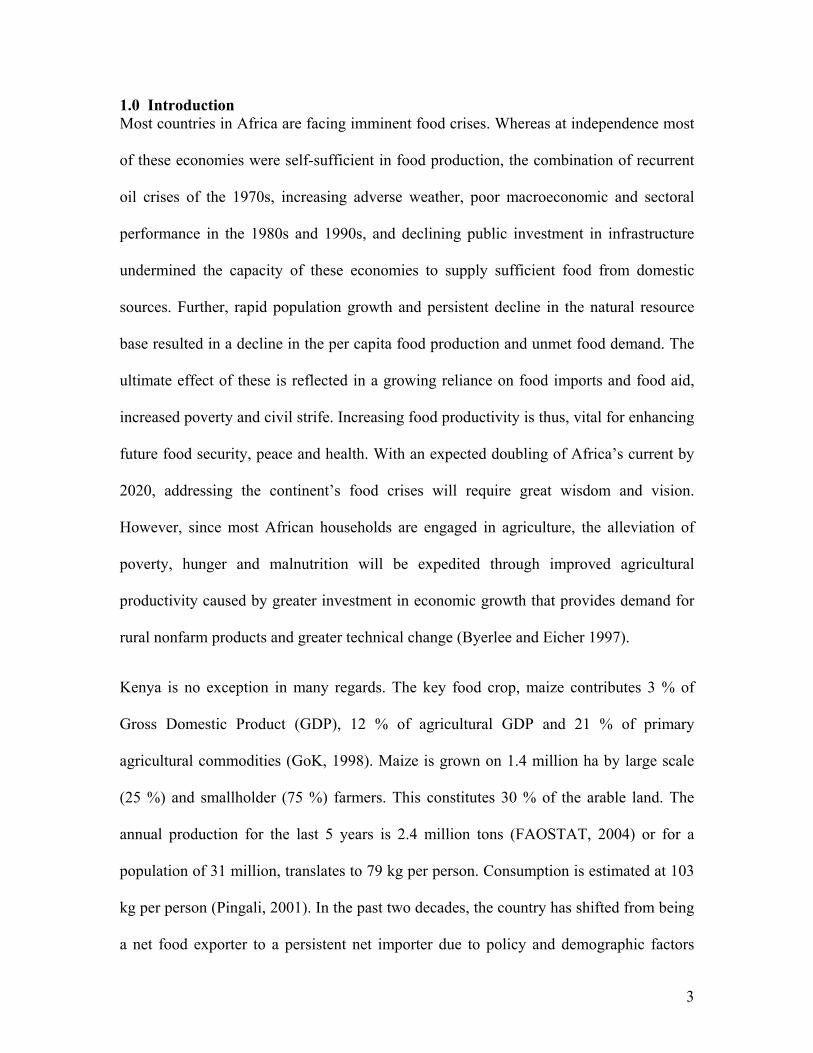
1.0 Introduction Most countries in Africa are facing imminent food crises. Whereas at independence most
of these economies were self-sufficient in food production, the combination of recurrent
oil crises of the 1970s, increasing adverse weather, poor macroeconomic and sectoral
performance in the 1980s and 1990s, and declining public investment in infrastructure
undermined the capacity of these economies to supply sufficient food from domestic
sources. Further, rapid population growth and persistent decline in the natural resource
base resulted in a decline in the per capita food production and unmet food demand. The
ultimate effect of these is reflected in a growing reliance on food imports and food aid,
increased poverty and civil strife. Increasing food productivity is thus, vital for enhancing
future food security, peace and health. With an expected doubling of Africa’s current by
2020, addressing the continent’s food crises will require great wisdom and vision.
However, since most African households are engaged in agriculture, the alleviation of
poverty, hunger and malnutrition will be expedited through improved agricultural
productivity caused by greater investment in economic growth that provides demand for
rural nonfarm products and greater technical change (Byerlee and Eicher 1997).
Kenya is no exception in many regards. The key food crop, maize contributes 3 % of
Gross Domestic Product (GDP), 12 % of agricultural GDP and 21 % of primary
agricultural commodities (GoK, 1998). Maize is grown on 1.4 million ha by large scale
(25 %) and smallholder (75 %) farmers. This constitutes 30 % of the arable land. The
annual production for the last 5 years is 2.4 million tons (FAOSTAT, 2004) or for a
population of 31 million, translates to 79 kg per person. Consumption is estimated at 103
kg per person (Pingali, 2001). In the past two decades, the country has shifted from being
a net food exporter to a persistent net importer due to policy and demographic factors
3
mentioned above. Domestic maize demand outstrips domestic production in six out of ten
years, leading to increasing reliance on imports to bridge the gap. This is in spite of the
successful maize research and extension program in the early 1960s and 1970s, through
the introduction of maize hybrids and related technologies, popularly referred to as
“Kenya’s Green Revolution’ (Karanja 1996).
That Kenya must increase its farm productivity and income is no longer debatable but is a
great necessity. While maize yields increased from 1.5 t ha-1 in early 1960s to over 2 tons
in 1982, they fell below 1.5 t ha-1 in 2000. The increase of maize yields witnessed in the
1960s and 1970s was associated with development and release of new varieties combined
with extensive agronomic trials, appropriate fertilizer and recommendation. The new
varieties spread fast and yields increased accordingly. Production also increased through
area expansion. Given the limited arable land area and low irrigation development
capacity, there is no doubt that Kenya will rely relatively more on use of modern
technologies than area expansion for future increases in maize production. Use of
improved maize seed and inorganic fertilizer will continue to be key inputs in enhancing
gains in maize yield. Analysis of farm level surveys between 1992 and 2002 indicates
slight increases in use of improved maize varieties and fertilizer but substantial decrease
in intensity of use of fertilizer (De Groote, et al, 2005). To improve maize productivity
and food security, it is critical to understand factors limiting use of improved maize
varieties and fertilizer.
Technology adoption decisions in developing countries have been extensively analyzed
(Feder et al., 1985., Rauniyar and Goode, 1992). Complementing the large amount of
theoretical work that focuses adoption in general, numerous empirical case studies
4
provide a wealth of information about the factors affecting farm-level decision to adopt
hybrid maize and fertilizer (e.g. CIMMYT, 1992., Byerlee et al., 1993., Smale et al.,
1991, Kumar, 1994., Heisey et al., 1998). The common theme emerging from this
literature is that the decision to adopt hybrid maize and fertilizer is influenced by a
complex and highly variable set of factors. Depending on the context, these can include
demographic characteristics of the household (e.g., size, age and gender composition,
wealth, education level of the household head), the expected profitability and/or
perceived risk of the technology, farmers’ consumption preferences, and the availability
and cost of inputs, especially seed.
In Kenya, for instance, several adoption studies (see for example Salasya et al., 1998;
Makokha et al., 2001; Ouma et al., 2001; Wekesa et al., 2002) explored factors affecting
adoption and intensity of use of improved maize varieties and fertilzer. Although these
studies provide useful insights on key factors affecting adoption and intensity of use of
improved maize varieties and fertilizer,, the micro studies fall short of addressing
important research and policy questions adequately due to the limitation in geographical
coverage and hence the inability to exploit the diverse variation in socioeconomic and
agroecological factors (Doss 2003). This paper is therefore based on baseline survey data
collected in 2002 across diverse maize growing zones in Kenya. The survey was
implemented under Insect Resistant Maize for Africa project (IRMA). The results derived
are important in addressing key research and policy question in maize production.
Improved maize varieties and fertilizers are considered. There are of course, other
technologies, including alternative soil fertility enhancing technologies such as use of
5
manure, rotation & intercropping with legumes but these technologies are hard to
quantify.
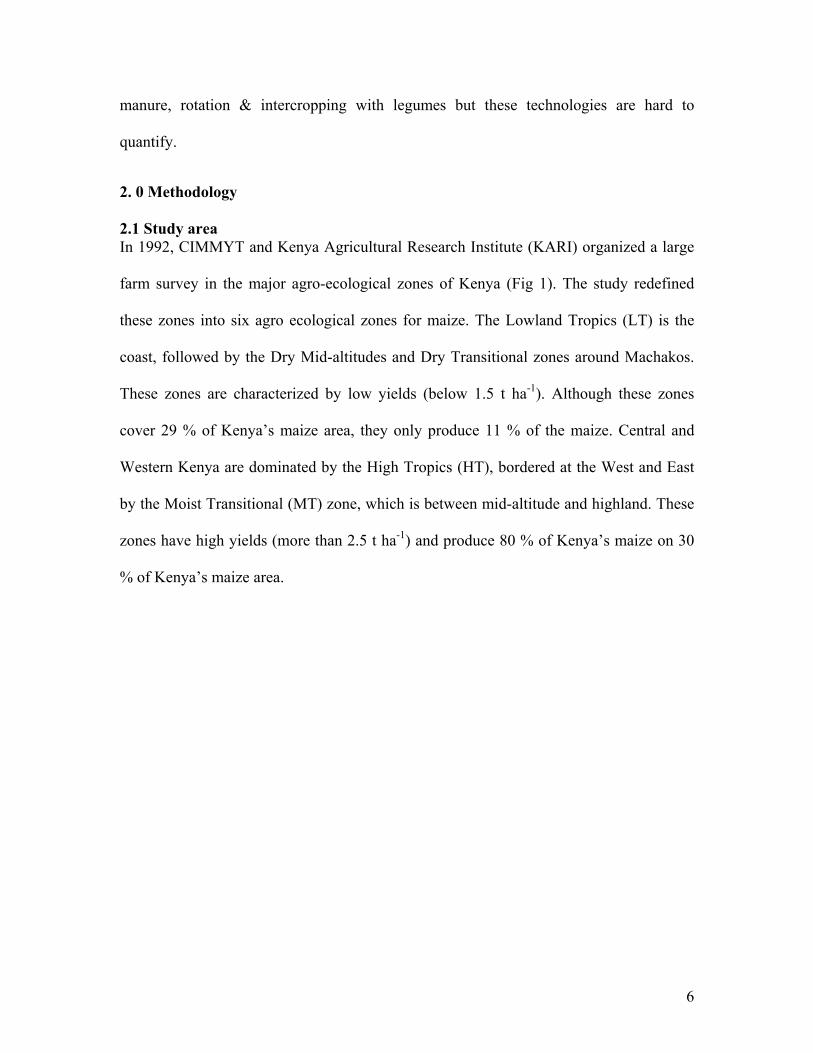
2. 0 Methodology 2.1 Study area In 1992, CIMMYT and Kenya Agricultural Research Institute (KARI) organized a large
farm survey in the major agro-ecological zones of Kenya (Fig 1). The study redefined
these zones into six agro ecological zones for maize. The Lowland Tropics (LT) is the
coast, followed by the Dry Mid-altitudes and Dry Transitional zones around Machakos.
These zones are characterized by low yields (below 1.5 t ha-1). Although these zones
cover 29 % of Kenya’s maize area, they only produce 11 % of the maize. Central and
Western Kenya are dominated by the High Tropics (HT), bordered at the West and East
by the Moist Transitional (MT) zone, which is between mid-altitude and highland. These
zones have high yields (more than 2.5 t ha-1) and produce 80 % of Kenya’s maize on 30
% of Kenya’s maize area.
6
##SS#S
#
#
S
S#
#
S
S
##
#
##SS
S
SS
#
#
S
S
## ##
SS SS
#S
#
#
S
S
##
SS
###SSS
##
#
SS
S
####SSSS
#
##
#
#S
SS
S
S
#
#
# S
S
S
#S
##
### S
S
SSS
##
# ##
#
SS
S SS
S
#
#
#
##
S
S
S
SS
#
##
S
SS
#
#
# S
S
S
###SSS
# ##
##
#
#S SS
SS
S
S
##
#
#
SS
S
S
#
#
#
## #
S
S
S
SS S
######
SSSSSS
##SS
####SSSS
#
#
#
##
###
S
S
S
SS
SSS
#
#
S
S
#
#
# #
#
#
S
S
S S
S
S
##
#
#
#
SS
S
S
S
#S
##S
S
#
#
##S
S
SS
#S
# #
#
S S
S
##
SS
#S
#
#
#S
S
S
#
#
#
S
S
S
##SS
###SSS
## SS
###
SSS
###SSS
## #
#
#
SS S
S
S
##SS
##
##
#SS
SS
S
##
#
##
##
###SS
S
SS
SS
SSS
# #S S
#S
#S
##
#
#SS
S
S
#
#
#S
S
S
#S
##
#
SS
S
# ##
S SS
#S
#
#
#
#
# S
S
S
S
S
###S
SS
##
#
SS
S
###
SSS
# #
#
S S
S
##
#
#
SS
S
S##
#
SS
S
##
SS
###
SSS
#S
##SS
##
SS
#
#
#S
S
S
#S
#S#S
##SS
## ##
##SS S
S
SS
#
##
#S
SS
S
##SS
#S
#S
## SS
###
SSS
##
###
#
#
#
SS
SSS
S
S
S
##
#SS
S
##SS
##
#SS
S
##
SS
#S
#
##
S
SS
##
#S
S
S #
#
S
S
#
# #
#
##
#
##
##
##
S
S S
S
SS
S
SS
SS
SS
#
#
S
S
#S
####
SSSS #
####
SSSSS
##
##
###
SS
SS
SSS
# #S S
#
###
#S
SSS
S
##
SS
##
SS
#
#
#
#S
S
S
S
#
##
#
#
S
SS
S
S
##SS
#S
#S
#S
#S
# ##
#
S SS
S
#S
##SS
##
# ##
## #
SS
S SS
SS S
##
##
##
SS
SS
SS
#
#
#
#
#
S
S
S
S
S
##
SS
###
#SS
SS
#
#
S
S
## ###
SS SSS
#
#
S
S
#
#
#
S
S
S
#
###
##
S
SSS
SS
####
##SSSS
SS
#
##S
SS
##
##
SS
SS
#
#
S
S
#
#
S
S
##SS
##SS
#
#
#
#S
S
S
S
###
SSS
#S
#
##S
SS
#
##
S
SS###
#
SSS
S
# ##
##S SS
SS
###S
SS
#
##
#S
SS
S
# #
#
#
#
S S
S
S
S
##
#
SS
S
# #S S
#
#
#S
S
S
#S
#
#
#
S
S
S
#S
##
#
SS
S
#S
#
##
#S
SS
S
#S
##
#S
S
S
#
#
S
S
#S
#
#
#S
S
S
##
##
SS
SS
# #S S
##
SS
#S
# #S S
#S
##
#
SS
S
#
#
S
S
##
###
SS
SSS
##
SS
#S
# #
#
#
S S
S
S
#S
##
SS
### #SSS S
#S
##
#SS
S
#
#
#
##S
S
S
SS
##
# #SS
S S
# ####S S
SSS
#S
#
# ##
S
S SS
#S
#
#
#
#S
S
S
S
##SS
#
# #
S
S S
#S
##SS
#
#
##
#
##
S
S
SS
S
SS
#
##
##S
SS
SS
##
##SS
SS
##
SS
#
#
#
S
S
S
## #SS S
## #
#
##
SS S
S
SS
#S
#
### #
#S
SSS S
S
#S
####SSSS
#
#
S
S
#
##
#S
SS
S
## ##SS SS
#
#
S
S
##
##S
S
SS
###
#SSS
S
##SS
##
#SS
S
#
#
#
#
##S
S
S
S
SS
#
#
# ##S
S
S SS
#
##
#S
SS
S
#S
#S
#S
###
SSS
##
#
SS
S
#
#
S
S
####S
SSS
#S
#S
##
#
#
SS
S
S
#
#
S
S#S
# # #S S S
#S
#
#
#
S
S
S
####
SSSS
#
#
#
S
S
S
#
#
#
#
#
#
#
##
S
S
S
S
S
S
S
SS
#
##
S
SS
##
SS
#S
#S
###SSS
#
#
#
#
S
S
S
S
#S
###
##
#
## SS
SSS
S
SS
## SS
#
#
S
S
#
#
#
##
#
S
S
S
SS
S
#
#
S
S
##
#SS
S
##
##
#S
S
SS
S
#
#
#
S
S
S
#
##
##
S
SS
SS
# #S S
##
##
SS
SS
#S
###
#
SSS
S
#S
####
SSSS
### #
SSS S
# ###S SSS
##SS
##
SS
#
# #
S
S S ###
#
SSS
S
## SS
##
#SS
S
##
SS
###
SSS
#
#
S
S
# #S S
#
#
#S
S
S
#S
#S
##SS
##SS
#
#
S
S
#
#
S
S
##
SS
###SSS
###SSS##
##SS
SS
##
#
#
##
###
SS
S
S
SS
SSS
#
#
#S
S
S
### SSS
#
#
#S
S
S
##SS
##
#
#
#SS
S
S
S
###S
SS
#S
##
SS
#S
#
#
S
S
#
#
#
S
S
S
#S
#
#
S
S
##S
S
##
#
#
#SS
S
S
S
#
###S
SSS
#
#
#S
S
S##
##
##
SSS
SS
S
##
#
SS
S
#
#
#
S
S
S
##SS
##SS
##
#
SS
S
#
#
#S
S
S
######
SSSSSS
#
#
#S
S
S
#
#
#
#
#
#
#
S
S
S
S
S
S
S
###SSS
# #
#
#
## #
S S
S
S
SS S
##
SS
##SS
#
#
S
S
##
#S
S
S
#
## #
S
SS S
# #S S
#S
##S
S#
#
S
S
#S
#S
#
#
#
#
#
S
S
S
S
S
### SSS
#
#
S
S
###
## #S
SS
SS S
#S
#S
#S
#
#
S
S
### SSS
#S
##
#SS
S#
#
S
S
##
#
SS
S
##
SS
#
#
S
S#
#
#S
S
S
#S
##
#SS
S
### #SSS S
###
##
#
#
SSS
SS
S
S
#S
#S
#S
##SS
# ##S SS
## ##
SS SS###
# #
#SS
SS S
S
#
#
##
S
S
SS
###SSS
##
#SS
S
#
###
S
SSS
##
SS
###
#S
SS
S
# ##
#
S SS
S#
#
S
S
##
##SS
SS
#S
#
#
#
#
#S
S
S
S
S
##
SS
##
# SS
S
##
###SS
SSS
##
# #S
S
S S
##
#
SS
S
#
##
#
#
#
#
S
SS
S
S
S
S
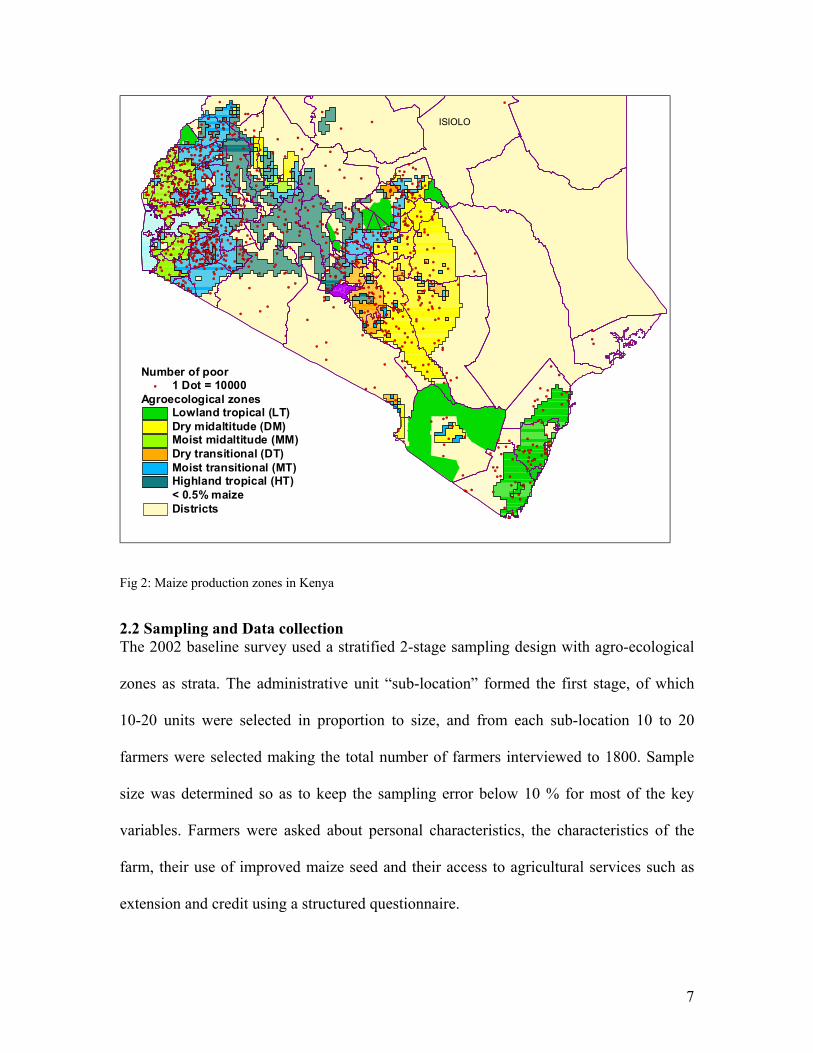
ISIOLO
Districts
Agroecological zonesLowland tropical (LT)Dry midaltitude (DM)Moist midaltitude (MM)Dry transitional (DT)Moist transitional (MT)Highland tropical (HT)< 0.5% maize
Number of poor#S 1 Dot = 10000
Fig 2: Maize production zones in Kenya
2.2 Sampling and Data collection The 2002 baseline survey used a stratified 2-stage sampling design with agro-ecological
zones as strata. The administrative unit “sub-location” formed the first stage, of which
10-20 units were selected in proportion to size, and from each sub-location 10 to 20
farmers were selected making the total number of farmers interviewed to 1800. Sample
size was determined so as to keep the sampling error below 10 % for most of the key
variables. Farmers were asked about personal characteristics, the characteristics of the
farm, their use of improved maize seed and their access to agricultural services such as
extension and credit using a structured questionnaire.
7
2.3 Model specifications The majority of adoption studies have incorporated maximum likelihood estimation
techniques. Among the more commonly used estimation techniques are tobit (Adesina
and Zinnah 1993, Nkonya et al. 1997), logit (Green and Ng'ong'ola 1993, Sain and
Martinez 1999), and probit (Negatu and Parikh 1999, Kaliba et al. 2000). These models
are more appropriate than OLS for analyzing the decision to use a new technology (Feder
et al. 1985). Because of the underlying specifications of these maximum likelihood
models, they have a more discrete range of values. The dependent variable is constrained
to values between zero and one in the case of the logit and probit models; and for the
tobit model, the dependent variable can be defined to have a lower bound of zero but may
take any positive value (Kennedy 1998).
For the analysis of adoption of improved maize seed and inorganic fertilizers, different
estimation methods were used according to the nature of the dependent variables. For the
use of the improved maize varieties and fertilizer, which are binary variables, the logit
model was used. To analyse the factors influencing intensity of use of improved maize,
and fertilizer the Tobit (or censored regression) model was used.
2.4 Variables influencing adoption Empirical studies identify numerous variables as being important to a household’s
decision to use a new technology. The underlying characteristic of these variables is that
they are hypothesized to affect the demand for the technology. Overall, the factors that
affect a household’s decision to use a new technology such as improved maize seed,
fertilizer and other inputs fall into three broad categories: market price and economic
profitability-level variables, household level variables, and physical and geographical-
level variables. In this paper, it was hypothesized that a farmer’s decision to use or not
8
use a given maize technology is influenced by the characteristics of the household head
(gender, age, and formal education of household head), access to credit and extension
services, frequency of listening to agricultural programmes in the radio, quantity of basal
fertilizer used at planting, distance to input market, and access to hired labour.
Detailed discussion of how some of these factors might influence technology adoption is
found in CIMMYT (1993). The empirical model for the maize adoption and fertilizer is
specified as follows:
/TECH = B0 + B1X1 + B2X2 + B3X3 +…. B10X10 + U/
Where: TECH = adoption of improved maize varieties/fertilizer, or intensity of improved
maize varieties/fertilizer. The following independent variables were hypothesized to
influence the adoption positively (+), negatively (-), or either negatively or positively (+/-
);
X1= Sex of household head (1=male, 2=female)
X2 = Access to hired labor (+) (1=yes, 0=otherwise),
X3 = Access to credit (+) (1=yes, 0=otherwise)
X4 = Years of formal schooling of household head (+),
X5 = Age of household head (yr) (+/-),
X6= Number of extension in 2001 (+),
X7=Distance to input market (km) (-),
9
X8=Quantity of fertilizer (kg) used for planting improved maize varieties (+),
X9 = Frequency of listening to agricultural programmes in the radio (+)
U = disturbance term; B0 is the intercept and Bis are the coefficients of the independent variables.
3 Results and Discussion 3.1 Determinants of Improved Maize Seed and fertilizer adoption Table 1 shows the results of the logit regression for improved maize varieties and
fertilizer adoption. The results suggest that access to credit has a positive and significant
influence on the adoption of improved maize seed and fertilizer. Farm households having
access to credit have a 22 % and 25 % higher probability of adopting improved maize
varieties and fertilizer respectively compared to households who do not have access to
credit. Input technology such as improved seed is resource intensive. Cash is needed to
purchase the seed, which is normally more costly than the local ones, and complementary
inputs such as fertility for optimal grain yields. This explains why “access to credit” is
often observed as an important determinant of improved variety and fertilzer adoption
(Morris et al., 1999; Gemeda et al., 2001; Adesina and Zinnah, 1993; Langyintuo, et al.,
2005; Langyintuo and Mekuria, 2005; Hugo Degroote, at al., 2005). Resource poor
farmers in developing Countries are usually cash-trapped and have limited access to
credit for varied reasons. In Kenya, cooperatives societies that used to provide credit to
farmers for purchase of inputs are no longer functioning well. In light of this situation
there is need to explore alternative sources of credit to farmers. Financial self-help groups
can successfully tap the meager resources and help build funds, which meet credit
demand among poor rural farmers. Quantity of fertilizer used positively influences the
chances of household using improved maize varieties. The number of number of
10
extension contacts positively determined the adoption of improved maize varieties.
Farmers using more fertilizer have higher chances of adopting improved maize varieties
than those using less fertilizer. Likewise, the higher the number of extension contacts, the
higher the chances of a farmer using improved maize varieties. Distance to input market,
on the other hand negatively influenced the likelihood of adoption fertilizer. Farmers
living further away from the main input center are less likely to adopt fertilizer.
3.2 Determinants of improved maize seed and fertilizer use The results of the Tobit model used to assess the determinants of intensity of use of
improved maize varieties and fertilizer are reported in Table 2. The results indicate that
access to credit significantly affects the level of use of improved maize varieties and
fertilizer. Farmers who have access to credit use more of fertilizer and plant more area
under improved maize seed. The distance to the input market adversely affects intensity
of use of fertilizer. Farmers closer to the market tend to use more fertilizer and vice
versa.. Gender of the household had a negative influence on the intensity of use of
fertilzer. Female-headed households are less likely to use more fertilizers than male-
headed households and this is explained by the poor access to credit by women. The
amount of basal fertilizer applied positively influences the intensity of use of improved
maize varieties. Farmers using more fertilizer also plant more area to improved maize
seed.
11
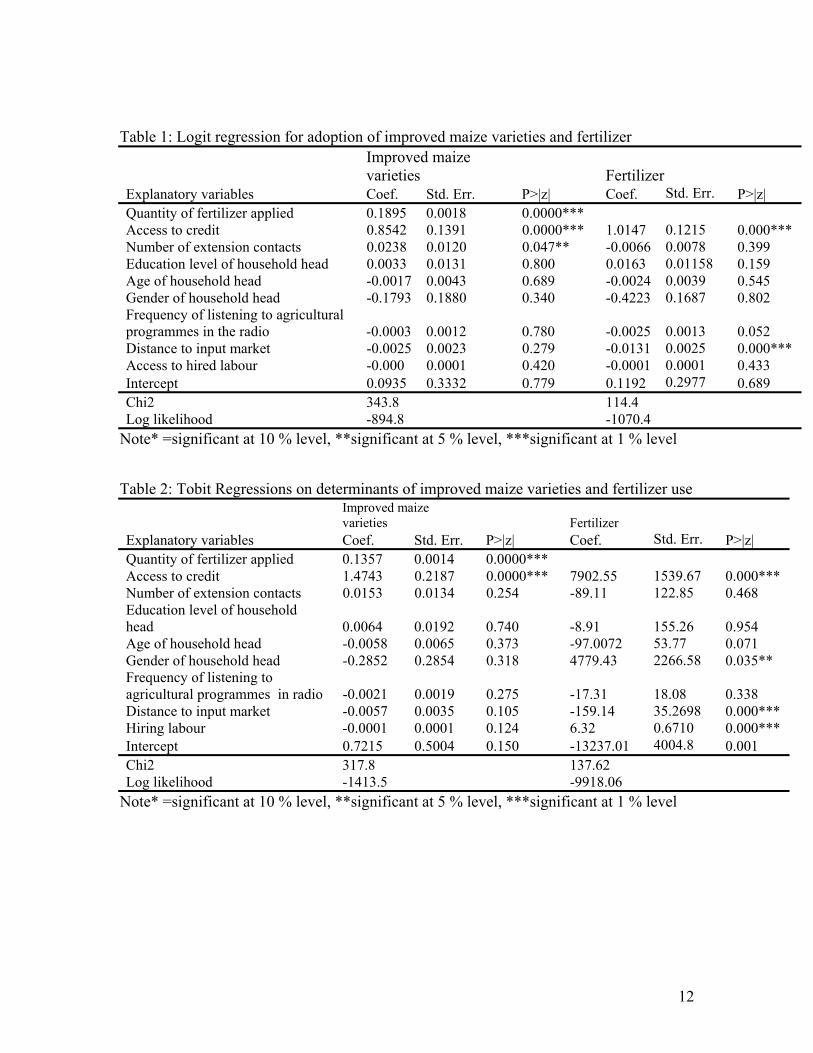
Table 1: Logit regression for adoption of improved maize varieties and fertilizer
Improved maize varieties Fertilizer
Explanatory variables Coef. Std. Err. P>|z| Coef. Std. Err. P>|z| Quantity of fertilizer applied 0.1895 0.0018 0.0000*** Access to credit 0.8542 0.1391 0.0000*** 1.0147 0.1215 0.000*** Number of extension contacts 0.0238 0.0120 0.047** -0.0066 0.0078 0.399 Education level of household head 0.0033 0.0131 0.800 0.0163 0.01158 0.159 Age of household head -0.0017 0.0043 0.689 -0.0024 0.0039 0.545 Gender of household head -0.1793 0.1880 0.340 -0.4223 0.1687 0.802 Frequency of listening to agricultural programmes in the radio -0.0003 0.0012 0.780 -0.0025
0.0013 0.052
Distance to input market -0.0025 0.0023 0.279 -0.0131 0.0025 0.000*** Access to hired labour -0.000 0.0001 0.420 -0.0001 0.0001 0.433 Intercept 0.0935 0.3332 0.779 0.1192 0.2977 0.689 Chi2 343.8 114.4 Log likelihood -894.8 -1070.4
Note* =significant at 10 % level, **significant at 5 % level, ***significant at 1 % level
Table 2: Tobit Regressions on determinants of improved maize varieties and fertilizer use
Improved maize varieties Fertilizer
Explanatory variables Coef. Std. Err. P>|z| Coef. Std. Err. P>|z| Quantity of fertilizer applied 0.1357 0.0014 0.0000*** Access to credit 1.4743 0.2187 0.0000*** 7902.55 1539.67 0.000*** Number of extension contacts 0.0153 0.0134 0.254 -89.11 122.85 0.468 Education level of household head 0.0064 0.0192 0.740 -8.91
155.26 0.954
Age of household head -0.0058 0.0065 0.373 -97.0072 53.77 0.071 Gender of household head -0.2852 0.2854 0.318 4779.43 2266.58 0.035** Frequency of listening to agricultural programmes in radio -0.0021 0.0019 0.275 -17.31
18.08 0.338
Distance to input market -0.0057 0.0035 0.105 -159.14 35.2698 0.000*** Hiring labour -0.0001 0.0001 0.124 6.32 0.6710 0.000*** Intercept 0.7215 0.5004 0.150 -13237.01 4004.8 0.001 Chi2 317.8 137.62 Log likelihood -1413.5 -9918.06
Note* =significant at 10 % level, **significant at 5 % level, ***significant at 1 % level
12
4.0 Conclusion and recommendation The study was undertaken to identify key factors in the adoption of improved maize seed
and fertilizer as well as the intensity of use of improved maize seed and fertilizer. The
logit models showed that access to credit is a key factor in the adoption and intensity of
use of improved maize seed and fertilizer. Contacts with extension and amounts of
planting fertilizer also play a key role in the adoption of improved maize seed. Planting
fertilizer is key to intensity of use of improved maize seed alongside access to credit as
mentioned above. In light of the importance of credit in determining the adoption and
intensity of improved maize seed and fertilizer and against the inaccessibility of credit
from formal credit institutions due to collateral requirement, there is need to explore other
sources of credit for small scale farmers. The emergence of microfinance institutions is
one answer to the problem of credit to farmers due to 1) the flexible lending conditions
and 2) poor functioning of the cooperatives societies currently. There is need to take an
inventory of such institutions and make an effort to link them with groups of farmers.
Extension service is important in providing knowledge to farmers to improve adoption
and increase productivity. The current public extension cannot efficiently reach all small-
scale farmers and needs to be revamped. To improve delivery of information, it is
important to think about privatization strategy for extension. This will imply a long-term
transition to more responsive information delivery. Such a transition will require
significant public funding in the foreseeable future.
13
References
Adesina, A.A & Zinnah, M.M., (1993). Technology Characteristics, Farmer Perceptions and Adoption Decisions: A Tobit Model Application in Sierra Leone. Agric Econ, 9:297-311.
Bylerlee,D & C.K.Eicher. 1997. Africa’s Food Crises. In Africa’s Emerging Maize Revolution, eds.D.Byerlee and C.K.Eicher.Boulder:Lynne Rienner Publishers.
Bylerlee, D., Morris, M.L., Lopez-Pereira, M.A., 1993. Hybrid maize and the small-scale farmer: economic and policy issues for Asia. Paper Presented at the Firth Asian Regional Maize Workshop, November 15-20, Honoi and Ho Chi Minh, Socialist Republic of Vietnam
CIMMTY, 1992. 1991-1992 CIMMTY world maize facts and trends: maize research investment and impacts in developing countries. International Maize and Wheat Improvement Centre (CIMMTY), Mexico City, Mexico
De Groote, Hugo , G. Owuor, C. Doss, J. Ouma, L. Muhammad, and K. Danda. 2005. The Maize Green Revolution in Kenya Revisited. electronic Journal of Agricultural and Development Economics 2 (1):32-49.
Doss, C.R. 2003. Understanding Farm Level Technology Adoption: Lessons Learned from CIMMYT’s Micro Surveys in Eastern Africa. CIMMYT Economics Working Paper 03-07. Mexico, D.F.: CIMMYT. Food and Agriculture Organization, 2004. FAOSTAT database, at http://faostat.fao.org. Feder, G.R., Just, R.E., Zilberman, D., 1985. Adoption of agricultural innovations in developing countries: a survey.Econ. Dev.Cult. Change 33, 255-298 Government of Kenya. (Various issues). Statistical abstracts. Central Bureau of Statistics, Nairobi, Kenya. Gemeda, A., Aboma, G., Verkuijl, H., Mwangi, W., 2001. Farmers’ maize seed system in Western Oromia, Ethiopia. International maize and Wheat Improvement Center (CIMMYT), Mexico and Ethiopia Agricultural Research Organization (EARO).32 pp. Gehart, J., 1975. The diffusion of hybrid maize in Western Kenya. International Maize and Wheat Improvement Centre (CIMMYT), Mexico City, Mexico.
14
Heisey, P.W., Moris, M.L., Byerlee, D., Lopez-Pereira, M.A., 1998. Economics of hybrid Maize adoption. In Morris, M.L. (ed), Maize Seed Industries in Developing Countries. Lynn Rienner, Boulder, Co, pp. 143-158. Karanja, D. D., 1993. An economic and institutional analysis of maize research in Kenya. MSU International Development Paper 15. Department of Agricultural Economics, Michigan State University, East Lansing, Michigan. Kumar, S.K., 1994. Adoption of hybrid maize in Zambia: effects on gender roles, food consumption, and nutrition. Research Report No. 100. International Food Policy Research Institute. Washington, DC. Langyintuo, A.S., Hamazakasa, P, Nawale, E., Jere, I., 2005. Maize production systems in Zambia: Setting indicators for impact assessment and targeting. CIMMYT Report, Harare, Zimbabwe. Langyintuo, A.S., Mekuria, M., 2005. Accounting for neighborhood influence in estimating factors determining the adoption of improved agricultural technologies. Selected Paper presented at the American Agricultural Economics Association Annual Meeting, Providence, RI, USA, July 24-27. Morris, M.L., Tripp, R., Dankyi, A.A., 1999. Adoption and impact of improved maize Production technologies. A case study of the Ghana Grains Development Project.Economics Program Paper 99-01. International maize and Wheat Improvement Center (CIMMYT), Mexico. 38 pp. Nkonya, E.M., Schroeder, T., and Norman.D., (1997). Factors Affecting Adoption of Improved Maize seed and Fertilizer in Northern Tanzania. American Journal of Agricultural Economics 48(1) (1997) 1-12 Pingali, P.L., (Ed.), 2001. CIMMYT 1999-2000 World maize facts and trends: Meeting world maize needs: Technological Opportunities and Priorities for the Public Sector, CIMMYT, D.F, Mexico. Ouma.J.O; F.M. Murithi; W.Mwangi; H. Verkuijl, M.Gethi and H. De Groote. 2002. Adoption of maize seed and Fertilizer Technologies in Embu District, Kenya. Mexico, D.F.: CIMMYT Salaysa, B.D.S., W.Mwangi; H. Verkuij, M.A.Odendo, and J.O.Odenya. 1998 An assessment of adoption of seed and fertilizer packages and the role of credit in smallholder maize production in Kakamega and Vihiga districts, Mexico, D.F.: Kenya Agricultural Research Institute (KARI) and International Maize and Wheat Improvement Centre (CIMMYT). P.36
15
Rauniyar, G.P., Goode, F.M., 1992. Technology adoption on small farms. World Dev. 20 (2), 275-282. Wekesa E., W.Mwangi; H. Verkuij, K.Danda, H.DeGroote. 2002. Adoption of Maize Production Technologies in the Coastal Lowlands of Kenya., Mexico, D.F.: Kenya Agricultural Research Institute (KARI) and International Maize and Wheat Improvement Centre (CIMMYT).
16
Related Documents