© 2012. Moses Muse Sichei & Godbertha Kinyondo. This is a research/review paper, distributed under the terms of the Creative Commons Attribution-Noncommercial 3.0 Unported License http://creativecommons.org/licenses/by-nc/3.0/), permitting all non- commercial use, distribution, and reproduction in any medium, provided the original work is properly cited. Global Journal of Management and Business Research Volume 12 Issue 18 Version 1.0 Year 2012 Type: Double Blind Peer Reviewed International Research Journal Publisher: Global Journals Inc. (USA) Online ISSN: 2249-4588 & Print ISSN: 0975-5853 Determinants of Foreign Direct Investment in Africa: A Panel Data Analysis By Moses Muse Sichei & Godbertha Kinyondo Mzumbe University Abstract - This study provides panel data evidence on the determinants of foreign direct investment (FDI) for a sample of 45 African countries over the period 1980 to 2009. Using dynamic panel data estimation techniques, the study identifies a number of factors that affect FDI flows in Africa, including, agglomeration economies, natural resources, real GDP growth, and international investment agreements. The study also shows that the Africa-wide environment has become more conducive to FDI since the year 2000. GJMBR-A Classification : FOR Code :150202, 150205 JEL Code : G32, G24 DeterminantsofForeignDirectInvestmentinAfricaAPanelDataAnalysis Strictly as per the compliance and regulations of:

Welcome message from author
This document is posted to help you gain knowledge. Please leave a comment to let me know what you think about it! Share it to your friends and learn new things together.
Transcript
© 2012. Moses Muse Sichei & Godbertha Kinyondo. This is a research/review paper, distributed under the terms of the Creative Commons Attribution-Noncommercial 3.0 Unported License http://creativecommons.org/licenses/by-nc/3.0/), permitting all non-commercial use, distribution, and reproduction in any medium, provided the original work is properly cited.
Global Journal of Management and Business Research Volume 12 Issue 18 Version 1.0 Year 2012 Type: Double Blind Peer Reviewed International Research Journal Publisher: Global Journals Inc. (USA) Online ISSN: 2249-4588 & Print ISSN: 0975-5853
Determinants of Foreign Direct Investment in Africa: A Panel Data Analysis
By Moses Muse Sichei & Godbertha Kinyondo Mzumbe University
Abstract - This study provides panel data evidence on the determinants of foreign direct investment (FDI) for a sample of 45 African countries over the period 1980 to 2009. Using dynamic panel data estimation techniques, the study identifies a number of factors that affect FDI flows in Africa, including, agglomeration economies, natural resources, real GDP growth, and international investment agreements. The study also shows that the Africa-wide environment has become more conducive to FDI since the year 2000.
GJMBR-A Classification : FOR Code :150202, 150205 JEL Code : G32, G24
Determinants of Foreign Direct Investment in Africa A Panel Data Analysis
Strictly as per the compliance and regulations of:
Determinants of Foreign Direct Investment in Africa: A Panel Data AnalysisMoses Muse Sichei α & Godbertha Kinyondo σ
Abstract - This study provides panel data evidence on the determinants of foreign direct investment (FDI) for a sample of 45 African countries over the period 1980 to 2009. Using dynamic panel data estimation techniques, the study identifies a number of factors that affect FDI flows in Africa, including, agglomeration economies, natural resources, real GDP growth, and international investment agreements. The study also shows that the Africa-wide environment has become more conducive to FDI since the year 2000.
Introduction
oreign direct investment (FDI) entails an investor acquiring substantial controlling interest in a foreign firm or sets up a subsidiary in a foreign
country [1]. FDI flows in the world have increased dramatically from $ 13.3 billion in 1970 to $ 2.1 trillion in 2007 before declining to $1.1 trillion in 2009 due to the global financial crisis in 2008-2009. However, Africa, as a region, has not benefited from the FDI boom since the volume of FDI inflows to the continent is not only low as a share of global FDI but is also on a downward trend for the last three decades. Specifically, Africa’s share of global FDI inflows declined from 9.5 per cent in 1970 to 5.3 per cent in 2009 [2].
Africa’s inability to attract FDI is troubling because it presents a potential solution to the continent’s growth and development challenges. FDI provides the needed capital for investment, brings with it employment, managerial skills and technology and at the end accelerate growth and development [3, 4]. The role of FDI is quite critical in Africa given the fact that poverty levels are generally high while domestic savings and income remain extremely low as income is mainly channeled to consumption expenditure. These factors coupled with the unpredictability of foreign aid flows, the low share of Africa in world trade and the high volatility of short-term capital flows calls for the need to attract different forms of FDI inflows.
Most countries in Africa have undertaken significant steps to attract FDI. First, countries in the region have adopted FDI-specific regulatory frameworks to support their investment related objectives. As pointed out by UNCTAD [2, 5], by 1998 45 out of 53 countries in Africa had established FDI - specific
Author
α : Director,Research & Policy Department, Commission on
Revenue Allocation, Keny , Nairobi, Kenya.
E-mails : [email protected] or [email protected]
Author
σ : Mzumbe University, Dar Es Salaam Business School, Dar
Es Salaam, Tanzania. E-mail : [email protected]
regulatory framework. The changes included the setting up of investment promotion agencies and facilities, and establishment of specialized schemes to attract investment such as export processing zones (EPZs). Second, countries also took steps at the international level through signing of international investment agreements (IIAs) such as bilateral investment treaties (BITs) and double taxation treaties (DTTs). BITs signed in Africa increased from 41 in 1970 to 772 in 2009. Similarly, DTTs signed increased from 68 in 1970 to 516 in 2009.
There are three different types of FDI. The first type of FDI is called market-seeking (horizontal) FDI, where investor’s purpose is to serve local markets. The reason for market-seeking FDI is market size and market growth. The second type of FDI is asset-seeking or resource-seeking FDI and takes place when a company’s purpose is to gain access or acquire the resources in the host country which are not available in home country such as raw materials, natural resources or low-cost labour. The third type of FDI is efficiency-seeking FDI, which take place when the company can gain when there is a common governance of geographically dispersed activities and presence of economies of scope and scale.
Despite the efforts, FDI inflows to Africa have been to countries that are classified by the World Bank as oil and mineral dependent: South Africa, Angola, Nigeria, Equatorial Guinea, and Egypt, among others. This phenomenon raises the questions as to whether Africa has been attracting one form of FDI or not.
This paper seeks to assess and quantify empirically the determinants of FDI using a set of data that covers 45 African countries over the period 1980 to 2009. The novelty of this research is three-fold. First, we use a large dataset that spans 45 African countries, which increases the degrees of freedom and the credibility of the results. Second, we include more recent data, which enable us to test the extent to which the determinants of FDI identified in previous studies are still relevant or not. Finally, we include new variables such as BITs and DTTs in the analysis.
The remainder of the paper is organized as follows: Section 2 presents some stylized facts about FDI in Africa while section 3 reviews the literature on the determinants of FDI in Africa. Section 4 presents the model, the data and estimation methodology. Section 5
F
© 2012 Global Journals Inc. (US)
85
Globa
l Jo
urna
l of M
anag
emen
t an
d Bu
siness Resea
rch
Volum
e XII
Issue
XVIII
Ver
sion
I
2012
Yea
r
presents the estimation results while section 6 presents the conclusion and policy recommendations.
I.

II.
Stylised Facts About of Fdi
a)
Africa-Wide Facts
About FDI in Africa
In this section we
summarise
some key stylized facts that motivate our study. First, the volume of FDI inflows to Africa is not only very low compared to other developing regions but is also on the decline. The volume of FDI inflows to developing Africa stood at US $ 1.3 billion in 1970, which was equivalent to 9.5 per cent of global FDI (Table 1).
At the same period, FDI flows to developing Asia stood at US $ 0.9 billion (Panel A Table 1), which was equivalent to 6.4 per cent of global FDI flows (Panel B Table 1). Africa’s share of global FDI has been on a steady downward trend and as at 2009, it
accounted for a paltry 5.3 per cent compared to 27 per cent for developing Asia. The corollary of these trends is that Africa has remained aid-dependent, with FDI lagging behind official development assistance (ODA).
Table 1: FDI flows by region, 1970-2009 (Billions of $ and percent)
Region 1970 1990 2000 2007 2008 2009 Panel A: FDI in flows in billions of US $
World: 13.3 207.7 1401.5 2100 1770.9 1114.2
Developed 9.5 172.5 1138 1444.1 1018.3 565.9 Developing: 3.9 35.1 256.5 564.9 630 478.3
Africa 1.3 2.8 9.8 63.1 72.2 58.6 America 1.6 8.9 97.7 163.6 183.2 116.6
Asia 0.9 22.6 148.7 336.9 372.7 301.4 Oceania 0.1 0.7 0.2 1.3 2.0 1.9
Africa (all) 1.3 3.0 10.2 64.5 73.6 59.4 Panel B: Percentage share in World FDI flows
Developed 71.1 83.1 81.2 68.8 57.5 50.8 Developing: 28.9 16.9 18.3 26.9 35.6 42.9
Africa 9.5 1.4 0.70 3.0 4.1 5.30 America 12.0 4.3 7.0 7.8 10.3 10.5
Asia 6.4 10.9 10.6 16.0 21.0 27.0 Oceania 1.0 0.3 0.02 0.06 0.1 0.2 Africa(all) 9.5 1.5 0.72 3.1 4.2 5.33
Source : UNCTAD/TNC database (www.unctad-org/fdistatistics)
Table 2 : Percentage contribution of FDI flows to GDP and GFCF by region, 1970-2009.
Region 1970 1990 2000 2007 2008 2009 Panel A: Percentage share in GDP
World: 0.5 0.9 4.4 3.8 2.9 1.9 Developed 0.4 1.0 4.6 3.7 2.5 1.5 Developing: 0.9 0.9 3.7 3.8 3.7 2.6
Africa 1.5 0.6 1.7 4.9 4.7 4.1 America 0.9 0.7 4.6 4.4 4.2 2.0
Asia 0.5 1.0 2.8 3.4 3.3 2.7 Oceania 13.8 5.5 1.7 5.3 6.6 Na
Panel B: Percentage share in Gross Fixed Capital Formation World 2.3 4.1 20.3 16.8 12.7
Developed 2.0 4.5 21.9 18.0 12.2 Developing: 4.4 3.9 13.3 14.1 12.5
Africa 7.5 3.0 9.8 24.1 23.4 America 4.3 3.9 24.0 22.2 20.0
Asia 2.6 4.0 13.3 11.2 9.8 Oceania 34.3 23.1 8.4 25.5 31.9
Source: UNCTAD/TNC database (www.unctad-org/fdistatistics )
Determinants of Foreign Direct Investment in Africa : A Panel Data Analysis
Globa
l Jo
urna
l of M
anag
emen
tan
d Bu
siness Resea
rch
Volum
e XII
Issu
e X
VIII
Ver
sion
I
2
2012
ea
r
© Global Journals Inc. (US)© 2012 Global Journals Inc. (US)
Y
86
Second, the declining FDI flows to Africa reflects the fact that Africa’s share of World output has been declining from 2.6 per cent in 1970 to 1.7 per cent by 2002 before recovering to 2.5 per cent in 2009 (Figure 1). Similarly, Africa’s share of World exports trade also fell from a peak of 5.6 per cent in 1980 to 2.9 per cent in 2009. Given the fact that income levels have also stagnated, the levels of FDI to Africa are not surprisingly low.
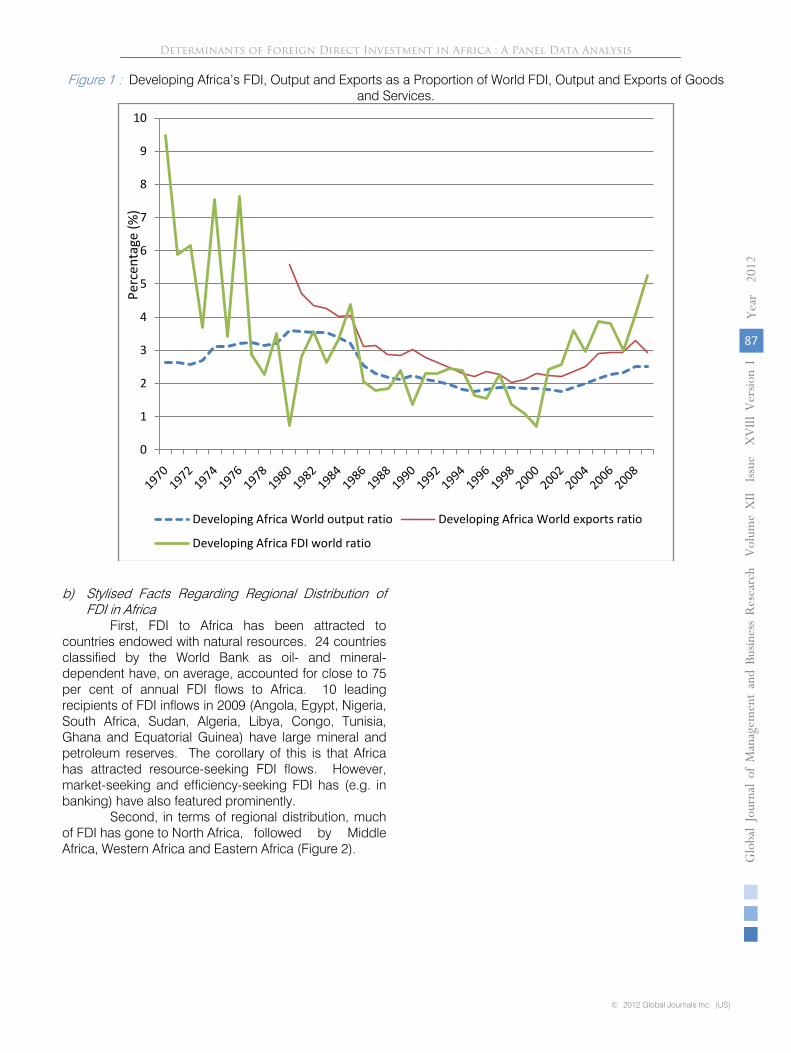
Figure 1 : Developing Africa’s FDI, Output and Exports as a Proportion of World FDI, Output and Exports of Goods and Services.
b) Stylised Facts Regarding Regional Distribution of FDI in Africa
First, FDI to Africa has been attracted to countries endowed with natural resources. 24 countries classified by the World Bank as oil- and mineral-dependent have, on average, accounted for close to 75 per cent of annual FDI flows to Africa. 10 leading recipients of FDI inflows in 2009 (Angola, Egypt, Nigeria, South Africa, Sudan, Algeria, Libya, Congo, Tunisia, Ghana and Equatorial Guinea) have large mineral and petroleum reserves. The corollary of this is that Africa has attracted resource-seeking FDI flows. However, market-seeking and efficiency-seeking FDI has (e.g. in banking) have also featured prominently.
Second, in terms of regional distribution, much of FDI has gone to North Africa, followed by Middle Africa, Western Africa and Eastern Africa (Figure 2).
0
1
2
3
4
5
6
7
8
9
10
Developing Africa World output ratio Developing Africa World exports ratio
Developing Africa FDI world ratio
Perc
enta
g e (%
)
Determinants of Foreign Direct Investment in Africa : A Panel Data Analysis
© 2012 Global Journals Inc. (US)
87
Globa
l Jo
urna
l of M
anag
emen
t an
d Bu
siness Resea
rch
Volum
e XII
Issue
XVIII
Ver
sion
I
2012
Yea
r

Figure 2 : FDI inflows to the different regions of Africa.
Source : UNCTAD database.
III. Literature Review
a) Theoretical Literature Review The theoretical literature on the determinants of
FDI stems from Stephen Hymer’s doctoral dissertation [6]. This was followed by the work of Dunning [7, 8] which provide a comprehensive analytical framework based on ownership advantages, location advantages and benefits of internationalization (OLI) paradigm. Past studies can be categorized into two categories. One category focuses on analyzing the determinants that are endogenous to Multinational corporations (MNC) such as the size of the firm, and basically asks why a firm becomes a foreign investor. The second category examines the FDI drivers that are exogenous to investors such as the location advantages of the host country, market size and labour costs. Our focus is on the latter group as the paper examines determinants of FDI that are exogenous to the investor but endogenous to the African host country.
Theoretical literature indicates that the key locational determinants are the classical sources of comparative advantage of the host country highlighted under the Ricardian or Heckscher-Ohlin-Vanek theoretical framework. The key issue here is that foreign firms choose their investment location that minimizes the production costs [1]. The locational factors are market size and relative factor costs (such as natural resources, labour costs and human capital). Other factors that
have been identified in theory include infrastructure availability, agglomeration economies, economic and political environment, and trade openness.
The market size and growth in the host country : represents the country’s economic conditions and the potential demand for the output/services which is critical for FDI. A large growing domestic market ensures the MNC of a market for its produce and provides scale for economies. Real GDP, real GDP growth [9], GDP per capita have been used as a proxy for market. It is expected that there is a positive relationship with FDI inflows [10].
Economic stability and growth prospects : Countries that have stable macroeconomic condition with high and sustainable growth rates will tend to receive high FDI inflows than a more volatile economy. The proxies used to measure economic stability are real GDP growth rate, industrial production index, inflation rates, exchange rates and interest rates.
Labour costs : High labour costs imply higher costs of production and is expected to limit the FDI inflows. Labour costs can be proxied by wage rates [10].
Infrastructure facilities : Well established and quality infrastructure is an important determinant of FDI inflows. Thus we expect a positive relationship between FDI and infrastructure [3]. The infrastructure is proxied by electricity, water, transportation, telecommunications, public expenditure on capital to acquire fixed capital
-5000
0
5000
10000
15000
20000
25000
30000
Eastern Africa Middle Africa Northern Africa
Southern Africa Western Africa
Determinants of Foreign Direct Investment in Africa : A Panel Data Analysis
Globa
l Jo
urna
l of M
anag
emen
tan
d Bu
siness Resea
rch
Volum
e XII
Issu
e X
VIII
Ver
sion
I
2
2012
ea
r
© Global Journals Inc. (US)© 2012 Global Journals Inc. (US)
Y
88

assets, land, non-financial and non-military assets for infrastructure.
Trade openness : Trade openness, meaning the degree of liberalization of trade regime of the host country, is regarded as a very important factor that promotes FDI. Much FDI is export oriented. It is proxied in most studies by the ratio of export plus imports divided by GDP [10]. A positive relationship is expected with FDI.
Political stability : Political instability and frequent occurrence of civil disorder create an unfavourable business climate which seriously erodes the risk-averse foreign investor’s confidence [11].
Human capital : Foreign investors are concerned with the quality of the labour force in addition to its cost. A more educated labour force can learn and adopt new technology faster and is generally more productive [12, 13]. Higher levels of human capital are a good indicator of the availability of skilled workers, which tends to boost the locational advantages of a country.
Natural resource endowment : Countries that are endowed with natural resources would receive more resource-seeking FDI.
Regional trade agreements (RTAs) : There are various channels through which RTAs can influence FDI, which include the nature of investment rules, trade rules and other initiatives (See for instance [14]). Investment rules govern investments in regional groupings and may apply to regional investors as well as extra-regional investors. RTAs can decrease horizontal (tariff-jumping) intra-regional FDI because it becomes cheaper to serve other economies in the region through trade rather than establishing an affiliate with production facilities and thus incurring plant-level costs. Vertically motivated regional FDI (efficiency and natural resource seeking FDI) [15] split up the production process across borders to exploit gains from comparative advantage within the firm. Here, the gains from ‘outsourcing’ of production stages to low-wage countries and the associated trade of intermediate goods within firms are important issues with vertical multinational firms. Therefore, we expect vertical FDI to increase through the implementation of RTAs.This is because lower trade costs will reduce the costs of establishing international production networks across member countries.
Extra-regional FDI can also be affected by RTAs in a number of ways. First, as tariffs among parties to the RTA are removed, it becomes profitable for extra-regional Transnational Corporation (TNC) to serve an effectively larger market (horizontal- market-seeking FDI) from one or more locations in the region. Second, the rule of origin can affect the location decision of FDI. Non-tariff barriers also play a significant role in attracting FDI. Third, some RTAs including COMESA and SADC have cooperation schemes that aim at establishing regional enterprises by promoting joint ventures.
Bilateral investment treaties (BITS) : BITS are investment treaties with clear and enforceable rules which reduce the risk the investor might face and that such reduction is, all things being equal, encourages investment [16]. As pointed out by UNCTAD [17], such measures are needed to cover a number of issues that are relevant for foreign investors especially when investing in African countries that are generally considered to involve risks. They cover fair and equitable treatment; most-favoured nation (MFN)-treatment subject to some standardized exceptions; free transfer of payments related to investments; and dispute resolution, among others. The BITs may also capture the quality of infrastructure.
Double taxation treaties (DTTs) : As pointed out by UNCTAD [17], DTTs set out allocation rules; contains rules for giving exemption from tax or credit for foreign tax; rules on non-discrimination; mutual agreements to avoid double taxation and provisions on assistance in tax collection.
Agglomeration economies (AE) : This arises when there are benefits from locating close to other foreign investors due to positive externalities. This arise from the fact that new foreign investors have less knowledge about host country and its environment, and thus they will view the investment decisions by others as a good signal of favourable investment conditions. This is normally tested using past FDI stock.
b) Empirical literature
There have been a number of studies that examine the various determinants of FDI in Africa specifically (see table 3). In most of the studies carried out a limited number of African countries are included in the analysis. However, there are a few of these studies that are concentrated on the determinants of FDI in Africa.
Asiedu [3] explored whether factors that affect FDI in developing countries affect countries in Sub-Saharan Africa (SSA) differently. Using data for 32 African countries for the period 1970 to 1999, she found that factors that drive FDI to developing countries have a different impact on FDI in SSA. Specifically, infrastructure development and higher return on capital promote FDI to non-SSA countries and not SSA countries. Openness to trade promotes FDI to both SSA and non-SSA countries.
Rogoff and Reinhart [12] constructed the probability of war for three regions of Africa, Asia and Western Hemisphere (excluding Canada and the United States) over the period 1960-2001 and found that there is a statistical significant negative correlation between FDI and conflicts in Africa.
Onyeiwu and Shrestha [18] use a dataset for 29 African countries over the period 1975 to 1999 and identified economic growth, openness of the economy, international reserves and natural resource availability as
Determinants of Foreign Direct Investment in Africa : A Panel Data Analysis
© 2012 Global Journals Inc. (US)
89
Globa
l Jo
urna
l of M
anag
emen
t an
d Bu
siness Resea
rch
Volum
e XII
Issue
XVIII
Ver
sion
I
2012
Yea
r

the key FDI determinants. Additionally, contrary to other studies, political rights and infrastructure were found to be unimportant for FDI flows to Africa.
Neumayer and Spess [19] focused on the signaling effect of BITs and found positive effect of BITs on FDI inflow across various model specifications. On the role of BITs operating as substitutes to institutional quality they found limited evidence. They argue that by concluding BITs with developed countries, particularly those that are major FDI exporters, developing countries give up some of their dometic policy autonomy by binding themsleves to foreign investment proctetion, but could expect to receive more FDI in exchange. Their conclusion was that the effect is possbily more evident in countries with weak domestic institutions, especially in countries for which the confidence and credibility inspiring signal to foreign investors following the signing of BITs was most important.
Salacuse and Sullivan [20] find that BITs with the strongest investor protection attracts FDI as
compared to an agreement with weaker standards. In line of this argument their results showed that United States BIT is more likely to induce FDI inflows than those by OECD countries.
Suliman and Mollick [21] use a panel data regression data fixed effect model to identify the determinants of foreign direct investment (FDI) for a large sample of 29 Sub-Saharan African countries from 1980 to 2003. They test whether human capital development defined by either literacy rates or economic freedom, and the incident of war affect FDI flows to these countries. Combining these explanatory variables to several widely used control variables, it was found that the literacy rate (human capital); freedom (political rights and civil rights) and the incident of war are important FDI determinants. The results confirm their expected signs; FDI inflows respond positively to the literacy rate and to improvements in political rights and civil liberties; war event, by contrast, exerts strong negative effects on FDI.
Table 3 : The Determinants of FDI to Africa: Selected Empirical Literature.
Study Sample Variables Main Results Dependent Explanatory
Bhathattachrya, Montiel and
Sharma(1997)
15 SSA for 1980-1995
Private flows, FDI, private
loans all % of GDP
Lag growth rate of GDP, lag gross fixed capital formation to GDP, lag
exports plus imports to GDP, lag total debt to
GDP, coefficient of variation of monthly real effective exchange rate index, lag dependent
variable and US 3 year government bond yield
For private flows, all variables were significant with expected sign except REER variability. For FDI key variables were GDP growth, openness and variability of REER. For
private loans key variables were domestic investment
and external debt ratios. US interest rate was not
significant in any regression Asiedu (2002) 32 SSA and 39
non-SSA, 1970-1999
(Net FDI flows)/GDP
GDP growth, openness, infrastructure, Return to
investment, inflation, Africa dummy, political stability, interactions
Factors that drive FDI to developing countries have a different impact on FDI to
SSA. Infrastructure development and a higher return on capital promote FDI to non-SSA countries. In contrast these factors have no effect on FDI to SSA. Openness to trade,
promotes FDI in both groups.
Onyeiwu and Shrestha (2004)
29 African countries, 1975-
1999
GDP growth, openness, international reserves,
natural resource
Found that FDI to Africa is determined by GDP growth, openness,
international reserves and natural resources
Krugell (2005) 17 African countries for 1980-1999
FDI inflows/GDP Past FDI, market size and growth, infrastructure,
Found that FDI is determined by past FDI,
market size and infrastructure
Suliman and Mollick(2009)
29 SSA for 1980-2003
FDI inflows/GDP Adult literacy, Freedom, real GDP, openness,
market liquidity,
Literacy rate, freedom(political and civil rights), and incidence of
Determinants of Foreign Direct Investment in Africa : A Panel Data Analysis
Globa
l Jo
urna
l of M
anag
emen
tan
d Bu
siness Resea
rch
Volum
e XII
Issu
e X
VIII
Ver
sion
I
2
2012
ea
r
© Global Journals Inc. (US)© 2012 Global Journals Inc. (US)
Y
90
infrastructure, FDI lag, war are important determinants on FDI

VI.
The Model and Estimation Framework
a) The Empirical Model
In line with the discussions in the previous section, a basic FDI model is specified as follows
itititit
itititititit
ititititititititit
uIGADUMACENSADECCASECOWASEACCOMESAMILITFIN
InvrlYOFFDTTsBITsopenresylFDIlFDI
+++++++++++++
+++++++++= −
2009...20001990 1021161514
1312111098
76543211
φφφβββββββββ
βββββββλα
(1)
Where itlFDI is the log of FDI stocks to
nominal GDP, ity is the real GDP growth rate
(introduced to proxy for growth potential of the market size), itres is the existence of natural resources, itopenis the degree of openness, itBITs is the number of
bilateral investment treaties, itDTTs is the number of
double taxation treaties, itInvr is the existence of FDI-
specific regulatory regime, itlYOFF is log of the number
of years the current president has been in power, itFINis whether there is a limited period before elections or not, itMILIT is whether the president is a military officer
or not, itCOMESA a Common Market for Eastern and
Southern Africa (COMESA) dummy, itSADC a Southern
African Development Community (SADC) dummy,
itEAC is East African Community (EAC) dummy,
itECOWAS is the Economic Community of West
African States (ECOWAS) dummy, itECCAS is the
Economic Community of Central African States (ECCAS) dummy, itCENSAD is the Community of Sahel-Saharan
States (CENSAD) dummy, itUMA and itIGAD is the
Intergovernmental Authority on Development (IGAD) dummy. The subscript i denotes countries and tdenotes the time.
The study utilises a one-way error component disturbances;
itiit vu += µ 45,...,1=i 2009,...,1980=t (2)
Where iµ denotes time-invariant unobservable
country effect, tλ denotes the Africa-wide unobservable
time effect and itv is the remainder stochastic
disturbance term that is assumed to be identically and independently distributed.
However, the explicit introduction of year dummy variables introduces time-specific fixed effects.
These effects capture the unobservable characteristics about each year which applies to all countries in the sample.
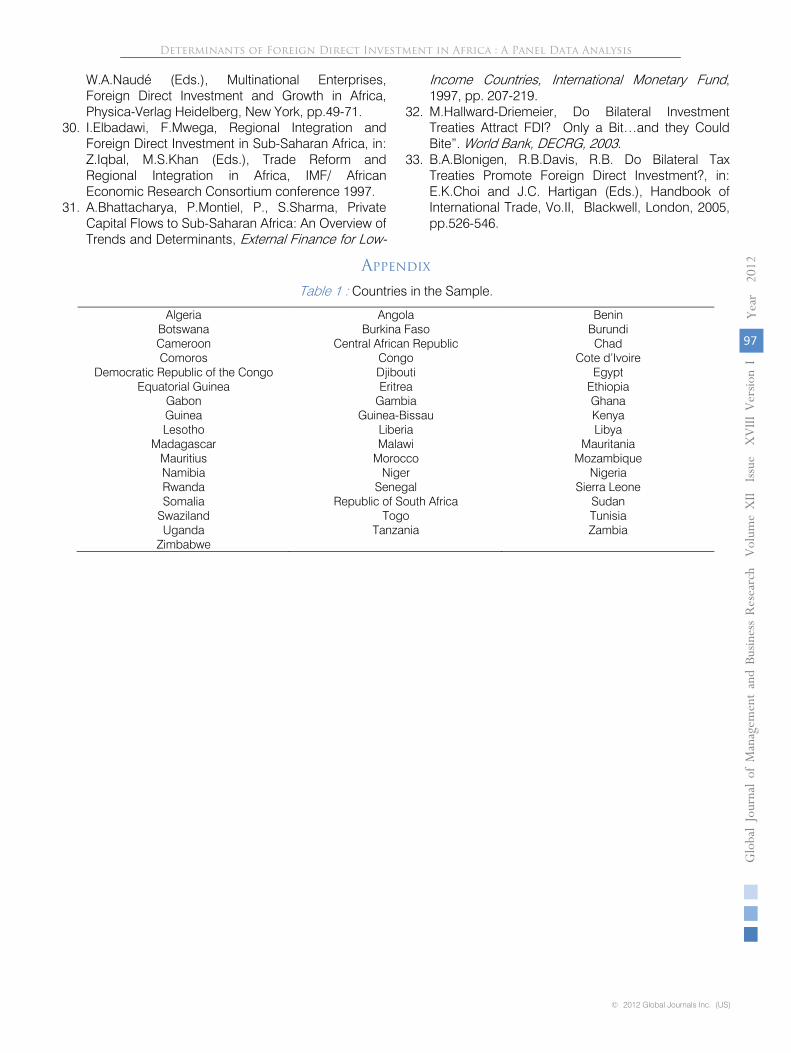
b) Description of the Data and Variables The sample contains the countries shown in
table A1 in the appendix. The dependent variable is the log of the ratio of FDI stocks to GDP all obtained from the United Nation Conference on Trade and Development (UNCTAD) web site. The choice of the independent variables was constrained by data availability. For instance data on infrastructure, wages were not available for a number of countries in the sample. Since one of the virtues of our study was the inclusion of many African countries, we were unable to test for these important variables. Below are some of the independent variables.
i. Macroeconomic variables. Real GDP growth: This data is collected from
the UNCTAD database. Openness : Computed as a ratio of the total
exports of goods and services to GDP. The Data is collected from the UNCTAD database.
ii. National and International Investment Policy. FDI-specific regulatory regime: Is a dummy
variable for countries with FDI-specific regulatory regime including existence of an Investment Promotion Agency. Countries with such a regime are coded as 1 and 0 otherwise.
Cumulative Bilateral investment treaties (BITs) : This is extracted from a list of BITs in the UNCTAD database.
Cumulative Double taxation treaties (DTTs) : This is extracted from a list of DTTs in the UNCTAD database.
iii. Natural resources. Natural resources: Is a dummy variable for
countries endowed with natural resources. Countries with natural resources are coded as 1 and 0 otherwise.
iv. Political governance variables. Years current president has been in power :
This is extracted from Kefer [22] database on political institutions.
Determinants of Foreign Direct Investment in Africa : A Panel Data Analysis
© 2012 Global Journals Inc. (US)
91
Globa
l Jo
urna
l of M
anag
emen
t an
d Bu
siness Resea
rch
Volum
e XII
Issue
XVIII
Ver
sion
I
2012
Yea
r
Fixed term before elections are held: This is extracted from Kefer [22] database on political institutions.
President being a military officer: This is extracted from Kefer [22] and is simply a dummy variable for those years/countries when the leader was a military officer.
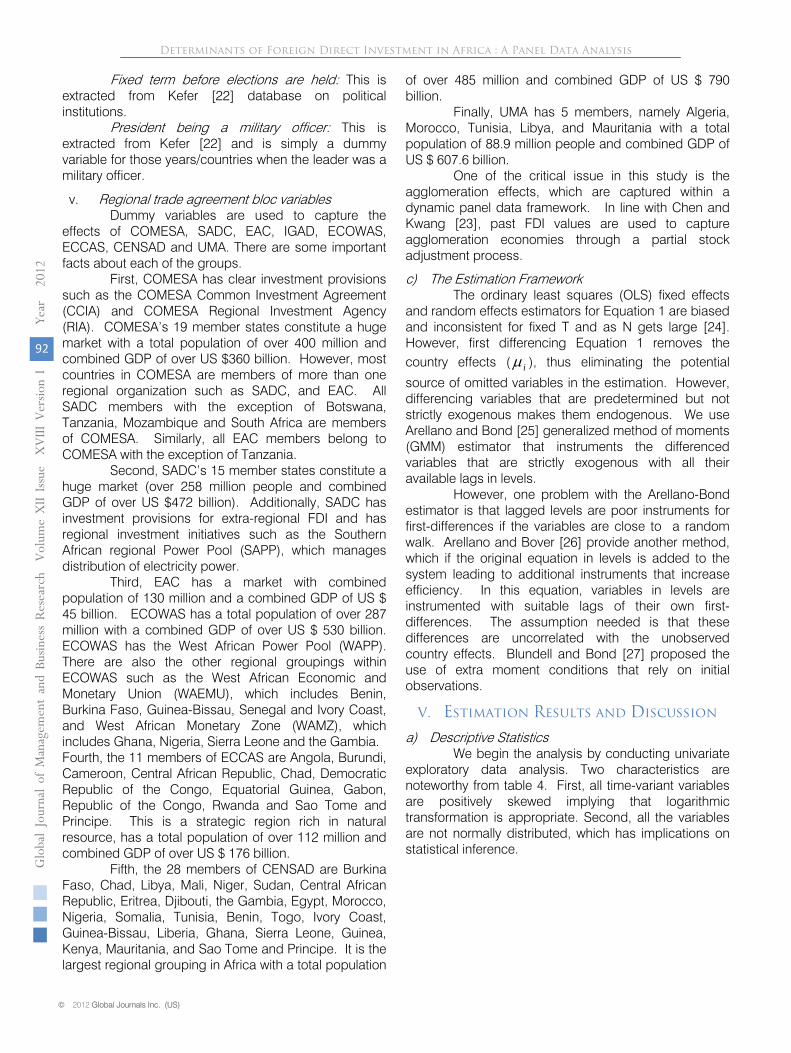
v. Regional trade agreement bloc variables Dummy variables are used to capture the
effects of COMESA, SADC, EAC, IGAD, ECOWAS, ECCAS, CENSAD and UMA. There are some important facts about each of the groups.
First, COMESA has clear investment provisions such as the COMESA Common Investment Agreement (CCIA) and COMESA Regional Investment Agency (RIA). COMESA’s 19 member states constitute a huge market with a total population of over 400 million and combined GDP of over US $360 billion. However, most countries in COMESA are members of more than one regional organization such as SADC, and EAC. All SADC members with the exception of Botswana, Tanzania, Mozambique and South Africa are members of COMESA. Similarly, all EAC members belong to COMESA with the exception of Tanzania.
Second, SADC’s 15 member states constitute a huge market (over 258 million people and combined GDP of over US $472 billion). Additionally, SADC has investment provisions for extra-regional FDI and has regional investment initiatives such as the Southern African regional Power Pool (SAPP), which manages distribution of electricity power.
Third, EAC has a market with combined population of 130 million and a combined GDP of US $ 45 billion. ECOWAS has a total population of over 287 million with a combined GDP of over US $ 530 billion. ECOWAS has the West African Power Pool (WAPP). There are also the other regional groupings within ECOWAS such as the West African Economic and Monetary Union (WAEMU), which includes Benin, Burkina Faso, Guinea-Bissau, Senegal and Ivory Coast, and West African Monetary Zone (WAMZ), which includes Ghana, Nigeria, Sierra Leone and the Gambia. Fourth, the 11 members of ECCAS are Angola, Burundi, Cameroon, Central African Republic, Chad, Democratic Republic of the Congo, Equatorial Guinea, Gabon, Republic of the Congo, Rwanda and Sao Tome and Principe. This is a strategic region rich in natural resource, has a total population of over 112 million and combined GDP of over US $ 176 billion.
Fifth, the 28 members of CENSAD are Burkina Faso, Chad, Libya, Mali, Niger, Sudan, Central African Republic, Eritrea, Djibouti, the Gambia, Egypt, Morocco, Nigeria, Somalia, Tunisia, Benin, Togo, Ivory Coast, Guinea-Bissau, Liberia, Ghana, Sierra Leone, Guinea, Kenya, Mauritania, and Sao Tome and Principe. It is the largest regional grouping in Africa with a total population
of over 485 million and combined GDP of US $ 790 billion.
Finally, UMA has 5 members, namely Algeria, Morocco, Tunisia, Libya, and Mauritania with a total population of 88.9 million people and combined GDP of US $ 607.6 billion.
One of the critical issue in this study is the agglomeration effects, which are captured within a dynamic panel data framework. In line with Chen and Kwang [23], past FDI values are used to capture agglomeration economies through a partial stock adjustment process.
c) The Estimation Framework The ordinary least squares (OLS) fixed effects
and random effects estimators for Equation 1 are biased and inconsistent for fixed T and as N gets large [24]. However, first differencing Equation 1 removes the country effects ( iµ ), thus eliminating the potential
source of omitted variables in the estimation. However, differencing variables that are predetermined but not strictly exogenous makes them endogenous. We use Arellano and Bond [25] generalized method of moments (GMM) estimator that instruments the differenced variables that are strictly exogenous with all their available lags in levels.
However, one problem with the Arellano-Bond estimator is that lagged levels are poor instruments for first-differences if the variables are close to a random walk. Arellano and Bover [26] provide another method, which if the original equation in levels is added to the system leading to additional instruments that increase efficiency. In this equation, variables in levels are instrumented with suitable lags of their own first-differences. The assumption needed is that these differences are uncorrelated with the unobserved country effects. Blundell and Bond [27] proposed the use of extra moment conditions that rely on initial observations.
V. Estimation Results and Discussion
a) Descriptive Statistics We begin the analysis by conducting univariate
exploratory data analysis. Two characteristics are noteworthy from table 4. First, all time-variant variables are positively skewed implying that logarithmic transformation is appropriate. Second, all the variables are not normally distributed, which has implications on statistical inference.
Determinants of Foreign Direct Investment in Africa : A Panel Data Analysis
Globa
l Jo
urna
l of M
anag
emen
tan
d Bu
siness Resea
rch
Volum
e XII
Issu
e X
VIII
Ver
sion
I
2
2012
ea
r
© Global Journals Inc. (US)© 2012 Global Journals Inc. (US)
Y
92
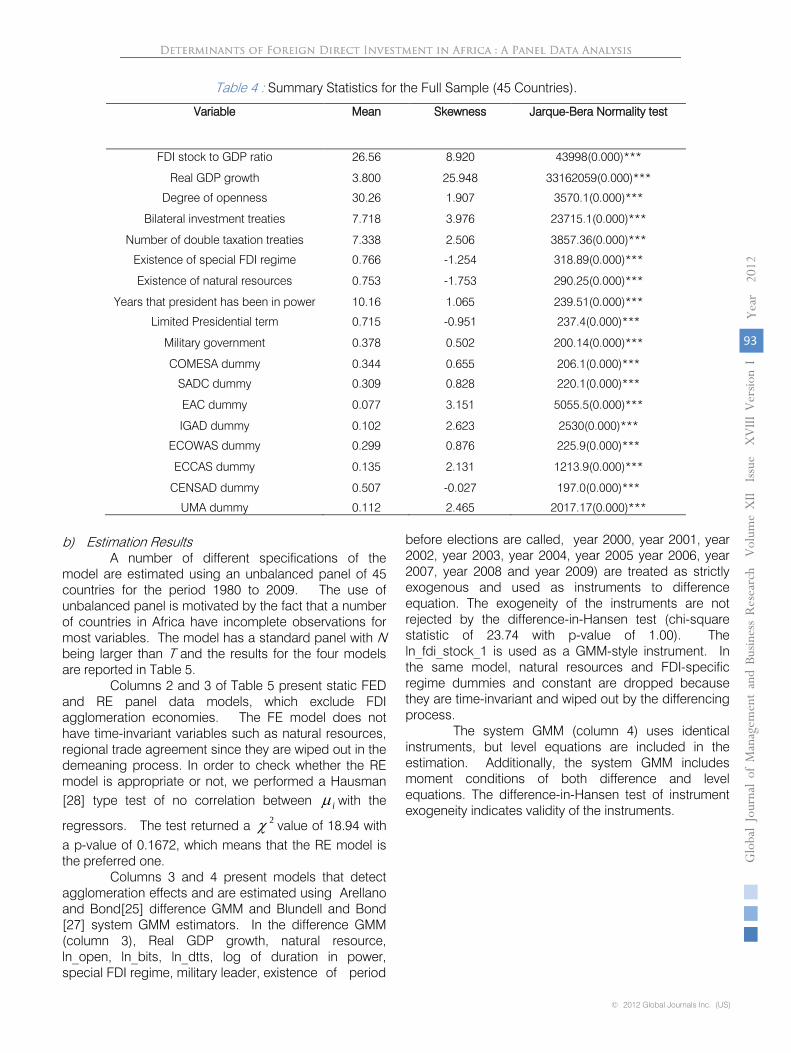
Table 4 : Summary Statistics for the Full Sample (45 Countries).
Variable Mean Skewness Jarque-Bera Normality test
FDI stock to GDP ratio 26.56 8.920 43998(0.000)***
Real GDP growth 3.800 25.948 33162059(0.000)***
Degree of openness 30.26 1.907 3570.1(0.000)***
Bilateral investment treaties 7.718 3.976 23715.1(0.000)***
Number of double taxation treaties 7.338 2.506 3857.36(0.000)***
Existence of special FDI regime 0.766 -1.254 318.89(0.000)***
Existence of natural resources 0.753 -1.753 290.25(0.000)***
Years that president has been in power 10.16 1.065 239.51(0.000)***
Limited Presidential term 0.715 -0.951 237.4(0.000)***
Military government 0.378 0.502 200.14(0.000)***
COMESA dummy 0.344 0.655 206.1(0.000)***
SADC dummy 0.309 0.828 220.1(0.000)***
EAC dummy 0.077 3.151 5055.5(0.000)***
IGAD dummy 0.102 2.623 2530(0.000)***
ECOWAS dummy 0.299 0.876 225.9(0.000)***
ECCAS dummy 0.135 2.131 1213.9(0.000)***
CENSAD dummy 0.507 -0.027 197.0(0.000)***
UMA dummy 0.112 2.465 2017.17(0.000)***
b)
Estimation Results
A number of different specifications of the model are estimated using an unbalanced panel of 45 countries for the period 1980 to 2009.
The use of
unbalanced panel is motivated by the fact that a number of countries in Africa have incomplete observations for most variables. The model has a standard panel with N
being larger than T and the results for the four models
are reported in Table 5. Columns 2 and 3 of Table 5 present
static FED
and RE panel data models, which exclude FDI agglomeration economies.
The FE model
does not
have time-invariant variables such as natural resources, regional trade agreement since they are wiped out in the demeaning process. In order to check whether the RE model is appropriate or not, we performed a Hausman [28]
type test of no correlation between iµ with the
regressors. The test returned a 2χ value of 18.94 with
a p-value of 0.1672, which means that the RE model is the preferred one.
Columns 3 and 4 present models that detect
agglomeration effects and are estimated using Arellano and Bond[25] difference GMM and Blundell and Bond [27] system GMM estimators. In the difference GMM (column 3), Real GDP growth, natural resource, ln_open, ln_bits, ln_dtts, log of duration in power, special FDI regime, military leader, existence of
period
before elections are called, year 2000, year 2001, year 2002, year 2003, year 2004, year 2005 year 2006, year 2007, year 2008 and year 2009) are treated as strictly exogenous and used as instruments to difference equation. The exogeneity of the instruments are not rejected by the difference-in-Hansen test (chi-square statistic of 23.74 with p-value of 1.00). The ln_fdi_stock_1 is used as a GMM-style instrument. In the same model, natural resources and FDI-specific regime dummies and constant are dropped because they are time-invariant and wiped out by the differencing process.
The system GMM (column 4) uses identical instruments, but level equations are included in the estimation. Additionally, the system GMM includes moment conditions of both difference and level equations. The difference-in-Hansen test of instrument exogeneity indicates validity of the instruments.
Determinants of Foreign Direct Investment in Africa : A Panel Data AnalysisDeterminants of Foreign Direct Investment in Africa : A Panel Data Analysis
© 2012 Global Journals Inc. (US)
93
Globa
l Jo
urna
l of M
anag
emen
t an
d Bu
siness Resea
rch
Volum
e XII
Issue
XVIII
Ver
sion
I
2012
Yea
r

Table 5 : Dynamic Panel Data Results (Dependent Variable=log of FDI stock).
Without agglomeration effects With agglomeration effects Variable Static FEM Static REM Difference GMM
(Arellano-Bond) System GMM
(Blundell-Bond) Constant 3.211(0.000)*** 2.925(0.001)***
FDI stock(lag) 0.858(0.000)*** 0.557(0.000)*** Real GDP growth 0.006(0.130) 0.006(0.108) 0.002(0.006)*** 0.005(0.043)** Openness (log) 0.434(0.000)*** 0.439(0.000)*** 0.006(0.845) -0.101(0.444)
Natural resources 0.645(0.090)* 0.743(0.083)* Special FDI regime -0.094(0.782) -0.378(0.205)
BITs(log) 0.308(0.000)*** 0.301(0.000)*** -0.010(0.882) 0.111(0.172) DTTs(log) 0.713(0.000)*** 0.754(0.000)*** 0.162(0.214) 0.543(0.004)***
Power duration(log) 0.074(0.001)*** 0.075(0.001)*** 0.035(0.000)*** -0.018(0.527) Limited term 0.248(0.000)*** 0.234(0.001)*** 0.226(0.368) -0.119(0.554)
Military government -0.063(0.401 -0.068(0.355) -0.047(0.447) 0.307(0.134) Year2000 0.067(0.492) 0.063(0.514) 0.077(0.000)*** 0.014(0.719)
Year2001 -0.028(0.778) -0.032(0.747) -0.017(0.640) -0.032(0.503) Year2002 0.083(0.414) 0.079(0.441) 0.096(0.011)** 0.041(0.450) Year2003 0.190(0.066)* 0.184(0.076)* 0.150(0.000)*** 0.129(0.011)** Year2004 0.166(0.113) 0.155(0.137) 0.107(0.000)*** 0.145(0.018)** Year2005 0.212(0.713) 0.199(0.058)* 0.041(0.338) 0.159(0.028)** Year2006 0.387(0.000)*** 0.373(0.000)*** 0.202(0.000)*** 0.328(0.000)***
Year2007 0.616(0.000)*** 0.602(0.000)*** 0.255(0.000)*** 0.427(0.000)*** Year2008 0.737(0.000)*** 0.722(0.000)*** 0.166(0.008)*** 0.439(0.000)*** Year2009 0.939(0.000)*** 0.926(0.000)*** 0.201(0.009)*** 0.472(0.000)***
COMESA dummy -0.692(0.149) 0.374(0.422) SADC dummy -0.014(0.983) 2.991(0.029)** EAC dummy -0.453(0.438) -1.476(0.051)* IGAD dummy 0.837(0.239) 1.725(0.086)*
ECOWAS dummy -0.477(0.451) -2.283(0.191)
ECCAS dummy 0.398(0.581) 3.907(0.012)** CENSAD dummy 0.171(0.733) 3.002(0.068)*
UMA dummy -0.170(0.792) -1.728(0.068)*
Diagnostic tests
Statistics
Adjusted R-squared 0.6175 0.6977 Sargan test 606.56(0.000)*** 701.44(0.000)*** Hansen test 28.65(1.000) 12.38(1.000)
Difference-in-Hansen 23.74(1.000) 23.08(1.000) Observations 948 948 871 923
i. Agglomeration economies
In all the models, the estimation results show significant (at 1 per cent level) agglomeration effects (lagged dependent variable) and its value is high reflecting the strength of the effect. This means that once the inflow of FDI sets in, it should perpetuate itself and attract further FDI since new investors locate their investment next to other multinationals. The reason for this is that FDI is a long-term capital investment that is irreversible in the short-run. This result is consistent with the work of Krugell [29].
ii. Macroeconomic variables First, the catalytic role played by the market size
and macroeconomic stability as captured by growth rate of GDP is evident. The coefficient for real GDP growth is positive and statistically significant in the difference and system GMM models. This means that market-seeking FDI is located in countries where the real GDP growth potential is high since it guarantees profitability of the projects. The results are in line with Elbadawi and Mwega [30], Onyeiwu and Shrestha [18], Krugell [29]
Determinants of Foreign Direct Investment in Africa : A Panel Data Analysis
Globa
l Jo
urna
l of M
anag
emen
tan
d Bu
siness Resea
rch
Volum
e XII
Issu
e X
VIII
Ver
sion
I
2
2012
ea
r
© Global Journals Inc. (US)© 2012 Global Journals Inc. (US)
Y
94
and [31] who show that economic growth is an important determinant of FDI flows to the region.
Second, trade openness has a positive effect on inward FDI in the static panel data models only. Once agglomeration effects are introduced in the model (columns 3 and 4), trade openness becomes statistically insignificant. This result is contrary to the work of Cheng and Kwan [23], Asiedu [3] and Onyeiwu and Shrestha [18].
Finally, existence of natural resources impacts positively on FDI in Africa as shown in the static RE and system GMM models. Countries with natural resources tend to attract resource-seeking FDI than those without. The rationale for this is that a number of resource-abundant countries in Africa neither have the large amounts of capital typically required for resource extraction nor the technical skills needed to extract or sell the raw materials in the world markets. Additionally, the infrastructure facilities for getting the raw materials out of the host country to the final destination need to be created calling for FDI. This result is consistent with the finding in Onyeiwu and Shrestha [18] as well as UNCTAD [2].
iii. Domestic and International FDI-Specific Policy First, the results in Table 5 show that special
FDI regimes per se have no effect on FDI to Africa. The insignificance of this factor may be attributed to poor investment climate and inadequate FDI promotion. Most investment promotion agencies in Africa are very small and poorly funded, which implies that they cannot master the minimum critical mass for basic country image-building and offer after-care services, among others.
Second, the signing of bilateral investment treaties (BITs) have a positive influence on the FDI in static panel data models only. This means that the signing of BITs (especially with major capital exporting countries) sends out a signal to potential investors that the country is generally serious about the protection of foreign investment. In the dynamic panel data models, BITs has no influence on FDI, which is consistent with the work of Hallward-Driemeier [32] and UNCTAD [17]. These papers find a rather weak correlation between BITs and increase in FDI. The possible reason for the weak evidence may be attributed to the quality of the BITs in terms of the provisions embedded.
Finally, double taxation treaties (DTTs) have a positive and statistically significant effect on inward FDI to Africa in all but except difference GMM model. This is consistent with the results of Blonigen and Davis [33] who find a positive relationship between the existing DTTs and FDI. iv. Political governance
The political governance factors are not quite strong in determining the location of the FDI in Africa. First, in all the models (except the system GMM) the
higher the number of years the chief executive officer of a country has been in power the more the FDI to an African country. However, in view of the inconsistency among the models, this variable is inconclusive.
Second, the results on the effect of constitutional limit on the number of years the president can serve before new elections are not conclusive. The direction of effect is positive in all the models (except the system GMM) as expected indicating that countries with constitutional limit on the number of years the president/King can serve before new elections are held tend to attract more FDI compared to other countries. However the effect is not statistically significant for the difference GMM.
Finally, the fact that the president is a military officer does not affect FDI negatively as expected. However, the effects are not statistically significant. The results are in not in line with the finding in Sulivan and Mollick [21], who show that political and civil rights exert a strong negative effect on FDI.
v. Time-specific effects The time-specific effects captured by year
dummies are reported in table 5 models 1 and 2. In generally time-specific effects are positive have been increasing with time. This means that the environment across all African countries has become increasingly conducive to FDI from 2000.
vi. Regional integration agreements (RTAs) In general, the RTAs do not seem to have much
influence on FDI inflow to Africa.
VI. Conclusion
The paper has examined some key determinants of FDI to Africa. Using dynamic panel data framework, the analysis shows that FDI inflows to Africa depend on agglomeration economies, existence of natural resources, real GDP growth, domestic and international FDI policy, among others. Some specific results are noteworthy. First, agglomeration economies are the most significant determinant of FDI inflows to Africa. This result is robust throughout alternative specifications. Second, real GDP growth positively influences the location of FDI. Third, the existence of natural resources tends to attract resource-seeking FDI. Finally, DTTs are FDI-enhancing in most countries. Finally, the environment across all African countries has become conducive to FDI since 2000. This is not surprising given reforms to attract FDI within their respective countries.
The empirical results have some policy implications on efforts to attract FDI in Africa. First, the results show that FDI to Africa is not solely driven by natural resource endowment and that there is a role for the conscious efforts by national and international institutions in promoting investments to Africa.
Determinants of Foreign Direct Investment in Africa : A Panel Data Analysis
© 2012 Global Journals Inc. (US)
95
Globa
l Jo
urna
l of M
anag
emen
t an
d Bu
siness Resea
rch
Volum
e XII
Issue
XVIII
Ver
sion
I
2012
Yea
r

Finally, the efforts to attract FDI seem to be yielding dividends as shown by the positive and increasing time-specific effects. This means that the negative perception about Africa (i.e. the famous African dummy) is slowly disappearing.
References Références Referencias
1. Markusen, J.R., J.R.Melvin, W.H.Kaempfer, K.E. Maskus. International Trade: Theory and Evidence, McGraw-Hill, 1995.
2. UNCTAD, World Investment Report 2010: Investing in a Low Carbon Economy, United Nations Conference on Trade and Development, New York, United Nations Publication, 2010.
3. E.Asiedu, On the Determinants of Foreign Direct Investment to Developing Countries: Is Africa Different?, World Development. 30(1) (2002) 107-119.
4. E.Asiedu, Foreign Direct Investment to Africa: The Role of Government Policy, Governance and Political Instability”, Working paper, University of Kansas (2003).
5. UNCTAD, World Investment Report 1998: Trends and Determinants, United Nations Conference on Trade and Development, New York, United Nations Publication, 1998a.
6.
S.H.Hymer, The International Operations of National Firms,
PhD thesis, MIT (published by the MIT Press
in 1976, 1960.
7.
J.H.Dunning, Trade, Location of Economic Activity and MNE: A Search for an Eclectic Approach, in: H.Ohlin, P.O.Hesselborn, P.M.Wijkman (Eds.),The International Allocation of Economic Activity, Macmillan, London,1977, pp.395-418.
8.
J.H.Dunning, International Production and Multinational Enterprises, George Allen and Unwin, London, 1981.
9.
Z.Q.Wang, N.J Swain, The Determinants of Foreign Direct Investment in Hungary and China”, Weltwirtschaftsliches Archiv. 131 (1995) 359-382.
10. H.P.Lankes, A.J.Venables, Foreign Direct Investment in Transition Economies: The Changing Pattern of Investment”, Economics of Transition. 4 (1996) 331-347.
11. K.Rogoff, C. Reinhart, FDI to Africa: the Role of Price Stability and Currency Instability, International Monetary Fund, Working Paper Series 03/01.
12. F.Noorbakhs, A.Paloni, A.Youssef, Human Capital and FDI Inflows to Developing Countries: New Empirical Evidence, World Development. 29(9) (2001) 1593-1610.
13.
M.R.Agosin, R.Machado, Openness and the Internatioanl allocation of foreign direct investment, Journal of Development Studies.
43(7) (2007) 1234-1247.
14. J.H.Dunning,The European Internal Market Programme and inbound Foreign Direct Investment, Journal of Common Market Studies. 35 (1997) 1-30.
15. E. Helpman, A Simple Theory of International Trade with Multinational Corporations, Journal of Political Economy. 92(1984) 451-471.
16. S. Rose-Ackerman, J.Tobin, Foreign Direct Investment and the Business Environment in Developing Countries: The Impact of Bilateral Investment Treaties, Yale Law and Economics Research Paper No.293, 2003.
17. UNCTAD, Bilateral Investment Treaties in the Mid-1990s, Nations Conference on Trade and Development, New York, United Nations Publication, 1998.
18. S.Onyeiwu, H.Shrestha, Determinants of Foreign Direct Investment in Africa, Journal of Developing Societies.20 (2004) 89-106.
19. E.Neumayer, L.Spess, Do Bilateral investment Treaties Increase Foreign Direct Investment to Developing Countries?, unpublished paper, department of Geography and Environment, London School of Economics, http://129.3.20.41/eps/if/papers/0411/0411004.pdf ,2005.
20. J.W. Salacuse, N.P. Sullivan, Do BITs Really Work?: An Evaluation of Bilateral Investment Treaties and their Grand Bargain, Harvard International Law Journal. 46(1) (2004).
21. A.H.Suliman, V.A.Mollick, Human Capital Development, War and Foreign Direct Investment in Sub-Saharan Africa, Oxford Development Studies. 37(1)(2009) 47-61.
22. P.Kefer, Database of Political Institutions: Changes and Variable Definitions, Development Research Group of the World Bank, 2010.
23. L.K.Cheng, Y.K. Kwan, What are the Determinants of the Location of FDI?: The Chinese Experience, Journal of International Economics. 51(2000) 379-400.
24. B.H.Baltagi, Econometric Analysis of Panel data, Fourth ed., John Wiley, New York, 2008.
25. M.Arellano, B.S.Bond, Some Tests of Specification for Panel Data: Monte Carlo Evidence and Application to Employment Equation, Review of Economic Studies. 58(1991) 277-97.
26. M.Arellano, O. Bover, Another Look at the Instrumental Variable Estimation of Error-Components Models, Journal of Econometrics. 68(1995) 29-51.
27. R.Blundell, S. Bond. Initial Conditions and Moment Restrictions in Dynamic Panel Data Models, Journal of Econometrics. 87(1998) 115-143.
28. J.A. Hausman, Specification Tests in Econometrics, Econometrica. 46(6) (1978) 1251-71.
29. W.Krugell, The Determinants of Foreign Direct Investment in Africa, in: B.M.Gilroy, T.Gries,
Determinants of Foreign Direct Investment in Africa : A Panel Data Analysis
Globa
l Jo
urna
l of M
anag
emen
tan
d Bu
siness Resea
rch
Volum
e XII
Issu
e X
VIII
Ver
sion
I
2
2012
ea
r
© Global Journals Inc. (US)© 2012 Global Journals Inc. (US)
Y
96
W.A.Naudé (Eds.), Multinational Enterprises, Foreign Direct Investment and Growth in Africa, Physica-Verlag Heidelberg, New York, pp.49-71.
30. I.Elbadawi, F.Mwega, Regional Integration and Foreign Direct Investment in Sub-Saharan Africa, in: Z.Iqbal, M.S.Khan (Eds.), Trade Reform and Regional Integration in Africa, IMF/ African Economic Research Consortium conference 1997.
31. A.Bhattacharya, P.Montiel, P., S.Sharma, Private Capital Flows to Sub-Saharan Africa: An Overview of Trends and Determinants, External Finance for Low-
Income Countries, International Monetary Fund, 1997, pp. 207-219.
32. M.Hallward-Driemeier, Do Bilateral Investment Treaties Attract FDI? Only a Bit…and they Could Bite”. World Bank, DECRG, 2003.
33. B.A.Blonigen, R.B.Davis, R.B. Do Bilateral Tax Treaties Promote Foreign Direct Investment?, in: E.K.Choi and J.C. Hartigan (Eds.), Handbook of International Trade, Vo.II, Blackwell, London, 2005, pp.526-546.
Appendix
Table 1 : Countries in the Sample.
Algeria Angola Benin Botswana Burkina Faso Burundi Cameroon Central African Republic Chad Comoros Congo Cote d’Ivoire
Democratic Republic of the Congo Djibouti Egypt Equatorial Guinea Eritrea Ethiopia
Gabon Gambia Ghana Guinea Guinea-Bissau Kenya Lesotho Liberia Libya
Madagascar Malawi Mauritania Mauritius Morocco Mozambique Namibia Niger Nigeria Rwanda Senegal Sierra Leone Somalia Republic of South Africa Sudan
Swaziland Togo Tunisia Uganda Tanzania Zambia
Zimbabwe
Determinants of Foreign Direct Investment in Africa : A Panel Data Analysis
© 2012 Global Journals Inc. (US)
97
Globa
l Jo
urna
l of M
anag
emen
t an
d Bu
siness Resea
rch
Volum
e XII
Issue
XVIII
Ver
sion
I
2012
Yea
r
Related Documents