Determinants of Dividend Initiation by IPO Issuing Firms By Bharat A. Jain Department of Finance Towson University Towson, MD 21252 (410)-704-3542 [email protected] and Chander Shekhar ∗ Melbourne Business School University of Melbourne Carlton, VIC 3053, Australia [email protected] and Violet Torbey School of Business Bond University Gold Coast, QLD 4229, Australia [email protected] JEL Classification: G31, G32 Keywords: Initial Public Offerings, Dividend Policy, Logit Models, Operating Performance, Financial Policy. ∗ Corresponding author. Phone +(613) 9349-8161; Fax +(613) 9349-8414

Welcome message from author
This document is posted to help you gain knowledge. Please leave a comment to let me know what you think about it! Share it to your friends and learn new things together.
Transcript

Determinants of Dividend Initiation by IPO Issuing Firms
By
Bharat A. Jain Department of Finance
Towson University Towson, MD 21252
(410)-704-3542 [email protected]
and
Chander Shekhar∗∗∗∗ Melbourne Business School
University of Melbourne Carlton, VIC 3053, Australia
and Violet Torbey
School of Business Bond University
Gold Coast, QLD 4229, Australia [email protected]
JEL Classification: G31, G32 Keywords: Initial Public Offerings, Dividend Policy, Logit Models, Operating Performance, Financial Policy.
∗ Corresponding author. Phone +(613) 9349-8161; Fax +(613) 9349-8414

2
Determinants of Dividend Initiation by IPO Issuing Firms
Abstract This article studies the determinants of dividend initiations by newly public firms. We compare the post-IPO patterns in sales growth, capital intensity and profit margins between dividend and non-dividend initiating firms to assess whether significant differences exist in their external financing needs. In addition to size, profitability, and investment opportunities, we analyze the impact of variables unique to the IPO market in influencing the probability of post-IPO dividend initiation. We also examine factors influencing the timing of the dividend initiation decision and compare the characteristics of early versus late dividend initiators. We find that industry technological status, venture capital participation, number of uses of IPO proceeds, initial returns, and pre-IPO capital expenditures are significantly related to the probability of post-IPO dividend initiation. In addition, the duration between IPO and dividend initiation increases with venture capital participation, initial returns, investment bank prestige, and use of proceeds for general corporate purposes and decreases with stage of development of issuing firm at the IPO and size of offering.

3
Determinants of Dividend Initiation by IPO Issuing Firms
1. Introduction
Initial public offering (IPO) firms typically go public on the promise of growth thereby
conditioning investors to expect capital gains rather than dividends during the post-IPO phase. In
fact, the offering prospectuses of most IPO issuers usually indicate that the firm is unlikely to pay
dividends in the foreseeable future. IPO issuing firms are usually in their early stages of
development and belong to rapidly growing, technologically oriented industries. They are
expected to invest substantially in areas such as R&D, advertising, and capital expenditures, post-
IPO, in an effort to gain market share and achieve technological dominance in their rapidly
evolving industries. Issuing firms are often cash flow negative at the time of the IPO and are
likely to continue to need substantial external financing during the post-IPO phase to sustain their
high growth rates as well as help finance acquisitions. Further, the incidence of U.S. firms going
public prior to achieving profitability has been growing over time. For instance, Ritter and Welch
(2002) document that the proportion of firms going public with negative earnings in the 12
months prior to the IPO increased from 19% in the 1980s to 37% during the period 1995-1998
and rose to an astonishing 79% during the internet bubble. Similarly, Fama and French (2001)
report a significant dispersion in the profitability of new listings and a tendency for left skewness.
Finally, even if issuing firms are profitable at the time of going public and in a position to pay
dividends after the IPO, they may constrained from such an action as a result of loan agreements.
As such, IPO firms are not expected to pay dividends during the initial post-issue phase.
Fama and French (2001) note that characteristics of dividend paying firms include size,
investment opportunities, and profitability. Extant empirical evidence indicates that in the post-
IPO phase, issuing firms are high on growth and investment opportunities and low on profitability
as demonstrated by strong post-IPO sales and capital expenditure growth, but a pattern of
declining operating performance relative to the year of the IPO (Jain and Kini (1994), Mikkelson,
Partch and Shah (1997)). As a consequence of their growth opportunities and low profitability,
capital constrained IPO firms are likely to utilize all available internal capital to finance their
investment opportunities. It is therefore, not surprising that one of the reasons for the declining
propensity of U.S. corporations to pay dividends is attributed to the large number of new firms
among listed companies (Fama & French (2001)).
At some point during their post-IPO phase, however, IPO firms should reach a steady
state in their growth patterns and therefore be in a position to consider initiating dividends. Fama
4
and French (2001) report that 25% of new lists that survive eventually start-paying dividends.
The decision to initiate dividends, however, is likely to be contingent on several factors such as
ability to generate and sustain free cash flows and investor reaction/expectations. The recent case
of Cisco Systems is illustrative in this regard. The shareholders of the company voted ten to one
against a proposal requiring the firm to pay dividends, despite the fact the company had
accumulated approximately $21 billion of cash on its balance sheet and faced an unfavorable
investment environment in the technology sector. Further, even when IPO issuing firms are in a
position to initiate dividends, they may instead elect to repurchase shares thereby preserving
financial flexibility with regard to future dividend payments (Jagannathan, Stephens, and
Weisbach (2000)).
A few recent studies have, however, directly addressed issues related to dividend
initiations by IPO firms. They have primarily focused on the valuation effects (Lipson, Maquieira
and Megginson (1998), McCaffrey and Hamill (2000) and Kosedag and Michayluk (2000)). For
instance, Lipson et al. (1998) suggest that initiation occurs when managers believe that the
dividends can be sustained by future earnings, and that managers may use initiation as a means to
differentiate their firm from other similar, newly public firms. Kosedag and Michayluk (2000)
compare market reaction to dividend initiating IPOs with dividend initiating reverse-LBOs and
find that the positive reaction is confined to dividend initiation by the IPO group. McCaffrey and
Hamill (2000), using UK data, find a positive market reaction to dividend initiations by 270 firms
(leading them to claim support for the signaling hypothesis), but also report that 90% of the
dividend paying firms initiate dividends within the first year of going public. Bessler, Murtagh
and Siregar (2001) study dividend policies of bank IPOs and find that although by the tenth year
(after the IPO) two thirds of banks pay dividends, approximately 30% of the banks initiate
dividends within the first twelve months of going public. An earlier study by Michaely and Shaw
(1994) reports that approximately 22% of IPO firms start paying dividends within the first three
years of going public. Further, Lipson et al. (1998) report that the average time to dividend
initiation in their sample of IPO firms is about two and a half years. Although collectively these
results suggest that the timing of the dividend decision may be relevant, none of the studies
explore this issue in detail.
In this study, we attempt to gain an understanding of the factors that influence both the
decision to initiate dividends as well as the timing of this decision for IPO issuing firms. Focusing
on factors that influence the probability of dividend initiation by IPO firms provides an
understanding of the impact of variables unique to the IPO market on financial policy choices of
entrepreneurial firms. In addition, by focusing on the timing of the dividend decision, we attempt

5
to identify characteristics of early (within twelve months of going public) versus late (after twelve
months of going public) dividend payers as well as factors that influence the timing of the
decision to initiate dividends.
Our results indicate that approximately 21% of IPOs that survive ten years after the IPO
initiate dividends. In addition, we find that for the most part, the decision to initiate dividends
occurs early with approximately 71% of dividend initiations in our sample occurring within the
first 12 months of going public. Approximately 81% of dividend firms were profitable at the time
of the IPO. Regarding dividend initiation, our main results indicate that the probability of
dividend initiation declines with number of uses of IPO proceeds, initial returns, risk of the issue,
venture capital participation, membership in emerging industries, and pre-IPO capital expenditure
intensity. The likelihood of dividend initiation, however, increases with the stage of development
of issuing firm, and size of the offering. Further, the duration between IPO and dividend initiation
increases with venture capital participation, initial returns, investment bank prestige, and use of
proceeds for general corporate purposes and decreases with stage of development of issuing firm
at the time of the IPO and size of the offering. In conjunction with these results, we find few
significant differences in firm and offering characteristics between early and late dividend
initiators – they differ from each other only in the number of planned uses of proceeds declared in
the prospectus and in the capital intensity at the IPO stage.
We also study the post-IPO patterns in sales growth, capital expenditures, leverage, and
profitability for both dividend initiating and non-dividend initiating firms. In terms of post-IPO
performance, we find that the dividend group exhibits significantly higher post-IPO operating
performance compared to similar non-dividend firms. This result is generally consistent with the
notion of dividend policy being used to signal better performance in the future. However, the one,
two, and three year, post-IPO sales growth rate of the dividend group is significantly lower than
that of similar non-dividend firms but the four year growth rate is not significantly different.
Finally, there is no significant difference between the dividend and similar non-dividend firms on
post-IPO capital expenditure growth rate or leverage. Taken overall, the results support the notion
that the likelihood of dividend initiation depends not only on the more obvious factors such as
profitability, investment opportunities, and size, but also on aspects related to the IPO process.
Further, the results indicate that the post-IPO investment opportunities for both dividend and non-
dividend firms are strong and therefore dividend initiation is not related to declining growth
prospects.

6
The remainder of the paper is organized as follows. Section 2 describes the sample.
Section 3 provides details of variable selection and methodology. The results are discussed in
Section 4. Finally, Section 5 concludes the paper.
2. Sample Description
Our initial sample consists of 5151 IPOs issued during the period 1990-1998 and
identified from Securities Data Corporation’s (SDC) New Issues database. Consistent with most
IPO studies, we exclude financial firms and unit offerings, resulting in a sample of 3503 IPOs.
Next, we exclude best effort issues and require that issuing firms be listed on CRSP immediately
after the IPO. These two restrictions further reduce the sample to 1640 IPO firms. Each firm is
tracked on CRSP from the IPO date until the end of year 2000 or the delisting date (whichever is
earlier) to determine whether the firm initiated an ordinary regular cash dividend. If the IPO firm
initiated an ordinary regular cash dividend, the number of additional dividends paid after the
initiation is also noted. For issuing firms that survived until the end of year 2000 and did not
initiate an ordinary cash dividend, we go back to the IPO date and search whether the firm made
any other type of distribution such as stock splits and stock dividends, liquidating dividends,
exchanges and reorganizations, subscription rights, and notation of issuance in the post-IPO
period. Our search for post-IPO distributions results in three categories of issuing firms; (1)
issuers who initiated regular cash dividends, post-IPO, (2) issuers who initiated distributions other
than regular cash dividends, post-IPO and (3) issuers who did not initiate any form of
distributions from the IPO date until the end of year 2000 or delisting date, whichever is earlier.
From the sub-sample of 111 issuers that initiated ordinary regular cash dividends we
exclude 12 issuers where the dividends were recorded as non-recurring or extra/special. This
results in a final sample of 1628 IPO issuers containing 99 dividend initiating firms and 1529
non-initiating firms. In order to test for robustness of our results we repeat the analysis with two
different specifications for the comparison sample of non-dividend initiating firms. These two
alternative specifications are; (1) non-dividend group consisting of IPO firms that did not initiate
any form of post-issue distributions and (2) an industry and size matched sample of non-dividend
firms. In both instances, the results are qualitatively similar to those reported here and are not
reported for purposes of brevity, but are available from the authors.
The final sample, therefore, includes 99 of the 1628 IPOs (6.08% of the total) that
initiated dividends in the post-IPO period. Overall, 913 of the 1628 IPOs representing 56.08% of
the sample were profitable prior to going public. Further, 81% of initiating firms were profitable

7
prior to the IPO. Therefore, firms that are unprofitable at the time of the IPO have an extremely
low propensity to initiate dividends during the post-IPO phase. We also evaluate the timing of the
dividend initiation for the 99 dividend firms in our sample. The mean (median) time in months
from the IPO to dividend initiation is 15.61(6.00) months. Further, approximately 71% of
dividend initiating IPOs (70 firms) initiated dividends within 12 months of going public.
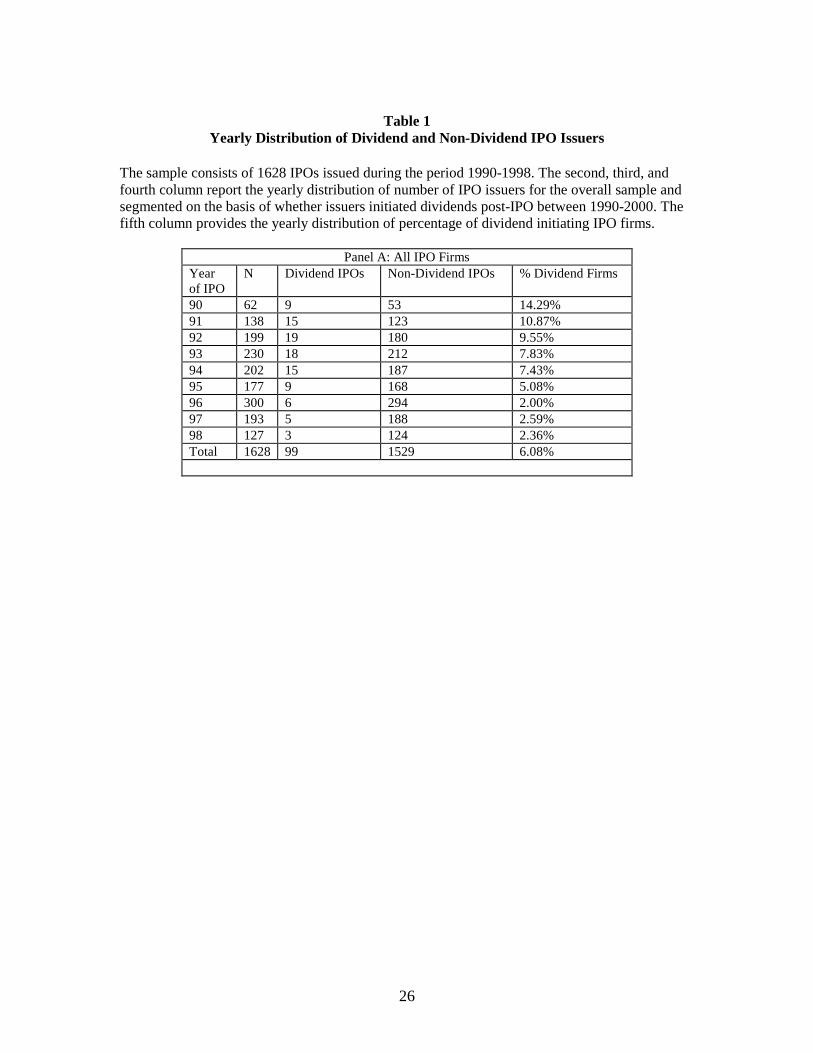
Table 1 provides the yearly distribution of the 1628 IPO issues in the sample. The results
are reported for the overall sample and segmented by dividend versus non-dividend IPO firms.
The full sample indicates significant variation in the volume of IPOs issued each year, with the
largest number of issues in 1996 followed by 1993 and the lowest number of issues in 1990.
Overall, 6% of issuers in the sample initiated dividends in the post-IPO period. Not surprisingly,
the percentage of issuers in each year that subsequently initiate dividends increases with the time
interval between the IPO year and the end of year 2000.
---Table 1 about here ---
For instance, 14% of 1990 issuers initiated dividends during the 10 year post-IPO period.
Similarly, 5% of 1995 IPO issuers initiated dividends in the five year post-IPO period. Further,
21% of surviving 1990 IPO issuers in our sample initiated dividends in the ten year post-IPO
period − indicating that one in five survivor IPO firms initiate dividends during the ten year post-
IPO window − a result that is consistent with Fama and French (2001) who find that
approximately 25% of survivor firms among new lists eventually initiate dividends.
3. Variable Selection and Methodology
3.1 Description of Variables
Industry Technological Focus
Firms going public come from a diverse set of industries that can be broadly classified as
emerging versus mature. Issuers in emerging, high technology industries face an innovation
oriented environment, with no dominant technologies, shorter product life cycles, evolving
product markets, and criticality of knowledge capital, Liu (2000). On the other hand, issuers in
mature industries face a stable economic environment, with well-developed product markets and
established industry leaders. Unlike mature industries, high technology industries are more
susceptible to shocks as a result of changes in technology, government policy or supply and
8
demand conditions thereby creating additional demand for external financing as firms in the
industry strive to adapt to structural changes occurring in the industry.
In order to capitalize on industry growth opportunities and finance new and emerging
technologies and product market strategies, issuing firms in high technology industries are likely
to need substantial external financing, post-IPO. Further, financing growth opportunities affects
the variability and permanence of a firm’s cash flow stream which in turn influences its financial
policy choices. Issuing firms in emerging industries need to keep their debt and borrowing
capacity within manageable limits so as to be in a strong position to capitalize on both internal
and external growth opportunities. Therefore, issuing firms in high technology industries are less
likely to distribute dividends post-IPO and instead attempt retain available internal funds for their
investment needs. By contrast, issuing firms in more mature industries are likely to be presented
with fewer investment opportunities and are likely to be in a position to generate free cash flows
which may then be paid to shareholders as dividends. Finally, issuing firms in emerging
industries have a higher propensity to indulge in substantial stock option grants for incentive pay,
recruitment, and retention of key employees. Therefore, even if IPO firms in emerging industries
are in a position to distribute cash to shareholders they are likely to prefer a repurchase program
over dividends. The above discussion leads us to expect a negative relationship between industry
technological status and probability of post-IPO dividend initiation.
Venture Capitalist Involvement
Venture capitalists (VCs) generally demonstrate industry and product market preferences
in the selection of firms they decide to finance. VCs, typically seek young, high growth, risky
companies that have the potential to produce breakthrough products and services and achieve
strong growth. Typically, they tend to make their investments at an early stage of development
when the prospects of success are far from certain. In addition to providing financing, VCs tend
to play an active role in the firm(s) by participating in activities such as strategic and operational
planning, marketing, personnel selection, supplier management, capital structure choices and
other facets of managerial decision-making as their portfolio companies evolve from start-ups to
public corporations. VCs, therefore, have an influential role in the strategic evolution of the
company and its investment and financing decisions. In addition, their investment horizon is
generally not long term and they view the IPO as a mechanism to facilitate their eventual exit,
with the investment objective being the realization of capital gains either at the IPO or shortly
thereafter, rather than collecting on a stream of dividends out into the future. Recent empirical
evidence supports the notion of “early exit” by the VCs - as noted by Field and Hanka (2001),
venture capitalists sell more aggressively than other officers on the expiration of the lock-up

9
period after an IPO. Additionally, Allen, Bernardo, and Welch (2000) show that, in general, the
presence of any shareholders “…who can mitigate the agency/information concerns but who do
not value dividends, we would expect target companies to substitute re-investment, share
repurchases, or other means of payout for dividend payments.” For newly public firms, the
venture capitalists fulfill this role during the early years, leading us to expect that venture capital
involvement is negatively related to the probability of post-IPO dividend initiation.
Uses of IPO proceeds
Issuing firms are required to specifically identify the various planned uses of the IPO
proceeds as well as the amount to be allocated for each use in the IPO offering prospectus. The
usual categories of uses of IPO proceeds cited in offering prospectuses include expenditures for
items such as general corporate purposes, acquisition financing, marketing and sales, product
development/R&D, retiring/refinancing debt, etc. The planned uses of IPO proceeds can provide
useful insights regarding aspects of financial and investment policies that in turn influence the
firm’s ability to pay dividends. The number of planned uses of IPO proceeds can be viewed as a
measure of the extent of the issuing firm’s financing needs. Therefore, firm’s that indicate a
larger number of uses of the IPO proceeds are generally likely to re-invest all their earnings, post-
IPO and in addition turn to the external capital markets to meet any unfulfilled needs. By contrast,
firms with a smaller number of planned uses for the IPO proceeds are less likely to require
additional rounds of external financing. This lack of dependence on external financing may flow
into the firms’ dividend policies and therefore, we expect a negative relation between the number
of uses of the IPO proceeds and the probability of dividend initiation.
In addition to the number of planned uses of the IPO proceeds, issuing firms also specify
their plan regarding primary use of the IPO proceeds. Information regarding the primary use of
IPO proceeds provides an indication of the firm’s strategic intent in areas such as capital structure
choices, growth strategy and product market strategy. For instance, issuing firms that indicate that
the primary use of the IPO proceeds is for acquisitions are signaling their intent to pursue an
aggressive growth strategy through acquisitions rather than internal growth. Aggressive serial
acquirers are likely to retain all their earnings and in addition, if required turn to the capital
markets for additional financing. Similarly, issuers that plan to use the IPO proceeds to rebalance
their capital structure or reduce leverage are less likely to seek external financing and are in a
better position to initiate dividends. Therefore, we expect the probability of dividend initiation,
post-IPO to be related to the primary use of the IPO proceeds.
10
Stage of Development
Issuing firms tend to go public at various stages of their development. Some firms tend to
go public at a relatively early, developmental stage, while still not profitable, whereas others go
public after several years of operations and after attaining profitability or being very close to
attaining profitability. Firms going public relatively early face considerable uncertainty regarding
future viability and the ability to attain and sustain profitability. These uncertainties arise from
factors such as extent of product demand, technological risk, access to distribution channels,
ability to secure future financing, and sustainability of growth rates. Firms going public at a later
stage in their development are either profitable or are in a position to demonstrate a clear path to
profitability and many of the above uncertainties have been resolved or minimized. Such firms
are likely to be in a better position to initiate dividends post-IPO. Therefore, we expect a positive
relationship between the stage of development at the time of the IPO and probability to initiate
dividends post-IPO.
Size
As pointed out by Fama and French (2001) dividend payers are significantly larger than
non-dividend payers. Kahle (2002) also notes that size is a proxy for financing costs and that
larger firms have less information asymmetry, stronger cash flows and lower financing costs.
Therefore, we expect that the probability of dividend initiation is positively related to size of the
firm.
Leverage
The extent of debt on the balance sheet is likely to have a significant impact on the IPO
firm’s dividend initiation decision. Smith and Watts (1992) argue that firms with greater growth
opportunities will tend to rely less on debt financing. Therefore, we expect a positive relationship
between leverage and the probability of dividend initiation by IPO firms.
Capital Expenditures
Investment opportunities clearly determine the probability of dividend initiation by IPO
firms. The investment opportunities available to the IPO firm can be assessed by the extent of
managerial commitment to capital expenditures. Prior empirical research in the IPO market has
documented that issuing firms substantially increase their capital expenditures post-IPO. Jain and
Kini (1994) find that even after adjustment for industry effects, IPO firms have substantially
higher growth in post-IPO capital expenditures in comparison to similar firms. Bommel and
Vermaelen (2003) report that ceteris paribus, IPO firms that receive positive feedback from the
market during the process of going public will spend on average 16.9 % more on capital
11
expenditures compared to companies that receive negative feedback. Kahle (2002) argues that
firms with high capital expenditures have better investment opportunities and less free cash flow
and therefore are less likely to be in a position to initiate dividends. Lower capital expenditures,
on the other hand, leads to lower external financing needs and therefore results in a higher
likelihood of dividend payments.
3.2 Methodology
Multivariate logistic regression analysis is used to predict the probability of dividend
initiation by an IPO firm in the post-IPO period. The basic form of the logit model is as follows:
Prob (Dividend Initiation) = β0 + β1TECH + β2VC + β3UNDPR +β4 STAGE + β5NUMUSES
+ β6ACQ + β7REF +β8 GEN + β9DEBT +β10CAPEXA + β11LAMT + β13 RISK + β14RANK
The dependent variable is the probability that an IPO issuing firm will initiate dividends,
post-IPO. Using the SDC definition of high- technology industries, the IPO sample is segmented
into two groups based on whether the issuing firm belongs to a high or low tech industry. The
variable TECH takes on the value 1 if the IPO firm belongs to a high technology industry and 0
otherwise. The variable VC represents venture capital participation and takes on the value 1 if
the issuing firm is VC- backed and 0 otherwise. The variable, NUMUSES measures the number
of uses for the IPO proceeds listed by the firm in its IPO prospectus. Three dummy variables are
constructed to measure the primary use of the IPO proceeds as follows - ACQ takes on the value
1 if the issuing firm primarily intends to use the proceeds for acquisitions and 0 otherwise, REF
takes on the value 1 if the primary use of proceeds is intended for debt reduction/refinancing and
0 otherwise, and finally GEN takes on the value 1 if the primary use of proceeds is for general
corporate purposes and 0 otherwise. The stage of development of the issuing firm is proxied by
pre-IPO profitability. Firms that are not profitable at the time of the IPO are considered as
developmental stage firms while those profitable at the IPO are more mature, later stage firms.
The variable STAGE takes on the value 1 if the IPO issuing firm attains profitability prior to the
IPO and 0 otherwise.
Initial returns are measured by the variable UNDPR expressed as the percentage
difference between market price at the end of the first day of trading and the offer price. The
initial returns are a measure of the market’s reaction to the offering and a stronger reception
should lead to higher post-IPO investment activity and therefore lower probability of dividends.
Leverage is represented by the variable DEBT measured as the long term debt divided by total
assets. CAPEXA is the capital expenditure divided by the total assets in the year of the IPO.
Finally, we include offer size, investment bank prestige, and risk of the issue as control variables.
These three variables have been widely used in the IPO literature. The variable LAMT proxies for

12
size and is measured as the the gross proceeds raised at the IPO. The variable RISK is measured
as the standard deviation of the first thirty days returns in the aftermarket. Our proxies for size
and risk are generally consistent with the IPO literature (see for example, Ritter (1991), Jain and
Kini (1994,1999)). Consistent with the previous literature, we use the Carter, Dark and Singh
(1998) nine-point investment banker prestige ranking system to measure investment bank
prestige (RANK). In results not reported in the paper, we also evaluate the impact of additional
control variables such as managerial ownership retention with qualitatively similar results. The
overall model fit is assessed by the likeliihood ratio and the significance of the individual
coefficients is assessed by the p-values.
4. Results
4.1 Summary statistics
In Table 2, the industry distribution of IPO firms in the sample is reported. The industry
groupings are defined on the basis of two digit SIC codes and the industries are listed in order of
decreasing number of IPOs that occurred in each industry during the sample period.
--Table 2 about here --
The largest number of IPOs from a particular industry occurred in the Advertising and Business
Services sector with 403 firms or 25% of the sample drawn from this sector. The next two
highest IPO industries are Electronics and Communication with 146 IPOs (9% of the sample) and
Medical and Photo Equipment with 139 IPOs (8.5% of the sample). The last column of Table 2
reports the proportion of dividend initiating IPO firms in each industry. The distribution of
proportion of dividend initiating IPO firms varies from a low of zero percent for the Motion
Pictures /Entertainment Services industry to a high of 36% for the Metal Products industry. Three
other industries exhibit a relatively high proportion of dividend initiating firms - Utilities (30%),
Transportation and Shipping (16.28%), and Mining/Construction (14%). As expected, the above
results indicate that the propensity to pay dividends varies depending on the specific industry
environment.
Table 3 provides a comparison of IPO firm and offering characteristics for dividend
versus non-dividend IPO firms. The results indicate that dividend firms raise significantly higher
proceeds at the IPO with a mean(median) value of $81.69($50.40) million compared to a

13
mean(median) of $32.02($24.00) million for the non-dividend group and the difference is
statistically significant at the 0.01 level.
-- Table 3 about here --
By contrast, the initial returns of the dividend group are significantly lower than that of the non-
dividend group. Since initial returns have been associated with the extent of information
asymmetry surrounding the prospects of the issuing firms, these results are indicative of lower
uncertainty at the IPO for the dividend group. There is no significant difference between the two
groups on managerial ownership retention in the post-IPO firm. Dividend firms have significantly
lower planned uses of the IPO proceeds compared to the non-dividend group. Further, the
dividend group is characterized by significantly higher investment banking prestige and
significantly lower risk of the issue compared to the non-dividend group.
The results in Table 3 also indicate significant variation between dividend and non-
dividend IPOs on firm characteristics. Although the dividend firms have significantly higher
levels of total assets, sales, and leverage at the time of going public compared to non-dividend
IPO firms, the capital intensity at the time of the IPO (measured as the capital expenditures
divided by total assets) is similar across the two groups. Dividend firms are also significantly
more profitable at the time of going public compared to non-dividend firms. Further, there are
significant differences between dividend and non-dividend IPO firms on aspects such as industry
technological status, venture capitalist participation, and choice of exchange listing. For instance,
13% of dividend firms are in high technology industries compared to 44% of non-dividend firms.
Additionally, 13% of dividend IPO firms attracted venture capital financing compared to 46% for
non-dividend firms. Therefore, the evidence indicates that non-dividend firms are more likely to
belong to high technology industries and attract venture capital financing compared to dividend
firms. There are also substantial differences between the two groups in terms of exchange listing
-- 40% of dividend firms list on NYSE compared to only 5% of non-dividend firms. Similarly,
82% of non-dividend firms list on NASDAQ compared to 53% of dividend firms.
Finally, in results not reported here, we also gauge investor interest in the proposed IPO
of dividend versus non-dividend firms by examining the relation between final IPO offer price to
the anticipated offer price in the preliminary prospectus. The results suggest that 9.47 % of
dividend firms are priced above the initial filing range compared to 10.90 % for the non-dividend
group. Almost two-thirds (66.3 %) of issuers in the dividend group were priced within the initial
filing range compared to 71.34 % for the non-dividend group. Similarly, about one-quarter
14
(24.21 %) of issuers in the dividend group were priced below the filing range compared to
17.36% for the non-dividend group. Thus, ex-ante there does not appear to be significant
differences in investor reception to IPOs from dividend versus non-dividend firms.
We also compare the characteristics of dividend versus non-dividend IPOs for a sub-
sample of 913 IPOs that were profitable in the year of the IPO. This sub-sample represents
issuing firms that are in a position to initiate dividends in the post-IPO period. However, only 80
firms representing 9% of firms that are profitable at the time of the IPO initiate dividends. We
find similar significant differences between dividend and non-dividend firms among issuers
profitable at the time of the IPO as was documented for the overall sample. For instance, the pre-
IPO profitable dividend group raises significantly higher proceeds at the IPO, is marketed by
more prestigious investment bankers and is more leveraged compared to the non-dividend group.
IPO firms can initiate dividends soon after the IPO (within the first year of going public)
or wait for several years after the IPO before initiating dividends. Approximately 71% of the
dividend firms in our sample elected to initiate dividends within 12 months of going public.
Firms that initiate dividends early usually state their intent to pay dividends in the offering
prospectus. On the other hand, late dividend initiators indicate an inability to initiate dividends
within the foreseeable future in the offering prospectuses. We compare the characteristics of early
versus late dividend initiators to determine if certain offering or firm characteristics can explain
the timing of the dividend decision. The results are reported in Table 4. We find that apart from
the number of uses in the IPO proceeds, early and late dividend initiators are indistinguishable.
The mean (median) number of uses of proceeds for the early dividend group is significantly lower
than that of the late dividend group.
--Table 4 about here-

15
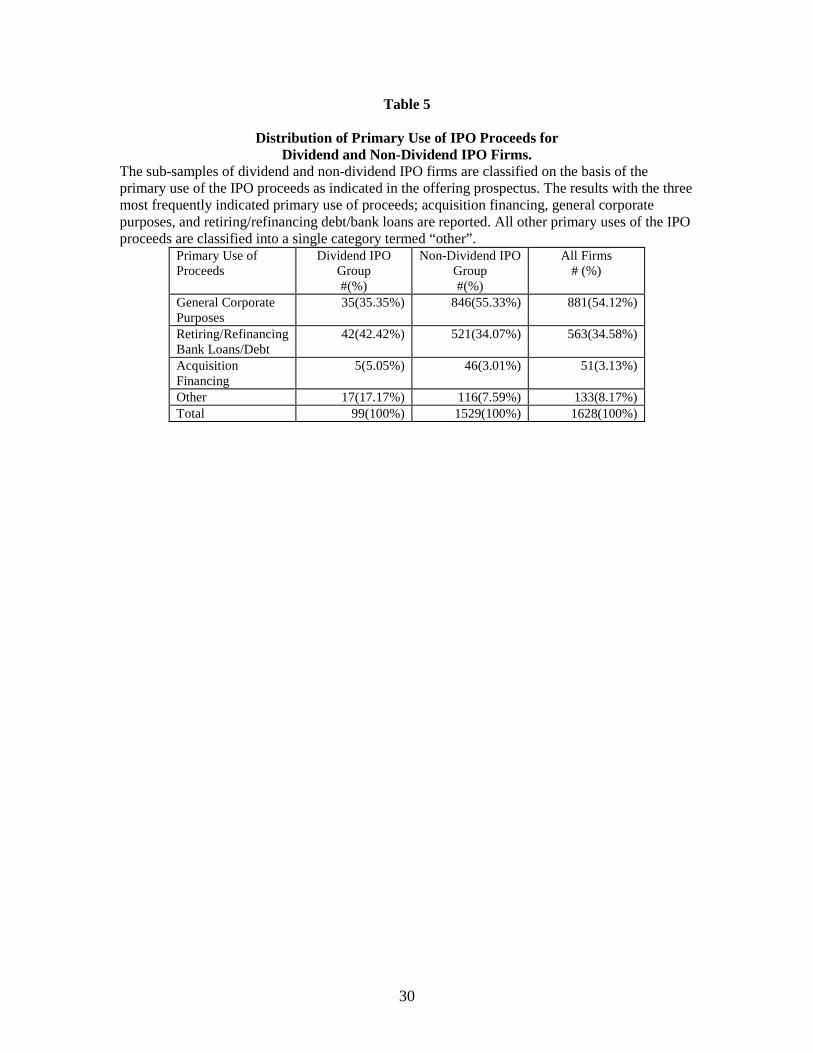
4.2 Uses of Proceeds
Table 5 describes the distribution of the planned primary use of IPO proceeds as
indicated by the issuing firm in the offering prospectus. The results are reported for the overall
sample and also segmented by dividend versus non-dividend firm. The IPO issuing firms are
segmented on the basis of the three most commonly cited primary uses of the IPO proceeds -
acquisition financing, general corporate purposes, and retiring/refinancing debt (both bank loans
and other debt).
-- Table 5 about here –
All the remaining primary uses of proceeds are included in the ”Others” category. The
results in Table 5 indicate that approximately 54 % of issuing firms cite general corporate
purposes as the primary use of IPO proceeds while 35 % cite retiring/refinancing debt, 3 %
acquisition financing and the remaining 8 % cite reasons included in the “Other” category. The
comparison of the primary uses of IPO proceeds for dividend versus non-dividend firms reveal
significant differences between the two groups - 55% of non-dividend firms cited general
corporate purposes as the primary use of IPO proceeds compared to 35% for dividend firms. On
the other hand, the most commonly cited use of the IPO proceeds for the dividend group was
retiring/refinancing bank loans/debt with 42% issuers citing this reason compared to 34% for the
non-dividend group. The results indicate that there is little difference in the percentage of issuers
that cite acquisition financing as the primary use of the IPO proceeds for the dividend and non-
dividend group.
4.3. Post-IPO Sales growth, Capital Expenditure growth and Profitability
In this section, we explore the differences between dividend and non-dividend IPO firms
on their post-IPO sales growth, capital intensity, leverage, and operating performance. The
comparison is made over several time windows measured related to the year of the IPO. The
performance of the dividend group is compared with a sample of all non-dividend IPOs as well as
with an industry and size matched sample of non-dividend IPOs. The matched sample
comparison allows us to compare the post-IPO performance of dividend firms versus similar non-
dividend firms. The matched sample is constructed by identifying a matching non dividend firm
for each dividend firm in the sample on the basis of industry and size of offering. Therefore, for

16
each dividend IPO firm, a matching non-dividend firm in the same four digit SIC code and
closest to the dividend firm in terms of IPO offer size is identified. In instances where a suitable
four digit match is not available, we identify a similar firm in the same three-digit SIC code.
The results of the comparison of post-IPO sales growth, capital expenditures growth and
change in operating performance for the dividend group versus non-dividend group and industry
and size adjusted non-dividend group is reported in Table 6 for several post-IPO time windows.
The year 0 represents the fiscal year of the IPO while years 1, 2, 3, and 4 represent post-IPO
fiscal years.
-- Table 6 about here –
In panel A, a comparison of the sales growth rate of the dividend and non-dividend group
is provided. The median percentage change in sales growth is reported for years 1, 2, 3,and 4
relative to year 0 for the two groups. The median one, two, three, and four year post-IPO sales
growth rates for the dividend group are 11%, 24%, 43% and 71% compared to 35%, 68%, 103%,
and 129% respectively, for the non-dividend group and the differences are statistically significant
for all four time windows. Therefore, while dividend and non-dividend IPO firms both
demonstrate strong post-IPO sales growth, the non-dividend group demonstrates significantly
higher post-IPO growth rates. The comparison of the post-IPO sales growth rate for the dividend
and matched sample of non-dividend firms is essentially similar with one exception. While the
dividend group has significantly lower one, two and three year growth rates compared to similar
non-dividend firms, the four year growth rate for the two groups is not significantly different.
The question of whether dividend firms tend to have lower post-IPO capital expenditures
compared to non-dividend firms is addressed by comparing the post-IPO capital expenditure
growth rate. In panel B, the median percentage change in capital expenditure intensity (measured
as capital expenditure over total assets) is reported for dividend and non-dividend groups. The
results indicate that while both dividend and non-dividend firms demonstrate substantially high
capital expenditure growth rates, for the most part, the capital expenditure growth of the dividend
group is significantly lower than the non-dividend group. However, the comparison with the
matched sample indicates that there is no significant difference in capital expenditure growth
rates between dividend and similar non-dividend firms.
In panel C, the results indicate that except for the first year after the IPO, both dividend
and non-dividend firms increase their leverage in the post-IPO years. On the other hand, there is
no evidence to indicate that the two groups significantly differ in terms of the extent of leverage.

17
We also compare the post-IPO profitability of dividend and non-dividend firms to assess whether
significant differences exist. Panel D of Table 6 provides a comparison of the operating return on
assets. Consistent with the existing literature on post-IPO performance, both dividend and non-
dividend IPO firms demonstrate a decline in post-IPO operating performance relative to the IPO
year. However, the decline in post-IPO operating return on assets is significantly lower for the
dividend group compared to the non-dividend group for all time windows. For instance, the
median change in operating return on assets for the years 1, 2, 3, and 4, relative to year 0 are -
0.36%, -2.03%, -5.05%, and -10.38% for the dividend group and -6.50%, -11.41%, -15.29%, and
-17.68% for the non-dividend group and the difference is statistically significant over all time
windows. The comparison with the industry matched sample is essentially similar.
In panel E, the median change in operating return on sales for the dividend and non-
dividend groups is provided. The results indicate that at least in the years +1, +2, +3 relative to
year 0, the dividend group shows no decline in operating performance. The dividend group does,
however, demonstrate a significant decline in operating performance over a four year window
relative to the IPO year. The non-dividend group, on the other hand, demonstrates a significant
decline in operating performance in each of the four time windows. Further, the dividend group
demonstrates significantly superior performance relative to the matched sample of non dividend
IPO firms in each of the four post-IPO time windows.
Overall, the results indicate that dividend IPO firms grow at a slower rate and exhibit
superior operating performance relative to the non-dividend group in the post-IPO years.
However, both dividend and non-dividend firms have strong post-IPO investment opportunities
and the growth rates in capital expenditures for the two groups are not significantly different for
all post-issue time windows.
4.4 Estimation of Logit Models
To identify the variables that significantly influence the probability of post-IPO dividend
initiation, we estimate several logit models. These results are reported in Table 7. All models
include a common set of three control variables; LAMT, RISK and RANK. The estimated log
likelihood coefficients, p-values and significance levels for each variable are reported along with
the likelihood ratio for the overall model.
-- Table 7 about here –
In model 1, the impact of industry technological orientation and venture capital
participation on the likelihood of post-IPO dividend initiation is explored. In addition to the three

18
control variables, the industry technological focus variable (TECH) and the participation of
venture capital in an IPO firm (VC) are included as explanatory variables. The coefficient of
TECH is negative and significant (-0.7424, p-value=0.024), indicating that the probability of
dividend initiation declines if the issuing firm belongs to a high technology industry. The
variable VC is also negative and significant (-1.2290, p-value=0.0002) indicating that the
probability of dividend initiation post-IPO declines with VC participation. The coefficient of
LAMT is positive and significant indicating that larger offerings (and by implication, larger
firms) have a higher probability of initiating dividends. On the other hand, the coefficient of
RISK is negative and significant indicating lower probability of dividend initiation by riskier
issues. The control variable investment bank prestige is positive but not statistically significant.
In model 2, we examine the impact of industry technological conditions as well as the
issuer’s indicated uses of the IPO proceeds on the probability of post-IPO dividend initiation. In
addition to the independent variables in model 1, we include the number of uses of the IPO
proceeds (NUMUSES) and the three variables that measure the most commonly cited primary use
of the IPO proceeds (ACQ, GEN, REF). Consistent with model 1, both industry technology status
and VC participation remain negative and significant. The coefficient of the variable NUMUSES
is negative and significant (-0.4594, p-value=0.0263) indicating that the probability of dividend
initiation increases with the decrease in the number of uses of the IPO proceeds. The
disaggregated variables measuring the various primary uses of the IPO proceeds, however, are
statistically insignificant, suggesting that such classification by the issuer in the prospectus has no
impact on the future likelihood of dividend initiation.
In model 3, in addition to TECH, VC, and NUMUSES, variables such as developmental
stage of issuing firm (STAGE), leverage (DEBT), pre-IPO capital expenditure intensity
(CAPEXA) and initial returns at the IPO (UNDPR) are included as explanatory variables.
Consistent with the earlier models, TECH, VC, and NUMUSES are significantly negatively
related to the probability of dividend initiation. Although the likelihood of dividend initiation
increases with the firm leverage, the results are not significant. The coefficient of UNDPR and
CAPEXA is negative and significant. Further, the coefficient of STAGE is positive and
significant indicating probability of dividend initiation increases with stage of development of
issuing firm.
Model 4 includes all the independent variables that were found to be significant in the
first three models. The direction of the relationship and significance of the variables are
consistent with the earlier results, supporting the notion that these variables influence whether a
newly public company chooses to initiate dividends or not. Finally, in model 5, we include all

19
the independent variables that are used in Models 1-4 to test for their significance. As evident
from the results in the last column of Table 7, our basic conclusions hold as all significant
variables retain their directional influence as well as their statistical significance.
Considered overall, the logistic regressions presented here indicate that the probability of
dividend initiation declines if the IPO issuer belongs to a high technology industry or receives
venture capital financing. Further, the probability of dividend initiation decreases with the
increase in the number of uses of the IPO proceeds, pre-IPO investment in capital expenditures,
initial returns at the IPO and the risk of the issue. Finally, the probability of dividend initiation
increases with the stage of development of the issuing firm and size of the offering. Factors such
as pre-IPO leverage and investment bank prestige are unrelated to the probability of dividend
initiation of newly public companies. In addition, in results not reported here but available with
the authors we re-estimated the logit models described in Table 7 by confining the dividend
sample to early dividend paying firms only. The results are qualitatively similar to those reported
above.
4.5. Timing of Dividend Initiation Decision
Hazard analysis methodology is employed to identify factors influencing the timing of
the dividend initiation decision by IPO issuing firms. Hazard analysis is a statistical technique
that has been employed to study the occurrence and timing of events (Allison 1984; LeClere
2000). An event represents a change of state and the duration of time between states is referred to
as failure or event time (LeClere 2000). The event of interest in our application is that of dividend
initiation. Hazard analysis is not only capable of predicting whether an event will occur or not but
also when the event occurs. The primary benefits of hazard analysis over regression analysis or
qualitative response models lies in their ability to explicitly account for time and handle censored
observations and time varying covariates (LeClere 2000; Shumway 2001). Censoring refers to the
situation where the event of interest has not as yet occurred at the end of the observation period or
the firm has left the sample before the end of the observation period for reasons other than the
event of interest. Therefore, the time spent by the firm or individual in the origin state is
incomplete and the duration until event is known for only a portion of the sample (LeClere 2000).
Specifically, in our application, censoring occurs for firms that do not initiate dividends until the
end of the tracking period or leave the sample as a result of being acquired or delisted. Survival
analysis models use estimation techniques that incorporate information from both censored and
uncensored observations to provide consistent parameter estimates (Allison 2000). Furthermore,
Shumway (2001) finds that hazard models are both theoretically and empirically preferable to
static models and also perform as well as or better than alternatives. We select the widely used

20
Cox Proportional Hazard model to identify variables that influence the timing of the dividend
initiation decision by IPO issuing firms. A detailed discussion of CPH models is available in Cox
(1972).
We define the event in our analysis as the initiation of dividends by IPO issuing firms. In
the post-IPO period, issuing firms will either initiate dividends, leave the sample as a result of
acquisition or failure or continue to operate until the end of the tracking period without initiating
dividends. Censored firms are defined as IPO firms that do not initiate dividends until the end of
the tracking period. The event time is measured as the number of months from the IPO until
dividend initiation or the end of the tracking period whichever comes first. The dependent
variable is the log of the hazard. The explanatory variables include all the variables evaluated in
the logistic regression analysis in determining the probability of dividend initiation. The results of
the hazard analysis are reported in Table 8. The overall model Chi-square, individual variable
coefficients and their associated p-values are reported. Since the dependent variable is the log of
the hazard rate, a positive coefficient on an explanatory model indicates that an increase in the
value of the independent variable is associated with an increase in the hazard rate and
consequently lower duration of the event of interest. Therefore, in the context of our study, a
positive coefficient indicates than an increase in the value of the independent variable results in a
decrease in the time to dividend initiation. Similarly, a negative coefficient indicates that an
increase in the value of the variable leads to a longer time to dividend initiation. Finally, the risk
ratios are reported. For indicator variables the risk ratio is interpreted as the estimated hazard of
dividend initiation for those with value 1 relative to the hazard of dividend initiation for those
with value zero after controlling for other covariates. For continuous variables, the risk ratio
indicates the percentage change in the hazard of dividend initiation for a unit increase in the
covariate of interest controlling for other factors (Allison 2000)
--Table 8 about here--
The results in table 8 indicate that several variables are significantly related to the time to
dividend initiation decision. The coefficient of the variables VC, UNDPR, GEN and RANK are
negative and significant while the coefficient of the variables STAGE and LAMT are positive
and significant. Therefore, the hazard analysis indicates that time to dividend initiation increases
with initial returns, VC participation, investment bank prestige, and use of proceeds for general
corporate purposes. Similarly, the time to dividend initiation decreases with the stage of
development of the IPO firm and amount of proceeds raised at the IPO. The hazard or risk ratios
help increase our understanding of the interpretation of the coefficients in hazard analysis
(LeClere, 2000). Risk ratios equal to one indicate the variable has no effect on the event while a
21
ratio greater (less) than one indicates a more rapid (slower) time to event. For instance, the risk
ratio for VC indicates that the hazard of dividend initiation for VC backed IPO firms is 76 percent
of that of non-VC backed IPO firms or alternatively non-VC backed are 1.31 times more likely to
initiate dividends compared to VC backed firms. Similarly, a one percent increase in the initial
returns at the IPO will result in 31.05 percent decline in the probability of dividend initiation.
Further, IPO firms whose primary use of IPO proceeds is for reasons other than general
corporate purposes are 1.5 times more likely to initiate dividends compared to firms whose
primary use of IPO proceeds is for general corporate purposes. Firms that are at a more advanced
stage of development (profitable) at the time of the IPO are 1.45 times more likely to initiate
dividends compared to firms that are at an early stage of development (unprofitable) at the time
of the IPO. Therefore, overall, the hazard analysis indicates that the timing of the IPO dividend
initiation decision is influenced by VC participation, use of proceeds for general corporate
purposes, initial returns at the IPO, stage of development of issuing firm at the time of the IPO,
proceeds raised at the IPO and investment bank prestige.
5. Conclusions
IPO issuing firms by virtue of their entrepreneurial nature, technological orientation and
investment opportunities are targeted towards high risk profile investors such as venture
capitalists, hedge funds, and other institutional investors committed to the growth style of
investing. These investors are willing to invest in high risk ventures in the hope of achieving
above average returns. As such, the typical IPO investor is drawn by the promise of huge capital
gains rather than the prospects of collecting a stream of dividends in the future. The lack of
motivation for issuing firms to initiate dividends raises the question of why some IPO firms pay
dividends and consequently what are the characteristics of dividend paying IPO firms. A related
question concerns the timing of the dividend decision in the post-IPO period and if there are any
distinguishing characteristics between the early versus late dividend initiators. This study
attempts to address some of the above issues by identifying factors that influence the probability
of dividend initiation by IPO firms and the timing of the decision.
We find that in addition to size, investment opportunities, and profitability, the
probability of post-IPO dividend initiation is related to several variables unique to the IPO
market. We find that the probability of dividend initiation is positively related to stage of
development of the issuing firm as measured by pre-IPO profitability, and size of the offering and
negatively related to the industry technological orientation, venture capital participation, number
of uses indicated in the IPO proceeds, pre-IPO capital expenditure intensity, initial returns, and
risk of the issue. Further, we find that the duration between IPO and dividend initiation increases

22
with initial returns, investment bank prestige, VC participation, and use of proceeds for general
corporate purposes and decreases with stage of development, and size of issue. In comparing the
post-IPO performance of dividend versus non-dividend IPO firms we find dividend firms have
higher sales growth rates and better post-issue operating performance; although there is no
significant difference in the capital expenditure growth rates for the two groups. Overall, our
results suggest that both dividend and non-dividend firms have strong post-IPO investment
opportunities. Finally, dividend paying firms are more likely to survive compared to non-dividend
firms.
Our results increase the understanding of the various facets of dividend policies of IPO
firms. The insights gained in this study can also provide a basis to understand the impact of
changes in government policy towards taxation on the dividend policies of IPO firms. The impact
of tax policy on dividend policies of firms has long been a subject of intense debate in the
financial economics literature. The recently implanted reduction in taxes on dividends has
energized this debate and raised questions regarding the impact of lower taxes on dividend payout
behavior of entrepreneurial, high growth firms. This question is particularly interesting in the
context of the IPO market given the low propensity to pay dividends. The basic question that
arises is whether the reluctance of successful IPO firms to initiate dividends may change with a
more favorable tax policy towards dividends. Recently, companies such as Cisco Systems and
Oracle Corporation who have never paid dividends nor given it serious consideration in the past
have signaled a willingness to review their zero payout policy if changes in tax policy occur that
favor dividends. While our study does not address this issue directly, it provides a basis to make
conjectures on the likely effect of tax changes on dividend policies of newly public firms. For
instance, we find few significant differences in characteristics between early and late dividend
initiators. Therefore, a more favorable tax climate for dividends may cause a shift in the dividend
timing decision resulting in larger proportion of initiators paying dividends soon after the IPO.
However, since we note that currently over two thirds of firms that pay dividends initiate the
payment within the first year of going public, the overall impact of accelerating the timing of the
dividend decision is likely to be small. A more substantive impact would occur if changes in tax
policy would cause non-initiators to consider initiating dividends. For instance, we document that
only a small percentage of firms that are profitable at the time of the IPO and hence in a position
to initiate dividends, actually pay dividends during the post-IPO phase. Such firms that avoid
dividends or engage in frequent repurchases are likely candidates that could be induced to initiate
dividends in a more favorable tax environment. Future research studying the choice between

23
dividends and repurchases for IPO firms is likely to yield additional insights into this aspect and
enhance our understanding of the dividend policies of newly public firms.

24
References
Allen, F., Bernardo, A.E., & Welch, I. (2000). A theory of dividends based on tax clienteles. Journal of Finance, 55, 2499-2536. Allison, P.D. 1984. “Event History Analysis”. Beverly Hills: Sage Publications Allison, P.D. 2000. “Survival analysis using the SAS system: A practical guide.” SAS Institute Publishing. Bessler, W, Murtagh, J. P., & Siregar, D. (2001). Dividend policy of Bank Initial Public Offerings. Working paper, Center for Finance and Banking, Justus-Liebig University Giessen, Germany. http://papers.ssrn.com/. Bommel, J.V. and Vermaelen, T. (2003). Post-IPO capital expenditures and market feedback. Journal of Banking and Finance, 27, 275-305. Carter, R., Dark, F. H., & Singh, A. K. (1998). Underwriter reputation, initial returns, and the long-run performance of IPO stocks. Journal of Finance, 53, 285-311. Cox, D.R. 1972. “Regression Models and Life Tables.” Journal of the Royal Statistical Society, B34: 187-220. Fama, E. F. and French, K. M. (2001). Disappearing dividends: changing firm characteristics or lower propensity to pay?. Journal of Financial Economics, 60, 3-43. Field, L. C. and Hanka, G. (2001). The expiration of IPO share lockups. Journal of Finance, 56, 471-500. Jagannathan, M, Stephens, C.P., and Weisbach, M.S. (2000). Financial flexibility and the choice between dividends and stock repurchases. Journal of Financial Economics, 57, 355-384. Jain, B. A. and Kini, O. (1994). The post-issue operating performance of IPO firms. Journal of Finance, 49, 1699-1726. Jain, B. A., and Kini, O. (1999). On investment banker monitoring in the new issues market. Journal of Banking & Finance, 23, 49-84. Kahle, K. M. (2002). When a buyback isn’t a buyback: Open Market Repurchases and Employees Options. Journal of Financial Economics, 63, 235-261. Kosedag, M. and Michayluk, D. (2000). Dividend initiations in reverse-LBO firms. Review of Financial Economics, 9, 55-63. LeClere, M.J. 2000. “The Occurrence and Timing of Events: Survival Analysis Applied to the Study of Financial Distress”. Journal of Accounting Literature 19:158-189.
25
Lipson, M.L., Maquieira, C. P., & Megginson, W. (1998).Dividend initiations and earnings surprises. Financial Management, 27, 36-45. Liu, Q. (2000). Growth Opportunities, knowledge capital, and leverage: Evidence from U.S. Biotech Firms. Working paper, University of Hong Kong. McCaffrey, K. and Hamill, P. (2000).Dividend initiation announcements effects in initial public offerings. Applied Financial Economics, 10, 533-542. Michaely, R. and Shaw, W. H. (1994). The pricing of initial public offerings: tests of adverse-selection and signaling theories. Review of Financial Studies, 7, 279-319. Mikkelson,W.H., Partch, M., & Shah, K. (1997). Ownership and operating performance of companies that go public. Journal of Financial Economics, 44, 281-307. Ritter, J.R. (2000). The long-run performance of initial public offerings. Journal of Finance, 46, 3-27. Ritter, J.R. and Welch, I. (2002). A review of IPO activity, pricing, and allocations. Journal of Finance, 57, 1795-1827. Shumway, T. 2001. “Forecasting Bankruptcy More Accurately: A simple Hazard Model”. Journal of Business 74:101-124. Smith, C., and Watts, R. (1992). The investment opportunity set and corporate financing, dividend, and compensation policies. Journal of Financial Economics, 32, 263-292.
26
Table 1
Yearly Distribution of Dividend and Non-Dividend IPO Issuers The sample consists of 1628 IPOs issued during the period 1990-1998. The second, third, and fourth column report the yearly distribution of number of IPO issuers for the overall sample and segmented on the basis of whether issuers initiated dividends post-IPO between 1990-2000. The fifth column provides the yearly distribution of percentage of dividend initiating IPO firms.
Panel A: All IPO Firms Year of IPO
N Dividend IPOs Non-Dividend IPOs % Dividend Firms
90 62 9 53 14.29% 91 138 15 123 10.87% 92 199 19 180 9.55% 93 230 18 212 7.83% 94 202 15 187 7.43% 95 177 9 168 5.08% 96 300 6 294 2.00% 97 193 5 188 2.59% 98 127 3 124 2.36% Total 1628 99 1529 6.08%

27
Table 2
Industry Distribution of Dividend and Non-Dividend IPO Firms IPO firms are classified into industry groups based on two digit SIC codes. The sample consists of 1628 IPO firms that went public during the period 1990-1998 period. The industry groups are reported in decreasing order of total number of IPOs in each industry group. Industry 2-digit SIC No. of
IPOs No of Dividend IPOs
No of Non-Dividend IPOs
% Dividend Initiating IPOs
Advertising and Business Services
73,87,89 403 4 399 1.00
Electronics and Communications 36 146 5 141 3.42 Medical and Photo Equipment 38 139 6 133 4.32 Retail Trade 52-59 123 3 120 2.44 Chemicals, Drugs, and Personal Care Products
28 107 3 104 2.80
Personal Services 70-72,80-86, 88
100 3 97 3.00
Machinery Computer Equipment 35 94 8 86 8.51 Wholesale Trade 50,51 88 5 83 5.68 Telecommunications, Radio and TV
48 60 4 56 6.67
Transportation and Shipping 40-47 43 7 36 16.28 Mining/Construction 10-17 43 6 37 13.95 Metal Products 33, 34 39 14 25 35.80 Motion Pictures/Entertainment Services
78,79 35 0 35 0.00
Transportation Equipment Aerospace
37 32 4 28 12.50
Food and Kindred Products 20 21 2 19 9.52 Utilities 49 20 6 14 30.00 Other 136 19 117 13.97 Total 1628 99 1529 6.08

28
Table 3 Descriptive Statistics of Dividend and Non-Dividend IPO Firms
Descriptive statistics for the sample of 99 dividend IPO firms and 1529 Non-Dividend IPO firms. The IPO proceeds are the gross amounts raised at the IPO in millions of dollars. The initial returns are measured as the difference between the first day market price minus the offer price divided by the offer price expressed as a percentage. The ownership retention is the percentage ownership in the post-IPO firm of insiders and directors. The number of uses of the proceeds represents all the planned uses of the IPO proceeds listed by the issuing firms in the offering prospectus. Prestige is a measure of investment banking reputation on the basis of a nine point ranking scale developed by Carter, Dark and Singh (1998). The risk is measured as the standard deviation of the first 30 days of aftermarket returns of the issuing firms. Long-Term debt/assets is the long term debt divided by total assets measured in the year of the IPO. Sales represents the gross sales in millions of dollars in the year if the IPO. Capital expenditure intensity is measured as the capital expenditures divided by total assets in the year of the IPO. Total assets is the total assets in millions of dollars measured in the year of the IPO. EPS is the net earnings per share in the year of the IPO.
Variable Description
Dividend IPO Firms Non-Dividend IPO Firms Test for difference of
means N Mean(Median) N Mean(Median) t-statistics
IPO Proceeds ($M) 99 81.69 (50.40) 1528 32.02(24.00) 4.98a
Initial Returns (%) 84 6.28(3.53) 1451 14.98(7.50) -6.96a
Ownership Retention 65 40.54(28.79) 1253 34.78(31.97) 0.63
# Uses of Proceeds 88 1.36(1.00) 1476 1.48(1.00) -2.19b
Underwriter Prestige 99 7.68(8.10) 1524 6.51(7.10) 6.33a
Risk 99 0.0282(0.0267) 1529 0.0717(0.0375) -2.76a
Long Term Debt/Assets (%) 93 19.72(14.31) 1402 9.73(1.39) 4.20a
Sales ($M) 93 696.16(192.35) 1350 89.85(33.54) 3.52a
Capital Intensity (%) 91 8.19(5.28) 1383 7.95(4.45) 0.27 Total Assets($M) 93 1084(183.68) 1402 87.81(39.22) 2.59a
Pre-IPO EPS ($) 85 1.00(0.98) 1328 -0.01(0.27) 12.47a
% Technology IPOs 13 13.13% 674 44.08%
% VC Backed IPOs 13 13.13% 702 45.91% % NYSE IPOs 39 39.39% 71 4.64%
% NASDAQ IPOs 52 52.53% 1254 82.01% a Significant at the 0.01 level b Significant at the 0.05 level

29
Table 4 Descriptive Statistics of Early versus Late IPO Dividend Initiators.
Descriptive statistics for the sample of 70 early (within twelve months of the IPO) dividend initiators versus 29 late (after twelve months of the IPO) dividend initiators. The IPO proceeds are the gross amounts raised at the IPO in millions of dollars. The initial returns are measured as the difference between the first day market price minus the offer price divided by the offer price expressed as a percentage. The ownership retention is the percentage ownership in the post-IPO firm of insiders and directors. The number of uses of the proceeds represents all the planned uses of the IPO proceeds listed by the issuing firms in the offering prospectus. Prestige is a measure of investment banking reputation on the basis of a nine point ranking scale developed by Carter, Dark and Singh (1998). The risk is measured as the standard deviation of the first 30 days of aftermarket returns of the issuing firms. Long-term debt/assets is the long term debt divided by total assets measured in the year of the IPO. Sales represents the gross sales in millions of dollars in the year if the IPO. Capital expenditure intensity is measured as the capital expenditures divided by total assets in the year of the IPO. EPS represents the earnings per share in the fiscal year of the IPO.
Variable Description
Early Dividend Firms Late Dividend Firms Test for difference of
means (medians)
N Mean(Median) N Mean(Median) t-statistics IPO Proceeds ($M) 70 89.31 (57.75) 29 63.32(43.10) 1.46(1.47)
Initial Returns (%) 55 4.94(2.21) 29 8.83(5.37) -1.56(-1.14) Ownership Retention 43 46.43(30.52) 29 29.02(28.90) 1.26(0.43)
# Uses of Proceeds 60 1.25(1.00) 28 1.60(2.00) -2.95a(-2.92)a
Underwriter Prestige 70 7.27(8.10) 29 7.58(8.10) -0.37(0.27) Risk 70 0.0267(0.0263) 29 0.0294(0.0267) -0.72(-0.15)
Long Term Debt/Assets (%) 65 20.53(14.44) 28 17.83(13.49) 0.60(0.38) Sales ($M) 65 867.63(270.60) 28 298.10(435.47) 2.23b(-1.28)
Capital Intensity (%) 63 8.00(6.17) 28 8.60(4.48) -0.29(1.73)c
Pre-IPO EPS ($) 70 0.78(1.00) 29 0.86(1.00) -0.93(0.87) a Significant at the 0.01 level b Significant at the 0.05 level c Significant at the 0.10 level
30
Table 5
Distribution of Primary Use of IPO Proceeds for Dividend and Non-Dividend IPO Firms.
The sub-samples of dividend and non-dividend IPO firms are classified on the basis of the primary use of the IPO proceeds as indicated in the offering prospectus. The results with the three most frequently indicated primary use of proceeds; acquisition financing, general corporate purposes, and retiring/refinancing debt/bank loans are reported. All other primary uses of the IPO proceeds are classified into a single category termed “other”.
Primary Use of Proceeds
Dividend IPO Group #(%)
Non-Dividend IPO Group #(%)
All Firms # (%)
General Corporate Purposes
35(35.35%) 846(55.33%) 881(54.12%)
Retiring/Refinancing Bank Loans/Debt
42(42.42%) 521(34.07%) 563(34.58%)
Acquisition Financing
5(5.05%) 46(3.01%) 51(3.13%)
Other 17(17.17%) 116(7.59%) 133(8.17%) Total 99(100%) 1529(100%) 1628(100%)

31
Table 6 Post-IPO Performance of Dividend and Non-Dividend Firms
The numbers reported are for the median change or growth relative to the year of the IPO for dividend and non-dividend IPO firms. Sales growth is defined as the growth rate in net sales. Capital intensity growth is the growth rate in capital expenditures/assets. Operating return on assets is defined as the operating income before depreciation as a percentage of assets. Operating return on sales is defined as operating income before depreciation divided by sales. The matched sample performance measures are based on a industry matched sample of non-IPO firms constructed by identifying a matching firm in the same industry and that went public around the same time for each of the dividend initiating IPO firms. *** , ** , and * denote significance at 1%, 5% and 10% respectively.
Panel A: Sales Growth Description Year 0-1 Year 0-2 Year 0-3 Year 0-4 Dividend Firms (%) 11.14*** 23.83*** 43.30*** 71.31***
Non-Dividend Firms (%) 35.09*** 68.00*** 103.40*** 128.54***
Industry Matched Non-Dividend Firms (%)
25.75*** 47.59*** 64.92*** 86.72***
Dividend Vs Non-Dividend Firms
Z=-8.47*** Z=-4.8316*** Z=-5.2794*** Z=-3.5064***
Dividend Vs Industry Matched Non-Dividend Firms
Z=-3.02*** Z=-2.94*** Z=-2.12** Z=-0.37
Panel B: Capital Expenditure Growth Dividend Firms (%) 28.35*** 42.25*** 56.29*** 86.51***
Non Dividend Firms (%) 60.39*** 63.28*** 81.16*** 85.45***
Matched Non-Dividend Firms (%)
55.19*** 34.69*** 64.66*** 62.06***
Dividend Vs Non-Dividend Firms
Z=3.34*** Z=2.0583** Z=1.6614* Z=0.127
Dividend Vs Industry Matched Non-Dividend Firms
Z=-1.53 Z=1.05 Z=-0.59 Z=1.36
Panel C: Long-Term Debt/Total Assets Dividend Firms (%) -6.12*** 6.97*** 13.60*** 11.22***
Non-Dividend Firms -1.62*** 4.62*** 9.88*** 17.15***
Matched Non-Dividend Firms 11.53*** 14.90*** 9.64*** 37.04***
Dividend vs Non-Dividend Firms
Z=-0.9327 Z=0.2521 Z=0.2542 Z=0.3912
Dividend vs Industry Matched Non-Dividend Firms
Z=2.16** Z=0.6748 Z=-0.099 Z=1.2786
Panel D: Operating Return on Assets Dividend Firms(%) -0.36*** -2.03*** -5.04*** -10.38***
Non-Dividend Firms(%) -6.50*** -11.41*** -15.29*** -17.68***
Industry Matched Non-Dividend Firms (%)
-10.60*** -18.59*** -21.77*** -22.35***
Dividend Vs Non-Dividend Firms
Z=3.05*** Z=2.36* Z=1.75* Z=1.26
Dividend Vs Industry Matched Non- Dividend Firms
Z=3.60*** Z=2.75*** Z=2.29** Z=1.99***
Panel E: Operating Return On Sales Dividend Firms(%) 5.32*** 1.37*** 0.55*** -4.71***
Non-Dividend Firms (%) -17.85*** -25.11*** -31.23*** -33.32***
Industry Matched Non-Dividend Firms (%)
-11.55*** -28.21*** -22.49*** -24.76***
Dividend Vs Non-Dividend Firms
Z=6.98*** Z=4.84*** Z=5.055*** Z=3.007***
Dividend Vs Industry Matched Non-Dividend Firms
Z=3.72*** Z=3.12*** Z=1.88* Z=2.02**

32
Table 7 Logit Models of Dividend Initiation by IPO Firms
The results of the logistic regression analysis to identify the determinants of dividend initiation by IPO firms is reported. The variable DIV takes on the value 1 if the IPO firm issues dividends in the post-IPO period and zero otherwise. The dependent variable is the probability that DIV=1. The variable TECH takes on the value 1 if the IPO issuer belongs to a high technology industry and 0 otherwise. The variable VC takes on the value 1 if the issuing firm is VC-backed and zero otherwise. NUMUSES represent the number of uses for the IPO proceeds identified by the issuing firm in its offering prospectus. DEBT represents firm leverage at the time of the IPO and is measured by the long-term debt divided by total assets. UNDPR is the initial returns at the IPO. CAPEXA is the capital intensity in the IPO year defined as capital expenditures divided by the total assets. LAMT represents the log of IPO proceeds. RISK is the standard deviation of the first thirty days aftermarket returns. RANK is the investment banking prestige measured using the Carter, Dark and Singh (1998) nine point reputation scale. STAGE is a dummy variable that takes on the value 1 if the IPO firm was profitable in the year of the IPO and 0 otherwise. ACQ is a dummy variable that takes on the value 1 if the primary use of the IPO proceeds is acquisitions and 0 otherwise. REF takes on the value 1 if the primary purpose of the IPO proceeds is retiring/refinancing debt and 0 otherwise. GEN takes in the value 1 if the primary purpose of the IPO proceeds is for general corporate purposes and 0 otherwise. P values are reported in parentheses and significance levels are indicated.
Variables Model 1 Model 2 Model 3 Model 4 Model 5 Intercept -3.8400
(0.0001)a -2.8573 (0.0001)a
-4.0105 (0.0001)a
-3.8413 (0.0001)a
-3.7512 (0.0001)a
TECH -0.7424 (0.0242)b
-0.8300 (0.0186)b
-0.6698 (0.0670)c
-0.6345 (0.0775)c
-0.6269 (0.0907)c
VC -1.2290 (0.0002)a
-1.2143 (0.0004)a
-1.0758 (0.0020)a
-1.0195 (0.0031)a
-1.0663 (0.0022)a
NUMUSES - -0.4594 (0.0263)b
-0.4003 (0.0738)c
-0.3794 (0.0835)c
-0.4123 (0.0669)c
ACQ - -0.4111 (0.5381)
- - -0.0737 (0.9148)
REF - -0.1693 (0.6901)
- - -0.0850 (0.8521)
GEN - -0.2466 (0.5767)
- - -0.2886 (0.5491)
DEBT - 0.0271 (0.9653)
- -0.0227 (0.9715)
UNDPR - -3.0466 (0.0050)a
-3.1079 (0.0041)a
-3.0848 (0.0049)a
STAGE - 1.1251 (0.0023)a
1.1285 (0.0021)a
1.1053 (0.0032)a
CAPEXA - - -2.6919 (0.0664)c
-2.6811 (0.0746)c
-2.6338 (0.0737)c
LAMT 0.6984 (0.0001)a
0.6293 (0.0004)a
0.7232 (0.0002)a
0.8602 (0.0001)a
0.6893 (0.0006)a
RISK -47.5092 (0.0001)a
-44.9099 (0.0001)a
-37.6588 (0.0025)a
-37.4191 (0.0024)a
-37.2995 (0.0001)a
RANK 0.1146 (0.1298)
0.1169 (0.1453)
0.0995 (0.2531)
-
0.1052 (0.2312)
Likelihood Ratio
160.21 (0.0001)
147.56 (0.0001)
150.13 (0.0001)
148.13 (0.0001)
150.73 (0.0001)
a Significant at the 0.01 level; b Significant at the 0.05 level; c Significant at the 0.10 level

33
Table 8 Estimation of Cox Proportional Hazard Models
The factors influencing the timing of the dividend initiation decision by IPO firms are estimated by the Cox Proportional Hazard model. The time to dividend initiation is measured as the number of months from the IPO to dividend initiation. The dependent variable is the log of the hazard rate. The variable TECH takes on the value 1 if the IPO issuer belongs to a high technology industry and 0 otherwise. The variable VC takes on the value 1 if the IPO firm is VC backed and zero otherwise. NUMUSES represent the number of uses for the IPO proceeds identified by the issuing firm in its offering prospectus. DEBT represents firm leverage at the time of the IPO and is measured by the long-term debt divided by total assets. UNDPR is the initial returns at the IPO. CAPEXA is the capital intensity in the IPO year defined as capital expenditures divided by the total assets. LAMT represents the log of IPO proceeds. RISK is the standard deviation of the first thirty days aftermarket returns. RANK is the investment banking prestige measured using the Carter, Dark and Singh (1998) nine point reputation scale. STAGE is a dummy variable that takes on the value 1 if the IPO firm was profitable in the year of the IPO and 0 otherwise. ACQ is a dummy variable that takes on the value 1 if the primary use of the IPO proceeds is acquisitions and 0 otherwise. REF takes on the value 1 if the primary purpose of the IPO proceeds is retiring/refinancing debt and 0 otherwise. GEN takes in the value 1 if the primary purpose of the IPO proceeds is for general corporate purposes and 0 otherwise. P values are reported in parentheses and significance levels are indicated. The coefficient of each independent variable, p-value and test of significance are reported. The Risk ratio for each variable is also reported. Variables Model Risk Ratio
TECH -0.0611 (0.36)
0.94
VC -0.2735 a (0.0005)
0.76
NUMUSES -0.0197 (0.6685)
0.98
ACQ 0.1884 (0.3512)
1.20
REF -0.1942 (0.1267)
0.82
GEN -0.4120a
(0.0012)0.66
DEBT -0.1028 (0.5903)
0.90
UNDPR -0.3718a (0.0030)
0.69
STAGE 0.3721a (0.0001)
1.45
CAPEXA 0.0740 (0.8005)
1.07
LAMT 0.1759a (0.0003)
1.19
RISK 0.0595 (0.1448)
1.06
RANK -0.0461a (0.0058)
0.95
Likelihood Ratio 111.95a
(0.0001)
a Significant at the 0.01 level; b Significant at the 0.05 level; and c Significant at the 0.10 level

34
Related Documents