DETERMINANTS OF DECISION MAKING QUALITY: STUDIES ON LEADERS OF UNIVERSITI TEKNOLOGI MARA SELANGOR AMIRA NURUL AAINA BINTI ABU BAKAR 2014801946 NUR DIYANA BINTI ABDUL RAZAK 2012707129 BACHELOR OF BUSINESS ADMINISTRATION WITH HONOURS (INTERNATIONAL BUSINESS) FACULTY OF BUSINESS MANAGEMENT UNIVERSITI TEKNOLOGI MARA KAMPUS BANDARAYA MELAKA JULY 2016

Welcome message from author
This document is posted to help you gain knowledge. Please leave a comment to let me know what you think about it! Share it to your friends and learn new things together.
Transcript
DETERMINANTS OF DECISION MAKING QUALITY:
STUDIES ON LEADERS OF UNIVERSITI TEKNOLOGI MARA SELANGOR
AMIRA NURUL AAINA BINTI ABU BAKAR
2014801946
NUR DIYANA BINTI ABDUL RAZAK
2012707129
BACHELOR OF BUSINESS ADMINISTRATION WITH HONOURS
(INTERNATIONAL BUSINESS)
FACULTY OF BUSINESS MANAGEMENT
UNIVERSITI TEKNOLOGI MARA
KAMPUS BANDARAYA MELAKA
JULY 2016
ii
DETERMINANTS OF DECISION MAKING QUALITY:
STUDIES ON LEADERS OF UNIVERSITI TEKNOLOGI MARA SELANGOR
AMIRA NURUL AAINA BINTI ABU BAKAR
2014801946
NUR DIYANA BINTI ABDUL RAZAK
2012707129
Submitted in Partial Fulfillment of the
Requirement for the
Bachelor of Business Administration with Honours (International Business)
FACULTY OF BUSINESS MANAGEMENT
UNIVERSITI TEKNOLOGI MARA
BANDARAYA MELAKA
JULY 2016
iii
DECLARATION OF ORIGINAL WORK
BACHELOR OF BUSINESS ADMINISTRATION WITH HONOURS
(INTERNATIONAL BUSINESS)
FACULTY OF BUSINESS MANAGEMENT
UNIVERSITI TEKNOLOGI MARA
KAMPUS BANDARAYA MELAKA
“DECLARATION OF ORIGINAL WORK”
We, Amira Nurul Aaina Binti Abu Bakar, (I/C Number: 930727-08-5748) and
Nur Diyana Binti Abdul Razak, (I/C Number: 921204-02-5688)
Hereby, declare that:
This work has not previously been accepted in substance for any degree, locally or
overseas, and is not being concurrently submitted for this degree or any other degrees.
This project paper is the result of our independent work and investigation, except where
otherwise stated.
All verbatim extracts have been distinguished by quotation marks and sources of our
information have been specifically acknowledged.
Signature: _________________________________ Date: _____________________
Signature: _________________________________ Date: _____________________
iv
LETTER OF SUBMISSION
24 June 2016
Project Advisor
Mr. Zakimi Bin Ibrahim
Bachelor of Business Administration (Hons) International Business
Faculty of Business Management
Universiti Teknologi MARA Kampus Alor Gajah Melaka
Dear Mr. Zakimi,
SUBMISSION OF PROJECT PAPER (IBM663)
With reference to the above matter, enclosed herewith is a report of our project paper titled
DETERMINANTS OF DECISION MAKING QUALITY: STUDIES ON THE LEADERS OF
UNIVERSITI TEKNOLOGI MARA SELANGOR to fulfill the requirement as needed by the faculty
of Business Management. It is with our very high hopes that this project paper has
accomplished the requirements and expectations of the faculty and the desired objective of the
course undertaken. Lastly, we would like to express our most sincere gratitude for the time,
advice and guidance that you have rendered during the entire preparation right up to the
completion of this project paper.
Thank You.
Yours Sincerely,
__________________________
AMIRA NURUL AAINA BINTI ABU BAKAR
2014801946
BBA HONS INTERNATIONAL BUSINESS
__________________________
NUR DIYANA BINTI ABDUL RAZAK
2012707129
BBA HONS INTERNATIONAL BUSINESS
v
ACKNOWLEDGEMENT
Bismillahirahmanirahim
In the name of Allah, the most beneficent and merciful
Alhamdulillah, praise to Allah SWT, who has endowed us with His Gracious and Mercy
for giving us strength in order to complete this project paper.
We would like to extend our highest appreciation and gratitude to our advisor, Mr
Zakimi Bin Ibrahim for his endless guidance and encouragement for us to strive in doing our
best. Also, to our second examiner, Madam Irwani Hazlina Binti Abd. Samad. We would also
like to extend our heartfelt thanks to all of our lecturers in the Faculty of Business Management
for imparting their knowledge to us besides providing us with their valuable support and
assistance throughout our journey to receive our Bachelor’s Degree.
Furthermore, our gratitude also goes to AKEPT and UiTM Kuala Pilah staffs for the
good memories and experience during our training stint. Not to forget to all the UiTM Selangor
leaders who had to participate in this project.
Last but not least, we would like to acknowledge our family and friends for their support
and encouragement and to the readers of this work, for their interest. Thank you.
vi
TABLE OF CONTENT
CONTENT PAGE
FRONT COVER i
DETERMINANTS OF DECISION MAKING QUALITY: STUDIES ON LEADERS OF
UNIVERSITI TEKNOLOGI MARA SELANGOR
ii
DECLARATION OF ORIGINAL WORK iii
LETTER OF SUBMISSION iv
ACKNOWLEDGEMENT v
TABLE OF CONTENT vi
LIST OF FIGURES ix
LIST OF TABLES x
ABSTRACT
xi
CHAPTER 1: INTRODUCTION
1
1.1 Introduction 1
1.2 Background of Study 2
1.3 Problem Statement 2
1.4 Research Objectives 4
1.5 Research Questions 4
1.6 Significance of Study 5
1.7 Scope of Study 5
1.8 Limitation of Study 6
1.8.1 Respondents’ Participation 6
1.8.2 Sample Size 6
1.8.3 Time Constraint 6
1.9 Definition of Term 6
1.9.1 Leadeship 6
1.9.2 Transactional Leadership 7
1.9.3 Transformational Leadership 7
1.9.4 Autocratic Leadership 7
1.9.5 Democratic Leadership 7
vii
1.9.6 Laissez-faire Leadership 8
1.9.7 Decision Making 8
1.9.8 Hierarchical Decision Making 8
1.9.9 Flexible Decision Making 8
1.9.10 Integrative Decision Making 8
1.9.11 Decision Quality
9
CHAPTER 2: LITERATURE REVIEW
10
2.1 Introduction 10
2.2 Decision Making Quality 10
2.3 Leadership Style 12
2.3.1 Transactional Leadership 16
2.3.2 Transformational Leadership 17
2.3.3 Autocratic and Democratic Leadership 19
2.3.4 Laissez-faire Leadership 21
2.4 Decision Theory 21
2.5 Decision Making Style 23
2.5.1 Decision Style 23
2.5.2 Hierarchical Decision Making 24
2.5.3 Flexible Decision Making 24
2.5.4 Integrative Decision Making 24
2.6 Research Framework
26
CHAPTER 3: RESEARCH METHODOLOGY
26
3.1 Introduction 26
3.2 Research Design 26
3.3 Sampling 26
3.3.1 Sampling Design 26
3.3.2 Population of Study 27
3.3.3 Sample Size 27
3.4 Data Collection Method 28
3.5 Questionnaire 29
viii
3.6 Data Analysis 29
3.7 Conclusion
30
CHAPTER 4: FINDINGS AND DATA ANALYSIS
31
4.1 Introduction 31
4.2 Findings and Analysis 31
4.2.1 Reliability Test 31
4.2.2 Respondent’s Profile 34
4.2.3 Descriptive Statistics 36
4.2.4 Correlation Coefficient Analysis 37
4.2.5 Multiple Regression Analysis 40
4.2.6 Hypotheses Testing 44
4.3 Conclusion
45
CHAPTER 5: CONCLUSIONS AND RECOMMENDATIONS
45
5.1 Introduction 45
5.2 Conclusions 45
5.2.1 Leadership Styles 45
5.2.2 Decision Making Styles 46
5.3 Recommendation 46
5.3.1 Improved Skills of Leadership and Decision making Style 46
5.3.2 Documented Decision Making Process
47
BIBLIOGRAPHY
APPENDICES
ix
LIST OF FIGURE
Figure:
Figure 2.1 Theoretical Framework 25
x
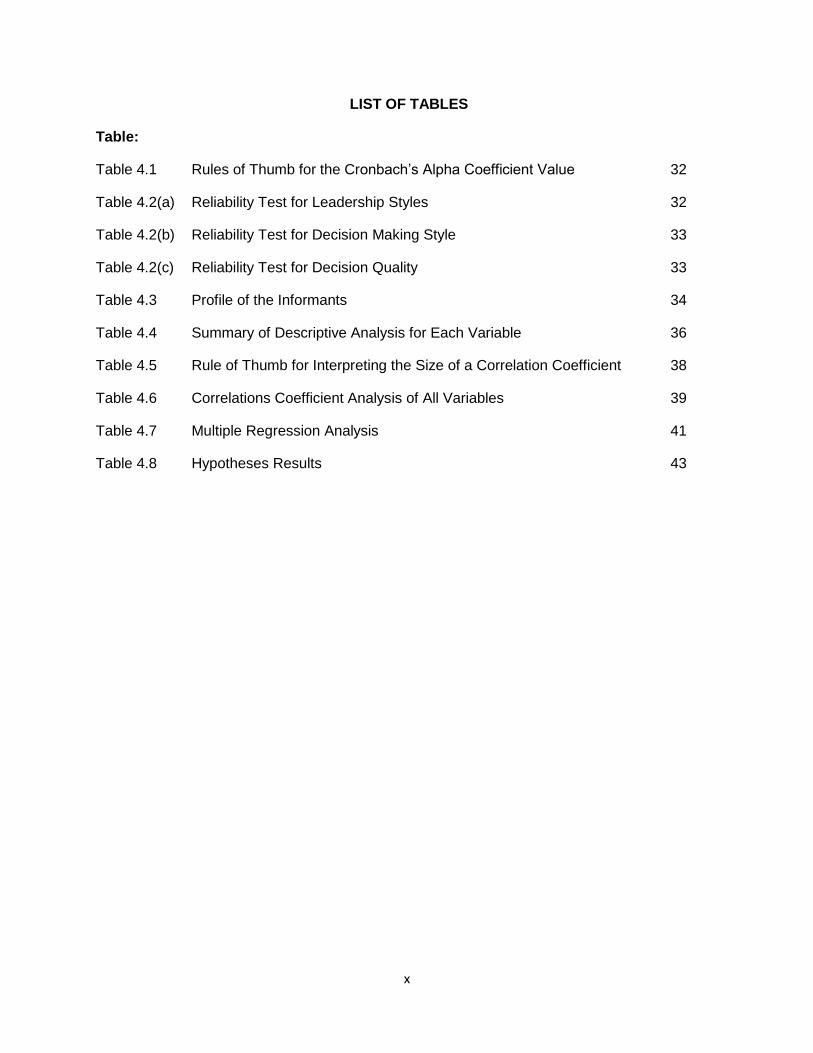
LIST OF TABLES
Table:
Table 4.1 Rules of Thumb for the Cronbach’s Alpha Coefficient Value 32
Table 4.2(a) Reliability Test for Leadership Styles 32
Table 4.2(b) Reliability Test for Decision Making Style 33
Table 4.2(c) Reliability Test for Decision Quality 33
Table 4.3 Profile of the Informants 34
Table 4.4 Summary of Descriptive Analysis for Each Variable 36
Table 4.5 Rule of Thumb for Interpreting the Size of a Correlation Coefficient 38
Table 4.6 Correlations Coefficient Analysis of All Variables 39
Table 4.7 Multiple Regression Analysis 41
Table 4.8 Hypotheses Results 43
xi
ABSTRACT
The main focus of this study is to determine the factors influencing decision quality
made by the leaders of Universiti Teknologi MARA (UiTM) Selangor. Factors that
influencing decision quality is the leadership styles which is divided into transactional
leaders, transformational leaders, democratic leaders, autocratic leaders and laissez-
faire leaders altogether with the decision-making styles which is divided into hierarchic
styles, flexible styles and integrative styles. There are eight hypotheses constructed in
this research. 130 electronic questionnaires were distributed via email to the unit of
analysis which is the leaders of Universiti Teknologi MARA (UiTM) Selangor. The
collected data have been analysed using the Statistical Package for Social Science
(SPSS) and the multiple regressions analysis was used to test the model and the
hypothesis. Results from this study show that transformational leaders, laissez-faire
leaders, hierarchic decision-making style, flexible decision-making style and integrative
decision-making style have a significant impact on decision quality. Recommendations
for future research have also been included.
1
CHAPTER 1: INTRODUCTION
1.1 Introduction
Education is the vital element for the nation to achieved stability and continuous sustainable
advancement. The Malaysian higher education system has developed from strength over
the recent decades. Over the recent decade alone, the system has made momentous gains
in student enrollment, raised in worldwide recognition on key dimensions, for example, the
patents, research publications and institutional quality, also become a top destination for
international students. These achievements are great evidence of the determination and
development of the Malaysian academic community.
Yet, the Ministry of Education aware that the system should need to keep developing up-to-
date following the global trends. Preparing Malaysian youth to prosper in this multifaceted
and perpetually changing future will involve an equally fundamental transformation of how
the higher education system and higher learning institutions currently operate.
Thus, the Ministry started building up the Malaysia Education Blueprint 2015–2025 (Higher
Education) in 2013. Over the two years progression, the Ministry illustrated on numerous
wellsprings of input, from Malaysian and international education experts to leaders of
Malaysian higher learning institutions and members of the public. The final product is a
blueprint that was developed by Malaysians, for Malaysians, and that will complement
Malaysia for the final phase of its excursion towards a high income nation.
1.2 Background of Study
To put to use the strategy of reaching goals towards improving higher education institution
(HEIs) reputation, the quality decision made by the top management level of higher
education institution regarding the institution's survival is extremely important. Inability to
2
make the quality decision may affect the enlargement of the size of student population, the
keenness of the institutions, the expectation of students and others. Decision quality is
very important because the results of the decision point to shows whether a good and
sound decision is made by the individual. Without a high quality decision, the organization
will not be able to create high quality services, such as the service delivery and
relationship with customers which is the students. This high quality decision is significant
for the organizational survival and competitiveness in the highly competitive worldwide
market.
Furthermore, quality has been an important theme adopted in general by educational
provider. The competitive surrounding conditions in Malaysia make the higher education
institution to discover the option of gaining competitive advantage through quality
improvement in managing the process of the educational system. This will lead to the
demand of having more quality decision by top management or the educational industry
leaders in Malaysia (Sohail et al., 2003). The decision quality is the result of organizational
leaders in selecting the right choices to settle down the problems faced by the
organization, precisely in the educational perspective.
1.3 Problem Statement
The issue of quality decisions relates to the top management of higher education
institutions which will act as the decision maker. Obliquely, this has to do with the
management of the institution, which is the most challenging issue facing educational
provider in developing countries today. This problem has persevered and continued to
gain the attention of major stakeholders, who are the students, the administration,
government, academician and society. The challenge is to encourage higher education
institution’s top management from an autocratic leader to become a democratic leader
3
and to warrant the reform is take on deliver the right prescriptions for the famous
weakness or problems. This is because the autocratic leadership styles in higher
education institutions can create poor management and indirectly poor decisions, which
may lead to failing standard of higher education in developing nation such as Malaysia
and her neighboring countries (Magoha, 2004)
The theory of leadership of higher educations are frequently confused and misunderstood,
and as a result, it will be rigorously debated within the academic community
(Bergquist.1992; Cohen & March, 1983). The basic failure of the study of management
and leadership drive from holding with the most important key issues of the decision may
be one cause why there is so little progress in the direction of overcoming the criticism of
management education that has become stronger and more prevalent during the last few
years (Bennis & O’Toole, 2005). One more probable cause for the lack of decision quality
is the belief by the higher level manager that they know what they need to know about
decision making in management and leadership issue (Rausch, 2007).
According to Rosser, Johnsrud, and Heck (2003), increments in competition for scarce
resources and a decrease in public trust in higher education practices have resulted in
demands for universities and colleges to demonstrate their productivity, effectiveness and
efficiency. Dealing with such issues requires that universities increase their
responsiveness to individual learner needs, societal goals and aspirations and economic
development. Hence, Universiti Teknologi Mara (UiTM) is no exemption. Subsequently, in
realizing a change event, universities administrators, academic leaders and change
agents need to know the values of their workforce and identify work habits which can
strengthen or weaken change initiatives (Asma et al. 2001). Paradoxically, studies showed
that up to 70% of new planned changes fail (Beer and Nohria, 2000).
4
Most of the research discussed on the topic between the relationship of leadership and
decision styles emphases on business organization, and there is very few amount of
research on higher education institutions even with the much descriptive report elaborate
the general performance of higher education institutions. Over and above, currently, a
broadly identified useful set of judging requirements or guidelines of quality decisions
relating to the higher education institutions, precisely the process, is needed. As follows,
development of judging requirements and the guideline is projected to achieve the
outcomes of the research. So, it is vital to understand how leadership styles focusing on
decision quality causes some colleges/universities accomplish high performance while
others do not.
1.4 Research Objectives
In line with the problem statement, this study seeks to address the following research
objectives:
1. To identify the relationship of leadership styles and decision making styles towards
decision quality.
2. To identify the factors that influence decision making quality the most.
1.5 Research Question
In relation to the research objectives, this study attempts to resolve the following research
questions:
1. What is the relationship of the leadership and decision making styles towards
decision quality?
2. Which factor influence decision making quality the most?
5
1.6 Significance of Study
The study on the decision making quality made by the leaders of UiTM Selangor is
extremely important from both theoretical and viable perspectives. Findings from this
study will extend to the development of the literature of leadership.
There are a lot of things that can be gained from the present study particularly to calculate
the decision quality of the UiTM Selangor Leaders. Understanding the relationships
between leadership styles and decision making styles with the decision quality should give
traces on how the growth paths of fast track of the leaders of UiTM Selangor vary from
those of slouches. It should trust that the study can impart to the theory gap in the
literature as well as the practice gap for the practitioners relating to its findings and result.
1.7 Scope of Study
The main point of this research is to investigate the determinants of decision quality made
by the leaders of UiTM Selangor. The respondents were approached via email whereby
the researchers explained the purpose of the study and attached a questionnaire for data
collection purposes.
This research focuses on the main campus of Universiti Teknologi MARA. Universiti
Teknologi MARA is the largest institution of higher learning in Malaysia in terms of size
and population. The main campus of the university is located in Shah Alam and they have
expanded nationwide with 12 state campuses 6 satellite campuses, 11 state satellite
campuses and 21 affiliated colleges. The leaders are comprised from Vice Chancellor to
Senior Lecturer of Universiti Teknologi MARA Selangor.
6
1.8 Limitations of Study
1.8.1. Respondents’ Participation
Leaders have an unlimited range of comprehension. Thus, in this study, the
researchers will focus on the leaders of Universiti Teknologi MARA Selangor. But, it
is still difficult for the researchers to approach the respondents and get their
response as the respondents are mostly busy people.
1.8.2. Sample Size
According to Krejcie and Morgan (1970), when the population is 130, the sample
size should be 97. Unfortunately, the researchers only managed to get 52
participants to participate in this research. According to Roscoe (1975), sample
sizes that are more than 30 and fewer than 500 are appropriate for most research.
Thus, 54% response rate, which is 52 respondents, can be considered as
adequate.
1.8.3. Time Constraint
Since the duration of time to do the research is limited due to the researchers’
internship commitment, it is hard for the researcher to get the sample size that is
needed, which are 97.
1.9 Definition of Terms
1.9.1. Leadership
Leadership is not about managing or directing. Leadership is about the ability to
influence and inspire other people in order to obtain the leader's goal. Leadership is
defined as the process of influencing the activities of an organized group toward
goal achievement (Yukl, 2002). Moreover, leaders have the ability to help
7
themselves and others to do the right things. Leaders set their direction, construct
an inspiring vision, and build something new. Leadership is about finding the
direction on where to go to be a successful team.
1.9.2. Transactional Leadership
Transactional leadership is also known as managerial leadership which focus on
supervision, organization and team performance. It is based on contingency, in that
reward or punishment is contingent upon performance. In the other words,
transactional leadership will make people feel motivated by thinking of rewards and
punishments.
1.9.3. Transformational Leadership
Transformational leadership is a process where leaders and their followers raise
one another to higher levels of morality and motivation (Burns, 1978). In addition,
transformational leadership is a model of integrity and fairness and able to set clear
goals. They have high expectations, able to encourage others and provide support
and recognition.
1.9.4. Autocratic Leadership
Autocratic leadership is a leadership style portrayed by an individual control over all
decisions and little input from group members. Autocratic leaders regularly make a
decision based on their thoughts and judgments and rarely acknowledge advice
from their followers. Autocratic leadership involves absolute, dictator control over a
group.
8
1.9.5. Democratic Leadership
Democratic leadership is a leadership style which every individual from the group
takes more participative part in the decision-making process. The democratic
leader is charged with choosing who is in the group and who gets the opportunity to
the decisions that are made.
1.9.6. Laissez-faire Leadership
Laissez-faire leadership is a leadership style which leaders let the group members
to make the decisions. A leader gives little directions to the subordinates. In the
other words, all the rights and power to make the decisions is completely given to
the worker.
1.9.7. Decision Making
Decision making is the selection of a method to measure the options and
discovering a solution to a problem. Moreover, certain circumstances will require
different methodologies of decision making in order to be effective.
1.9.8. Hierarchical Decision Making
The hierarchical style analyzes a great deal of information and expecting others to
contribute and will readily challenge others’ views, analyses and decisions.
1.9.9. Flexible Decision Making
The flexible style concentrates on pace however the weight is on adaptability.
Confronted with the issue a person working in the flexible mode will simply get
enough data to choose a line of attack and quickly change course if need be.
9
1.9.10. Integrative Decision Making
Integrative decision making style composes the decisions that are comprehensively
characterized and comprise of various approaches.
1.9.11. Decision Quality
The quality decision is the decision that meets the objectives of the organization
and offers rise to the positive outcome to the decision maker. Thus, decision quality
is operationally defined by looking at decision-making outcome in set apart
between the good decision and bad decision and whether it has encountered the
goal and objective of the organization.
10
CHAPTER 2: LITERATURE REVIEW
2.1 Introduction
Higher education institutions face competition from different education institutions offering
almost the same services and programmes. To remain competitive, these institutions must
respond to the complex factors while making a hit on the demand for education. Education
institutions seeking to achieve success must conduct a range of activities designed to
captivate potential students not only in Malaysia but worldwide.
In positioning themselves against their competitors and shaping their future directions,
strategic planning is extremely important for these institutions to remain competitive and
able to last for a long-term growth. Strategic management can be seen as a matter of
crucial economic analysis and planning. It can also be seen as a matter of organizational
decision making, within a social, political and cultural process (Johnson & Scholes, 1993).
Strategic management consists of taking a view of the entire organization, its place in its
environment, its values and culture, its key purpose, its direction and its strategic choice
for the improved future. Strategic management is a matter of bridge building or mapping
the route between the perceived present situation and the desired future situation (West-
Burnham, 1994).
2.2 Decision Making Quality
The quality concept is in fact as old as the Medieval Ages. It has been a permanent
concern of the universities since their foundation on those ancient times, having always
been part of the academic ideology. Van Vught (1995) argues that it was already possible
to distinguish two models of quality assessment in the XIIIth century, the French model of
vesting control in an external authority (Cobban, 1988) being the classic of quality
11
assessment in terms of accountability, and the English model of a sovereign community of
fellows being an example of quality assessment by means of noble review.
According to Massy (2003), HEIs need “Honoring the Trust”, these words meaning the
menders of the breach of trust that has been abraded. They can do this by being better
than they actually are, through a continuous and sustained work on the improvement of
“decision quality of education without spending more, dismantling their research
enterprise, or undermining their essential values” (Massy, 2003). Still, this may prove a
very difficult duty as Trow (1994) emphasizes: “Trust cannot be demanded but must be
freely given”. According to Vroeijenstijn (1995), the present attention given to the quality of
higher education may lead to think that this is an invention from the late decades and that
there was no concept of quality prior to 1985. This is, however not true. The quality
decision will always associate in what way leaders make the decision. It is interrelated to
their decision styles hence determine their leadership style.
The shift of decision-making responsibility to producers has had “substantial implications
for institutional governance and management” (Dill, 1995). Starting in the 80’s, and
especially at the political level, there were several voices were raised against the
traditional model of governance and management of HEIs, considered to be inefficient and
outdated to facing the new challenges confronting these organizations (Rosa,
Saraiva&Diz, 2005). Indeed, almost everywhere higher education has been under
pressure to turn into “more accountable and responsive, efficient and effective and, at the
same time, more entrepreneurial and self-managing” (Meek, 2003). Thus, in the last
twenty years, one has assisted to the invasion of the rhetoric and management practices
of the private sector into higher education, which has led to vital changes in the operation
of higher education institutions.
12
According to Elsass and Graves (1997) who contend that the heart of leadership is
decision making, and assuming that the key decisions are increasingly being
decentralized to individuals and groups within organizations, it is important to understand
how the increasing diversity in the sector relates to Malaysia Colleges’ decision making
capacity. Decision-making can be thought at three main levels. Firstly, at the personal
level, this means the individual goes through a common problem solving cycle to make
choices about the personal issues for which they look for solutions. Secondly, at an
aggregate or small group level which the tendency is to integrate more structured
approaches by generally, at least in aspiration, involve rational problem solving strategies
and relate to operational issues. Lastly, level makes up decisions made for the
organization which tend to be more tactical and generally involve the senior management
team, who carry strategic responsibility for their organization.
2.3 Leadership Style
Stated in today’s dictionaries, a leader is defined as an individual who rules, guides or
inspires others. Adult education could learn from and build on models of leadership from
other Fields (Rose, 1992). Shoemaker (1998) suggested that leadership is difficult to
characterize as the field is punctured by inconclusive definitions as to the role and function
of leadership. Leaders mean someone who accompanies people on a journey, guiding
them towards their destination and by implication holds them together as a group while
steering them in the right direction (McCaffery, 2004). The important part of leadership can
be representing the leadership style. Its significance stems from the contribution it makes
to the organization’s success. Gebert and Steinkamp (1991) contend that there is a close
relationship between the leadership styles used in an organization with their economic
success. In addition, leadership styles affect the speed of the product development
(McDonough and Barczak, 1991).
13
Murnighan and Leung (1976) found that undergraduate participants that have been led by
the uninvolved leaders have a less productive in both quality and quantity of the problems
they solved and lower in satisfaction compared to the participants who were led by
involved leaders. Daft (2005) stated that people in organizations all over the world are
feeling the impact of the decision making and other trends and are being forced to adapt
to the new working ways. In this context, leaders are having really difficult jobs to keep
people grounded, focused and motivated toward accomplishing targeted goals. As Daft
(2005) sees it, shifts representing a transition from traditional to new paradigms are having
a dramatic impact on organizations and presenting new challenges for leaders.
Comparing old and new paradigms of leadership, Daft contrasts stability with change and
crisis management, control with empowerment, competition with collaboration, uniformity
with diversity, self-centeredness with higher purpose and hero with humble. Such unstable
situations call for a continuous awareness of the changing human needs in the workplace,
and effective leadership practices to encourage and support people in their achievement
of the decision and organizational goals.
In the current century, a lot of educators have researched leadership contexts and
theoretical foundations of leadership. Yet, most theories on and research about leadership
look at how a person gains the understanding of the values, beliefs, and attitudes of
people from different cultures and define leadership as characterized by the traits,
qualities, and behaviors of the leader. Some argue that leadership is a process and not a
position or a characteristic, but a transactional event that occurs between leaders and
followers (Hughes, Ginnett, &Curphy, 2002; Northouse, 2004). Yukl (2006) explains that
leadership is the process of influencing others to understand and agree about what needs
14
to be done and how to do it and the process of facilitating individual and collective efforts
to accomplish shared objectives.
In contra, Saal and Knight (1988) found that leadership is not necessarily a product of
inborn traits but instead those effective leadership methods can be taught to employees.
Earlier theories and researches about leadership mentioned the internal qualities with
which a person is born but ignored the situational and environmental factors that play a
role in the leader’s level of effectiveness. Boulding (2005) also argued that good leaders
are made not born and that becoming effective leaders requires desire and personal
determination. Good leaders develop through a continuum process of self-study,
education, training, and experience. Furthermore, Yukl (1994) explains that leadership
includes personal influence directed through communication processes towards goal
attainment and influential increment over and above mechanical compliance with
directions and orders for a specified goal or goals. Nevertheless, DuBrin (1995) argues
that in order to be effective, a leader must be aware of the specific tactics needed to
influence others. The essence of leadership is not the leader but the relationship due to
what have been argued by Rost (1993) today scholars discuss the basic nature of such
leadership in terms of the "interaction" among the people involved in the process: both
leaders and followers. Thus, the leadership is not the work of a single person; rather it can
be explained and defined as a "collaborative endeavor" among group members.
Therefore, there are a lot of ways on how to lead since every leader has his or her style.
Some of the styles include autocratic, bureaucratic, democratic, and laissez-faire. The
autocratic leadership style describes that manager retains as much power possible.
Participative leadership motivates others to participate and contribute to making them be
more committed. Effective leaders involve in both personal leadership behaviors and
15
professional leadership behaviors. What means by professional leadership behaviors is to
set a mission, creating a process for achieving goals, aligning processes and procedures,
and basically these activities can be interpreted as the organizational business practices.
The personal leadership behaviors are usually referred to the leadership styles since they
involve building trust, caring for people, acting morally, etc Bennis and Nanus(1985) argue
that leadership style represents an important factor in the determination of the success or
failure of organizations.
It is adequate here to differentiate two vital aspects of leadership. The first is that of
providing direction, organizational vision and making related decisions about resource
allocation and distribution. Leaders achieve this in a lot of ways. Some use autocratic
means, while others utilize democratic or laissez faire approaches (Bernhard & Walsh,
1995; Marrelli, 1997). These leadership styles apply dissimilar sources of power and
impact contrarily on the levels and the extent to which worker consider them as making a
contribution to organizational decision making. Both the quality and extent of staff
participation in decision-making tend to vanish as we shift across the continuum from
laissez faire to autocratic leadership. Three different leadership styles, specifically
transformational, transactional, and laissez-faire, have been shown to reflect the full range
of leadership styles (Bass 1990; Bass & Avolio, 1995). Research on these leadership
styles has found that a transformational leadership style is typically more effective than
transactional and laissez-faire leadership styles. Transformational leaders are consistently
rated by subordinates as being more effective leaders and have been consistently linked
with greater organizational performance and success.
16
2.3.1 Transactional Leadership
Consequently for work exertion, transactional leadership offers pay and numerous
different advantages including the values, honesty, fairness, responsibility and
reciprocity (Yukl, 2006). Yuklalludes the exchange process as the rewards for
compliance. There are two depictions regarding the components of the
transactional behaviors. The transactional behavior comprises of three factors:
“contingent reward”, “active management by exception” and “passive management
by exception”. Northouse (2004) states those components of transactional behavior
as comprising two factors which seem to be “contingent reward” and “management
by exception”. The key component of contingent rewards alludes to the exchange
processes between leaders and followers.
On the past research has indicated transactional contingent reward style leadership
to be positively related to followers’ commitment, satisfaction, and performance
(Hunt & Schuler, 1976; Podsakoff, Todor, Grover, & Huber, 1984; Bycio, Hackett, &
Allen, 1995). Goodwin, Wofford, and Whittington (2001) depicted that there is a
positive relationship between transactional contingent reward leadership and
organizational citizenship behavior, distinguishing transactional leadership that was
more recognition based from that based on setting basic expectations and goals.
What’s more, Goodwin et al. (2001) uncovered that the recognition-based
transactional leadership, which they considered implicit contracting, was more
positively related to followers showing hierarchical citizenship behaviors than was a
transactional leadership based on explicit contracts exchange between the leader
and follower.
17
2.3.2 Transformational Leadership
Daft (2005) explains that transformational leadership is categorized by the
capability to bring about significant change. Transformational leaders have the
capability to conduct changes in the organization’s vision, strategy and culture as
well as encourage innovation in products and technologies. Burn (1978, cited by
Yukl, 1994) identifies transformational leadership as involving sharing, expressing
and mediating conflict among groups of people in addition to motivating individuals.
Yukl (1994) maintains that transformational leadership speaks of the process of
constructing the commitment to the organization’s objectives and allowing followers
to accomplish these objectives. A few theories of transformational leadership also
observe on how leaders change the structure and culture of their organization to be
reliable with management strategies for accomplishing organizational objectives.
Furthermore, Certo (1997) states that transformational leadership as containing
inspiration of organizational success by intensely affecting followers’ beliefs in what
an organization should be, as well as their values, such as justice and integrity. The
model of transformational leadership contains a continuum of transformational,
transactional, and laissez-faire forms of leadership. Each form portrays aspects of
the dynamic procedure of interaction between leader and follower but classifies
certain features and patterns to differentiate transformational leadership from
transactional and laissez-faire styles (Avolio, 1999). The transformational leader
pays specific attention to others’ needs, which, in turn, increases followers’ levels of
motivation (Bass,1998; Avolio, 1999). In addition, a leader of this type inspires
others to reach their full potential while also accepting a strong ethical
characteristic. Transformational leadership contains the ability to motivate and
inspire followers. This approach postulates that activating internal motivators
influence a person. A process-based view of leadership involves the ability to
18
motivate followers to act recognizing that the ability to successfully influence others
is the essence of leadership (Yukl, 1999). The successful and effective leader has
the ability to have their vision was accepted, as well as to inspire followers to work
toward a common end (Chemers, 2001). Effective leadership is enhanced when
leaders can motivate their followers to accept change by communicating a
persuasive vision of the future and motivating willingness to work in a new manner.
Transformational leadership is not a mutually exclusive utility employed by the
leader. As a replacement for, the leader in different circumstances and intensities
may use varying degrees of transformational leadership (Howell &Avolio, 1993).
Moreover, as there have been components of the transformational leadership style
found among the cooperative extension professionals (Paxson, Howell, Michael, &
Wong, 1993; Sandmann& Vandenberg, 1995; Brown, Birnstihl, & Wheeler, 1996;
Moore & Jones,2001), the literature also exposes arguments maintaining that
transformational leadership is the supreme effective style for the acquisition of
external funds as well. Thus, transformational leadership is thought to be critical to
the success of extramural fund acquisition, whereby leaders coherent and
communicate a vision, build a team, inspire and motivate that team, and reflect the
articulated vision over their own personal practices (Grace, 1991; Rosso, 1996;
Joyaux, 1997; Day, 1998). Sequentially, leaders employing the transformational
style are also better able to encourage beneficial relationships with funders (Grace,
1991; Joyaux, 1997; Day, 1998).Still, while the literature maintains that
transformational leadership is the most effective style in resource development
(Grace, 1991; Joyaux, 1997; Day, 1998), there is also a dearth of empirical data
with respect to the degree of success of the transformational leader.
19
Transformational leaders are slanted towards changing both individual and
organization, communicating a vision, and motivating both internal and external
constituents of the organization (Bass, 1985; Kirby, Paradise, & King, 1991;
Joyaux, 1997; Day, 1998; Kark, Shamir, & Chen, 2003). In conclusion,
transformational leadership characteristics positively relate to personal qualities of
the leader and desired organizational outcomes, such as job satisfaction and
organizational effectiveness.
2.3.3 Autocratic and Democratic Leadership
The autocratic leadership style represents that manager hold the biggest power.
These leadership styles practice totally different sources of power and impact
contrastingly on the levels and the extent to which workers believe they are making
a contribution to organizational decision making. Both the quality and extent of
workers participation in decision-making tend to reduce as we have the tendency to
move over the continuum from laissez-faire to autocratic leadership. Applied to
public good dilemmas, autocratic style leaders will do no matter what they feel is
important to provide the common well. They decide which group members ought to
contribute how much without even asking anyone for input.
Whilst the Democratic style leaders are in contra which they will involve group
members in the decision making process. Autocratic leadership can involve either
participative (shared) or consultative decision-making (Vroom &Yetton, 1973; Bass,
1990). A participative leader makes decisions in collaboration with the group
members,usually using majority rules social decision schemes, whereas a
consultative leader makes decisions, after talking with group members concerning
20
their opinions. Research on social dilemmas has shown that group members are
normally unwilling to relegate an autocratic leader to manage with conflicts over the
appropriation of public goods or the protection of public resources. For instance,
Samuelson and Messick (1986) found that rather than having a leader makes all
the decisions for them, group members preferred to divide resources equally
among themselves to avoid a resource crisis (Samuelson, 1993). And Rutte and
Wilke (1985) found that when group members faced a collective resource menace,
they preferred to solve it using the democratic solutions, such as consensus or
majority rules voting instead of using autocratic leadership.
2.3.4 Laissez-faire Leadership
Subsequent research suggested that satisfaction of followers will be lower under
laissez-faire leadership than under autocratic leadership if the latter is non-punitive
or non-punishment-based, appropriate for the followers' levels of capability, or in
keeping with the necessities of the situation. Most frequent, laissez-faire leadership
has been consistently found to be the littlest satisfying and effective management
style. The original observations of Lewin, Lippitt and White (1939) have been
supported in a variety of survey and experimental investigations of the impact of
laissez-faire leadership on subordinates' performance. Laissez-faire leadership has
the scales of Management-by-Exception (passive) and laissez-faire leadership. In
this leadership style, the leader uses Management-by- Exception (passive), which
is only intervening when goals are not achieved or a problem comes up. The
Management-by-Exception leader with a “passive” behavior would not get involved
as long as a problem is not serious. The Management-by-Exception leader
(passive) waits to take action until the mistakes are attracting his or her attention.
Laissez-faire behaviors are ones that make late decisions and give up
21
responsibility. Laissez-faire leaders do not offer feedback or support to the follower.
Laissez-faire leadership is a “hands-off” approach to leadership (Northouse, 2004).
Laissez-faire leadership is also called a “non-leadership” style. The laissez-faire
leader avoids accepting responsibilities, is absent when needed, fails to follow up
on requests for assistance, and resists expressing his or her views on important
issues. The laissez-faire leader gives the majority of control in the decision-making
process to the followers. Laissez-faire leadership assumes that followers are
naturally motivated and should be left alone to achieve goals. The laissez-faire
leader does not provide direction or guidance.
2.4 Decision Theory
The process of decision-making involves identifying and choosing alternatives based on
the values and preferences of a decision maker (Hussain, 2006). Decision making is the
important things in managerial because managerial influenced by technology and global
impact. This theory divided into two styles which are thinking style and decision style.
2.5 Decision Making Style
Now most decision-making involves some degree of agreement rather than just blind
obedience. Modern leadership is more alarmed with gaining commitment rather than
compliance. The most important part of accomplishing motivation is to attend to the most
important needs of the people being led. These include reward, safety, promotion, and
glory.
Decision-making is usually defined as a process of identifying the problems and the
possibilities for their solving (Daft, 1997), which includes the efforts before and after the
decision is made. Implementation of decisions is basically decided by the question that the
22
decision-makers are, and how much are the workers involved in the process. The need for
the change of making the decision in higher education is becoming vital. Increasingly,
students are frustrated with their experiences as education consumers. Seymour (1992)
demonstrates that students want "quality" to extend beyond the size of their school's
endowment or the research credentials of senior faculty.
Study on decision-making styles was hugely done by a lot of researchers. They are mixed
evidence on the value of diversity to organizational decision-making. The increasingly
diverse nature of workplace groups and teams has been documented since the late
1980’s (Johnson & Packer, 1987; Jackson, May & Whitney, 1995).
Since then, abundant of writers have suggested that diverse teams may be advantage-
giving to organizations, especially in performing decision-making tasks (Watson, Kumar &
Michaelsen, 1993; Lumby et al., 2005). Diverse decision-making group members bring
different experiences, values, opinions, expertise and orientations to the complex decision
making processes which lead to the identification and critical examination of diverse
decision alternatives which may, in turn, create performance gains (Jackson et al. 1995).
The State Higher Education Executive Officers convened the National Commission on
Accountability in Higher Education in 2004 to contemplate how “accountability” might
become more effective in improving performance. The Accountability Commission report,
questioning the effectiveness of top-down commands and extensive reporting, argues that
effective accountability approaches will employ clear goals, shared responsibility, a
division of labor, decisive measurement of outcomes, and shared accountability for
improvement (SHEEO, 2007). In several respects, the state examples conversed below
reflects such an approach. Maier (1963) advised that the important situational variables
concerning participative decision making could be classified as quality requirements and
23
subordinate acceptance requirements. Vroom and Yetton (1973) developed a normative
model of leadership decision-making based on Maier's classification. The Vroom-Yetton
model is one of a number of contingency models designed to provide guidance for
managers concerning when and how much subordinate participation should be used. The
model focuses attention on the nature of decisions and attempts to designate conditions
under which participation will be most successful. The Vroom-Yetton model, along with
Heller's (1971) model, might appropriately be classified as hierarchical control models that
derive their principal assumption from the rational design view of organizations. It is
recognized that Heller's work also includes much more, as it is a longitudinal field analysis
of many aspects of management decision making (Heller, Drenth, Koopman, &Rus, 1988).
Since the Vroom-Yetton model is used in this study it will be analyzed in some detail.
2.5.1 Decision Style
Decision style has been referred as "cognitive style, psychological type" or
"problem solving style” (Abdul Rahim, Md Isa, Nik Muhamad & Othman, 2009).
There have three types of decision style, which are decisive, hierarchic, flexible and
integrative. Each style will determine information use and number of options that
should be placed.
2.5.2 Hierarchical Decision Making
Hierarchic decision makers analyze a lot of information and seek input from others
(Nik Muhamad et al., 2009).The hierarchic decision makers like to challenge
varying perspectives or approaches and value making decisions that will withstand
scrutiny. Once their minds are made up, their decisions are final. This decision-
making style consolidates lots of information to produce one option. This
24
characteristic can be convenient, depending upon the application; financial
forecasting and capital procurement decisions come to mind.
2.5.3 Flexible Decision Making
Flexible decision makers are focused on speed and adaptability (Nik Muhamad et
al., 2009). The flexible decision makers acquire just enough information to decide
what to do next and will change course if necessary. This decision making style
works with few options that can change or be replaced as new information gets to
be accessible. Being flexible comes in useful when you have to make decisions in
dynamic and uncertain situations.
2.5.4 Integrative Decision Making
Integrative decision makers consider different components and work with lots of
input (Nik Muhamad et al., 2009).The integrative decision makers develop a wider
perspective of the situation and invite a wide range of perspectives. They flex as
changes arise until time is up and a decision must be made.
This decision-making style utilizes lots of information and produces lots of choices.
It’s convenient for an executive level or managerial decision making in a fast
moving, dynamic conditions where the decision has a big impact on individuals or
resources.
2.6 Research Framework
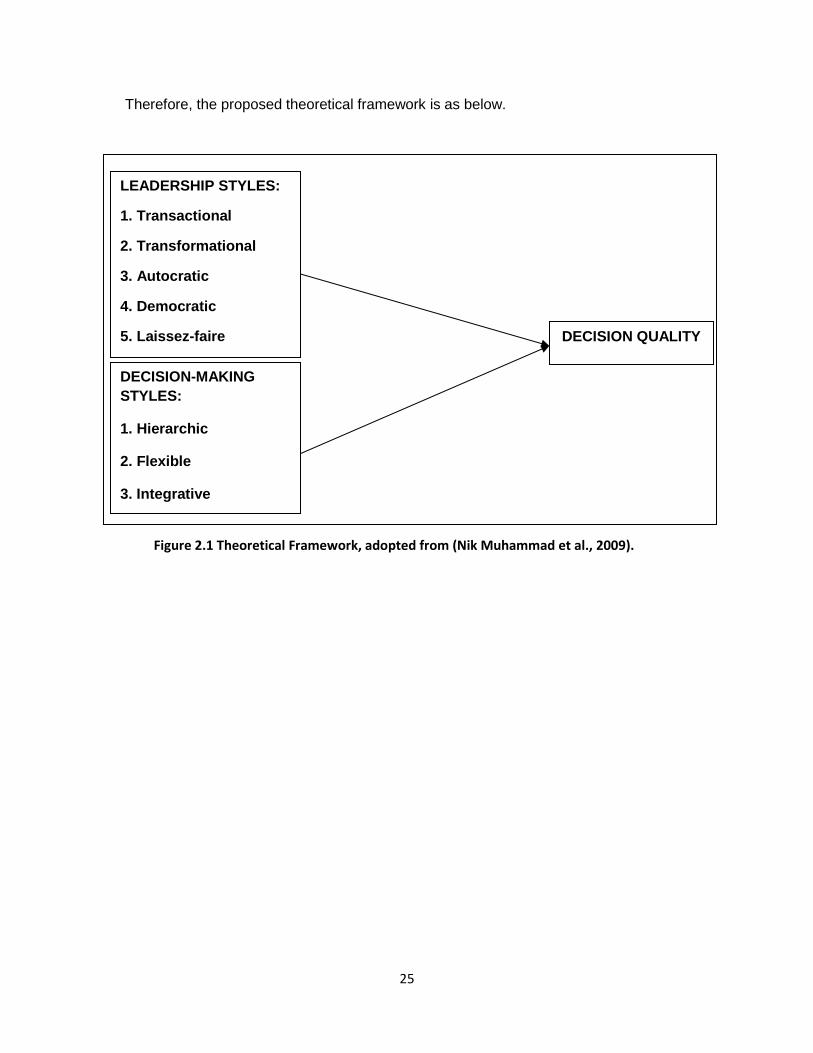
Based on the literature review, the research framework was constructed as depicted in
figure 2.1. In this study, the researchers hypothesized that the leadership style and
decision making styles influence the quality of the decision made.
25
Therefore, the proposed theoretical framework is as below.
Figure 2.1 Theoretical Framework, adopted from (Nik Muhammad et al., 2009).
LEADERSHIP STYLES:
1. Transactional
2. Transformational
3. Autocratic
4. Democratic
5. Laissez-faire
DECISION-MAKING
STYLES:
1. Hierarchic
2. Flexible
3. Integrative
DECISION QUALITY
26
CHAPTER 3: RESEARCH METHODOLOGY
3.1 Introduction
This chapter will describe the research methodology, population, sampling technique,
sample size, design, data collection method and questionnaire. Research methodology is
a process which is finding a solution to a problem in order to achieve the objective of the
study. This study conducted among the leaders of Universiti Teknologi Mara Selangor.
3.2 Research Design
The research design is a representation of a group, evaluation, and interpretation of data
based on the research questions of the study (Sekaran & Bougie, 2010). This shows that
research design will operate as a framework for the researchers in guiding collection and
analysis of data to arrive at the solution of the problem that leads to the research project.
In addition, descriptive research is managed in order to determine and illustrate the
features of all the variables in this study. The researchers interact with the participant to
distribute a survey to collect the required information.
3.3 Sampling
Sampling is the procedure of selecting a reasonable number of units or people from a
population of interest to make the study practically generalize the result back to the
population. The important steps of the sampling are to explain the population, sample
frame, and discover the sampling size and to complete the sampling process.
3.3.1 Sampling Design
This research applies Simple Random Sampling which is a probability sampling as
a sampling technique. The elements in the sampling have a known or
predetermined chance of being selected as subjects (Sekaran&Bougie, 2013).
27
The lists of leaders in Universiti Teknologi MARA Selangor are sourced from
Universiti Teknologi MARA Selangor directory. The name list of the leaders is then
copied and pasted into an Excel spreadsheet. The column next to the leaders
names which are Column A will then be pasted with the function =RANDO(). The
function =RANDO() is the method that Excel uses to place a random number
between 0 and 1. Both columns are then sorted by the random number. Next, the
list would then be rearranged from the lowest to the highest random number.
Finally, the first 130 names are selected from the final list. The questionnaires were
then distributed to the respondents via email. Since it is a Simple Random
Sampling, it is less bias and offers the most generalizability as compared to the
other sampling techniques.
3.3.2 Population of Study
Population refers to the whole team of attention according to the features. The
target population is the target of the large group of people to whom the survey
appeals for. Population chosen should be suitable with the characteristic of this
study.
The target population in this study is the leaders of Universiti Teknologi Mara
Selangor.
3.3.3 Sample Size
In order to determine the sample size, the researchers used a table that has been
simplified by Krejcie and Morgan (1970) as a guideline. Please refer to the
Appendices section to view the Krejcie and Morgan sample size guideline.
28
Based on the table, Krejcie and Morgan (1970) proposed that if the population (N)
is 130, the sample size will be 97. Additionally, according to Roscoe (1975), sample
sizes that are larger than 30 and less than 500 are appropriate for most research.
Thus, in this research, as the population for this research is 130, the sample size
that is appropriate will be 97. Unfortunately, the researchers only manage to get 52
respondents that response to the questionnaires. Thus, a 54% response rate,
which is equal to 52 respondents is considered as adequate.
3.4 Data Collection Method
Data collection methods are the most important part of research design. There are quite a
few data collection methods such as Interviews, Observation, Questionnaires, Physical
Measurements and Unobtrusive. Each of these methods has their own benefits and also
caveats.
In this research, the researchers used questionnaires as the data collection method. The
data are collected by electronic questionnaires. The benefits gained by the researchers in
using questionnaires were that it is inexpensive when administered to a group of
respondents as the questionnaires were distributed by email. It is also easier to administer
and the respondents can respond to the questionnaires at their own convenient time.
Besides that, the delivery time is very fast. However, some of the caveats are that the
respondents must be willing to complete and answer the questionnaire and electronic
questionnaires have the lowest response rate. Thus, a 30% response rate is considered
acceptable (Sekaran & Bougie, 2013).
Besides that, the researchers also used secondary data as their resources. The
secondary data were obtained from existing data such as news articles, journals, reports
29
and theses. This secondary data helps in terms of information discovery and obtaining
details about the topic chosen for this research.
3.5 Questionnaire
The questionnaire is adopted from Dulewicz, Higgs and Partington (2003). Besides that,
the questionnaire has been through normality test. The result shows that the data is drawn
from a normal distribution. The questionnaire is divided into three parts altogether. The
first part is Part A, which covers the respondents’ demographic profile. Meanwhile, Part B
consists of twenty questions regarding leadership styles. Part C consists of ten questions
regarding decision-making styles. Lastly, part D consists of five question regarding
decision quality. The respondents were asked to provide a response ranking from 1 -
Strongly Disagree to 5 – Strongly Agree based on the 5-point Likert scale.
3.6 Data Analysis
After all the data has been collected from a representative population, the researchers
then analyze the data to test the research hypothesis. The Statistical Package for the
Social Science (SPSS) program will be used to analyze the data. Some opening steps
need to be complete before the researchers continue with the analyzing process. These
steps will assure that the data are practically good to pursue further analysis.
The first step is to get the data ready for analysis such as editing the data, handling blank
responses, coding data, categorizing data, creating a data file and programming. The
second step is to get a feel for the data by checking the central tendency and dispersion
using descriptive statistics. The mean in the data will give the researchers a bright idea on
how respondents react to the questions in the questionnaire.
30
The nest step is to test the goodness of the data. The reliability and validity of the
measures can now be tested. Cronbach’s Alpha testing will be using to test the reliability
and next will be the well-validated measures are used, there is no need to establish the
validity again for the next study. Through SPSS, the researchers have used the frequency
distribution and descriptive statistics to test the variables.
3.7 Conclusion
This chapter overall explains the research methodology that describes the approach,
method and technique that are used in this study in order to collect and analyze all the
data. The data for this study will be presented and explained in the next chapter.
31
CHAPTER 4: FINDINGS AND DATA ANALYSIS
4.1 Introduction
This chapter will discuss the research findings. For this research, electronic
questionnaires were used to determine the leadership and decision styles that affecting
the decision quality among the leaders of Universiti Teknologi MARA Selangor. The total
population of leaders of Universiti Teknologi MARA Selangor is 130, thus the sample size
for this research is 97 (Krejcie & Morgan, 1970). Consideration of fact that electronic
questionnaires have the lowest response rate then, the researchers distributed 130
electronic questionnaires in order to obtain a higher response rate to achieve the desired
sample size. However, the researchers only managed to record 52 responses which are a
54% response rate.
The results of the data analysis will be described in the form of the reliability analysis,
Cronbach’s alpha of the variables, profile of the respondents, descriptive analysis,
correlation coefficient analysis and multiple regression analysis. The generated results
solely rely on the research objectives established by the researchers. Please refer to the
Appendices section for the SPSS output.
4.2 Findings and Analysis
4.2.1 Reliability Test
The Cronbach’s alpha reliability coefficient test is used to check the reliability and
validity of the collected data. The scale of measurement is used to access the
reliability of Leadership Styles, Decision-making Styles, and Decision Quality.
Cronbach’s alpha ranges from 0 to 1 (Sekaran&Bougie, 2013). The closer the
measurement is to 1, the more reliable the data, and the closer the measurement is
to 0, the lesser the data reliability. Table 4.1 shows the rule of thumb for the
32
Cronbach’s alpha coefficient value as suggested by Hair, Babin, Money, &
Samouel (2003) to measure the reliability strength.
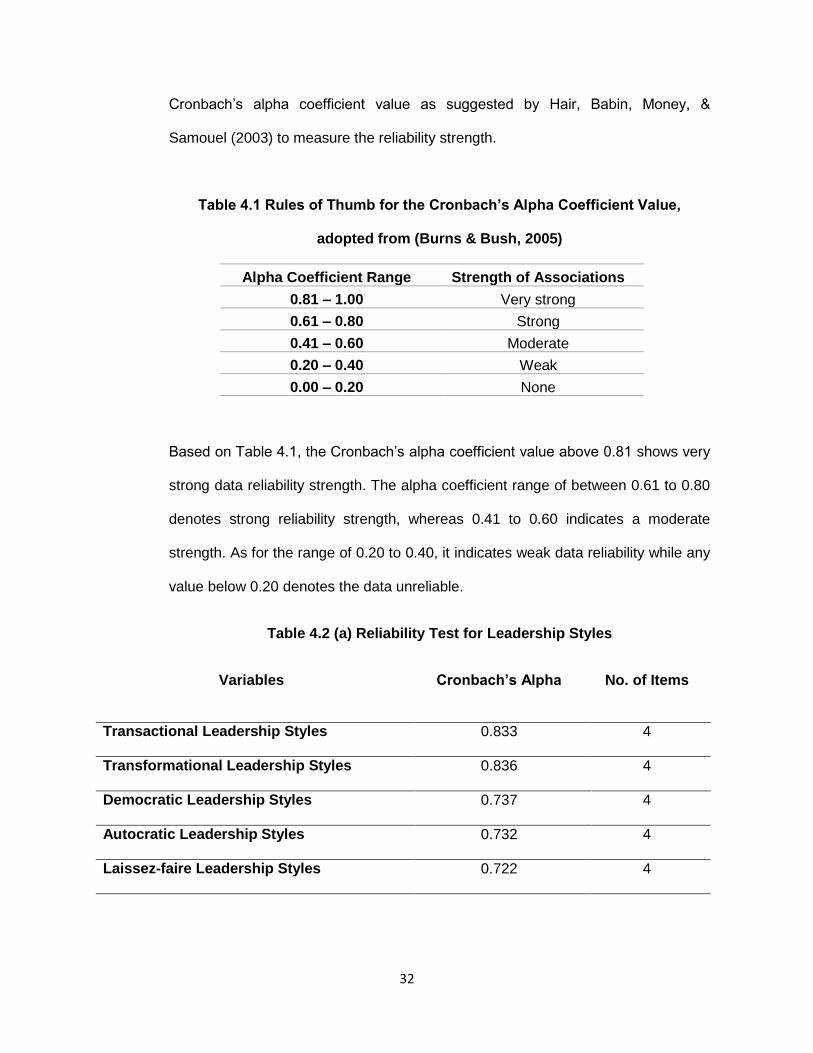
Table 4.1 Rules of Thumb for the Cronbach’s Alpha Coefficient Value,
adopted from (Burns & Bush, 2005)
Alpha Coefficient Range Strength of Associations
0.81 – 1.00 Very strong
0.61 – 0.80 Strong
0.41 – 0.60 Moderate
0.20 – 0.40 Weak
0.00 – 0.20 None
Based on Table 4.1, the Cronbach’s alpha coefficient value above 0.81 shows very
strong data reliability strength. The alpha coefficient range of between 0.61 to 0.80
denotes strong reliability strength, whereas 0.41 to 0.60 indicates a moderate
strength. As for the range of 0.20 to 0.40, it indicates weak data reliability while any
value below 0.20 denotes the data unreliable.
Table 4.2 (a) Reliability Test for Leadership Styles
Variables
Cronbach’s Alpha No. of Items
Transactional Leadership Styles 0.833 4
Transformational Leadership Styles 0.836 4
Democratic Leadership Styles 0.737 4
Autocratic Leadership Styles 0.732 4
Laissez-faire Leadership Styles 0.722 4
33
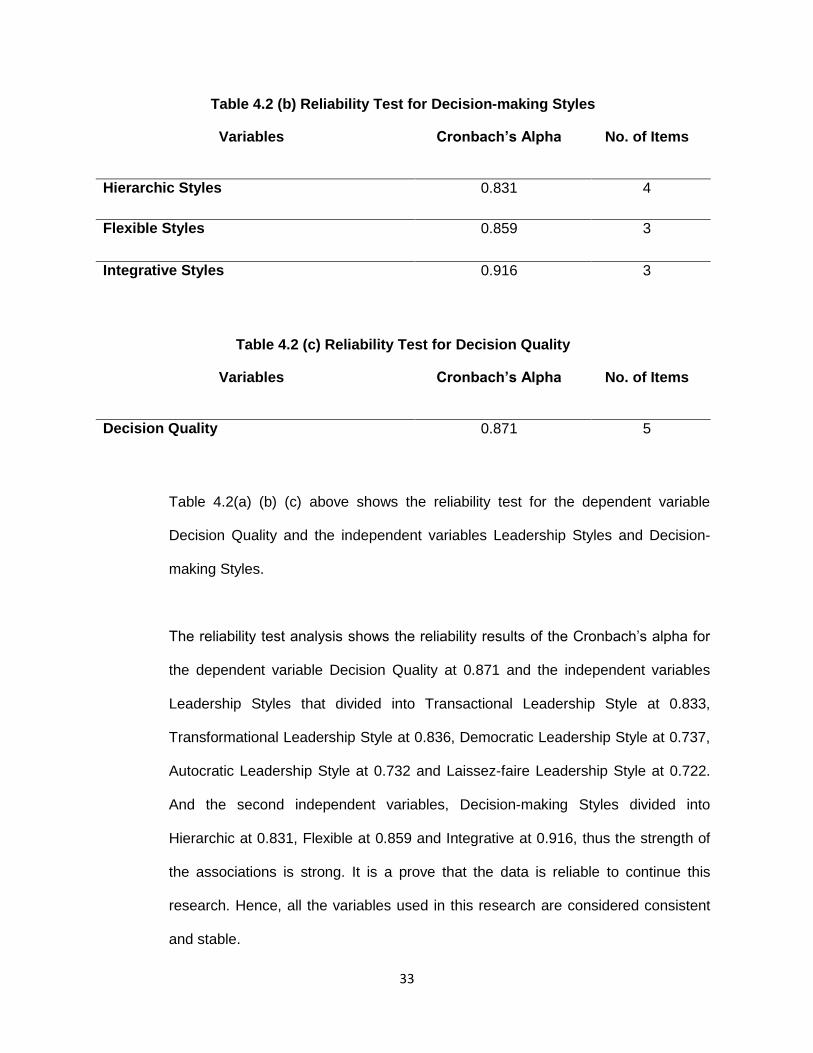
Table 4.2 (b) Reliability Test for Decision-making Styles
Variables
Cronbach’s Alpha No. of Items
Hierarchic Styles 0.831 4
Flexible Styles 0.859 3
Integrative Styles 0.916 3
Table 4.2 (c) Reliability Test for Decision Quality
Variables
Cronbach’s Alpha No. of Items
Decision Quality 0.871 5
Table 4.2(a) (b) (c) above shows the reliability test for the dependent variable
Decision Quality and the independent variables Leadership Styles and Decision-
making Styles.
The reliability test analysis shows the reliability results of the Cronbach’s alpha for
the dependent variable Decision Quality at 0.871 and the independent variables
Leadership Styles that divided into Transactional Leadership Style at 0.833,
Transformational Leadership Style at 0.836, Democratic Leadership Style at 0.737,
Autocratic Leadership Style at 0.732 and Laissez-faire Leadership Style at 0.722.
And the second independent variables, Decision-making Styles divided into
Hierarchic at 0.831, Flexible at 0.859 and Integrative at 0.916, thus the strength of
the associations is strong. It is a prove that the data is reliable to continue this
research. Hence, all the variables used in this research are considered consistent
and stable.
34
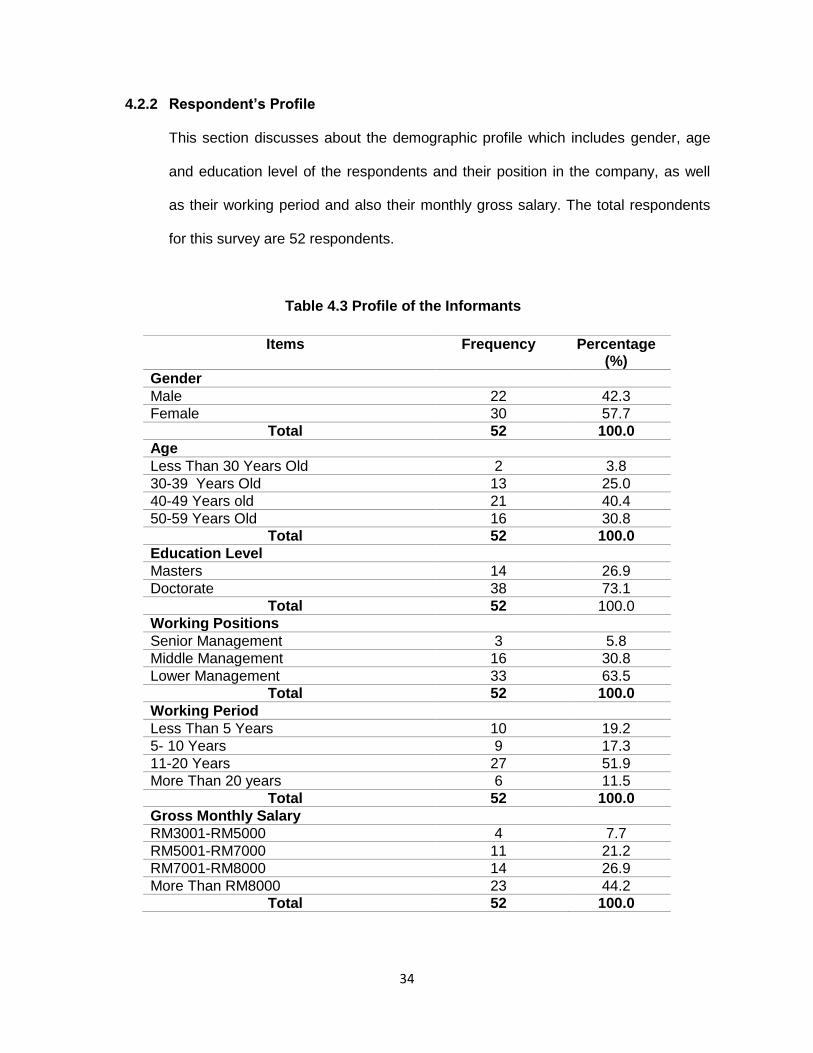
4.2.2 Respondent’s Profile
This section discusses about the demographic profile which includes gender, age
and education level of the respondents and their position in the company, as well
as their working period and also their monthly gross salary. The total respondents
for this survey are 52 respondents.
Table 4.3 Profile of the Informants
Items Frequency Percentage (%)
Gender
Male 22 42.3
Female 30 57.7
Total 52 100.0
Age
Less Than 30 Years Old 2 3.8
30-39 Years Old 13 25.0
40-49 Years old 21 40.4
50-59 Years Old 16 30.8
Total 52 100.0
Education Level
Masters 14 26.9
Doctorate 38 73.1
Total 52 100.0
Working Positions
Senior Management 3 5.8
Middle Management 16 30.8
Lower Management 33 63.5
Total 52 100.0
Working Period
Less Than 5 Years 10 19.2
5- 10 Years 9 17.3
11-20 Years 27 51.9
More Than 20 years 6 11.5
Total 52 100.0
Gross Monthly Salary
RM3001-RM5000 4 7.7
RM5001-RM7000 11 21.2
RM7001-RM8000 14 26.9
More Than RM8000 23 44.2
Total 52 100.0
35
Based on Table 4.3, 30 female respondents took up 57.7% of the total number of
respondents whereas the male respondents were only 42.3% of 20 individuals.
From the table above, it can be concluded that females dominate the male
respondents.
Next, it shows that 40.4% respondents are at the age between 40 to 49 years old,
30.8% of the respondents age between 50 to 59 years old and 25% of the total
respondents are n the range of 30 to 39 years old. The lowest percentage is 3.8%
which consists of the respondents in less than 30 years old.
In terms of the level of education, 73.1% holds Doctorate Degree and the rest of
them, 26.9% hold Masters Degree.
The majority of the respondents is in the lower management (63.5%) designated as
research leaders, coordinators and project leaders and followed by middle
management (30.8%) designated as deputy dean and head of department or
program and lastly followed by senior management (5.8%) designated as dean and
campus director.
Only 11.5% of the total respondents have been working more than 20 years old. It
is followed by 17.3% which works between 5 to 7 years and 19.2% work less than 5
years. The highest percentage is 51.9% have been working between 11 to 20
years.
Almost half of the total number of respondents that took up 44.2% received a gross
monthly salary more than RM8000, while 26.9% receive in the range of RM7001 to
RM8000 followed by 21.2% of the respondents earn about RM5001 to RM7000.
And there are only 7.7% of the respondents earn between RM3001 to RM5000 per
month.

36
4.2.3 Descriptive Statistics
Descriptive statistics are usually used to describe the basic features of the data in a
study. As a recap, the dependent variable of this research is Decision Quality while
the independent variables consist of Leadership Styles and Decision-making
Styles. Leadership styles are divided into five divisions which are Transactional
Leadership, Transformational Leadership, Democratic Leadership, Autocratic
Leadership and Laissez-faire Leadership. While the Decision-making Styles are
divided into three divisions which are Hierarchic, Flexible and Integrative. The table
below shows the descriptive statistics of the variables for each item that consisted
of 52 respondents which show the mean and standard deviation.
Table 4.4 Summary of Descriptive Analysis for Each Variable
Variables
Mean Standard
Deviation
Leadership Styles Transactional 4.5144 0.42
Transformational 4.5433 0.43
Democratic 4.3221 0.51
Autocratic 4.0962 0.54
Laissez-faire 4.1010 0.61
Decision-making
Styles
Hierarchic 4.1346 0.60
Flexible 3.7628 0.63
Integrative 4.1474 0.66
Decision Quality 4.2077 0.51
37
Table 4.4 shows a descriptive analysis summary for the dependent variable
Decision Quality and the independent variables Leadership Styles and Decision-
making Styles.
It is clearly shown that the mean for Transformational Leadership Style is the
highest amongst the other variables where the total mean is 4.54 with a standard
deviation of 0.43. This is followed by Transactional Leadership Style at 4.51, with
standard deviation of 0.42, Democratic Leadership Style at 4.32 (standard deviation
= 0.0.51), Decision Quality at 4.21 (standard deviation = 0.51), Integrative Decision-
making Style at 4.15 (standard deviation = 0.66), Hierarchic Decision-making Style
at 4.14 (standard deviation = 0.60), Laissez-faire Leadership Style at 4.10
(standard deviation = 0.61) and Autocratic Leadership Style at 4.10 (standard
deviation = 0.61). Flexible Decision-making Style has the least mean of 3.76 with a
standard deviation of 0.63.
4.2.4 Correlation Coefficient Analysis
The correlation analysis and regression technique were also used in this research
to measure the relationship between the variables. The formula for calculating the
correlation coefficient from sample data is as follows:
r = [ 1 / (n - 1) ] * Σ { [ (xi - x) / sx ] * [ (yi - y) / sy ] }
where n is the number of observations in the sample, xi is the x value for
observation i, x is the sample mean of x, yi is the y value for observation i, y is the
sample mean of y, sx is the sample standard deviation of x, and sy is the sample
standard deviation of y.
38
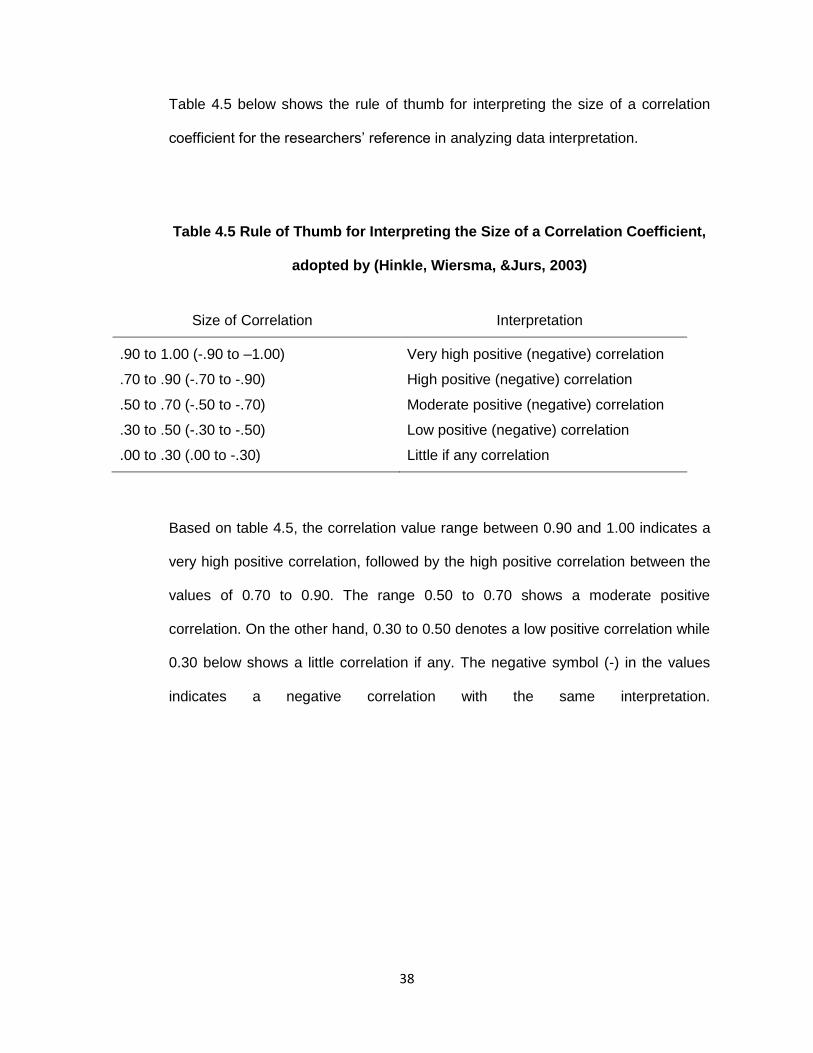
Table 4.5 below shows the rule of thumb for interpreting the size of a correlation
coefficient for the researchers’ reference in analyzing data interpretation.
Table 4.5 Rule of Thumb for Interpreting the Size of a Correlation Coefficient,
adopted by (Hinkle, Wiersma, &Jurs, 2003)
Size of Correlation Interpretation
.90 to 1.00 (-.90 to –1.00) Very high positive (negative) correlation
.70 to .90 (-.70 to -.90) High positive (negative) correlation
.50 to .70 (-.50 to -.70) Moderate positive (negative) correlation
.30 to .50 (-.30 to -.50) Low positive (negative) correlation
.00 to .30 (.00 to -.30) Little if any correlation
Based on table 4.5, the correlation value range between 0.90 and 1.00 indicates a
very high positive correlation, followed by the high positive correlation between the
values of 0.70 to 0.90. The range 0.50 to 0.70 shows a moderate positive
correlation. On the other hand, 0.30 to 0.50 denotes a low positive correlation while
0.30 below shows a little correlation if any. The negative symbol (-) in the values
indicates a negative correlation with the same interpretation.

39
Table 4.6 Correlations Coefficient Analysis of Leadership Styles (Transactional, Transformational, Democratic, Autocratic,
Laissez-faire), Decision-making Styles (Hierarchic, Flexible, Integrative) and Decision Quality
Decision Quality
Transactional Transformational Democratic Autocratic Laissez-faire
Hierarchic Flexible Integrative
Decision Quality
1
52
Transactional
.579** 1
.000
52 52
Transformational
.366* .633** 1
.008 .000
52 52 52
Democratic
.532** .538** .683** 1
.000 .000 .000
52 52 52 52
Autocratic
.554** .799 .533** .438** 1
.000 .000 .000 .001
52 52 52 52 52
Laissez-faire
.688** .485** .304* .439** .566** 1
.000 .000 .028 .001 .000
52 52 52 52 52 52
Hierarchic
.978** .509** .244 .465** .485** .629** 1
.000 .000 .082 .001 .000 .000
52 52 52 52 52 52 52
Flexible
.627** .228 .207 .330* .335* .287* .606** 1
.000 .104 .142 .017 .015 .039 .000
52 52 52 52 52 52 52 52
Integrative
.207 .308* .160 .036 .148 .130 .208 .456** 1
.141 .026 .256 .801 .294 .359 .139 .00q
52 52 52 52 52 52 52 52 52
**. Correlation is significant at the 0.01 level (2-tailed). *. Correlation is significant at the 0.05 level (2-tailed).
40
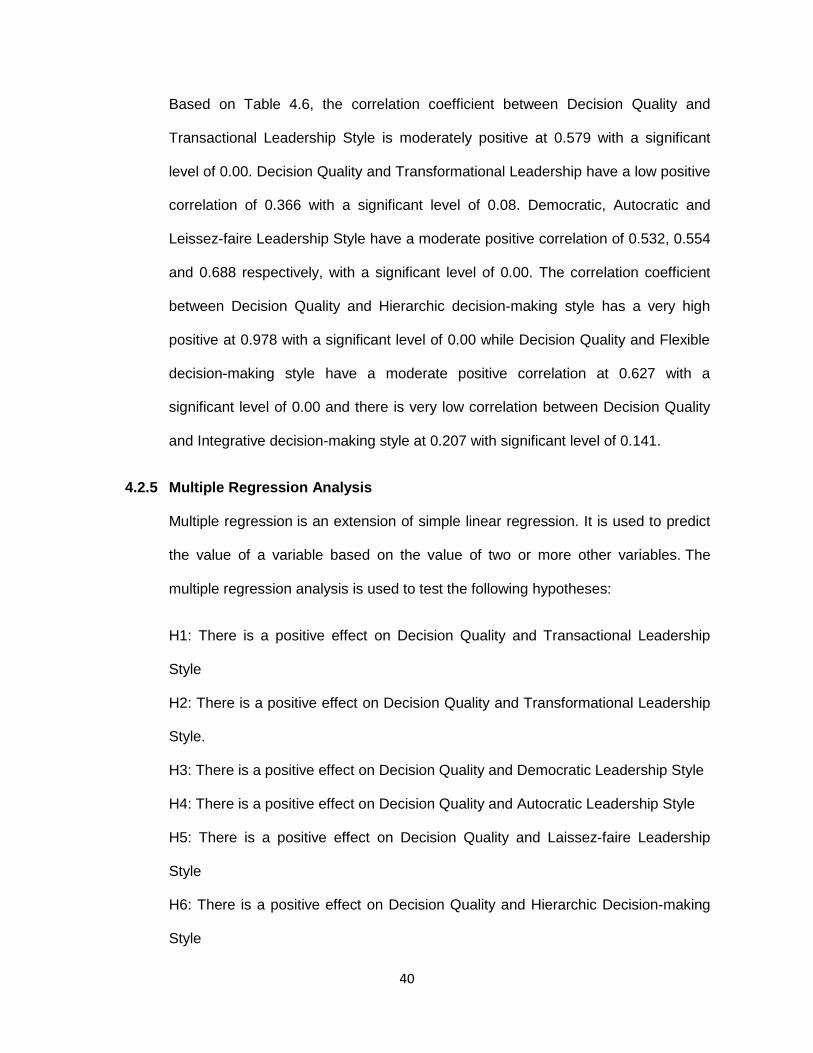
Based on Table 4.6, the correlation coefficient between Decision Quality and
Transactional Leadership Style is moderately positive at 0.579 with a significant
level of 0.00. Decision Quality and Transformational Leadership have a low positive
correlation of 0.366 with a significant level of 0.08. Democratic, Autocratic and
Leissez-faire Leadership Style have a moderate positive correlation of 0.532, 0.554
and 0.688 respectively, with a significant level of 0.00. The correlation coefficient
between Decision Quality and Hierarchic decision-making style has a very high
positive at 0.978 with a significant level of 0.00 while Decision Quality and Flexible
decision-making style have a moderate positive correlation at 0.627 with a
significant level of 0.00 and there is very low correlation between Decision Quality
and Integrative decision-making style at 0.207 with significant level of 0.141.
4.2.5 Multiple Regression Analysis
Multiple regression is an extension of simple linear regression. It is used to predict
the value of a variable based on the value of two or more other variables. The
multiple regression analysis is used to test the following hypotheses:
H1: There is a positive effect on Decision Quality and Transactional Leadership
Style
H2: There is a positive effect on Decision Quality and Transformational Leadership
Style.
H3: There is a positive effect on Decision Quality and Democratic Leadership Style
H4: There is a positive effect on Decision Quality and Autocratic Leadership Style
H5: There is a positive effect on Decision Quality and Laissez-faire Leadership
Style
H6: There is a positive effect on Decision Quality and Hierarchic Decision-making
Style
41
H7: There is a positive effect on Decision Quality and Flexible Decision-making
Style
H8: There is a positive effect on Decision Quality and Integrative Decision-making
Style
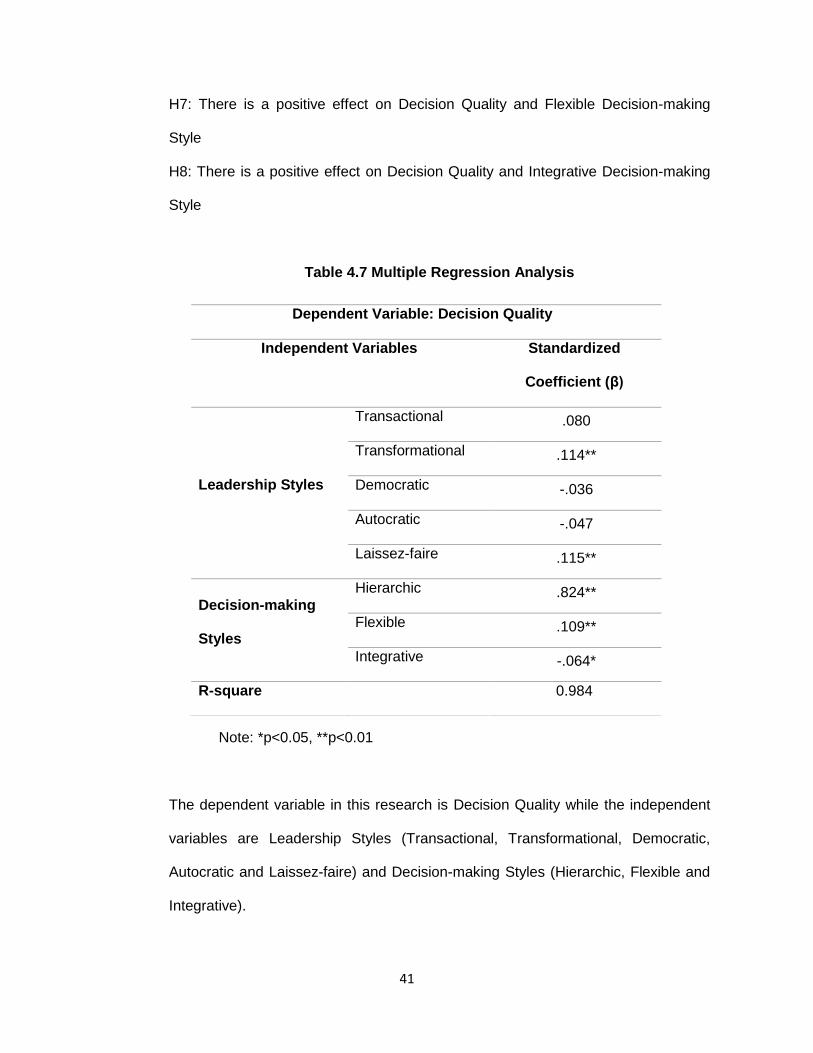
Table 4.7 Multiple Regression Analysis
Note: *p<0.05, **p<0.01
The dependent variable in this research is Decision Quality while the independent
variables are Leadership Styles (Transactional, Transformational, Democratic,
Autocratic and Laissez-faire) and Decision-making Styles (Hierarchic, Flexible and
Integrative).
Dependent Variable: Decision Quality
Independent Variables Standardized
Coefficient (β)
Leadership Styles
Transactional .080
Transformational .114**
Democratic -.036
Autocratic -.047
Laissez-faire .115**
Decision-making
Styles
Hierarchic .824**
Flexible .109**
Integrative -.064*
R-square 0.984
42
Based on Table 4.7, the R-Square = 0.984 indicates that 98.4% of the dependent
variable which is the Decision Quality is explained by all the independent variables
such as Leadership Styles and Decision-making Styles as stated above.
The standardized coefficient or beta coefficient indicates that Transformational
Leadrship Style (β = 0.114, p < 0.01) has a significant influence on Decision
Quality. Moreover, the standardized coefficient or beta coefficient of Laissez-faire
Leadership Style (β = 0.115, p < 0.01) shows a significant effect on Decision
Quality. Hierarchic (β = 0.824, p < 0.01), Flexible (β = 0.109, p < 0.01) and
Integrative (β = -0.064, p < 0.05) Decision-making Styles also show a significant
effect on Decision Quality.
On the other hand, Transactional, Democratic and Autocratic Leadership Style are
insignificant in affecting Decision Quality. It can be concluded that only
Transactional Leadership Style, Laissez-faire Leadership Style, Hierarchic, Flexible
and Integrative Decision-making Style are significantly related to Decision Quality.
4.2.6 Hypotheses Testing
The objective of this survey was to identify the effect between Decision Quality and
the Leadership Style (Transactional, Transformational, Democratic, Autocratic and
Laissez-faire) as well as the Decision-making Style ( Hierarchic, Flexible and
Integrative) . Table 4.8 shows the results of the hypotheses test:
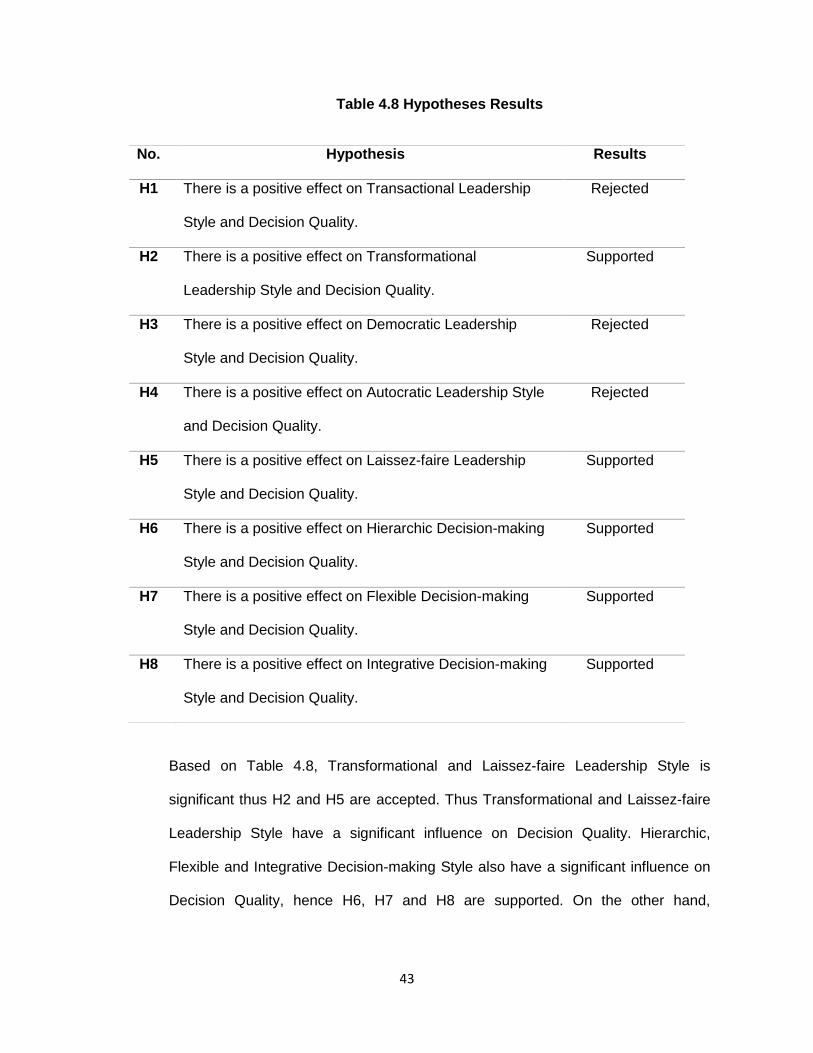
43
Table 4.8 Hypotheses Results
Based on Table 4.8, Transformational and Laissez-faire Leadership Style is
significant thus H2 and H5 are accepted. Thus Transformational and Laissez-faire
Leadership Style have a significant influence on Decision Quality. Hierarchic,
Flexible and Integrative Decision-making Style also have a significant influence on
Decision Quality, hence H6, H7 and H8 are supported. On the other hand,
No. Hypothesis Results
H1 There is a positive effect on Transactional Leadership
Style and Decision Quality.
Rejected
H2 There is a positive effect on Transformational
Leadership Style and Decision Quality.
Supported
H3 There is a positive effect on Democratic Leadership
Style and Decision Quality.
Rejected
H4 There is a positive effect on Autocratic Leadership Style
and Decision Quality.
Rejected
H5 There is a positive effect on Laissez-faire Leadership
Style and Decision Quality.
Supported
H6 There is a positive effect on Hierarchic Decision-making
Style and Decision Quality.
Supported
H7 There is a positive effect on Flexible Decision-making
Style and Decision Quality.
Supported
H8 There is a positive effect on Integrative Decision-making
Style and Decision Quality.
Supported
44
Transactional, Democratic and Autocratic Leadership Style have no significant
effect on Decision Quality, so H1, H3 and H4 is rejected.
4.3 Conclusion
This Chapter overall explains about the research data analysis that gathered from all of
the respondents. The data collected can generate some conclusions and will be explained
in the next chapter.
45
CHAPTER 5: CONCLUSIONS AND RECCOMENDATIONS
5.1 Introduction
In this chapter researchers will answer all the research questions and achieved the
researchers’ objection based on the findings and all the data analysis found from the
previous chapter. The researchers also will give some recommendation for the purpose of
the study.
5.2 Conclusions
As a conclusion, this research was conducted to investigate the factors influencing
decision quality made by the leaders of UiTM Selangor.
5.2.1 Leadership Styles
Researcher also achieved research objective 1 whereby based on findings, it
showed that the level of means from transactional, transformational, democratic,
autocratic and laissez-faire is more than 4. In addition, findings show that the
highest variables among the others are transformational leadership style where the
total mean is 4.54. Fielder (1996), said that transformational leadership style may
instil effective communication, individual needs and strengths, trust, loyalty, energy,
vision and creativity within the unified process of completing a task or goal.
Independent variables such as transformational, transactional and laissez-faire
have significance affect with decision quality. From the result, transactional
leadership style has moderate relationship with decision quality at value 0.579.
Moreover, democratic, autocratic and laissez-faire has a moderate positive
relationship with decision quality with value 0.532, 0.554 and 0.688 each.
46
5.2.2 Decision Making Styles
Refer to the findings, research objective 2 showed that the total means from all
factors which are hierarchic, flexible and integrative is more than 3. However
based on outcome in this study, it showed that hierarchic and integrative was the
most decision making style that influence leaders in UiTM Selangor. These happen
because there is not much difference figure between hierarchic and integrative.
For decision making style, hierarchic has a very high positive relationship at value
0.978 while flexible decision making style has moderate positive relationship at
value 0.627. Lastly, integrative decision making style has very low relationship with
decision quality at value 0.207.
5.3 Recommendations
There are several recommendation that the researcher would like to suggest in order to
improve the decision making quality. By giving the recommendations, it may help future
researchers in other researcher.
5.3.1 Improve skills of leadership and decision style.
Leadership and decision style need some changing by apply the right styles of
leadership and decision style that may help leaders to contribute higher productivity
in decision quality. Researchers recommended to leaders by studies in larger
scope in both institutions which are other branches, private and public institutions.
Besides, from both view and observations, leaders may seek more collaboration
with other institutions to exchange knowledge in making quality decision.
Collaborations with other institutions or branches, it can improve leaders ideas and
be more creative that will benefit to them.
47
5.3.2 Documented Decision Making Process
Based on this study, researchers suggest to leaders by documented all the
leadership and decision making information for future researcher. As a example, to
be expert leaders in organizations, leaders should know technique on decision
making that can be absorb from local leaders and all the technique should compile
in documentations.
48
BIBLIOGRAPHY
Avolio, B. J. (1999). Full leadership development: Building the vital forces in organizations.
Thousand Oaks, CA: Sage.
Bass, B.M. (1990), Handbook of leadership: A Survey of theory and research. New York; Free
Press.
Bass, B. (1985). Leadership and Performance Beyond Expectations. New York: Free Press.
Bennis, W.G, & Nanus, B. (1997). Leaders: Strategies for taking charge (2nd ed.). New York:
Harper Business.
Bennis,W.G & O’Toole, J.(2005). “How Business Schools Lost Their Ways”, Harvard Business
Review, May, 96-104
Bernhard, L. A. & Walsh, M. A. (1995) (3rd ed.) Leadership: the key to the professionalisation of
nursing, Missouri: Morsby.
Bergquist, H. (1992). The Four Cultures of the Academy: Insights and Strategies for Improving
Leadership in Collegiate Organizations. San Francisco. Jossey-Bass
Bulger, W.M. (2005), Leadership in Higher Education. [Online.] Available:
http://www.polisci.new.edu/.../faculty_research/symposia_retated/documents/Bulgerleadrship in
Higher Education.pdf. Accessed 11 July, 2005.
Burns, J. M. (1978). Leadership. New York: Harper Row.
Cobban, A.B. (1988) The Medieval English Universities; Oxford and Cambridge to C. 1500.
Berkeley: University of California Press
Certo, S.C. (1997), Modern Management. New Jersey : Prentice-Hall, Inc.
Chemers, M. M. (2001). Leadership effectiveness: An integrative review. In M. A.Hogg, & R. bS.
Tindale (Eds.) Blackwell handbook of social psychology: Group processes, Oxford, United
Kingdom: Blackwell Publishing
Daft, R.L. (2005), The Leadership Experience (Third Edition). Australia: Thomson.
Dill, D. (1995). Through Deming’s Eyes: a cross-national analysis of quality assurance policies
49
in higher education. Quality in Higher Education, 1, 95-110.
Daft, L.R. (1997). Management, Fourth Edition, The Dryden Press, New York.
Boulding, K. (2005), Concepts of Leadership “The image: knowledge in life and Society”.
[Online.] Available: http://www/nwlink.com/~donclark/leader/leadcon.html. Accessed 9 April,
2005.
DuBrin, A.J. (1995), Leadership: Research Findings, Practice, and Skills. Boston: Houghton
Mifflin Company.
Elsass, P. M. & Graves, (1997) Demographic Diversity in Decision making groups: the
experiences of women and people of colour, Academy of Management Review, 22, (4) 946-973.
Filzah, M.I., Nik, M., Rosli, A.R., & Siti, N.R. (2009). “Decision Making Quality of Higher
Education Institutions Leaders In Malaysia: Leadership Style and Decision Style.
Gardner, J. (1990), On Leadership. New York: Free Press.
Grace, K. (1991). Leadership and team building. In H. Rosso (Ed.) Achieving Excellence in
Fundraising (pp. 161-173). San Francisco, CA: Jossey-Bass.
Greenfield, T. B. (1978). Reflections on Organization Theory and the Truths of Irreconcilable
Realities. Educational Administration Quarterly 14 (2), 1 – 23.
Goodwin, V. L., Wofford, J. C., & Whittington, J. L. (2001). A theoretical and empirical extension
to the transformational leadership construct. Journal of Organizational Behavior, 22, 759–774.
Heller, F. (1971). Managerial Decision Making: A Study of Power Sharing among Senior
Managers. London: Tavistock.
Heller, F., Drenth, P., Koopman, P. & Rus. Z. (1988). Decisions m Organizations. Newbury Park.
CA; Sage.Hughes, R.L., Ginnett, R.C., & Curphy, G.J. (2002), Leadership Enhancing the
Lessons of Experience. Boston: McGraw-Hill.
Hughes, R.L., Ginnett, R.C., & Curphy, G.J. (2002), Leadership Enhancing the Lessons of
Experience. Boston: McGraw-Hill.
Hunt, J. G., & Schuler, R. S. (1976). Leader reward and sanctions: Behavior relations criteria in
a large public utility. Carbondale: Southern Illinois Press.
50
Johnson, W. B. & Packer, A. E. (1987) Workforce 2000, Work and workers for the 21st century:
Washington DC: Department of Labour 12.
Jackson, S. E., May, K. E. & Whitney, K. (1995) Understanding the Dynamics of diversity in
decision making teams in R.A. Guzzo et al, (1995) Team effectiveness and decision making in
organisations: San Fransisco: Jossey-Bass.
Kirtikara, K. (2002), Thai Public University System in Transition: Some Issues on Management
and Financing. Bangkok: King Mongkut’s University of Technology Thonburi.
Lewin, K., Lippitt, R., & White, R. K. (1939). Patterns of aggressive behavior in experimentally
created social climates. Journal of Social Psychology, 10, 271-301.
Maier, N. R. F. (1963). Problem Solving Discussion and Conferences: Leadership Methods and
Skills. New York: McGraw-Hill.
Magoha, P.W. (2004). “A critique for the modernization of management in higher education
institutions of developing nations”, World Transactions on Engineering and Technology
Education, 3(1), 105-110
Malaysia (1998). Rancangan Malaysia Ke Tujuh. Jabatan Perdana Menteri
Massy, W. F. (2003). Honoring the trust. Quality and cost containment in higher education.
Bolton: Anker Publishing Company, Inc.
Meek, V. L. (2003). Governance and management of Australian higher education: Enemies
within and without. In A. Amaral, V. L. Meek & I. M. Larsen (Eds.), The higher education
managerial revolution? (pp. 179-201). Dordrecht: Kluwer Academic Publishers.
Nik Muhamad., Md. Issa., Othman. & Abdul Rahim, (2009) Decision Making Quality of Higher
Education Institution Leaders in Malaysia: Leadership Style, Decision Style, Managerial Process
and Competitive Intensity Relationships, 10-44
McCaffery, P. (2004), The Higher Education Manager’s Handbook: Effective Leadership and
Management in Universities and Colleges. London and New York: Routledge Falmer.
Paxson, M., Howell, R., Michael, J. & Wong, S. (1993, Spring). Leadership development in
extension. Journal of Extension, 31(1).
Ramsden, P. (1998), Learning to Lead in Higher Education. London: Simultaneously Published
51
in the USA and Canada by Routledge.
Rausch, E. (2007). “Leadership in management education and development: criteria for quality
decisions”, European Business Review, 19(3), 257-268.
Rosa, M.J., Saraiva, P. & Diz, H. (2005). “Defining Strategic and Excellence Bases for the
Development of Portuguese Higher Education”, European Journal of Education, Vol. 40 (2),
205-221.
Rose, A. R. (1992). Visions of leadership: Understanding the research literature. In P.J. Edelson
(Ed.), Rethinking leadership in adult and continuing education (pp.83-93). San Francisco:
Jossey-Bass.
Rost, J.C. (1993), "Leadership Development in the New Millennium." The Journal of Leadership
Studies: November, pp. 91-110.
Rutte, C. G., & Wilke, H. A. M. (1985). Preference for decision structures in a social dilemma
situation. European Journal of Social Psychology, 15, 367–370.
Saal, F. E., & Knight, P. A. (1988), Industrial/Organizational Psychology: Science and Practice.
Belmont, CA: Wadsworth.
Samuelson, C. D. (1993). A multivariate evaluation approach to structural change in resource
dilemmas. Organizational Behavior and Human Decision Processes, 55, 298–324.
Seymour, D. T. (1993) On Q: Causing Quality in HigherEducation (New York, MacMillan).
SHEEO. State Higher Education Finance, FY2006. Boulder, Colorado, State Higher Education
Executive Officers, 2007.
Shoemaker, C. J. (1998). Leadership in continuing and distance education in higher education.
Boston: Allyn & Bacon.
Sekaran U. &Bougie R. (2013). Research Methodology for Business. West Sussex: John Wiley
& Sons Ltd.
Sekaran, U., & Bougie, R. (2013). Research Methods for Business: A Skill-Building Approach.
Italy: Wiley & Sons Ltd.
Sohail, M.S, Rajadurai, J & Abdul Rahman, N.A ( 2003). “Managing quality in higher education :
a Malaysian case study”, The International Journal of Educational Management, 17(4), 141-
52
146.
Sugarman, K. (2000), Leadership Characteristics. [Online]. Available:
http://www.psywww.com/sports/leader.htm. Accessed 7 January, 2005.
Trow, M. (1994). Managerialism and the academic profession: The case of England. Higher
Education Policy, 7 (2), 11-18.
Van Vught, F.A. (1995), “The New Context for Academic Quality”. In David Dill & Barbara Sporn
(eds), Emerging Patterns of Social Demand and University Reform: Through a Glass Darkly
(194-211). Oxford: Pergamon.
Vroeijenstijn, A. I. (1995). Improvement and accountability: Navigating between Scylla and
Charybdis. Guide for external quality assessment in higher education. London: Jessica Kingsley
Publishers.
Vroom, V. H. &. Yetton, P. W. (1973). Leadership and Decision Making. Pittsburgh, PA:
University of Pittsburgh Press.
Watson, W. E, Kumar, K. & Michaelsen, L. K.(1993) Cultural Diversity impact on interaction
process and performance: Comparing homogenous and diverse task groups, Academy of
management Journal, 36, 590-602.
Yukl, G. (1994), Leadership in Organizations. Third Edition. Englewood Cliffs, London: Prentice-
Hall International(UK) Limited.
Yukl, G. (2006), Leadership in Organizations. Sixth Edition. New York: Pearson Prentice-Hall.
53
APPENDICES
1. Questionnaire
DETERMINANTS OF DECISION MAKING QUALITY: STUDIES ON LEADERS OF
UNIVERSITI TEKNOLOGI MARA SELANGOR
Dear Respondents,
We are students from Universiti Teknologi MARA (UiTM), Faculty of Business Management,
pursuing the degree in Bachelor of Business and Administration (BBA) Hons. International
Business. Currently conducting a research on “DETERMINANTS OF DECISION MAKING
QUALITY: STUDIES ON LEADERS OF UNIVERSITI TEKNOLOGI MARA SELANGOR” for
our final year project.
Please take note that this survey is strictly for academic purposes and we would like to assure
you that all the information collected will remain PRIVATE AND CONFIDENTIAL. We greatly
appreciate you for taking the time, efforts and participation in completing this questionnaire.
Thank you for cooperation.
Regards,
AMIRA NURUL AAINA BINTI ABU BAKAR
NUR DIYANA BINTI ABDUL RAZAK
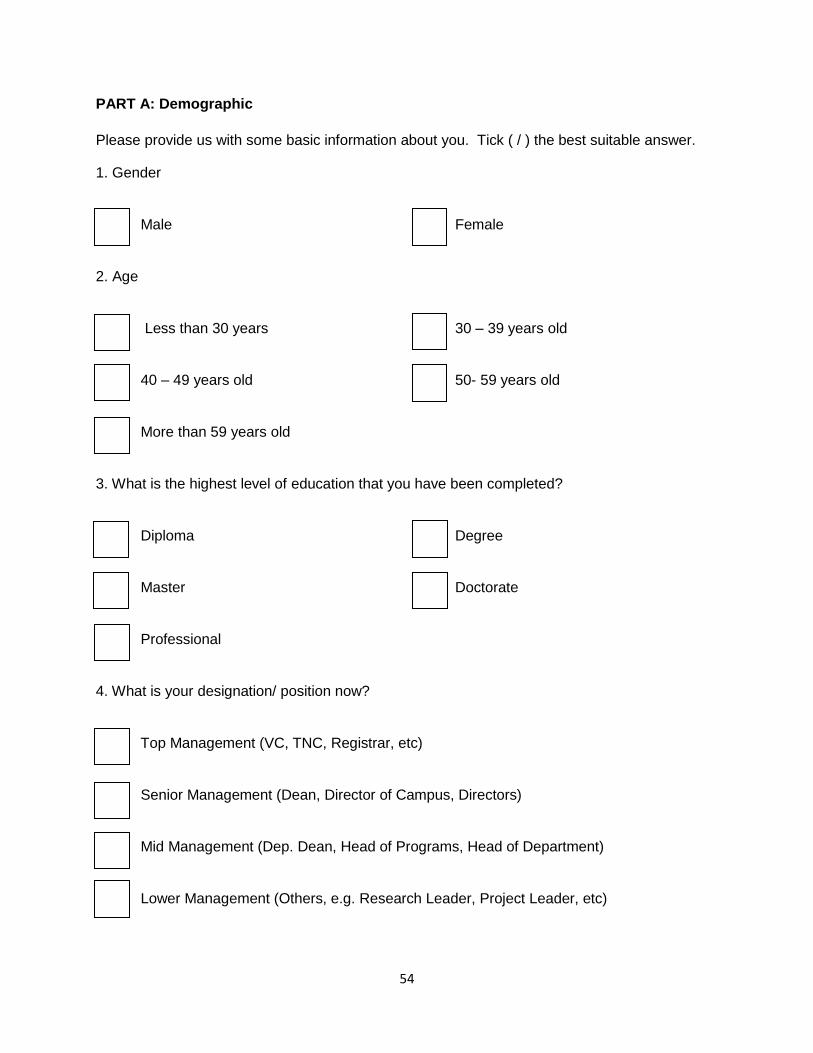
54
PART A: Demographic
Please provide us with some basic information about you. Tick ( / ) the best suitable answer.
1. Gender
Male Female
2. Age
Less than 30 years 30 – 39 years old
40 – 49 years old 50- 59 years old
More than 59 years old
3. What is the highest level of education that you have been completed?
Diploma Degree
Master Doctorate
Professional
4. What is your designation/ position now?
Top Management (VC, TNC, Registrar, etc)
Senior Management (Dean, Director of Campus, Directors)
Mid Management (Dep. Dean, Head of Programs, Head of Department)
Lower Management (Others, e.g. Research Leader, Project Leader, etc)
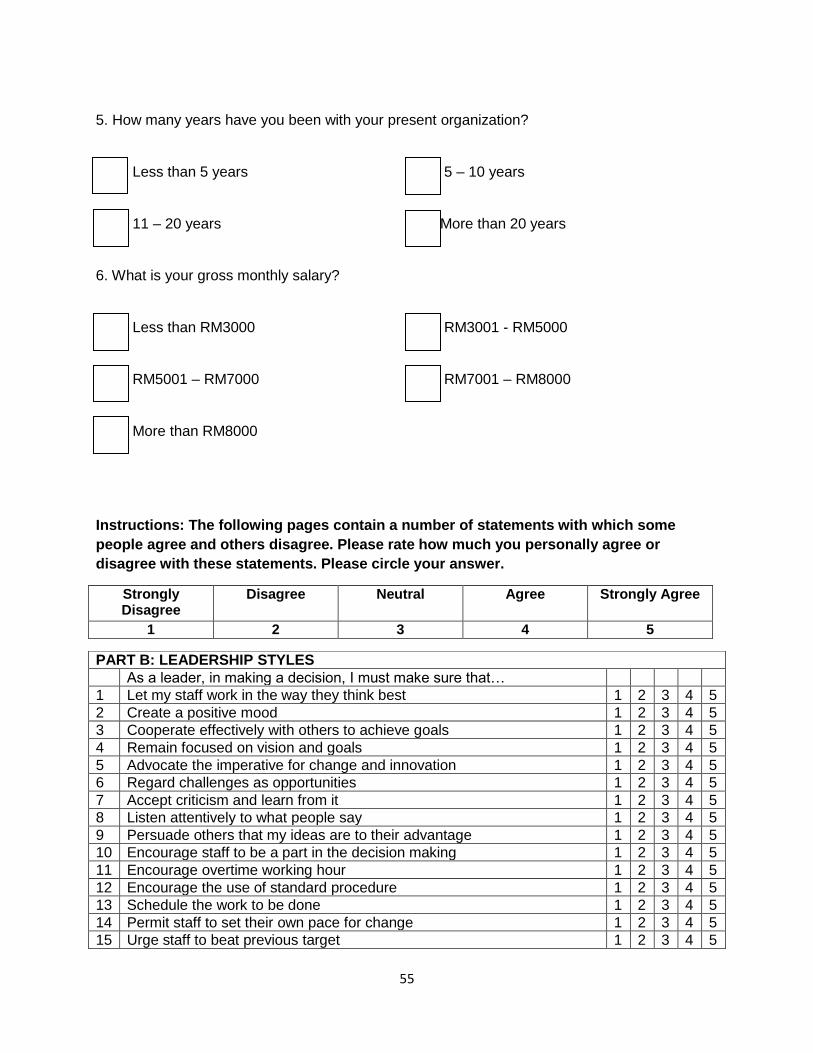
55
5. How many years have you been with your present organization?
Less than 5 years 5 – 10 years
11 – 20 years More than 20 years
6. What is your gross monthly salary?
Less than RM3000 RM3001 - RM5000
RM5001 – RM7000 RM7001 – RM8000
More than RM8000
Instructions: The following pages contain a number of statements with which some
people agree and others disagree. Please rate how much you personally agree or
disagree with these statements. Please circle your answer.
Strongly Disagree
Disagree Neutral Agree Strongly Agree
1 2 3 4 5
PART B: LEADERSHIP STYLES
As a leader, in making a decision, I must make sure that…
1 Let my staff work in the way they think best 1 2 3 4 5
2 Create a positive mood 1 2 3 4 5
3 Cooperate effectively with others to achieve goals 1 2 3 4 5
4 Remain focused on vision and goals 1 2 3 4 5
5 Advocate the imperative for change and innovation 1 2 3 4 5
6 Regard challenges as opportunities 1 2 3 4 5
7 Accept criticism and learn from it 1 2 3 4 5
8 Listen attentively to what people say 1 2 3 4 5
9 Persuade others that my ideas are to their advantage 1 2 3 4 5
10 Encourage staff to be a part in the decision making 1 2 3 4 5
11 Encourage overtime working hour 1 2 3 4 5
12 Encourage the use of standard procedure 1 2 3 4 5
13 Schedule the work to be done 1 2 3 4 5
14 Permit staff to set their own pace for change 1 2 3 4 5
15 Urge staff to beat previous target 1 2 3 4 5
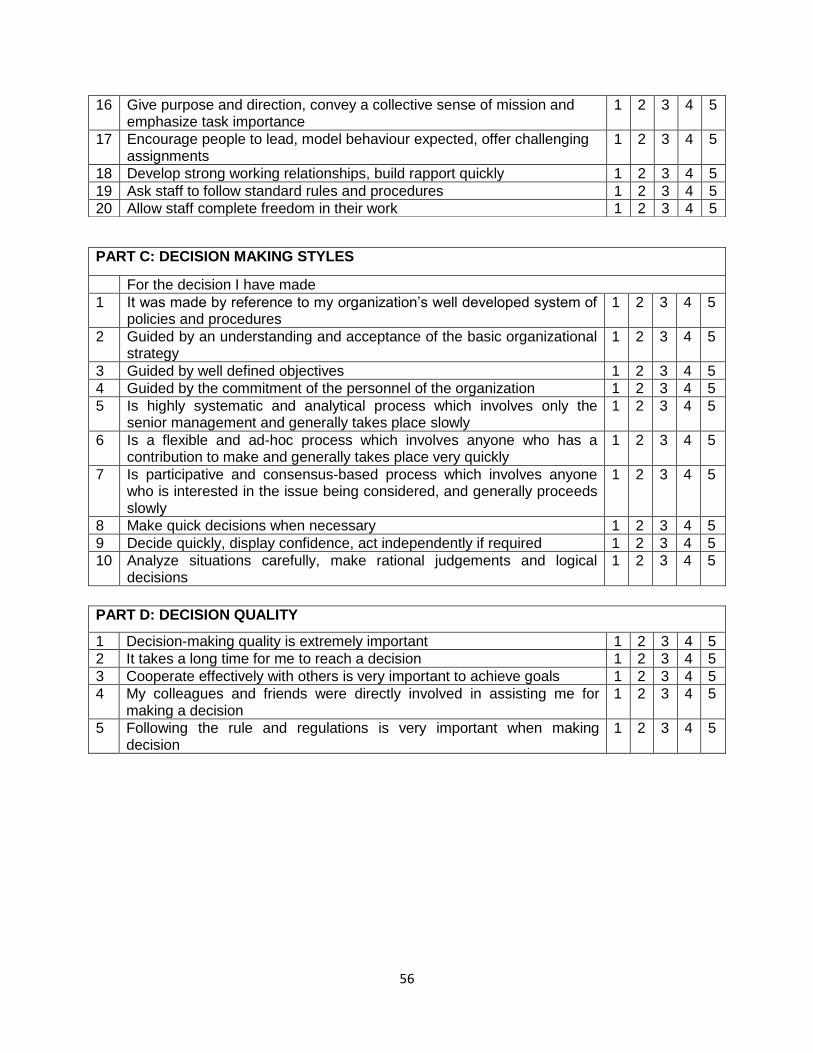
56
PART C: DECISION MAKING STYLES
For the decision I have made
1 It was made by reference to my organization’s well developed system of policies and procedures
1 2 3 4 5
2 Guided by an understanding and acceptance of the basic organizational strategy
1 2 3 4 5
3 Guided by well defined objectives 1 2 3 4 5
4 Guided by the commitment of the personnel of the organization 1 2 3 4 5
5 Is highly systematic and analytical process which involves only the senior management and generally takes place slowly
1 2 3 4 5
6 Is a flexible and ad-hoc process which involves anyone who has a contribution to make and generally takes place very quickly
1 2 3 4 5
7 Is participative and consensus-based process which involves anyone who is interested in the issue being considered, and generally proceeds slowly
1 2 3 4 5
8 Make quick decisions when necessary 1 2 3 4 5
9 Decide quickly, display confidence, act independently if required 1 2 3 4 5
10 Analyze situations carefully, make rational judgements and logical decisions
1 2 3 4 5
PART D: DECISION QUALITY
1 Decision-making quality is extremely important 1 2 3 4 5
2 It takes a long time for me to reach a decision 1 2 3 4 5
3 Cooperate effectively with others is very important to achieve goals 1 2 3 4 5
4 My colleagues and friends were directly involved in assisting me for making a decision
1 2 3 4 5
5 Following the rule and regulations is very important when making decision
1 2 3 4 5
16 Give purpose and direction, convey a collective sense of mission and emphasize task importance
1 2 3 4 5
17 Encourage people to lead, model behaviour expected, offer challenging assignments
1 2 3 4 5
18 Develop strong working relationships, build rapport quickly 1 2 3 4 5
19 Ask staff to follow standard rules and procedures 1 2 3 4 5
20 Allow staff complete freedom in their work 1 2 3 4 5
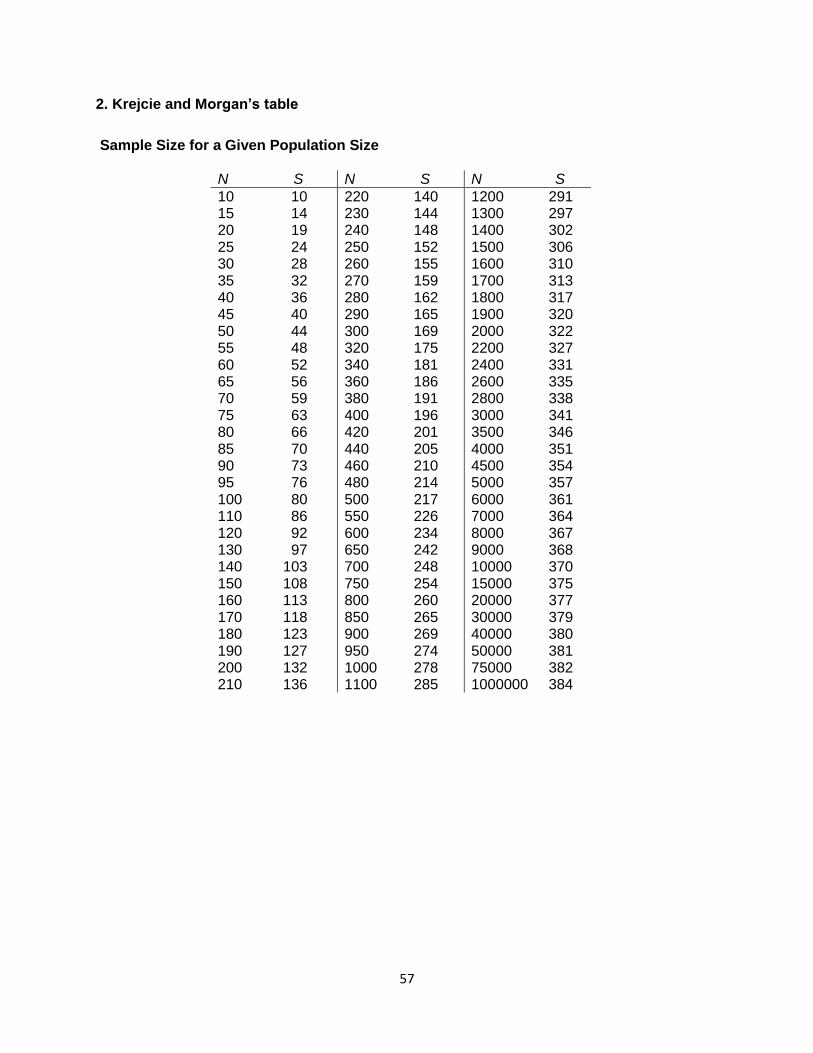
57
2. Krejcie and Morgan’s table
Sample Size for a Given Population Size
N S N S N S
10 10 15 14 20 19 25 24 30 28 35 32 40 36 45 40 50 44 55 48 60 52 65 56 70 59 75 63 80 66 85 70 90 73 95 76 100 80 110 86 120 92 130 97 140 103 150 108 160 113 170 118 180 123 190 127 200 132 210 136
220 140 230 144 240 148 250 152 260 155 270 159 280 162 290 165 300 169 320 175 340 181 360 186 380 191 400 196 420 201 440 205 460 210 480 214 500 217 550 226 600 234 650 242 700 248 750 254 800 260 850 265 900 269 950 274 1000 278 1100 285
1200 291 1300 297 1400 302 1500 306 1600 310 1700 313 1800 317 1900 320 2000 322 2200 327 2400 331 2600 335 2800 338 3000 341 3500 346 4000 351 4500 354 5000 357 6000 361 7000 364 8000 367 9000 368 10000 370 15000 375 20000 377 30000 379 40000 380 50000 381 75000 382 1000000 384
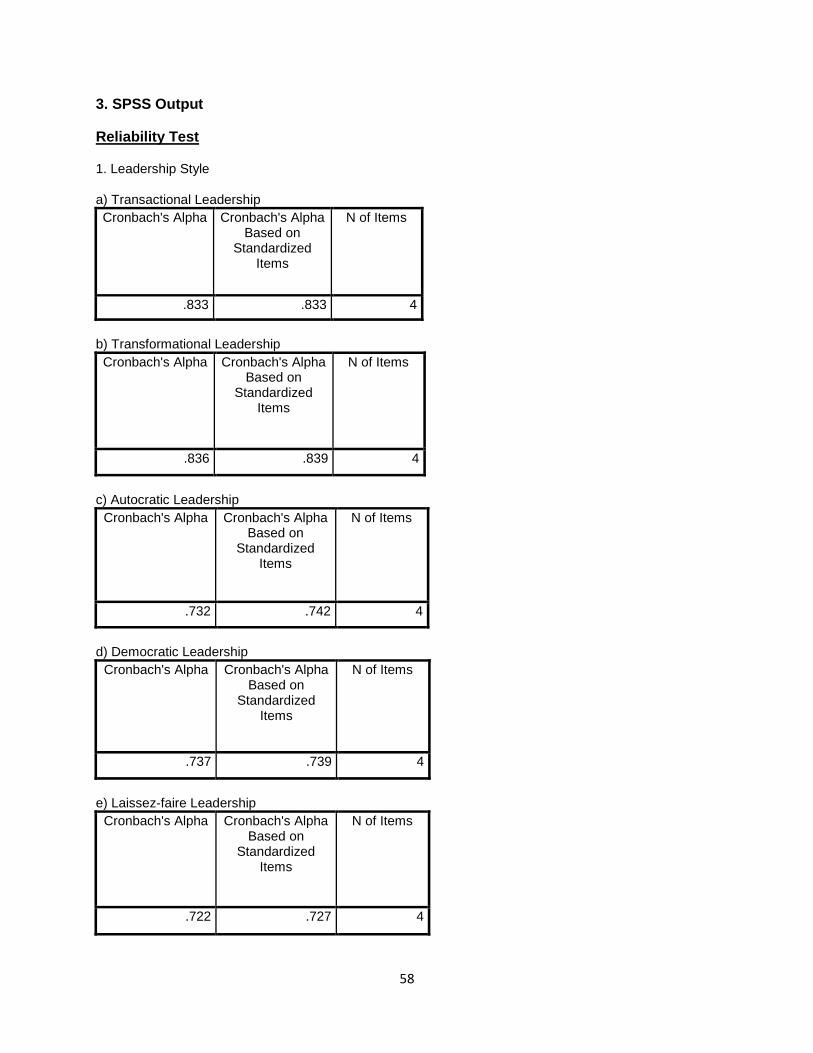
58
3. SPSS Output
Reliability Test
1. Leadership Style
a) Transactional Leadership
Cronbach's Alpha Cronbach's Alpha Based on
Standardized Items
N of Items
.833 .833 4
b) Transformational Leadership
Cronbach's Alpha Cronbach's Alpha Based on
Standardized Items
N of Items
.836 .839 4
c) Autocratic Leadership
Cronbach's Alpha Cronbach's Alpha Based on
Standardized Items
N of Items
.732 .742 4
d) Democratic Leadership
Cronbach's Alpha Cronbach's Alpha Based on
Standardized Items
N of Items
.737 .739 4
e) Laissez-faire Leadership
Cronbach's Alpha Cronbach's Alpha Based on
Standardized Items
N of Items
.722 .727 4
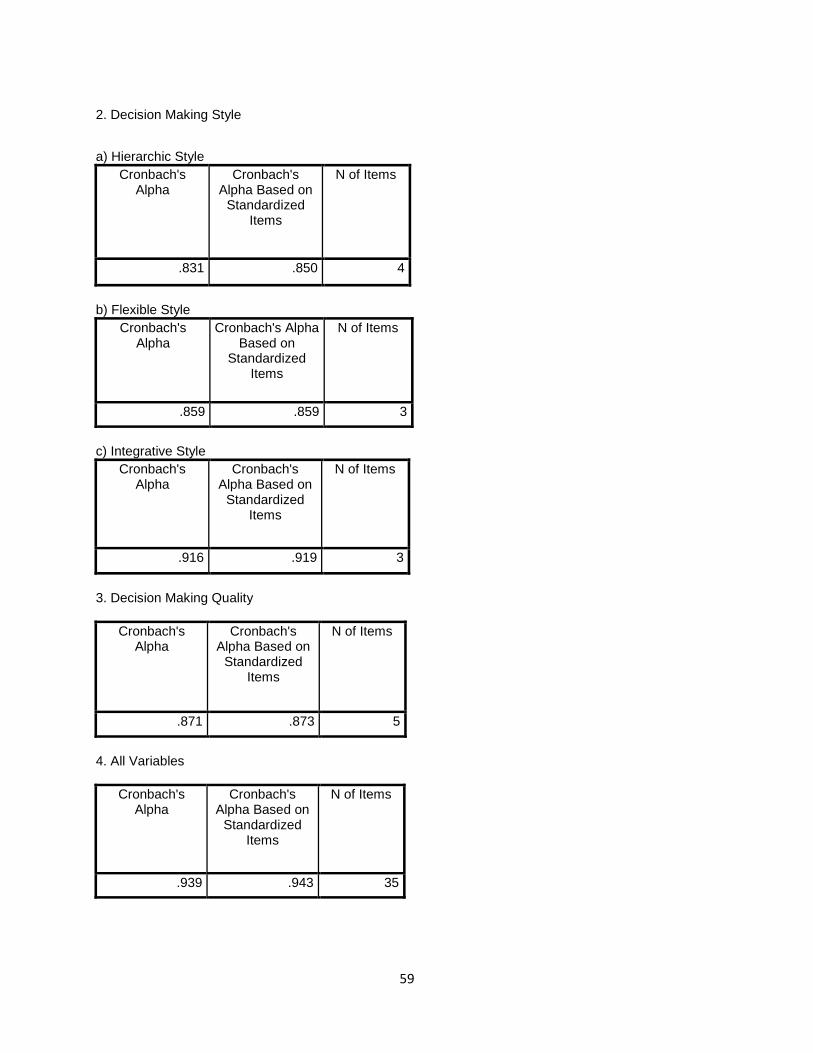
59
2. Decision Making Style
a) Hierarchic Style
Cronbach's Alpha
Cronbach's Alpha Based on
Standardized Items
N of Items
.831 .850 4
b) Flexible Style
Cronbach's Alpha
Cronbach's Alpha Based on
Standardized Items
N of Items
.859 .859 3
c) Integrative Style
Cronbach's Alpha
Cronbach's Alpha Based on
Standardized Items
N of Items
.916 .919 3
3. Decision Making Quality
Cronbach's Alpha
Cronbach's Alpha Based on
Standardized Items
N of Items
.871 .873 5
4. All Variables
Cronbach's Alpha
Cronbach's Alpha Based on
Standardized Items
N of Items
.939 .943 35
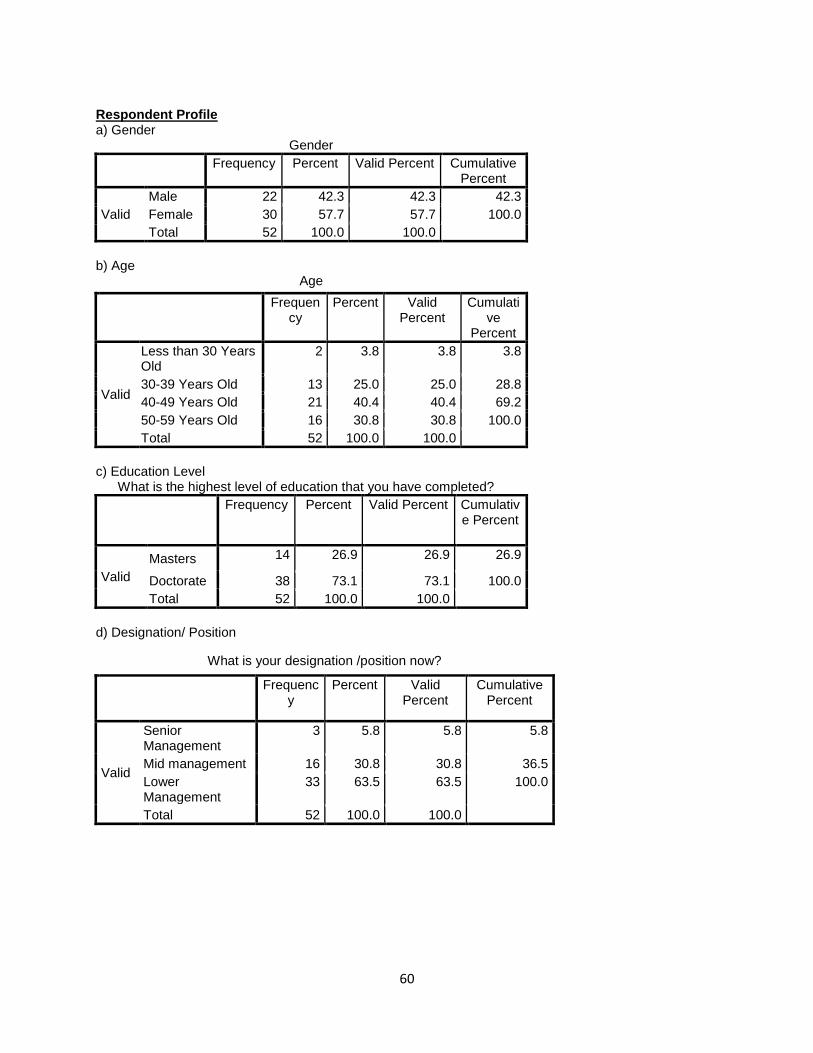
60
Respondent Profile a) Gender
Gender
Frequency Percent Valid Percent Cumulative Percent
Valid
Male 22 42.3 42.3 42.3
Female 30 57.7 57.7 100.0
Total 52 100.0 100.0
b) Age
Age
Frequency
Percent Valid Percent
Cumulative
Percent
Valid
Less than 30 Years Old
2 3.8 3.8 3.8
30-39 Years Old 13 25.0 25.0 28.8
40-49 Years Old 21 40.4 40.4 69.2
50-59 Years Old 16 30.8 30.8 100.0
Total 52 100.0 100.0
c) Education Level What is the highest level of education that you have completed?
Frequency Percent Valid Percent Cumulative Percent
Valid
Masters 14 26.9 26.9 26.9
Doctorate 38 73.1 73.1 100.0
Total 52 100.0 100.0
d) Designation/ Position
What is your designation /position now?
Frequency
Percent Valid Percent
Cumulative Percent
Valid
Senior Management
3 5.8 5.8 5.8
Mid management 16 30.8 30.8 36.5
Lower Management
33 63.5 63.5 100.0
Total 52 100.0 100.0
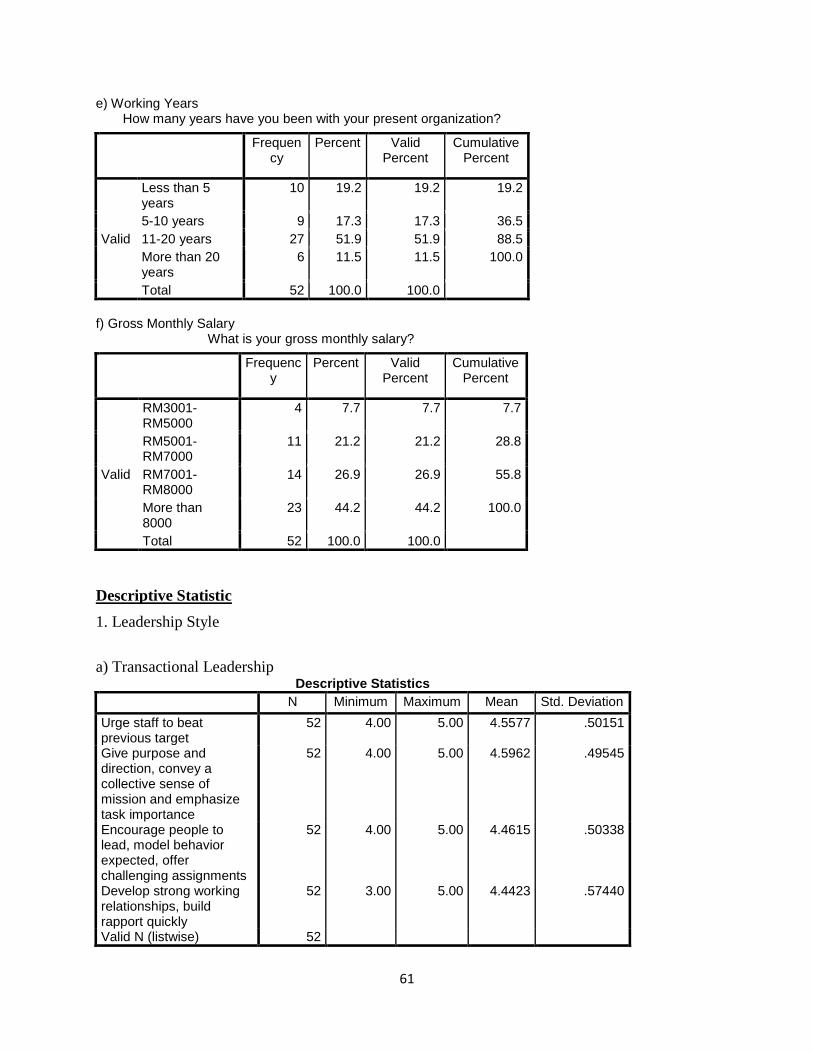
61
e) Working Years How many years have you been with your present organization?
Frequency
Percent Valid Percent
Cumulative Percent
Valid
Less than 5 years
10 19.2 19.2 19.2
5-10 years 9 17.3 17.3 36.5
11-20 years 27 51.9 51.9 88.5
More than 20 years
6 11.5 11.5 100.0
Total 52 100.0 100.0
f) Gross Monthly Salary
What is your gross monthly salary?
Frequency
Percent Valid Percent
Cumulative Percent
Valid
RM3001-RM5000
4 7.7 7.7 7.7
RM5001-RM7000
11 21.2 21.2 28.8
RM7001-RM8000
14 26.9 26.9 55.8
More than 8000
23 44.2 44.2 100.0
Total 52 100.0 100.0
Descriptive Statistic
1. Leadership Style
a) Transactional Leadership Descriptive Statistics
N Minimum Maximum Mean Std. Deviation
Urge staff to beat previous target
52 4.00 5.00 4.5577 .50151
Give purpose and direction, convey a collective sense of mission and emphasize task importance
52 4.00 5.00 4.5962 .49545
Encourage people to lead, model behavior expected, offer challenging assignments
52 4.00 5.00 4.4615 .50338
Develop strong working relationships, build rapport quickly
52 3.00 5.00 4.4423 .57440
Valid N (listwise) 52
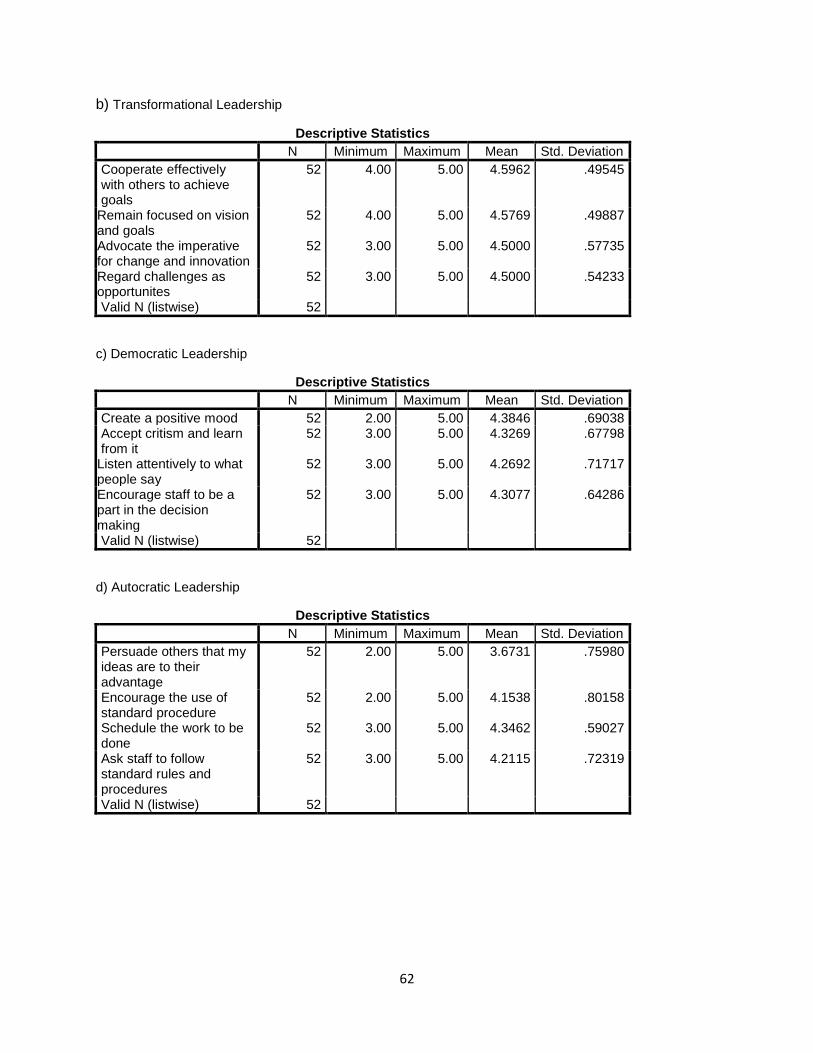
62
b) Transformational Leadership
Descriptive Statistics
N Minimum Maximum Mean Std. Deviation
Cooperate effectively with others to achieve goals
52 4.00 5.00 4.5962 .49545
Remain focused on vision and goals
52 4.00 5.00 4.5769 .49887
Advocate the imperative for change and innovation
52 3.00 5.00 4.5000 .57735
Regard challenges as opportunites
52 3.00 5.00 4.5000 .54233
Valid N (listwise) 52
c) Democratic Leadership
Descriptive Statistics
N Minimum Maximum Mean Std. Deviation
Create a positive mood 52 2.00 5.00 4.3846 .69038 Accept critism and learn from it
52 3.00 5.00 4.3269 .67798
Listen attentively to what people say
52 3.00 5.00 4.2692 .71717
Encourage staff to be a part in the decision making
52 3.00 5.00 4.3077 .64286
Valid N (listwise) 52
d) Autocratic Leadership
Descriptive Statistics
N Minimum Maximum Mean Std. Deviation
Persuade others that my ideas are to their advantage
52 2.00 5.00 3.6731 .75980
Encourage the use of standard procedure
52 2.00 5.00 4.1538 .80158
Schedule the work to be done
52 3.00 5.00 4.3462 .59027
Ask staff to follow standard rules and procedures
52 3.00 5.00 4.2115 .72319
Valid N (listwise) 52
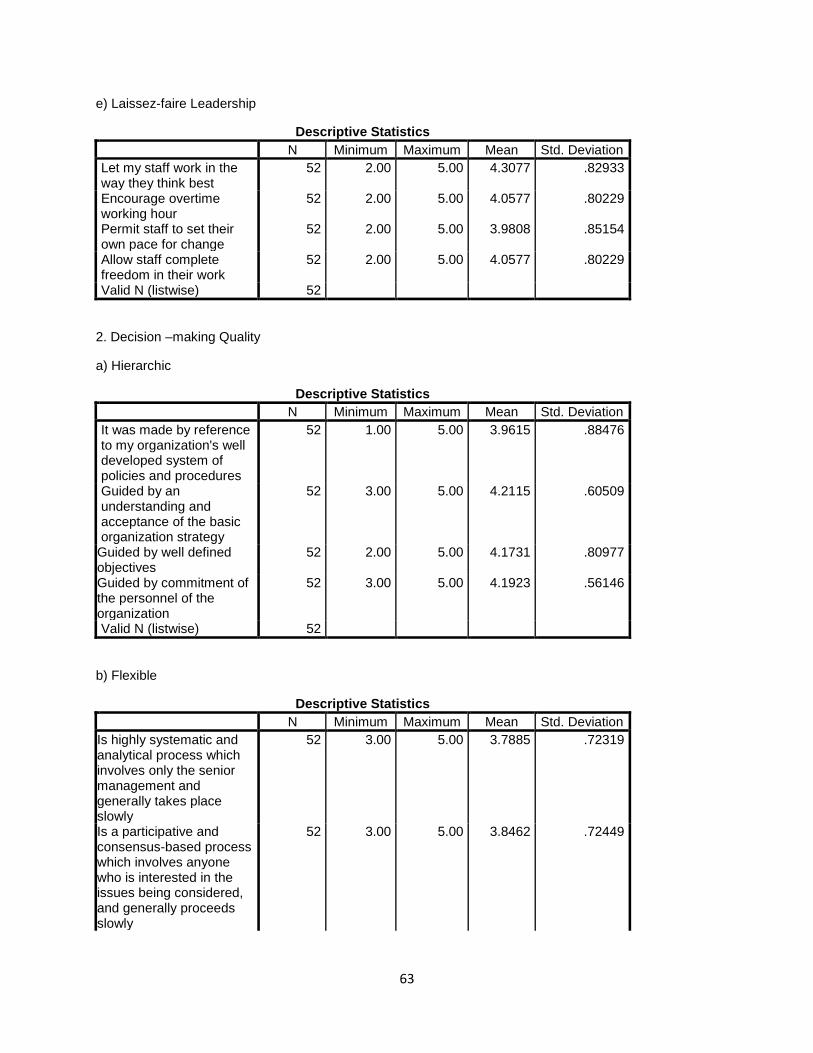
63
e) Laissez-faire Leadership
Descriptive Statistics
N Minimum Maximum Mean Std. Deviation
Let my staff work in the way they think best
52 2.00 5.00 4.3077 .82933
Encourage overtime working hour
52 2.00 5.00 4.0577 .80229
Permit staff to set their own pace for change
52 2.00 5.00 3.9808 .85154
Allow staff complete freedom in their work
52 2.00 5.00 4.0577 .80229
Valid N (listwise) 52
2. Decision –making Quality
a) Hierarchic
Descriptive Statistics
N Minimum Maximum Mean Std. Deviation
It was made by reference to my organization's well developed system of policies and procedures
52 1.00 5.00 3.9615 .88476
Guided by an understanding and acceptance of the basic organization strategy
52 3.00 5.00 4.2115 .60509
Guided by well defined objectives
52 2.00 5.00 4.1731 .80977
Guided by commitment of the personnel of the organization
52 3.00 5.00 4.1923 .56146
Valid N (listwise) 52
b) Flexible
Descriptive Statistics
N Minimum Maximum Mean Std. Deviation
Is highly systematic and analytical process which involves only the senior management and generally takes place slowly
52 3.00 5.00 3.7885 .72319
Is a participative and consensus-based process which involves anyone who is interested in the issues being considered, and generally proceeds slowly
52 3.00 5.00 3.8462 .72449
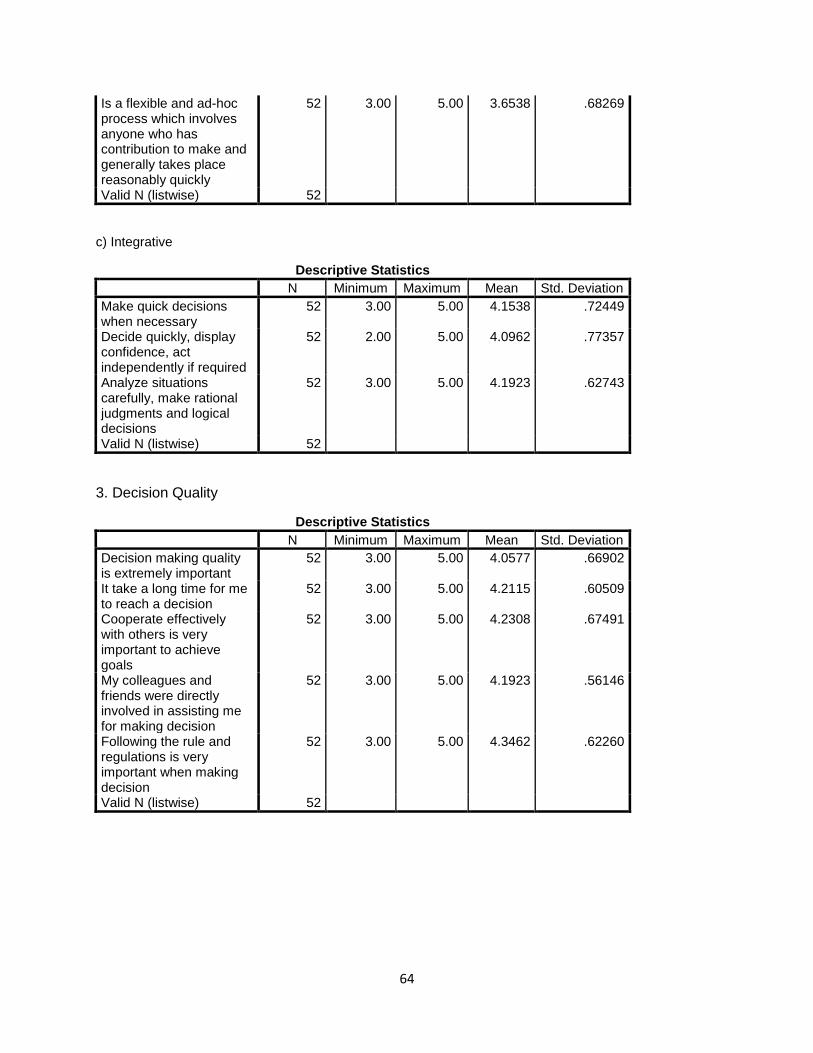
64
Is a flexible and ad-hoc process which involves anyone who has contribution to make and generally takes place reasonably quickly
52 3.00 5.00 3.6538 .68269
Valid N (listwise) 52
c) Integrative
Descriptive Statistics
N Minimum Maximum Mean Std. Deviation
Make quick decisions when necessary
52 3.00 5.00 4.1538 .72449
Decide quickly, display confidence, act independently if required
52 2.00 5.00 4.0962 .77357
Analyze situations carefully, make rational judgments and logical decisions
52 3.00 5.00 4.1923 .62743
Valid N (listwise) 52
3. Decision Quality
Descriptive Statistics
N Minimum Maximum Mean Std. Deviation
Decision making quality is extremely important
52 3.00 5.00 4.0577 .66902
It take a long time for me to reach a decision
52 3.00 5.00 4.2115 .60509
Cooperate effectively with others is very important to achieve goals
52 3.00 5.00 4.2308 .67491
My colleagues and friends were directly involved in assisting me for making decision
52 3.00 5.00 4.1923 .56146
Following the rule and regulations is very important when making decision
52 3.00 5.00 4.3462 .62260
Valid N (listwise) 52
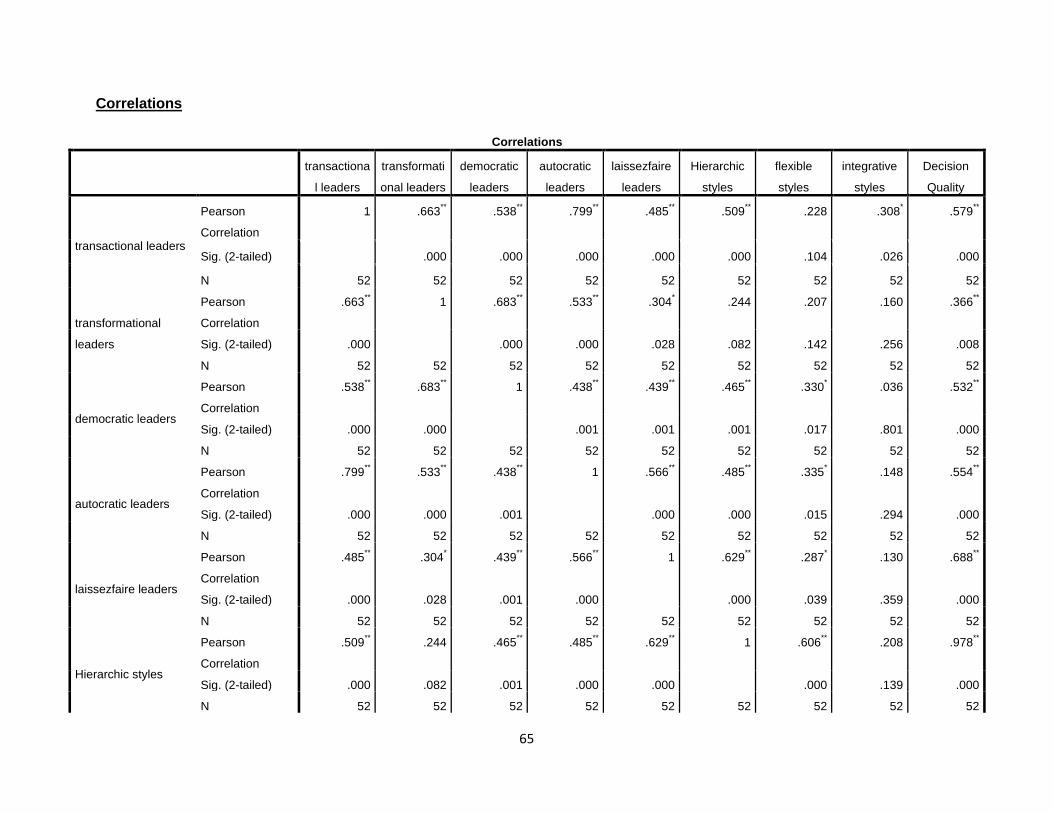
65
Correlations
Correlations
transactiona
l leaders
transformati
onal leaders
democratic
leaders
autocratic
leaders
laissezfaire
leaders
Hierarchic
styles
flexible
styles
integrative
styles
Decision
Quality
transactional leaders
Pearson
Correlation
1 .663** .538
** .799
** .485
** .509
** .228 .308
* .579
**
Sig. (2-tailed) .000 .000 .000 .000 .000 .104 .026 .000
N 52 52 52 52 52 52 52 52 52
transformational
leaders
Pearson
Correlation
.663** 1 .683
** .533
** .304
* .244 .207 .160 .366
**
Sig. (2-tailed) .000 .000 .000 .028 .082 .142 .256 .008
N 52 52 52 52 52 52 52 52 52
democratic leaders
Pearson
Correlation
.538** .683
** 1 .438
** .439
** .465
** .330
* .036 .532
**
Sig. (2-tailed) .000 .000 .001 .001 .001 .017 .801 .000
N 52 52 52 52 52 52 52 52 52
autocratic leaders
Pearson
Correlation
.799** .533
** .438
** 1 .566
** .485
** .335
* .148 .554
**
Sig. (2-tailed) .000 .000 .001 .000 .000 .015 .294 .000
N 52 52 52 52 52 52 52 52 52
laissezfaire leaders
Pearson
Correlation
.485** .304
* .439
** .566
** 1 .629
** .287
* .130 .688
**
Sig. (2-tailed) .000 .028 .001 .000 .000 .039 .359 .000
N 52 52 52 52 52 52 52 52 52
Hierarchic styles
Pearson
Correlation
.509** .244 .465
** .485
** .629
** 1 .606
** .208 .978
**
Sig. (2-tailed) .000 .082 .001 .000 .000 .000 .139 .000
N 52 52 52 52 52 52 52 52 52
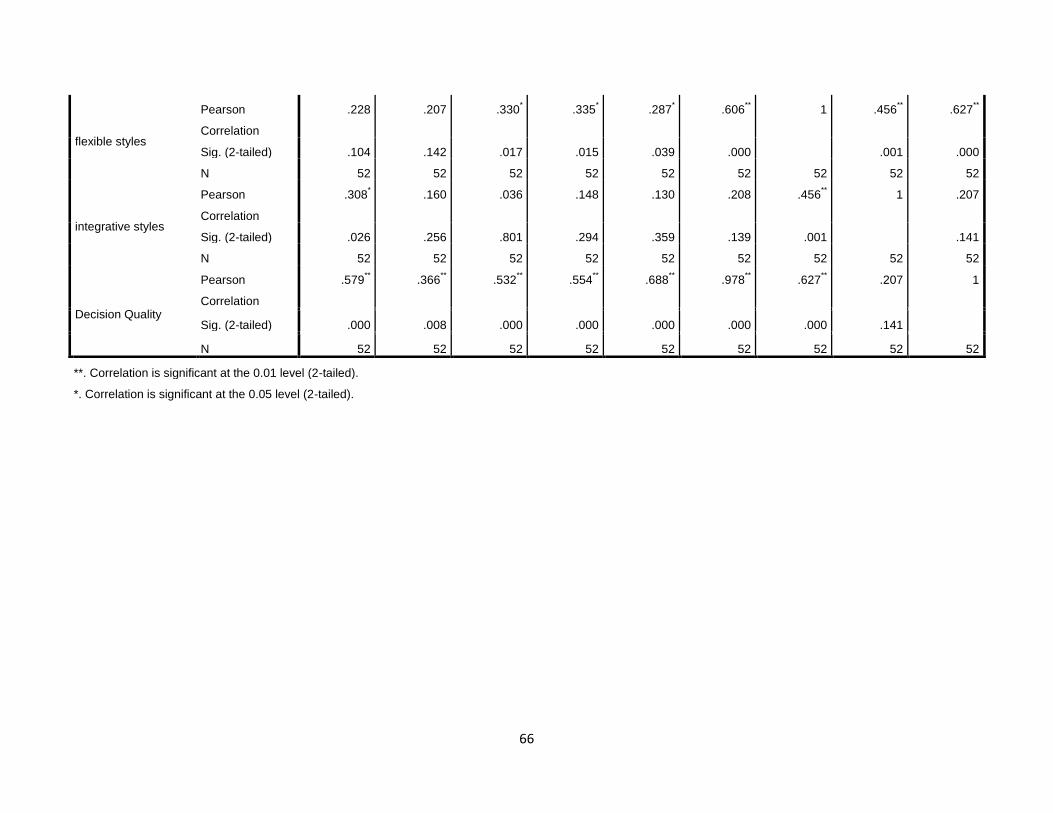
66
flexible styles
Pearson
Correlation
.228 .207 .330* .335
* .287
* .606
** 1 .456
** .627
**
Sig. (2-tailed) .104 .142 .017 .015 .039 .000 .001 .000
N 52 52 52 52 52 52 52 52 52
integrative styles
Pearson
Correlation
.308* .160 .036 .148 .130 .208 .456
** 1 .207
Sig. (2-tailed) .026 .256 .801 .294 .359 .139 .001 .141
N 52 52 52 52 52 52 52 52 52
Decision Quality
Pearson
Correlation
.579** .366
** .532
** .554
** .688
** .978
** .627
** .207 1
Sig. (2-tailed) .000 .008 .000 .000 .000 .000 .000 .141
N 52 52 52 52 52 52 52 52 52
**. Correlation is significant at the 0.01 level (2-tailed).
*. Correlation is significant at the 0.05 level (2-tailed).
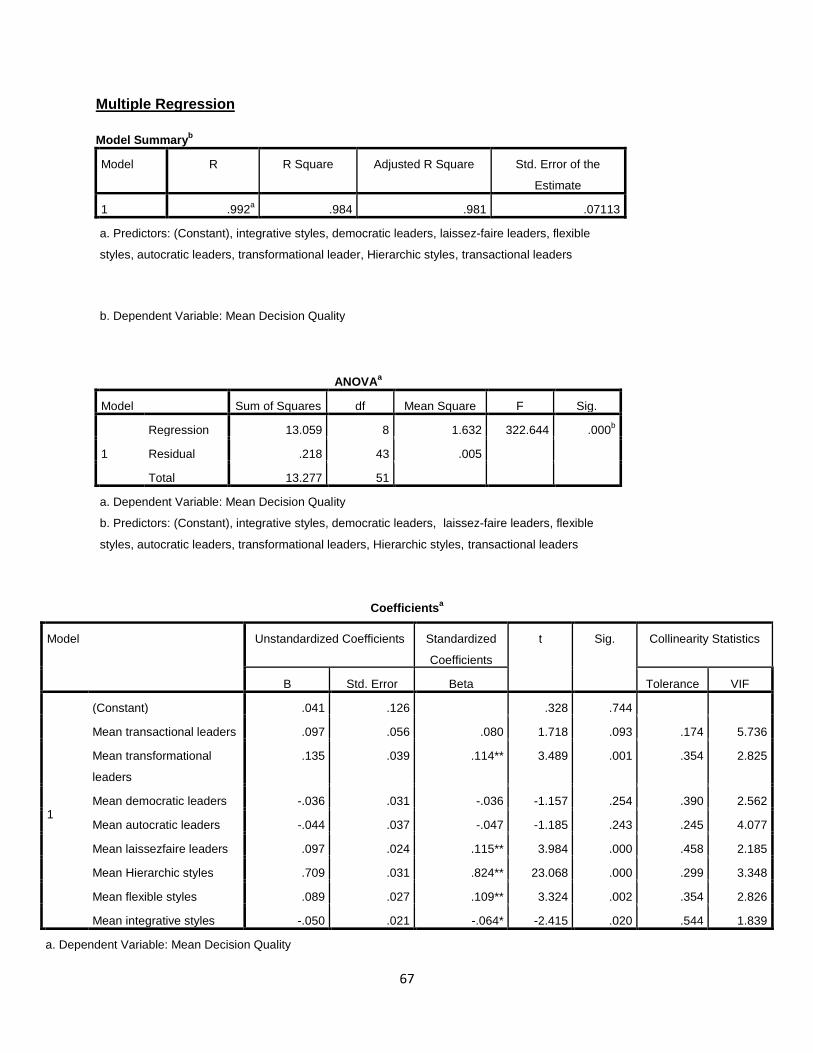
67
Multiple Regression
Model Summaryb
Model R R Square Adjusted R Square Std. Error of the
Estimate
1 .992a .984 .981 .07113
a. Predictors: (Constant), integrative styles, democratic leaders, laissez-faire leaders, flexible
styles, autocratic leaders, transformational leader, Hierarchic styles, transactional leaders
b. Dependent Variable: Mean Decision Quality
ANOVAa
Model Sum of Squares df Mean Square F Sig.
1
Regression 13.059 8 1.632 322.644 .000b
Residual .218 43 .005
Total 13.277 51
a. Dependent Variable: Mean Decision Quality
b. Predictors: (Constant), integrative styles, democratic leaders, laissez-faire leaders, flexible
styles, autocratic leaders, transformational leaders, Hierarchic styles, transactional leaders
Coefficientsa
Model Unstandardized Coefficients Standardized
Coefficients
t Sig. Collinearity Statistics
B Std. Error Beta Tolerance VIF
1
(Constant) .041 .126 .328 .744
Mean transactional leaders .097 .056 .080 1.718 .093 .174 5.736
Mean transformational
leaders
.135 .039 .114** 3.489 .001 .354 2.825
Mean democratic leaders -.036 .031 -.036 -1.157 .254 .390 2.562
Mean autocratic leaders -.044 .037 -.047 -1.185 .243 .245 4.077
Mean laissezfaire leaders .097 .024 .115** 3.984 .000 .458 2.185
Mean Hierarchic styles .709 .031 .824** 23.068 .000 .299 3.348
Mean flexible styles .089 .027 .109** 3.324 .002 .354 2.826
Mean integrative styles -.050 .021 -.064* -2.415 .020 .544 1.839
a. Dependent Variable: Mean Decision Quality

68
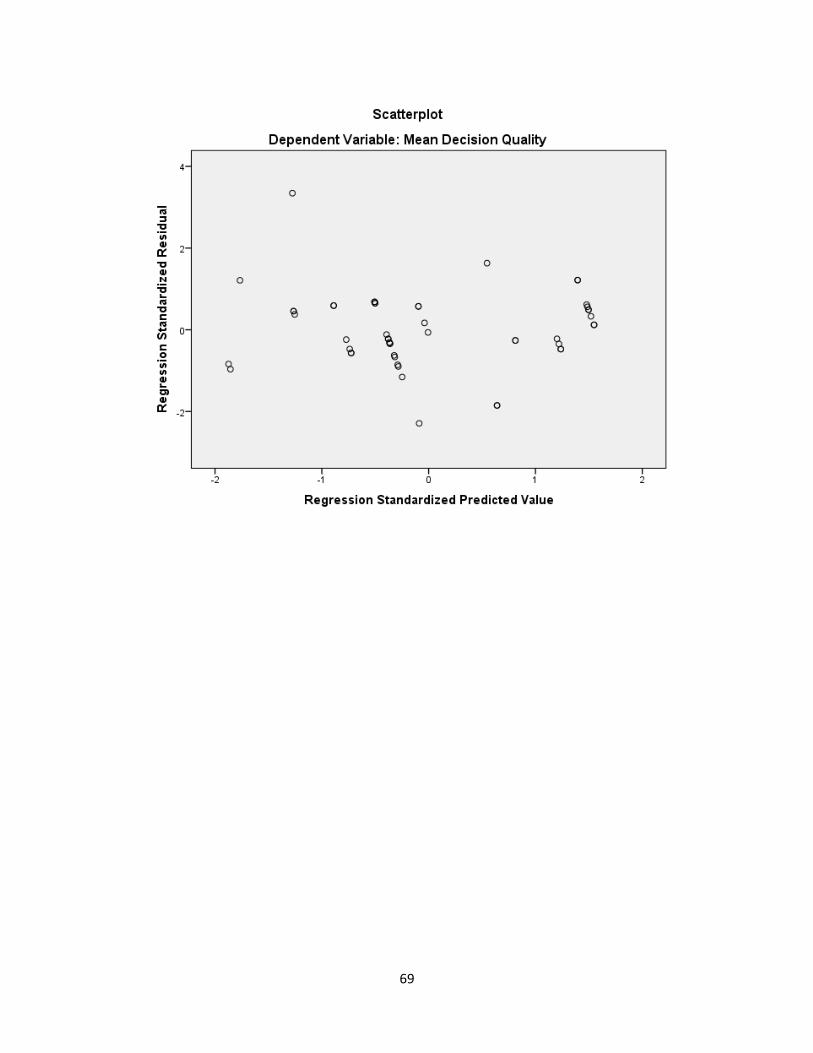
69
Related Documents