Dissertation for the degree of philosophiae doctor (PhD) at the University of Bergen Dissertation date: 'HWHUPLQDQWV RI FKLOG PDOQXWULWLRQ 6WXGLHV IURP D UXUDO DUHD LQ WKH 'HPRFUDWLF 5HSXEOLF RI &RQJR +DOOJHLU .LVPXO 'HFHPEHU

Welcome message from author
This document is posted to help you gain knowledge. Please leave a comment to let me know what you think about it! Share it to your friends and learn new things together.
Transcript
Dissertation for the degree of philosophiae doctor (PhD)
at the University of Bergen
Dissertation date:


Scientific environment
Contents
SCIENTIFIC ENVIRONMENT.........................................................................................................II
ACKNOWLEDGEMENTS ............................................................................................................... VI
LIST OF PUBLICATIONS ............................................................................................................ XIII
1. INTRODUCTION ......................................................................................................................1
1.12.1 Household food security .............................................................................................17
1.12.2 Individual food security ..............................................................................................21
2. RATIONALE AND OBJECTIVES........................................................................................ 28
3. MATERIAL AND METHODS .............................................................................................. 31
3.9.1 Descriptive approach (quantitative) .......................................................................... 48
3.9.2 Analytical approach (quantitative) ............................................................................ 49
3.9.3 Case study design and social field analysis (qualitiative).......................................... 50
4. RESULTS ................................................................................................................................. 54
5. DISCUSSION........................................................................................................................... 59

5.7.1 Diet and the development of kwashiorkor...................................................................71
5.7.2 Food and nutrition security ........................................................................................74
5.7.3 The macro socio-economic context of malnutrtion .....................................................78
5.7.4 Social inequalities in malnutrition ..............................................................................79
6. RECOMMENDATIONS AND CONCLUSIONS..................................................................81

Acknowledgements
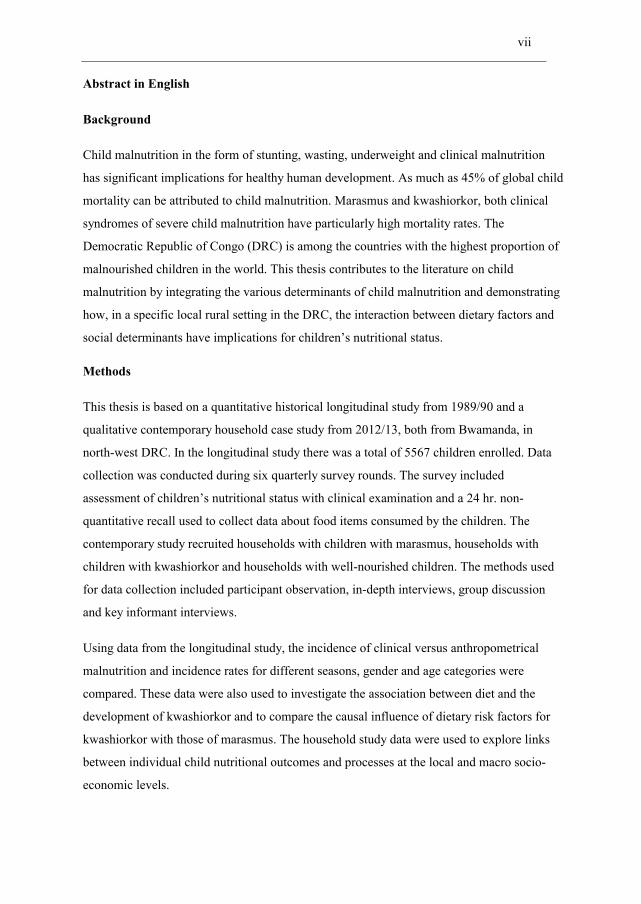
Abstract in English
Background
Methods
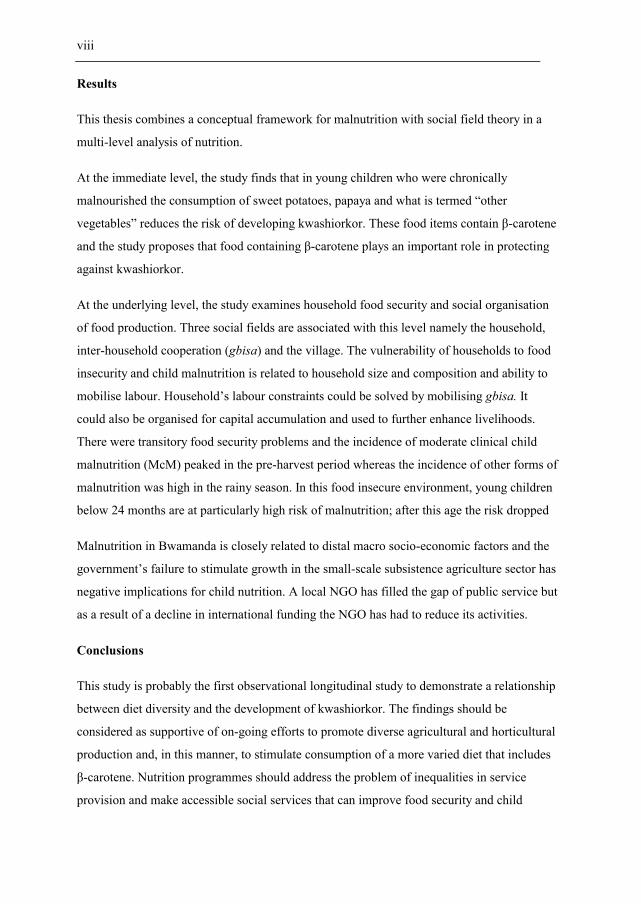
Results
gbisa
gbisa.
Conclusions
Abstract in Norwegian
Bakgrunn
Metoder
Resultater
gbisa
gbisa Gbisa
Konklusjon
List of publications
List of abbreviations

Glossary
Accuracy
Clinical severe childhood malnutrition;
Determinant;
Hidden hunger;
Incidence;
Kwashiorkor;
Malnutrition;
Marasmic-kwashiorkor;
Marasmus;
Mid upper arm circumference
Obese;
Overweight
Precision

Prevalence;
Sensitivity;
Specificity;
Stunted;
Undernutrition;
Underweight;
Wasted
Z-score;
1. Introduction
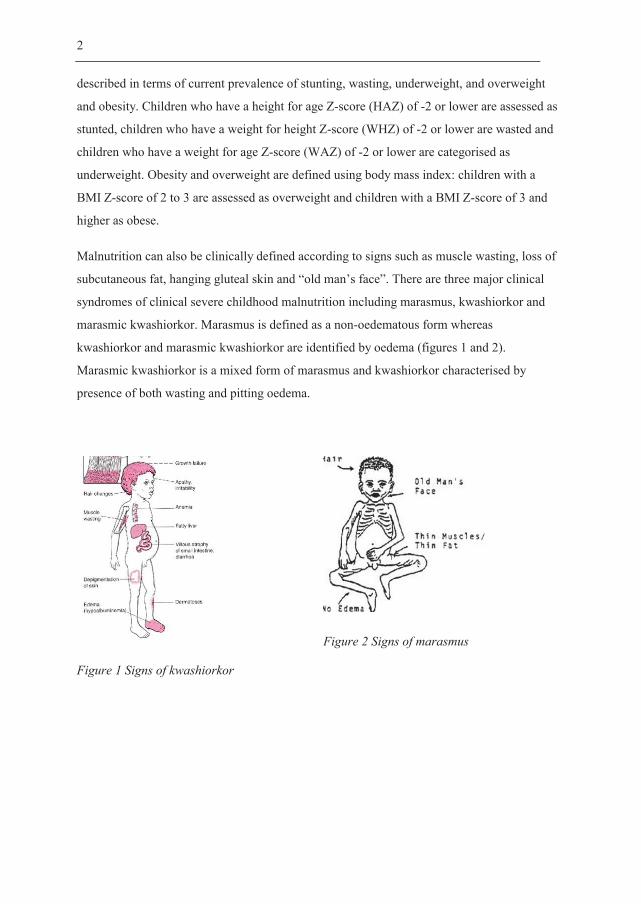
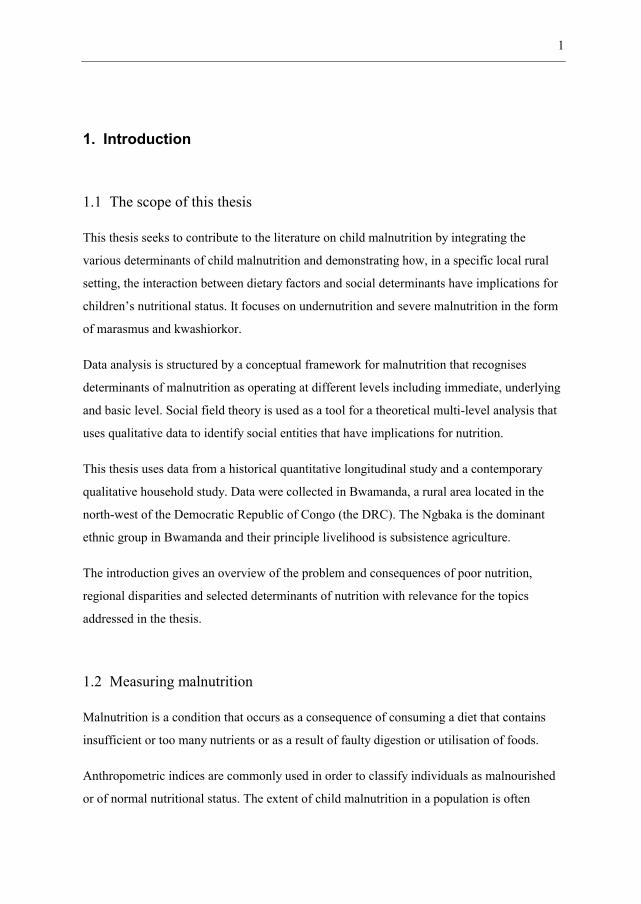
Figure 1 Signs of kwashiorkor
Figure 2 Signs of marasmus

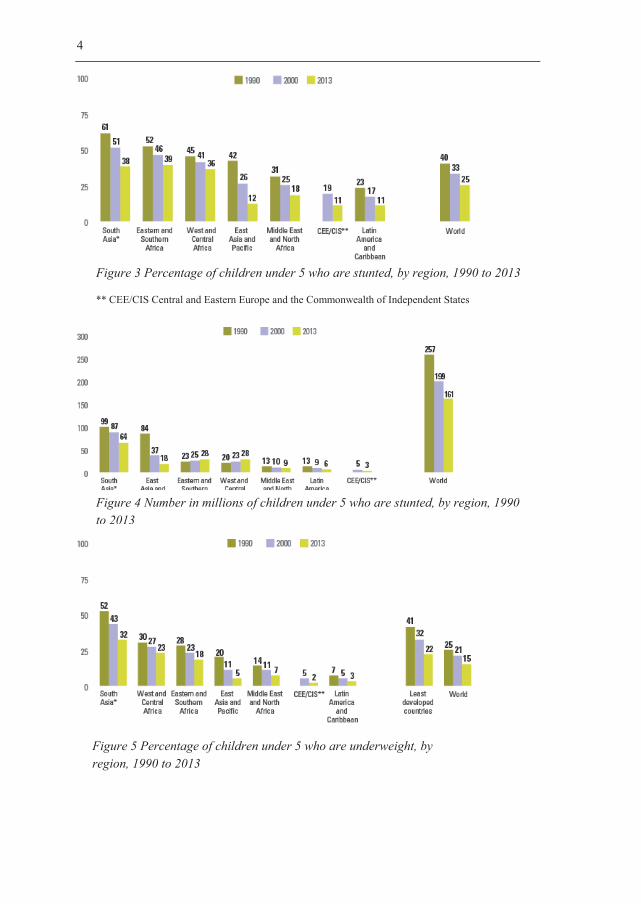
Figure 3 Percentage of children under 5 who are stunted, by region, 1990 to 2013
Figure 4 Number in millions of children under 5 who are stunted, by region, 1990 to 2013
Figure 5 Percentage of children under 5 who are underweight, by region, 1990 to 2013
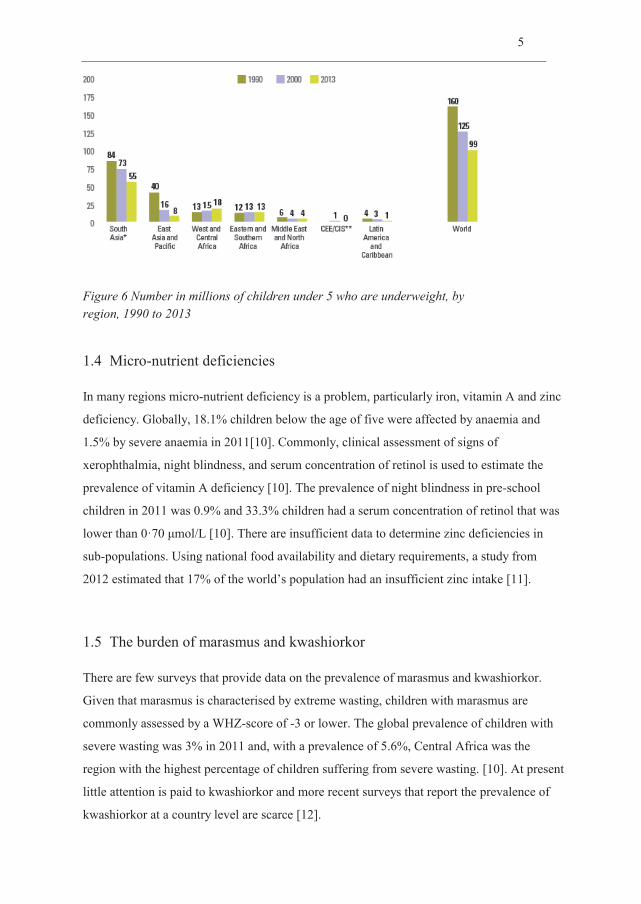
Figure 6 Number in millions of children under 5 who are underweight, by region, 1990 to 2013
The Lancet

The Lancet
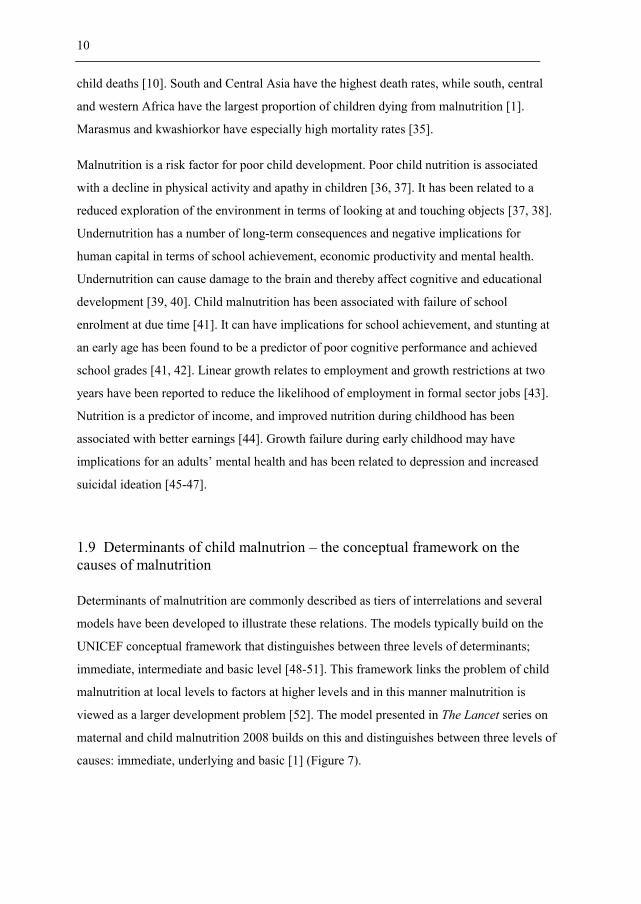
Figure 7 Framework of the relationships between poverty, food insecurity and other underlying
causes to maternal and child undernutrition and their short-term and long term consequences [1]

The protein-energy hypothesis
The free radical hypothesis
The microbiota hypothesis
1.12.1 Household food security
Household characteristics

Inter-household cooperation
Land tenure
Other drivers of household food security
1.12.2 Individual food security
Transitory food insecurity and seasonal variations in child malnutrition

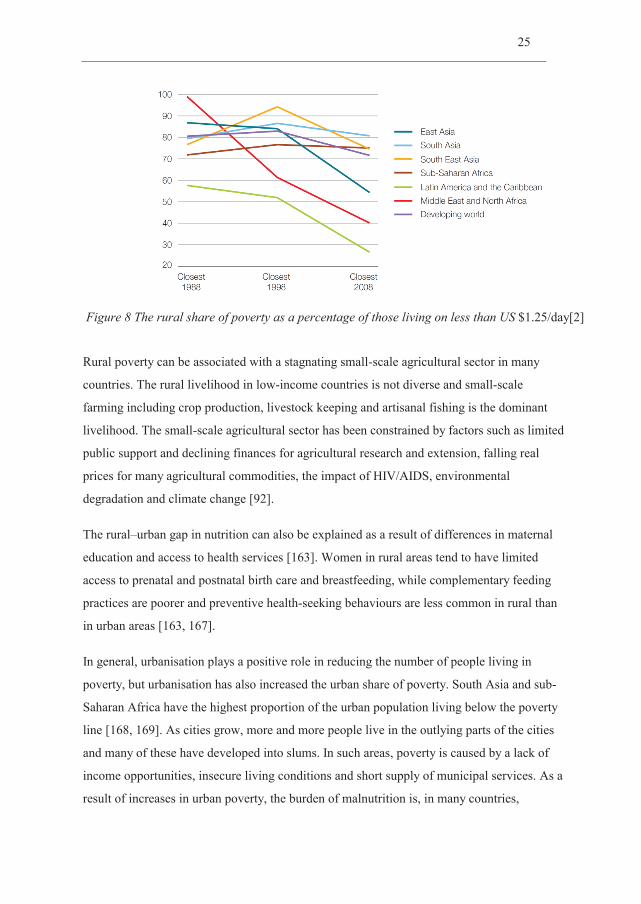
Figure 8 The rural share of poverty as a percentage of those living on less than US

2. Rationale and objectives
3. Material and methods
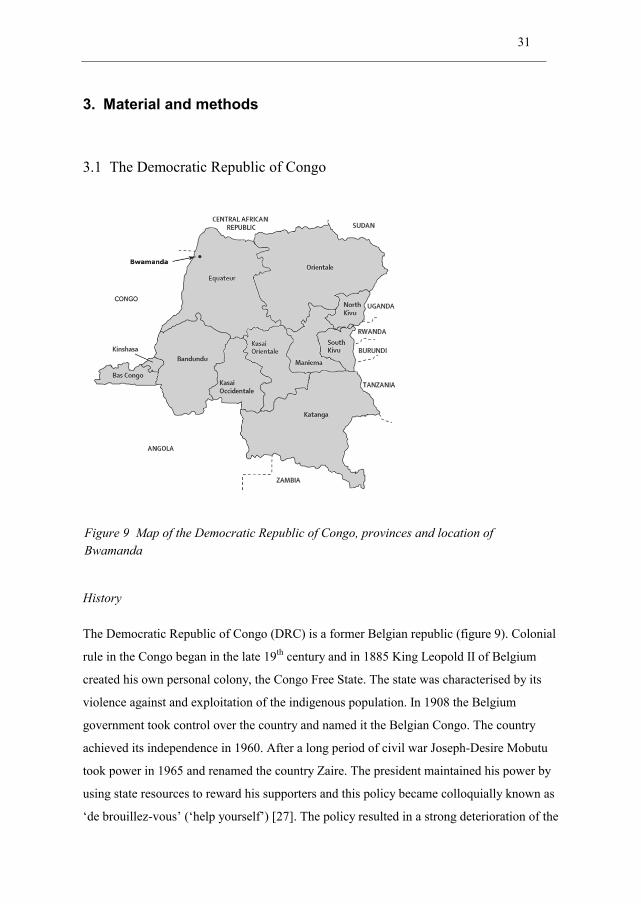
History
Figure 9 Map of the Democratic Republic of Congo, provinces and location of Bwamanda

Food production and food insecurity
Health services
The education sector
Access to clean drinking water and sanitation
Economic development
bo
Agriculture
Gathering, fishing and hunting
Labour organisation and inter-household cooperation
gbisa
gbisa
gbisa ka
Gbisa
gbisa
gbisa
Food consumption
ka
ka

Rites of passage and marriage
The household
gbisa
gbisa
gbisa
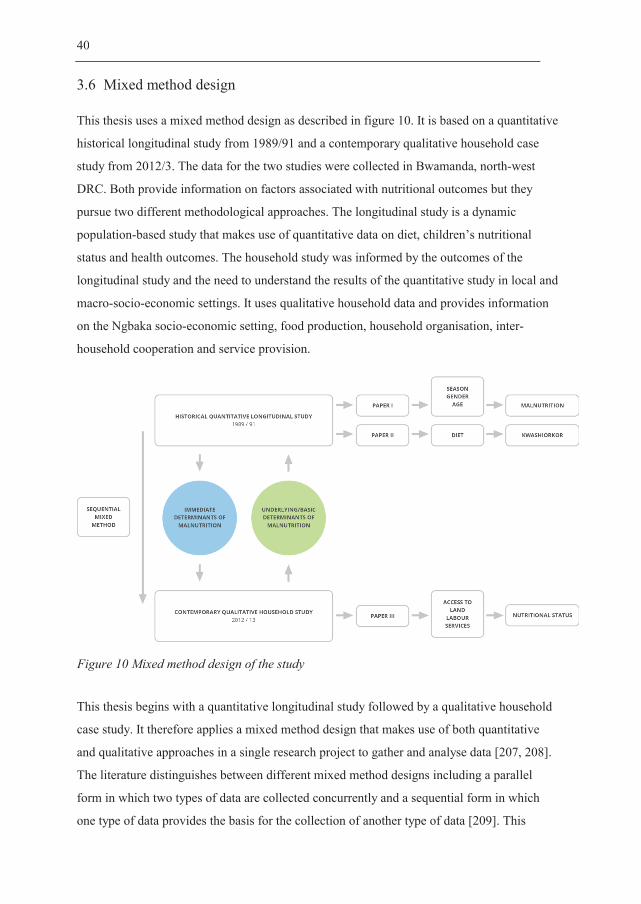
Figure 10 Mixed method design of the study
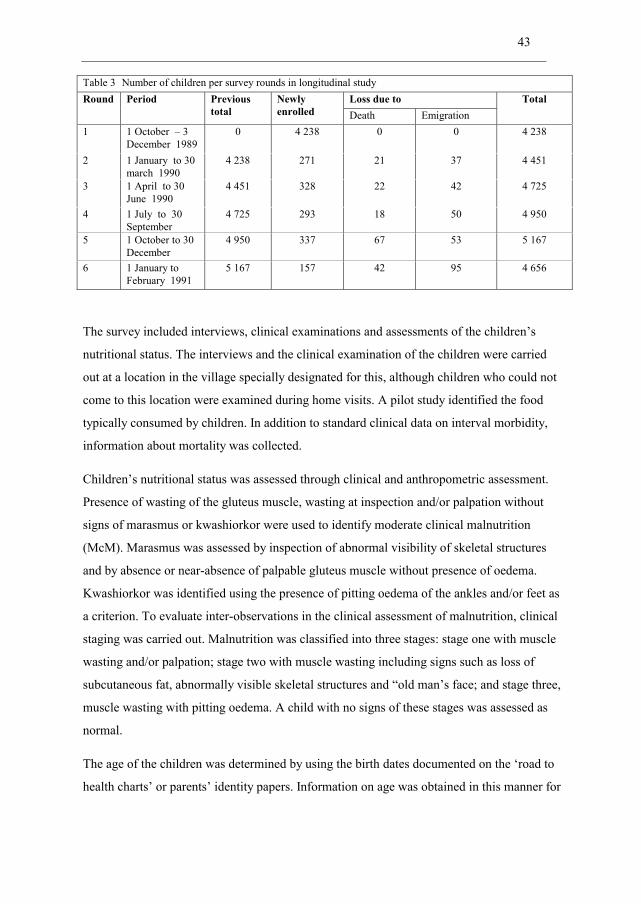
Round Period Previous total
Newly enrolled
Loss due to Total


Table 4
Informants Number of
informants
Methods Dates
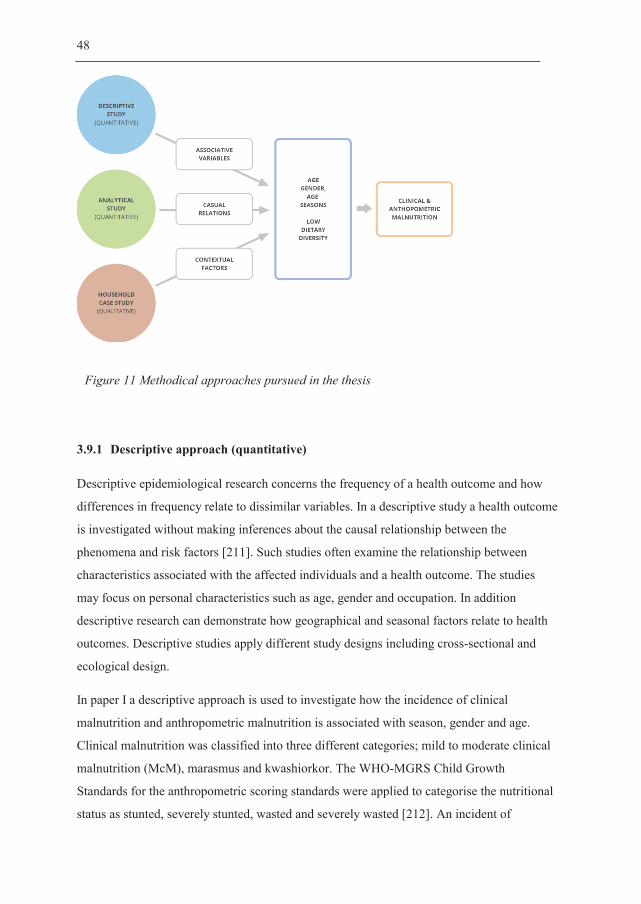
3.9.1 Descriptive approach (quantitative)
Figure 11 Methodical approaches pursued in the thesis
3.9.2 Analytical approach (quantitative)
3.9.3 Case study design and social field analysis (qualitiative)
Explorative approach and case study design
Social field theory
a priori
Data analysis
4. Results
Social fields
gbisa
gbisa
gbisa
The household

Inter-household cooperation – gbisa
gbisa
gbisa
gbisa
gbisa
gbisa
gbisa
gbisa
The village
The local NGO


5. Discussion

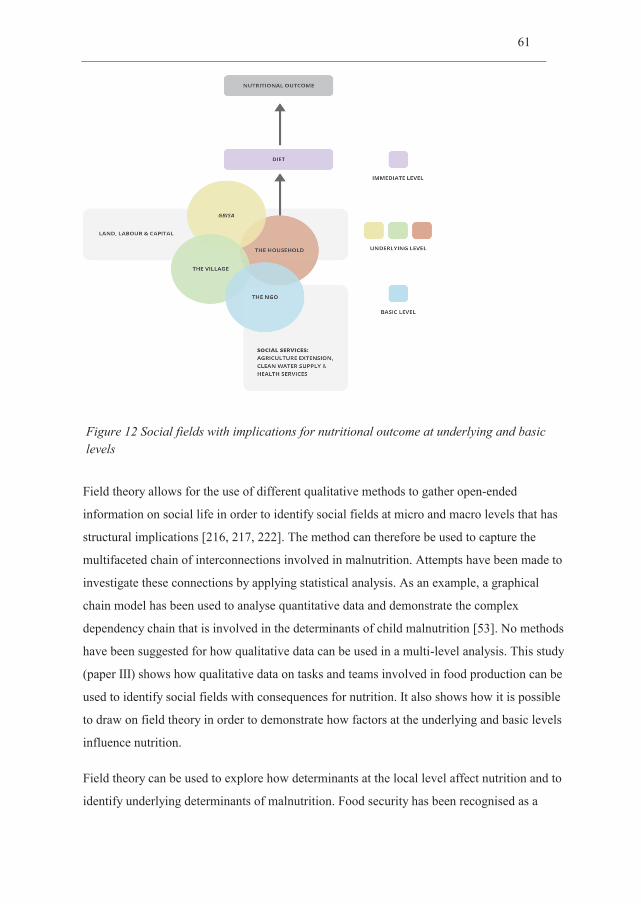
Figure 12 Social fields with implications for nutritional outcome at underlying and basic levels

gbisa


Internal validity

Relevance
Reflexivity
Recruitment and data analysis
Applicability of qualitative findings
gbisa
gbisa
5.7.1 Diet and the development of kwashiorkor
5.7.2 Food and nutrition security
The household
Inter-household cooperation – gbisa
gbisa
gbisa Gbisa
gbisa
The village
5.7.3 The macro socio-economic context of malnutrtion
The DRC socio-economic context
The local NGO

5.7.4 Social inequalities in malnutrition
gbisa.
gbisa
gbisa
gbisa
6. Recommendations and conclusions
The Lancet
gbisa

gbisa

References
Maternal and child undernutrition 1 - Maternal and child undernutrition: global and regional exposures and health consequences.
371Rural Poverty Report 2011
Protein-Energy Malnutrition
Skin signs of nutritional disorders.11
Hair Growth in Kwashiorkor.42
Nutrition-related hair signs in Zairian preschool children and associations with anthropometry.47
Fatty liver in children; kwashiorkor. 6
Pathogenesis of the Fatty Liver in Protein-Energy Malnutrition. 57
UNICEF/WHO/World Bank Joint Child Malnutrition Estimates, 2014
Maternal and child undernutrition and overweight in low-income and middle-income countries. 382
Estimating the Global Prevalence of Zinc Deficiency: Results Based on Zinc Availability in National Food Supplies and the Prevalence of Stunting. 7
Kwashiorkor and severe acute malnutrition in childhood - Reply.371
Kwashiorkor: a nutritional disease of children associated with a maize diet. Volume 226
Kwashiorkor and severe acute malnutrition in childhood.371
The distribution of kwashiorkor in the southern region of Malawi. 15
Kwashiorkor - is it a dying disease?97
Developmental Drivers of Nutritional Change: A Cross-Country Analysis. 42
What Policy Changes Will Reverse Persistent Malnutrition in Asia? 25
Ending poverty and sharing prosperity Global monitoring report
Africa and the Green Revolution A Global Historical Perspective.70

Assessing the impact of the Green Revolution, 1960 to 2000. 300
The green revolution Curse or blessing?
Poverty and the state of nutrition in India. 22
Enquête Démographique et de Santé République Démocratique du Congo 2014
Enquête Démographique et de Santé République Démocratique du Congo 2007
Enquête Démographique et de Santé République Démocratique du Congo 2007
Neither war nor peace in the Democratic Republic of Congo (DRC): profiting and coping amid violence and disorder.
40Human development index and its components UNDP Human
Development Report
Democratic Republic of the Congo: Poverty Reduction Strategy Paper
For Congo Children, Food Today Means None Tomorrow
The least developed countries - the case of the Congo DR. 61
Democratic Republic of Congo (2012).
Transforming Agricultural Extension System and Accelerating Agricultural Productivity Growth in the Democratic Republic of Congo
Improving financial access to health care in the Kisantu district in the Democratic Republic of Congo: acting upon complexity.
8Kwashiorkor: still an enigma – the search must go on
Behavior of Severely Malnourished Children in a Jamaican-Hospital.
33Behaviour and development of stunted and nonstunted
Jamaican children.40Some Indicators of Nutritional Status Are Associated with
Activity and Exploration in Infants at Risk for Vitamin and Mineral Deficiencies.139
Malnutrition, poverty and intellectual development.274
Early postnatal protein-calorie malnutrition and cognition: a review of human and animal studies. 8
The Impact of Childhood Malnutrition on Schooling: Evidence from Bangladesh.
43Child development in developing countries 1 -
Developmental potential in the first 5 years for children in developing countries.369
Early childhood length-for-age is associated with the work status of Filipino young adults.7
Effect of a nutrition intervention during early childhood on economic productivity in Guatemalan adults. 371
Linear growth in early life is associated with suicidal ideation in 18-year-old Filipinos.23
Early childhood stunting is associated with poor psychological functioning in late adolescence and effects are reduced by psychosocial stimulation.
137Early childhood malnutrition predicts depressive symptoms at
ages 11-17. 51The State of the World's Children 1998: Focus on Nutrition Oxford
University Press for UNICEF
Care and nutrition: Concepts and measurement. 27
Explaining child malnutrition in developing countries: a cross country analysis. Food Consumption and Nutrition Division discussion paper
Revisiting the UNICEF malnutrition framework to foster agriculture and health sector collaboration to reduce malnutrition: A comparison of stakeholder priorities for action in Afghanistan.
34UNICEF Conceptual Framework Malnutrition
Undernutrition in Benin-an analysis based on graphical models.56
Malnutrition among children under the age of five in the Democratic Republic of Congo (DRC): does geographic location matter?
11Nutritional epidemiology, third edition
The Nature of Nutritional Deficiency in Relation to Growth Failure and Poverty.
Food diversity versus breastfeeding choice in determining anthropometric status in rural Kenyan toddlers.
27Food consumption of young stunted and non-stunted children
in rural Zambia. 53Dietary diversity, child nutrition and health in contemporary
African communities.136
Food diversity versus breastfeeding choice in determining anthropometric status in rural Kenyan toddlers.
27Dietary Diversity and Subsequent Cause-
Specific Mortality in the Nhanes-I Epidemiologic Follow-up-Study.14
Variability in two indexes of dietary diversity in the US population. 11
Food variety - a good indicator of nutritional adequacy of the diet? A case study from an urban area in Mali, West Africa. 52
Dietary diversity is associated with child nutritional status: evidence from 11 demographic and health surveys. 134
Dietary Diversity is Associated with Nutrient Intakes and Nutritional Status of Children in Ghana. 2
Pathophysiological factors of importance in protein-calorie malnutrition
Experimental Protein-Energy Malnutrition in Baby Baboons - Attempts to Reproduce Pathological Features of Kwashiorkor as Seen in Uganda. 28
Notes on pathophysiological factors of importance in protein-calorie malnutrition.
A note on infantile pellagra.35
The pathogenesis of oedema in kwashiorkor--the role of plasma proteins. 38
Famine in Ethiopia 1983-1985: kwashiorkor and marasmus in four regions. 7
Kwashiorkor and marasmus: evolution and distinguishing features. .5
Albumin and Nutritional Edema.1
Protein-Deficiency, Energy Deficiency, and the Edema of Malnutrition. 1
Free radicals in the pathogenesis of kwashiorkor.46
Bacterial contamination in traditional Gambian weaning foods. 1
Blood Glutathione in Severe Malnutrition in Childhood.80
Red-Blood-Cell Antioxidant Enzyme Concentrations in Kwashiorkor and Marasmus. 13
Cysteine supplementation improves the erythrocyte glutathione synthesis rate in children with severe edematous malnutrition.
76HIV infection in severely
malnourished children in Kumasi, Ghana: a cross-sectional prospective study.13
Antioxidant supplementation for the prevention of kwashiorkor in Malawian children: randomised, double blind, placebo controlled trial.330
Persistent gut microbiota immaturity in malnourished Bangladeshi children. 510
Gut Microbiomes of Malawian Twin Pairs Discordant for Kwashiorkor. 339
Kwashiorkor and the Gut Microbiota.368
Fighting undernutrition: don't forget the bugs.13
Nutrition When guests turn hostile. 494Undernutrition-Looking Within for Answers.
339Food security: definition and measurement.
1Factors Influencing Household Food Security in
West Africa: The Case of Southern Niger. 6The State of Food and Agriculture. Innovation in Family Farming.
Small Farms: Current Status and Key Trends, Information Brief Research Workshop Wye College, June 26–29, 2005
The Future of Small Farms: Trajectories and Policy Priorities.38
The future of small farms. Proceedings of a research workshop
The Future of Small Farms.38
The State of Food and Agriculture Innovation in family farmingFamily and Household - Analysis of Domestic Groups.
8Household-level determinants of food insecurity in rural
areas of Dire and Dawa, Eastern Ethiopia. .9
Determinants of food security among households in Addis Ababa, Ethiopia. 10
Empirical analysis of the determinants of rural household food security in Southern Ethiopia: The case of Shashemene District. .
1
Factors influencing household food security among smallholder farmers in the Mudzi district of Zimbabwe.31
Household Organization - and Intensive Agriculture - the Kofyar Case. 35
Land-Use and the Extended Family in Moala, Fiji.59
The theory of peasant ecomomy
Stone-age economicsDeterminants of household food security in Nepal: A
binary logistic regression analysis. 8
The pervasive triad of food security, gender inequity and women's health: exploratory research from sub-Saharan Africa. 5
Food chain activities of women in an Agrarian Community in Central Nigeria. 19
Female Labor Participation in Agricultural Production and the Implications for Nutrition and Health in Rural Africa.
34The State of Food and Agriculture 2010 2011. Women in Agriculture. Closing
the gender gap for development The State of Food and Agriculture
Poverty and productivity in female-headed households in Zimbabwe. 43
What Determines Gender Inequality in Household Food Security in Kenya? Application of Exogenous Switching Treatment Regression. 56
HIV affected households in Western Kenya experience greater food insecurity. 42
Female-headed households and food insecurity in Brazil. 4
Gender and agriculture in the information society. ISNARBriefing Paper
Small and as productive: Female-headed households and the inverse relationship between land size and output in Kenya Working Paper
Modeling the impact of HIV/AIDS upon food security of diverse rural households in Western Kenya. 103
Effects of HIV/AIDS on the livelihood of banana-farming households in Central Kenya. .
56Institutional aspects of shifting cultivation
Co operative labour in peasant agriculture.2
Encyclopaedia of African history 1-3
Culture Structure and Process - the Occurrence and Disappearance of Reciprocal Farm-Labor. 12
Communual labour in the Sudan
Tenures in Transition, Tenures in Confict: Examples from the Zimbabwe Social Forest. 58
Land Tenure System and their Impacts on Food Security and Sustainable Development in Africa
Land tenure and food security: Exploring dynamic linkages. 30
Technology adoption and the multiple dimensions of food security: the case of maize in Tanzania
Markets, Climate Change, and Food Security in West Africa. 43
Targeting agricultural research and extension for food security and poverty alleviation: A case study of fish farming in Central Cameroon.
36Soil fertility management in support of food security in sub-Saharan Africa
Micro-level practices to adapt to climate change for African small-scale farmers: A review of selected literature
An analysis of childhood malnutrition in rural India: Role of gender, income and other household characteristics. 27
Gender inequality and severe malnutrition among children in a remote rural area of Bangladesh.
18Sex Bias in the Family Allocation of Food and
Health-Care in Rural Bangladesh. 7
Selective Discrimination against Female-Children in Rural Punjab, India. 13
Intra-household allocation of food and health care: Current findings and understandings - Introduction. 44
Sex differences in health indicators among children in African DHS surveys. 35
Boys are more stunted than girls in Sub-Saharan Africa: a meta-analysis of 16 demographic and health surveys. 12
An analysis of socio-demographic patterns in child malnutrition trends using Ghana demographic and health survey data in the period 1993-2008. 13
Gender inequality in food intake and nutritional status of children under 5 years old in rural Eastern Kenya.
65Inequality in the intrafamily distribution of food: the dilemma
of defining an individual’s ‘‘fair share
Seasonal-Variations, and the Intra-Household Distribution of Food in a Bangladeshi Village.
41Inter-household and intra-household patterns of fish and
meat consumption in fishing communities in two states in Nigeria.97Seasonal aspects of weight-for-age in young children in Zimbabwe.
4Effect of economic inequality on chronic childhood undernutrition in
Ghana. 10Malnutrition and the disproportional burden on the poor: the
case of Ghana. 6Socioeconomic inequality in malnutrition in developing
countries. 86Determinants of Inequality in Child Malnutrition in India the Poverty-
Undernutrition Linkage. 6Socioeconomic inequalities in child malnutrition in
the developing world Policy Research Working PaperInequities in under-five child malnutrition in South Africa.2
The family as a determinant of stunting in children living in conditions of extreme poverty: a case-control study. 4
Determinants of Child Nutrition and Mortality in North-West Uganda. 70
Geographical accessibility to healthcare and malnutrition in Rwanda. 130
Human development, poverty, health & nutrition situation in India. 128
Agrarian Poverty, Nutrition and Economic Class - A Study of Gujarat, India. 13
Research to advance understanding of the interrelationship of poverty and nutrition. 107
Why Americans eat what they do: Taste, nutrition, cost, convenience, and weight control concerns as influences on food consumption.
98The cost of a healthy diet: A South African perspective.
27Food security and poverty in Asia and the Pacific key challenges
Household Rice Expenditure and Maternal and Child Nutritional Status in Bangladesh. 140
Castel Gandolfo Workshop: An Introduction to the Impact of Climate Change, the Economic Crisis, and the Increase in the Food Prices on Malnutrition. 140
Child health inequities in developing countries: differences across urban and rural areas. 5
Urban-rural differentials in child malnutrition: trends and socioeconomic correlates in sub-Saharan Africa. 13
Why is child malnutrition lower in urban than in rural areas? Evidence from 36 developing countries.
33In an era of economic growth, is inequity holding
back reductions in child malnutrition in Vietnam?12
Are determinants of rural and urban food security and nutritional status different? Some insights from Mozambique.
27Poverty in Rural and Urban Areas Direct comparisons using
the global MPI 2014
Urbanization in Latin America: Constraints and opportunities for child feeding and care. 21
Urban Poverty: A Global ViewNew Evidence on the. Urbanization of Global
Poverty Policy Research Paper No. 4199The politics of reducing malnutrition: building commitment and
accelerating progress. 382Socioeconomic Causes and Cultural Explanations of Childhood
Malnutrition among the Chagga of Tanzania.38
Hunger and shame. Child malnutrition and poverty on Mount Kilimanjaro
Reducing Child Undernutrition: Past Drivers and Priorities for the Post-MDG Era. 68
Why Worry About the Politics of Childhood Undernutrition?64
Political violence, drought and child malnutrition: Empirical Evidence from Andhra Pradesh, India Households in Conflict Network Working Papers
Fighting maternal and child malnutrition: Analysing the political and institutional determinants of delivering a national multisectoral response in six countries. A synthesis paper
Arm Circumference and Other Factors in Children at High-Risk of Death in Rural Bangladesh.2
A model to standardise mortality of severely malnourished children using nutritional status on admission to therapeutic feeding centres.
51Influence of nutritional-status on
child-mortality in rural Zaire. 341Livelihoods, basic services and social protection
in Democratic Republic of the Congo Wageningen working paper
Growth of Young Children in a Gambian Village.62
A quantitative study into the role of infection in determining nutritional status in Gambian village children.
48Worldwide timing of growth faltering: revisiting implications for
interventions. 125Pattern of growth faltering and recovery in under-5 children in
India using WHO growth standards - A study on first and third national family health survey. 48
Timing of growth faltering: A critical window for healthy growth.48
Nutrition, health and mortality in sub-Saharan Africa: Is there a gender bias? 32
Dietary diversity, child nutrition and health in contemporary African communities. 136
The quality of the diet in Malawian children with kwashiorkor and marasmus. 2
A prospective assessment of food and nutrient intake in a population of Malawian children at risk for kwashiorkor.44
Child mortality in the Democratic Republic of Congo: cross-sectional evidence of the effect of geographic location and prolonged conflict from a national household survey. 14
Mortality in the Democratic Republic of Congo: a nationwide survey. 367
Food Security Country Framework for the Democratic Republic of Congo FY 2011–FY 2015. USAID Office of Food for Peace Food Security Country Framework for the Democratic Republic of Congo FY 2011–FY 2015.
IMF Country Report No. 14/273 Seclected issues
World Health Organization Global Health Expenditure database
Implementation Completion and Results Report Educational Sector the DRC
GDP per capita, PPP (current international $)
The Democratic Republic of Congo Country Overview
IDH : la RDC pourrait devenir émergent d’ici 13 ans, selon le PNUD
Country Note The Democratic Republic of Congo
Province de l’Equateur. Profile Resume. Pauvrete et Conditions de Vie des Menages
Historical Dictionary of the Democratic Republic of the Congo.
Enquête Démographique et de Santé République Démocratique du Congo 2013 2014
Les Ngbaka du centre de L'Ubangi
Assessment of child health and nutrional status in a rural tropical area
Le Mariage et La Naissance Chez Les Ngbaka Minagende (Rdc).30
Assessment of child health and nutritional status in a rural area
Research design: Qualitative,Quantitative and Mixed Methods Approaches.
The New Era of Mixed Methods.1
A sequential mixed model research design: design, analytical and display issues.3
Designing and Conducting Mixed Methods Research 2ND edition
Epidemiology: Principles and Practical Guidelines
Child Growth Standards: Length/Height-for-Age, Weight-for-Age, Weight for- Length, Weight-for-Height and Body Mass Indexfor-Age: Methods and Development.
Etiologic study vis-a-vis intervention study.25
Case Study Research: Design and Methods. 4th edition
The case study approach.11
Micro-Macro Relations: Social Organization in Antalya,
Scale as a variable i analaysis: fields in social organisation in Herat, northwest Afghanistan Scale and social organisation
In other words: Essays toward a reflexive sociology .
What is Field Theory? 109
Bourdieu's Theory of Social Fields Concepts and Applications
Field, local communities and planning Lecture transcription (In Norwegian)
Migration and territorialisation (in Norwegian).21
The forms of capital
Social Space and Symbolic Space - Introduction to Japanese Reading of 'Distinction'. 12
Practice and field: revising Bourdieusian concepts CRIC Discussion Paper
Social theory as habitus Bourdieu: Critical Perspectives; ed
Power after Lukes: a review of the literature An overview of theories of power since Lukes and their application to development
Estimation of design effects in cluster surveys.4
Principles of Nutritional Assessment, second edition
Anthropometric measurement error and the assessment of nutritional status. 82
Retrieval from Memory of Dietary Information. 5
Reproducibility and Validity of Dietary Assessment Instruments .1. A Self-Administered Food Use Questionnaire with a Portion Size Picture Booklet.
128Relative validity and reproducibility of a food frequency dietary
questionnaire for use in the Italian EPIC centres.26
National Nutrient Database for Standard Reference Release
The contribution of wild plants to human nutrition in the Ferlo.
Qualitative research & evaluation methods (3rd edn.)
Reviewing Qualitative Research - Proposed Criteria for Fairness and Rigor. 14
Kvalitative metoder i medisinsk forskning, 3 utg. (In Norwegian)

Qualitative research: standards, challenges, and guidelines.358
Research design , forth editionGeneralization in quantitative and qualitative research:
Myths and strategies. 47
Enhancing Generalizability: Moving From an Intimate to a Political Voice. 19
Within-case and across-case approaches to qualitative data analysis. 13
Alternative arguments for generalizing from data as applied to qualitative research. 22
Lipid kinetic differences between children with kwashiorkor and those with marasmus. 83
Protein metabolism in severe childhood malnutrition.28
The contribution of wild plants to human nutrition in the Ferlo.7
Bioaccessibility of beta-carotene in orange fleshed sweet potato. 23
Availability of Beta-Carotene from Papaya Fruit and Amaranth in Preschool-Children.
17beta-carotene and other carotenoids as antioxidants.
18The shifting perception on antioxidants: The case of vitamin E
and beta-carotene. 4Low plasma lycopene concentration is associated with increased
mortality in a cohort of patients with prior oral, pharynx or larynx cancers.23
Mortality associated with low plasma concentration of beta carotene and the effect of oral supplementation.
275Household-level determinants of food insecurity in rural
areas of Dire and Dawa, Eastern Ethiopia.9
Empirical analysis of the determinants of rural household food security in Southern Ethiopia: The case of Shashemene District. . 2012. 1(6): p. 132–8.1
Determinants of rural household food security: a comparative analysis of African and Asian studies.
93Solving Africa’s Weed Problem: Increasing Crop Production &
Improving the Lives of WomenSeasonal Hunger: A Neglected Problem with
Proven Solutions. 6
Dietary diversity is associated with nutritional status of Orang Asli children in Krau Wildlife Reserve, Pahang. 18
The role of wild foods in food security: the example of Timor-Leste. 7
Pattern of growth faltering and recovery in under 5 children in India using WHO growth standards--a study on First and Third National Family Health Survey. 48
Work Parties, Wages, and Accumulation in a Voltaic Village.10
Seasonality, Labor Scheduling, and Agricultural Intensification in the Nigerian Savanna.
92Reciprocal Labor and Peripheral Capitalism in the Central Andes.
19Neighbors and Networks: The Idiom of Kin- ship in Social Action
among the Nden-deuli of Tanzania Traditional communal labour and rural development.
Examples from Africa South of Sahara Food and nutrition safety of
children under two years of age in families of landless rural workers.16
Africa Human Development Report 2012. Towards a Food Secure Future.
Comprehensive Food Security and Vulnerability Analysis Democratic Republic of Congo
Land-Tenure Patterns and Child Health in Southern Brazil - the Relationship between Agricultural Production, Malnutrition and Child-Mortality. 15
Socio-economic influences on gender inequalities in child health in rural Bangladesh. 50
Local Governance & Leadership in Eastern DRC
Effective responses: Protestants, Catholics and the provision of health care in the post-war Kivus. 40
From devastation to mobilisation: the Muslim community's involvement in social welfare in post-conflict DRC.
40How changes in coverage affect equity in maternal and child
health interventions in 35 Countdown to 2015 countries: an analysis of national surveys. 380
What drives food insecurity in southern Africa? A meta-analysis of household economy studies.
15The 2008 Food Price Crisis Negatively Affected Household
Food Security and Dietary Diversity in Urban Burkina Faso.142
Distinction: A social critique of the judgement of taste.
The Lancet Nutrition Interventions Review Group, and the Maternal and Child Nutrition Study Group. Evidence-based interventions for improvement of maternal and child nutrition: what can be done and at what cost? (vol 382, pg 452, 2013). 382
Vitamin A supplementation for preventing morbidity and mortality in children from 6 months to 5 years of age.
Introduction of Orange Sweet Potato in Uganda Could Improve Vitamin a Intakes of Vulnerable Groups.55
Seasonal and spatial factors related to longitudinal patterns of child growth in Bwamanda, DR Congo.
Time of emergence of climate signals.39

Original papers I - III

I

Corrections

STUDY PROTOCOL Open Access
Incidence and course of child malnutritionaccording to clinical or anthropometricalassessment: a longitudinal study from ruralDR CongoHallgeir Kismul1*, Catherine Schwinger1, Meera Chhagan2, Mala Mapatano3 and Jan Van den Broeck1
Abstract
Background: Longitudinal studies describing incidence and natural course of malnutrition are scarce. Studiesdefining malnutrition clinically [moderate clinical malnutrition (McM) marasmus, kwashiorkor] rather thananthropometrically are rare. Our aim was to address incidence and course of malnutrition among pre-schoolers andto compare patterns and course of clinically and anthropometrically defined malnutrition.
Methods: Using a historical, longitudinal study from Bwamanda, DR Congo, we studied incidence of clinical versusanthropometrical malnutrition in 5 657 preschool children followed 3-monthly during 15 months.
Results: Incidence rates were highest in the rainy season for all indices except McM. Incidence rates of McM andmarasmus tended to be higher for boys than for girls in the dry season. Malnutrition rates increased from the 0–5to the 6 – 11 months age category. McM and marasmus had in general a higher incidence at all ages than theiranthropometrical counterparts, moderate and severe wasting. Shifts back to normal nutritional status within3 months were more frequent for clinical than for anthropometrical malnutrition (62.2-80.3% compared to3.4-66.4.5%). Only a minority of moderately stunted (30.9%) and severely stunted children (3.4%) shifted back tonormal status. Alteration from severe to mild malnutrition was more characteristic for anthropometrically than forclinically defined malnutrition.
Conclusions: Our data on age distribution of incidence and course of malnutrition underline the importance ofearly life intervention to ward off malnutrition. In principle, looking at incidence may yield different findings fromthose obtained by looking at prevalence, since incidence and prevalence differ approximately differ by a factor“duration”. Our findings show the occurrence dynamics of general malnutrition, demonstrating that patterns candiffer according to nutritional assessment method. They suggest the importance of applying a mix of clinical andanthropometric methods for assessing malnutrition instead of just one method. Functional validity ofcharacterization of aspects of individual nutritional status by single anthropometric scores or by simple clinicalclassification remain issues for further investigation.
Keywords: Malnutrition, Marasmus, Kwashiorkor, Wasting, Stunting, Incidence
* Correspondence: [email protected] for International Health, University of Bergen, 5020 Bergen, NorwayFull list of author information is available at the end of the article
© 2014 Kismul et al.; licensee BioMed Central Ltd. This is an Open Access article distributed under the terms of the CreativeCommons Attribution License (http://creativecommons.org/licenses/by/2.0), which permits unrestricted use, distribution, andreproduction in any medium, provided the original work is properly cited. The Creative Commons Public Domain Dedicationwaiver (http://creativecommons.org/publicdomain/zero/1.0/) applies to the data made available in this article, unless otherwisestated.
Kismul et al. BMC Pediatrics 2014, 14:22http://www.biomedcentral.com/1471-2431/14/22
BackgroundWhile the worldwide prevalence of child malnutrition inthe period from 1990 to 2010 declined significantly, therehas been only minimal change in sub-Saharan Africa [1].It is therefore important to improve our understanding ofchild malnutrition in these settings. Many studies fromsub-Saharan Africa have determined the national, regionalor local occurrence frequencies of child malnutrition.Typically, these studies provide prevalence rates of low an-thropometric scores in population cross-sections as themeasure of burden of malnutrition. In contrast, longitu-dinal studies looking at incidence and natural course ofmalnutrition are few. Such studies are useful because theyallow for a better understanding of season- and age-dependent risks for developing malnutrition. The study ofthe natural course of malnutrition is considered to be ofparticular value for nutritional programmes in planninginterventions [2]. There are very few such studies and ac-cording to Isanaka et al. [3] only one population-basedstudy has been published concerning the duration of un-treated malnutrition [4]. Studies defining malnutritionclinically (marasmus, kwashiorkor, moderate clinical mal-nutrition) rather than anthropometrically are also scarce,despite the fact that anthropometric assessment alonelacks specificity in the diagnosis of malnutrition [5].Given that clinical assessment of malnutrition is a
comparatively inexpensive method suitable for regionswith a significant burden of malnutrition, the lack of at-tention to this method is remarkable.The aim of this paper is to address, in a large popula-
tion-based study, longitudinal occurrence patterns andcourse of malnutrition among pre-schoolers and to com-pare these patterns among clinically and anthropome-trically defined malnutrition. Our specific aim was todescribe age-, season- and gender- dependent incidence ofmoderate clinical malnutrition, marasmus and kwashior-kor, and compare these with rates obtained using anthro-pometrical definitions of malnutrition. We also sought todescribe and compare patterns of change and duration ofclinically and anthropometrically defined malnutrition.
MethodsThe Bwamanda studyThis paper presents a secondary analysis of data fromthe historical Bwamanda study [6]. The rural area ofBwamanda is located in northwest DR Congo and has atropical climate with the rainy season lasting from Aprilto November and the dry season from December toMarch. The major livelihood adaptation was subsistenceagriculture, mainly cultivation of cassava and maize. Thearea was served by a central hospital and 10 peripheralhealth centres with a local NGO that up till today holdsthe major responsibilities for running the health servicesin the area. Several health centres had an associated
nutritional rehabilitation centre, but the uptake was lim-ited due to time constraints of mothers, the voluntarynature of the personnel services in these centres, and in-terruptions of stocks of food supplements. During thestudy sick children were referred to the local health centreor hospital where they received oral rehydration therapyfor diarrhoea, antibiotics for severe respiratory infectionand chloroquine or quinine for malaria. Moreover, se-verely malnourished children were offered transport tothe Bwamanda hospital. Since the study was undertakenthere have been few political and economic changes. Thesocio-economic development in the area has been con-strained by several factors including restricted public ser-vice support and only minor private sector growth.The study included 5 657 children from 16 villages in
the Bwamanda area. A sample of 4 238 pre-school chil-dren was enrolled at the first contact. During follow-upnewborn and immigrated children were added, whilesome children were lost due to emigration or death. Inthe last follow up round children who were born in1984, and had reached six years, were no longer exam-ined. Children were followed in the period 1989–1991.Three-monthly contacts were organised making up 15months of follow-up and 6 contacts. The area was veryhomogeneous and there were no significant differencesbetween the villages in nutritional status of the childrenor socioeconomic status (negligible design effect).Fifteen interviewers holding a secondary school cer-
tificate were trained in simple physical examinations andin undertaking interviews in the villages according to aninterviewer’s manual. They determined age on the basisof children’s birth date noted on road to health chartsor/and on parents’ identity papers. This information wasavailable for about 90% of the children. For the remai-ning ones, birth dates were determined by a careful inter-view of the mothers using a local events calendar.Nutritional status of children was assessed by clinical
assessment as well as by anthropometrical assessment.The clinical assessment of nutritional status is describedby Van den Broeck et al. [7]. With this method maras-mus was assessed by inspection of abnormal visibility ofskeletal structures and by absence or near-absence ofpalpable gluteus muscle. Kwashiorkor was assessed usingthe presence of pitting oedema of the ankles and/or feetas a criterion. Moderate clinical malnutrition (McM)was identified as the presence of wasting of the gluteusmuscle, wasting at inspection and/or palpation withoutsigns of marasmus or kwashiorkor. Length of childrenbelow 12 months was measured with a locally constructedlength measuring board, while older children’s standingheight was measured with a microtoise, in both cases tothe nearest 0.1 cm. A spring scale (CMS weighting equip-ment) was used to weigh the children to the nearest 100gram. For the present analysis, anthropometric scoring
Kismul et al. BMC Pediatrics 2014, 14:22 Page 2 of 8http://www.biomedcentral.com/1471-2431/14/22
was done using the WHO-MGRS 2006 Child GrowthStandards [8]. Z-scores were calculated for weight forlength/height (WHZ) and for length/height for age (HAZ).Children with a WHZ <−2 to >−3 were classified as mo-derately wasted, those with WHZ <−3 as severely wasted.Similarly, those with a HAZ <−2 to >−3 were categorisedmoderately stunted and those with HAZ <−3 as severelystunted. Clinical and anthropometric assessments partlytake into account different aspects of malnutrition. Bothclinical and anthropometric assessments are able to cap-ture wasting processes and are therefore directly compa-rable methods. However, only anthropometric assessmentmeasures stunting processes.
Incidence rates of malnutritionIncidence rates of the various forms of clinical and an-thropometrical malnutrition were calculated for the agecategories 0–5, 6–11, 12–23, 24–35 and 36–71 months.Incident cases were defined as malnutrition being pre-sent, but absent at the scheduled previous contact. Forthe calculation of incidence rates, the person-time at riskwas defined on the basis of time elapsed from one con-tact round to the next, normally about 3 months. Inci-dence rate was expressed as number per 1 000 personmonths. Direct age standardization was used to compareincidence rates across seasons by using the age distri-bution in the first follow up round (second contact)as the reference. Season was defined as: dry post-harvest(January – March); beginning of rainy pre-harvest (April –June); rainy (July – September); end of rainy season post-harvest (October –December).
Natural course of incident malnutritionTo document the natural course of incident malnutri-tion we examined short-term (3-months) shifts in sever-ity, and short-term (3-months) mortality among childrenwith incident malnutrition. Duration was categorised
as 0–3, 3–6, 6–9, 9–12 months, or as censored afterend of follow-up. Children with a WHZ and HAZ higherthan <−2 were classified as normal, that is “no wasting”and “no stunting”.
Ethical aspectsEthical approval for the Bwamanda study had beengranted by the University of Leuven’s Tropical ChildcareHealth Working Group and funding provided by theFlemish Inter-University Council and the Nutricia Re-search Foundation.
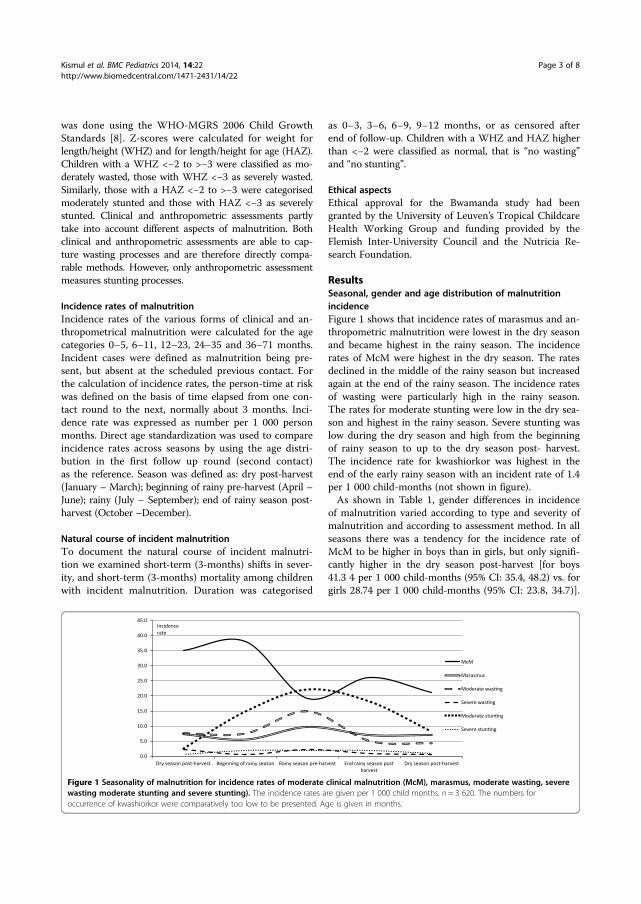
ResultsSeasonal, gender and age distribution of malnutritionincidenceFigure 1 shows that incidence rates of marasmus and an-thropometric malnutrition were lowest in the dry seasonand became highest in the rainy season. The incidencerates of McM were highest in the dry season. The ratesdeclined in the middle of the rainy season but increasedagain at the end of the rainy season. The incidence ratesof wasting were particularly high in the rainy season.The rates for moderate stunting were low in the dry sea-son and highest in the rainy season. Severe stunting waslow during the dry season and high from the beginningof rainy season to up to the dry season post- harvest.The incidence rate for kwashiorkor was highest in theend of the early rainy season with an incident rate of 1.4per 1 000 child-months (not shown in figure).As shown in Table 1, gender differences in incidence
of malnutrition varied according to type and severity ofmalnutrition and according to assessment method. In allseasons there was a tendency for the incidence rate ofMcM to be higher in boys than in girls, but only signifi-cantly higher in the dry season post-harvest [for boys41.3 4 per 1 000 child-months (95% CI: 35.4, 48.2) vs. forgirls 28.74 per 1 000 child-months (95% CI: 23.8, 34.7)].
Figure 1 Seasonality of malnutrition for incidence rates of moderate clinical malnutrition (McM), marasmus, moderate wasting, severewasting moderate stunting and severe stunting). The incidence rates are given per 1 000 child months. n = 3 620. The numbers foroccurrence of kwashiorkor were comparatively too low to be presented. Age is given in months.
Kismul et al. BMC Pediatrics 2014, 14:22 Page 3 of 8http://www.biomedcentral.com/1471-2431/14/22
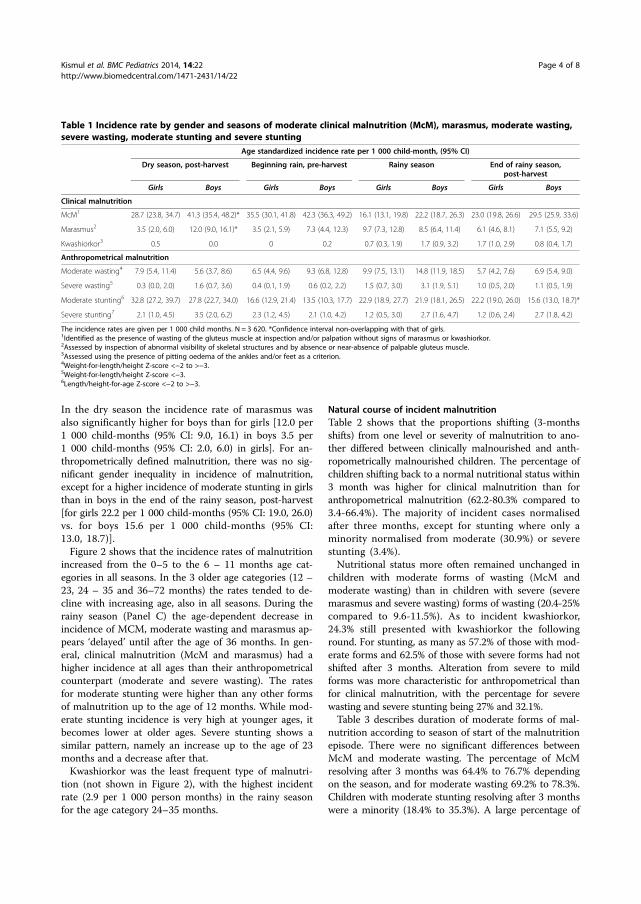
In the dry season the incidence rate of marasmus wasalso significantly higher for boys than for girls [12.0 per1 000 child-months (95% CI: 9.0, 16.1) in boys 3.5 per1 000 child-months (95% CI: 2.0, 6.0) in girls]. For an-thropometrically defined malnutrition, there was no sig-nificant gender inequality in incidence of malnutrition,except for a higher incidence of moderate stunting in girlsthan in boys in the end of the rainy season, post-harvest[for girls 22.2 per 1 000 child-months (95% CI: 19.0, 26.0)vs. for boys 15.6 per 1 000 child-months (95% CI:13.0, 18.7)].Figure 2 shows that the incidence rates of malnutrition
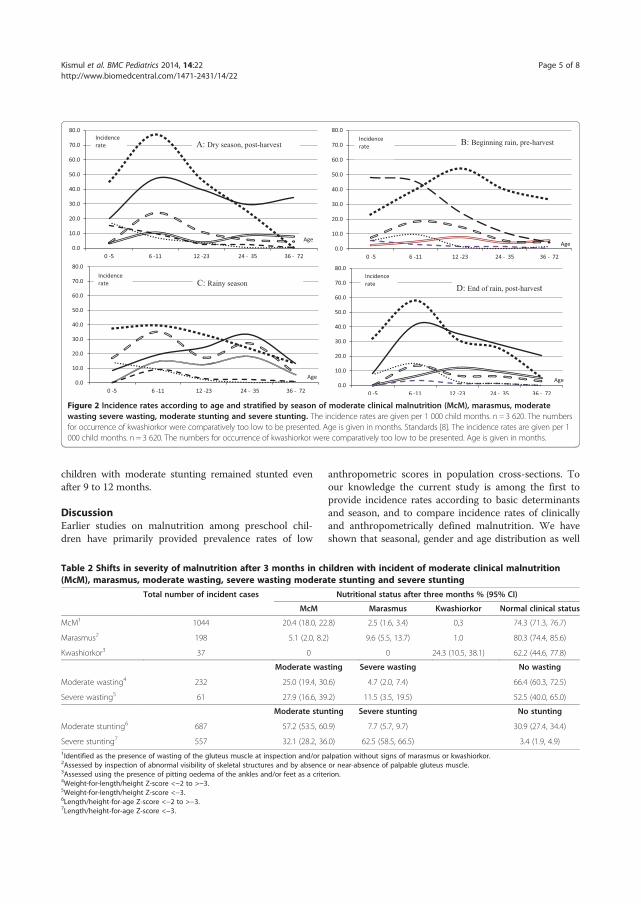
increased from the 0–5 to the 6 – 11 months age cat-egories in all seasons. In the 3 older age categories (12 –23, 24 – 35 and 36–72 months) the rates tended to de-cline with increasing age, also in all seasons. During therainy season (Panel C) the age-dependent decrease inincidence of MCM, moderate wasting and marasmus ap-pears ‘delayed’ until after the age of 36 months. In gen-eral, clinical malnutrition (McM and marasmus) had ahigher incidence at all ages than their anthropometricalcounterpart (moderate and severe wasting). The ratesfor moderate stunting were higher than any other formsof malnutrition up to the age of 12 months. While mod-erate stunting incidence is very high at younger ages, itbecomes lower at older ages. Severe stunting shows asimilar pattern, namely an increase up to the age of 23months and a decrease after that.Kwashiorkor was the least frequent type of malnutri-
tion (not shown in Figure 2), with the highest incidentrate (2.9 per 1 000 person months) in the rainy seasonfor the age category 24–35 months.
Natural course of incident malnutritionTable 2 shows that the proportions shifting (3-monthsshifts) from one level or severity of malnutrition to ano-ther differed between clinically malnourished and anth-ropometrically malnourished children. The percentage ofchildren shifting back to a normal nutritional status within3 month was higher for clinical malnutrition than foranthropometrical malnutrition (62.2-80.3% compared to3.4-66.4%). The majority of incident cases normalisedafter three months, except for stunting where only aminority normalised from moderate (30.9%) or severestunting (3.4%).Nutritional status more often remained unchanged in
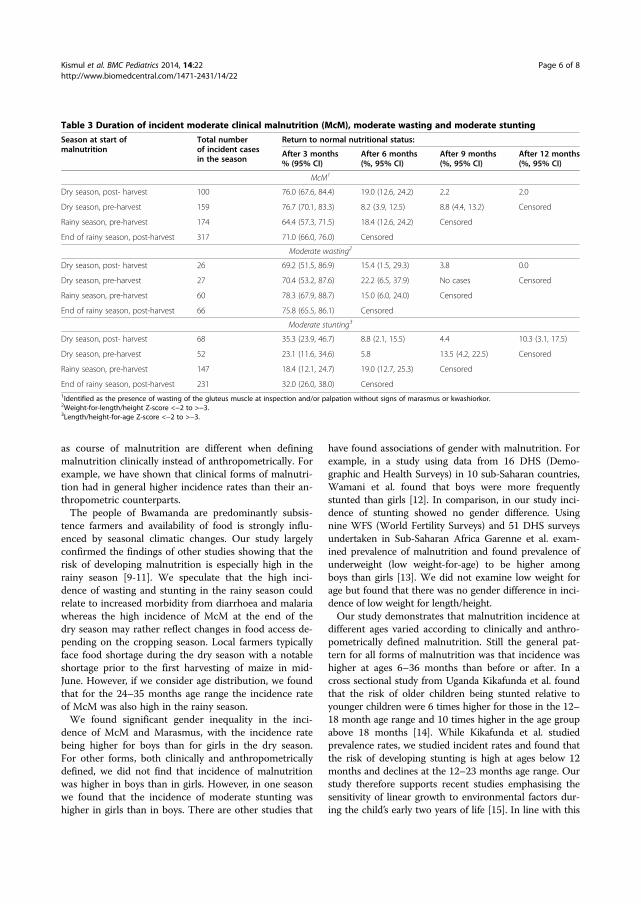
children with moderate forms of wasting (McM andmoderate wasting) than in children with severe (severemarasmus and severe wasting) forms of wasting (20.4-25%compared to 9.6-11.5%). As to incident kwashiorkor,24.3% still presented with kwashiorkor the followinground. For stunting, as many as 57.2% of those with mod-erate forms and 62.5% of those with severe forms had notshifted after 3 months. Alteration from severe to mildforms was more characteristic for anthropometrical thanfor clinical malnutrition, with the percentage for severewasting and severe stunting being 27% and 32.1%.Table 3 describes duration of moderate forms of mal-
nutrition according to season of start of the malnutritionepisode. There were no significant differences betweenMcM and moderate wasting. The percentage of McMresolving after 3 months was 64.4% to 76.7% dependingon the season, and for moderate wasting 69.2% to 78.3%.Children with moderate stunting resolving after 3 monthswere a minority (18.4% to 35.3%). A large percentage of
Table 1 Incidence rate by gender and seasons of moderate clinical malnutrition (McM), marasmus, moderate wasting,severe wasting, moderate stunting and severe stunting
Age standardized incidence rate per 1 000 child-month, (95% CI)
Dry season, post-harvest Beginning rain, pre-harvest Rainy season End of rainy season,post-harvest
Girls Boys Girls Boys Girls Boys Girls Boys
Clinical malnutrition
McM1 28.7 (23.8, 34.7) 41.3 (35.4, 48.2)* 35.5 (30.1, 41.8) 42.3 (36.3, 49.2) 16.1 (13.1, 19.8) 22.2 (18.7, 26.3) 23.0 (19.8, 26.6) 29.5 (25.9, 33.6)
Marasmus2 3.5 (2.0, 6.0) 12.0 (9.0, 16.1)* 3.5 (2.1, 5.9) 7.3 (4.4, 12.3) 9.7 (7.3, 12.8) 8.5 (6.4, 11.4) 6.1 (4.6, 8.1) 7.1 (5.5, 9.2)
Kwashiorkor3 0.5 0.0 0 0.2 0.7 (0.3, 1.9) 1.7 (0.9, 3.2) 1.7 (1.0, 2.9) 0.8 (0.4, 1.7)
Anthropometrical malnutrition
Moderate wasting4 7.9 (5.4, 11.4) 5.6 (3.7, 8.6) 6.5 (4.4, 9.6) 9.3 (6.8, 12.8) 9.9 (7.5, 13.1) 14.8 (11.9, 18.5) 5.7 (4.2, 7.6) 6.9 (5.4, 9.0)
Severe wasting5 0.3 (0.0, 2.0) 1.6 (0.7, 3.6) 0.4 (0.1, 1.9) 0.6 (0.2, 2.2) 1.5 (0.7, 3.0) 3.1 (1.9, 5.1) 1.0 (0.5, 2.0) 1.1 (0.5, 1.9)
Moderate stunting6 32.8 (27.2, 39.7) 27.8 (22.7, 34.0) 16.6 (12.9, 21.4) 13.5 (10.3, 17.7) 22.9 (18.9, 27.7) 21.9 (18.1, 26.5) 22.2 (19.0, 26.0) 15.6 (13.0, 18.7)*
Severe stunting7 2.1 (1.0, 4.5) 3.5 (2.0, 6.2) 2.3 (1.2, 4.5) 2.1 (1.0, 4.2) 1.2 (0.5, 3.0) 2.7 (1.6, 4.7) 1.2 (0.6, 2.4) 2.7 (1.8, 4.2)
The incidence rates are given per 1 000 child months. N = 3 620. *Confidence interval non-overlapping with that of girls.1Identified as the presence of wasting of the gluteus muscle at inspection and/or palpation without signs of marasmus or kwashiorkor.2Assessed by inspection of abnormal visibility of skeletal structures and by absence or near-absence of palpable gluteus muscle.3Assessed using the presence of pitting oedema of the ankles and/or feet as a criterion.4Weight-for-length/height Z-score <−2 to >−3.5Weight-for-length/height Z-score <−3.6Length/height-for-age Z-score <−2 to >−3.
Kismul et al. BMC Pediatrics 2014, 14:22 Page 4 of 8http://www.biomedcentral.com/1471-2431/14/22
children with moderate stunting remained stunted evenafter 9 to 12 months.
DiscussionEarlier studies on malnutrition among preschool chil-dren have primarily provided prevalence rates of low
anthropometric scores in population cross-sections. Toour knowledge the current study is among the first toprovide incidence rates according to basic determinantsand season, and to compare incidence rates of clinicallyand anthropometrically defined malnutrition. We haveshown that seasonal, gender and age distribution as well
Figure 2 Incidence rates according to age and stratified by season of moderate clinical malnutrition (McM), marasmus, moderatewasting severe wasting, moderate stunting and severe stunting. The incidence rates are given per 1 000 child months. n = 3 620. The numbersfor occurrence of kwashiorkor were comparatively too low to be presented. Age is given in months. Standards [8]. The incidence rates are given per 1000 child months. n = 3 620. The numbers for occurrence of kwashiorkor were comparatively too low to be presented. Age is given in months.
Table 2 Shifts in severity of malnutrition after 3 months in children with incident of moderate clinical malnutrition(McM), marasmus, moderate wasting, severe wasting moderate stunting and severe stunting
Total number of incident cases Nutritional status after three months % (95% CI)
McM Marasmus Kwashiorkor Normal clinical status
McM1 1044 20.4 (18.0, 22.8) 2.5 (1.6, 3.4) 0,3 74.3 (71.3, 76.7)
Marasmus2 198 5.1 (2.0, 8.2) 9.6 (5.5, 13.7) 1.0 80.3 (74.4, 85.6)
Kwashiorkor3 37 0 0 24.3 (10.5, 38.1) 62.2 (44.6, 77.8)
Moderate wasting Severe wasting No wasting
Moderate wasting4 232 25.0 (19.4, 30.6) 4.7 (2.0, 7.4) 66.4 (60.3, 72.5)
Severe wasting5 61 27.9 (16.6, 39.2) 11.5 (3.5, 19.5) 52.5 (40.0, 65.0)
Moderate stunting Severe stunting No stunting
Moderate stunting6 687 57.2 (53.5, 60.9) 7.7 (5.7, 9.7) 30.9 (27.4, 34.4)
Severe stunting7 557 32.1 (28.2, 36.0) 62.5 (58.5, 66.5) 3.4 (1.9, 4.9)1Identified as the presence of wasting of the gluteus muscle at inspection and/or palpation without signs of marasmus or kwashiorkor.2Assessed by inspection of abnormal visibility of skeletal structures and by absence or near-absence of palpable gluteus muscle.3Assessed using the presence of pitting oedema of the ankles and/or feet as a criterion.4Weight-for-length/height Z-score <−2 to >−3.5Weight-for-length/height Z-score <−3.6Length/height-for-age Z-score <−2 to >−3.7Length/height-for-age Z-score <−3.
Kismul et al. BMC Pediatrics 2014, 14:22 Page 5 of 8http://www.biomedcentral.com/1471-2431/14/22
as course of malnutrition are different when definingmalnutrition clinically instead of anthropometrically. Forexample, we have shown that clinical forms of malnutri-tion had in general higher incidence rates than their an-thropometric counterparts.The people of Bwamanda are predominantly subsis-
tence farmers and availability of food is strongly influ-enced by seasonal climatic changes. Our study largelyconfirmed the findings of other studies showing that therisk of developing malnutrition is especially high in therainy season [9-11]. We speculate that the high inci-dence of wasting and stunting in the rainy season couldrelate to increased morbidity from diarrhoea and malariawhereas the high incidence of McM at the end of thedry season may rather reflect changes in food access de-pending on the cropping season. Local farmers typicallyface food shortage during the dry season with a notableshortage prior to the first harvesting of maize in mid-June. However, if we consider age distribution, we foundthat for the 24–35 months age range the incidence rateof McM was also high in the rainy season.We found significant gender inequality in the inci-
dence of McM and Marasmus, with the incidence ratebeing higher for boys than for girls in the dry season.For other forms, both clinically and anthropometricallydefined, we did not find that incidence of malnutritionwas higher in boys than in girls. However, in one seasonwe found that the incidence of moderate stunting washigher in girls than in boys. There are other studies that
have found associations of gender with malnutrition. Forexample, in a study using data from 16 DHS (Demo-graphic and Health Surveys) in 10 sub-Saharan countries,Wamani et al. found that boys were more frequentlystunted than girls [12]. In comparison, in our study inci-dence of stunting showed no gender difference. Usingnine WFS (World Fertility Surveys) and 51 DHS surveysundertaken in Sub-Saharan Africa Garenne et al. exam-ined prevalence of malnutrition and found prevalence ofunderweight (low weight-for-age) to be higher amongboys than girls [13]. We did not examine low weight forage but found that there was no gender difference in inci-dence of low weight for length/height.Our study demonstrates that malnutrition incidence at
different ages varied according to clinically and anthro-pometrically defined malnutrition. Still the general pat-tern for all forms of malnutrition was that incidence washigher at ages 6–36 months than before or after. In across sectional study from Uganda Kikafunda et al. foundthat the risk of older children being stunted relative toyounger children were 6 times higher for those in the 12–18 month age range and 10 times higher in the age groupabove 18 months [14]. While Kikafunda et al. studiedprevalence rates, we studied incident rates and found thatthe risk of developing stunting is high at ages below 12months and declines at the 12–23 months age range. Ourstudy therefore supports recent studies emphasising thesensitivity of linear growth to environmental factors dur-ing the child’s early two years of life [15]. In line with this
Table 3 Duration of incident moderate clinical malnutrition (McM), moderate wasting and moderate stunting
Season at start ofmalnutrition
Total numberof incident casesin the season
Return to normal nutritional status:
After 3 months% (95% CI)
After 6 months(%, 95% CI)
After 9 months(%, 95% CI)
After 12 months(%, 95% CI)
McM1
Dry season, post- harvest 100 76.0 (67.6, 84.4) 19.0 (12.6, 24.2) 2.2 2.0
Dry season, pre-harvest 159 76.7 (70.1, 83.3) 8.2 (3.9, 12.5) 8.8 (4.4, 13.2) Censored
Rainy season, pre-harvest 174 64.4 (57.3, 71.5) 18.4 (12.6, 24.2) Censored
End of rainy season, post-harvest 317 71.0 (66.0, 76.0) Censored
Moderate wasting2
Dry season, post- harvest 26 69.2 (51.5, 86.9) 15.4 (1.5, 29.3) 3.8 0.0
Dry season, pre-harvest 27 70.4 (53.2, 87.6) 22.2 (6.5, 37.9) No cases Censored
Rainy season, pre-harvest 60 78.3 (67.9, 88.7) 15.0 (6.0, 24.0) Censored
End of rainy season, post-harvest 66 75.8 (65.5, 86.1) Censored
Moderate stunting3
Dry season, post- harvest 68 35.3 (23.9, 46.7) 8.8 (2.1, 15.5) 4.4 10.3 (3.1, 17.5)
Dry season, pre-harvest 52 23.1 (11.6, 34.6) 5.8 13.5 (4.2, 22.5) Censored
Rainy season, pre-harvest 147 18.4 (12.1, 24.7) 19.0 (12.7, 25.3) Censored
End of rainy season, post-harvest 231 32.0 (26.0, 38.0) Censored1Identified as the presence of wasting of the gluteus muscle at inspection and/or palpation without signs of marasmus or kwashiorkor.2Weight-for-length/height Z-score <−2 to >−3.3Length/height-for-age Z-score <−2 to >−3.
Kismul et al. BMC Pediatrics 2014, 14:22 Page 6 of 8http://www.biomedcentral.com/1471-2431/14/22
Victora et al. and Miamady et al., analysing WHO nationalanthropometric data from 54 countries and Indian Na-tional Family Health Survey respectively, found that meanHAZ declined dramatically until at the age of 24 months[16,17]. In Bwamanda weaning food is already intro-duced at the age of 3 months and this early introductioncould explain the high incidence rates of malnutrition ininfancy.We have described the frequency of severity shifts and
returns to normal nutritional status after three months.The percentage of children with marasmus or McM whoreturned to normal was high. It was also noticeable thata large proportion of severely stunted children returnedto moderate stunting. Isanaka et al. estimated the du-ration of untreated acute moderate and severe anthro-pometrical malnutrition, defined by WHZ and absoluteMUAC (mid-upper arm circumference), by a mathemat-ical model and data from a community-based cohort inNiger of children aged 6 to 60 months [3]. Using the2006 World Health Organization growth standards theirstudy estimated the duration of moderate acute malnu-trition to be 2.5-2.7 months (WHZ defined) and 3.4 –3.9 months (MUAC defined). Isanaka et al. estimatedthe duration of severe acute malnutrition at 1.5 months(WHZ defined). In our study most of the incident casesof McM and moderate wasting resolved after 0–3 monthswhich suggests that the duration of episodes were more inaccordance with the study of Isanaka et al. with regards tomoderate malnutrition. The suggested duration of malnu-trition was thereby shorter than the duration found in anearlier study by Garrenne et al. [4]. The latter study esti-mated severe malnutrition (severe wasting) to last 7–8months on average. We did not have sufficient incidentcases in our study to estimate the duration of severe mal-nutrition with useful precision. Since caretakers were of-fered assistance this might have influenced the duration ofepisodes of malnutrition in our study.Our analysis was based on a large sample of pre-
school children, but a weakness is that many childrenwere lost due to emigration and during follow up. Thisweakness in particular constrained our examination ofthe duration of malnutrition for severe malnutrition. Inorder to understand how emigration and lost to followup might have influenced our findings we compared lastnutritional status of children who emigrated or were lostto follow up with children who also were surveyed inthe subsequent follow up round. This analysis yielded noevidence that emigration and lost to follow up influencedour findings. Data on incidence and course of malnutri-tion were obtained from two sequential follow up roundsand thereby dependent on two different measurements.The data on incidence and course of malnutrition werethereby susceptible to measurement errors. We are alsoaware that we might not have captured some of the
shorter episodes of malnutrition which occurred and wereresolved between visits.
ConclusionsOur data on age distribution of incidence of malnutri-tion underlines the importance of strengthening inter-ventions before children reaches the age of 2 years toward off malnutrition. Our findings, especially with regardto course of McM, marasmus and severely stunted chil-dren, emphasise the importance of early life intervention.There are few population-based studies that have ad-
dressed the occurrence dynamics of clinically and anthro-pometrically defined malnutrition. Our findings show theoccurrence dynamics of general malnutrition in a ruralAfrican area, demonstrating that patterns can differ ac-cording to nutritional assessment method. None of the as-sessment methods can be described as superior as theypartly measure different aspects of malnutrition. Our find-ings suggest the importance of applying a mix of clinicaland anthropometric methods for assessing malnutritioninstead of just one method. Functional validity of aspectsof characterization of individual nutritional status by sin-gle anthropometric scores or simple clinical classificationsremain issues for further investigation.
AbbreviationsHAZ: Length/height for age Z-score; McM: Moderate clinical malnutrition;NGO: Non-governmental organisation; WHZ: Weight for length/heightZ-score.
Competing interestsThe authors declare that they have no competing interests.
Authors’ contributionsHK, CS, MC, MMA, JVdB participated in the conception of the study. H.K.performed data analysis and wrote the paper. All authors participated in therevision of the paper. All authors read and approved the final manuscript.
AcknowledgementsThe Bwamanda study was supported by the Nutricia Research Foundation,The Hague, The Netherlands.
Accessibility of the Bwamanda datasetAs the principle investigator Jan Van den Broeck is the custodian of theBwamanda dataset. Jan Van den Broeck supervised our study and providedHallgeir Kismul as the first author access to the Bwamanda data. The datasetcan be made available by contacting Jan Van den Broeck; [email protected].
Author details1Centre for International Health, University of Bergen, 5020 Bergen, Norway.2Department of Paediatrics, University of KwaZulu-Natal, 4013 Congella,South Africa. 3School of Public Health, University of Kinshasa, Kinshasa 1,Democratic Republic of Congo.
Received: 30 September 2013 Accepted: 24 January 2014Published: 28 January 2014
References1. Lim SS: A comparative risk assessment of burden of disease and injury
attributable to 67 risk factors and risk factor clusters in 21 regions,1990–2010: a systematic analysis for the Global Burden of Disease Study2010. Lancet 2012, 380:2224–2260.
Kismul et al. BMC Pediatrics 2014, 14:22 Page 7 of 8http://www.biomedcentral.com/1471-2431/14/22

2. Briend A, Van den Broeck J, Fadnes LT: Target weight gain for moderatelywasted children during supplementation interventions–a population-based approach. Public Health Nutr 2011, 14:2117–2123.
3. Isanaka S, Grais RF, Briend A, Checchi F: Estimates of the duration ofuntreated acute malnutrition in children from Niger. Am J Epidemiol 2011,173:932–940.
4. Garenne M, Willie D, Maire B, Fontaine O, Eeckels R, Briend A, Van denBroeck J: Incidence and duration of severe wasting in two Africanpopulations. Public Health Nutr 2009, 12:1974–1982.
5. de Onis M: Measuring nutritional status in relation to mortality. Bull WorldHealth Organ 2000, 78:1271–1274.
6. Van den Broeck J, Eeckels R, Vuylsteke J: Influence of nutritional-status onchild-mortality in rural Zaire. Lancet 1993, 341:1491–1495.
7. Van den Broeck J, Meulemans W, Eeckels R: Nutritional assessment: theproblem of clinical-anthropometrical mismatch. Eur J Clin Nutr 1994,48:60–65.
8. World Health Organization: Child Growth Standards: Length/Height-for-Age,Weight-for-Age, Weight for- Length, Weight-for-Height and Body Mass Index-for- Age: Methods and Development. Geneva: WHO; 2006.
9. Mcgregor IA, Rahman AK, Thompson B, Billewic W, Thomson AM: Growthof young children in a Gambian village. Trans R Soc Trop Med Hyg 1968,62:341–352.
10. Rowland MG, Cole TJ, Whitehead RG: A quantitative study into the role ofinfection in determining nutritional status in Gambian village children.Br J Nutr 1977, 48:441–450.
11. Wright J, Vaze P, Russell G, Gundry SW, Ferro-Luzzi A, Mucavele P, Nyatsanza J:Seasonal aspects of weight-for-age in young children in Zimbabwe.Public Health Nutr 2001, 4:757–764.
12. Wamani H, Astrøm AN, Peterson S, Tumwine JK, Tylleskär T: Boys are morestunted than girls in Sub-Saharan Africa: a meta-analysis of 16demographic and health surveys. BMC Pediatr 2007, 7:17.
13. Garenne M: Sex differences in health indicators among children inAfrican DHS surveys. J Biosoc Sci 2003, 35:601–614.
14. Kikafunda JK, Walker AF, Collett D, Tumwine JK: Risk factors for earlychildhood malnutrition in Uganda. Pediatrics 1998, 102:E45.
15. de Onis M: Timing of growth faltering: a critical window for healthygrowth. Indian Pediatr 2011, 48:851–852.
16. Victora CG, de Onis M, Hallal PC, Blossner M, Shrimpton R: Worldwidetiming of growth faltering: revisiting implications for interventions.Pediatrics 2010, 125:e473–e480.
17. Mamidi RS, Shidhaye P, Radhakrishna KV, Babu JJ, Reddy PS: Pattern ofgrowth faltering and recovery in under-5 children in India using WHOgrowth standards - a study on first and third national family healthsurvey. Indian Pediatr 2011, 48:855–860.
doi:10.1186/1471-2431-14-22Cite this article as: Kismul et al.: Incidence and course of childmalnutrition according to clinical or anthropometrical assessment: alongitudinal study from rural DR Congo. BMC Pediatrics 2014 14:22.
Submit your next manuscript to BioMed Centraland take full advantage of:
• Convenient online submission
• Thorough peer review
• No space constraints or color figure charges
• Immediate publication on acceptance
• Inclusion in PubMed, CAS, Scopus and Google Scholar
• Research which is freely available for redistribution
Submit your manuscript at www.biomedcentral.com/submit
Kismul et al. BMC Pediatrics 2014, 14:22 Page 8 of 8http://www.biomedcentral.com/1471-2431/14/22

II

Submitted 22 November 2013Accepted 27 March 2014Published 15 April 2014
Corresponding authorHallgeir Kismul,[email protected]
Academic editorJara Perez-Jimenez
Additional Information andDeclarations can be found onpage 13
DOI 10.7717/peerj.350
Copyright2014 Kismul et al.
Distributed underCreative Commons CC-BY 3.0
OPEN ACCESS
Diet and kwashiorkor: a prospectivestudy from rural DR CongoHallgeir Kismul, Jan Van den Broeck and Torleif Markussen Lunde
Centre for International Health, University of Bergen, Norway
ABSTRACTThe etiology of kwashiorkor remains enigmatic and longitudinal studies examiningpotential causes of kwashiorkor are scarce. Using historical, longitudinal study datafrom the rural area of Bwamanda, Democratic Republic of Congo, we investigatedthe potential causal association between diet and the development of kwashiorkorin 5 657 preschool children followed 3-monthly during 15 months. We compareddietary risk factors for kwashiorkor with those of marasmus. Kwashiorkor was diag-nosed as pitting oedema of the ankles; marasmus as abnormal visibility of skeletalstructures and palpable wasting of the gluteus muscle. A 24-h recall was administered3-monthly to record the consumption of the 41 locally most frequent food items.We specified Hanley–Miettinen smooth-in-time risk models containing potentialcausal factors, including food items, special meals prepared for the child, breastfeed-ing, disease status, nutritional status, birth rank, age, season and number of meals.Bayesian Information Criteria identified the most plausible causal model of whysome children developed kwashiorkor. In a descriptive analysis of the diet at the lastdietary assessment prior to development of kwashiorkor, the diet of children whodeveloped kwashiorkor was characterized by low consumption of sweet potatoes,papaya and “other vegetables” [0.0% , 2.3% (95% CI [0.4, 12.1]) and 2.3% (95% CI[0.4, 12.1])] in comparison with children who did not develop kwashiorkor [6.8%(95% CI [6.4, 7.2]), 15.5% (95% CI [15, 16.1]) and 15.1% (95% CI [14.6, 15.7])]or children who developed marasmus [4.5% (95% CI [2.6, 7.5]) 11.8% (95% CI[8.5, 16.0]) and 17.6% (95% CI [13.7, 22.5])]. Sweet potatoes and papayas have highβ-carotene content and so may some of “the other vegetables”. We found that a riskmodel containing an age function, length/height-for age Z-score, consumption ofsweet potatoes, papaya or other vegetables, duration of this consumption and itsinteraction term, was the most plausible model. Among children aged 10–42 months,the risk of developing kwashiorkor increased with longer non-consumption of thesefoods. The analysis was repeated with only children who developed marasmus as thereference series, yielding similar results. Our study supports that β-carotene may playan important role in the protection against kwashiorkor development.
Subjects Epidemiology, Global Health, NutritionKeywords Malnutrition, Kwashiorkor, Marasmus, Food items, β-carotene, Papaya, Sweet potato,Wild vegetables, DR Congo
How to cite this article Kismul et al. (2014), Diet and kwashiorkor: a prospective study from rural DR Congo. PeerJ 2:e350;DOI 10.7717/peerj.350
INTRODUCTIONMalnutrition contributes significantly to the high under-five year mortality in the world
and as an underlying factor it has been estimated that it contributes to over one third of all
child deaths (Lim, 2012). Mortality is very high among children with marasmus, and even
higher among those with kwashiorkor (Briend, Wojtyniak & Rowland, 1987; Prudhon et
al., 1997). Kwashiorkor and marasmus are characterised by different metabolic response to
severe undernutrition (Badaloo et al., 2006; Jahoor et al., 2008).
Kwashiorkor has been linked to diet since its first description. Williams (1935), who
introduced the name kwashiorkor, suggested protein undernutrition as the etiology
of kwashiorkor. The association of kwashiorkor with low protein intake has later been
questioned. So far no research has demonstrated that children with kwashiorkor consume
less protein than children with marasmus. Golden & Ramdath (1987) proposed excess
free radicals as the explanation of clinical findings in kwashiorkor. Relations between
antioxidant depletion and the occurrence of kwashiorkor have been investigated, but the
role of oxidative stress as primary cause of kwashiorkor is still debated (Ciliberto et al.,
2005; Lenhartz et al., 1998; Manary, Leeuwenburgh & Heinecke, 2000). We would like to
remark that there are difficulties with the oxidative hypothesis. As an example oxidative
stress is present in HIV but studies have found oedematous malnutrition to occur in a
minority among HIV seropositive patients who are severely malnourished (Asafo-Agyei,
Antwi & Nguah, 2013).
To our knowledge there are only two observational longitudinal studies that have
examined the relations between diet diversity and kwashiorkor. Investigating protein-
calorie malnutrition, a study following Indian children from birth to 3 years examined
differences in diet between children developing kwashiorkor and children developing
marasmus (Gopalan, 1992). A more recent study examined dietary factors determining
kwashiorkor by assessing diet of one to three years old Malawian children (Lin et al.,
2007). The former study did not find significant differences in diet between children who
developed kwashiorkor and those who developed marasmus, while the latter did not find
differences between those who developed kwashiorkor and those who did not (Gopalan,
1992; Lin et al., 2007).
The overall aim of our study is to investigate, in a large longitudinal population-based
study, the possible association between diet and the development of kwashiorkor. We also
wanted to compare the causal influence of dietary risk factors for kwashiorkor with those
of marasmus. We performed this analysis by applying the causal investigation method
proposed by Miettinen and the statistical approach by Hanley and Miettinen, using a
random sample of person moments from the entire dynamic population as the reference
series (Hanley & Miettinen, 2009; Miettinen, 2010).
METHODThe Bwamanda studyWe did a secondary analysis of the historical data from the Bwamanda study, conducted
from 1989 to 1991 in a rural area of the northwest part of the Democratic Republic
Kismul et al. (2014), PeerJ, DOI 10.7717/peerj.350 2/16

of Congo, (DRC), located at 19.2 degrees east and 3.2 degrees north. The people of
Bwamanda are, up till today, predominantly subsistence farmers and the basic diet consists
of mainly of maize, cassava supplemented with fish, vegetables and fruits. Health care in
the area is provided by a central hospital and 10 minor health centres with a few of these
providing some limited nutritional rehabilitation services. With virtually unchanged living
conditions in the study area, the secondary analysis was viewed to be contemporary and
relevant.
Study designThe Bwamanda study was a dynamic population study with follow-up including
thrice-monthly survey rounds, making up 15 months of follow-up and 6 contacts. At
the first round 4 235 preschool children were enrolled and at the last round a total of
5 657 were enrolled. A full description of the study population can be found in Van den
Broeck, Eeckels & Vuylsteke (1993). Trained interviewers conducted interviews according
to an interviewer’s manual. They determined the children’s age on the basis of birth date
noted on children’s road to health chart or on parents’ identity paper or on the basis of an
interview using a local events calendar.
Children were examined for kwashiorkor by using the presence of pitting oedema of the
feet or ankles as a criterion. All children were examined for marasmus through inspection
of abnormal visibility of skeletal structures and by absence or near-absence of palpable
gluteus muscle. A locally constructed measuring board was used for measuring the length
of children below 24 months, while a microtoise was used for measuring children older
than 24 months. In both cases length was measured to the nearest 0.1 cm. A spring scale
(CMS weighting equipment) was used to weigh the children to the nearest 100 g. We
applied the WHO Child Growth Standard for anthropometric scoring (World Health
Organization, 2006). Z-scores were calculated for weight for length/height (WHZ) and for
length/height for age (HAZ).
At each contact interviewers undertook face-to-face interviews with the most proximal
caregiver of the child, usually the biological mother. The questionnaire included a single
non-quantitative 24-h recall with the 41 locally most consumed food items listed and
interviewees providing “yes or no” answers to the questions if children had consumed the
listed food items during the previous day. The food items had been identified through
a pilot study. The interviewees were also asked about number of meals prepared for the
families, special meals prepared for the child and breastfeeding.
Statistical methodIn an initial descriptive analysis, we tabulated the percentage (95% confidence interval) of
individuals eating the different items, grouped by those who developed kwashiorkor, those
who did not and those who developed marasmus. We used a two-sample test for equality of
proportions to test if the fractions were different.
Here, we were interested in estimation of risks of developing kwashiorkor specific to
age, diet, frequency of food consumption, and infectious diseases. We were also interested
in the duration of a particular diet; did a child eat a food item at each visit occurring
Kismul et al. (2014), PeerJ, DOI 10.7717/peerj.350 3/16
every three months over the last 15 months, or only at, for example, one of the interview
rounds prior to developing kwashiorkor. Smooth-in-time hazard functions as proposed by
Hanley and Miettinen allow this type of analysis (Hanley & Miettinen, 2009). We specified
Hanley–Miettinen smooth-in-time risk models containing all potential causal factors,
including food items, special meals prepared for the child, breastfeeding, disease status,
nutritional status, birth rank, age, season and number of meals. To select a representative
sample from the study population we used the method proposed by Miettinen, and used
the whole study population as reference series (Miettinen, 2010). In the analysis we include
all new cases of kwashiorkor, but use a representative sample of the non-cases. With a
relatively small number of cases, there is little to be gained by letting the number of
non-cases become arbitrarily large, having in mind the computational cost of running
the model. Results are reported as log-odds ratios (LOR) and risk reductions. In line with
this method we took the dataset to consist of 35 person moments (c) where kwashiorkor
was observed as the case series, and a representative sample (b) of the infinite number of
person moments that constitute the 46 397 person-months in the study base. We use a
(b)/(c)-ratio of 150 assuring variances and covariance have minimal errors (less than 1
percentage) compared to using the entire series.
Age function and age as a risk factorGiven that risk is not changing linearly with age, as seen in Fig. 1, we developed an
age variable that accounted for nonlinear change in risk. Such transformations are
required when risk does not change linearly with age. Accordingly age was included as
an independent variable in the model. Based on visual inspection of how kwashiorkor was
distributed according to age, a transformation of the age variable was done:
f (age) = a exp(−b Age) ∗ exp(−a exp(−b Age)). (1)
To find the parameters a and b, we optimized Eq. (2) with binomial errors using logistic
regression.
y = a + b ∗ f (age). (2)
The AIC (Akaike Information criteria Information criteria) was used to compare models.
To find the parameters which minimized AIC we used an algorithm combining the golden
section search and successive parabolic interpolation, an efficient and automated method
to find the best model. Here we used the optimize function in R to find the parameters
which minimized AIC, resulting in a = 11.55, and b = 0.90 (Brent, 1973).
Other risk factorsThe risk factors associated with kwashiorkor were defined in two steps; first we specified
a log-linear hazard model with binomial errors where the independent variables were all
food types, presence or absence of diarrhoea, and stunting and wasting at last visit. We
defined time as the natural logarithm of number of months a person had, or had not,
consumed a specific food item. We assumed that the food items reported at a given point in
Kismul et al. (2014), PeerJ, DOI 10.7717/peerj.350 4/16
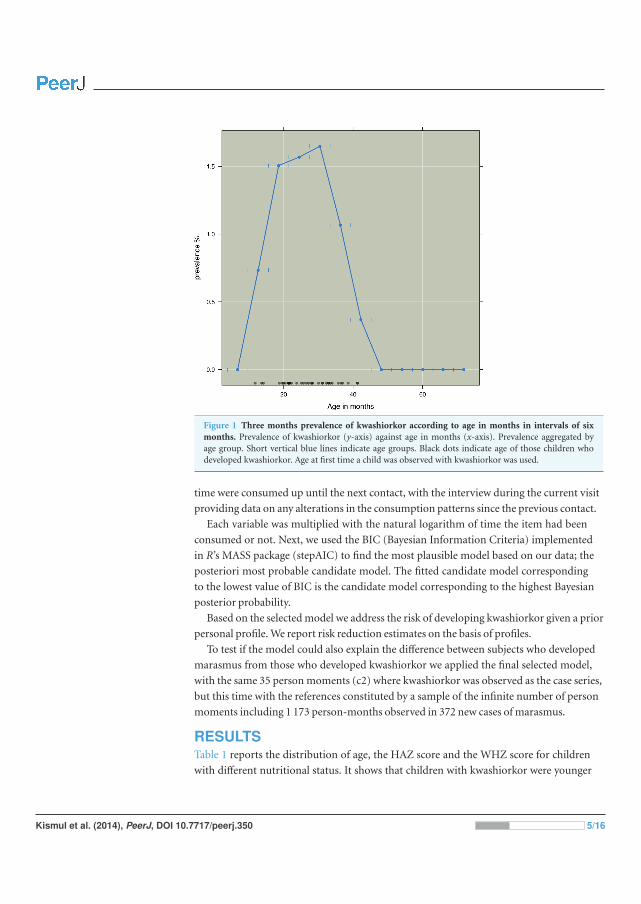
Figure 1 Three months prevalence of kwashiorkor according to age in months in intervals of sixmonths. Prevalence of kwashiorkor (y-axis) against age in months (x-axis). Prevalence aggregated byage group. Short vertical blue lines indicate age groups. Black dots indicate age of those children whodeveloped kwashiorkor. Age at first time a child was observed with kwashiorkor was used.
time were consumed up until the next contact, with the interview during the current visit
providing data on any alterations in the consumption patterns since the previous contact.
Each variable was multiplied with the natural logarithm of time the item had been
consumed or not. Next, we used the BIC (Bayesian Information Criteria) implemented
in R’s MASS package (stepAIC) to find the most plausible model based on our data; the
posteriori most probable candidate model. The fitted candidate model corresponding
to the lowest value of BIC is the candidate model corresponding to the highest Bayesian
posterior probability.
Based on the selected model we address the risk of developing kwashiorkor given a prior
personal profile. We report risk reduction estimates on the basis of profiles.
To test if the model could also explain the difference between subjects who developed
marasmus from those who developed kwashiorkor we applied the final selected model,
with the same 35 person moments (c2) where kwashiorkor was observed as the case series,
but this time with the references constituted by a sample of the infinite number of person
moments including 1 173 person-months observed in 372 new cases of marasmus.
RESULTSTable 1 reports the distribution of age, the HAZ score and the WHZ score for children
with different nutritional status. It shows that children with kwashiorkor were younger
Kismul et al. (2014), PeerJ, DOI 10.7717/peerj.350 5/16
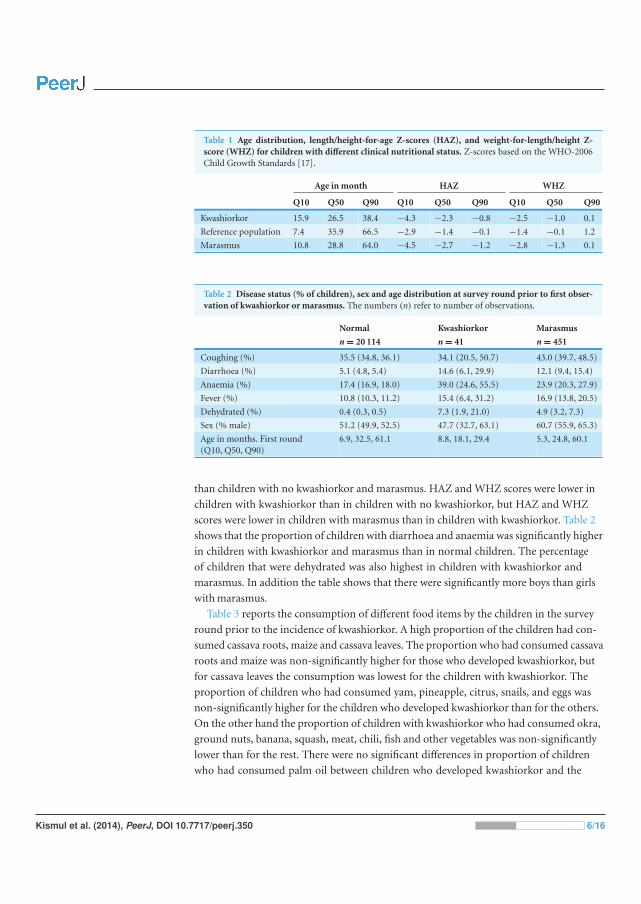
Table 1 Age distribution, length/height-for-age Z-scores (HAZ), and weight-for-length/height Z-score (WHZ) for children with different clinical nutritional status. Z-scores based on the WHO-2006Child Growth Standards [17].
Age in month HAZ WHZ
Q10 Q50 Q90 Q10 Q50 Q90 Q10 Q50 Q90
Kwashiorkor 15.9 26.5 38.4 −4.3 −2.3 −0.8 −2.5 −1.0 0.1
Reference population 7.4 35.9 66.5 −2.9 −1.4 −0.1 −1.4 −0.1 1.2
Marasmus 10.8 28.8 64.0 −4.5 −2.7 −1.2 −2.8 −1.3 0.1
Table 2 Disease status (% of children), sex and age distribution at survey round prior to first obser-vation of kwashiorkor or marasmus. The numbers (n) refer to number of observations.
Normal Kwashiorkor Marasmus
n = 20 114 n = 41 n = 451
Coughing (%) 35.5 (34.8, 36.1) 34.1 (20.5, 50.7) 43.0 (39.7, 48.5)
Diarrhoea (%) 5.1 (4.8, 5.4) 14.6 (6.1, 29.9) 12.1 (9.4, 15.4)
Anaemia (%) 17.4 (16.9, 18.0) 39.0 (24.6, 55.5) 23.9 (20.3, 27.9)
Fever (%) 10.8 (10.3, 11.2) 15.4 (6.4, 31.2) 16.9 (13.8, 20.5)
Dehydrated (%) 0.4 (0.3, 0.5) 7.3 (1.9, 21.0) 4.9 (3.2, 7.3)
Sex (% male) 51.2 (49.9, 52.5) 47.7 (32.7, 63.1) 60.7 (55.9, 65.3)
Age in months. First round(Q10, Q50, Q90)
6.9, 32.5, 61.1 8.8, 18.1, 29.4 5.3, 24.8, 60.1
than children with no kwashiorkor and marasmus. HAZ and WHZ scores were lower in
children with kwashiorkor than in children with no kwashiorkor, but HAZ and WHZ
scores were lower in children with marasmus than in children with kwashiorkor. Table 2
shows that the proportion of children with diarrhoea and anaemia was significantly higher
in children with kwashiorkor and marasmus than in normal children. The percentage
of children that were dehydrated was also highest in children with kwashiorkor and
marasmus. In addition the table shows that there were significantly more boys than girls
with marasmus.
Table 3 reports the consumption of different food items by the children in the survey
round prior to the incidence of kwashiorkor. A high proportion of the children had con-
sumed cassava roots, maize and cassava leaves. The proportion who had consumed cassava
roots and maize was non-significantly higher for those who developed kwashiorkor, but
for cassava leaves the consumption was lowest for the children with kwashiorkor. The
proportion of children who had consumed yam, pineapple, citrus, snails, and eggs was
non-significantly higher for the children who developed kwashiorkor than for the others.
On the other hand the proportion of children with kwashiorkor who had consumed okra,
ground nuts, banana, squash, meat, chili, fish and other vegetables was non-significantly
lower than for the rest. There were no significant differences in proportion of children
who had consumed palm oil between children who developed kwashiorkor and the
Kismul et al. (2014), PeerJ, DOI 10.7717/peerj.350 6/16
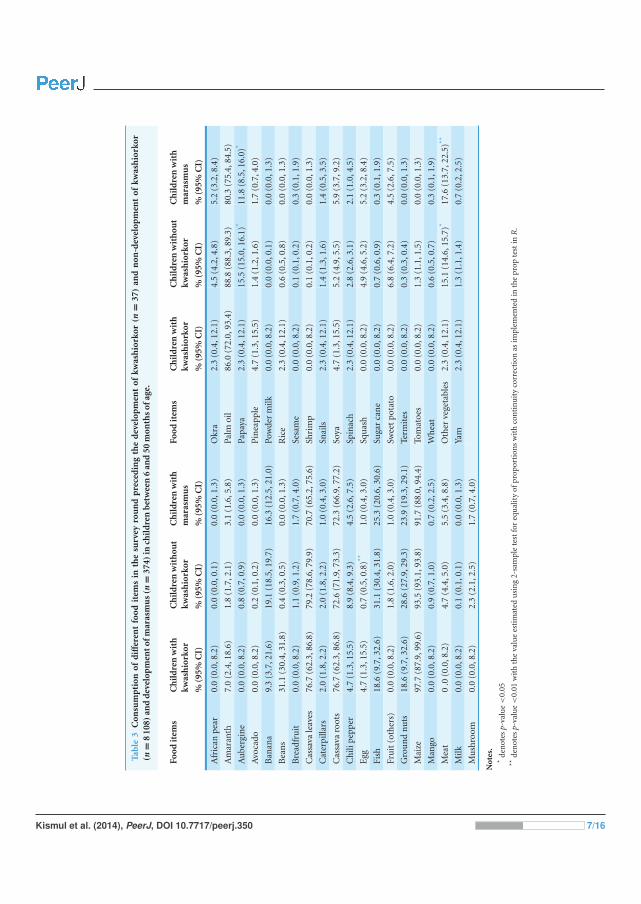
Tabl
e3
Con
sum
pti
onof
diff
eren
tfo
odit
ems
inth
esu
rvey
rou
nd
pre
ced
ing
the
dev
elop
men
tof
kwas
hio
rkor
(n=
37)
and
non
-dev
elop
men
tof
kwas
hio
rkor
(n=
810
8)an
dd
evel
opm
ento
fmar
asm
us(n
=37
4)in
chil
dre
nb
etw
een
6an
d50
mon
ths
ofag
e.
Food
item
sC
hil
dre
nw
ith
kwas
hio
rkor
Ch
ild
ren
wit
hou
tkw
ash
iork
orC
hil
dre
nw
ith
mar
asm
us
Food
item
sC
hil
dre
nw
ith
kwas
hio
rkor
Ch
ild
ren
wit
hou
tkw
ash
iork
orC
hil
dre
nw
ith
mar
asm
us
%(9
5%C
I)%
(95%
CI)
%(9
5%C
I)%
(95%
CI)
%(9
5%C
I)%
(95%
CI)
Afr
ican
pear
0.0
(0.0
,8.2
)0.
0(0
.0,0
.1)
0.0
(0.0
,1.3
)O
kra
2.3
(0.4
,12.
1)4.
5(4
.2,4
.8)
5.2
(3.2
,8.4
)
Am
aran
th7.
0(2
.4,1
8.6)
1.8
(1.7
,2.1
)3.
1(1
.6,5
.8)
Palm
oil
86.0
(72.
0,93
.4)
88.8
(88.
3,89
.3)
80.3
(75.
4,84
.5)
Au
berg
ine
0.0
(0.0
,8.2
)0.
8(0
.7,0
.9)
0.0
(0.0
,1.3
)Pa
paya
2.3
(0.4
,12.
1)15
.5(1
5.0,
16.1
)*11
.8(8
.5,1
6.0)
*
Avo
cado
0.0
(0.0
,8.2
)0.
2(0
.1,0
.2)
0.0
(0.0
,1.3
)P
inea
pple
4.7
(1.3
,15.
5)1.
4(1
.2,1
.6)
1.7
(0.7
,4.0
)
Ban
ana
9.3
(3.7
,21.
6)19
.1(1
8.5,
19.7
)16
.3(1
2.5,
21.0
)Po
wde
rm
ilk0.
0(0
.0,8
.2)
0.0
(0.0
,0.1
)0.
0(0
.0,1
.3)
Bea
ns
31.1
(30.
4,31
.8)
0.4
(0.3
,0.5
)0.
0(0
.0,1
.3)
Ric
e2.
3(0
.4,1
2.1)
0.6
(0.5
,0.8
)0.
0(0
.0,1
.3)
Bre
adfr
uit
0.0
(0.0
,8.2
)1.
1(0
.9,1
.2)
1.7
(0.7
,4.0
)Se
sam
e0.
0(0
.0,8
.2)
0.1
(0.1
,0.2
)0.
3(0
.1,1
.9)
Cas
sava
leav
es76
.7(6
2.3,
86.8
)79
.2(7
8.6,
79.9
)70
.7(6
5.2,
75.6
)Sh
rim
p0.
0(0
.0,8
.2)
0.1
(0.1
,0.2
)0.
0(0
.0,1
.3)
Cat
erpi
llars
2.0
(1.8
,2.2
)2.
0(1
.8,2
.2)
1.0
(0.4
,3.0
)Sn
ails
2.3
(0.4
,12.
1)1.
4(1
.3,1
.6)
1.4
(0.5
,3.5
)
Cas
sava
root
s76
.7(6
2.3,
86.8
)72
.6(7
1.9,
73.3
)72
.3(6
6.9,
77.2
)So
ya4.
7(1
.3,1
5.5)
5.2
(4.9
,5.5
)5.
9(3
.7,9
.2)
Ch
ilipe
pper
4.7
(1.3
,15.
5)8.
9(8
.4,9
.3)
4.5
(2.6
,7.5
)Sp
inac
h2.
3(0
.4,1
2.1)
2.8
(2.6
,3.1
)2.
1(1
.0,4
.5)
Egg
4.7
(1.3
,15.
5)0.
7(0
.5,0
.8)**
1.0
(0.4
,3.0
)Sq
uas
h0.
0(0
.0,8
.2)
4.9
(4.6
,5.2
)5.
2(3
.2,8
.4)
Fish
18.6
(9.7
,32.
6)31
.1(3
0.4,
31.8
)25
.3(2
0.6,
30.6
)Su
gar
can
e0.
0(0
.0,8
.2)
0.7
(0.6
,0.9
)0.
3(0
.1,1
.9)
Fru
it(o
ther
s)0.
0(0
.0,8
.2)
1.8
(1.6
,2.0
)1.
0(0
.4,3
.0)
Swee
tpo
tato
0.0
(0.0
,8.2
)6.
8(6
.4,7
.2)
4.5
(2.6
,7.5
)
Gro
un
dn
uts
18.6
(9.7
,32.
6)28
.6(2
7.9,
29.3
)23
.9(1
9.3,
29.1
)Te
rmit
es0.
0(0
.0,8
.2)
0.3
(0.3
,0.4
)0.
0(0
.0,1
.3)
Mai
ze97
.7(8
7.9,
99.6
)93
.5(9
3.1,
93.8
)91
.7(8
8.0,
94.4
)To
mat
oes
0.0
(0.0
,8.2
)1.
3(1
.1,1
.5)
0.0
(0.0
,1.3
)
Man
go0.
0(0
.0,8
.2)
0.9
(0.7
,1.0
)0.
7(0
.2,2
.5)
Wh
eat
0.0
(0.0
,8.2
)0.
6(0
.5,0
.7)
0.3
(0.1
,1.9
)
Mea
t0
.0(0
.0,8
.2)
4.7
(4.4
,5.0
)5.
5(3
.4,8
.8)
Oth
erve
geta
bles
2.3
(0.4
,12.
1)15
.1(1
4.6,
15.7
)*17
.6(1
3.7,
22.5
)**
Milk
0.0
(0.0
,8.2
)0.
1(0
.1,0
.1)
0.0
(0.0
,1.3
)Ya
m2.
3(0
.4,1
2.1)
1.3
(1.1
,1.4
)0.
7(0
.2,2
.5)
Mu
shro
om0.
0(0
.0,8
.2)
2.3
(2.1
,2.5
)1.
7(0
.7,4
.0)
Not
es.
*de
not
esp-
valu
e<
0.05
**de
not
esp-
valu
e<
0.01
wit
hth
eva
lue
esti
mat
edu
sin
g2-
sam
ple
test
for
equ
alit
yof
prop
orti
ons
wit
hco
nti
nu
ity
corr
ecti
onas
impl
emen
ted
inth
epr
opte
stin
R.
Kismul et al. (2014), PeerJ, DOI 10.7717/peerj.350 7/16
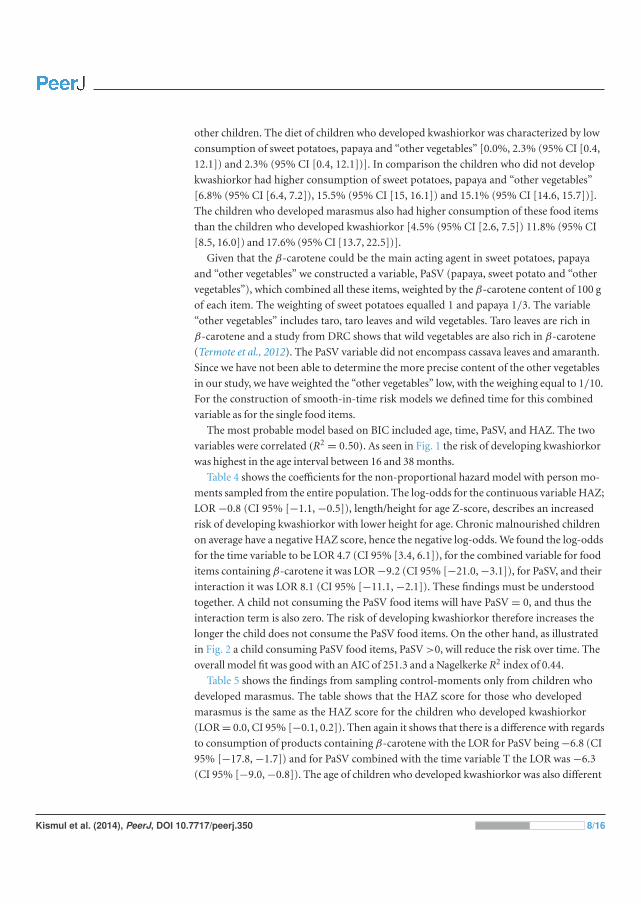
other children. The diet of children who developed kwashiorkor was characterized by low
consumption of sweet potatoes, papaya and “other vegetables” [0.0%, 2.3% (95% CI [0.4,
12.1]) and 2.3% (95% CI [0.4, 12.1])]. In comparison the children who did not develop
kwashiorkor had higher consumption of sweet potatoes, papaya and “other vegetables”
[6.8% (95% CI [6.4, 7.2]), 15.5% (95% CI [15, 16.1]) and 15.1% (95% CI [14.6, 15.7])].
The children who developed marasmus also had higher consumption of these food items
than the children who developed kwashiorkor [4.5% (95% CI [2.6, 7.5]) 11.8% (95% CI
[8.5, 16.0]) and 17.6% (95% CI [13.7, 22.5])].
Given that the β-carotene could be the main acting agent in sweet potatoes, papaya
and “other vegetables” we constructed a variable, PaSV (papaya, sweet potato and “other
vegetables”), which combined all these items, weighted by the β-carotene content of 100 g
of each item. The weighting of sweet potatoes equalled 1 and papaya 1/3. The variable
“other vegetables” includes taro, taro leaves and wild vegetables. Taro leaves are rich in
β-carotene and a study from DRC shows that wild vegetables are also rich in β-carotene
(Termote et al., 2012). The PaSV variable did not encompass cassava leaves and amaranth.
Since we have not been able to determine the more precise content of the other vegetables
in our study, we have weighted the “other vegetables” low, with the weighing equal to 1/10.
For the construction of smooth-in-time risk models we defined time for this combined
variable as for the single food items.
The most probable model based on BIC included age, time, PaSV, and HAZ. The two
variables were correlated (R2 = 0.50). As seen in Fig. 1 the risk of developing kwashiorkor
was highest in the age interval between 16 and 38 months.
Table 4 shows the coefficients for the non-proportional hazard model with person mo-
ments sampled from the entire population. The log-odds for the continuous variable HAZ;
LOR −0.8 (CI 95% [−1.1, −0.5]), length/height for age Z-score, describes an increased
risk of developing kwashiorkor with lower height for age. Chronic malnourished children
on average have a negative HAZ score, hence the negative log-odds. We found the log-odds
for the time variable to be LOR 4.7 (CI 95% [3.4, 6.1]), for the combined variable for food
items containing β-carotene it was LOR −9.2 (CI 95% [−21.0, −3.1]), for PaSV, and their
interaction it was LOR 8.1 (CI 95% [−11.1, −2.1]). These findings must be understood
together. A child not consuming the PaSV food items will have PaSV = 0, and thus the
interaction term is also zero. The risk of developing kwashiorkor therefore increases the
longer the child does not consume the PaSV food items. On the other hand, as illustrated
in Fig. 2 a child consuming PaSV food items, PaSV >0, will reduce the risk over time. The
overall model fit was good with an AIC of 251.3 and a Nagelkerke R2 index of 0.44.
Table 5 shows the findings from sampling control-moments only from children who
developed marasmus. The table shows that the HAZ score for those who developed
marasmus is the same as the HAZ score for the children who developed kwashiorkor
(LOR = 0.0, CI 95% [−0.1, 0.2]). Then again it shows that there is a difference with regards
to consumption of products containing β-carotene with the LOR for PaSV being −6.8 (CI
95% [−17.8, −1.7]) and for PaSV combined with the time variable T the LOR was −6.3
(CI 95% [−9.0, −0.8]). The age of children who developed kwashiorkor was also different
Kismul et al. (2014), PeerJ, DOI 10.7717/peerj.350 8/16
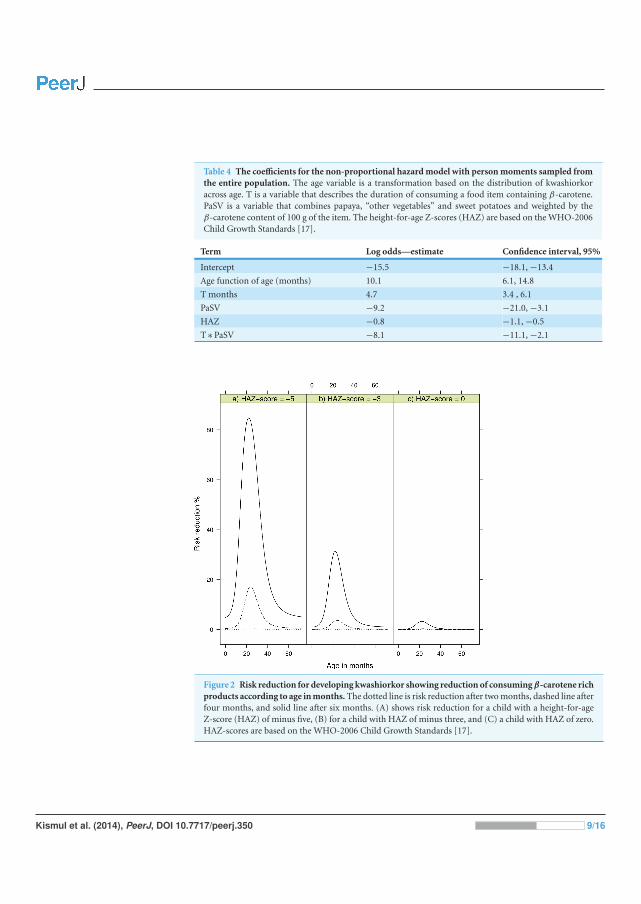
Table 4 The coefficients for the non-proportional hazard model with person moments sampled fromthe entire population. The age variable is a transformation based on the distribution of kwashiorkoracross age. T is a variable that describes the duration of consuming a food item containing β-carotene.PaSV is a variable that combines papaya, “other vegetables” and sweet potatoes and weighted by theβ-carotene content of 100 g of the item. The height-for-age Z-scores (HAZ) are based on the WHO-2006Child Growth Standards [17].
Term Log odds—estimate Confidence interval, 95%
Intercept −15.5 −18.1, −13.4
Age function of age (months) 10.1 6.1, 14.8
T months 4.7 3.4 , 6.1
PaSV −9.2 −21.0, −3.1
HAZ −0.8 −1.1, −0.5
T ∗ PaSV −8.1 −11.1, −2.1
Figure 2 Risk reduction for developing kwashiorkor showing reduction of consuming β-carotene richproducts according to age in months. The dotted line is risk reduction after two months, dashed line afterfour months, and solid line after six months. (A) shows risk reduction for a child with a height-for-ageZ-score (HAZ) of minus five, (B) for a child with HAZ of minus three, and (C) a child with HAZ of zero.HAZ-scores are based on the WHO-2006 Child Growth Standards [17].
Kismul et al. (2014), PeerJ, DOI 10.7717/peerj.350 9/16

Table 5 The coefficients for the non-proportional hazard model with reference person momentsdrawn from people developing marasmus. The age variable is based on the distribution of kwashiorkoracross age. T is a variable that describes the duration of consuming a food item containing β-carotene.PaSV is a variable that includes papaya, “other vegetables” and sweet potatoes weighted by the β-carotenecontent of 100 g of the item. Height-for-age Z-scores (HAZ) are based on the WHO-2006 Child GrowthStandards [17].
Term Log odds—estimate Confidence interval, 95%
Intercept −9.7 −12.1, −7.7
Age function of age (months) 7.9 4.3, 12.1
T months 4.2 3.2, 5.4
PaSV −6.8 −17.8, −1.7
HAZ 0.0 −0.3, 0.2
T ∗ PaSV −6.3 −9.0, −0.8
from children who developed marasmus with LOR being 7.9 (CI 95% [4.3, 12.1]). The age
of children with marasmus was distributed within the age of 11–64 months, while the age
of children with kwashiorkor mainly fell between 16 and 38 months, reaching a top around
26 months.
Ethical approval for the Bwamanda study was granted by the University of Leuven’s
Tropical Childcare Health Working Group. Community consent was obtained verbally
from community leaders, whereas individual verbal consent was obtained from children’s
caretakers.
DISCUSSIONOur study shows that the children who developed kwashiorkor were mainly stunted
children aged 16–38 months. Their diet was characterized by a low or no consumption
of sweet potatoes, papaya and “other vegetables”. The children who developed marasmus
resembled the children who developed kwashiorkor by being stunted. However, the
consumption of papaya, sweet potatoes and “other vegetables” were lower among children
with kwashiorkor than among marasmic children. Sweet potatoes, papaya and “other
vegetables” are characterised by their high β-carotene content. We found that the risk of
developing kwashiorkor increased the longer the child did not consume these food items.
We emphasize the importance of β-carotene because it is a substance with significant
antioxidant activities. Also, sweet potatoes, papaya and what we have termed “other
vegetables” contain several other carotenoids that have antioxidant activities. As a result
the various carotenoids, the mixture of carotenoids or carotenoids in association with
other antioxidants in these food items can have played important roles in the protective
pathway in kwashiorkor.
Children who developed kwashiorkor also consumed palm oil, with the oil being rich
in β-carotene. In Bwamanda palm oil is extracted locally and mostly stored in bottles,
often being exposed to strong sunlight. Palm oil is used for preparing cassava leaves stew.
The oil is mixed with cassava leaves and boiled in a pot for an hour. Studies show that
carotenoids are vulnerable to degradation. It is especially their unsaturated structures
Kismul et al. (2014), PeerJ, DOI 10.7717/peerj.350 10/16

that make them sensitive to heat, oxygen and light (Leskova et al., 2006). A study from
Nigeria on heating of palm oil demonstrated that the amount of β-carotene declined with
temperature increase and that the destruction of β-carotene was greater when the oil was
heated continuously for 30 min at any given temperature (Mudambi & Rajagopa, 2006).
Another study on heating red palm oil showed that all trans-β-carotene were almost lost
after 20 min (Fillion & Henry, 1998). Thus given that local practices expose palm oil to
sunlight and long duration cooking it is unlikely that palm oil consumption would have
compensated for the lack of provitamin A in the local diet. However we would like to
mention that intervention studies with red palm oil have found improved vitamin A status
(Bhaskaram et al., 2003).
Besides our study there are only two other observational longitudinal studies we know
of that examine the relationship between diet and the development of kwashiorkor: the
Gopalan (1992) study of Indian children up to 10 years and Lin et al. (2007) study on
Malawian children. While our study analyses diet with reference to a variety of food items,
Gopalan’s study concentrated on differences in terms of protein-calorie consumption.
Gopalan did not find evidence that there were any differences in the protein calorie intake
between cases of marasmus and kwashiorkor. The study conducted by Lin et al. (2007)
actually found that the daily intake of vitamin A equivalents was low among children who
developed kwashiorkor, but not significantly lower than in the control group. The diets
of the study population in these studies were monotonous and therefore to some extent
resembled the diet in Bwamanda. The diet of Indian children was based on rice and millet,
while the diet of the Malawian children was corn-based supplemented by small fish. The
diet in Bwamanda consisted to a large extent of maize, cassava roots and cassava leaves.
Golden & Ramdath (1987) suggested that kwashiorkor results from oxidative stress
and a general deficiency in protective mechanism that could reduce the oxidative damage
with most of the protective pathways necessitating micronutrients. Before target specific
antibodies have been produced, immune cells generate and release reactive oxygen species
(Strobel, Tinz & Biesalski, 2007). These oxidative bursts have been shown to be important
in the early phase of for example malaria infections. Oxidative burst can lead to haemolysis
and cellular dysfunction (Isaksson et al., 2013). Since carotenoids can act as important
antioxidants our findings support theories that relate kwashiorkor to oxidative stress and
the importance of micronutrients in the protective pathways (Sergio, 1999; Strobel, Tinz &
Biesalski, 2007).
A case-control study examined the antioxidant hypotheses by comparing the diet in
siblings of children presenting with marasmus and children with kwashiorkor (Sullivan
et al., 2006). It concluded that siblings of children with kwashiorkor consumed egg and
tomatoes less frequently than children with marasmus did. We note that the differences in
consumption between the two were minor.
Studies have questioned the hypothesis that antioxidant depletion causes kwashiorkor.
In a controlled trial from Malawi, Ciliberto et al. (2005) assessed the efficiency of
antioxidant supplementation in preventing kwashiorkor in children aged 1–4 years. The
intervention arm received antioxidant powder containing riboflavin, vitamin E, selenium
Kismul et al. (2014), PeerJ, DOI 10.7717/peerj.350 11/16

and N-acetylcysteine, while the control arm received a placebo of an identical looking
powder. According to Ciliberto et al. (2005) the study showed that the supplementation of
antioxidant powder did not prevent children from developing kwashiorkor. We noted that
the study did not include supplementation of provitamin A and therefore does not address
the efficiency of provitamin A in preventing kwashiorkor. The study did not provide
baseline data about study participants’ diet. The study design does not, therefore, allow
for examining how dietary variables might have influenced the treatment with antioxidant
powder and the influence of such variables on the development of kwashiorkor.
As far as we know the Bwamanda study is, excepting Gopalan (1992) and Lin et al.
(2007), the only observational longitudinal study that describes the diet of children
who develop kwashiorkor and marasmus. The results from our study support the
hypothesis that kwashiorkor is caused by oxidative stress, supporting the role that food
containing carotenoids plays in the protective pathway. In Bwamanda the dietary sources
of preformed vitamin A are limited and pro-vitamin A carotenoid constitutes a major
source of vitamin A. The pro-vitamin A carotenoids including β-carotene, can through
cleavage be converted into retinaldehyde (a form of vitamin A). Studies have shown
that the bioavailability of provitamin A carotenoids is less than of preformed vitamin A
(de Pee et al., 1995; de Pee et al., 1998). Our study proposes that the consumption of fruits
plays a role in reducing the risk of developing kwashiorkor. In comparison with green leafy
vegetables and carrots, fruits are also more effective in improving vitamin A status among
children (de Pee et al., 1998).
Studies have shown that there is a relationship between diet and infection during
the development of kwashiorkor and that recurrent infections contributes to hypo-
albuminaemia and the development of oedema (Frood, 1971; Whitehead, 1977). We also
know that vitamin A modulates many types of specific and non-specific immune system
and those vitamin deficiencies have a negative impact on different types of immunity
functions (Stephensen, 2001; Villamor & Fawzi, 2005). In this manner provitamin A can
play a role in reducing the severity of a number of types of infections and we speculate that
provitamin A played a role in reducing the risk of developing oedema among chronically
malnourished children in Bwamanda.
The strength of our study is that in a large population-based study we have managed to
examine the dietary diversity over a long period of children who developed kwashiorkor
and marasmus. The study design has also some disadvantages. Given that information on
diet was based on 24 h recall we were not able to determine food consumed in between
the follow up period. Furthermore, we have limited information on the quantity of food
consumed and we are therefore not in a position to determine the amount of pro-vitamin
vitamin A consumed by the children. In our analysis we assumed that the food items
reported at a given point in time were consumed up to the next survey round. Given that
food consumption is characterised by individual variances this assumption represents
a weakness. We also realise that our findings require confirmation, preferably in a large
randomised trial that examines the development of kwashiorkor in a trial of carotenoids
supplementation.
Kismul et al. (2014), PeerJ, DOI 10.7717/peerj.350 12/16
In conclusion, this is the first observational longitudinal study that demonstrates
a relationship between diet diversity and the development of kwashiorkor. We have
suggested that the consumption of a diet that includes food items containing carotenoids
reduces the risk in children aged 10–71 months of developing kwashiorkor. Our findings
should be considered as a support to ongoing efforts that aim at promoting a diverse
agricultural and horticulture production and in this manner stimulate consumption of a
more varied diet. In rural communities where there is a shortage of vitamin A rich food it
is in particular important to promote increased production of vegetables and fruits rich in
carotenoids including sweet potatoes and papaya.
ACKNOWLEDGEMENTSWe would like to thank Roger Eeckels who participated in the initiation and conducting of
the Bwamanda study.
ADDITIONAL INFORMATION AND DECLARATIONS
FundingThe study was funded by the University of Bergen and the Nutricia Research Foundation.
The funders had no role in study design, data collection and analysis, decision to publish,
or preparation of the manuscript.
Grant DisclosuresThe following grant information was disclosed by the authors:
University of Bergen and the Nutricia Research Foundation.
Competing InterestsThe authors declare there are no competing interests.
Author Contributions• Hallgeir Kismul conceived and designed the experiments, performed the experiments,
analyzed the data, wrote the paper, prepared figures and/or tables, reviewed drafts of the
paper.
• Jan Van den Broeck conceived and designed the experiments, performed the experi-
ments, contributed reagents/materials/analysis tools, reviewed drafts of the paper.
• Torleif Markussen Lunde conceived and designed the experiments, performed the
experiments, analyzed the data, prepared figures and/or tables, reviewed drafts of the
paper.
Human EthicsThe following information was supplied relating to ethical approvals (i.e., approving body
and any reference numbers):
Ethical approval for the Bwamanda study was granted by the University of Leuven’s
Tropical Childcare Health Working Group.
Kismul et al. (2014), PeerJ, DOI 10.7717/peerj.350 13/16
Data DepositionAs the principle investigator Jan Van den Broeck is the custodian of the Bwamanda dataset.
Please contact Jan Van den Broeck for access to the dataset: [email protected].
Supplemental InformationSupplemental information for this article can be found online at http://dx.doi.org/
10.7717/peerj.350.
REFERENCESAsafo-Agyei SB, Antwi S, Nguah SB. 2013. HIV infection in severely malnourished children in
Kumasi, Ghana: a cross-sectional prospective study. BMC Pediatrics 13:181DOI 10.1186/1471-2431-13-181.
Badaloo AV, Forrester T, Reid M, Jahoor F, Jahoor F. 2006. Lipid kinetic differences betweenchildren with kwashiorkor and those with marasmus. American Journal of Clinical Nutrition83:1283–1288.
Bhaskaram P, Radhika MS, Balakrishna N, Ramalakshmi BA. 2003. Red palm oil supplementa-tion: a feasible diet-based approach to improve maternal and neonatal vitamin A status andhealth. Journal of Womens Health & Gender-Based Medicine 12:428–428.
Brent RP. 1973. Algorithms for minimization without derivatives. Englewood Cliffs, NJ:Prentice-Hall.
Briend A, Wojtyniak B, Rowland MGM. 1987. Arm circumference and other factors in children athigh-risk of death in rural Bangladesh. Lancet 2:725–728 DOI 10.1016/S0140-6736(87)91084-1.
Ciliberto H, Ciliberto M, Briend A, Ashorn P, Bier D, Manary M. 2005. Antioxidantsupplementation for the prevention of kwashiorkor in Malawian children: randomised, doubleblind, placebo controlled trial. BMJ 330:1–5 DOI 10.1136/bmj.38427.404259.8F.
de Pee S, West CE, Muhilal KD, Hautvast JG. 1995. Lack of improvement in vitamin A status withincreased consumption of dark-green leafy vegetables. Lancet 346:75–81DOI 10.1016/S0140-6736(95)92111-7.
de Pee S, West CE, Permaesih D, Martuti S, Muhilal, Hautvast JG. 1998. Orange fruit is moreeffective than are dark-green, leafy vegetables in increasing serum concentrations of retinoland beta-carotene in schoolchildren in Indonesia. American Journal of Clinical Nutrition68:1058–1067.
Fillion L, Henry CJK. 1998. Nutrient losses and gains during frying: a review. International Journalof Food Sciences and Nutrition 49:157–168 DOI 10.3109/09637489809089395.
Frood JD. 1971. Relationship between pattern of infection and development of hypoalbuminaemiaand hypo-beta-lipoproteinaemia in rural Ugandan children. Lancet 2:1047–1049DOI 10.1016/S0140-6736(71)90375-8.
Golden MH, Ramdath D. 1987. Free radicals in the pathogenesis of kwashiorkor. Proceedings ofthe Nutrition Society 46:53–68 DOI 10.1079/PNS19870008.
Gopalan C. 1992. Kwashiorkor and marasmus: evolution and distinguishing features. The NationalMedical Journal of India 5:145–151.
Hanley JA, Miettinen OS. 2009. Fitting smooth-in-time prognostic risk functions via logisticregression. International Journal of Biostatistics 5:Article 3 DOI 10.2202/1557-4679.1125.
Kismul et al. (2014), PeerJ, DOI 10.7717/peerj.350 14/16

Isaksson C, Sepil I, Baramidze V, Sheldon B. 2013. Explaining variance of avian malaria infectionin the wild: the importance of host density, habitat, individual life-history and oxidative stress.BMC Ecology 13:1–11 DOI 10.1186/1472-6785-13-15.
Jahoor F, Badaloo A, Reid M, Forrester T. 2008. Protein metabolism in severe childhoodmalnutrition. Annals of Tropical Paediatrics 28:87–101 DOI 10.1179/146532808X302107.
Lenhartz H, Ndasi R, Anninos A, Botticher D, Mayatepek E, Tetanye E, Leichsenring M.1998. The clinical manifestation of the kwashiorkor syndrome is related to increased lipidperoxidation. Journal of Pediatrics 132:879–881 DOI 10.1016/S0022-3476(98)70324-5.
Leskova E, Kubikova J, Kovacikova E, Kosicka M, Porubska J, Holcikova K. 2006. Vitamin losses:retention during heat treatment and continual changes expressed by mathematical models.Journal of Food Composition and Analysis 19:252–276 DOI 10.1016/j.jfca.2005.04.014.
Lim SS. 2012. A comparative risk assessment of burden of disease and injury attributable to 67 riskfactors and risk factor clusters in 21 regions, 1990–2010: a systematic analysis for the GlobalBurden of Disease Study 2010. Lancet 380:2224–2260 DOI 10.1016/S0140-6736(12)61766-8.
Lin CA, Boslaugh S, Ciliberto HM, Maleta K, Ashorn P, Briend A, Manary MJ. 2007. Aprospective assessment of food and nutrient intake in a population of Malawian childrenat risk for kwashiorkor. Journal of Pediatrics Gastroenterology and Nutrition 44:487–493DOI 10.1097/MPG.0b013e31802c6e57.
Manary MJ, Leeuwenburgh C, Heinecke JW. 2000. Increased oxidative stress in kwashiorkor.Journal of Pediatrics 137:421–424 DOI 10.1067/mpd.2000.107512.
Miettinen OS. 2010. Etiologic study vis-a-vis intervention study. European Journal of Epidemiology25:671–675 DOI 10.1007/s10654-010-9486-9.
Mudambi RS, Rajagopa MV. 2006. Effect of heat on the beta-carotene content of Nigerian palmoil. Journal of Food Science and Technology-Mysore 43:1414–1416.
Prudhon C, Golden MHN, Briend A, Mary JY. 1997. A model to standardise mortality of severelymalnourished children using nutritional status on admission to therapeutic feeding centres.European Journal of Clinical Nutrition 51:771–777 DOI 10.1038/sj.ejcn.1600483.
Sergio AR. 1999. b-carotene and other carotenoids as antioxidants. Journal of the American Collegeof Nutrition 18:426–433 DOI 10.1080/07315724.1999.10718880.
Stephensen CB. 2001. Vitamin A, infection, and immune function. Annual Review of Nutrition21:167–192 DOI 10.1146/annurev.nutr.21.1.167.
Strobel M, Tinz J, Biesalski HK. 2007. The importance of beta-carotene as a source of vitamin Awith special regard to pregnant and breastfeeding women. European Journal Nutrition 46(Suppl 1):1–20 DOI 10.1007/s00394-007-1001-z.
Sullivan J, Ndekha M, Maker D, Hotz C, Manary MJ. 2006. The quality of the diet in Malawianchildren with kwashiorkor and marasmus. Maternal and Child Nutrition 2:114–122DOI 10.1111/j.1740-8709.2006.00053.x.
Termote C, Meyi MB, Djailo BD, Huybregts L, Lachat C, Kolsteren P, Van Damme P. 2012. Abiodiverse rich environment does not contribute to a better diet: a case study from DR Congo.PLoS ONE 7:e30533 DOI 10.1371/journal.pone.0030533.
Van den Broeck J, Eeckels R, Vuylsteke J. 1993. Influence of nutritional-status on child-mortalityin rural Zaire. Lancet 341:1491–1495 DOI 10.1016/0140-6736(93)90632-Q.
Villamor E, Fawzi WW. 2005. Effects of vitamin A supplementation on immune responsesand correlation with clinical outcomes. Clinical Microbiology Reviews 18:446–464DOI 10.1128/CMR.18.3.446-464.2005.
Kismul et al. (2014), PeerJ, DOI 10.7717/peerj.350 15/16
Whitehead RG. 1977. Infection and the development of kwashiorkor and marasmus in Africa.American Journal of Clinical Nutrition 30:1281–1284.
Williams CD. 1935. Kwashiorkor: a nutritional disease of children associated with a maize diet.The Lancet 226:1151–1152 DOI 10.1016/S0140-6736(00)94666-X.
World Health Organization W. 2006. Child growth standards: length/height-for-age,weight-for-age, weight-for-length, weight-for-height and body mass index-for-age: methods anddevelopment. Geneva: World Health Organization.
Kismul et al. (2014), PeerJ, DOI 10.7717/peerj.350 16/16

III


RESEARCH Open Access
The social context of severe child malnutrition:a qualitative household case study from a ruralarea of the Democratic Republic of CongoHallgeir Kismul1*, Anne Hatløy2, Peter Andersen3, Mala Mapatano4, Jan Van den Broeck1ˆ and Karen Marie Moland1
Abstract
Introduction: The magnitude of child malnutrition including severe child malnutrition is especially high in the ruralareas of the Democratic Republic of Congo (the DRC). The aim of this qualitative study is to describe the socialcontext of malnutrition in a rural part of the DRC and explore how some households succeed in ensuring that theirchildren are well-nourished while others do not.
Methodology: This study is based on participant observation, key informant interviews, group discussions andin-depth interviews with four households with malnourished children and four with well-nourished children. Weapply social field theory to link individual child nutritional outcomes to processes at local level and to the widersocio-economic environment.
Findings: We identified four social fields that have implications for food security and child nutritional outcomes:1) household size and composition which determined vulnerability to child malnutrition, 2) inter-household cooperationin the form of ‘gbisa work party’ which buffered scarcity of labour in peak seasons and facilitated capital accumulation,3) the village associated with usufruct rights to land, and 4) the local NGO providing access to agricultural support, cleandrinking water and health care.
Conclusions: Households that participated in inter-household cooperation were able to improve food and nutritionsecurity. Children living in households with high pressure on productive members were at danger of food insecurityand malnutrition. Nutrition interventions need to involve local institutions for inter-household cooperation and addressthe problem of social inequalities in service provision. They should have special focus on households with few resourcesin the form of land, labour and capital.
Keywords: Malnutrition, Marasmus, Kwashiorkor, Food security, Subsistence agriculture, Social inequality, Social capital,The Democratic Republic of Congo
IntroductionMalnutrition contributes significantly to mortality inchildren under five years and in 2011 it was estimatedthat about 45 % of child deaths could be attributed tomalnutrition [1]. Marasmus and kwashiorkor are bothforms of severe malnutrition and have especially highmortality rates [2, 3]. While Marasmus is characterisedby extreme wasting, Kwashiorkor is characterised byoedema and the aetiology of this disease is still uncertain.
Child malnutrition in the form of stunting, wasting,underweight and severe malnutrition has significant impli-cations for healthy human development in terms of motorskills, and cognitive and social development [4–7]. Thereare several pathways to malnutrition. Poor diet and illnesshave been identified as immediate factors that contributeto the development of malnutrition, food insecurity hasbeen identified as an intermediate factor, and socio-economic conditions as underlying causes [8]. Growingsocial inequalities and determinants of health attractedspecial attention during the last decades [9, 10]. In lowand middle-income countries there is evidence of increas-ing social inequalities in child nutrition with the highest
* Correspondence: [email protected]ˆDeceased1Centre for International Health, University of Bergen, 5009 Bergen, NorwayFull list of author information is available at the end of the article
© 2015 Kismul et al.; licensee BioMed Central. This is an Open Access article distributed under the terms of the CreativeCommons Attribution License (http://creativecommons.org/licenses/by/4.0), which permits unrestricted use, distribution, andreproduction in any medium, provided the original work is properly credited. The Creative Commons Public DomainDedication waiver (http://creativecommons.org/publicdomain/zero/1.0/) applies to the data made available in this article,unless otherwise stated.
Kismul et al. International Journal for Equity in Health (2015) 14:47 DOI 10.1186/s12939-015-0175-x
rates of malnutrition being found in the poorest segmentsof the population [11–14]. Urban–rural inequalities inchild malnutrition are frequently found with a higher riskamong the rural population [15–20]. The factors thataffect nutrition in rural and urban areas differ and a higherreliance on agriculture and natural resources, and a lesserdependency on cash income are characteristic of ruralareas. [15]. The majority of rural people in low-incomecountries live on small farms of less than one hectare andagriculture is the foremost provider of food and theprinciple source of income [21–23]. Sub-Saharan Africa ismore dependent on agriculture than any other region inthe world and small-scale agriculture is particularly im-portant [24]. In areas that strongly depend on agriculturethere is a close linkage between agriculture and nutrition.Agriculture as a source of food is the most direct pathwaybetween agriculture and nutrition [25]. The urban–ruralgap in malnutrition has also been attributed to factorssuch as education, access to quality food and availability ofhealth services [15, 17, 18, 20]. Maternal education, espe-cially education at secondary level, is considered to beamong the most important factors that explain urban ruraldifferences in malnutrition [17, 18, 20]. Besides investigat-ing inter-household inequalities, several studies have ex-amined intra-household inequalities in nutrition. Whilestudies from South Asia have reported discriminationagainst girls in food allocation and malnutrition beingmore common among girls than boys [26–29], researchfrom sub-Saharan Africa on gender inequalities in nutri-tion is inconclusive [30–33].The Democratic Republic of Congo (the DRC) is
among the countries in the world with the highest ratesof child malnutrition [1, 34]. Although malnutrition iswidespread in all provinces there are important geo-graphic variations and the occurrence is significantlyhigher in rural than in urban areas [34, 35]. While theprevalence of stunting in rural areas in 2013 was 47 % itwas 33 % in urban areas. In the rural areas of the DRCsubsistence agriculture is the major livelihood for themajority of the households [36, 37]. Currently there areseveral constraints to subsistence production: farmerscultivate small land-holdings, they rely on traditionalcultivation technologies, have limited access to agricul-tural input, infrastructure is poor and pressure on theproductive population is high [35, 36, 38]. In the contextof civil war the subsistence agricultural sector has alsobeen seriously neglected by the government and devel-opment agencies [37].In small-scale agricultural communities the household
is typically the unit responsible for food production andconsumption [39, 40]. Hence, the social organisation ofthe household has important implications for food andnutritional security [39]. In this paper we explorehow household characteristics, access to land and
inter-household cooperation affect food security andvulnerability to child malnutrition in an environmentwhere subsistence agriculture is dominant. Using theBwamanda area, located in a rural part of westernDRC as a case, we aim to describe the social contextof food production and nutrition, and explore howsome households succeed to ensure that their childrenare well-nourished while others do not.
MethodsStudy settingThe Democratic Republic of Congo (the DRC)The DRC is located in south-west central Africa and isthe second largest country in Africa. It is divided intoten provinces and one city province (see Fig. 1 map). Interms of natural resources it is among the richest coun-tries in the world and has a diversity of mineral andforest resources [41]. It also has an environment that isfavourable for agricultural activities and allows for twoharvests per year [42]. Despite the DRCs wealth in nat-ural resources, its population is among the poorest inthe world and because of its poor scores with regardsto income, health and education it is ranked as secondto last according to the Human Development Index[43]. There is a rural–urban gap in poverty disfavouringrural areas where eight out of ten households are livingbelow the poverty line of 1.25 dollars a day while inurban areas it is less than seven out of ten [41]. Since1997 and until now the political situation in thecountry has been characterised by civil wars and cor-ruption. The death toll of the civil war, 1998 – 2004,has been estimated to 3.9 million [44]. The conflictshave restricted the country’s ability to promote devel-opment and it is still strongly dependent on foreignaid [37, 45].
The Equatorial provinceThe Equatorial Province where this study was under-taken is situated in the north-west part of the country.The province covers an area of 403.292 km2, 17 % of theDRC, and is composed of five districts. It has a popula-tion of five million. According to a UNDP report from2009 as much as 94 % of the population was living belowthe poverty line of 1.25 dollars a day, the province wasthe poorest in the country [46]. The proportion of chil-dren suffering from malnutrition in 2013 was high: 57 %of the children under five years of age were stunted and7.6 % wasted [34]. With prevalence in 2007 of 10.5 %,this province had the highest proportion of children withkwashiorkor [47].
Bwamanda areaThe study was carried out in the Bwamanda area in thenorth-west of the Equatorial Province. Bwamanda village
Kismul et al. International Journal for Equity in Health (2015) 14:47 Page 2 of 14
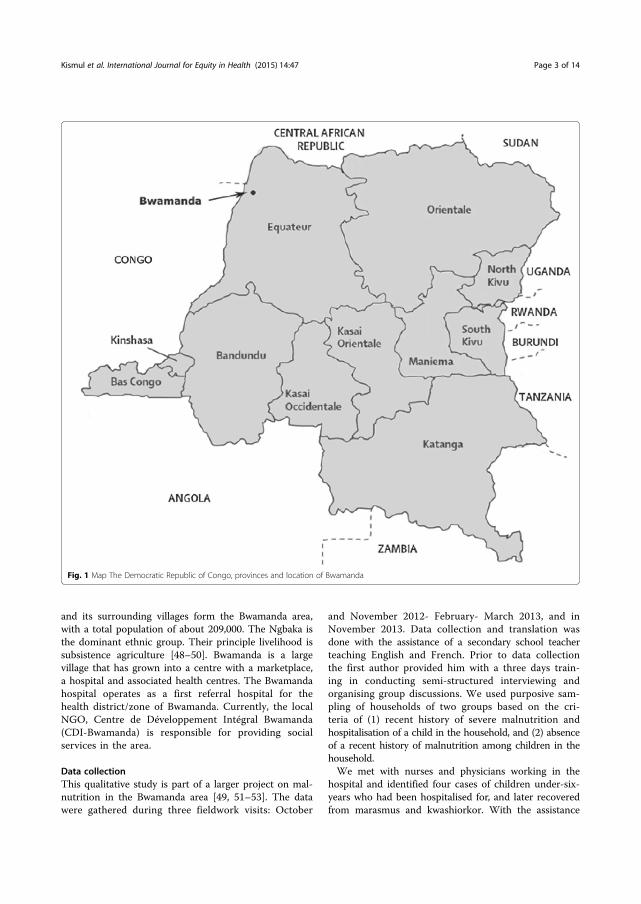
and its surrounding villages form the Bwamanda area,with a total population of about 209,000. The Ngbaka isthe dominant ethnic group. Their principle livelihood issubsistence agriculture [48–50]. Bwamanda is a largevillage that has grown into a centre with a marketplace,a hospital and associated health centres. The Bwamandahospital operates as a first referral hospital for thehealth district/zone of Bwamanda. Currently, the localNGO, Centre de Développement Intégral Bwamanda(CDI-Bwamanda) is responsible for providing socialservices in the area.
Data collectionThis qualitative study is part of a larger project on mal-nutrition in the Bwamanda area [49, 51–53]. The datawere gathered during three fieldwork visits: October
and November 2012- February- March 2013, and inNovember 2013. Data collection and translation wasdone with the assistance of a secondary school teacherteaching English and French. Prior to data collectionthe first author provided him with a three days train-ing in conducting semi-structured interviewing andorganising group discussions. We used purposive sam-pling of households of two groups based on the cri-teria of (1) recent history of severe malnutrition andhospitalisation of a child in the household, and (2) absenceof a recent history of malnutrition among children in thehousehold.We met with nurses and physicians working in the
hospital and identified four cases of children under-six-years who had been hospitalised for, and later recoveredfrom marasmus and kwashiorkor. With the assistance
Fig. 1 Map The Democratic Republic of Congo, provinces and location of Bwamanda
Kismul et al. International Journal for Equity in Health (2015) 14:47 Page 3 of 14
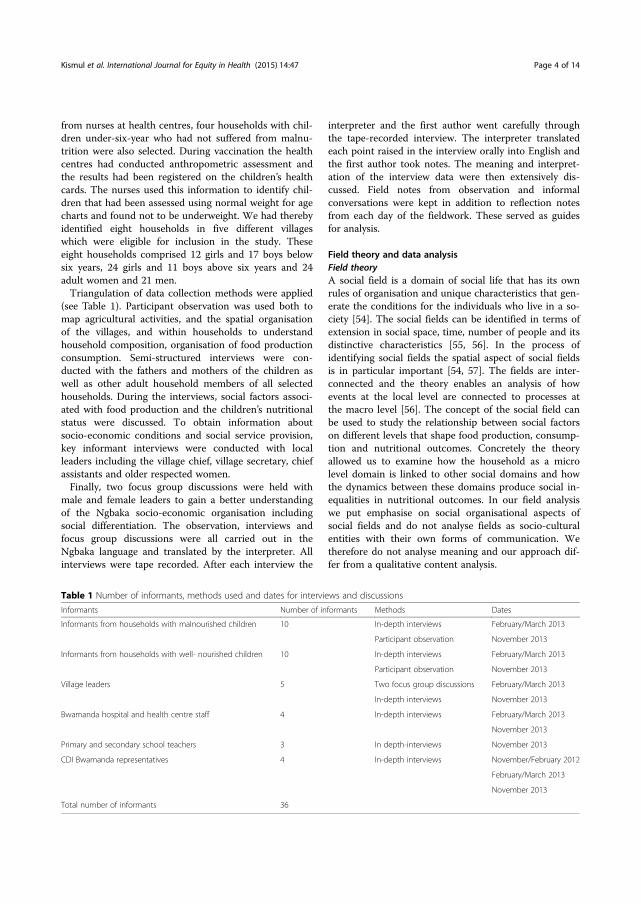
from nurses at health centres, four households with chil-dren under-six-year who had not suffered from malnu-trition were also selected. During vaccination the healthcentres had conducted anthropometric assessment andthe results had been registered on the children’s healthcards. The nurses used this information to identify chil-dren that had been assessed using normal weight for agecharts and found not to be underweight. We had therebyidentified eight households in five different villageswhich were eligible for inclusion in the study. Theseeight households comprised 12 girls and 17 boys belowsix years, 24 girls and 11 boys above six years and 24adult women and 21 men.Triangulation of data collection methods were applied
(see Table 1). Participant observation was used both tomap agricultural activities, and the spatial organisationof the villages, and within households to understandhousehold composition, organisation of food productionconsumption. Semi-structured interviews were con-ducted with the fathers and mothers of the children aswell as other adult household members of all selectedhouseholds. During the interviews, social factors associ-ated with food production and the children’s nutritionalstatus were discussed. To obtain information aboutsocio-economic conditions and social service provision,key informant interviews were conducted with localleaders including the village chief, village secretary, chiefassistants and older respected women.Finally, two focus group discussions were held with
male and female leaders to gain a better understandingof the Ngbaka socio-economic organisation includingsocial differentiation. The observation, interviews andfocus group discussions were all carried out in theNgbaka language and translated by the interpreter. Allinterviews were tape recorded. After each interview the
interpreter and the first author went carefully throughthe tape-recorded interview. The interpreter translatedeach point raised in the interview orally into English andthe first author took notes. The meaning and interpret-ation of the interview data were then extensively dis-cussed. Field notes from observation and informalconversations were kept in addition to reflection notesfrom each day of the fieldwork. These served as guidesfor analysis.
Field theory and data analysisField theoryA social field is a domain of social life that has its ownrules of organisation and unique characteristics that gen-erate the conditions for the individuals who live in a so-ciety [54]. The social fields can be identified in terms ofextension in social space, time, number of people and itsdistinctive characteristics [55, 56]. In the process ofidentifying social fields the spatial aspect of social fieldsis in particular important [54, 57]. The fields are inter-connected and the theory enables an analysis of howevents at the local level are connected to processes atthe macro level [56]. The concept of the social field canbe used to study the relationship between social factorson different levels that shape food production, consump-tion and nutritional outcomes. Concretely the theoryallowed us to examine how the household as a microlevel domain is linked to other social domains and howthe dynamics between these domains produce social in-equalities in nutritional outcomes. In our field analysiswe put emphasise on social organisational aspects ofsocial fields and do not analyse fields as socio-culturalentities with their own forms of communication. Wetherefore do not analyse meaning and our approach dif-fer from a qualitative content analysis.
Table 1 Number of informants, methods used and dates for interviews and discussions
Informants Number of informants Methods Dates
Informants from households with malnourished children 10 In-depth interviews February/March 2013
Participant observation November 2013
Informants from households with well- nourished children 10 In-depth interviews February/March 2013
Participant observation November 2013
Village leaders 5 Two focus group discussions February/March 2013
In-depth interviews November 2013
Bwamanda hospital and health centre staff 4 In-depth interviews February/March 2013
November 2013
Primary and secondary school teachers 3 In depth-interviews November 2013
CDI Bwamanda representatives 4 In-depth interviews November/February 2012
February/March 2013
November 2013
Total number of informants 36
Kismul et al. International Journal for Equity in Health (2015) 14:47 Page 4 of 14

Data analysisDuring the field work we observed and discussed withkey informants how location related to food productionand consumption. We examined this relation with re-spect to smaller areas including the compound, theneighbourhood, the village and larger areas such as agri-cultural fields, natural areas in the vicinity of the villagesand the Bwamanda area. In this manner with couldidentify separate bounded areas that we term socialspace. We identified major characteristics of social activ-ities by describing the context of production and con-sumption. Making linkages between social space andactivities with their own characteristics we could beginto delineate separate fields. Through the description ofthe household cases we further singled out field charac-teristics and fields’ implications for nutrition. By havingidentified the social fields we were able to present factorsthat could be easily compared and analysed. We per-formed cross case-case comparisons and analysed howthe fields had different implications for food securityand nutritional status. Household cases were used toshow the linkage between social organisation and nutri-tion and we therefore did not use quotes to highlightthis relation.
Ethical issuesEthical clearance was provided by the Regional Committeefor Medical and Health Research Ethics, Western Norwayand by the Ethical Committee at the School of PublicHealth, University of Kinshasa, the Democratic Republic ofCongo. For ethical reasons we recruited children who pre-viously had suffered from malnutrition. In regards to thefieldwork and data collection, an information sheet and in-formed consent form were prepared in the Ngbaka lan-guage. We explained the content of the form to eachparticipant and obtained informed consent before startingany data collection including consent to record the inter-views. Finally, although the households are described in de-tail in the findings section, we strived to keep names andlocation confidential.
FindingsThe first section gives an account of the Ngbaka socio-economic organisation and we describe characteristicactivities relating to food production, consumption andnutrition. The description of socio-economic context isused as a backdrop for organising the household casesand links between the social context and nutritional out-comes. In the second section eight household cases arepresented: the first four are households with a history ofseverely malnourished children and the last four arethose with well-nourished children. Table 2 gives anoverview of household cases structured in accordancewith the description of the socio-economic context.
Ngbaka socio-economic organisationVillage leadership and access to landThe Ngbaka live in villages whose names typically beginswith the pre-fix bo which means descendant, followedby the name of the founder of the village. Each villagehas a chief (capita) who is supported by several assis-tants. Land administration is a major task of the villageleadership with the leaders negotiating in land con-flicts and being responsible for land redistribution. InBwamanda, land is under a traditional community-based property system and individual farmers are entitledto usufruct rights. In accordance with the Ngbaka patri-lineal descent system land rights are transferred fromfather to son. In order to uphold usufruct to land thefamily is required to continuously cultivate it and residein the village.
Food productionThe Ngbaka farmers produce their staple foods throughshifting cultivation and a household’s planted land com-monly covers less than one hectare. Maize and cassavaare staples and groundnuts and palm oil are major cashcrops. Some farmers also grow crops such as taro, sweetpotatoes, pigeon peas, beans and various vegetables andfruits. Farming techniques are very traditional; all opera-tions are done by hand, farmers do not have access todraught animals and fertilisers are unavailable. Agricul-tural fields are cleared during the first two months ofthe year, planted and weeded in April up to the begin-ning of June. The first harvest of maize takes place inJune and the other in November, while farmers begin toharvest cassava in October. After three to four years thesoil is exhausted and land is left fallow for several years.Fallow land is sometimes used for oil palms and treecrops. To supplement crop production poorer farmerskeep poultry and guinea pigs while better-off farmersraise pigs, sheep, goats and cattle.In addition to agriculture the Ngbaka hunt, gather wild
food and fish. Men hunt whereas women gather wildfood, but both men and women fish. While men fishusing rods, nets and traps, women catch fish in tempor-arily dammed pools as they drain out. Natural resourcesin Bwamanda are widely dispersed; agricultural fieldscan be located up to 4 h walk from the homesteads andin the dry season people go on foot for several hours tofish in the rivers.
Food consumptionThe Ngbaka normally eat two meals per day with a mainmeal that typically consists of ka, a stiff porridge madefrom cassava and maize flour. Porridge is served with astew of cassava leaves, sometimes enhanced with fishand groundnuts. In between meals, adults and childrendrink tea with sugar and eat various fruits. Infants are
Kismul et al. International Journal for Equity in Health (2015) 14:47 Page 5 of 14
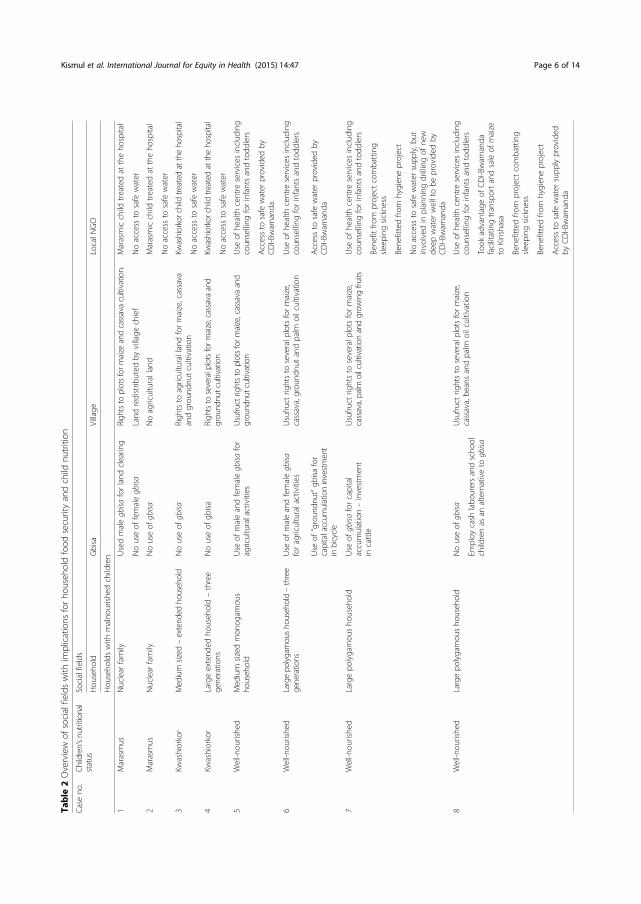
Table
2Overview
ofsocialfieldswith
implications
forho
useh
oldfood
securityandchild
nutrition
Caseno
.Ch
ildren’snu
tritional
status
Socialfields
Hou
seho
ldGbisa
Village
LocalN
GO
Hou
seho
ldswith
malno
urishe
dchildren
1Marasmus
Nuclear
family
Usedmalegbisa
forland
clearin
gRigh
tsto
plotsform
aize
andcassavacultivation.
Marasmicchild
treatedat
theho
spital
Nouseof
femalegbisa
Land
redistrib
uted
byvillage
chief
Noaccess
tosafe
water
2Marasmus
Nuclear
family
Nouseof
gbisa
Noagriculturalland
Marasmicchild
treatedat
theho
spital
Noaccess
tosafe
water
3Kw
ashiorkor
Medium
sized
–extend
edho
usehold
Nouseof
gbisa
Righ
tsto
agriculturallandformaize,cassava
andgrou
ndnu
tcultivatio
nKw
ashiorkorchildtre
ated
attheho
spital
Noaccess
tosafe
water
4Kw
ashiorkor
Largeextend
edho
useh
old–three
gene
ratio
nsNouseof
gbisa
Righ
tsto
severalplotsform
aize,cassava
and
grou
ndnu
tcultivation
Kwashiorkorchildtre
ated
attheho
spital
Noaccess
tosafe
water
5Well-n
ourishe
dMed
ium
sizedmon
ogam
ous
househ
old
Use
ofmaleandfemalegbisa
for
agriculturalactivities
Usufru
ctrightsto
plotsform
aize,cassava
and
grou
ndnu
tcultivation
Use
ofhe
alth
centre
services
includ
ing
coun
selling
forinfantsandtodd
lers
Accessto
safe
water
provided
byCDI-Bwam
anda
6Well-n
ourishe
dLargepo
lygamou
sho
usehold–three
generations
Use
ofmaleandfemalegbisa
foragriculturalactivities
Usufru
ctrig
htsto
severalp
lotsformaize,
cassava,grou
ndnu
tandpalm
oilcultivation
Use
ofhe
alth
centre
services
includ
ing
coun
selling
forinfantsandtodd
lers
Use
of“groun
dnut”gb
isafor
capitalaccum
ulationinvestment
inbicycle
Accessto
safe
water
provided
byCDI-Bwam
anda
7Well-n
ourishe
dLargepo
lygamou
sho
useh
old
Use
ofgbisa
forcapital
accumulation–investmen
tin
cattle
Usufru
ctrig
htsto
severalp
lotsformaize,
cassava,palm
oilcultivationandgrow
ingfru
itsUse
ofhe
alth
centre
services
includ
ing
coun
selling
forinfantsandtodd
lers
Bene
fitfro
mprojectcombatting
sleeping
sickne
ss
Bene
fittedfro
mhygien
eproject
Noaccess
tosafe
water
supp
ly,b
utinvolved
inplanning
drillingof
new
deep
water
welltobe
provided
byCDI-Bwam
anda
8Well-n
ourishe
dLargepo
lygamou
sho
useh
old
Nouseof
gbisa
Usufru
ctrig
htsto
severalp
lotsformaize,
cassava,be
ansandpalm
oilcultivation
Use
ofhe
alth
centre
services
includ
ing
coun
selling
forinfantsandtodd
lers
Employ
cash
labo
urersandscho
olchildrenas
analternativeto
gbisa
Took
advantageof
CDI-Bwam
anda
facilitatingtransportandsaleof
maize
toKinshasa
Bene
fittedfro
mprojectcombatting
sleeping
sickne
ss
Bene
fittedfro
mhygien
eproject
Accessto
safe
water
supp
lyprovided
byCDI-Bwam
anda
Kismul et al. International Journal for Equity in Health (2015) 14:47 Page 6 of 14
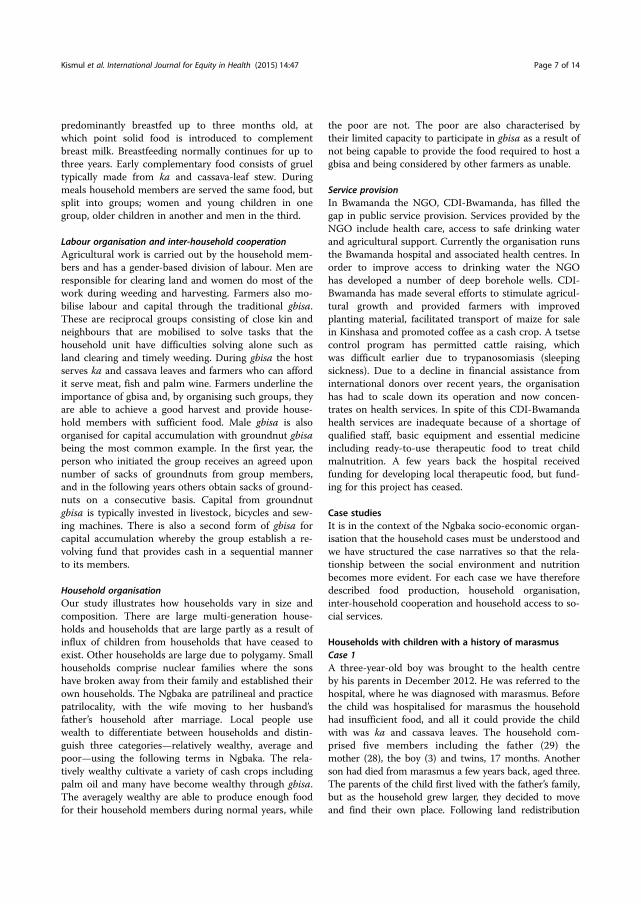
predominantly breastfed up to three months old, atwhich point solid food is introduced to complementbreast milk. Breastfeeding normally continues for up tothree years. Early complementary food consists of grueltypically made from ka and cassava-leaf stew. Duringmeals household members are served the same food, butsplit into groups; women and young children in onegroup, older children in another and men in the third.
Labour organisation and inter-household cooperationAgricultural work is carried out by the household mem-bers and has a gender-based division of labour. Men areresponsible for clearing land and women do most of thework during weeding and harvesting. Farmers also mo-bilise labour and capital through the traditional gbisa.These are reciprocal groups consisting of close kin andneighbours that are mobilised to solve tasks that thehousehold unit have difficulties solving alone such asland clearing and timely weeding. During gbisa the hostserves ka and cassava leaves and farmers who can affordit serve meat, fish and palm wine. Farmers underline theimportance of gbisa and, by organising such groups, theyare able to achieve a good harvest and provide house-hold members with sufficient food. Male gbisa is alsoorganised for capital accumulation with groundnut gbisabeing the most common example. In the first year, theperson who initiated the group receives an agreed uponnumber of sacks of groundnuts from group members,and in the following years others obtain sacks of ground-nuts on a consecutive basis. Capital from groundnutgbisa is typically invested in livestock, bicycles and sew-ing machines. There is also a second form of gbisa forcapital accumulation whereby the group establish a re-volving fund that provides cash in a sequential mannerto its members.
Household organisationOur study illustrates how households vary in size andcomposition. There are large multi-generation house-holds and households that are large partly as a result ofinflux of children from households that have ceased toexist. Other households are large due to polygamy. Smallhouseholds comprise nuclear families where the sonshave broken away from their family and established theirown households. The Ngbaka are patrilineal and practicepatrilocality, with the wife moving to her husband’sfather’s household after marriage. Local people usewealth to differentiate between households and distin-guish three categories—relatively wealthy, average andpoor—using the following terms in Ngbaka. The rela-tively wealthy cultivate a variety of cash crops includingpalm oil and many have become wealthy through gbisa.The averagely wealthy are able to produce enough foodfor their household members during normal years, while
the poor are not. The poor are also characterised bytheir limited capacity to participate in gbisa as a result ofnot being capable to provide the food required to host agbisa and being considered by other farmers as unable.
Service provisionIn Bwamanda the NGO, CDI-Bwamanda, has filled thegap in public service provision. Services provided by theNGO include health care, access to safe drinking waterand agricultural support. Currently the organisation runsthe Bwamanda hospital and associated health centres. Inorder to improve access to drinking water the NGOhas developed a number of deep borehole wells. CDI-Bwamanda has made several efforts to stimulate agricul-tural growth and provided farmers with improvedplanting material, facilitated transport of maize for salein Kinshasa and promoted coffee as a cash crop. A tsetsecontrol program has permitted cattle raising, whichwas difficult earlier due to trypanosomiasis (sleepingsickness). Due to a decline in financial assistance frominternational donors over recent years, the organisationhas had to scale down its operation and now concen-trates on health services. In spite of this CDI-Bwamandahealth services are inadequate because of a shortage ofqualified staff, basic equipment and essential medicineincluding ready-to-use therapeutic food to treat childmalnutrition. A few years back the hospital receivedfunding for developing local therapeutic food, but fund-ing for this project has ceased.
Case studiesIt is in the context of the Ngbaka socio-economic organ-isation that the household cases must be understood andwe have structured the case narratives so that the rela-tionship between the social environment and nutritionbecomes more evident. For each case we have thereforedescribed food production, household organisation,inter-household cooperation and household access to so-cial services.
Households with children with a history of marasmusCase 1A three-year-old boy was brought to the health centreby his parents in December 2012. He was referred to thehospital, where he was diagnosed with marasmus. Beforethe child was hospitalised for marasmus the householdhad insufficient food, and all it could provide the childwith was ka and cassava leaves. The household com-prised five members including the father (29) themother (28), the boy (3) and twins, 17 months. Anotherson had died from marasmus a few years back, aged three.The parents of the child first lived with the father’s family,but as the household grew larger, they decided to moveand find their own place. Following land redistribution
Kismul et al. International Journal for Equity in Health (2015) 14:47 Page 7 of 14
carried out by the village chief, the couple obtained accessto a homestead and agricultural land, with one plot formaize and one for cassava. For clearing the land the fatherinvolved a gbisa. With their children being so sick, theparents had not been able to spend the necessary timetending to their two plots, and consequently weeds sup-pressed their fields resulting in poor harvests. Caring forthe sick boy and breastfeeding the twins had made it hardfor the mother to find time for fishing. Buying fishinghooks was also an unaffordable expense and the fathercould therefore not go fishing. They failed to produce asufficient amount of food and had no stores of maize andthe family had to subsist on cassava from the fields. Theiropportunity to supplement their cassava- and maize-baseddiet with fish was severely curtailed. Facing acute foodscarcity the family had to rely on food provided by rela-tives living nearby. They also lived on the outskirts of thevillage and had no access to safe drinking water providedby CDI-Bwamanda.
Case 2A boy aged 16 months was brought to the health centrein January 2013, where he exhibited signs of severe mal-nutrition. The health centre referred the boy to the hos-pital in Bwamanda, where he was diagnosed withmarasmus. The family spent one whole day walking tothe hospital. In order to pay for the hospital expenses,the boy’s mother pledged the only saucepan in thehousehold. Although the boy had not completely recov-ered he was discharged from the hospital. The healthcentre in the village continued to provide care for thechild until he gradually recuperated. Before the childwas hospitalised for marasmus the household had insuf-ficient food, and all it could provide the child with waska and cassava leaves. The household comprised threemembers; the mother (17), the father (25) and the mal-nourished boy. In 2011 the family lived in the father’svillage. They had moved to this village in order to seekpatrilineal rights to land. Many years ago the boy’s par-ental grandfather had left this village in order to marry awoman from a village outside the Bwamanda area. Mov-ing back to his village of origin, the father had acquiredan agricultural plot from a relative. After the land hadbeen cleared, the relative demanded it back. Withoutany land, the father started harvesting oil palm fruits onthe fallow land of other farmers. He thus acquired a verysmall income from selling palm oil. His wife also re-ceived cassava root and leaves as payment for workingas a labourer on another farmer’s field. Since the house-hold had no access to land they did not participate ingbisa. The household had no stores of grain and theyhad no relatives who would help them with food. Inaddition they had no access to safe water provided byCDI-Bwamanda.
Households with children with a history of kwashiorkorCase 3A three-year-old boy was brought to the health centreby his parents and the centre referred the boy to thehospital, where he was diagnosed with kwashiorkor. Inthe period before the boy fell ill from kwashiorkor hehad been eating mostly ka and cassava leaves. Thehousehold was composed of 12 members including thefather of the boy (42), his second wife (32), the father’smother, five adolescent girls and four preschool children.Two of the preschool children, including the boy whohad suffered from kwashiorkor, were children of the firstwife of the father. The first wife had left and given thefather the responsibility of taking care of the two chil-dren. The household cultivated two plots on which theygrew maize and cassava for subsistence, and groundnutsas a cash crop. Because the fertility of the land in usewas rapidly declining, the father wanted to clear morefallow land. With only one adult male member, therewas inadequate labour within the household to clearadditional land. Income from the groundnut sale wasspent mostly on school fees for the older children andthere was no surplus for hiring labour. Involving thegbisa in clearing the land was also said to be impossiblebecause it required the household to provide fish forfeeding the group members during the workday. Thefather said he did not have enough cash to buy fishhooksand could not afford to purchase fish. He and his secondwife reported that because they were unable to clearmore land they were incapable of providing a more di-verse diet for their household members. The householdhad no access to safe drinking water provided by CDI-Bwamanda, and they fetched water from a reservoir thatwas also used for washing clothes.
Case 4An 18-month-old girl was brought to the health centreby her parents in January 2013. She was referred to thehospital where she was diagnosed with kwashiorkor.During the period before she was hospitalised she hadsuffered from diarrhoea, vomiting and fever. The girlwas breastfed complemented with gruel that containedfish. The parents explained that the girl became mal-nourished because she drank contaminated water from ahand-dug well. The household comprised 30 membersfrom three generations, among them the father of thegirl (34), the mother (34), and seven children. Theycultivated several plots of land and in addition to produ-cing staple crops for subsistence they obtained cash in-come from selling maize and groundnuts. They weredependent on household labour, but occasionally hiredlabour for clearing fallow land. They had also invested in12 goats used for meat. In addition to ka and cassavaleaves, they had fish almost every day, as well as chicken
Kismul et al. International Journal for Equity in Health (2015) 14:47 Page 8 of 14
and other meat a couple of days per week. They had noaccess to safe drinking water, from CDI-Bwamanda andthey collected water from a hand-dug well that wasdeemed unsafe and several household members had be-come sick after drinking water from this source.
Households with well-nourished childrenCase 5This was a monogamous household consisting of 15members in total. The household head lived with hiswife and his sister, two adolescents and ten younger chil-dren, all relatives. On their land, the household culti-vated cassava, maize, groundnuts and beans. Farm workwas done by the household members, but labour wasalso mobilised through participating in male and femalegbisa. The women prepared ka and cassava leaves forgbisa and it was not expected for them to provide fish ormeat to the members of the work groups. The head wasan active fisher and hunter. Around the homestead thehousehold also grew a number of fruit trees. The house-hold emphasised the value of a diverse diet and arguedthat they gave their children fish and fruit every day.They obtained safe drinking water from a water sourceprepared by CDI-Bwamanda.
Case 6In this household, comprising 19 members, the headlived with his three wives. Other relatives in the house-hold included three adult males, one adult female, sixadolescents and five younger children. They had man-aged to clear several agricultural plots for cassava,groundnut and palm oil cultivation. In addition tohousehold labour they relied on mobilising gbisa forland clearing and weeding. In the male work group fishand meat was served. The adult males participated in a“groundnut gbisa” and they had used the income fromthe gbisa to purchase a bicycle. They produced enoughcrops and cash to ensure that their members obtained asufficient diet that usually included fish. In their com-pound they grew fruits and in between the meals chil-dren and adults ate bananas and pineapples. Thehousehold lived in the centre of the village and collectedwater from a borehole well drilled by CDI-Bwamanda.
Case 7In this household there were 12 members where thelivestock keeper lived together with his two wives, threeadult males, two adult females, two adolescents and twoyounger children. The members of the household wereall relatives. The household cultivated palm oil and co-conuts in addition to the most common crops. It hadalso established a separate fruit orchard. In order tosecure a regular supply of fish, one of the head’s wivesspecialised in fishing. The head participated in a gbisa
that established a revolving fund providing cash on aconsecutive basis to its members for capital accumula-tion and investment in livestock. To cover the gbisa in-vestment, the household head used funds that his wiveshad saved from selling palm wine. With the capital re-ceived from the gbisa, the household invested in cattle.The gbisa group had later evolved into a group of live-stock owners who cooperated on preventing livestockdiseases. The adult members reported that their childrenwere well-nourished because they could provide themwith a diverse diet that included fish, meat and fruit.They also stated that good hygiene was important. In2011 a project promoted good personal hygiene in theBwamanda area and advised the household members towash their hands before meals. They had attached awater bottle to a tree and water from this bottle wasused for hand washing. Because the household had noaccess to safe drinking water, the head was in regularcontact with the CDI-Bwamanda in the planning of dril-ling a new borehole well.
Case 8This business household consisted of 13 members andthe head lived with his three wives. Other relatives inthe household included three adult males, one adultfemale, two adolescents and two younger children. Theycultivated the most common staple crops while coconutsand oil palm were grown as cash crops. Besides employ-ing household labour, they hired farm labourers and alsoengaged school students during harvest. Previously,CDI-Bwamanda had promoted cash cropping by pur-chasing crops from local farmers and shipping the pro-duce to Kinshasa. At the beginning of the 1990s thehousehold took advantage of this opportunity and withthe profits made on cash crops they invested in acigarette business. Income from the sale of cigaretteswas invested in pigs, sheep and goats and, at a laterstage, in cattle. The head believed that his children werehealthy because, aside from ka and cassava leaves, theyate fish and a variety of fruit. The household had alsofollowed the advice from the hygiene project and usedwater from a bottle attached to a tree for hand washing.It had access to drinking water from a borehole welldrilled by CDI-Bwamanda.
Social field analysisWe have identified four social fields that extend in socialspace each with their own characteristics. On the basisof our description of the Ngbaka socio-economic con-text it is possible to make linkages between activities andspecific locations. Food production and consumption isassociated with the household compound and householdagricultural plots, access to external labour and capitalwith the neighbourhood, acquiring land with the village
Kismul et al. International Journal for Equity in Health (2015) 14:47 Page 9 of 14
and social service provision with local NGO activitieswhich again are linked to activities at the national andinternational level. Several characteristics are unique tothese to these four fields. The household is the majorunit for food production and consumption, division oflabour is gender based and household composition influ-ences its ability to produce sufficient and adequate food.Neighbourhood cooperation in the form of gbisa is char-acterised by being a reciprocal group for exchange oflabour and provision of food and drinks to participantsinfluence people’s willingness to participate in workgroups. The gbisa plays and important role in capital ac-cumulation. The village is associated with access to landand land is transferred from father to sons, living in avillage and continuously cultivating the land is a pre-condition for access to land. The local NGO, CDIBwamanda; in the absence of a strong state has becomethe main provider of social services. The NGO’s provisionof social services establishes linkages between local activ-ities and processes at higher levels. The identification ofthe fours social fields enabled us to conduct a cross-caseanalysis and compare households with malnourished chil-dren with those with well-nourished children.
The householdIn our cases there are links between household size,composition and children’s nutritional status. Largehouseholds comprising many adults with relatively littlepressure on productive members were able to broadentheir economic activities and supply members with anadequacy of food, both in terms of quantity and variety.For example, household 7 included six adults and hadmanaged to diversify its food production. The membersspecialised in growing fruit, making wine, herding cattleand fishing. In contrast, as indicated by case 1, nuclearfamilies were particularly vulnerable and, when membersbecame sick, the effect of ill health was food insecurityand malnutrition. It was not only size and dependencyratio that mattered, but also gender composition. Thefarmers practice shifting cultivation and clearing landrelies heavily on male labour. As illustrated in case 3,shortage of male labour can result in failure to clearland, food insecurity and malnutrition. Among theNgbaka it is women who are mainly responsible forweeding. Household 1 comprised only one woman andthe poor harvest was primarily due to failing to properlyweed the agricultural fields.
Inter-household cooperation – the GbisaEfficient food production does not only rely on house-hold size and composition, but also on inter-householdcooperation in the form of participation in gbisa. Thecases show how households with well-nourished childrenmanaged to solve seasonal bottlenecks by mobilising
agricultural labour through gbisa participation. In case 5,the household was in a positon to supply food desired bythe group and by mobilising a work group it could solvethe problem of shortage of male labour. In contrast, thehousehold in case 3 was unable to provide the foodneeded to join a gbisa. The failure to take part in workgroups was linked to an incapability to provide anadequate diet and malnutrition. Gbisa was also usedfor capital accumulation and revenues were used tostrengthen household economic activities and therebyenhance food security. As illustrated in case 6, in-come from groundnut gbisa was spent on improvinghousehold transportation, while in case 7 profits wereinvested in cattle.
The villageIn Bwamanda rights to land are closely linked to the vil-lage as a unit and access to land is maintained by stayingin the village and continuously cultivating the land. Inour cases, households with well-nourished children hadaccess to labour and land, with wealthier householdscultivating relatively large areas of land. In an area suchas Bwamanda where there are few alternative incomegenerating activities landlessness may result in food inse-curity and child malnutrition. Household 3 illustratesthis link between landlessness and malnutrition. Thehousehold which moved to the village of the malnour-ished child’s father failed to obtain agricultural land andhad to rely on food as payment for work and a meagreincome from selling palm oil.
The local NGOOur study indicates that access to the limited servicesthat exist is disproportionately associated with wealth.For example, in case 7, the household took advantage ofefforts made by CDI-Bwamanda to promote the sale ofmaize. Profits made on cash cropping were used to ex-pand economic activities with earnings being invested inpetty-trade and livestock. The two better-off households(cases 7 and 8), also benefited from efforts to combatsleeping sickness, and as a result of the decline in thisdisease they could keep cattle. These two householdsalso followed advice given by a hygiene project. More-over households with well-nourished children gainedfrom CDI-Bwamanda’s endeavours to improve access tosafe drinking water while those with malnourished chil-dren had not. In case 4 the parents of the girl withkwashiorkor stated that malnutrition was a result ofdrinking contaminated water. Several factors constrain ahousehold’s access to health services that could treatmalnutrition. Local people have no means of transporta-tion and parents must walk long distances to reachBwamanda hospital. As indicated in case 2 it is difficultfor poor households to pay fees for healthcare and the
Kismul et al. International Journal for Equity in Health (2015) 14:47 Page 10 of 14
poor family had to sell their assets to cover hospital feesfor treating the boy with marasmus. Bwamanda hospitalalso lacked food to properly treat malnutrition and the boydid not recover after he had been treated at the hospital.
DiscussionIn our study, access to vital resources for adequate foodproduction was related to four social fields that gener-ated conditions for social inequalities in nutrition.Households with sufficient land, enough labour and ac-cess to social services could ensure that their childrenstayed well-nourished. Households with well-nourishedchildren also benefited from taking part in inter-household cooperation. In this study we identified foursocial fields that had consequences for food security andchildren’s nutritional status. First, household size andcomposition determined the household’s access to labourand hence ability to diversify food production. Second,through neighbour cooperation, in the form of gbisa, kinand neighbours could be mobilised for overcoming sea-sonal bottlenecks and for capital accumulation. Third, thevillage, which controlled access to land for food productionand fourth, the local NGO providing different access tosocial services including agricultural support and health.
The householdThis study has shown how household organisation mayrelate to food and nutritional security. The Ngbaka liveand work in an environment where resources are widelydispersed. In Bwamanda there are hardly any localmeans of transportation and farmers walk for severalhours to reach their farms and fishing grounds. Theyalso practice an intensive form of shifting cultivation. Inaccordance with the literature, our study demonstrateshow in such environments larger households might bemore efficient than small [58, 59]. Our findings also sup-port the suggestion that in societies where the householdis the production unit, households with a high pressureon the productive members are at risk of not being ableto support themselves [60, 61]. Studies have investigatedthe relationship between family size and malnutritionand found that the odds for being malnourished arehigher in large crowded families than in small families[62–65]. Whereas these studies relate family size tohousehold crowding, our study has investigated howhousehold size and composition influences productiveactivities. Our findings align with the notion that genderdivision of labour in agriculture has important implica-tions for food production and nutrition [39, 66].
Inter-household cooperation - the GbisaIn accordance with reports from other areas our casesshow that reciprocal work groups can play an importantrole in mobilising agricultural labour and solving seasonal
bottlenecks [67–70]. Our findings show how the workinggroups could be mobilised in order to solve such tasks asland clearing and timely weeding. In order to mobilise re-ciprocal work groups, some reward is required - often foodor alcoholic drinks [69]. This study shows how being un-able to serve food required by the group members limitfarmers ability to participate in gbisa and how this nega-tively affects access to labour, food production and hencefood security. Reciprocal groups can also be organised forother purposes [71]. Among the Ngbaka such groups canplay a role in capital accumulation and enhancement offood security.Research has dealt with the relationship between ac-
cess to social networks and children’s nutritional statusand has found that participation, especially in largenetworks, is positively associated with child nutrition[72, 73]. Whereas these studies deal with how social net-works can enhance mothers’ access to health advice, ourstudy shows how networks in the form of inter-household cooperation may facilitate households’ accessto agricultural labour and capital.
The villageOur findings are in line with the literature that consideraccess to productive land to be one of the most import-ant factors determining household food security and thelandless to be vulnerable to food insecurity [74–76].Land availability is considered to be a problem in theDRC and although there is a great potential to cultivateland in the DRC, farmers report difficulties in accessingland [36]. Quantitative studies have also found that ac-cess to agriculture land plays a role in determining chil-dren’s nutritional status and that children of agriculturalworkers are more likely to be malnourished than thoseof land owners [77, 78].
The local NGOAs in many other areas in the DRC where public socialservices are minimal, an NGO delivers services inBwamanda [37, 79, 80]. Our study indicates that thewell-off had better access than the poor to the limitedservices that existed. Food insecurity and malnutritionis, as in other rural areas in the DRC, to a large extentrelated to distal factors including the government beingunable to deliver basic services to rural areas such asagricultural support, infrastructure development, health,access to clean drinking water and education [35]. Otherscholars have also demonstrated how macro-relationsdetermine the development of severe child malnutrition.For example, an ethnographic account from rural Tanzaniaexamined how fluctuations in the world economy, landshortage, population growth, social stratification and mar-ginalisation were among the driving forces behind severemalnutrition [81].
Kismul et al. International Journal for Equity in Health (2015) 14:47 Page 11 of 14

Social inequality in malnutritionThe literature has linked social determinants of malnu-trition to income-related inequalities and documentspro-rich disparities in nutrition [12, 14, 82]. Householdincome and food prices are also closely related to foodsecurity. It has been shown that an inability to accessfood was largely determined by a low ability to purchasefood rather than by local food production [83, 84]. How-ever, since subsistence agriculture is the major livelihoodin rural DRC, food security and inequalities in childnutrition is closely related to people’s capacity to pro-duce enough nutritious food [36]. Research has identi-fied maternal education, emphasising the importance ofeducation higher than primary school, as one of themain factors that benefit child nutrition [14, 17, 18, 20].Since many women in the study area were illiterate andfew had education above primary level [85] we anticipatethat maternal education had limited implications for inter-household differences in nutrition. Several studies fromsub-Saharan Africa have investigated intra-household in-equalities in the form of gender differences, but conclu-sions from these studies are contradictory [30–33]. Ourfield observations and discussions did not point towardsany gender-based discrimination in food allocation and astudy from Bwamanda did not find significant differencesin nutritional status between girls and boys [51].
Strengths and limitationsStudies on social inequality in malnutrition analyseDemographic and Health Survey (DHS) and LivingStandards Measurement Study (LSM) data. Using datafrom a large number of low and middle-income coun-tries research has been able to investigate the presenceof and compared national and regional differences insocio-economic inequalities in malnutrition [15, 82, 86].DHS and LSM apply a standard questionnaire approachon a set of predetermined variables and proxies forsocio-economic status may not be representative forrural areas where people predominantly depend on agri-culture [15, 87, 88]. This study has used different quali-tative methods to gather open-ended information abouta specific rural setting and our analysis has uncoveredlinks between local social organisation and inequalitiesin nutrition. Our study uses few cases but the findingsmight be transferable to other population in a similarcontext in the DRC. The variables that we have identi-fied may be applied in quantitative studies that can cre-ate quantitative evidence of the relation between thevariables and nutritional outcomes in rural areas similarto Bwamanda. The combination of several methodsincluding participant observation, semi-structured inter-views and key informant interviews strengthens ourstudy. By combining these methods we have managedto reveal how household organisation, inter-household
cooperation, access to land, capital and social servicesrelate to food security and nutrition. Data collection wascarried out during three relatively short field work pe-riods and continuing data collection with longer periodswe could probably have gained new insights in social as-pects of nutrition. We are well aware that our findingsare based on a small sample and the results should becarefully interpreted when applied to other settings inthe DRC. We therefore realise that social factors withimplications for the development of kwashiorkor aresomewhat ambiguous, and if we had included morekwashiorkor cases, the social etiology of this disease mayhave become clearer. The use of an interpreter and nottranscribing the interviews also represent weaknesses ofthe study.
ConclusionsResources vital for food productions were associatedwith four social fields and access to these resources wasunequally distributed creating social inequality in nutri-tional outcomes. Households could, by mobilising localinstitutions for inter-household cooperation, improvetheir food security. Children living in households wherethere was a great pressure on productive members wereat risk of food insecurity and at danger of developingmalnutrition. It is important that nutritional programmesinvolve institutions for inter-household cooperation to fur-ther improve food security and nutritional outcomes.These initiatives should address the problem of inequalitiesin service provision and making accessible social servicesthat can improve food security and child nutrition inhouseholds with few resources in the form of labour, landand capital.
Competing interestsThe authors declare they have no competing interests.
Authors’ contributionsHK wrote the first draft of the manuscript. KMM supervised data analysis andresults reporting. All other authors edited the manuscript and contributed tointerpretation of the results. Van den Broeck died in 2014. All the other authorsread and approved the final manuscript. HK initiated and conducted theBwamanda household case study.
AcknowledgementThe work was supported by the Centre for International Health, Universityof Bergen.
Author details1Centre for International Health, University of Bergen, 5009 Bergen, Norway.2Fafo, Box 2947, Tøyen, 0608 Oslo, Norway. 3Department of Geography,University of Bergen, 5020 Bergen, Norway. 4School of Public Health,University of Kinshasa, Kinshasa 1, Democratic Republic of Congo.
Received: 5 May 2014 Accepted: 15 May 2015
References1. Black RE, Victora CG, Walker SP, Bhutta ZA, Christian P, de Onis M, et al.
Maternal and child undernutrition and overweight in low-income andmiddle-income countries. Lancet 2013, 382:427-451.
Kismul et al. International Journal for Equity in Health (2015) 14:47 Page 12 of 14
2. Talbert A, Thuo N, Karisa J, Chesaro C, Ohuma E, Ignas J, et al. Diarrhoeacomplicating severe acute malnutrition in Kenyan children: a prospectivedescriptive study of risk factors and outcome. PloS One. 2012;7.
3. Briend A. Kwashiorkor: still an enigma – the search must go on. Departmentof Nutrition, Exercise and Sports, Faculty of Science: Copenhagen; 2014.
4. Grantham-McGregor S, Cheung YB, Cueto S, Glewwe P, Richter L, Strupp B,et al. Child development in developing countries 1 - Developmentalpotential in the first 5 years for children in developing countries.Lancet. 2007;369:60–70.
5. Walker SP, Wachs TD, Grantham-McGregor S, Black MM, Nelson CA, Huffman SL,et al. Child development 1 inequality in early childhood: risk and protectivefactors for early child development. Lancet. 2011;378:1325–38.
6. Nyaradi A, Li JH, Hickling S, Foster J, Oddy WH. The role of nutrition inchildren’s neurocognitive development, from pregnancy throughchildhood. Front Hum Neurosci. 2013;7.
7. Prado EL, Dewey KG. Nutrition and brain development in early life. Nutr Rev.2014;72:267–84.
8. Bellamy C. The State of the World’s children 1998: focus on nutrition.Geneva: In Oxford University Press for UNICEF; 1998.
9. Marmot M, Wilkinson RG. Social determinants of health. 2nd ed. London:Oxford University Press; 2006.
10. Marmot M, Friel S, Bell R, Houweling TAJ, Taylor S, Hlt CSD. Closing the gapin a generation: health equity through action on the social determinants ofhealth. Lancet. 2008;372:1661–9.
11. Wagstaff A, Van Doorslaer E, Watanabe N. Socioeconomic inequalities inchild malnutrition in the developing world. In: Research Working Paper No2434. Washington: The World Bank; 2000.
12. Zere E, McIntyre D. Inequities in under-five child malnutrition in South Africa. IntJ Equity Health. 2003;2:7.
13. Van de Poel E, Hosseinpoor AR, Jehu-Appiah C, Vega J, Speybroeck N.Malnutrition and the disproportional burden on the poor: the case ofGhana. Int J Equity Health. 2007;6.
14. Hong R. Effect of economic inequality on chronic childhood undernutritionin Ghana. Public Health Nutr. 2007;10:371–8.
15. Smith LC, Ruel MT, Ndiaye A. Why is child malnutrition lower in urban thanin rural areas? Evidence from 36 developing countries. World Dev.2005;33:1285–305.
16. Ortiz J, Van Camp J, Wijaya S, Donoso S, Huybregts L. Determinants of childmalnutrition in rural and urban Ecuadorian highlands. Public Health Nutr.2014;17:2122–30.
17. Fotso JC. Child health inequities in developing countries: differences acrossurban and rural areas. Int J Equity Health. 2006;5:9.
18. Fotso JC. Urban–rural differentials in child malnutrition: trends andsocioeconomic correlates in sub-Saharan Africa. Health Place.2007;13:205–23.
19. Menon P, Ruel MT, Morris SS. Socio-economic differentials in child stuntingare consistently larger in urban than rural areas: analysis of 10 DHS data sets.Faseb J. 1999;13:A543–3.
20. Kumar A, Kumari D. Decomposing the Rural–urban Differentials in ChildhoodMalnutrition in India, 1992–2006. Asian Popul Stud. 2014;10:144–62.
21. Hazell P, Poulton C, Wiggins S, Dorward A. The future of small farms:trajectories and policy priorities. World Dev. 2010;38:1349–61.
22. Pinstrup-Andersen PW D. Food policy in developing countries: the role ofgovernment in global, National, and local food systems. New York: CornellUniversity Press; 2011.
23. FAO. The State of food insecurity in the world. Strengthening the enablingenvironment for food security and nutrition. Rome: Food and AgricultureOrganization of the United Nations; 2014.
24. Davis B, Di Giuseppe S, Zezza A. Income diversification patterns in rural Sub-Saharan Africa. Reassessing the evidence. World Bank: Washington; 2014.
25. Gillespie S, Harris J. The agriculture-nutrition disconnect in India. Washington:The International Food Policy Research Institute (IFPRI); 2012.
26. Sen A, Sengupta S. Malnutrition of rural children and the Sex bias. EconPolit Wkly. 1983;18:855.
27. Messer E. Intra-household allocation of food and health care: current findingsand understandings - introduction. Soc Sci Med. 1997;44:1675–84.
28. Pal S. An analysis of childhood malnutrition in rural India: role of gender,income and other household characteristics. World Dev. 1999;27:1151–71.
29. Moestue H. Can anthropometry measure gender discrimination? An analysisusing WHO standards to assess the growth of Bangladeshi children. PublicHealth Nutr. 2009;12:1085–91.
30. Klasen S. Nutrition, health and mortality in sub-Saharan Africa: Is there agender bias? J Dev Stud. 1996;32:913–32.
31. Garenne M. Sex differences in health indicators among children in AfricanDHS surveys. J Biosoc Sci. 2003;35:601–14.
32. Wamani H, Astrøm AN, Peterson S, Tumwine JK, Tylleskär T. Boys are morestunted than girls in Sub-Saharan Africa: a meta-analysis of 16 demographicand health surveys. BMC Pediatr. 2007;7:17.
33. Ndiku M, Jaceldo-Siegl K, Singh P, Sabate J. Gender inequality in food intakeand nutritional status of children under 5 years old in rural Eastern Kenya.Eur J Clin Nutr. 2011;65:26–31.
34. du Plan M. DRC: Enquête Démographique et de Santé RépubliqueDémocratique du Congo 2013 2014. Kinshasa: Ministère du Plan etSuivi de la Mise en oeuvre de la Révolution de la Modernité, Ministèrede la Santé Publique et ICF International; 2014.
35. Kandala NB, Madungu TP, Emina JBO, Nzita KPD, Cappuccio FP. Malnutritionamong children under the age of five in the Democratic Republic ofCongo (DRC): does geographic location matter? BMC Public Health. 2011;11.
36. WFP. Comprehensive food security and vulnerability analysis democraticrepublic of Congo. Rome: World Food Programme (WFP); 2014.
37. Weijs B, Hilhorst D, Fer A. Livelihoods, basic services and social protection inDemocratic Republic of the Congo. In Wageningen working paper.Wageningen: Wageningen University; 2012.
38. Van Herp M, Parque V, Rackley E, Ford N. Mortality, violence and lack ofaccess to health-care in the Democratic Republic of Congo. Disasters.2003;27:141–53.
39. Yanagisako SJ. Family and household - analysis of domestic groups. AnnuRev Anthropol. 1979;8:161–205.
40. FAO. The State of Food and Agriculture Innovation in family farming. Rome:Food and Agricultural Organiazation of the United Nation (FAO); 2014.
41. World B. Democratic Republic of the Congo: poverty reduction strategypaper. The World Bank: Washington; 2013.
42. Rossi L, Hoerz T, Thouvenot V, Pastore G, Michael M. Evaluation of health,nutrition and food security programmes in a complex emergency: the caseof Congo as an example of a chronic post-conflict situation. Public HealthNutr. 2006;9:551–6.
43. UNDP. Human development index and its components. New York UnitedNations Development Programme (UNDP): In UNDP Human DevelopmentReport; 2014.
44. Coghlan B, Brennan R, Ngoy P, Dofara D, Otto B, Clements M, et al. Mortalityin the Democratic Republic of Congo: a nationwide survey. Lancet.2006;367:44–51.
45. Larmer M, Laudati A, Clark JF. Neither war nor peace in the DemocraticRepublic of Congo (DRC): profiting and coping amid violence and disorder.Rev Afr Polit Econ. 2013;40:1–12.
46. UNDP. Province de l’Equateur. Profile Resume. Pauvrete et Conditions de Viedes Menages. United Nations Development Programme: Kinshasa; 2009.
47. du Plan M. DRC: Enquête Démographique et de Santé RépubliqueDémocratique du Congo 2007. Ministère du Plan avec la collaboration duMinistère de la Santé: Kinshasa; 2008.
48. Maest V. Les Ngbaka du centre de L’Ubangi. Peres O.F.M. Capucins:Gemena; 1997.
49. Van den Broeck J. Assessment of child health and nutrional status in a ruraltropical area. Leuven, Belgium: Khatolike Universiteit Leuven, Department ofPaedriatrics; 1994.
50. Henrix M. Le Mariage et La Naissance Chez Les Ngbaka Minagende (Rdc).Annales Aequatoria. 2009;30:653–99.
51. Kismul H, Schwinger C, Chhagan M, Mapatano M, Van den Broeck J. Incidenceand course of child malnutrition according to clinical or anthropometricalassessment: a longitudinal study from rural DR Congo. BMC Pediatr. 2014;14:22.
52. Kismul H, Van den Broeck J, Lunde TM. Diet and kwashiorkor: a prospectivestudy from rural DR Congo. Peer J. 2014;2, e350.
53. Schwinger C, Lunde TM, Andersen P, Kismul H, Van den Broeck J. Seasonaland spatial factors related to longitudinal patterns of child growthBwamanda, DR Congo. Earth Perspectives. 2014;1:26.
54. Calhoun C, Moody J, Pfafff S, Virk S. Contemporary sociological theory.Oxford: Blackwell; 2007.
55. Grønhaug R. Micro–macro relations: social organization in Antalya.Department of Social Anthropology.: Bergen; 1974.
56. Grønhaug R. Scale as a variable i analaysis: fields in social organisation inHerat, northwest Afghanistan. In Scale and social organisation: OsloUniversitetsforlaget; 1978.
Kismul et al. International Journal for Equity in Health (2015) 14:47 Page 13 of 14
57. Toje H, Ødegaard CV. Migration and territorialisation (in Norwegian). Norskantropologisk tidsskrift. 2010;21:223–38.
58. Sahlins MD. Land-use and the extended family in Moala, Fiji. Am Anthropol.1957;59:449–62.
59. Netting RM. Household Organization - and Intensive Agriculture - the KofyarCase. Africa. 1965;35:422–9.
60. Chayanov AV. The theory of peasant ecomomy. The American EconomicAssociation: Homewood; 1966.
61. Sahlins MD. Stone-age economics. New York: Adline de Gruyter; 1972.62. Hien NN, Kam S. Nutritional status and the characteristics related to
malnutrition in children under five years of age in Nghean, Vietnam. J PrevMed Public Health. 2008;41:232–40.
63. Mahyar A, Ayazi P, Fallahi M, Javadi THS, Farkhondehmehr B, Javadi A.Prevalence of underweight, stunting and wasting among children inQazvin, Iran. Iran J Pediatr Soc. 2010;2:37–43.
64. Kavosi E, Hassanzadeh Rostami Z, Kavosi Z, Nasihatkon A, Moghadami M,Heidari M. Prevalence and determinants of under-nutrition among childrenunder six: a cross-sectional survey in Fars province, Iran. Int J Health PolicyManagement. 2014;3:71–6.
65. Fikadu T, Assegid S, Dube L. Factors associated with stunting amongchildren of age 24 to 59 months in Meskan district, Gurage Zone, SouthEthiopia: a case- control study. BMC Public Health 2014, 14. doi:10.1186/1471-2458-14-800.
66. FAO. The State of Food and Agriculture 2010 2011. Women in Agriculture.Closing the gender gap for development. In: The State of Food andAgriculture. Rome: Food and Agriculture Organization of the UnitedNations (FAO); 2011.
67. Saul M. Work Parties, Wages, and Accumulation in a Voltaic Village. Am Ethnol.1983;10:77–96.
68. Stone GD, Netting RM, Stone MP. Seasonality, Labor Scheduling, andAgricultural Intensification in the Nigerian Savanna. Am Anthropol.1990;92:7–23.
69. Manger LO. Communual labour in the Sudan. Bergen: University ofBergen; 1987.
70. Guillet D. Reciprocal Labor and Peripheral Capitalism in the Central Andes.Ethnology. 1980;19:151–67.
71. Erasmus CJ. Culture Structure and Process - the Occurrence andDisappearance of Reciprocal Farm-Labor. Southwestern J Anthropol.1956;12:444–69.
72. Moestue H, Huttly S, Sarella L, Galab S. ‘The bigger the better’–mothers’social networks and child nutrition in Andhra Pradesh. Public Health Nutr.2007;10:1274–82.
73. Favara M. “United We Stand Divided We Fall” Maternal Social Participationand Children’s Nutritional Status in Peru. Essex: World Bank and Universityof Essex; 2013.
74. Lang RMF, Almeida CCB, Taddei JADC. Food and nutrition safety of childrenunder two years of age in families of landless rural workers. Ciencia SaudeColetiva. 2011;16:3111–8.
75. Maxwell D, Wiebe K. Land tenure and food security: Exploring dynamiclinkages. Dev Change. 1999;30:825–49.
76. UNDP. Africa Human Development Report 2012. Towards a Food SecureFuture. New York: United Nations Development Programme (UNDP); 2012.p. 2012.
77. Victora CG, Vaughan JP. Land-Tenure Patterns and Child Health in SouthernBrazil - the Relationship between Agricultural Production, Malnutrition andChild-Mortality. Int J Health Serv. 1985;15:253–74.
78. Rousham EK. Socio-economic influences on gender inequalities in childhealth in rural Bangladesh. Eur J Clin Nutr. 1996;50:560–4.
79. Seay LE. Effective responses: Protestants, Catholics and the provision ofhealth care in the post-war Kivus. Rev Afr Polit Econ. 2013;40:83–97.
80. Leinweber AE. From devastation to mobilisation: the Muslim community’sinvolvement in social welfare in post-conflict DRC. Rev Afr Polit Econ.2013;40:98–115.
81. Howard M. Socioeconomic Causes and Cultural Explanations of ChildhoodMalnutrition among the Chagga of Tanzania. Soc Sci Med. 1994;38:239–51.
82. Van De Poel E, Hosseinpoor AR, Speybroeck N, Van Ourti T, Vega J.Socioeconomic inequality in malnutrition in developing countries. BullWorld Health Organ. 2008;86:282–91.
83. Misselhorn AA. What drives food insecurity in southern Africa? A meta-analysis of household economy studies. Global Environ Change Hum PolDimens. 2005;15:33–43.
84. Martin-Prevel Y, Becquey E, Tapsoba S, Castan F, Coulibaly D, Fortin S, et al.Food Price Crisis Negatively Affected Household Food Security and DietaryDiversity in Urban Burkina Faso. J Nutr. 2008;2012(142):1748–55.
85. Kismul H. Maternal education. Interviews with primary and secondaryteachers in Bwamanda and group disscussion involving well-respectedwomen. 2013.
86. Wagstaff A, Watanabe N. Socioeconomic inequalities in child malnutrition inthe developing world. In: Policy Research Working Paper, vol. 2434.Washington: World Bank; 2000.
87. Boerma JT, Sommerfelt AE. Demographic and health surveys (DHS):contributions and limitations. World Health Stat Q. 1993;46:222–6.
88. Grosh ME, Glewwe P. The World Bank’s living standards measurement studyhousehold surveys. J Econ Perspect. 1998;12:187–96.
Submit your next manuscript to BioMed Centraland take full advantage of:
• Convenient online submission
• Thorough peer review
• No space constraints or color figure charges
• Immediate publication on acceptance
• Inclusion in PubMed, CAS, Scopus and Google Scholar
• Research which is freely available for redistribution
Submit your manuscript at www.biomedcentral.com/submit
Kismul et al. International Journal for Equity in Health (2015) 14:47 Page 14 of 14
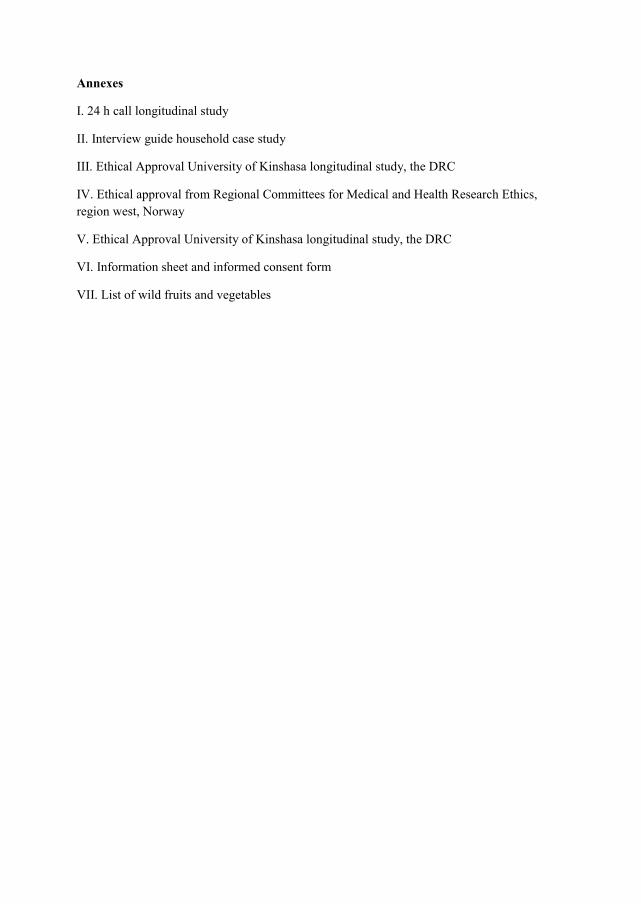
Annexes


I


II

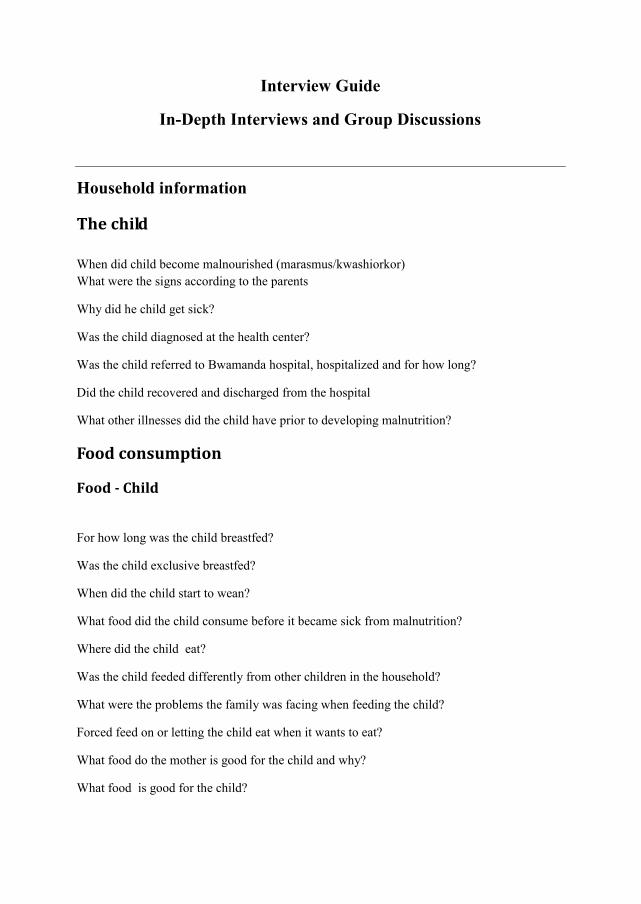
Interview Guide
In-Depth Interviews and Group Discussions
Household information
The child
Food consumption
Food - Child
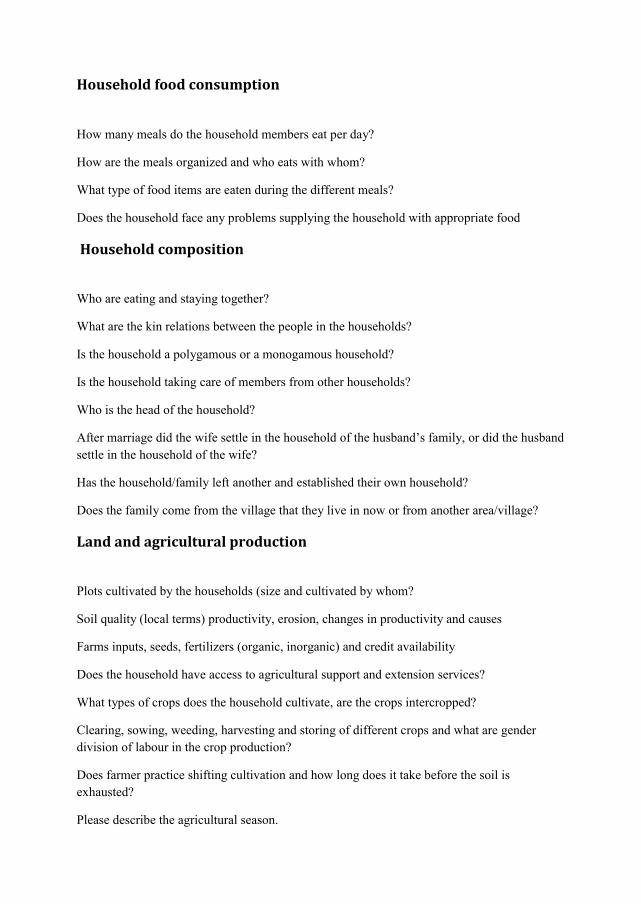
Household food consumption
Household composition
Land and agricultural production
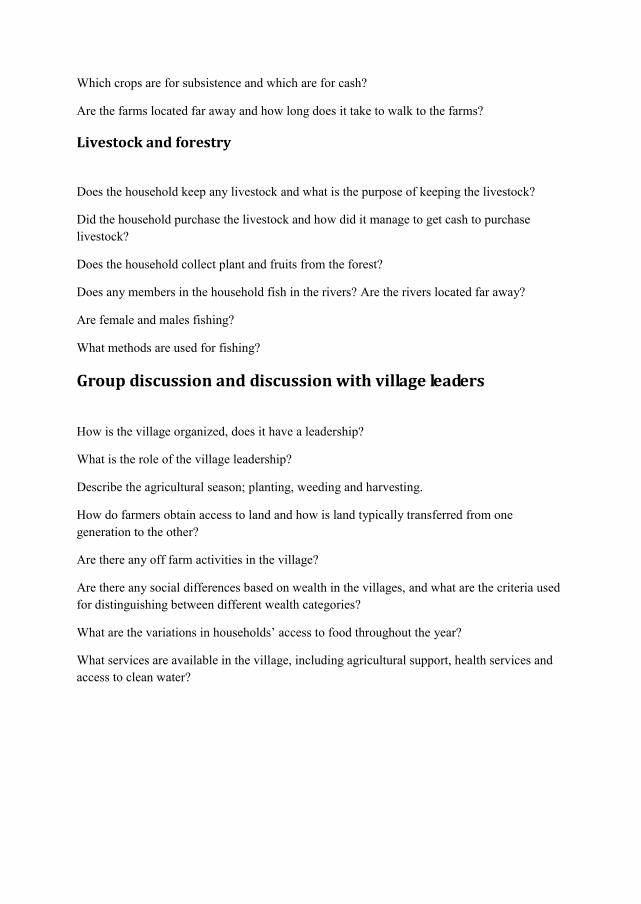
Livestock and forestry
Group discussion and discussion with village leaders


III


IV


V


VI


Informed consent form for local officials, village leaders and villagers invited to take part in the part in the research titled Household food strategies and malnutrition, Bwamanda DR Congo. A
Principle investigator: Hallgeir Kismul; Centre for International Health University of Bergen, Norway
Part I: Information sheet
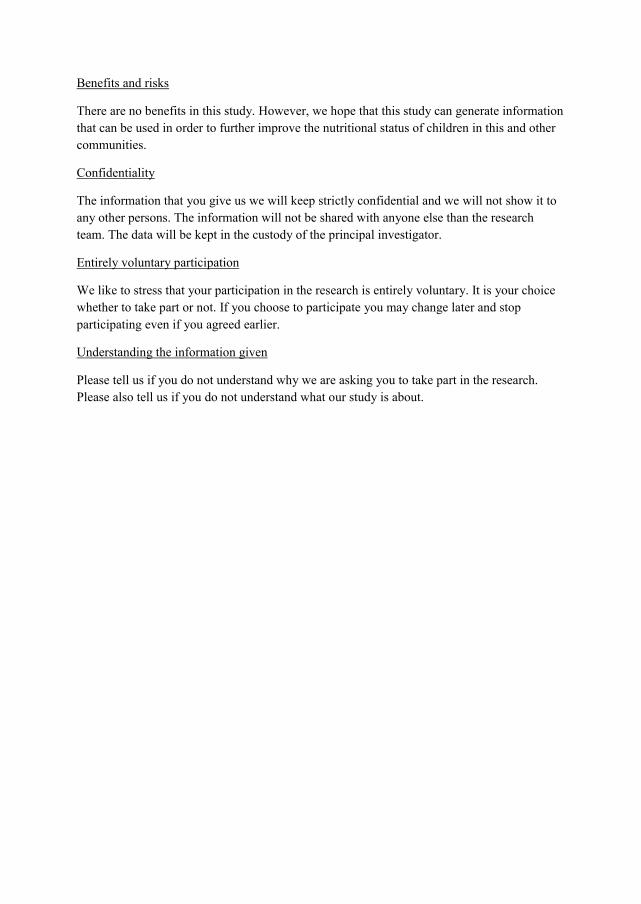

Part II: Certificate of consent
'


VII

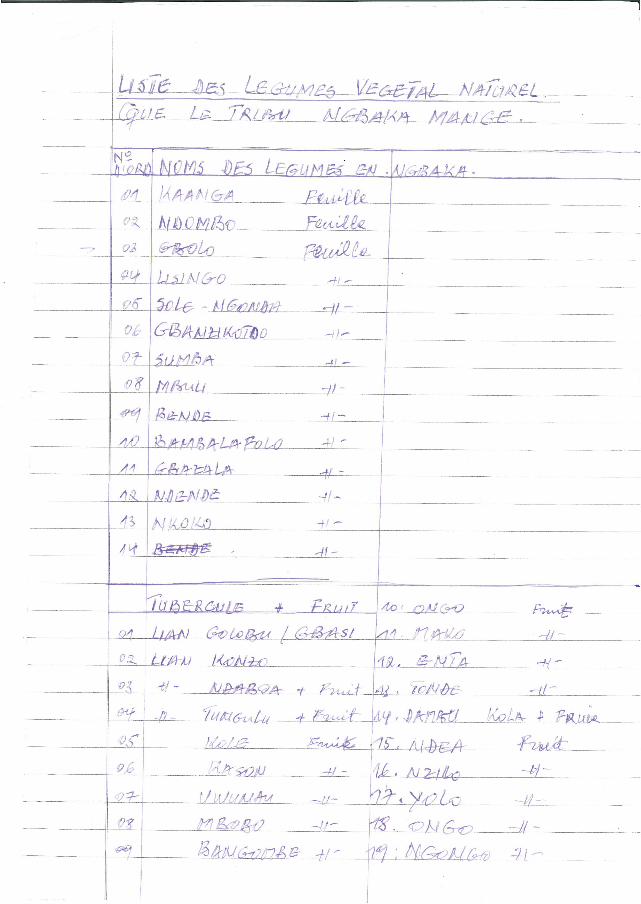

Related Documents