DETERMINANTS OF CAPITAL ADEQUACY OF COMMERCIAL BANKS IN KENYA FREDRICK AMBALE MUGWANG’A D61/80411/2012 A RESEARCH PROJECT REPORT SUBMITTED IN PARTIAL FULFILLMENT OF THE REQUIREMENTS FOR THE AWARD OF THE DEGREE OF MASTER OF BUSINESS ADMINISTRATION, SCHOOL OF BUSINESS, UNIVERSITY OF NAIROBI NOVEMBER 2014

Welcome message from author
This document is posted to help you gain knowledge. Please leave a comment to let me know what you think about it! Share it to your friends and learn new things together.
Transcript
DETERMINANTS OF CAPITAL ADEQUACY OF COMMERCIAL
BANKS IN KENYA
FREDRICK AMBALE MUGWANG’A
D61/80411/2012
A RESEARCH PROJECT REPORT SUBMITTED IN PARTIAL
FULFILLMENT OF THE REQUIREMENTS FOR THE AWARD OF THE
DEGREE OF MASTER OF BUSINESS ADMINISTRATION, SCHOOL OF
BUSINESS, UNIVERSITY OF NAIROBI
NOVEMBER 2014


iii
DEDICATION
This research project is a special dedication to my wife Beatrice K.B. Ambale and our children
Shantel, Patience ,Sydney, Prudence & Remson who had to put up with my late home arrivals
and who by the grace of God gave me a peace of mind so needed to accomplish my task.

iv
ACKNOWLEDGEMENT
I thank God for enabling me to complete this course. My special appreciation and gratitude to
my supervisor Dr. Fredrick Ogilo for the invaluable guidance, understanding and patience. He
indeed gave me the intellectual and moral support that made this research a success.
I acknowledge the university of Nairobi lecturers, especially those who took us through the
course work, the university librarians and MBA 2014 colleagues for their warm company in this
long journey. I also extend my utmost appreciation to my larger family members, Church and
colleagues at work for their encouragement provided throughout the study. Without your
cooperation & support , this study would not have been complete.
May God bless you all!
v
ABSTRACT
This study aimed at identifying the most important factors that determine Capital Adequacy of Commercial Banks in Kenya for the period 2009 – 2013 using Multiple Linear Regression Analysis and the Correlation Coefficient (Pearson Correlation). The target population comprised all registered commercial banks in Kenya in a five year period 2009 to 2013. Secondary data was used from Nairobi Securities Exchange for listed banks and management of banks that are not listed. Following the financial crisis of the 2007-2009, stringent regulatory measures, such as higher capital requirements have become more prominent as a move towards having stable and more competitive banking sector. Banks play a critical role in the allocation of society’s limited savings among the most productive investments, and they facilitate the efficient allocation of the risks of those investments. The study showed that there existed a significant relationship between capital adequacy and capital risk. There was no existence of a significant relationship between capital adequacy and the following: liquidity risk, credit risk, interest rate risk, return on assets ratio, return on equity ratio and revenue power ratio. As shown by the findings of the study, the liquidity risk, credit risk, capital risk, interest rate risk, return on asset ratio, return on equity ratio and revenue power ratio combined with a relatively high effect on the Capital Adequacy and the changes that occur within, as the percentage of the interpretation reached approximately eighty one percent. Since the P-value of the F-test is less than alpha, the overall conclusion of the study was that there is a significant relationship between the Liquidity Risky Assets, Credit Risks, Capital Risks, Interest Rate Risks, Return on Asset Ratio, Return on Equity Ratio and Revenue Power Ratio and Capital Adequacy. On this basis of the findings the study recommends that report of financial statements and data should include rules and basis on which capital adequacy measurement is based, which will lead to raising banking and finance awareness that will enhance banks competitive positions with regional and international banks.

vi
TABLE OF CONTENTS
Declaration..................................................................................................................................... ii
Dedication ..................................................................................................................................... iii
Acknowledgement ........................................................................................................................ iv
Abstract ...........................................................................................................................................v
List of tables................................................................................................................................ ix
List of Abbreviations .....................................................................................................................x
CHAPTER ONE: INTRODUCTION ..........................................................................................1
1.1 Background of the study ............................................................................................................1
1.1.1 Capital adequacy ................................................................................................................3
1.1.2 Determinants of capital adequacy ......................................................................................4
1.1.3 Commercial banks in Kenya ..............................................................................................5
1.2 Research problem .......................................................................................................................7
1.3 Research objectives ....................................................................................................................8
1.4 Value of the study ......................................................................................................................8
CHAPTER TWO: LITERATURE REVIEW ...........................................................................10
2.1 Introduction ..............................................................................................................................10
2.2 Theoretical review ...................................................................................................................10
2.2.1 Capital structure theory .....................................................................................................10
2.2.2 The capital buffer theory .................................................................................................11
2.2.3 Trade-off theory ................................................................................................................12
2.3 Determinants of capital adequacy ............................................................................................12
2.3.1 Liquidity risk .......................................................................................................................13
vii
2.3.2 Credit risk............................................................................................................................13
2.3.3 Capital risk ..........................................................................................................................14
2.3.4 Interest rate risk ...................................................................................................................15
2.3.5 Return on Assets .................................................................................................................15
2.3.6 Return on equity ..................................................................................................................16
2.3.7 Revenue power ratio ...........................................................................................................17
2.4 Empirical review ......................................................................................................................17
2.5 Summary of literature review ..................................................................................................19
CHAPTER THREE: RESEARCH METHODOLOGY ..........................................................20
3.1 Introduction ..............................................................................................................................20
3.2 Research Design.......................................................................................................................20
3.3 Population of the study ............................................................................................................20
3.4 Data collection .........................................................................................................................21
3.5 Data analysis ............................................................................................................................21
3.5.1 Analytical Model ...............................................................................................................21
3.5.2 Measurement of Variables ................................................................................................22
CHAPTER FOUR: DATA ANALYSIS RESULTS AND FINDINGS ...................................24
4.1 Introduction ..............................................................................................................................24
4.2 Regression analysis ..................................................................................................................24
4.2.1 Test of significance ...........................................................................................................25
4.2.2 Coefficients of the model ..................................................................................................27
viii
4.3 Interpretation of results ............................................................................................................28
CHAPTER FIVE: SUMMARY OF FINDINGS CONSLUSION AND
RECOMMENDATIONS .............................................................................31
5.1 Introduction ..............................................................................................................................31
5.2 Summary of findings................................................................................................................31
5.2.1 Liquidity risky assets ............................................................................................................31
5.2.2 Credit risk .............................................................................................................................32
5.2.3 Capital risk ...........................................................................................................................32
5.2.4 Interest rate risk ....................................................................................................................32
5.2.5 Return on asset ratio .............................................................................................................33
5.2.6 Return on equity ratio ..........................................................................................................33
5.2.7 Revenue power ratio ............................................................................................................33
5.3 Conclusions ..............................................................................................................................33
5.4 Recommendations ....................................................................................................................34
5.5 Suggestions for further studies.................................................................................................34
REFERENCES .............................................................................................................................35
APPENDICES ..............................................................................................................................40
Appendix 1: List of commercial banks in Kenya ......................................................................40

ix
LIST OF TABLES
4.1 Model summary of determinants of capital adequacy .............................................................25
4.2 ANOVA for determinants of capital adequacy ........................................................................26
4.3 Regression results on capital adequacy....................................................................................27

x
LIST OF ABBREVIATIONS
CAMEL Capital, Assets, Management Quality, Equity, Liquidity
CA Capital Adequacy
CAR Capital Adequacy Ratio
CBK Central Bank of Kenya
CPR Capital Risk
CR Credit Risk
IR Interest Rate Risk
KBA Kenya Bankers Association
KES Kenya Shillings
LR Liquidity Risk
NIM Net Interest Margin
NSE Nairobi Securities Exchange
ROA Return on Assets
ROE Return on Equity
RP Revenue Power
SFP Statement of Financial Position
SPSS Statistical Package for Social Scientists
1
CHAPTER ONE: INTRODUCTION
1.1 Background of the Study
Capital adequacy refers to amount of capital relative to a financial institution's loans and other
assets (Barsel II , 1988). It represents the most critical element of banks stability and solidarity
(Wen, 2010). Investors and stakeholders do not seem to understand what really determines
capital adequacy and why some banks do better than others (Ongore, 2012). In Kenya today
investors and stakeholders do not appear to understand what really determines capital adequacy
and why some banks perform better than others (Ongore, 2012). In an effort to promote
efficiency in the banking industry, to control weaknesses resulting from worldwide liberalization
and deregulation, the Basel Capital Accord of 1988 (Basel I) which led to the endorsement of a
new capital adequacy framework (Basel II) in 2004 (operational from 2007) marked the
beginning of a new phase of re-regulation with an attempt to bring about an international
harmonization of banking regulations (Bichsel and Blum, 2005). In assessing bank’s efficiency,
the level, nature and composition of capital and the cost income ratio are some of the key
measures used to determine performance of a bank (Bourke,1989). Kwan and Eisenbeis (1995)
and Hughes and Moon (1995) argued that it is necessary to recognize explicitly the concept of
efficiency in the empirical models linking bank capital to risk and to distinguish between
efficient and inefficient risk undertaking. There are conflicts in capital theories for example
Capital buffer theory encourages high capital while capital structure theory does not (Modigliani
and Miller, 1958).

2
Capital adequacy has been the focus of a number of theories and studies as it is considered to be
one of the main drivers of any financial institution’s profitability (Bourke, 1989; White and
Morrison, 2001). In contrast, some theories argue that in a world of perfect financial markets,
capital structure and hence capital regulation is irrelevant (Modigliani and Miller, 1958). As per
capital buffer theory, capital buffer is the excess capital a bank holds above the minimum capital
required. The capital buffer theory implicates that banks with low capital buffers attempt to
rebuild appropriate capital buffer by raising capital and banks with high capital buffers attempt to
maintain their capital buffer. This theory is relevant to this study because it explains why capital
adequacy is critical to commercial banks as per Marcus (1984) However, White and Morrison
(2001) posited that the regulator ensures that banks have enough of their own capital at stake.
There exist a conflict in the above theories hence this study. In measuring the profitability of a
bank, bank regulators and analysts have used Return On Assets (ROA) and return on equity
(ROE) to assess industry performance and forecast trends in market structure as inputs in
statistical models to predict bank failures and mergers and for a variety of other purposes where a
measure of profitability is desired (Gilbert and Wheelock, 2007; Mostafa, 2007; Christian et al.,
2008). Navapan and Tripe (2003) explained that comparing banks’ Returns On Equity (ROE) is
one way of measuring their performance relative to each other. The return on equity looks at the
return on the shareholder’s investment (Gilbert and Wheelock, 2007).
In Kenya, Central Bank of Kenya (CBK) increased the minimum capital requirement, aimed at
strengthening institutional structures and improving resilience of the banking industry In respect
to the international standards. According to the Banking Act (2008), every bank was expected to
maintain a minimum core capital of at least KES 1 billion (USD 12 million) by 2012. It was
3
further expected that the small banks that found difficulties raising their capital to the required
levels would be encouraged to merge (Kenya Finance Act, 2008 ). In line with the capital buffer
theory (Whalley, 2001) banks aim at holding more capital than required (i.e., maintaining
regulatory capital above the regulatory minimum) as insurance against breach of the regulatory
minimum capital requirement. The outline of the study is as follows: after the introduction, there
is the literature review, which is also followed by the methodology of the study.
1.1.1 Capital Adequacy
Capital is one of the bank specific factors that influence the level of bank profitability. Capital is
the amount of own fund available to support the bank's business and act as a buffer in case of
adverse situation (Athanasoglou et al., 2005). Banks capital creates liquidity for the bank due to
the fact that deposits are most fragile and prone to bank runs. Greater bank capital reduces the
chance of financial distress. Adequacy of capital is judged on the basis of capital adequacy ratio
(CAR). CAR ratio shows the internal strength of the bank to withstand losses during crisis as
sited by Dang (2011).
Prior to the 2007-2009 crisis the banking sector of many countries had built up excessive on and
off- statement of financial position (SFP) leverage that was accompanied by the gradual erosion
of the level and quality of the banks’ capital base (Bank of International Settlements (BIS),
(2009). As a result, the banking system was not able to absorb the resulting systemic trading and
credit losses nor could it cope with the re-intermediation of large off-SFP exposures that had
built up in the shadow banking system (BIS, 2009). Capital adequacy regulation is often viewed

4
as a buffer against insolvency crises, limiting the costs of financial distress by reducing the
probability of insolvency of banks. Irrespective of the viewpoint, a general consensus is that
banks with higher capital and liquidity buffers are better able to support businesses and
households in bad times since buffers enhance the capacity of banks to absorb losses and uphold
lending during a downturn (Barrell et al., 2009).
1.1.2 Determinants of Capital Adequacy
Capital adequacy ratio (CAR) is the ratio that is set by the regulatory authority in the banking
sector, and this ratio can be used to test the health of the banking system, this ratio has
mandatory requirement imposed by the state bank because this ratio ensures that the bank has the
ability to absorb the reasonable amount of losses (Brealey and Myers, 2003). Risk level is critical
as a determinant of capital adequacy. It is generally accepted that the capital is considered as
shock absorber, due to unexpected losses, which reducing the probability of the insolvency and
the cost of bankruptcy will be managed (Aggarwal and Jacques, 2001). A bank has many risks
that must be managed carefully, especially since a bank uses a large amount of leverage. Without
effective management of its risks, it could very easily become insolvent (Aburime, 2005).
Capital adequacy of previous period also plays a role as a determinant of capital adequacy. The
risk level of banking sector can be measure through the RWA (risk weighted assets/Total assets).
Banks face a number of risks in order to conduct their business, and how well these risks are
managed and understood is a key driver behind profitability, and how much capital a bank is
required to hold (Aburime, 2005). Risk level or size of assets do not fully describes the

5
adjustment costs, the capital of the previous period is one of the major factors which determine
adjustment cost. Banks are also required to disclose in their balance sheet the quantum of Tier I
and Tier II capital fund, under disclosure norms as per Basel I (1988). Huge capital holding
affect the profitability, efficiency and the effectiveness of operations of banks, while the lower
level of capital or insufficient funds make certain results to be negative (Rime, 2001). Capital
adequacy ratio is directly proportional to the resilience of the bank to crisis situations. It has also
a direct effect on the profitability of banks by determining its expansion to risky but profitable
ventures or areas (Sangmi and Nazir, 2010).
Alternative capital cost is a major component of CAR in the banking system and determinant of
Capital adequacy. ROE is a more suitable tool for the analysis of the alternative cost of capital,
when the cost of capital is low, then holding of excess capital than the regulatory requirements
does not effect on the profitability . A business that has a high return on equity is more likely to
be one that is capable of generating cash internally.ROE is the ratio of Net Income after Taxes
divided by Total Equity Capital ( Khrawish, 2011). As the rate of alternative cost of capital
increases there is willingness to decrease the holding more capital (Rime, 2001).
1.1.3 Commercial Banks in Kenya
Central Bank makes and enforces rules which govern the minimum capital requirement for
Kenyan banks and are based on the international standards developed by the Basel Committee.
In the year 2008, CBK reviewed the minimum capital requirements for commercial banks and
mortgage finance institutions with the aim of maintaining a more stable and efficient banking
6
and financial system. According to the Banking Act (2008) every institution was expected to
maintain:- A minimum core capital of at least KES 1 billion (USD 12 million) by 2012 , core
capital of not less than 8% of total risk adjusted assets plus risk adjusted off-SFP items, a core
capital of not less than 8% of its total deposit liabilities and a total capital of not less than 12% of
its total risk adjusted assets plus risk adjusted off-SFP items as per Kenya Banking act (2008)
The history of banking in Kenya dates back to the colonial period. British commercial banks
started operations in Kenya during 1890s. As Kenya became more and more part of this capitalist
world economy, the banks established themselves in the colony to provide services for financing
exports and imports (CBK, Kenya Bankers Association and Reuters 2009). Three British banks
dominated banking in colonial Kenya. The National Bank of India (later National and Grindlays
Bank) began operations in 1896. It was followed in 1910 by the Standard bank of South Africa
(later standard Bank and Standard Chartered), and shortly thereafter the national Bank of South
Africa entered the field. In 1925, the latter merged with two other British banks to form Barclays
Bank Dominion Colonial and overseas (later Barclays Bank) with a primary interest to finance
external trade. Kenyan financial services industry is dominated by the banking sector. During the
period 2007 – 2011, the Kenyan banking system showed resilience, which was attributed to the
low financial integration in the global financial market and the strict supervision and sound
regulatory reforms (Bank Supervision Annual Report 2009, 2010; IMF, 2009). According to the
Central Bank of Kenya the financial sector performance indicators with return on asset indicator
went up from 2.6 percent in 2007 to 4.4 percent in 2011 while the ratio of gross non-performing
loans to gross loans improving from 10.6 percent to 4.4 percent over the same period.

7
1.2 Research Problem
Investors and stakeholders do not appear to understand what really determines capital adequacy
and why some banks perform better than others (Ongore, 2012). There are conflicts in capital
theories, for example Capital buffer theory encourages high capital while Modigiliani and Miller
(1958) does not. In line with the capital buffer theory (Marcus, 1984, Milne and Whalley, 2001)
banks aim at holding more capital than required as insurance against breach of the regulatory
minimum capital requirement.
Banks with high capital buffers attempt to maintain their capital buffer. In contrast, some
theories argue that in a world of perfect financial markets, capital structure and hence capital
regulation is irrelevant (Modigliani and Miller, 1958) while in capital buffer theory, capital
buffer is the excess capital a bank holds above the minimum capital required.
Despite financial sector reforms and regulation by CBK for all financial institution with an aim
of improving profitability, efficiency and productivity, commercial banks’ determinants of
capital adequacy are still not understood by many investors (Mathuva , 2009). Nag and Das
(2002) studied the impact of capital requirement norms on flow of credit to the business sector
by public sector banks in India and found that in the post reform period, public sector banks shift
their portfolio in a way that reduced their capital requirements this did not capture determinants
of capital adequacy. A study conducted by Al-Tamimi (2013) on Commercial banks capital
adequacy in Jordan found out that there is negative non-significant relationship between capital
adequacy and capital risk. In a study conducted by Ogilo (2012) on Impact of credit risk

8
management on financial performance of commercial banks in Kenya , the study found out that
there is a strong impact between CAMEL components on financial performance of commercial
banks. Another study conducted by (Agoraki et al., 2011) found out that imposing high capital
requirements, banks will be constrained to some extent by competitive pressures, which would
occur due to competition on loans, deposits and even the sources of equity and debt investments.
Discussion in previous studies seem to have suggested a number of factors that may influence
the failure pattern of banks, bank products and management. There is little done on a model
designed on determinants of capital adequacy of commercial banks in Kenya. The study
attempted to address the following research question: What are the factors that determine capital
adequacy of commercial banks in Kenya ?
1.3 Research Objectives
To establish factors that determine capital adequacy of commercial banks in Kenya.
1.4 Value of the study
The findings of this study will be of great importance to the policy makers when making
policies touching on Capital. For regulators especially CBK , the findings will help them in their
efforts to monitor the commercial banks financial performance in relation to capital adequacy.
The study will as well assist the CBK as a regulator to know when there are distress symptoms
and to form measures to further securitize the banking system and restore depositor’s confidence.

9
It is hoped that the findings of this study will help the customers and investors to know whether
the banking system is performing better in terms of capital adequacy. The study results might
help different policy holders, either individuals or groups, in maintaining their investments and
achieving the highest possible return with the lowest possible risks. Furthermore the study will
provide financial organizations management with success and failure indicators. The study will
contribute to the Capital Buffer Theory by giving insight to what determines capital adequacy
and performance of commercial banks. The study will as well contribute to Trade Off Theory
and Theory of Moral Hazards by showing how determinants of capital adequacy affects
performance commercial banks while keeping in line with these theories.
The findings of the research will be helpful to other researchers and academicians who will carry
out related research and using the findings of this research to explore more on areas untapped
in this research. Finally public institution might benefit from this study through taking preventive
measures to avoid the occurrence of financial crisis affecting the national economy.

10
CHAPTER TWO: LITERATURE REVIEW
2.1 Introduction
This chapter provided theoretical and empirical information from publications on topics related
to the research problem.
2.2 Theoretical Review
This chapter reviewed literature which contains information related to area of study which
investigates the determinant of capital adequacy of commercial banks in Kenya. It involves
reviews of empirical studies, historical records, government reports and newspaper accounts.
This chapter also reviews literature on various theories and concepts that have been brought
forward by other scholars and researchers in the area of capital adequacy of commercial banks.
2.2.1 Capital Structure Theory
The fundamental concept of capital structure was introduced by Modigliani and Miller (1958), the
theory of capital structure was also introduced by Modigliani and Miller (1958). Capital structure
theory suggests the value a firm is irrelevant to the capital structure of a company. Whether the
is highly levered or has lower debt component , it has no bearing on its market value. The market
value of a firm is dependent on the operating profits of the company (Modigliani and Miller, 1958).

11
Capital structure which determines capital adequacy of a company is the way a company
finances its assets. A company can finance its operations by either debt or equity or different
combinations of these two sources. Capital structure of a company can have majority of debt
component or majority of equity , only one of the tow components or an equal mix of both debt
and equity. Each approach has its own set of advantages and advantages (Kwan and Eisenbeis ,
1995).
Capital structure theory has been used by many researchers in their theoretical and empirical
research on capital structure of financial or non-financial sectors. These studies are mainly
focused on the non-financial sector; only limited studies were previously conducted on the
capital structure of the financial sector and only few of them on the determinants of Capital
Adequacy Ratio (CAR) in banking sector especially in developing countries as per Bourke (1989).
2.2.2 The Capital Buffer Theory
In capital buffer theory, banks aim at holding more capital than recommended. Regulations
targeting the creation of adequate capital buffers are designed to reduce the procyclical nature of
lending by promoting the creation of countercyclical buffers (Milne & Whalley, 2001).
Moreover these regulations are designed to reduce the procyclical nature of lending by
promoting the creation of countercyclical buffers (Khawish, 2011).
The capital buffer is the excess capital a bank holds above the minimum capital required. The
capital buffer theory implicates that banks with low capital buffers attempt to rebuild an
12
appropriate capital buffer by raising capital and banks with high capital buffers attempt to
maintain their capital buffer. More capital tends to absorb adverse shocks and thus reduces the
likelihood of failure. Banks raise capital when portfolio risk goes up in order to keep up their
capital buffer as sighted by (Marcus, 1984) which appear to relate to determinant of capital
adequacy and performance of commercial banks.
2.2.3 Trade-Off Theory
The trade-off theory of capital structure refers to the idea that a company chooses how much debt
finance and how much equity finance to use by balancing costs and benefits. The classical
version of the hypothesis goes back to Kraus and Litzenberer (1973) who considered a balance
between the dead-weight costs of bankruptcy and tax saving benefits of debt. It states that there
is an advantage to financing with debt, the tax benefits of debt and there is a cost of financing
with debt, the costs of financial distress(Brealey and Myers, 2003). In order to generate an
“adequate” return on equity, commercial banks have to incur higher risks to receive higher risk
premium on their investments. Thus, increased risk requires greater proportions of equity in the
firm’s capital structure to prevent an inefficient cost of capital. The net effect of this negative
incentive effect and the buffer effect is ambiguous (Brealey and Myers, 2003).
2.3 Determinants of Capital Adequacy
The relationship between capital adequacy and other business factors guides the overall
performance of a bank (Heffernan , 1996). Profit is the ultimate goal of commercial banks. All
the strategies designed and activities performed thereof are meant to have a relationship that
13
realize this grand objective (Murthy and Sree, 2003;Alexandru et al., 2008). The determinants of
capital adequacy can be classified into bank specific (internal) and macroeconomic (external)
factors (Al-Tamimi, 2010; Aburime, 2005).
2.3.1 Liquidity Risk
Liquidity risks (LR) represented in those current and potential risks related to a bank profitability
and capital which result from bank inability to meet its obligations which incurred including the
inability to manage unexpected reductions or changes that might occur on market conditions and
affect the ability to liquidate assets rapidly and with the least possible losses in their values;
Liquidity risk is compounded when banks cannot forecast the demand on loans or deposits
withdrawal accompanied by its inability to reach new sources of money to cover these demands
(Abdelkareem & Salah, 2007).
Liquid assets are represented by cash at hand and at the central bank in addition to
cash at other banks or financial institutions, while total liabilities are represented by all short
and long-term liabilities such as demand deposits, time deposits, sawing deposits in addition to
borrowing processes from banks and financial institutions. This ratio reflects ability of bank
liquid assets in meeting withdrawal process by customer (depositors); In other words there is an
inverse relationship between liquidity risks and degree of capital adequacy (Heffernan , 1996).
2.3.2 Credit Risk
Credit risk (CR) refers to risks that originate as a result of a bank giving loans or credits to both

14
individuals and various economic sectors with its inability to get back its rights represented by
the loan principal and interests in the due date or being capable to pay it back but does not want
that, for different reasons, therefore risks are represented in losses that the bank might bear due
to customers inability or unwillingness to pay back the loan principal and its interests (Ruzaig &
Korthd, 2007).
This ratio measures the bank's ability to employ its cash in financial credits, and existing
literature shows the existence of an inverse relationship between credit risks and banking
credit. In other words, when credit risks are law, banking credits are high, which, in turn,
increases owner equity to risk assets ration as well as increased security margin in the face of
investment risks.
2.3.3 Capital Risk
Capital risks (CPR) represent the probability of the bank inability to meet its obligations, and this
occurs when there is a negative owners equity and net owners’ equity is determined by the
difference between assets market value and liability market value. Paid capital is the invested
capital, while risk weighted assets are all assets other than cash accounts in other banks and
financial institutions and this ratio measures the extent to which assets value decreases before
affecting depositors and owners funds. Capital risk usually occur when banks assets market value
drops to a level lower than banks liability market value (AL – Jinabi, 2005, p. 273) Furthermore,
banking and finance literature shows a close relationship between capital risks and capital
adequacy as expressed by owner's equity to risk weighted assets ratio. In other words the

15
increase of capital risks requires an in turn of capital adequacy to meet investment risks,
therefore, which intern requires the bank to increase owners’ equity to meet capital risk, there is
an inverse relationship between capital risks and capital adequacy (Ruzaig & Korthd, 2007).
2.3.4 Interest Rate Risk
Interest Rate Risk (IR) refers to risks resulting from interest rate fluctuations and might have a
negative effect on bank's capital and revenues as banks face these risks as part of being a
financial intermediaries (brokers), meaning that interest rates risks might involve a big threat to
its profits and capital, which requires a good interest rate management from the part of the
bank, through maintaining acceptable levels of interest rates (Heffernan , 1996). Interest rate
risks have multiple aspects, the most important of which different maturation dates against fixed
interest rate, pricing against variable interest rate for bank assets and liabilities its financial
centers, apart form its balance sheet (Abdelkareem & Salah, 2007).
Interest rate sensitive assets represent financial credits while liabilities represent customers, other
banks and financial institutions deposits at the bank as well as borrowed money by part of the
bank, meanwhile, existing literature showed an inverse relationship between interest rate risk and
capital adequacy (Heffernan , 1996).
2.3.5 Return on Assets
Return on Assets (ROA) represents all assets owned by the bank and their ability in
generating profits during a specific time period, in other words it explains the degree to which
16
the bank succeeds in investing its assets and its efficiency in directing them towards profitable
investment opportunities.
This ratio measures the management efficiency in using the available resources and its ability
in realizing revenues from funds or resources available from various financing resources,
therefore it reflects the effect of the bank financial and operation activities, meanwhile, this
ratio was employed as a measure of banks performance in several previous studies of, which
polios and Samuel (2000) study, and a direct relationship, between return on assets ratio and
Capital adequacy, was documented.
2.3.6 Return on Equity
Return on Equity (ROE) is a financial ratio that refers to how much profit a company earned
compared to the total amount of shareholder equity invested or found on the balance sheet
(Athanasoglou et al.,2005). ROE is what the shareholders look in return for their investment. A
business that has a high return on equity is more likely to be one that is capable of generating
cash internally. Thus, the higher the ROE the better the company is in terms of profit generation.
It is further explained by Khrawish (2011) that ROE is the ratio of Net Income after Taxes
divided by Total Equity Capital. It represents the rate of return earned on the funds invested in
the bank by its stockholders. ROE reflects how effectively a bank management is using
shareholders’ funds. Thus, it can be deduced from the above statement that the better the ROE
the more effective the management in utilizing the shareholders capital (Oloo, 2010).
17
2.3.7 Revenue Power Ratio
Revenue power ratio (RP) is based on the relationship between operations profits and assets
contributing to its realization, in measuring profitability, Revenue power is defined as the ability
of certain investment to generate a revenue in turn of its use, or it is the institution's ability to
generate profits for the use of its assets in its basic activity, put in other terms, it is the ratio of
operations profits to institution assets (Abu- Zeiter, 2006). This ratio is better than profits as a
measure for judging the institution efficiency, since profit is an absolute number that does not
indicate the realized investments, while revenue power finds out this relationship, which in turn
facilitates comparison with revenues from other time periods and institutions, in addition to
identifying that institutions Performance will take, it is also a measure of the institution's
operational performance efficiency, therefore, when it is computed, we should be confined on the
assets actually participating in the institution's typical operation along with profits generated
from operation of these assets before tax, and other expenditures and revues (Abu Zeiter, 2006).
Total revenues include credit interests, net commissions, profits of financial assets and tools, and
other operational revenues, in addition, literature indicates a positive relationship between
Revenue power ratio and capital adequacy (Abu- Zeiter, 2006).
2.4 Empirical Review
Bevan (2000) conducted a study that addressed commercial bank leverage (debtedness) and its
determinant factors in , Hungary ; where they expressed the dependent variable as Leverage, while bank
size, risky Assets, long term debts, short term debts and retained earnings, as independent ones. The study
indicated an inverse relationship between debtedness (Leverage) and each of risky assets, it also revealed

18
the importance of increasing commercial banks capital to safeguard or protect depositors funds against the
exposure to leverage risks (Bevan, 2000).
Al – Maleeji (2002) conducted a study aimed at developing an accounting model for judging the
Egyptian commercial banks and to establish a standard that includes various element needed to
assess capital adequacy, which reflects most of the risks facing commercial banks in general and
credit, inflation liquidity and market risks in particular. The study reheated that capital adequacy
established according to Basel banking decisions (1988) and Egyptian central bank decisions
(1991), are not effective, as well as the new framework for capital adequacy (Basel, 1999).
Berrospide et al. (2008) study which sought to find out the effects of companies finance policy
on their performance and value, focusing on the macroeconomics environment, using fixed
effects statistical analysis methods, the study revealed a direct relationship between book and
market values of the company, and security decisions with operational profits margin, Brazilian
currency derived contracts, capital expenditures, Monetary budgets, but no statistically
significant relationship between company size, sales growth rate with security banking decisions.
Barakat (2009) conducted a study which aimed at checking the extent to which (Basel 2)
standards requirement are applied by commercial banks operating in Jordan. Data was collected
through a questionnaire administered to more than (40) bank employees in Jordan. The study
revealed that all banks operating in Jordan applied basils standards, as well as the existence of
great differences in applying Basel 2 standards among local end foreign banks.
19
Mathuva (2009) study provides evidence that supports the Central Bank of Kenya`s move to
gradually raise bank capital levels by 2012 and to tightly monitor the operations of banks so as to
ensure that Kenyan banks are more efficient in their operations while at the same time being
profitable.
2.5 Summary of Literature Review
A general conclusion drawn from the body of literature above is that research on determinants of
capital adequacy and performance of commercial banks in developing countries has received
little attention despite rapid growth in this literature over the years. This is rather unfortunate
given the dominance of banking sector in the financial system in these countries including
Kenya.
Capital adequacy modeling has not been in the mainstream of econometric research into the
financial sector in Kenya. Analysis of the banking sector have so far focused on qualitative
assessment of growth trends and sectorial behavior patterns in the industry. Discussion in the
above mentioned studies has, for instance, suggested a number of factors that may influence the
failure pattern of banks, bank products and management. There has been few models designed on
determinants of capital adequacy of commercial banks in Kenya.

20
CHAPTER THREE: RESEARCH METHODOLOGY
3.1 Introduction
This chapter discussed the research design, population, data collection, data analysis and
analytical model. It further shows the data collection methods used, techniques and instruments.
3.2 Research Design
This study adopted a descriptive research design. Descriptive research is a process of collecting
data in order to test hypothesis or answer questions concerning the current status of the subject
matter that was used in this study. A descriptive survey design allows researchers to gather
information, summarize, present and interpret it for the purpose of clarification (Mugenda and
Mugenda, 1999).
3.3 Population of the Study
The target population comprised all registered commercial banks in Kenya in a five year period
2009 to 2013. The researcher chose this period because it has got a relatively normal business
environment while avoiding year 1997 and 1998 when there was post election violence in the
country. The commercial banks that comprised of the population are banks that operated in
Kenya registered and regulated by Central Bank of Kenya (CBK) and Kenya Bankers
Association (KBA).

21
3.4 Data Collection
Secondary data was used from NSE for listed banks and management of banks that are not
listed. The compulsory requirement of publishing listed companies financial reports made it easy
to obtain secondary data for the period 2009-2013 that was relevant for the study while special
requests were made to management of unlisted banks to provide the researcher with their
financial reports. All registered banks were approached.
3.5 Data Analysis
Linear regression analysis and correlation coefficient (person correlation) analysis was used to
identify factors that determine capital adequacy of commercial banks in Kenya . Statistical
Package for Social Sciences (SPSS) was used to aid in the data analysis.
3.5.1 Analytical Model The study will use Regression analysis and correlation Coefficient (Pearson Correlation).
CA = a + β 1 LR + β 2 CR + β 3 CPR + β 4 IR + β 5 ROA+ β 6 ROE + β 7 RP +ε Where; CA = Capital Adequacy
LR = Liquidity Risky Assets
CR = Credit Risks
CPR = Capital Risks
IR = Interest Rate Risks

22
ROA = Return On Assets Ratio
ROE = Return On Equity Ratio
RP = Revenue Power Ratio
ε = Error term
3.5.2 Measurement of Variables
CA: Capital Adequacy defined as awareness of and caution from various types of risks, that
might face commercial banks in their operational processes which represents the dependent
variable that can be expressed by the following equation as per Brealey and Myers (2003).
CA = Owner's equity risky ratio = Owners Equity
Risky Assets
LR = Current Liabilities
Total Liabilities
CR = Total Loans
Total Assets
CPR = Paid Capital
Risk Weight Assets

23
IR = Interest rate Sensitive Assets
Rate Sensitive Liability
ROA = Net Profit after Tax
Total Assets
ROE = Net Profit after Tax
Total Owners' Equity
RP = Total Revenues
Total Assets

24
CHAPTER FOUR: DATA ANALYSIS RESULTS AND FINDINGS
4.1 Introduction
This chapter reported major findings in the study as they relate to the research objective. The
research areas considered in this study were the analysis of determinants of capital adequacy of
commercial banks in Kenya. The study used secondary data contained in annual audited reports
in responding to the study objectives.
4.2 Regression Analysis
A regression analysis was conducted on Capital adequacy against determinants of capital
adequacy, which was proxied by liquidity risky assets, credit risk, capital risk, interest rate risk,
return on asset ratio return on equity ratio and revenue power. The regression equation was as
follows:
CA = a + β 1 LR + β 2 CR + β 3 CPR + β 4 IR + β 5 ROA+ β 6 ROE + β 7 RP +ε
25
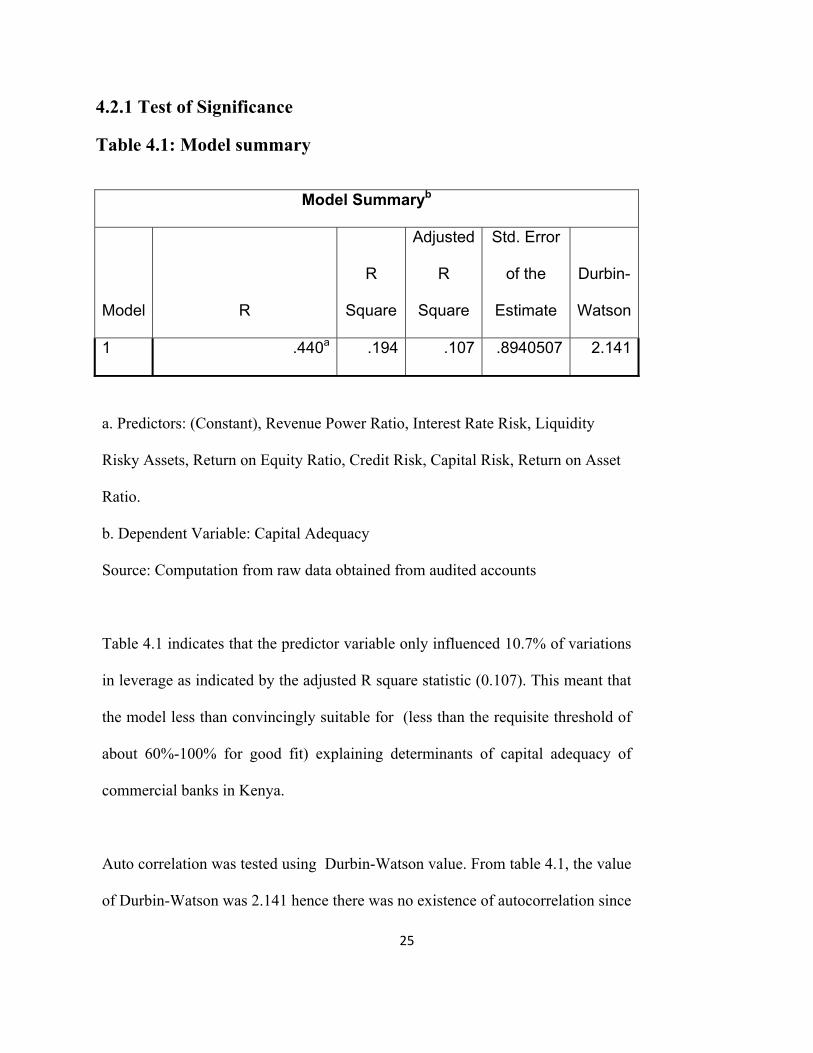
4.2.1 Test of Significance
Table 4.1: Model summary
Model Summaryb
Model R
R
Square
Adjusted
R
Square
Std. Error
of the
Estimate
Durbin-
Watson
1 .440a .194 .107 .8940507 2.141
a. Predictors: (Constant), Revenue Power Ratio, Interest Rate Risk, Liquidity
Risky Assets, Return on Equity Ratio, Credit Risk, Capital Risk, Return on Asset
Ratio.
b. Dependent Variable: Capital Adequacy
Source: Computation from raw data obtained from audited accounts
Table 4.1 indicates that the predictor variable only influenced 10.7% of variations
in leverage as indicated by the adjusted R square statistic (0.107). This meant that
the model less than convincingly suitable for (less than the requisite threshold of
about 60%-100% for good fit) explaining determinants of capital adequacy of
commercial banks in Kenya.
Auto correlation was tested using Durbin-Watson value. From table 4.1, the value
of Durbin-Watson was 2.141 hence there was no existence of autocorrelation since

26
the value was below the threshold for autocorrelation of 7.
Table 4.2: ANOVA for determinants of capital adequacy
ANOVAa
Model
Sum of
Squares df
Mean
Square F Sig.
1 Regression 12.498 7 1.785 2.234 .042b
Residual 51.956 65 .799
Total 64.455 72
a. Dependent Variable: Capital Adequacy.
b. Predictors: (Constant), Revenue Power Ratio, Interest Rate Risk, Liquidity Risky
Assets, Return on Equity Ratio, Credit Risk, Capital Risk, Return on Asset Ratio.
Source: Computation from raw data obtained from audited accounts
Significance test (F) on table 4.2 demonstrates the usefulness of overall regression model at a 5%
level of significance. Since the P-value of the F test is less than alpha it was concluded that there
was a significant relationship between the dependent and Independent variables used in the
study. Table 4.2 also clearly indicates that the regression only accounted for less than 12.498
(19.39 %) out of 64.455, the rest of the variations being accounted for by other factors external to
the model as indicated by sum of squares. Residual represents unexplained variation after fitting
a regression model.

27
4.2.2 Coefficients of the model
Table 4.3: Regression results on capital adequacy
Model
Unstandardized
Coefficients
Standardized
Coefficients
t Sig.
95.0%
Confidence
Interval for B
B
Std.
Error Beta
Lower
Bound
Upper
Bound
1 (Constant) -.637 .532 -1.198 .235 -1.699 .425
Liquidity Risky
Assets
.017 .100 .019 .167 .868 -.183 .216
Credit Risk .394 .323 .143 1.220 .227 -.251 1.040
Capital Risk 1.683 .617 .332 2.730 .008 .452 2.915
Interest Rate
Risk
-.008 .017 -.054 -.478 .635 -.042 .026
Return on Assets
Ratio
1.070 6.633 .021 .161 .872 -12.177 14.318
Return on Equity
Ratio
-.184 .181 -.124 -1.019 .312 -.546 .177
Revenue Power
Ratio
6.999 4.147 .213 1.688 .096 -1.282 15.280
a. Dependent Variable: Capital Adequacy
Source: Computation from raw data obtained from audited accounts.
28
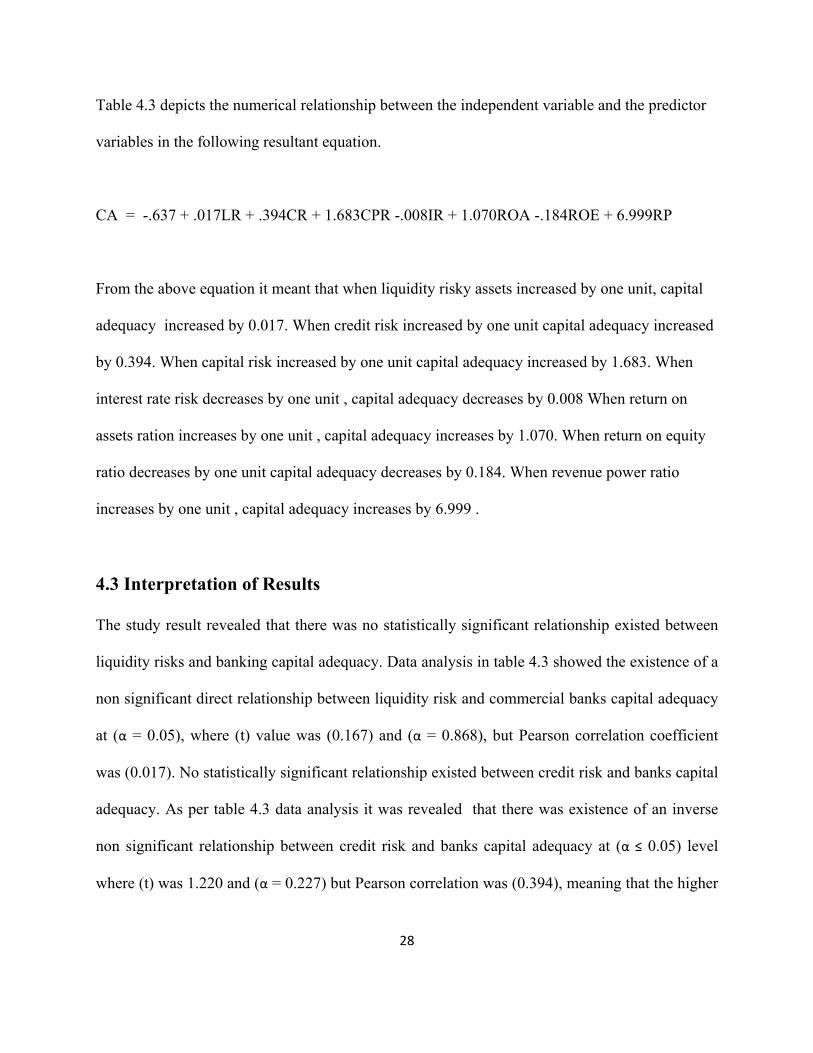
Table 4.3 depicts the numerical relationship between the independent variable and the predictor
variables in the following resultant equation.
CA = -.637 + .017LR + .394CR + 1.683CPR -.008IR + 1.070ROA -.184ROE + 6.999RP
From the above equation it meant that when liquidity risky assets increased by one unit, capital
adequacy increased by 0.017. When credit risk increased by one unit capital adequacy increased
by 0.394. When capital risk increased by one unit capital adequacy increased by 1.683. When
interest rate risk decreases by one unit , capital adequacy decreases by 0.008 When return on
assets ration increases by one unit , capital adequacy increases by 1.070. When return on equity
ratio decreases by one unit capital adequacy decreases by 0.184. When revenue power ratio
increases by one unit , capital adequacy increases by 6.999 .
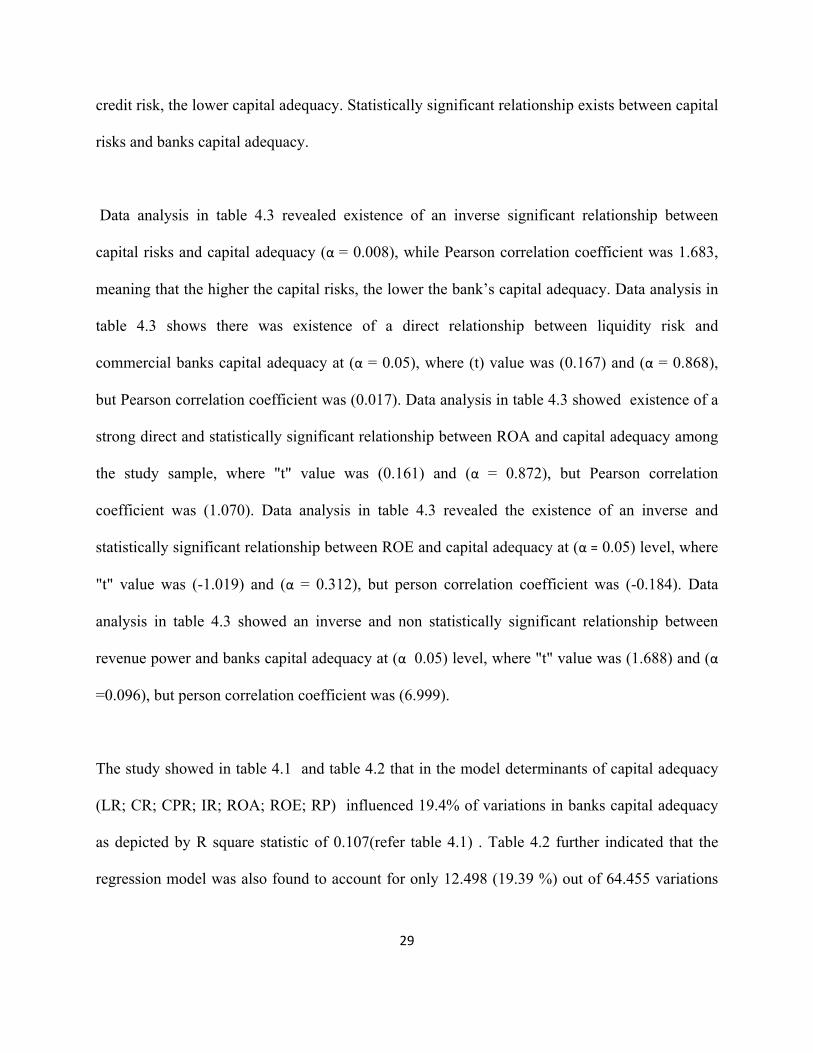
4.3 Interpretation of Results
The study result revealed that there was no statistically significant relationship existed between
liquidity risks and banking capital adequacy. Data analysis in table 4.3 showed the existence of a
non significant direct relationship between liquidity risk and commercial banks capital adequacy
at (α = 0.05), where (t) value was (0.167) and (α = 0.868), but Pearson correlation coefficient
was (0.017). No statistically significant relationship existed between credit risk and banks capital
adequacy. As per table 4.3 data analysis it was revealed that there was existence of an inverse
non significant relationship between credit risk and banks capital adequacy at (α ≤ 0.05) level
where (t) was 1.220 and (α = 0.227) but Pearson correlation was (0.394), meaning that the higher
29
credit risk, the lower capital adequacy. Statistically significant relationship exists between capital
risks and banks capital adequacy.
Data analysis in table 4.3 revealed existence of an inverse significant relationship between
capital risks and capital adequacy (α = 0.008), while Pearson correlation coefficient was 1.683,
meaning that the higher the capital risks, the lower the bank’s capital adequacy. Data analysis in
table 4.3 shows there was existence of a direct relationship between liquidity risk and
commercial banks capital adequacy at (α = 0.05), where (t) value was (0.167) and (α = 0.868),
but Pearson correlation coefficient was (0.017). Data analysis in table 4.3 showed existence of a
strong direct and statistically significant relationship between ROA and capital adequacy among
the study sample, where "t" value was (0.161) and (α = 0.872), but Pearson correlation
coefficient was (1.070). Data analysis in table 4.3 revealed the existence of an inverse and
statistically significant relationship between ROE and capital adequacy at (α = 0.05) level, where
"t" value was (-1.019) and (α = 0.312), but person correlation coefficient was (-0.184). Data
analysis in table 4.3 showed an inverse and non statistically significant relationship between
revenue power and banks capital adequacy at (α 0.05) level, where "t" value was (1.688) and (α
=0.096), but person correlation coefficient was (6.999).
The study showed in table 4.1 and table 4.2 that in the model determinants of capital adequacy
(LR; CR; CPR; IR; ROA; ROE; RP) influenced 19.4% of variations in banks capital adequacy
as depicted by R square statistic of 0.107(refer table 4.1) . Table 4.2 further indicated that the
regression model was also found to account for only 12.498 (19.39 %) out of 64.455 variations

30
in capital adequacy, with the majority of variations (in capital adequacy) being accounted for by
residual / other exogenous factors (80.61 % ).
31
CHAPTER FIVE: SUMMARY OF FINDINGS, CONCLUSIONS AND
RECOMMENDATIONS
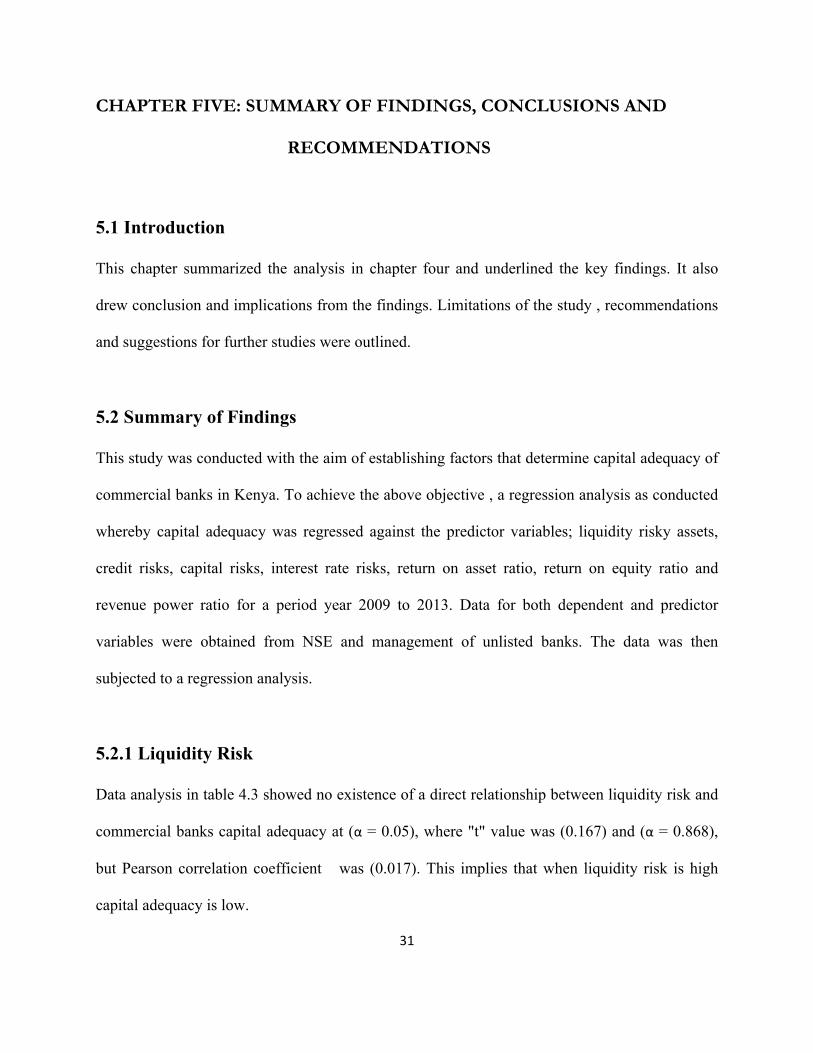
5.1 Introduction
This chapter summarized the analysis in chapter four and underlined the key findings. It also
drew conclusion and implications from the findings. Limitations of the study , recommendations
and suggestions for further studies were outlined.
5.2 Summary of Findings
This study was conducted with the aim of establishing factors that determine capital adequacy of
commercial banks in Kenya. To achieve the above objective , a regression analysis as conducted
whereby capital adequacy was regressed against the predictor variables; liquidity risky assets,
credit risks, capital risks, interest rate risks, return on asset ratio, return on equity ratio and
revenue power ratio for a period year 2009 to 2013. Data for both dependent and predictor
variables were obtained from NSE and management of unlisted banks. The data was then
subjected to a regression analysis.
5.2.1 Liquidity Risk
Data analysis in table 4.3 showed no existence of a direct relationship between liquidity risk and
commercial banks capital adequacy at (α = 0.05), where "t" value was (0.167) and (α = 0.868),
but Pearson correlation coefficient was (0.017). This implies that when liquidity risk is high
capital adequacy is low.
32
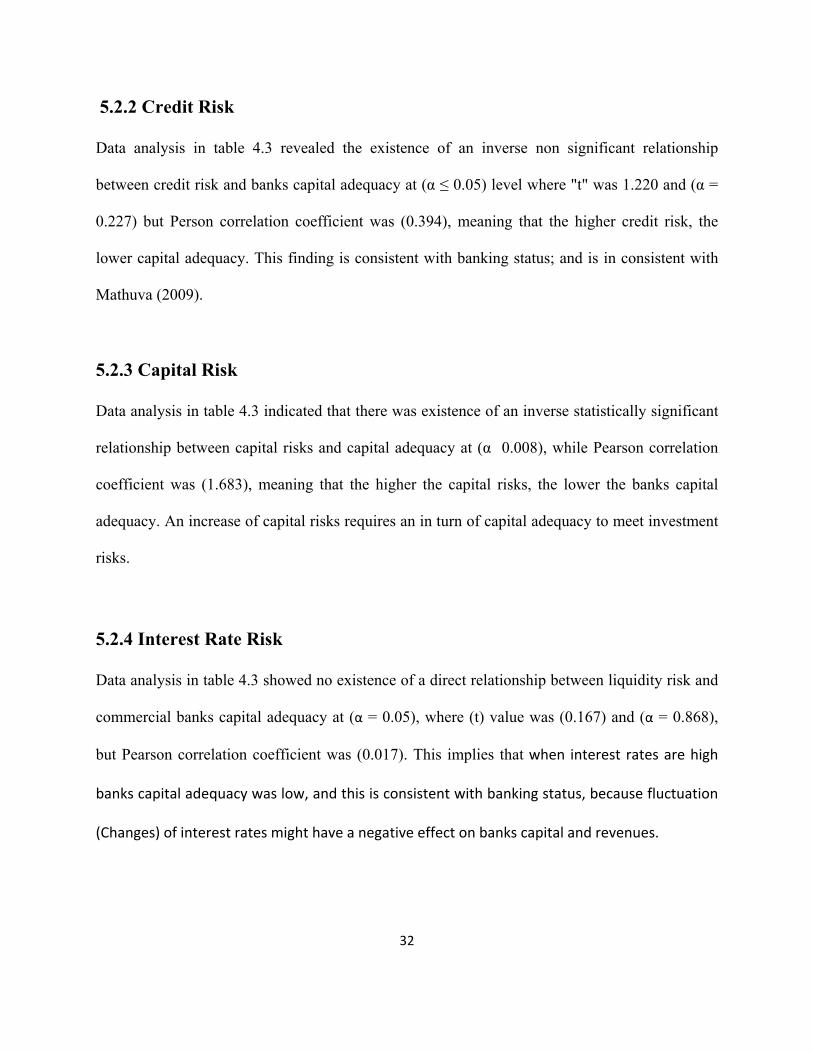
5.2.2 Credit Risk
Data analysis in table 4.3 revealed the existence of an inverse non significant relationship
between credit risk and banks capital adequacy at (α ≤ 0.05) level where "t" was 1.220 and (α =
0.227) but Person correlation coefficient was (0.394), meaning that the higher credit risk, the
lower capital adequacy. This finding is consistent with banking status; and is in consistent with
Mathuva (2009).
5.2.3 Capital Risk
Data analysis in table 4.3 indicated that there was existence of an inverse statistically significant
relationship between capital risks and capital adequacy at (α 0.008), while Pearson correlation
coefficient was (1.683), meaning that the higher the capital risks, the lower the banks capital
adequacy. An increase of capital risks requires an in turn of capital adequacy to meet investment
risks.
5.2.4 Interest Rate Risk
Data analysis in table 4.3 showed no existence of a direct relationship between liquidity risk and
commercial banks capital adequacy at (α = 0.05), where (t) value was (0.167) and (α = 0.868),
but Pearson correlation coefficient was (0.017). This implies that when interest rates are high
banks capital adequacy was low, and this is consistent with banking status, because fluctuation
(Changes) of interest rates might have a negative effect on banks capital and revenues.
33
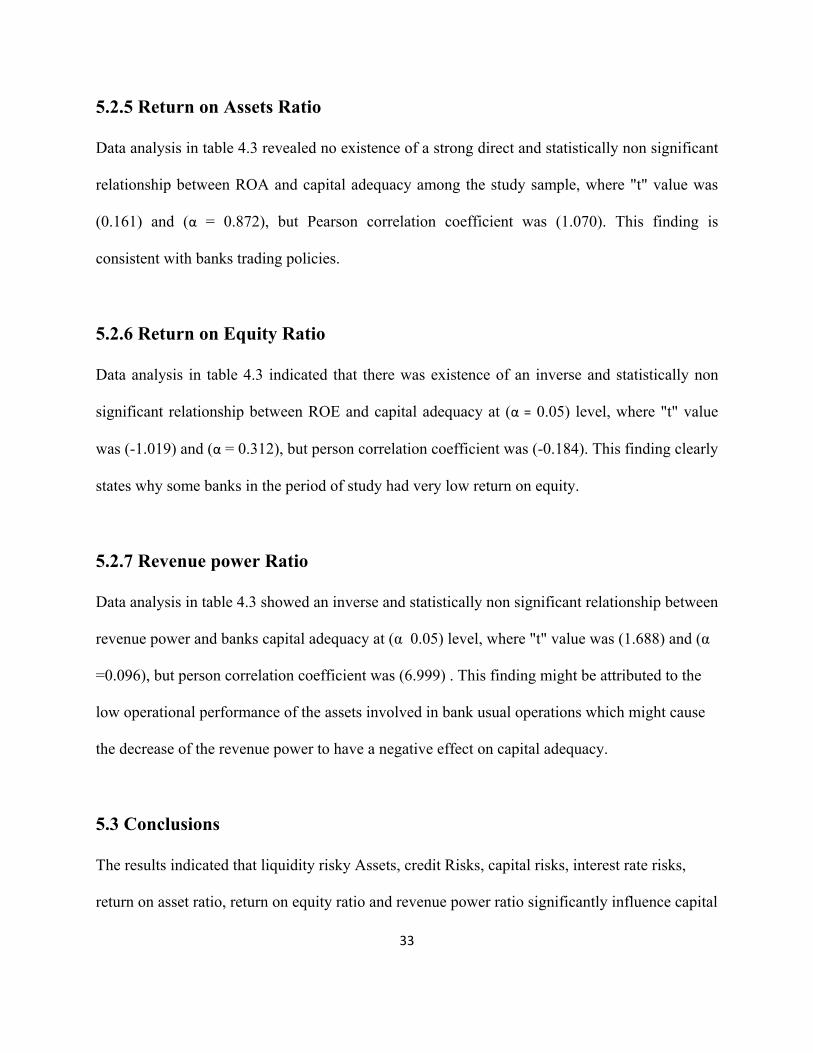
5.2.5 Return on Assets Ratio
Data analysis in table 4.3 revealed no existence of a strong direct and statistically non significant
relationship between ROA and capital adequacy among the study sample, where "t" value was
(0.161) and (α = 0.872), but Pearson correlation coefficient was (1.070). This finding is
consistent with banks trading policies.
5.2.6 Return on Equity Ratio
Data analysis in table 4.3 indicated that there was existence of an inverse and statistically non
significant relationship between ROE and capital adequacy at (α = 0.05) level, where "t" value
was (-1.019) and (α = 0.312), but person correlation coefficient was (-0.184). This finding clearly
states why some banks in the period of study had very low return on equity.
5.2.7 Revenue power Ratio
Data analysis in table 4.3 showed an inverse and statistically non significant relationship between
revenue power and banks capital adequacy at (α 0.05) level, where "t" value was (1.688) and (α
=0.096), but person correlation coefficient was (6.999) . This finding might be attributed to the
low operational performance of the assets involved in bank usual operations which might cause
the decrease of the revenue power to have a negative effect on capital adequacy.
5.3 Conclusions
The results indicated that liquidity risky Assets, credit Risks, capital risks, interest rate risks,
return on asset ratio, return on equity ratio and revenue power ratio significantly influence capital
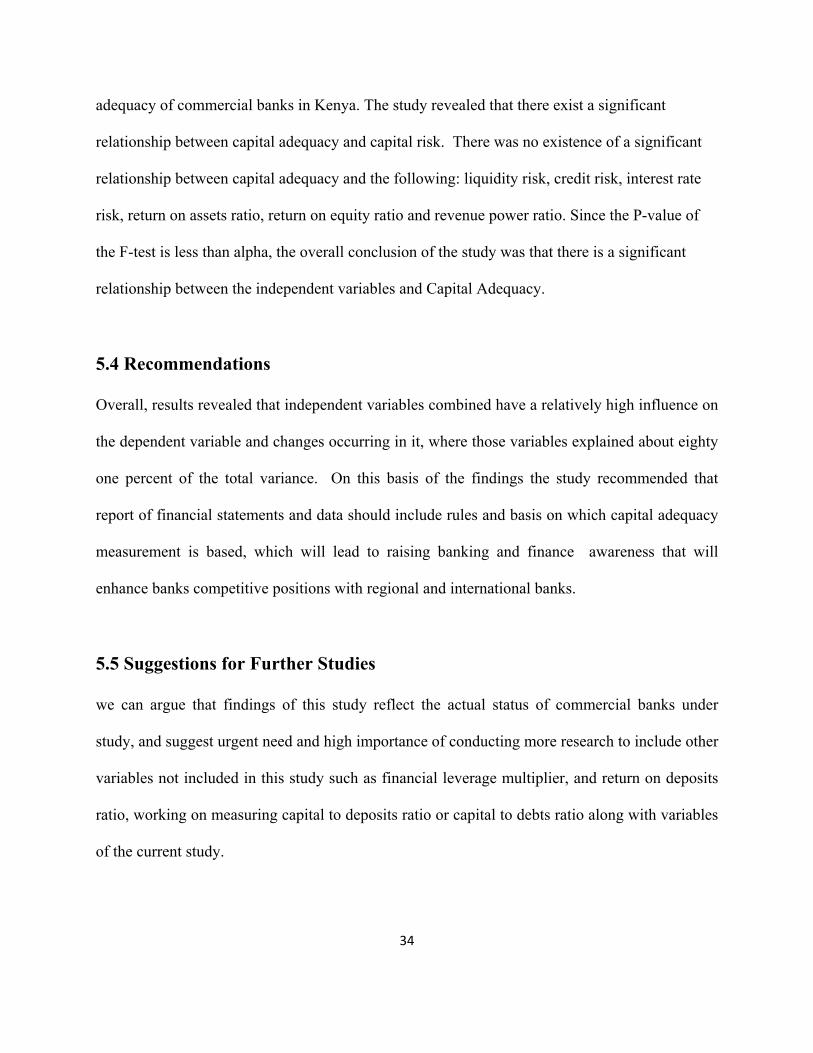
34
adequacy of commercial banks in Kenya. The study revealed that there exist a significant
relationship between capital adequacy and capital risk. There was no existence of a significant
relationship between capital adequacy and the following: liquidity risk, credit risk, interest rate
risk, return on assets ratio, return on equity ratio and revenue power ratio. Since the P-value of
the F-test is less than alpha, the overall conclusion of the study was that there is a significant
relationship between the independent variables and Capital Adequacy.
5.4 Recommendations
Overall, results revealed that independent variables combined have a relatively high influence on
the dependent variable and changes occurring in it, where those variables explained about eighty
one percent of the total variance. On this basis of the findings the study recommended that
report of financial statements and data should include rules and basis on which capital adequacy
measurement is based, which will lead to raising banking and finance awareness that will
enhance banks competitive positions with regional and international banks.
5.5 Suggestions for Further Studies
we can argue that findings of this study reflect the actual status of commercial banks under
study, and suggest urgent need and high importance of conducting more research to include other
variables not included in this study such as financial leverage multiplier, and return on deposits
ratio, working on measuring capital to deposits ratio or capital to debts ratio along with variables
of the current study.

35
REFERENCES
Aburime, U. (2005). Determinants of Bank Profitability: Company-Level Evidence from Nigeria.
Alexandru, C., Genu, G., Romanescu, M. (2008). The Assessment of Banking Performances-
Indicators of Performance in Bank Area.
Al-Tamimi, H., Hassan, A. (2010). Factors Influencing Performance of the UAE Islamic and
Conventional National Banks. Department of Accounting. Finance and Economics,
College of Business Administration, University of Sharjah.
Al-Tamimi, K.A. and Obeidat S.F. (2013). Determinants of Capital Adequacy in Commercial
Banks of Jordan an Empirical Study. International journal of Academic Research in
Economics and Management Science.
Al malleeji, H. (2002). Development of accounting measurement for Judging capital adequacy in
commercial banks, An empirical study, Scientific Journal
Athanasoglou, P., Sophocles, N., Matthaios, D. (2005). Bank-specific, industry-specific and
macroeconomic determinants of bank profitability.
Azam, M., Siddiqoui, S. (2012). Domestic and Foreign Banks’ Profitability: Differences and
Their Determinants. International Journal of Economics and Financial Issues 2(1),33-40.
36
Baltagi, B. (2005). Econometric Analysis of Panel Data. England: John Wiley & Sons Ltd,
The Atrium, Southern Gate, Chichester, West Sussex PO19 8SQ.
Baral, K. (2005). Health Check-up of Commercial Banks in the Framework of CAMEL: A
Case Study of Joint Venture Banks in Nepal. The Journal of Nepalese.
Barakat, A. ( December 2009). Banks Basel II Norms Requirement Regarding. International
Control Field Study on Jordan Banks, Delhi Business Review.
Berger, A.J. Herring and Szego, G.P. (1995). The role of capital in financial The Romanian
Economic.
Bevun, A. and Danbolt, J., (2000). Capital Structure and Determinants, ACE Financial Flows in
Transition and Market Economics.
Bichsel, R. and Blum, J. (2005). Capital regulation of banks: Where do we stand and where are
we going?
Bourke, P. (1989). Concentration and other determinants of bank profitability in Europe.,
Central Bank of Kenya (2008). Bank Supervision Annual Report, Kenya.
Claessens, S., Hore, N. (2012). Foreign Banks: Trends, Impact and Financial Stability.

37
Dang, U. (2011). The CAMEL Rating System in Banking Supervision: a Case Study of
ArcadaUniversity of Applied Sciences, International Business.
Farazi, S., Erik, F., Roberto, R. (2011). Bank Ownership and Performance in the Middle East
and North Africa Region.
Flamini, C., Valentina C., McDonald, G., Liliana, S. (2009). The Determinants of Commercial
BankProfitability in Sub-Saharan Africa. IMF Working Paper.
Diamond, D. Raghuram, A. (2000). A Theory of Bank Capital. The Journal of Finance.
Gujarati, N. (2003). Basic Econometrics. United States Military Academy.
Gul, S., Faiza, I., Khalid, Z. (2011). Factors Affecting Bank Profitability in Pakistan. The
Romanian Economic Journal, 2(3), 6-9.
Heffernan, S. (1996). Modern banking in Theory and Practice. England: Published by John
Wiley & Sons Ltd, West Sussex PO19 1UD.
Ismi, A. (2004). Impoverishing a Continent: The World Bank and the IMF in Africa. 2004.
Khrawish, A. (2011). Determinants of Commercial Banks Performance: Evidence from
Jordan. International Research Journal of Finance and Economics. Zarqa University

38
Mathuva D. (2009). Capital Adequacy, Cost Income Ratio and the Performance of
Commercial Banks: The Kenyan Scenario. The International Journal of Applied
Economics and FinancE.
Mugenda, O and Mugenda, A (1999). Research Methods: Qualitative and Quantitative
Approaches. Publisher African Centre for Technology studies
Murthy, Y., Sree, R. (2003). A Study on Financial Ratios of major Commercial Banks. Research
Studies, College of Banking & Financial Studies, Sultanate of Oman.
Navapan, K. and Tripe D. ( 2003). An exploration of the relationship between bank capital levels and
return on equity.
Ogilo, F. (2012). The Impact of Credit Risk Management on the financial performance of
Commercial Banks in Kenya. DBA Africa Management Review.
Oloo, O. (2010). Banking Survey Report, The best banks this decade 2000-2009, Think Business
Limited, Kenya.Oloo, O. (2011). Banking Survey Report, The best banks this decade
2001-2010, Think Business Limited, Kenya.
Olweny, T., Shipho, T. (2011). Effects of Banking Sectoral Factors on the Profitability of
Commercial Banks in Kenya. Economics and Finance Review, 1(5), 1-30.

39
Ongore, V. (2011). The relationship between ownership structure and firm performance: An
empirical analysis of listed companies in Kenya. African Journal of Business
Management, 5(6), 2120-2128.
40
APPENDICES
Appendix I: List of Commercial Banks In Kenya
ABC Bank (Kenya)
Bank of Africa
Bank of Baroda
Bank of India
Barclays Bank (Kenya)
CFC Stanbic Bank
Chase Bank (Kenya)
Citibank
Commercial Bank of Africa
Consolidated Bank of Kenya
Cooperative Bank of Kenya
Credit Bank

41
Development Bank of Kenya
Diamond Trust Bank
Dubai Bank Kenya
Ecobank
Equatorial Commercial Bank
Equity Bank
Family Bank
Fidelity Commercial Bank Limited
First Community Bank
Giro Commercial Bank
Guaranty Trust Bank
Guardian Bank
Gulf African Bank
Habib Bank
Habib Bank AG Zurich
42
I&M Bank
Imperial Bank Kenya
Jamii Bora Bank
Kenya Commercial Bank
K-Rep Bank
Middle East Bank Kenya
National Bank of Kenya
NIC Bank
Oriental Commercial Bank
Paramount Universal Bank
Prime Bank (Kenya)
Standard Chartered Kenya
Trans National Bank Kenya
United Bank for Africa
Victoria Commercial Bank

43
Source: CBK (2014)
Related Documents