Board of Governors of the Federal Reserve System International Finance Discussion Papers Number 717 January 2002 DETERMINANTS AND REPERCUSSIONS OF THE COMPOSITION OF CAPITAL INFLOWS Mark Carlson and Leonardo Hernández NOTE: International Finance Discussion Papers are preliminary materials circulated to stimulate discussion and critical comment. References to International Finance Discussion Papers (other than acknowledgement that the writer has had access to unpublished material) should be cleared with the author or authors. Recent IFDPs are available on the Web at www.federalreserve.gov/pubs/ifdp/.

Welcome message from author
This document is posted to help you gain knowledge. Please leave a comment to let me know what you think about it! Share it to your friends and learn new things together.
Transcript

Board of Governors of the Federal Reserve System
International Finance Discussion Papers
Number 717
January 2002
DETERMINANTS AND REPERCUSSIONS OF THE COMPOSITION OF CAPITAL INFLOWS
Mark Carlson and Leonardo Hernández
NOTE: International Finance Discussion Papers are preliminary materials circulated to stimulate discussion and critical comment. References to International Finance Discussion Papers (other than acknowledgement that the writer has had access to unpublished material) should be cleared with the author or authors. Recent IFDPs are available on the Web at www.federalreserve.gov/pubs/ifdp/.

DETERMINANTS AND REPERCUSSIONS OF THE COMPOSITION OF CAPITAL INFLOWS
Mark Carlson and Leonardo Hernández*
Abstract: The Mexican, Asian, and Russian crises of the mid- and late 1990s, have renewed the interest among policymakers in the determinants and effects of private capital flows. This paper analyzes whether policies can affect the composition of capital inflows and whether different compositions aggravate crises. We find that, while fundamentals matter, capital controls can affect the mix of capital inflows that countries receive. We find that during the Asian crisis countries with more Yen denominated debt faired worse, while during the Mexican crisis larger short-term debt stocks increased the severity of the crisis. Keywords: Capital Flows, Crisis, Contagion
* The first author is an economist in the Monetary Affairs Division of the Federal Reserve
Board who can be reached at [email protected] or Mail Stop 86, Federal Reserve Board, Washington DC 20551. The second author is an economist at the International Monetary Fund who can be reached at [email protected]. We would like to thank Barry Eichengreen, Greg Duffee and Joshua Green for valuable advice at different stages of this research. The views in this paper are solely the responsibility of the authors and should not be interpreted as reflecting the views of the Board of Governors of the Federal Reserve System, the International Monetary Fund, or any other person associated with either organization.

1
1. Introduction
There has been enormous growth in capital flows over the 1990s. It is estimated that
private capital flows to the developing countries increased –in nominal terms– by 9 times
between 1986 and 1996 (the increase is even larger, about 11 times, for the emerging market
economies).1 The emerging market crisis of 1997 caused a sudden drop in capital flows, but they
have since partially resumed (World Bank, 2001). Accompanying the increase in inflows has
been a change in their source, destination, and composition. Private flows have become
increasingly important, increasing six fold between 1990 and 1996, rising even faster than total
flows (Alba et. all. 2000), while Asia has become a more popular destination for foreign capital.
During the 1980’s, 12% of total capital flows went to Asia. Over the course of the 1990’s, this
share more than tripled rising to 43% of total flows (Alba et. al. 2000). The composition of
capital flows has also changed dramatically. There has been a marked expansion of Foreign
Direct Investment (FDI) as a portion of capital flows (Alba et. al., 2000; Chuhan et. all., 1998;
Hausmann and Fernandez-Arias, 2000).
There has been an extensive debate on whether these changes are caused by forces
internal or external to the recipient developing countries. Calvo, Leiderman and Reinhart (1993)
found that total flows from the developed to developing nations have been mainly driven by
growth and interest rates in the developed world (see also Fernández-Arias, 1996). Others have
found that the distribution of capital flows within developing countries has responded to country
specific factors, such as political stability, creditworthiness, and location (Calvo and Reinhart,
1996; Fernandez-Arias and Montiel, 1995; Hernández and Rudolph, 1997; Hausmann and
Fernandez-Arias, 2000; Corbo and Hernández, 2001). Specific types of inflow composition,
analyzed in terms of short term flows (short-term debt and portfolio equity) and long term flows
(FDI and long term debt), have been found to be affected by internal fundamentals such as GDP
growth and interest rate differentials (Chuhan et. all., 1998; Montiel and Reinhart, 1999; Corbo
and Hernández, 2001).
While capital flows are an important means of financing investment (Montiel, 1996;
McKinnon, 1999), it has become clear in the past decade that the sudden disappearance (or
worse, reversal) of capital flows can result in tremendous crises (Ahluwalia, 2000; Calvo and
Reinhart, 1996). It has been argued that the composition of capital flows received by a country
1 Source: World Economic Outlook

2
is an important determinant of whether the rise in capital flows is beneficial or detrimental.
Claessens, Dooley, and Warner (1995) indicated that the conventional wisdom is that2:
“short term capital movements are deemed speculative and reversible –hot money– and long term capital flows –cold money– are based on fundamentals and are deemed reversible only when the fundamentals change (p.154).” Short-term capital flows are argued to arrive mainly seeking high returns, leave at the
first sign of trouble, and be destabilizing (Rodrik and Velasco, 1999). Long-term capital flows
are thought to lead to the accumulation of physical capital or the development of human capital
and thus encourage economic development (Frankel & Rose, 1996).
Several studies have tested whether the composition of capital flows influences the
susceptibility of a country to a crisis. Rodrik and Velasco (1999) looked at crises in the 1990’s
and found that having more short-term debt increased the likelihood and severity of a crisis.
However, Frankel and Rose (1996) examined the crises between 1971 and 1992 and uncovered
no evidence that short-term debt had any effect on the likelihood of a crisis. But there are several
concerns about these results. The first is that the level of short-term debt may be endogenous.
Investors may shorten the duration of their lending because they are concerned about potential
crises, thus leading to a buildup of short-term debt prior to a crisis. Second, these studies assume
that all crises are the same. If crises differ in nature, then it will be difficult to use long panels to
identify factors that affect countries’ susceptibility to and severity of crises. Even if it decreases
the power of tests, if crises are different, it is important to separate crises to determine their
sources.
In this paper we perform an integrated analysis of the composition of capital inflows. We
first examine what determines capital inflow composition and then analyze whether such
composition per se affects countries’ experiences during crises. The first part of the paper
focuses on the determinants of inflow composition. We divide inflow composition into FDI,
short-term debt and portfolio equity flows. We test whether government policies and
fundamentals influence the relative shares of each of these flows in the total. Separating types of
flows allows us to determine whether specific flows respond to policies in similar ways. In the
second part of the paper, we analyze how the inflow composition affects the severity of the crises
that countries experience. In particular, focusing on the Mexican and Asian crises, we first test
2 Although their own findings challenges the conventional wisdom.

3
whether inflow composition acts as a channel through which crises spread from country to
country. Next, we test whether short-term debt increases countries’ severity of crises. Because
there is a concern that the amount of short-term debt outstanding is endogenous, we use as
instruments the policies and fundamentals found in the first half of the paper to affect the share
of short-term debt. Finally, we examine whether the sources of the two crises are the same. We
test whether factors that played a role in one crisis played the same role in the other.
Our results indicate that, while certain fundamentals are important, there are indeed
policies that governments can adopt to affect the mix of capital flows that they receive. By
imposing capital controls governments can increase the share of FDI in the total. Countries that
adopt floating exchange rates tend to attract a higher share of their inflows in short-term debt,
while countries with fixed exchange rates tend to attract more direct and portfolio investment.
Additionally, we find that portfolio equity tends to respond to policies in ways similar to FDI
rather than short-term debt. This is contrary to what has been suggested by the literature that
tends to treat portfolio flows as short-term debt.
We also find during the Asian crisis that similar trade patterns and capital inflow
composition among countries may have affected the severity of their crisis. Countries with more
Yen denominated debt and a larger share of exports to Japan generally faired worse. We believe
that this is caused by a misalignment between the countries’ currency pegs and the denomination
of their debt. During the Mexican crisis, we find evidence that short-term debt increased the
severity of the crisis, tentatively lending support to the findings that short-term debt increased the
susceptibility of countries to the crisis. Interestingly, we do not find that the same factors
mattered in both crises. Short-term debt played a role only in the Mexican crisis. Similarly we
find some evidence of an effect of fundamentals, such as an appreciation of the real exchange
rate and exchange rate coverage of monetary aggregates, only in one crisis. This suggests that
crises are aggravated by different factors and that it may be incorrect to treat crises as equal.
The rest of the paper is organized as follows. We discuss the existing literature and the
relation of this study to that literature in Section 2. In Section 3, we present the experience of
eight countries over the course of the 1990’s. We do this to informally illustrate some trends in
the composition of capital inflows and to help motivate some of our results. Section 4 presents
our formal analysis of the determinants of the composition of capital inflows. In Section 5, we
present our analysis of the impact of capital inflow composition on the experience of different
4
counties during the Mexican and Thai crises. Section 6 discusses our conclusions and some
policy implications.
2. Related Literature
2.1 Determinants of Capital Inflows
With the recent rise in importance of capital inflows from developed to developing
countries, there has been a corresponding effort in the literature to understand this phenomenon.
The central question in the literature is whether capital flows are driven by push factors (things
that are external to the country) or pull factors (domestic forces). Some of the early studies
looked at the volume of flows between the developed and developing worlds, but later studies
focused more on how these flows were distributed among countries. Recent studies have
examined the determinants of particular types of capital flows.
Calvo et. all., (1993) tested whether aggregate capital flows between the developed and
developing countries are driven by business cycles in the developed world (push factors) or
improving economic conditions in the developing world (pull factors). Using principal
components analysis, they found that capital flows between developed and developing nations
are driven largely by cyclical factors in developed nations. They argued that when investment
returns in developed nations decline, money flows abroad seeking higher returns. Thus, capital
flows tend to move against the business cycle in the developed world, especially the United
States.
But aggregate flows have not been evenly distributed amongst developing countries.
This has prompted scholars to examine why only some countries receive large capital inflows.3 It
has been argued that while factors in the industrial world may influence the size of capital flows
overall, which countries receive these flows is driven by country specific factors (Corbo and
Hernández, 2001; Montiel and Reinhart, 1999; Hernández and Rudolph, 1997). Fernandez-Arias
and Montiel (1995) showed that a country’s creditworthiness is important for capital flows, and
that actions by a country that decrease its credit rating may result in large outflows of capital.
Montiel (1996) argued that policy can be an important tool for affecting the magnitude of net
capital flows. He argued that capital controls have been effective at reducing the size of capital
3 The top 18 recipient countries received about 80% of the net private capital flows during 1990-97
(Source: IMF).
5
inflows to developing nations. Calvo and Reinhart (1996) found that factors specific to a county,
but not necessarily within its control, such as regional location, can be important. They showed
that capital flows to small countries increase if they are in the same region of a large country that
is receiving capital flows.
Recent studies have examined why different types of capital flows go to particular
nations. Often flows are classified either as short-term flows, composed of portfolio equity and
short-term debt, or long-term flows such as FDI and LT debt.
Studies that examine short term flows generally find that they are driven by market forces
that are indicative of the state of the economy in the recipient country. Chuhan et. all. (1998),
looked at portfolio debt and equity flows. Using data from the United States, they found that
portfolio debt flows (bonds) are affected by credit ratings and secondary market prices. Equity
flows are affected by price-equity ratios, stock market returns, and GDP growth. They also
found that U.S. interest rates affected equity flows, indicating some importance for external
factors in equity markets. Montiel and Reinhart (1999) examined short-term flows. They found
that sterilization increased both the volume of inflows and the share of short-term flows. Foreign
interest rates were also found to affect the share of short-term flows and especially that of
portfolio equity. Bohn and Tesar (1998) look at United States portfolio investment in Asia.
Focusing particularly on equity trading, they find that market returns in Asia determine net
purchases of assets while the return on assets in the United States has no effect.
The studies examining FDI flows have tested whether they have been affected by a broad
range of factors. Montiel and Reinhart (1999) found that by imposing capital controls, countries
were able to increase the share of FDI. Hausmann and Fernandez-Arias (2000) found that
countries that have less developed capital markets tend to have higher levels of FDI. They
concluded that FDI often substitutes for alternative means of financing, so that companies facing
difficulties accessing domestic capital markets may instead sell part or all of their firm to a
foreign company. Goldberg and Klein (1998) look at FDI to Latin America and East Asia from
the United States and Japan. They test whether flows of FDI are affected by changes in the
recipient countries’ bilateral real exchange rates vis-à-vis either country. They find no effect on
FDI flows to Latin America from changes in either bilateral real exchange rate. In East Asia,
when the real exchange rate depreciates vis-à-vis Japan or appreciates vis-à-vis the United States,
flows from Japan increased. Similarly, an appreciation vis-à-vis Japan increased FDI flows from
6
the United States. They argued that the difference was that flows from Japan were used to
develop export industries, while flows from the United States substitute for imports from the
United States.
2.2 Contagion and Financial Crises
Three issues in the vast literature on currency and financial crises are of particular
interest. The first concerns the transmission of crises. The second is whether different inflows
affect the likelihood and severity of crises. The third issue is whether crises are predictable.
An issue that has grown in importance during the 1990’s is how crises spread. The
literature describes three ways that contagion can occur: the first is through trade linkages (direct
and indirect), the second is through financial linkages (direct and indirect), and the third is
through macroeconomic similarities, where a country is attacked because its economic
fundamentals resemble the fundamentals of another country in crisis.
Glick and Rose (1998) find evidence that trade linkages are a channel through which
crises spread. They find that countries that compete with crisis-origin countries in third country
markets are more likely to experience a crisis. The rationale for this finding is as follows: if a
country’s trade competitor devalues, the country will experience a decline in exports if its
exchange rate remains constant. The country is faced with a choice between a recession or
devaluing its currency. These circumstances increase the likelihood of a crisis as investors
foresee the possibility of a devaluation. Glick and Rose argue that trade patterns are a strong
candidate for explaining crises because, like crises, trade patterns tend to be regional.
Hernández and Valdes (2001) find evidence of contagion through indirect financial
linkages. Looking at the Thai, Russian, and Brazilian crises, they find that countries experience a
more severe crisis if they borrow from banks in the same financial center as the other crisis
countries. They argue that this linkage could occur either because the financial assets issued by
the two countries could look similar (or are treated as equals), because having a common lender
promotes herd behavior, or simply because countries compete for a limited pool of funds –
having a common lender increases the impact of margin calls or portfolio balancing when a
shock occurs. Van Rijckeghem and Weder (1999) find similar results.
The findings of Sachs, Tornell, and Velasco (1996) have been interpreted as support for
the third method of transmission. This study focuses on factors responsible for the severity of the
Mexican crisis. Sachs, Tornell and Velasco construct an index of crisis severity based on changes

7
in all three: international reserves, the exchange rate, and the interest rate.4 They then test
whether a variety of fundamentals, such as the rate of monetary growth compared to
international reserves, growth of domestic credit, and appreciation of the real exchange rate,
affect this index. They find that countries that did poorly on each and every measure of
fundamentals were the ones that suffered the most during the Mexican crisis. It can thus be
argued that countries that were similar to Mexico, in that they also had relatively poor
fundamentals, were the ones that experienced a more severe tequila shock.
A second issue in the literature is whether the capital inflows a country receives affect its
susceptibility to a crisis. Countries frequently experience a crisis when capital flows suddenly
stop (Calvo, 1998). Countries with large amounts of short-term debt that need to be rolled over
would be especially vulnerable to this problem. Several studies have tested this hypothesis.
Frankel and Rose (1996) studied a panel of countries over the seventies, eighties, and early
nineties. They did not find any role for short-term debt relative to GDP. Rodrik and Velasco
(1999) examined a different set of countries during the nineties and did find a role for short-term
debt, although their results depend on the variable against which short-term debt is measured.
They found that during the nineties, countries with more short-term debt relative to reserves were
more likely to suffer a crisis, and that the amount of short-term debt affected the severity of a
crisis.5
A third issue is whether crises are predictable. The Asian crisis has sparked much debate
in this area. Goldstein and Hawkins (1998) argue that there were signs of weakness. They show
that there were excessive increases in bank credit, large real exchange rate appreciations with
respect to the Japanese Yen that were hurting exports, and a substantial currency mismatch in
financial assets. However, Radalet and Sachs (1998) argue that the crisis was not predicted.
Foreign lending to the crisis countries continued until right up to the crisis. The sovereign rating
of the crisis countries also remained high until the crisis took hold. Berg and Patillo (1998)
tested whether measures constructed after the Mexican crisis would have been able to predict the
Asian crisis. They find modest evidence that a few measures perform better than a naive guess.
4 The index is a weighted average of the changes in the three variables, where the weight are inversely
proportional to each series’ volatility. 5 There is some concern about the use in Rodrik and Velasco of contemporaneous values of short-term
debt. If investors are concerned about the economic health of a country and the possibility of a crisis, then they may shorten the maturity of their lending. Thus, high levels of short term debt are a symptom rather than a cause of crises.

8
3. Country Experiences
Here we present an informal analysis of three of the issues that are considered in this
study, namely, how do shares of capital flows change over time and relative to each other,
whether policy variables can affect the flow of capital, and whether trade and financing patterns
match the regional crisis patterns. This informal analysis is conducted by presenting the
experiences of eight countries. We construct three series of charts. Each series traces three or
four variables over time for each of the eight countries. This informal analysis is conducted in
order to illustrate broad trends and to motivate the more formal analysis of Section 4.
3.1 Data & Methodology
The countries that are used in this section are Argentina, Brazil, India, Indonesia, Korea,
Mexico, Poland, and Thailand. These countries were selected because of being among those that
received relatively large amounts of capital inflows during the 1990s.
The data come from several sources: the IMF International Financial Statistics, the IMF
Direction of Trade Statistics, the IMF World Economic Outlook, and the World Bank Global
Development Finance Report. See Appendix 1 for the detailed information about the source or
method of construction of each variable. The data covers the period from 1988 to 1998.
3.2 The Series
Series 1
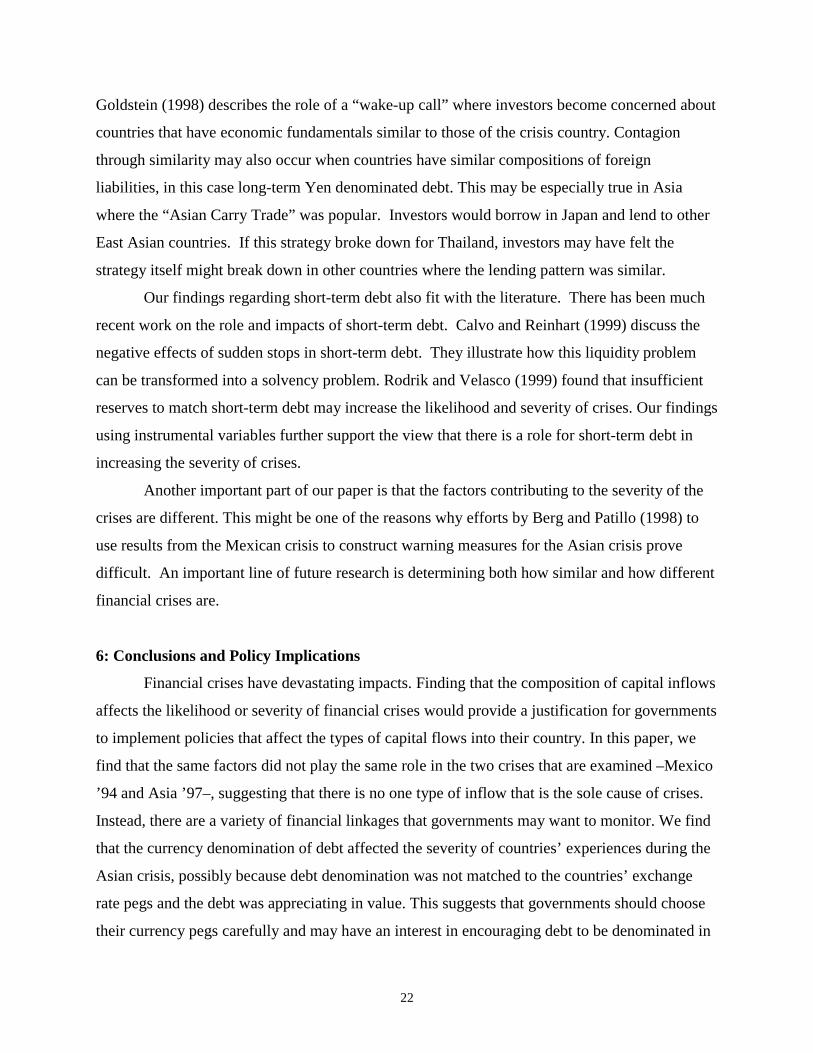
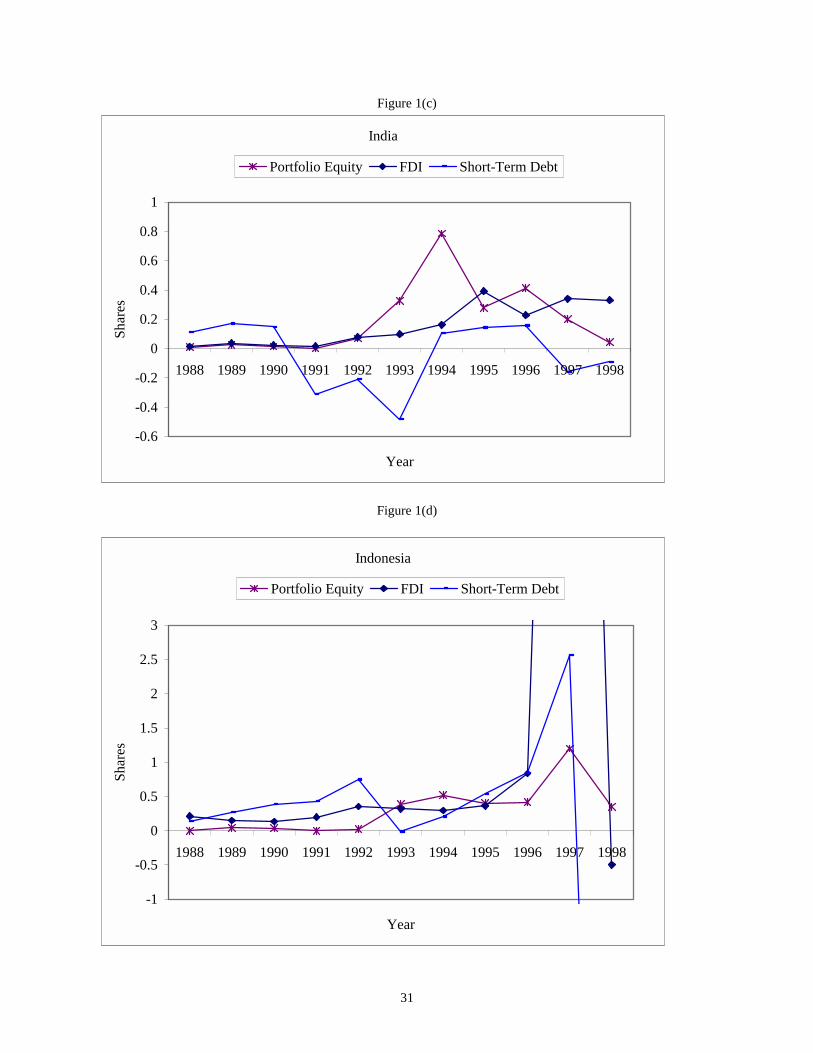
The first series focuses on how shares of different flows evolve over time and how they
move relative to each other. We look at FDI, short-term debt, and portfolio equity flows as a
share of total net capital inflows. The latter are total net capital flows as reported by the IMF.
The series can be seen in Figure 1(a)-1(h).
Two observations can be made. First, while FDI has grown in importance for some
countries, such as India, this is not the case for all countries. Net flows of FDI to Argentina are
quite volatile, while the share of FDI flows to Thailand decreased for most of the sample period.
Thus, it is important to know why the overall trend of FDI has increased for some countries but
not for others. The last two years of the sample, where the share of FDI flows increases for over

9
half the countries, indicate that FDI flows are less likely to be deterred by a crisis.6 Second, there
are periods when the shares of portfolio equity flows and short-term debt appear to mirror each
other, although this does not seem to be a universal occurrence. This suggests that it is important
to separate short-term debt and portfolio equity flows in the analysis below.
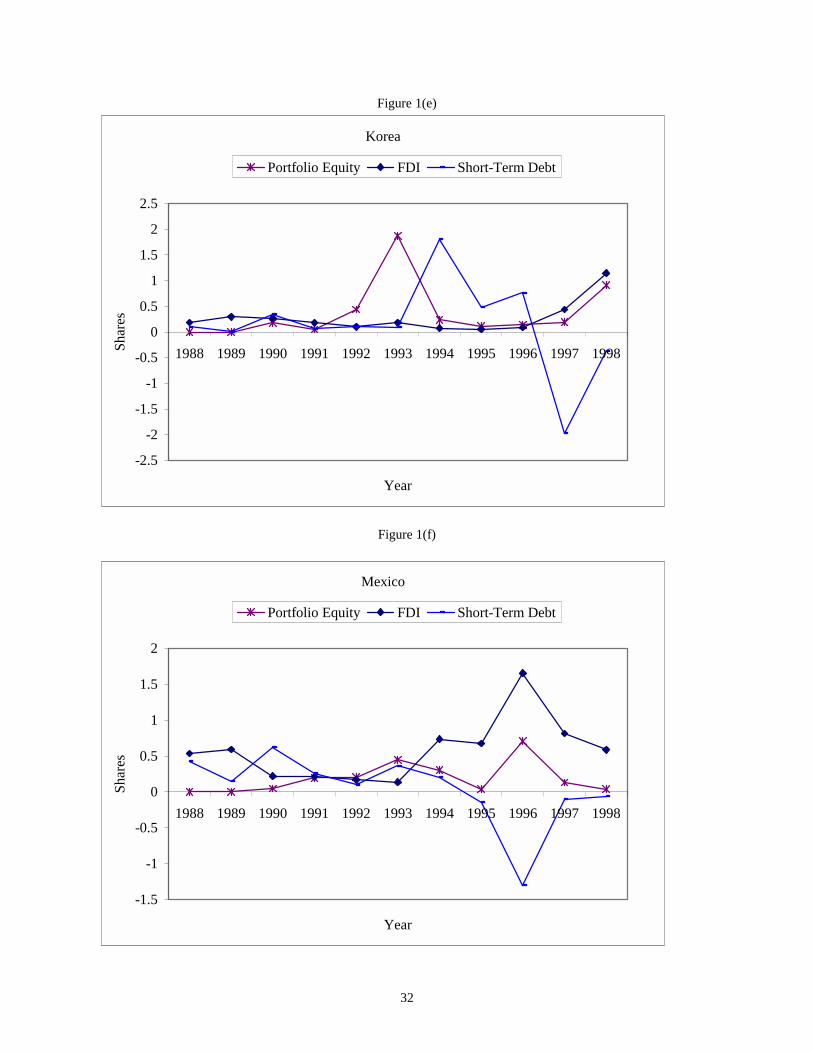
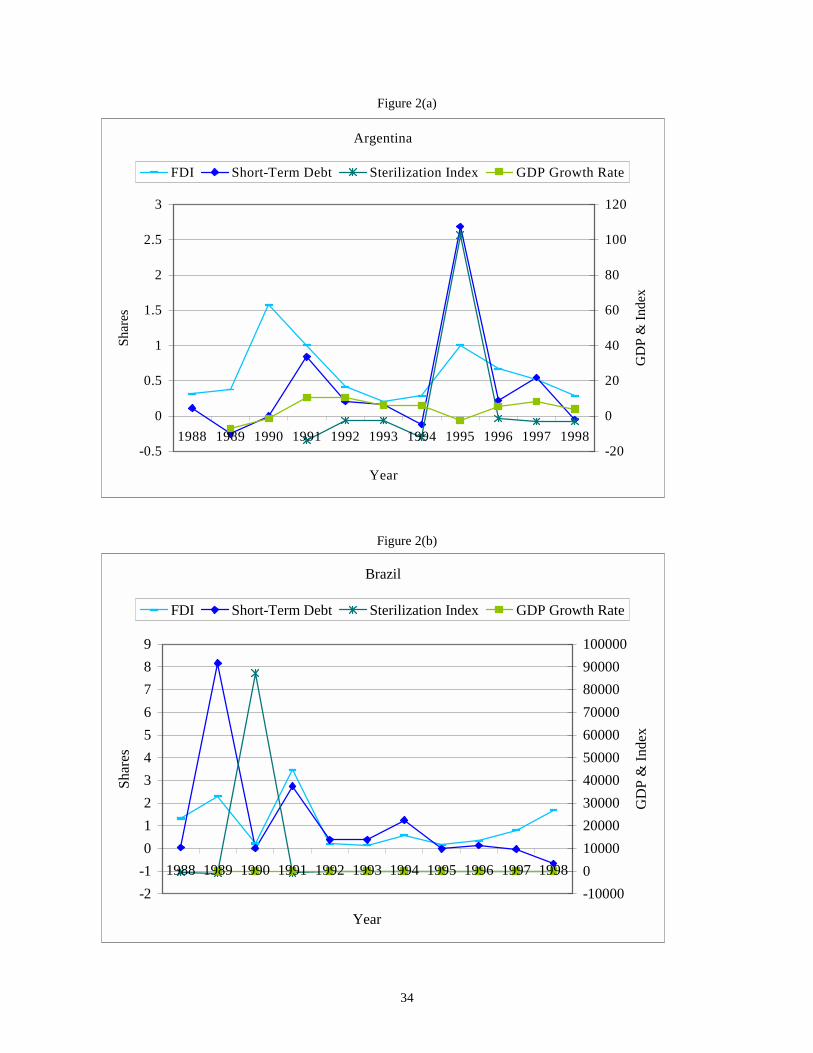
Series 2
The second series examines whether the yearly shares of FDI and short-term debt are
influenced by real factors, indicated by the percentage change in annual real GDP, and/or policy
measures, represented by an index measuring the extent of sterilization.7 The literature suggests
that sterilization increases the share of short-term debt (Montiel and Reinhart, 1999).
There are some correlations between inflows and the other factors included here. From
figures 2 (a)-(h), it is clear that large movements in the sterilization index are associated with
large movements in short-term debt. The co-movement is less clear for lower levels of the
sterilization index. Movements in real GDP do not appear to be related to shares of short-term
debt. However, changes in the share of FDI are moderately correlated with changes in real GDP.
In both India and Mexico, increases in the rate of growth of real GDP are followed by increases
in the share of FDI. More formal analysis, however, will be needed to confirm this observation.
Series 3
The third series examines whether trade and financing patterns might have played a role
in transmitting crises. Trade patterns are indicated by the share of annual exports to the United
States and the share of annual exports to Japan. Financing patterns are indicated by the share of
long-term debt denominated in Dollars and the share of long-term debt denominated in Yen. The
geographical patterns of crises have led scholars to look for regional explanations. Since trade
also tends to be geographically concentrated, it has been a strong candidate for explaining crises
contagion (Glick and Rose, 1998). Here we examine whether borrowing patterns also display
regional preferences. As an assessment of the potential vulnerability of countries in different
regions, the average Yen-Dollar exchange rate for the year is also included. 6 It can also be noted additionally that during crisis periods, 1994-5 in Mexico and 1997 in East Asia,
short-term debt decreases first and most dramatically.
10
The series show that geography has a significant impact on both debt denomination and
trade. Latin American countries tend to denominate more of their debt in Dollars, while East
Asian countries denominate a substantial amount of their debt in Yen during the same time
period. Geography also matters for trade; Japan is far less important in Latin America than it is
in Asia. Further, except for Mexico, the United States seems to be less important for Latin
America than Japan is for East Asia. Thus, movements in the Yen-dollar rate are expected to be
more important for East Asian than Latin American countries for trade purposes. Exports to
Japan move with the exchange rate, but the movements are small. Debt denomination does not
appear to respond at all to shifts in the exchange rate.
4. Determinants of the Composition of Capital Inflows
In the previous section we observed that policies such as large scale sterilization, and real
effects such as changes in growth rates, appear to be correlated with the composition of capital
inflows. Here we formally test whether policy and real factors affect the shares of private short-
term debt flows, portfolio equity flows, and FDI in annual net capital inflows.8 The policy
variables we use are the exchange rate regime, capital controls, as well as the measure of
sterilization used previously. In addition to changes in GDP growth rates we test whether other
economic variables, such as the countries’ interest rate differentials with international rates,
affect inflow composition. We also include location dummies to account for regional effects.
4.1 Data and Methodology
To test whether policy and real factors affect different types of the capital inflows, we
will employ a panel data set. The data consist of annual observations from 1991 to 1998, and
include the countries of Argentina, Brazil, Chile, Colombia, Ecuador, Egypt, India, Indonesia,
Korea, Malaysia, Mexico, Peru, the Philippines, Poland, Thailand, and Turkey. These countries
were chosen because they are among the largest recipients during the 1990s.9 The types of
7 The sterilization index is the difference in the dollar value of domestic credit between two years
divided by the difference in the dollar value of reserves in the same two years. All this is multiplied by negative one so that a higher positive value of the index indicates a higher level of sterilization.
8 We also tried unsuccessfully to measure the determinants of long-term debt. 9 Other large recipients were excluded because of data availability problems.

11
capital flows we are concerned with are portfolio equity flows, private short-term debt, and
FDI.10
Data on different capital flows, GDP, interest rates, and the variables used to construct
the sterilization measure come from the IMF International Financial Statistics. See Appendix 1
for details. Data on exchange rate regimes come from Levy-Yeyati and Sturzenegger (1999).
The exchange rate regime identified by these authors is used because it is the de facto exchange
rate regime rather than the de jure regime. They identified the regime by observing changes in
reserves and changes in the nominal exchange rate. If reserves fluctuated but not the nominal
exchange rate, then the exchange rate regime was considered fixed. If the nominal exchange rate
changed but not reserves then the regime was considered to be floating. If there was moderate
movement in both reserves and the exchange rate, the country was considered to be operating a
dirty float. If neither moved then the exchange rate regime was said to be indeterminate.11
Data on capital controls are from the IMF Exchange Arrangements and Exchange
Restrictions. Controls are broken down into two groups: controls that require the surrender of
export proceeds and controls that place restrictions on capital transactions.
Here net capital flows consist of the sum of net flows of FDI, portfolio equity, and total
debt.12 It is important to note that inflows and outflows of different types may offset each other
so that “shares” of particular types of flows may exceed 100% of net capital flows.13
In cases when outflows almost balance inflows significant outliers will result that may
bias the results. Thus, we have eliminated all observations in which the share of one of the
components exceeded ±800% of the net capital inflow. In practice, this led us to drop only one
observation– Chile in 1991, for all three series.14
In the previous section, it appeared that short-term debt and sterilization moved together
only when the sterilization index was very large. Thus in the formal analysis below we replace
the sterilization index with an indicator of ‘high’ sterilization. This indicator takes on a value of
one when the observation is in the top 15% of the values of the index and is zero otherwise.
10 Data on portfolio equity investment in Poland is unavailable. 11 Or in the authors’ terminology “irrelevant”. See footnote 21. 12 Importantly official debt flows are not included. 13 Thus our dependent variable is not constrained to be between zero and one. 14 This is the year when Chile imposed reserve requirements on capital inflows.

12
We used lagged values of the explanatory variables rather than contemporary ones. This
is done for several reasons. The first is that lagged values may be more indicative of the
information available to market participants than the contemporaneous variable. For example,
the growth rate of the country will not be known until well into the year. Second, by using
lagged values, we are able to more clearly ascertain causality. The data are analyzed in two
ways. We use a panel data regression with fixed effects for each country and the seemingly
unrelated regression technique (SUR) on a pooled sample with country and year dummies.15 The
results are qualitatively the same in both cases. To correct for potential heteroskedasticity, the
errors are White standard.
4.2 Foreign Direct Investment
We find that both policy and real effects tend to influence the share of FDI relative to
other components of net capital inflows. The results of the tests can be found in Table 1.
Similar to the results of Montiel and Reinhart (1999), we find that restrictions on capital
transactions tend to increase the share of FDI. This may occur because a more restrictive capital
account increases the incentives for domestic firms to avoid capital markets altogether, and lead
them to seek financing by allowing themselves to be (partly) purchased by a foreign firm
(Hausmann and Fernandez-Arias, 2000).
Floating exchange rates tend to discourage FDI. McKinnon (1999) noted that, with
floating exchange rates, capital inflows cause the nominal exchange rates to appreciate. This in
turn reduces immediately the ability of a country to export, thus making direct investment in the
export sector in that country less attractive.16 Thus, to the extent that the bulk of FDI goes into
export industries, firms may prefer to avoid countries where their ability to export is expected to
vary more over time.17
Countries in East Asia with high (past) growth rates tend to attract more FDI, while
growth rates in other parts of the world have no effect. Firms may prefer to establish an equity
stake in economies that are expected to grow. Growth rates in Asia were both high and sustained
15 The SUR regression with dummies imposes additional restrictions on the residuals’ var-cov matrix.
Fixed effects are largely associated with regional factors. A Hausmann test rejected, as expected, the random effects models.
16 With a fixed exchange rate in the presence of capital inflows the real exchange rate moves (appreciates) slowly.
17 Recall that the alternative to a floating exchange rate is greater stability.

13
from year to year.18 Given the stability in growth rates, firms observing high growth one year
could reasonably expect high growth in the future. In contrast, growth rates in other parts of the
world are more erratic, and thus do not convey as much information to firms about future
growth.19
4.3 Short-Term Debt
The determinants of short-term debt tend to be the same ones as for FDI, only with
opposite sign. The results of tests of the determinants of the share of short-term debt in net
capital flows can be found in Table 2.
As expected, having very high levels of the sterilization index increases the share of
short-term debt in the mix. Somewhat curiously, this result holds in Latin America and East Asia
but not in the other countries. This result is similar to that reported by Montiel and Reinhart
(1999).20
Having either a dirty float or a free float tends to increase the share of short-term debt. In
other words, under a floating exchange rate regime long-term investment becomes –at the
margin–less appealing than short-term investments, thus leading to an increase in the share of
short-term debt. And higher growth rates in East Asia tend to decrease the share of capital
inflows that are composed of short-term debt, while growth rates in other parts of the world do
not have any significant effect.
4.4 Portfolio Equity Investment
The effects of the policies, GDP growth, and interest rates on the share of portfolio equity
investment are very similar to those of FDI. Only the relationship between exchange rates
regime, capital controls, and portfolio equity share are more complicated. This is surprising. In
18 The mean growth rate during 1991-98 is 6.8%, the average variance is 2.4 percentage points and the
year to year correlation is 0.3. 19 The mean growth rate during 1991-98 for all other countries –Argentina, Brazil, Chile, Colombia,
Ecuador, Egypt, India, Mexico, Peru, Poland and Turkey– is 4.0%, the average variance is 4.7 percentage points, and the year to year correlation is 0.1.
20 Also similar to Montiel and Reinhart (1999) we find evidence –albeit weak– that imposing restrictions on capital transactions tend to reduce the share of short-term debt in the total (these coefficients attain a marginal significance of about 15 percent; see table 2).

14
most studies, portfolio equity is thought to behave similarly to short-term debt. The test results
are available in Table 3.
Similar to the case of FDI, countries that have a pure floating exchange rate tend to have
a smaller share of their capital inflows composed of portfolio equity investment. This may be
due to increased uncertainty or concern about exchange rate variability. Investors may be less
interested in purchasing equity in a country where they are concerned with exchange rate risk in
addition to other risks. Also, if investment is in the export sector, investors may be concerned
with the ability of firms to export if the exchange rate were to appreciate because of the capital
inflows.
We also find the following relationships. Countries with a fixed exchange rate and
restrictions on capital transactions tend to have a smaller share of flows in portfolio equity, while
countries that have fixed exchange rates and surrender requirements on export proceeds tend to
have larger shares of flows composed of portfolio equity. Countries with floating exchange rates
and surrender requirements on export proceeds also have higher shares of portfolio equity.
Neither surrender requirements nor restrictions on capital transactions have any effect by
themselves.
These results are difficult to interpret21 and are an area that requires further research.
Nonetheless, one plausible hypothesis is that only central banks that are able to credibly commit
to a sustainable polar exchange rate regime –either a fixed or pure float– are able to enforce the
surrender of export proceeds and other capital controls.22 This greater enforcement capability is
what leads investors to reduce the share of portfolio equity in the case of restrictions on capital
transactions, and increase this share –probably as a way to bypass the restriction–in the case of
surrender requirements of export proceeds.
Finally, high growth rates in countries in East Asia tend to attract more portfolio equity
investment while growth in other countries has no effect. We believe the reasons for this are the
21 These results should also be interpreted with caution as the exchange rate regime classification
presents some drawbacks. In particular, countries with a clearly defined regime –e.g., Argentina– may be classified as ‘irrelevant’ or indeterminate if there is no pressure in the exchange rate market –if international reserves don’t change.
22 If capital controls are thought as a mean to create some room to maneuver for monetary policy, without putting in jeopardy the sustainability of the exchange rate regime (i.e., implement monetary policy without depleting reserves under a strict peg, or to contain the volatility of the nominal exchange rate under a pure float), then the central bank must have the capability to enforce the compliance with capital controls. This requirement is less important in a dirty float regime.

15
same as those for FDI –i.e., that growth rates in East Asia were more stable and therefore easy to
forecast.
When responding to growth rates and exchange rate regimes, we find that portfolio equity
responds like FDI and in the opposite manner of short-term debt. Previous work usually grouped
portfolio equity flows with short-term debt because it was thought that the same factors would
affect all highly liquid flows in the same manner. Finding that portfolio equity behaves more like
FDI has strong implications for thinking about the motivations of portfolio investors.
4.5 Factors That Did Not Matter
In a study of the determinants of the composition of capital flows, it is almost as
interesting to know what does not affect the composition as what does. Here we mention factors
that we tested and found did not affect inflow composition.
External factors did not seem to matter. We experimented by including US interest rates,
interest differentials, and US GDP growth in the regression analysis. None had an affect.23 It is
reasonable that the state of the economy in the developed world affects total flows but that the
form those investments take depends of the policies and fundamentals in the recipient countries.
Fundamentals such as inflation in the domestic economy and changes in the real
exchange rate had no effect. We tried including changes in the inflation rate and percentage
changes in the real exchange rate as well as dummies that indicated extreme changes. We also
interacted these variables with the exchange rate regime and still found no effect.
Some countries in the sample experience hyperinflation during the sample period. These
episodes account for much of the variation in inflation. Hyperinflation would also discourage all
forms of investment not just one particular type. Hence, it is not surprising that we do not find
any effect of inflation on the shares of inflows.
Our finding that the real exchange rate has no effect is not inconsistent with the findings
of Goldberg and Klein (1998) or others as we are concerned with the capital inflow composition
as opposed to flows in levels.
23 There is marginal evidence that the interest rate differential tends to increase the share of portfolio
equity in the total (see the SUR regression in table 3).

16
5. Capital Inflow Composition and Crises
The figures in Section 3 show strong regional patterns in both trade and debt
denomination. Glick and Rose (1998) among others, have argued that trade patterns explain the
regional nature of crises. The figures in Section 3 also show that during crisis periods, short-
term debt flows tend to turn negative. It has been argued that excessive amounts of short-term
debt may be indicative of the likelihood24 as well as contribute to the severity of crisis because if
there are signs of trouble these loans may simply not be renewed (Calvo, 1998; Rodrik and
Velasco, 1999).
In this section, we test whether similar trade and debt denomination patterns affect the
severity of crises and thus may be a means of transmitting crises.25 In addition, we examine
short-term debt and try to assess whether it played a role in the crises. Additionally, we examine
the Mexican crisis and the Asian crisis individually to determine whether the same factors played
a similar role in both crises, thus implying that crises are to some extent predictable.
5.1 Data and Methodology
The methodology we employ in this section follows Sachs, Tornell, and Velasco (1996)
[hereafter STV]. We construct a crisis index for each country that is a weighted average of the
changes in each country’s interest rates, exchange rates, and reserves.26 We consider changes in
these measures for six, nine, and twelve months after the start of the crisis. Results are generally
reported using the six month period, although the results are largely the same regardless of the
time period considered. The Mexican crisis is taken to start in December 1994, and the Asian
crisis is taken to start in July 1997. All exogenous variables are measured at the end of the
previous quarter.
We test whether the severity of crises is affected by a variety of factors. We first attempt
to replicate the findings of STV by testing the importance of the fundamentals that they identify
in their study on our sample of countries. It has been suggested that STV’s approach tests a form
24 The likelihood argument refers to investors shortening the maturity of loans because they perceive the
potential of trouble in the future. 25 Contagion would occur due to direct or indirect trade linkages and because investors treat all countries
that look alike in the same way (the wake-up effect). 26 This index, due to Girton and Roper (1977), is also used by Eichengreen, Rose, and Wyplosz (1995)
and by Frankel and Rose (1996). There are slight variations in the variables used and the weighting systems. Our index most closely follows the one used by Sachs, Tornell and Velasco.

17
of the wake-up call hypothesis because it signals to investors to look at countries that have
similarly poor fundamentals.27 When testing the role of fundamentals, we employ the same ones
used in STV, namely, the ratio of M2 to reserves, the expansion of bank credit over last year, and
the real exchange rate appreciation over the past year. Following STV, we also try using dummy
variables to indicate that a country is in the upper part of the distribution. The indicator for
having “excessive” M2 to reserves is equal to 1 if the country has a ratio in the top 75% of the
sample and zero otherwise. Countries with a real exchange rate appreciation in the top 66% of
the sample are selected to have high rates of appreciation. Countries with bank credit growth in
the top 66% of the sample are treated as having high bank credit growth.28
Next, we test whether trade linkages or debt-composition similarities were important in
transmitting crises by analyzing whether regional trade patterns or debt denomination affect
crisis severity. Both direct and third party trade linkages have been identified as channels of
crisis transmission. Here we test whether competition in third country markets matters by
including exports to the United States during the Mexican crisis and exports to Japan during the
Asian crisis. Goldstein (1998) suggests that unhedged foreign currency debt was important in the
crises. Regional patterns are one of the motivations for investigating whether trade links
influence the spread of crises. We also note strong regional patterns in debt denomination.
Therefore, we test the importance of currency composition of debt denomination, in particular,
the impact of Dollar denominated debt during the Mexican crisis and that of Yen denominated
debt during the Thai crisis.
Third, we examine the role of short-term debt in affecting the severity of the crises. The
literature suggests that excessive short-term debt was a factor in the crises. Rodrik and Velasco
(1999) found that short-term debt affected the probability and severity of the crisis. To confirm
this, we look at the ratios of outstanding short-term debt to reserves. To address problems of
endogeneity, the policy and economic variables from Section 4 are used to instrument the ratio of
short-term debt to reserves. Although this ratio is different than the one used in Section 4 (net
27 Both Mexico and Thailand, the crisis origin countries, displayed relatively poor fundamentals at the
time of crisis. 28 Both Tornell (1999) and Berg and Patillo (1998) perform a similar exercise. We compare our results
to theirs below.

18
flows of short-term debt to total net capital flows), analysis indicates that the variables used as
instruments affect these two short-term debt ratios in much the same ways.29
Finally, we look at whether the two crises are similar. Most studies group crises together
or use a long data panel. This imposes strong assumptions about the behavior of countries across
crises and the effects of variables during crises. We examine the Mexican and Asian crises
separately and test whether it is appropriate to pool the data—i.e., we test whether the effects of
fundamentals and short-term debt are the same for the two crises or whether each crisis is
different.
The countries that we use are Argentina, Brazil, Bulgaria, Chile, China, Colombia, the
Czech Republic, Ecuador, Egypt, Hungary, India, Indonesia, Korea, Malaysia, Mexico, Peru, the
Philippines, Poland, Thailand, and Turkey.30 The data comes from the IMF International
Financial Statistics and World Bank Global Development Finance Report. See Appendix 1 for
details.
5.2 Results Following Sachs, Tornell , and Velasco
Sachs, Tornell, and Velasco argued that having rapid growth in bank credit or rapid
exchange rate appreciation is not bad in itself; rather it is when bank credit is growing rapidly,
when money supply vastly exceeds reserves, and the exchange rate is appreciating that the
country is in trouble. So they tested each measure individually, and tested each measure jointly
with indicators for having “excessively” and/or rapidly changing (deteriorating) fundamentals.
We repeat these tests for both the Mexican and Asian crises using our crises indexes. The results
are in Table 4.
During the Mexican crisis, we find results that are fairly similar to STV. We find that
none of these measures is detrimental by itself; however, having a larger real appreciation, when
the country has among the highest bank credit growth and has among the highest appreciations
29 We rerun the equation in table 2 replacing the dependent variable with the ST Debt to reserves ratio. It
turns out that the RHS variables have explanatory power. 30 The four additional countries –Bulgaria, China, the Czech Republic and Hungary– could not be
included in the analysis of section 4 because of some missing policy variables. Therefore these countries are not included in the results using instrumental variables reported in table 6.
19
or highest ratios of M2 to reserves, results in a more severe crisis.31 This exactly follows STV.32
During the Asian crisis, we find no evidence that either bank credit or real appreciation resulted
in a more severe crisis.
We believe that the inclusion of countries from Eastern Europe, which experienced high
rates of bank credit growth as the banking sectors were developing after the collapse of
communism, is a possible reason why high bank credit growth is not found to matter in either
crisis.
Tornell (1999) repeats the STV exercise using both the Mexican and the Asian crisis. He
finds that in both crises, countries that had experienced a larger appreciation of the real exchange
rate, or had a bank lending boom, had more severe crisis unless they had large amounts of
reserves to outstanding short-term debt. The findings regarding the real exchange rate
appreciation, however, are not as strong in the Asian crisis. Berg and Patillo (1998) perform a
similar exercise using yet another sample of countries. During the Mexican crisis they find a role
for the expansion of bank credit but no role for real exchange rate appreciation. They also find
no role for either real exchange rate appreciation or bank credit expansion in the Asian crisis.
5.3 Transmission of Crises
When we test for the possibility of transmission of crises through similar trade and debt
patterns in the Mexican and Asian crises, we find a role for trade and currency composition of
debt in the Asian crisis but not in the Mexican crisis. Because the sample is rather small, we
check the robustness of the results by repeating the analysis 20 times dropping a different
country each time from the sample. A result is considered to be not robust if dropping six or
more of the countries causes the results to become insignificant, moderately robust if dropping
between three and five countries causes the results to become insignificant, and is otherwise
considered robust. The results, all robust, appear in Table 5.
For the Asian crisis, we find that both currency composition and trade patterns (although
in the latter case the result is only marginally significant) affect the severity of the crisis.
Countries that had high levels of long-term debt denominated in Yen fared poorly in the crisis,
31 To interpret the coefficients in tables 4 thru 6 keep in mind that the crisis index is defined as a negative
number (a lower number means a more severe crisis) and an appreciation is measured as a fall in the real exchange rate (a negative number means a larger appreciation).
32 We do not, however, find that high bank credit growth resulted in a more severe crisis.

20
and nations that had a larger share of their exports to Japan tended to have more severe crises.
Both these results are robust. We believe that the findings regarding currency composition are
the result of a mismatch between the currency that debt is denominated in and the exchange
rate.33 Many countries in East Asia were pegging their currency to the dollar (McKinnon, 1999)
and denominating their debts in Yen [Figures 3(a)-3(h)]. Over the years prior to the crisis there
was a steady drop in the Yen-Dollar rate, thus increasing the cost of servicing foreign debt for
countries borrowing in Yen.34 Finding a marginal role for trade patterns is evidence of the
countries’ loss of competitiveness during the years immediately preceding the crisis, and also
that competitive devaluations were important in transmitting the crisis. A weak Japanese
economy may have negatively affected the economies of countries who depended on exporting
to the Japanese market, and therefore increased the pressure on countries to devalue to preserve
export levels.
We find no effect of either trade or debt composition linkages in the Mexican crisis.
During the Mexican crisis the concern was over short-term Dollar-indexed debt. Admittedly, this
would not be included in our sample because this debt was not long-term and not actually
denominated in Dollars.
5.4 Testing Short Term Debt
We examine the two crises first using the raw measure of short-term debt to reserves and
then using instrumental variables.35 Results from both the Mexican and Asian crises are in Table
6.
For the Mexican crisis, we find that the amount of short-term debt matters. Having more
short-term debt to reserves increases the severity of the crisis. This result is significant using both
raw levels of short-term debt to reserves and instrumental variables. Also like Rodrik and
Velasco, we find that it is important to use reserves as the denominator. Similar analysis using
the ratio of net flows of short-term debt to net capital flows indicated no significant role for
short-term debt when instrumental variables were used.
33 Note that this argument requires that this mismatch not be hedged. Again, Goldstein (1998) suggests
that this was the case. 34 See figures 3(a) –3(h) in Section 3. 35 The instrumental variable estimation technique helps reduce the endogeneity problem.

21
In the instrumental variable estimation for the Mexican Crisis, we find a detrimental
effect of a higher level of real exchange rate appreciation.36 This is the same effect as predicted
by the literature. During the Asian crisis, we do not find a role for short-term debt, but there is
evidence that a higher stock of M2 over reserves made the crisis worse –countries with a lower
reserve coverage of monetary balances fared worse during the crisis.
5.5 Are Crises Really the Same
Above, we examine each crisis individually. Most studies group crises because it
increases the number of observations. But grouping crises also imposes that the variables have
the same effect in all crises. We test whether this is appropriate. In particular, we focus on
whether the effects of short-term debt and fundamentals are the same in the two crises. The test
results for both the ordinary least squares and instrumental variables estimation are provided in
Table 6.
We find that there are differences in the effects of short-term debt to reserves between the
two crises for the six, nine and especially the twelve months horizon. We also find that the real
exchange rate appreciation and the ratio of M2 to reserves have different effects during the two
crises in the six months horizon when instrumental variables are used and that the effects of
economic fundamentals are otherwise not different between the crises. These results suggest that
imposing constraints that coefficients are to be the same across crises may be incorrect.
5.6 Discussion
Each result in our study of crises has support in the literature. Our findings that trade
linkages may be important fits well with the contagion literature. Glick and Rose (1998) argue
that countries with strong trade linkages with crisis countries have an increased likelihood
themselves of suffering a crisis. Since Japan was an important trading partner for all the East-
Asian countries, competitive devaluations may indeed have been important and contributed to
the severity of the Asian Crisis.
Having large share of debt denominated in Yen may have increased the severity of the
crisis for several reasons. First, the appreciation of the Yen in the years prior to the crisis
increased the cost of servicing the debt, especially given the de facto peg to the dollar. Also,
36 See footnote 31.
22
Goldstein (1998) describes the role of a “wake-up call” where investors become concerned about
countries that have economic fundamentals similar to those of the crisis country. Contagion
through similarity may also occur when countries have similar compositions of foreign
liabilities, in this case long-term Yen denominated debt. This may be especially true in Asia
where the “Asian Carry Trade” was popular. Investors would borrow in Japan and lend to other
East Asian countries. If this strategy broke down for Thailand, investors may have felt the
strategy itself might break down in other countries where the lending pattern was similar.
Our findings regarding short-term debt also fit with the literature. There has been much
recent work on the role and impacts of short-term debt. Calvo and Reinhart (1999) discuss the
negative effects of sudden stops in short-term debt. They illustrate how this liquidity problem
can be transformed into a solvency problem. Rodrik and Velasco (1999) found that insufficient
reserves to match short-term debt may increase the likelihood and severity of crises. Our findings
using instrumental variables further support the view that there is a role for short-term debt in
increasing the severity of crises.
Another important part of our paper is that the factors contributing to the severity of the
crises are different. This might be one of the reasons why efforts by Berg and Patillo (1998) to
use results from the Mexican crisis to construct warning measures for the Asian crisis prove
difficult. An important line of future research is determining both how similar and how different
financial crises are.
6: Conclusions and Policy Implications
Financial crises have devastating impacts. Finding that the composition of capital inflows
affects the likelihood or severity of financial crises would provide a justification for governments
to implement policies that affect the types of capital flows into their country. In this paper, we
find that the same factors did not play the same role in the two crises that are examined –Mexico
’94 and Asia ’97–, suggesting that there is no one type of inflow that is the sole cause of crises.
Instead, there are a variety of financial linkages that governments may want to monitor. We find
that the currency denomination of debt affected the severity of countries’ experiences during the
Asian crisis, possibly because debt denomination was not matched to the countries’ exchange
rate pegs and the debt was appreciating in value. This suggests that governments should choose
their currency pegs carefully and may have an interest in encouraging debt to be denominated in

23
particular currencies. In the Mexican crisis, we find some evidence that excessive amounts of
short-term debt to reserves contributed to the crisis.
Fortunately governments have the ability to influence the types of capital inflows they
receive either by imposing capital controls or by establishing a particular exchange rate regime.
Letting the exchange rate float tends to increase the share of short-term debt in total capital
inflows. Imposing restrictions on capital transactions on the other hand, tends to increase the
share of FDI.
We also find evidence that the balance of capital inflows during non-crisis times may be
different than the conventional view. Usually short-term debt and portfolio equity are grouped
together. We find, however, that portfolio equity flows respond to policies in a manner similar to
that of FDI and in a manner opposite to that of short-term debt. It may be that portfolio equity is
not of a short-term nature after all. It may be, as suggested by the 2001 Global Development
Finance Report (World Bank, 2001), that equity investors are concerned with fundamentals and
have longer time horizons than debt holders. Thus, it is a mistake to always group short-term
debt and portfolio equity. It may also be that short-term debt and portfolio equity are substitutes.
Investors may choose one or the other depending on the incentives created by different
government policies. Because this question has important implications for the impacts of
government policy, further investigating and resolving this question is an important line of future
research.

24
Appendix 1 – Data Sources
GDF = World Bank Global Development Finance Report IFS = IMF International Financial Statistics WEO = IMF World Economic Outlook DTS = IMF Direction of Trade Statistics
Economic Fundamentals
- Gross Domestic Product. Reported as millions of units of the domestic currency, reported in current currency units. Obtained from the IFS – line 99b.
- GDP deflator. Reported as an index number. Obtained from the WEO.
- Stock of International Reserves. In Millions of US dollars. Taken from the WEO except for Korea where the GDF values are used.
- Inflation rate. Calculated as the rate of change in the countries CPI. The CPI is obtained from the IFS – line 64.
- Exchange rate. Average for the year. Reported as unit of domestic currency to the dollar. Obtained from the IFS – line rf.
- Stock of domestic credit of the central bank. Millions of units of the domestic currency. Defined as: sum of claims by the central bank on the central goverment, local government, other public enterprises, private sector, banking institutions, and nonbank financial institutions. Obtained from the IFS – line 32.
- Interest rate paid on deposits. Reported as a rate. Interest rate paid on savings deposits, or the closest substitute. Obtained from the IFS – line 60l.
- LIBOR. 3 month rate on Eurodollar deposits as reported in IFS
- Real exchange rate appreciation. percent change in the real exchange rate. Real exchange rate calculated as [Exchange rate with US Dollar]*[US WPIt]/[Country’s CPIt]. All components of the real exchange rate come from the IFS.
- Yield on government bonds in the United States. Obtained from the IFS.
- Growth rate of real GDP in the USA. Real GDP calculated by dividing nominal GDP by the GDP deflator. All components from the IFS.
- Ratio of reserves to M2. Calculated as (Reserves*exchange rate with Dollar)/(Money + QuasiMoney). Reserves in US dollars, Money reported in national currency. Construction same as Sachs, Tornell, and Velasco (1996). Reserves from WEO other variables from IFS.
- Expansion of bank credit. Calculated as [(BankCredit Year2 – BankCredit Year1)/(BankCredit Year1)] / [(GDP Year2 – GDP Year1)/(GDP Year1)]. Variables measured in national currency. All Variables from the IFS.
- Real Exchange Rate Appreciation. Calculated as percent changes in real exchange rate. Real exchange rate calculated as (nominal e-rate)*(trade weighted foreign WPI)/(domestic CPI). Trade weighted WPI calculated as (USWPI*ExUS/SE + GerWPI*ExGer/SE + JpnWPI*ExJpn/SE) where SE = sum exports to Japan, Germany, and the United States. All variables from IFS.

25
Trade and Capital Flows
- Net flows of foreign direct investment. In millions of US dollars. Obtained from the GDF.
- Flows of Portfolio Equity into the country. (Believed to be net, however this is not clearly indicated) In millions of US dollars. Obtained from the GDF.
- Net flow of Short Term Debt into the country. In millions of US dollars. Obtained from the GDF. (Note stocks and flows of debts do not necessarily add up – see GDF documentation for reconciliation information).
- Net flow of capital into the country. In millions of US dollars. Obtained from the WEO.
- Calculated Capital Flows. Calculated as the sum of NFfdi, NFpe, and NFtd
- Exports to the United States. Recorded in millions of US dollars. As reported in the DTS.
- Exports to Japan. Recorded in millions of US dollars. As reported in the DTS.
- Exports to the World. Recorded in millions of US dollars. As reported in the DTS.
- Faction of exports to the United States. Calculated as exports to the USA divided by world exports. Reported in DTS.
- Fraction of exports to Japan. Calculated as exports to the Japan divided by world exports. Reported in DTS.
- Portion of long term debt denominated in Japanese Yen. Recorded as a percent. Obtained from the GDF.
- Portion of long term debt denominated in United States Dollars. Recorded as a percent. Obtained from the GDF.
- Total stock of short-term debt at the end of 1996 (million dollar value). Reported in GDF.
- Stock of foreign assets in the country. Calculated as stock of debt in the country in 1980 + value of the financial account + the value of the errors and omissions from 1981 to 1996. All valued in 1995 US dollars. All variables from the IFS.
Policy Variables
- Sterilization Index – a measure of sterilization calculated from changes in the dollar value of (exchange rate = XR) domestic credit (DC) and international reserves (IR). Calculated as: -1*[(DC Year2)/(XRYear2)-(DC Year1)/(XR Year1)] ÷[(IR Year2) - (IRYear1)]
- High Sterilization Dummy – 1 if in upper quartile of the sterilization index, 0 otherwise.
- Dummy variable indicating the country has restriction on capital account transactions
- Dummy variable indicating the country has restrictions on the surrender of export proceeds
- Dummy indicating the country used a fixed exchange rate. From Yeyati and Sturzenegger
- Dummy indicating the country used a dirty float exchange rate. From Yeyati and Sturzenegger
- Dummy indicating the country used a floating exchange rate. From Yeyati and Sturzenegger

26
Crises Measures
- Crisis Index. Calculated at 6 months, 9 months, and 12 months. Constructed by; 1. Calculating monthly changes in interest rates and monthly percent change in nominal
exchange rates and reserves over the years prior to the crisis and then calculating the variances of these changes. Dates used are January 1990 – October 1994 for the Mexican crisis and January 1996 – June 1997 for the Asian crisis.
2. Calculating the change in interest rates, nominal exchange rates and reserves for 6, 9 and 12months after the crisis. These are then added together.
3. Using the variances of prior changes as weights for the post crisis change in these
variables. Weights are calculated as : ��
���
�
σΣσ
−��
�
�2i
2i1*
21
4. The index is then (%∆e)(we) + (%∆r)(wr) – (∆i)(wi) where (w) indicates a weight.

27
References
Ahluwalia, P. (2000), “Discriminating Contagion: An Alternative Explanation of Contagious Currency Crises in Emerging Markets,” IMF Working Paper WP/00/14, February.
Alba, P., A. Bharracharya, S. Claessens, S. Ghosh, and L. Hernandez (2000), “Volatility and Contagion in a Financially Integrated World: Lessons from East Asia’s Recent Experience,” In G. de Brouwer & W. Pupphavesa (eds.), Asia Pacific Financial Deregulation, Routledge, London.
Berg, Andrew and Catherine Pattillo (1998), “Are Currency Crises Predictable: A Test” IMF Working Paper WP/98/154, November.
Bohn, Henning and Linda Tesar (1998), “U.S. Portfolio Investment in Asian Capital Markets” in Reuven Glick (ed.) Managing Capital Flows and Exchange Rates, Cambridge University Press, Cambridge, United Kingdom.
Calvo, G., (1998), “Capital Flows and Capital Market Crises: The Simple Economics of Sudden Stops,” Journal of Applied Economics, Vol.1, No.1, pp. 35-54.
Calvo, G., L. Leiderman, and C. Reinhart (1993), “Capital Flows and The Real Exchange Rate Appreciation in Latin America: The Role of External Factors” IMF Staff Papers, Vol. 40, No 1, March.
Calvo, G. and C. Reinhart (1996), “Capital Flows to Latin America: Is There Evidence of Contagion?,” In G. Calvo, M. Goldstein, and E Hochreiter (eds.) Private Capital Flows to Emerging Markets After the Mexican Crisis, Institute for International Economics and Austrian National Bank, Washington D.C., USA and Vienna, Austria.
Chuhan, P., S. Claessens, and N. Mamingi (1998), “Equity and Bond Flows to Latin America and Asia: the Role of Global and Country Factors,” Journal of Development Economics Vol. 55, pp. 439-463.
Claessens, Stijn, Michael Dooley, and Andrew Warner (1995), “Portfolio Capital Flows: Hot or Cold,” The World Bank Economic Review, Vol. 9, No. 1, January.
Corbo, Vittorio and Leonardo Hernández (2001), “Private Capital Inflows and the Role of Economic Fundamentals”. In Felipe Larraín (ed.), Capital Flows, Capital Controls, and Currency Crisis: Latin America in the 1990s, Michigan University Press.
Eichengreen, B., and M. Mussa, with G. Dell’Ariccia, E. Detragiache, G. Milesi-Ferretti, and A. Tweedie (1998), Capital Account Liberalization: Theoretical and Practical Aspects, Occasional Paper 172, International Monetary Fund.
Eichengreen, Barry, Andrew Rose, and Charles Wyplosz (1995) “Exchange Market Mayhem: The Antecedents and Aftermath of Speculative Attacks” Economic Policy.
Fernandez-Arias, E. (1996), “The New Wave of Private Capital Inflows: Push or Pull?,” Journal of Development Economics, Vol. 48, pp. 389-418.
Fernandez-Arias, E. and P. Montiel (1995), “The Surge in Capital Inflows to Developing Countries: Prospects and Policy Response,” World Bank Working Paper 1473.
Frankel, Jeffrey and Andrew Rose (1996) “Currency Crashes in Emerging Markets: An Empirical Treatment,” Journal of International Economics, Vol. 41, pp. 351-366.

28
Girton, Lance, and Don Roper, 1977, “A Monetary Model of Exchange Market Pressure Applied to the Postwar Canadian Experience,” American Economic Review, Vol. 67, No. 4 (September) pp. 537–48.
Glick, Reuven and Andrew Rose (1998) “Contagion and Trade: Why are Currency Crises Regional,” Pacific Basin Working Paper Series, PB98-03.
Goldberg, Linda and Michael Klein (1998) “Foreign Direct Investment, Trade, and Real Exchange Rate Linkages in Developing Countries,” in Reuven Glick (ed.) Managing Capital Flows and Exchange Rates, Cambridge University Press, Cambridge, United Kingdom.
Goldstein, Morris (1998) The Asian Financial Crisis: Causes, Cures, and Systemic Implications, Institute for International Economics, Washington, D.C.
Goldstein, Morris and John Hawkins (1998) “The Origins of the Asian Financial Turmoil,” Reserve Bank of Australia Research Discussion Paper 980, May.
Hausmann, R. and E. Fernandez-Arias (2000), “Foreign Direct Investment: Good Cholesterol,” Inter-American Development Bank Working Paper, # 417.
Hernández, L and H. Rudolph (1997), “Sustainability of Private Capital Flows to Developing Countries: Is a Generalized Reversal Likely?” Cuadernos de Economia, Number 102 (August), pp. 237-266.
Hernández, L. and R. Valdés (2001), “What Drives Contagion: Trade, Neighborhood, or Financial Links?”. International Review of Financial Analysis (10) pp 1-16.
Kwan, C.H. (1997), “Causes and Consequences of Asia’s Currency Crisis,” Nomura Research Institute: Tokyo, October.
Levy-Yeyati, Eduardo and Frederico Sturzenegger (1999), “Classifying Exchange Rate Regimes: Deeds vs. Words” Univerisidad Torcuato Di Tella, unpublished manuscript.
McKinnon, Ronald (1999), “The East Asian Dollar Standard, Life After Death,” Workshop for the Economic Development Institute, World Bank, February, 1999
Mishkin, Frederic (1996), “Understanding Financial Crises: A Developing Country Perspective.” NBER Working Paper, 5600.
Montiel, P. (1996), “Policy Responses to Surges in Capital Inflows: Issues and Lessons,” In G. Calvo, M. Goldstein, and E Hochreiter (eds.) Private Capital Flows to Emerging Markets After the Mexican Crisis, Institute for International Economics and Austrian National Bank, Washington D.C., USA and Vienna, Austria.
Montiel, P. and C. Reinhart (1999), “Do Capital Controls and Macroeconomic Policies Influence the Volume and Composition of Capital Flows? Evidence from the 1990’s,” Journal of International Money and Finance, Vol. 18(4), pp.619-35.
Radalet, Steven and Jeffrey Sachs (1998), “The Onset of the East Asian Financial Crisis,” Cambridge, MA: Harvard Institute for International Development, presented at National Bureau of Economic Research Currency Crises Conference.
Rodrik, D., and A. Velasco (1999), “Short-Term Capital Flows,” NBER Working Paper, 7364.
Schadler, S., M. Carkovic, A. Bennett and R. Kahn (1993), Recent Experiences With Surges in Capital Inflows, Occassional Paper 108, International Monetary Fund.

29
Sachs, J., A. Tornell, and A. Velasco (1996), “Financial Crises in Emerging Markets: The Lessons from 1995,” Brookings Papers on Economic Activity 1, pp. 147-215.
World Bank (2001), Global Development Finance, The World Bank, Washington DC.

30
Figure 1(a)
Figure 1(b)
Argentina
-0.5
0
0.5
1
1.5
2
2.5
3
1988 1989 1990 1991 1992 1993 1994 1995 1996 1997 1998
Year
Shar
es
Portfolio Equity FDI Short-Term Debt
Brazil
-2
-1
0
1
2
3
4
5
6
7
8
9
1988 1989 1990 1991 1992 1993 1994 1995 1996 1997 1998
Year
Shar
es
Portfolio Equity FDI Short-Term Debt
31
Figure 1(c)
Figure 1(d)
India
-0.6
-0.4
-0.2
0
0.2
0.4
0.6
0.8
1
1988 1989 1990 1991 1992 1993 1994 1995 1996 1997 1998
Year
Shar
es
Portfolio Equity FDI Short-Term Debt
Indonesia
-1
-0.5
0
0.5
1
1.5
2
2.5
3
1988 1989 1990 1991 1992 1993 1994 1995 1996 1997 1998
Year
Shar
es
Portfolio Equity FDI Short-Term Debt
32
Figure 1(e)
Figure 1(f)
Korea
-2.5
-2
-1.5
-1
-0.5
0
0.5
1
1.5
2
2.5
1988 1989 1990 1991 1992 1993 1994 1995 1996 1997 1998
Year
Shar
es
Portfolio Equity FDI Short-Term Debt
Mexico
-1.5
-1
-0.5
0
0.5
1
1.5
2
1988 1989 1990 1991 1992 1993 1994 1995 1996 1997 1998
Year
Shar
es
Portfolio Equity FDI Short-Term Debt

33
Figure 1(g)
Figure 1(h)
Poland
-1
0
1
2
3
4
5
1988 1989 1990 1991 1992 1993 1994 1995 1996 1997 1998
Year
Shar
es
Portfolio Equity FDI Short-Term Debt
Thailand
-0.4
-0.2
0
0.2
0.4
0.6
0.8
1
1988 1989 1990 1991 1992 1993 1994 1995 1996 1997 1998
Year
Shar
es
Portfolio Equity FDI Short-Term Debt
34
Figure 2(a)
Figure 2(b)
Argentina
-0.5
0
0.5
1
1.5
2
2.5
3
1988 1989 1990 1991 1992 1993 1994 1995 1996 1997 1998
Year
Shar
es
-20
0
20
40
60
80
100
120
GD
P &
Inde
x
FDI Short-Term Debt Sterilization Index GDP Growth Rate
Brazil
-2-10123456789
1988 1989 1990 1991 1992 1993 1994 1995 1996 1997 1998
Year
Shar
es
-100000100002000030000400005000060000700008000090000100000
GD
P &
Inde
x
FDI Short-Term Debt Sterilization Index GDP Growth Rate

35
Figure 2(c)
Figure 2(d)
India
-0.6-0.5-0.4-0.3-0.2-0.1
00.10.20.30.40.5
1988 1989 1990 1991 1992 1993 1994 1995 1996 1997 1998
Year
Shar
es
-15
-10
-5
0
5
10
15
20
25
30
GD
P &
Inde
x
FDI Short-Term Debt Sterilization Index GDP Growth Rate
Indonesia
-20
-15
-10
-5
0
5
10
15
20
25
1988 1989 1990 1991 1992 1993 1994 1995 1996 1997 1998
Year
Shar
es
-30
-25
-20
-15
-10
-5
0
5
10
15
20G
DP
& In
dex
FDI Short-Term Debt Sterilization Index GDP Growth Rate

36
Figure 2(e)
Figure 2(f)
Korea
-2.5
-2
-1.5
-1
-0.5
0
0.5
1
1.5
2
1988 1989 1990 1991 1992 1993 1994 1995 1996 1997 1998
Year
Shar
es
-60
-40
-20
0
20
40
60
80
GD
P &
Inde
x
FDI Short-Term Debt Sterilization Index GDP Growth Rate
Mexico
-1.5
-1
-0.5
0
0.5
1
1.5
2
1988 1989 1990 1991 1992 1993 1994 1995 1996 1997 1998
Year
Shar
es
-25
-20
-15
-10
-5
0
5
10G
DP
& In
dex
FDI Short-Term Debt Sterilization Index GDP Growth Rate
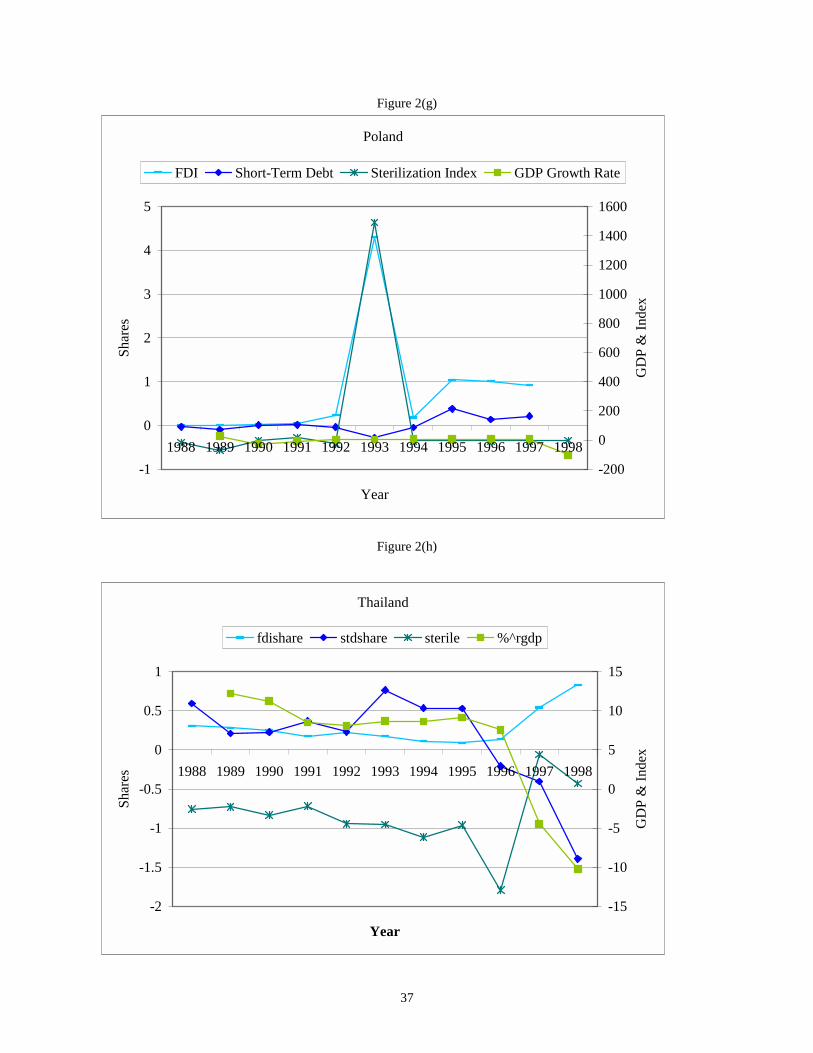
37
Figure 2(g)
Figure 2(h)
Poland
-1
0
1
2
3
4
5
1988 1989 1990 1991 1992 1993 1994 1995 1996 1997 1998
Year
Shar
es
-200
0
200
400
600
800
1000
1200
1400
1600
GD
P &
Inde
x
FDI Short-Term Debt Sterilization Index GDP Growth Rate
Thailand
-2
-1.5
-1
-0.5
0
0.5
1
1988 1989 1990 1991 1992 1993 1994 1995 1996 1997 1998
Year
Shar
es
-15
-10
-5
0
5
10
15
GD
P &
Inde
xfdishare stdshare sterile %^rgdp

38
Figure 3(a)
Figure 3(b)
Argentina
0
10
20
30
40
50
60
70
80
1988 1989 1990 1991 1992 1993 1994 1995 1996 1997 1998
Year
Cur
renc
y/Ex
port
Shar
es
0
20
40
60
80
100
120
140
160
Yen
/Dol
lar E
xcha
nge
Rat
e
Yen Debt Dollar Debt US Exports Japan Exports Yen-Dollar Rate
Brazil
0
10
20
30
40
50
60
70
80
1988 1989 1990 1991 1992 1993 1994 1995 1996 1997 1998
Year
Cur
renc
y/Ex
port
Shar
es
0
20
40
60
80
100
120
140
160Y
en/D
olla
r Exc
hang
e R
ate
Yen Debt Dollar Debt US Exports Japan Exports Yen-Dollar Rate

39
Figure 3(c)
Figure 3(d)
India
0
10
20
30
40
50
60
70
1988 1989 1990 1991 1992 1993 1994 1995 1996 1997 1998
Year
Cur
renc
y/Ex
port
Shar
es
0
20
40
60
80
100
120
140
160
Yen
/Dol
lar E
xcha
nge
Rat
e
Yen Debt Dollar Debt US Exports Japan Exports Yen-Dollar Rate
Indonesia
0
10
20
30
40
50
60
1988 1989 1990 1991 1992 1993 1994 1995 1996 1997 1998
Year
Cur
renc
y/Ex
port
Shar
es
0
20
40
60
80
100
120
140
160Y
en/D
olla
r Exc
hang
e R
ate
Yen Debt Dollar Debt US Exports Japan Exports Yen-Dollar Rate
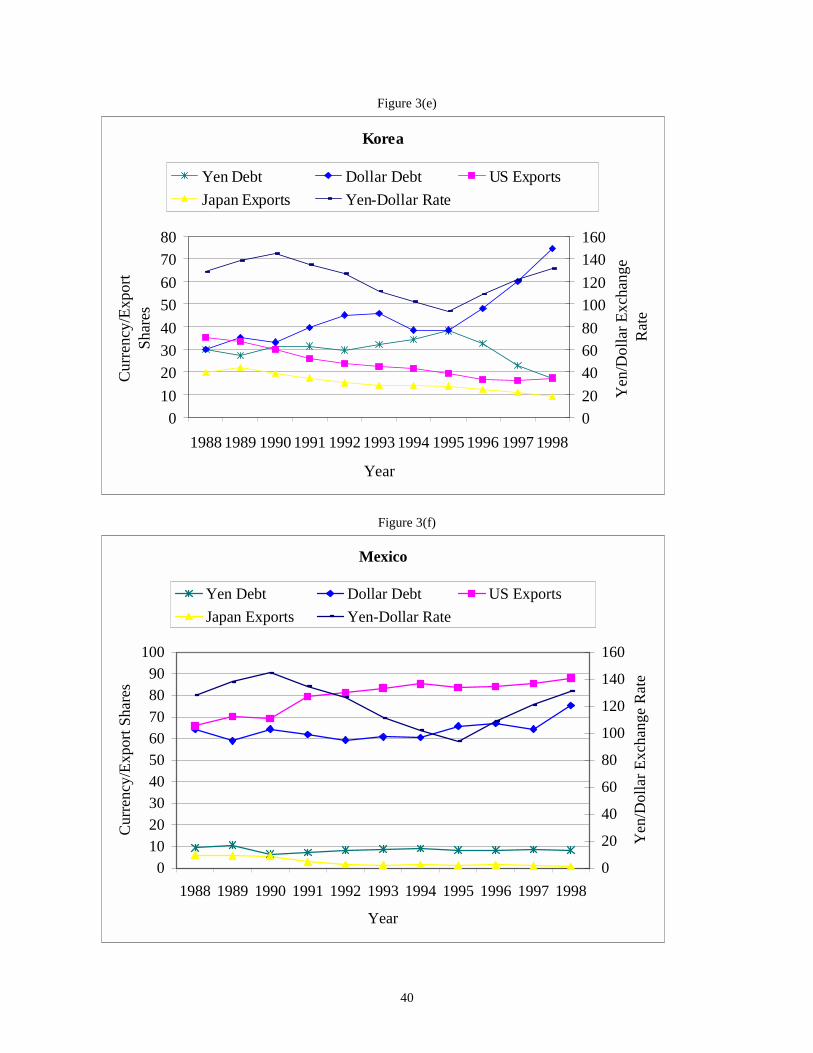
40
Figure 3(e)
Figure 3(f)
Korea
01020304050607080
1988 1989 1990 1991 1992 1993 1994 1995 1996 1997 1998
Year
Cur
renc
y/Ex
port
Shar
es
020406080100120140160
Yen
/Dol
lar E
xcha
nge
Rat
e
Yen Debt Dollar Debt US ExportsJapan Exports Yen-Dollar Rate
Mexico
0102030405060708090
100
1988 1989 1990 1991 1992 1993 1994 1995 1996 1997 1998
Year
Cur
renc
y/Ex
port
Shar
es
0
20
40
60
80
100
120
140
160Y
en/D
olla
r Exc
hang
e R
ate
Yen Debt Dollar Debt US ExportsJapan Exports Yen-Dollar Rate
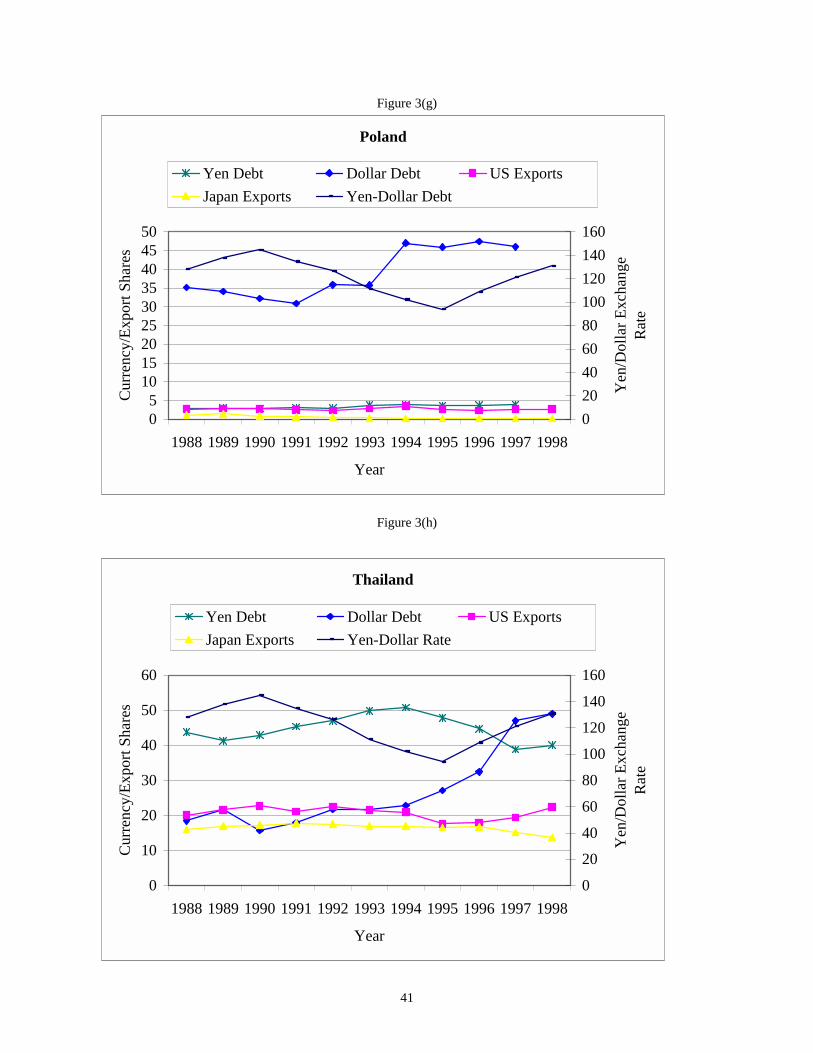
41
Figure 3(g)
Figure 3(h)
Poland
05
101520253035404550
1988 1989 1990 1991 1992 1993 1994 1995 1996 1997 1998
Year
Cur
renc
y/Ex
port
Shar
es
020406080100120140160
Yen
/Dol
lar E
xcha
nge
Rat
e
Yen Debt Dollar Debt US ExportsJapan Exports Yen-Dollar Debt
Thailand
0
10
20
30
40
50
60
1988 1989 1990 1991 1992 1993 1994 1995 1996 1997 1998
Year
Cur
renc
y/Ex
port
Shar
es
0
20
40
60
80
100
120
140
160
Yen
/Dol
lar E
xcha
nge
Rat
eYen Debt Dollar Debt US ExportsJapan Exports Yen-Dollar Rate

42
Table 1
Determinants of the Share of Foreign Direct Investment Dependent variable: Share of net capital flows consisting of FDI
Panel SUR Coef. t test Mg sig lev Coef. t test Mg sig lev Lagged Dependent Variable -0.168 -2.060 0.042 -0.058 -0.991 0.322 Percent Change in GDP 0.007 0.439 0.661 -0.017 -0.875 0.382 Percent Change in GDP for East Asia 0.135 3.039 0.003 0.172 3.907 0.000 Interest Rate Differential 0.000 0.416 0.678 0.000 0.709 0.478 High Sterilization Indicator -0.235 -1.022 0.310 -0.348 -1.624 0.104 High Sterilization Indicator outside East Asia and Latin America 0.404 0.998 0.321 0.336 0.783 0.434 Surrender Export Proceed (SEP) -0.176 -0.735 0.464 -0.079 -0.352 0.725 Capital Transaction Restrictions (CTR) 0.499 2.026 0.046 0.462 1.957 0.050 Fixed Exchange Rate -0.038 -0.096 0.924 -0.020 -0.057 0.954 Dirty Float Exchange Rate -0.688 -2.934 0.004 -0.630 -2.993 0.003 Floating Exchange Rate -0.806 -2.116 0.037 -0.693 -2.023 0.043 CTR*Fixed Exchange Rate -0.827 -1.384 0.170 -0.738 -1.407 0.160 SEP*Fixed Exchange Rate 0.036 0.064 0.949 -0.006 -0.011 0.991 SEP* Floating Exchange Rate 0.221 0.588 0.558 0.177 0.529 0.597 Constant 0.360 1.173 0.244 0.681 1.813 0.070 N 124 117 R sqr 0.244 0.363 F test // Chi-sqr test 2.160 66.13 Mg sig level 0.015 0.001

43
Table 2 Determinants of the Share of Short-Term Debt
Dependent variable: Share of net capital flows consisting of short-term debt Panel SUR Coef. t test Mg sig lev Coef. t test Mg sig lev Lagged Dependent Variable -0.194 -2.404 0.018 -0.084 -1.506 0.132 Percent Change in GDP 0.003 0.163 0.871 0.008 0.302 0.763 Percent Change in GDP for East Asia -0.232 -4.133 0.000 -0.257 -4.576 0.000 Interest Rate Differential 0.000 -1.259 0.211 0.000 -1.586 0.113 High Sterilization Indicator 0.634 2.188 0.031 0.751 2.745 0.006 High Sterilization Indicator outside East Asia and Latin America -0.808 -1.587 0.116 -0.886 -1.617 0.106 Surrender Export Proceed (SEP) 0.038 0.128 0.899 -0.045 -0.160 0.873 Capital Transaction Restrictions (CTR) -0.476 -1.530 0.129 -0.443 -1.471 0.141 Fixed Exchange Rate -0.168 -0.337 0.737 -0.206 -0.452 0.651 Dirty Float Exchange Rate 0.855 2.818 0.006 0.761 2.800 0.005 Floating Exchange Rate 1.315 2.724 0.008 1.256 2.861 0.004 CTR*Fixed Exchange Rate 1.317 1.748 0.084 1.247 1.863 0.062 SEP*Fixed Exchange Rate -0.098 -0.137 0.892 -0.022 -0.033 0.974 SEP* Floating Exchange Rate -0.593 -1.249 0.215 -0.641 -1.502 0.133 Constant 0.396 1.047 0.298 -0.026 -0.054 0.957 N 124 117 R sqr 0.317 0.414 F test // Chi-sqr test 3.110 82.0 Mg sig level 0.001 0.000
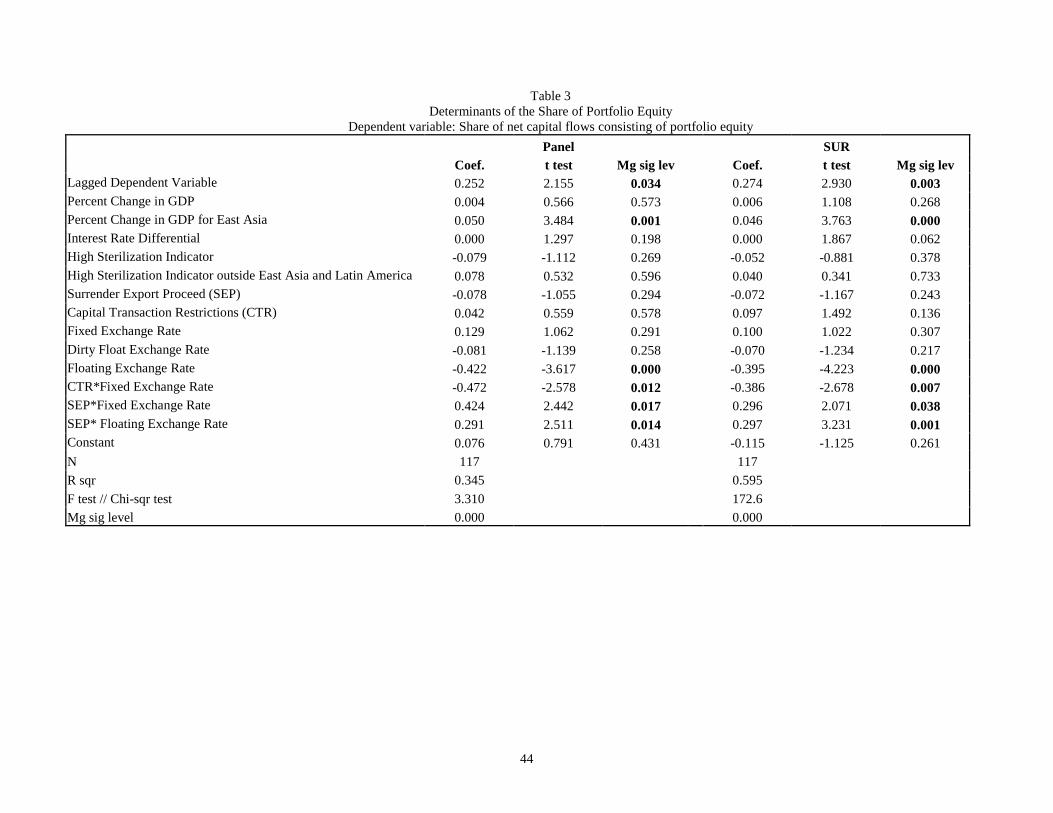
44
Table 3 Determinants of the Share of Portfolio Equity
Dependent variable: Share of net capital flows consisting of portfolio equity Panel SUR Coef. t test Mg sig lev Coef. t test Mg sig lev Lagged Dependent Variable 0.252 2.155 0.034 0.274 2.930 0.003 Percent Change in GDP 0.004 0.566 0.573 0.006 1.108 0.268 Percent Change in GDP for East Asia 0.050 3.484 0.001 0.046 3.763 0.000 Interest Rate Differential 0.000 1.297 0.198 0.000 1.867 0.062 High Sterilization Indicator -0.079 -1.112 0.269 -0.052 -0.881 0.378 High Sterilization Indicator outside East Asia and Latin America 0.078 0.532 0.596 0.040 0.341 0.733 Surrender Export Proceed (SEP) -0.078 -1.055 0.294 -0.072 -1.167 0.243 Capital Transaction Restrictions (CTR) 0.042 0.559 0.578 0.097 1.492 0.136 Fixed Exchange Rate 0.129 1.062 0.291 0.100 1.022 0.307 Dirty Float Exchange Rate -0.081 -1.139 0.258 -0.070 -1.234 0.217 Floating Exchange Rate -0.422 -3.617 0.000 -0.395 -4.223 0.000 CTR*Fixed Exchange Rate -0.472 -2.578 0.012 -0.386 -2.678 0.007 SEP*Fixed Exchange Rate 0.424 2.442 0.017 0.296 2.071 0.038 SEP* Floating Exchange Rate 0.291 2.511 0.014 0.297 3.231 0.001 Constant 0.076 0.791 0.431 -0.115 -1.125 0.261 N 117 117 R sqr 0.345 0.595 F test // Chi-sqr test 3.310 172.6 Mg sig level 0.000 0.000
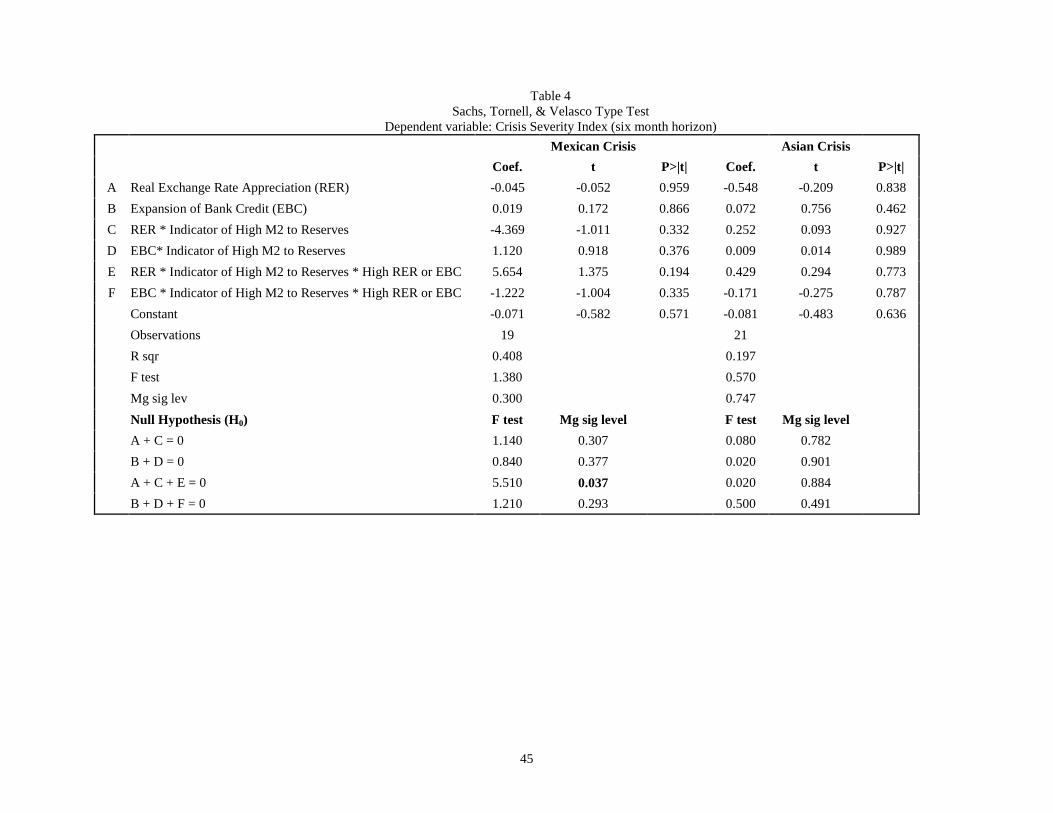
45
Table 4 Sachs, Tornell, & Velasco Type Test
Dependent variable: Crisis Severity Index (six month horizon) Mexican Crisis Asian Crisis Coef. t P>|t| Coef. t P>|t|
A Real Exchange Rate Appreciation (RER) -0.045 -0.052 0.959 -0.548 -0.209 0.838 B Expansion of Bank Credit (EBC) 0.019 0.172 0.866 0.072 0.756 0.462 C RER * Indicator of High M2 to Reserves -4.369 -1.011 0.332 0.252 0.093 0.927 D EBC* Indicator of High M2 to Reserves 1.120 0.918 0.376 0.009 0.014 0.989 E RER * Indicator of High M2 to Reserves * High RER or EBC 5.654 1.375 0.194 0.429 0.294 0.773 F EBC * Indicator of High M2 to Reserves * High RER or EBC -1.222 -1.004 0.335 -0.171 -0.275 0.787
Constant -0.071 -0.582 0.571 -0.081 -0.483 0.636 Observations 19 21 R sqr 0.408 0.197 F test 1.380 0.570 Mg sig lev 0.300 0.747 Null Hypothesis (H0) F test Mg sig level F test Mg sig level A + C = 0 1.140 0.307 0.080 0.782 B + D = 0 0.840 0.377 0.020 0.901
A + C + E = 0 5.510 0.037 0.020 0.884 B + D + F = 0 1.210 0.293 0.500 0.491

46
Table 5 Testing Transmission of Crises
Dependent variable: Crisis Severity Index (six month horizon) Mexican Crisis Asian Crisis Coef. t test Mg sig lev Coef. t test Mg sig lev Ratio of M2 to Reserves -0.008 -0.418 0.683 0.013 0.405 0.692 Percent Expansion of Bank Credit 0.016 0.241 0.813 0.059 1.146 0.271 Real Exchange Rate Appreciation 0.498 1.188 0.256 -0.121 -0.276 0.787 Share Debt Denominated in United States Dollars -0.001 -0.299 0.770 Share of Total Exports to the United States -0.308 -1.061 0.308 Share Debt Denominated in Japanese Yen -0.010 -2.365 0.033 Share of Total Exports to Japan -1.726 -2.038 0.061 Constant -0.041 -0.254 0.804 0.037 0.256 0.801 N 19 20 R sqr 0.243 0.630 F test 0.830 4.770 Mg sig lev 0.549 0.009
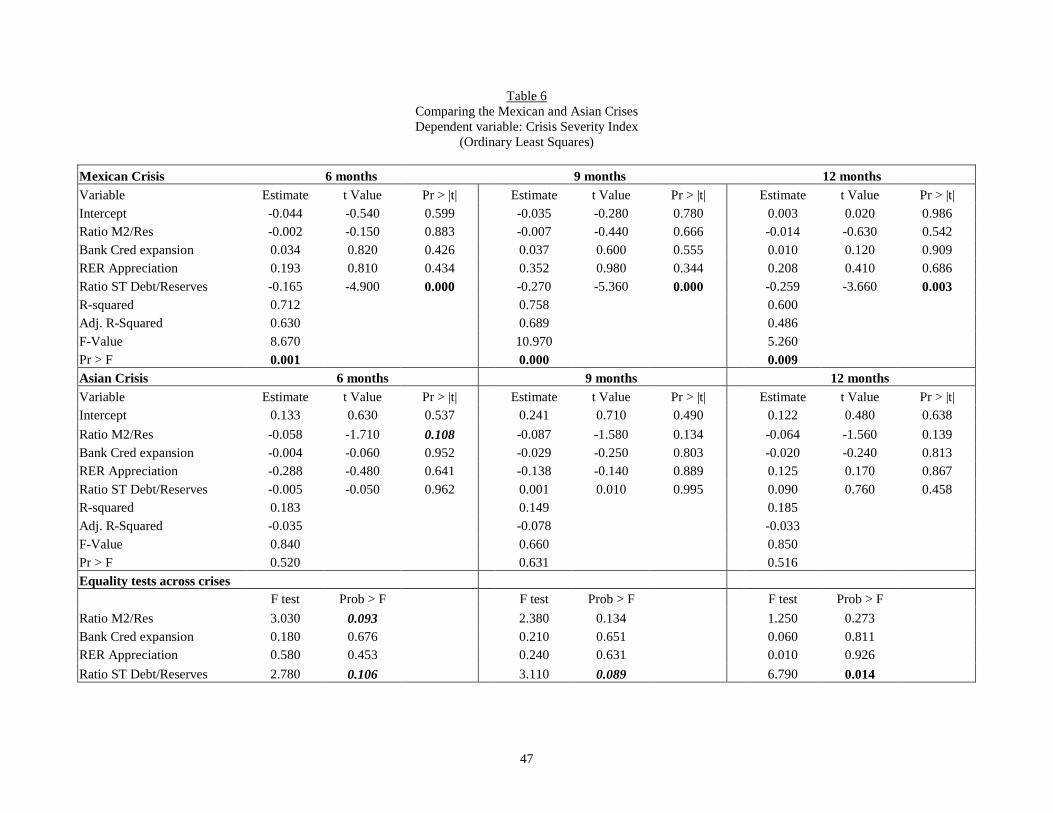
47
Table 6 Comparing the Mexican and Asian Crises Dependent variable: Crisis Severity Index
(Ordinary Least Squares)
Mexican Crisis 6 months 9 months 12 months Variable Estimate t Value Pr > |t| Estimate t Value Pr > |t| Estimate t Value Pr > |t| Intercept -0.044 -0.540 0.599 -0.035 -0.280 0.780 0.003 0.020 0.986 Ratio M2/Res -0.002 -0.150 0.883 -0.007 -0.440 0.666 -0.014 -0.630 0.542 Bank Cred expansion 0.034 0.820 0.426 0.037 0.600 0.555 0.010 0.120 0.909 RER Appreciation 0.193 0.810 0.434 0.352 0.980 0.344 0.208 0.410 0.686 Ratio ST Debt/Reserves -0.165 -4.900 0.000 -0.270 -5.360 0.000 -0.259 -3.660 0.003 R-squared 0.712 0.758 0.600 Adj. R-Squared 0.630 0.689 0.486 F-Value 8.670 10.970 5.260 Pr > F 0.001 0.000 0.009 Asian Crisis 6 months 9 months 12 months Variable Estimate t Value Pr > |t| Estimate t Value Pr > |t| Estimate t Value Pr > |t| Intercept 0.133 0.630 0.537 0.241 0.710 0.490 0.122 0.480 0.638 Ratio M2/Res -0.058 -1.710 0.108 -0.087 -1.580 0.134 -0.064 -1.560 0.139 Bank Cred expansion -0.004 -0.060 0.952 -0.029 -0.250 0.803 -0.020 -0.240 0.813 RER Appreciation -0.288 -0.480 0.641 -0.138 -0.140 0.889 0.125 0.170 0.867 Ratio ST Debt/Reserves -0.005 -0.050 0.962 0.001 0.010 0.995 0.090 0.760 0.458 R-squared 0.183 0.149 0.185 Adj. R-Squared -0.035 -0.078 -0.033 F-Value 0.840 0.660 0.850 Pr > F 0.520 0.631 0.516 Equality tests across crises F test Prob > F F test Prob > F F test Prob > F Ratio M2/Res 3.030 0.093 2.380 0.134 1.250 0.273 Bank Cred expansion 0.180 0.676 0.210 0.651 0.060 0.811 RER Appreciation 0.580 0.453 0.240 0.631 0.010 0.926 Ratio ST Debt/Reserves 2.780 0.106 3.110 0.089 6.790 0.014

48
Table 6 cont’d (Instrumental Variables)
Mexican Crisis 6 months 9 months 12 months Variable Estimate t Value Pr > |t| Estimate t Value Pr > |t| Estimate t Value Pr > |t| Intercept -0.003 -0.030 0.975 0.057 0.390 0.705 0.163 0.930 0.370 Ratio M2/Res -0.008 -0.420 0.685 -0.027 -1.000 0.341 -0.043 -1.320 0.215 Bank Cred expansion -0.003 -0.050 0.959 0.020 0.250 0.808 0.011 0.120 0.910 RER Appreciation 0.892 2.800 0.017 1.175 2.480 0.030 0.769 1.370 0.197 Instrument for ST Debt/Res -0.174 -2.900 0.014 -0.326 -3.660 0.004 -0.358 -3.400 0.006 R-squared 0.715 0.779 0.743 Adj. R-Squared 0.611 0.698 0.649 F-Value 6.890 9.660 7.930 Pr > F 0.005 0.001 0.003 Asian Crisis 6 months 9 months 12 months Variable Estimate t Value Pr > |t| Estimate t Value Pr > |t| Estimate t Value Pr > |t| Intercept 0.170 0.520 0.612 0.177 0.290 0.775 -0.077 -0.180 0.859 Ratio M2/Res -0.094 -2.490 0.030 -0.135 -1.920 0.081 -0.094 -1.910 0.082 Bank Cred expansion -0.006 -0.080 0.935 -0.031 -0.250 0.808 -0.034 -0.390 0.702 RER Appreciation -0.630 -0.920 0.376 -0.427 -0.340 0.743 0.125 0.140 0.891 Instrument for ST Debt/Res 0.077 0.230 0.823 0.251 0.400 0.696 0.444 1.020 0.332 R-squared 0.425 0.285 0.312 Adj. R-Squared 0.215 0.025 0.061 F-Value 2.030 1.090 1.250 Pr > F 0.160 0.406 0.348 Equality tests across crises F test Prob > F F test Prob > F F test Prob > F Ratio M2/Res 4.570 0.044 2.260 0.147 0.780 0.386 Bank Cred expansion 0.000 0.977 0.100 0.760 0.110 0.738 RER Appreciation 4.540 0.045 1.600 0.219 0.400 0.536 Instrument for ST Debt/Res 0.760 0.393 1.280 0.270 3.780 0.065
Related Documents