Available online at www.sciencedirect.com Respiratory Physiology & Neurobiology 159 (2007) 178–186 Determinant factors of the decrease in aerobic performance in moderate acute hypoxia in women endurance athletes Pascal Mollard a,∗ , Xavier Woorons a , Muriel Letournel b , Christine Lamberto a,b , Fabrice Favret a , Aur´ elien Pichon a , Mich` ele Beaudry a , Jean-Paul Richalet a,b a Universit´ e Paris 13, Laboratoire “R´ eponses cellulaires et fonctionnelles ` a l’hypoxie”, EA2363, ARPE, 74 rue Marcel Cachin, 93017 Bobigny Cedex, France b AP-HP, Hˆ opital Avicenne, Service de physiologie, explorations fonctionnelles et m´ edecine du sport, Bobigny, France Accepted 23 June 2007 Abstract The purpose of this study was to evaluate the limiting factors of maximal aerobic performance in endurance trained (TW) and sedentary (UW) women. Subjects performed four incremental tests on a cycle ergometer at sea level and in normobaric hypoxia corresponding to 1000, 2500 and 4500 m. Maximal oxygen uptake decrement ( ˙ V O 2 max ) was larger in TW at each altitude. Maximal heart rate and ventilation decreased at 4500 m in TW. Maximal cardiac output remained unchanged. In both groups, arterialized oxygen saturation (Sa O 2 max ) decreased at and above 2500 m and maximal O 2 transport ( ˙ Qa O 2 max ) decreased from 1000 m. At 4500 m, there was no more difference in ˙ Qa O 2 max between TW and UW. Mixed venous O 2 pressure (P¯ v O 2 max ) was lower and O 2 extraction (O 2 ER max ) greater in TW at each altitude. The primary determinant factor of ˙ V O 2 max decrement in moderate acute hypoxia in trained and untrained women is a reduced maximal O 2 transport that cannot be compensate by tissue O 2 extraction. © 2007 Elsevier B.V. All rights reserved. Keywords: Cardiac output; Arterial O 2 saturation; Venous O 2 saturation; Tissue O 2 extraction 1. Introduction The decrease in maximal oxygen uptake ( ˙ V O 2 max ) in acute hypoxic conditions has been widely investigated. Nevertheless, most of the studies dealing with this topic focused on men (Squires and Buskirk, 1982; Lawler et al., 1988; Martin and O’Kroy, 1993; Benoit et al., 1995; Gore et al., 1996; Ferretti et al., 1997; Chapman et al., 1999; Peltonen et al., 2001; Benoit et al., 2003; Mollard et al., 2007, in press) or pooled groups of males and females (Paterson et al., 1987; Shephard et al., 1988; Koistinen et al., 1995; Gore et al., 1997; Robergs et al., 1998) but more rarely on women exclusively (Drinkwater et al., 1979; Wagner et al., 1979; Woorons et al., 2005). Furthermore, men and women may not have similar metabolic responses during maximal exercise in acute hypoxia. Some authors hypothesize that women have a stronger protective mechanism against acute exposure to hypoxia during maximal ∗ Corresponding author. Tel.: +33 1 48 38 77 57; fax: +33 1 48 38 89 24. E-mail address: [email protected] (P. Mollard). exertion because of a higher relative ventilatory response than males (Paterson et al., 1987). The lower haemoglobin concen- tration and therefore the lower arterial O 2 content in women than men could generate specific responses during maximal exercise in acute hypoxia. In men, numerous studies have reported that the drop of aer- obic performance in acute hypoxia was greater in endurance athletes than in sedentary subjects (Lawler et al., 1988; Martin and O’Kroy, 1993; Gore et al., 1996; Gore et al., 1997; Benoit et al., 2003; Mollard et al., 2007, in press). A recent study showed that it was also the case in women, from an altitude of 2500 m: the greater decrease in ˙ V O 2 max in female athletes was due to a greater decrement in arterial O 2 saturation (Sa O 2 ) at maximal exercise (Woorons et al., 2005). This arterial O 2 desaturation which exists in normoxia in highly trained endurance athletes could be mainly explained by a diffusion limitation (Dempsey et al., 1982). In athletes, the increase in ˙ Q max in comparison with untrained subjects could reduce the blood transit time in the pul- monary capillary and thus the O 2 equilibrium process (Dempsey et al., 1982). Furthermore, exercise in hypoxic conditions results in low venous P O 2 (P¯ v O 2 ), which could increase the time needed 1569-9048/$ – see front matter © 2007 Elsevier B.V. All rights reserved. doi:10.1016/j.resp.2007.06.012

Welcome message from author
This document is posted to help you gain knowledge. Please leave a comment to let me know what you think about it! Share it to your friends and learn new things together.
Transcript
A
w4imO
t©
K
1
hm(OaemKbW
mSm
1d
Available online at www.sciencedirect.com
Respiratory Physiology & Neurobiology 159 (2007) 178–186
Determinant factors of the decrease in aerobic performancein moderate acute hypoxia in women endurance athletes
Pascal Mollard a,∗, Xavier Woorons a, Muriel Letournel b, Christine Lamberto a,b,Fabrice Favret a, Aurelien Pichon a, Michele Beaudry a, Jean-Paul Richalet a,b
a Universite Paris 13, Laboratoire “Reponses cellulaires et fonctionnelles a l’hypoxie”, EA2363, ARPE,74 rue Marcel Cachin, 93017 Bobigny Cedex, France
b AP-HP, Hopital Avicenne, Service de physiologie, explorations fonctionnelles et medecine du sport, Bobigny, France
Accepted 23 June 2007
bstract
The purpose of this study was to evaluate the limiting factors of maximal aerobic performance in endurance trained (TW) and sedentary (UW)omen. Subjects performed four incremental tests on a cycle ergometer at sea level and in normobaric hypoxia corresponding to 1000, 2500 and500 m. Maximal oxygen uptake decrement (�VO2 max) was larger in TW at each altitude. Maximal heart rate and ventilation decreased at 4500 mn TW. Maximal cardiac output remained unchanged. In both groups, arterialized oxygen saturation (Sa′
O2 max) decreased at and above 2500 m and˙ ˙
aximal O2 transport (QaO2 max) decreased from 1000 m. At 4500 m, there was no more difference in QaO2 max between TW and UW. Mixed venous2 pressure (PvO2 max) was lower and O2 extraction (O2ERmax) greater in TW at each altitude.The primary determinant factor of VO2 max decrement in moderate acute hypoxia in trained and untrained women is a reduced maximal O2
ransport that cannot be compensate by tissue O2 extraction.2007 Elsevier B.V. All rights reserved.
e O2 e
emtmi
oaaattge
eywords: Cardiac output; Arterial O2 saturation; Venous O2 saturation; Tissu
. Introduction
The decrease in maximal oxygen uptake (VO2 max) in acuteypoxic conditions has been widely investigated. Nevertheless,ost of the studies dealing with this topic focused on men
Squires and Buskirk, 1982; Lawler et al., 1988; Martin and’Kroy, 1993; Benoit et al., 1995; Gore et al., 1996; Ferretti et
l., 1997; Chapman et al., 1999; Peltonen et al., 2001; Benoitt al., 2003; Mollard et al., 2007, in press) or pooled groups ofales and females (Paterson et al., 1987; Shephard et al., 1988;oistinen et al., 1995; Gore et al., 1997; Robergs et al., 1998)ut more rarely on women exclusively (Drinkwater et al., 1979;agner et al., 1979; Woorons et al., 2005).Furthermore, men and women may not have similar
etabolic responses during maximal exercise in acute hypoxia.ome authors hypothesize that women have a stronger protectiveechanism against acute exposure to hypoxia during maximal
∗ Corresponding author. Tel.: +33 1 48 38 77 57; fax: +33 1 48 38 89 24.E-mail address: [email protected] (P. Mollard).
wcaumei
569-9048/$ – see front matter © 2007 Elsevier B.V. All rights reserved.oi:10.1016/j.resp.2007.06.012
xtraction
xertion because of a higher relative ventilatory response thanales (Paterson et al., 1987). The lower haemoglobin concen-
ration and therefore the lower arterial O2 content in women thanen could generate specific responses during maximal exercise
n acute hypoxia.In men, numerous studies have reported that the drop of aer-
bic performance in acute hypoxia was greater in endurancethletes than in sedentary subjects (Lawler et al., 1988; Martinnd O’Kroy, 1993; Gore et al., 1996; Gore et al., 1997; Benoit etl., 2003; Mollard et al., 2007, in press). A recent study showedhat it was also the case in women, from an altitude of 2500 m:he greater decrease in VO2 max in female athletes was due to areater decrement in arterial O2 saturation (SaO2 ) at maximalxercise (Woorons et al., 2005). This arterial O2 desaturationhich exists in normoxia in highly trained endurance athletes
ould be mainly explained by a diffusion limitation (Dempsey etl., 1982). In athletes, the increase in Qmax in comparison with
ntrained subjects could reduce the blood transit time in the pul-onary capillary and thus the O2 equilibrium process (Dempseyt al., 1982). Furthermore, exercise in hypoxic conditions resultsn low venous PO2 (PvO2 ), which could increase the time needed
logy &
fi(Pmciatm
V
obt(1(Hpsdad
oWas(maV
b
p(mc
2
2
swufiUwwpfawP
2
(iartt0t4tS(attptmbAtoea
2
2
etbmawJtOt(ea
2
leOcT
P. Mollard et al. / Respiratory Physio
or blood to equilibrate with oxygen in the pulmonary capillar-es, further challenging lung diffusion capacity during exerciseWagner, 1982). The greater Qmax associated with the lowervO2 max in trained than untrained subjects could explain theore important arterial O2 desaturation in athletes in hypoxic
onditions (Mollard et al., in press). As a consequence, at max-mal exercise, the larger SaO2 max decrease in athletes leads togreater decrease in arterial O2 content (CaO2 max) and in O2
ransport (QaO2 max) and therefore in the O2 availability for theuscle.However, in severe acute hypoxia (5300 m), two-thirds of
˙O2 max decrease is accounted for by CaO2 max reduction andne-third by the decrease in peak cardiac output and musclelood flow (Calbet et al., 2003). In moderate acute hypoxia,here is no consensus about cardiac output at maximal exerciseQmax) changes since it was found decreased (Ekblom et al.,975; Peltonen et al., 2001; Hopkins et al., 2003) or unchangedStenberg et al., 1966; Hughes et al., 1968; Hartley et al., 1973;orstman et al., 1980; Wagner et al., 1986; Mollard et al., inress) even though no study has focused on women exclusivelyo far. With regard to the important maximal heart rate (fH max)ecrease, especially in trained women (Woorons et al., 2005),reduction in QaO2 max could also partly explain the VO2 max
ecrement.Tissue O2 extraction could also be a determinant factor
f VO2 max in normoxia and in hypoxia (Roca et al., 1989;agner, 2006). Recent studies indicated that under normoxia
nd moderate hypoxia, limitations in both convective and diffu-ive O2 transport to the tissues were important factors of VO2 maxMcGuire and Secomb, 2004; Mollard et al., in press). Further-ore, the important difference between TW and UW in QaO2 max
nd tissue O2 extraction, reported as the two limiting factors of˙O2 max at sea level (Saltin and Calbet, 2006; Wagner, 2006) maye differently affected by hypoxia.
The purpose of this study was to evaluate O2 transportarameters at maximal exercise in moderate acute hypoxia1000–4500 m) in trained and sedentary women in order to deter-ine the contributing factors of aerobic performance in these
onditions.
. Methods
.1. Subjects
Sixteen healthy and non smoker women (aged 18–40 years),ea-level residents, were recruited for this study. Subjectsere divided into two groups: trained women (TW, n = 8) andntrained women (UW, n = 8). TW were triathletes, with at leastve training sessions per week and a VO2 max > 50 ml/ min /kg.W were sedentary or active persons in recreational sports, butho had never engaged in systematic endurance training andith a VO2 max < 45 ml/ min /kg. Before being included in therotocol, each subject was informed about the procedures to be
ollowed and the potential risks inherent with the experimentsnd signed a written informed consent form. All proceduresere approved by the ethics committee of Necker Hospital,aris.teAt
Neurobiology 159 (2007) 178–186 179
.2. Protocol
Each subject completed four maximal cycle ergometer testsJaeger ER 900, Wuerzburg, Germany) divided into two exper-mental testing sessions, each separated by ∼7 days and witht least a 3-h rest between tests. The first test was always car-ied out in normoxia (FI O2 = 0.209 and PI O2 = 150 mmHg)o ensure that the subjects VO2 max met the study criteria. Inhe other tests, subjects breathed inspired oxygen fractions of.187; 0.154 and 0.117 (PI O2 of 132, 108 and 81 mmHg, respec-ively) for simulated altitudes of approximately 1000, 2500 and500 m, respectively, administered in random order. To simulatehese altitudes we used the AltiTrainer200
® (S.M.TEC, Geneva,witzerland) which produces a normobaric hypoxic mixturereduced oxygen fraction) by addition of nitrogen in ambientir. Before starting exercise, subjects remained at rest breathinghe desired gas mixture for 5 min for physiological parameterso stabilize. The exercise began with a 3-min warm-up at aower output (PO) of 40 watts (W) followed by an incremen-al load of 25 W every 2 min, until the subjects could no longer
aintain a pedaling frequency of 65 rpm. Subjects were ver-ally encouraged to continue the exercise as long as possible.
test was considered to be maximal if two of the followinghree criteria were met: (1) a plateau in VO2 (≤150 mL increasever 2 min) despite increasing power output, (2) a respiratoryxchange ratio > 1.1 at exhaustion and (3) lactate concentrationt maximal exercise >9 mmol/L.
.3. Measurements
.3.1. Gas exchangeGas exchange was recorded breath by breath at rest and at
xercise. We used a rigid mouthpiece connected to a “Y” sys-em fixation with a double valve which ensures separate waysetween inspired and expired flow (Jaeger, Wuerzburg, Ger-any). An inspiratory valve, connected to the AltiTrainer200
®
llowed subject to inhale the hypoxic mixture. Expired gasesere collected continuously into a metabograph (Oxycon,
aeger, Wuerzburg, Germany) to measure expired minute ven-ilation at body temperature and pressure saturated (VEBTPS),
2 consumption (VO2 ), end-tidal O2 pressure (PET O2 ) and end-idal carbon dioxide pressure (PET CO2 ). Alveolar O2 pressurePAO2 ) was calculated using the alveolar gas equation (Rileyt al., 1946): PAO2 = PI O2 − PACO2/R, where R is VCO2/VO2
nd PACO2 = PET CO2 .
.3.2. Blood analysesCapillary blood from a prewarmed earlobe with a vasodi-
ating capsaicin cream was sampled at rest and at maximalxercise to measure arterialized PaO2 (Pa′
O2), PaCO2 (Pa′
CO2),
2 saturation (Sa′O2
), pH (pHa′), hemoglobin ([Hb]) and lactateoncentrations [Radiometer ABL 700, Copenhagen, Denmark].he earlobe is always physically rubbed with a compress in order
o activate the blood circulation and to ameliorate the cream pen-tration. Then, we apply a warming cream for at least 10–20 min.
technician is especially trained in our laboratory to performhe arterialized measurements in less than 30 s avoiding air con-
1 logy &
tgpm
2
ci0mdPdm2fesshwsaoWCkbtp
2
Sc1
vbh
aiblH
2
spmuftVo
3
3
Ty(t
3e
eaha
3p
talaP
bntUrt
80 P. Mollard et al. / Respiratory Physio
amination. A recent meta-analysis comparing values of bloodases from an arterial blood sample to a capillary earlobe sam-le showed that the mean bias = 2.4 mmHg for PaO2 and wasinimal for low values of PaO2 (Zavorsky et al., 2007).
.3.3. Cardiac outputHeart rate (fH) was measured continuously using electro-
ardiography. Cardiac output (Q) was measured using a nonnvasive impedance cardiograph device, the PhysioFlow PF-5 (Manatec biomedical, Paris, France). This bioimpedanceethod of Q determination uses changes in thoracic impedance
uring cardiac ejection to calculate the stroke volume (SV). ThehysioFlow concept and methodology have been recently vali-ated at rest and at exercise (Charloux et al., 2000) and during aaximal progressive exercise (Richard et al., 2001; Tordi et al.,
004; Welsman et al., 2005). Six electrodes were placed, twoor an electrocardiography measurement and four “impedance”lectrodes placed at the base of the neck and on the proces-us xiphoideus. Before placing these electrodes, the skin waslightly scraped with an abrasive sponge and cleaned with alco-ol. After placing the electrodes and carefully fixing the threadith an adhesive band in order to prevent any movement, the
ubject took her sitting position on the ergocycle and kept quietnd silent during all the calibration process. The measurementf arterial pressure is necessary to start the calibration process.e took the arterial pressure three times (Dinamap 1846 SX,ritikon, Tampa, USA), after 5 min in hypoxic conditions, andeep the last value. We watched over the signal quality and sta-ility during the entire test. Q was continuously measured duringhe test and averaged over 15-s intervals. A new calibrationrocedure at rest was performed before each test.
.3.4. Parameters calculated at maximal exercise
Arterialized O2 content (mL/L): Ca′O2 max = [Hb] × 13.4 ×
Sa′O2 max/100 + Pa′
O2 max × 0.03, with [Hb] in g/dL, Sa′O2 max
in % and Pa′O2 max in mmHg.
Maximal O2 transport (L/min): QaO2 max = Qmax ×Ca′
O2 max/1000.Parameters of diffusive O2 transport to the tissue were cal-culated at maximal exercise. Difference in arterial–venous O2content (mL/L): Da − vO2 max = (VO2 max/Qmax) × 1000 withVO2 max and Qmax in L/min.Mixed venous O2 content (mL/L): CvO2 max = Ca′
O2 max −Da − vO2 max.Mixed venous O2 saturation (%):SvO2 max = (CvO2 max ×100)/([Hb] × 13.4) neglecting dissolved venous O2 content.Tissue O2 extraction (%): O2ERmax = VO2 max/QaO2 max.
We used Dill and Forbes blood O2 line charts to convertvO2 max to PvO2 max in reference with pH and with a theoreti-al body temperature of 38.5 ◦C at maximal exercise (Altman,961).
The hypoxic ventilatory response (HVR) and the hypoxicentilatory response at exercise (HVRe) in UW and TW haveeen calculated from our measurements, in reference with theypoxic ventilatory response tests developed by Richalet et
3
s
Neurobiology 159 (2007) 178–186
l. (1988). They were calculated as the ratio of the differencen minute ventilation (� VE) and arterial saturation (� SaO2 )etween normoxia and 4500 m, at rest for HVR and at an abso-ute workload equivalent to 30% of normoxic VO2 max for HVRe.VR(e) = (� VE/� SaO2 )/body weight × 100.
.4. Statistical analysis
A two-way analysis of variance (ANOVA) for repeated mea-ures was used to analyze the effect of altitude on measuredarameters and the differences between the two groups. If aain effect of hypoxia appeared, a Scheffe post-hoc test was
sed to identify the altitude at which there was a significant dif-erence from normoxia for each group. Relationships betweenwo different parameters were examined by linear regressions.alues are given as mean ± standard error (S.E.) and the levelf significance was established at p < 0.05.
. Results
.1. Subjects
Eight UW and eight TW have participated at this study.here was no difference in age (27.1 ± 3.8 versus 28.4 ± 4.7ears), body mass (53.3 ± 5.0 versus 57.9 ± 6.6 kg) and height1.64 ± 4.8 versus 1.68 ± 4.0 m) between UW and TW, respec-ively.
.2. Oxygen consumption and power output at maximalxercise (Table 1)
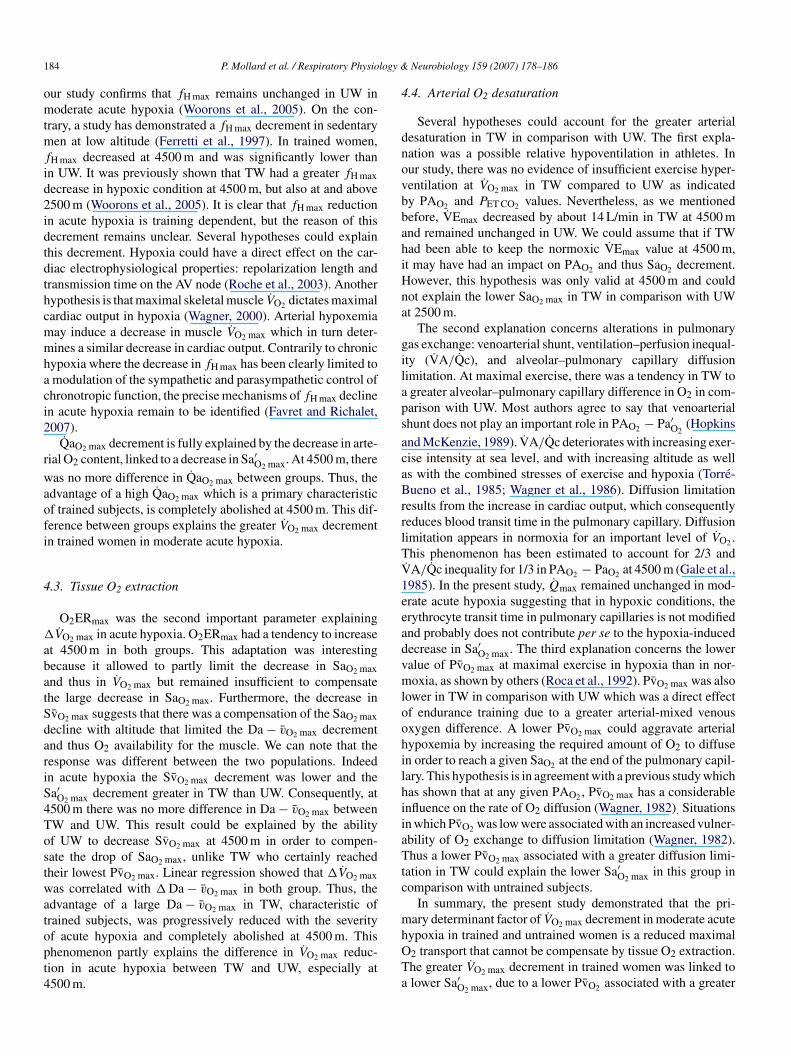
VO2 max (Fig. 1) and POmax were higher in TW than UW atach altitude. VO2 max and POmax decrement were significant atnd above 1000 m for TW and 2500 m in UW. �VO2 max wasigher in TW at each altitude. Lactate concentration was notffected by training status or hypoxia.
.3. Ventilatory parameters at maximal exercise andulmonary gas exchanges (Table 1)
VEmax was significantly greater in TW than UW at each alti-ude except at 4500 m. VE/VO2 was lower in TW than UWt each altitude but the difference was significant only at seaevel. PAO2 max and Pa′
O2 max decreased from 1000 m in trainednd untrained subjects but without difference between groups.ET CO2 was significantly lower in TW than UW at 4500 mut not at the other altitudes. Pa′
CO2 max and PAO2 − Pa′O2
wereot affected by training status or hypoxia. The hypoxic ventila-ory response was lower in TW (0.26 ± 0.08 L/min/kg) than inW (0.42 ± 0.10 L/min/kg, P < 0.05). The hypoxic ventilatory
esponse at exercise was lower in TW (0.56 ± 0.20 L/min/kg)han in UW (0.78 ± 0.18 L/min/kg, P < 0.05).
.4. Parameters of maximal O2 transport (Table 2)
fH max was greater in UW than TW but the difference wasignificant only at 4500 m. SVmax and Qmax (Fig. 1) were greater
P.Mollard
etal./Respiratory
Physiology
&N
eurobiology159
(2007)178–186
181
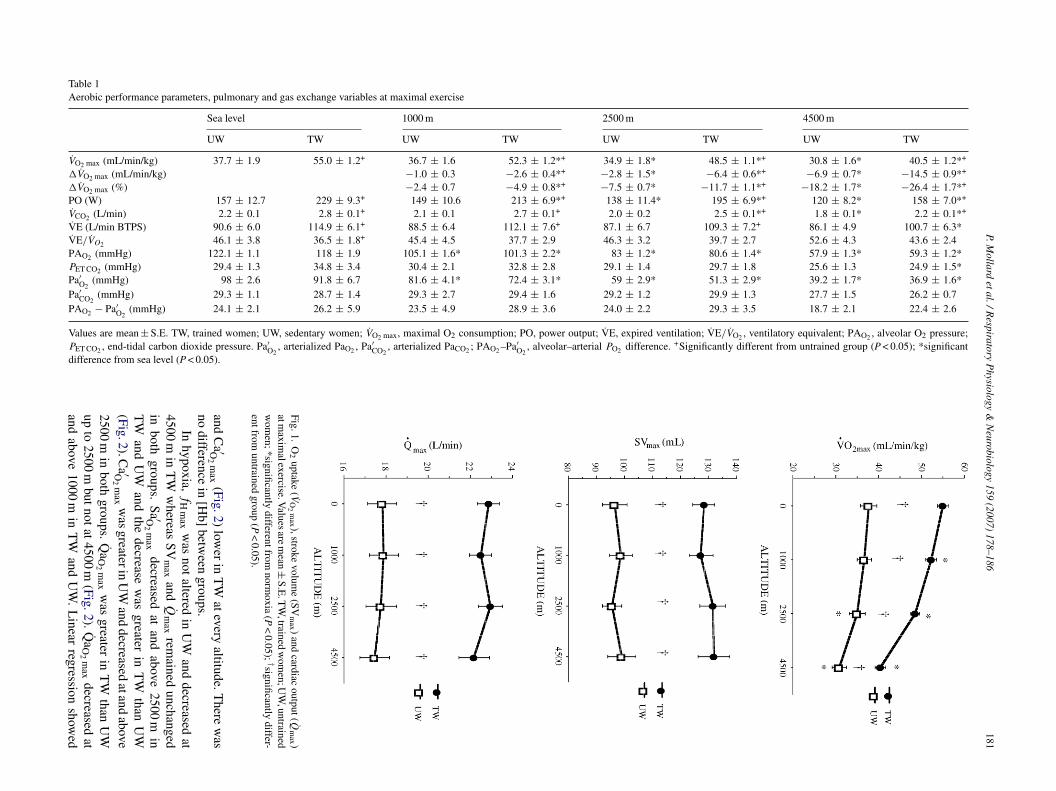
Table 1Aerobic performance parameters, pulmonary and gas exchange variables at maximal exercise
Sea level 1000 m 2500 m 4500 m
UW TW UW TW UW TW UW TW
VO2 max (mL/min/kg) 37.7 ± 1.9 55.0 ± 1.2+ 36.7 ± 1.6 52.3 ± 1.2*+ 34.9 ± 1.8* 48.5 ± 1.1*+ 30.8 ± 1.6* 40.5 ± 1.2*+
�VO2 max (mL/min/kg) −1.0 ± 0.3 −2.6 ± 0.4*+ −2.8 ± 1.5* −6.4 ± 0.6*+ −6.9 ± 0.7* −14.5 ± 0.9*+
�VO2 max (%) −2.4 ± 0.7 −4.9 ± 0.8*+ −7.5 ± 0.7* −11.7 ± 1.1*+ −18.2 ± 1.7* −26.4 ± 1.7*+
PO (W) 157 ± 12.7 229 ± 9.3+ 149 ± 10.6 213 ± 6.9*+ 138 ± 11.4* 195 ± 6.9*+ 120 ± 8.2* 158 ± 7.0*+
VCO2 (L/min) 2.2 ± 0.1 2.8 ± 0.1+ 2.1 ± 0.1 2.7 ± 0.1+ 2.0 ± 0.2 2.5 ± 0.1*+ 1.8 ± 0.1* 2.2 ± 0.1*+
VE (L/min BTPS) 90.6 ± 6.0 114.9 ± 6.1+ 88.5 ± 6.4 112.1 ± 7.6+ 87.1 ± 6.7 109.3 ± 7.2+ 86.1 ± 4.9 100.7 ± 6.3*VE/VO2 46.1 ± 3.8 36.5 ± 1.8+ 45.4 ± 4.5 37.7 ± 2.9 46.3 ± 3.2 39.7 ± 2.7 52.6 ± 4.3 43.6 ± 2.4PAO2 (mmHg) 122.1 ± 1.1 118 ± 1.9 105.1 ± 1.6* 101.3 ± 2.2* 83 ± 1.2* 80.6 ± 1.4* 57.9 ± 1.3* 59.3 ± 1.2*PET CO2 (mmHg) 29.4 ± 1.3 34.8 ± 3.4 30.4 ± 2.1 32.8 ± 2.8 29.1 ± 1.4 29.7 ± 1.8 25.6 ± 1.3 24.9 ± 1.5*Pa′
O2(mmHg) 98 ± 2.6 91.8 ± 6.7 81.6 ± 4.1* 72.4 ± 3.1* 59 ± 2.9* 51.3 ± 2.9* 39.2 ± 1.7* 36.9 ± 1.6*
Pa′CO2
(mmHg) 29.3 ± 1.1 28.7 ± 1.4 29.3 ± 2.7 29.4 ± 1.6 29.2 ± 1.2 29.9 ± 1.3 27.7 ± 1.5 26.2 ± 0.7PAO2 − Pa′
O2(mmHg) 24.1 ± 2.1 26.2 ± 5.9 23.5 ± 4.9 28.9 ± 3.6 24.0 ± 2.2 29.3 ± 3.5 18.7 ± 2.1 22.4 ± 2.6
Values are mean ± S.E. TW, trained women; UW, sedentary women; VO2 max, maximal O2 consumption; PO, power output; VE, expired ventilation; VE/VO2 , ventilatory equivalent; PAO2 , alveolar O2 pressure;PET CO2 , end-tidal carbon dioxide pressure. Pa′
O2, arterialized PaO2 , Pa′
CO2, arterialized PaCO2 ; PAO2 –Pa′
O2, alveolar–arterial PO2 difference. +Significantly different from untrained group (P < 0.05); *significant
difference from sea level (P < 0.05).
Fig.1.O
2uptake
(VO
2m
ax ),strokevolum
e(SV
max )
andcardiac
output(Qm
ax )atm
aximalexercise.V
aluesarem
ean±S.E
.TW
,trainedw
omen;U
W,untrained
wom
en;*significantlydifferentfrom
normoxia
(P<
0.05); †significantlydiffer-
entfromuntrained
group(P
<0.05).
andC
a ′O2
max
(Fig.2)low
erin
TW
ateveryaltitude.T
herew
asno
differencein
[Hb]
between
groups.In
hypoxia,f
Hm
axw
asnot
alteredin
UW
anddecreased
at4500
min
TW
whereas
SVm
axand
Qm
axrem
ainedunchanged
inboth
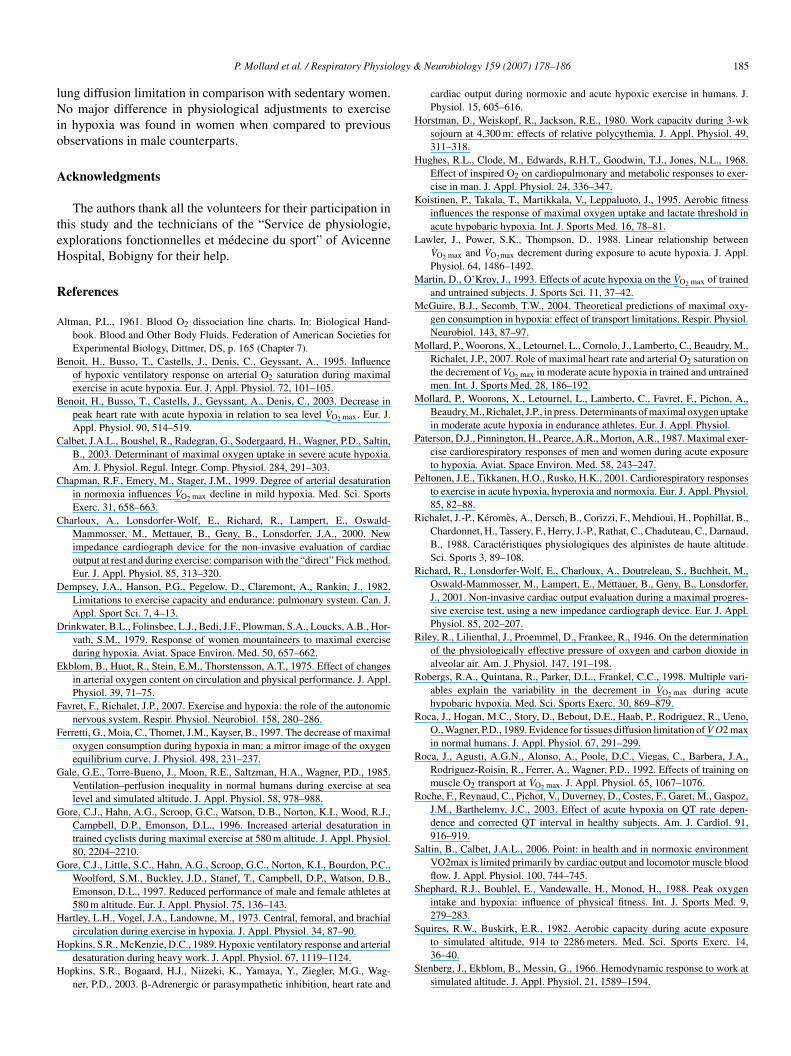
groups.Sa ′O
2m
axdecreased
atand
above2500
min
TW
andU
Wand
thedecrease
was
greaterin
TW
thanU
W(Fig.2).C
a ′O2
max
was
greaterinU
Wand
decreasedatand
above
2500m
inboth
groups.Q
aO
2m
axw
asgreater
inT
Wthan
UW
upto
2500m
butnotat4500m
(Fig.2).Qa
O2
max
decreasedat
andabove
1000m
inT
Wand
UW
.L
inearregression
showed

182P.M
ollardetal./R
espiratoryP
hysiology&
Neurobiology
159(2007)
178–186
Table 2Metabolic and cardiorespiratory variables at VO2 max
Sea level 1000 m 2500 m 4500 m
UW TW UW TW UW TW UW TW
fH (beat/min) 183.2 ± 3.2 178.7 ± 4.6 182.1 ± 4.2 178.1 ± 5.2 182.1 ± 3.1 175.2 ± 4.6 177.1 ± 3.2 168.7 ± 3.8*+
�fH (beat/min) −1.1 ± 1.2 −0.5 ± 1.2 −1.2 ± 2.0 −3.4 ± 1.2 −6.1 ± 2.7 −10.0 ± 1.1*[Hb] (g/dL) 14.2 ± 0 13.5 ± 0.4 14.1 ± 0.3 13.4 ± 0.4 13.9 ± 0.3 13.5 ± 0.5 14.2 ± 0.3 13.4 ± 0.4CvO2 (mLO2/L) 72.4 ± 7.3 34.3 ± 5.4+ 66.1 ± 6.9 32.4 ± 5.1+ 56.9 ± 9.2* 29.5 ± 6.4*+ 46.2 ± 6.1* 18.2 ± 4.9*+
PvO2 (mmHg) 26.3 ± 2.1 13.4 ± 1.3+ 21.8 ± 1.6* 11.7 ± 1.5+ 18.9 ± 0.9* 10.3 ± 2.6+ 15.2 ± 1.5* 6.2 ± 1.9+
pH 7.29 ± 0.02 7.30 ± 0.2 7.35 ± 0.2* 7.37 ± 0.1* 7.35 ± 0.2* 7.37 ± 0.2* 7.34 ± 0.3* 7.4 ± 0.1 *Lactate (mmol/L) 10.6 ± 0.32 10.3 ± 0.28 9.7 ± 0.4 9.3 ± 0.4 10.0 ± 0.7 9.5 ± 0.4 10.1 ± 0.5 9.6 ± 0.3
Values are mean ± S.E. TW, trained women; UW, sedentary women; fH, heart rate; [Hb], hemoglobine concentration; CvO2 , venous O2 content; PvO2 venous PO2 ; +significantly different from untrained group(P < 0.05); *significant difference from sea level (P < 0.05).
Fig.2.A
rterializedO
2saturation
(Sa ′O2
max ),arterial
O2
content(C
a ′O2
max )
at
maxim
alexerciseand
maxim
alO2
transport(Qa
O2
max ).V
aluesare
mean±
S.E.
TW
,trainedw
omen;
UW
,untrainedw
omen;
*significantlydifferent
fromnor-
moxia
(P<
0.05); †significantlydifferentfrom
untrainedgroup
(P<
0.05).
that�
VO
2m
axw
ascorrelated
with
�Q
aO
2m
axin
TW
(R=
0.91,p
<0.05)
andU
W(R
=0.68,p
<0.05).
3.5.Param
etersoftissue
O2
extraction(Table
2)
SvO
2m
ax(Fig.3)
andPv
O2
max
were
higherin
UW
atevery
FIO
2 .Sv
O2
max
decreasedat
4500m
inboth
groupsw
hereasPv
O2
max
decreasedat
andabove
1000m
inU
Wand
remained
unchangedin
TW
.Da−
vO
2m
axw
asgreaterinT
Wup
to2500
m,
butat
4500m
therew
asno
more
differencebetw
eengroups
(Fig.3).O2 E
Rm
axincreased
slightlyin
bothgroups
butnotsig-

P. Mollard et al. / Respiratory Physiology &
Fig. 3. Mixed venous O2 saturation (SvO2 max), alveolar–venous O2 difference(Da − vO2 max) and tissue O2 extraction (O2ERmax) at maximal exercise. Valuesare mean ± S.E. TW, trained Women; UW, untrained Women; *significantlyd(
ncUb
4
c
�
UmsisTrfsaftcgst
4
tVnsrtchVtivtV
rTg
4
bdmnmneam
ifferent from normoxia (P < 0.05); †significantly different from untrained groupP < 0.05).
ificantly (Fig. 3). Linear regression showed that �VO2 max wasorrelated with � Da − vO2 max in TW (R = 0.96, p < 0.05) andW (R = 0.77, p < 0.05). pH increased at and above 1000 m inoth groups.
. Discussion
In both trained and untrained subjects, VO2 max decreasedontinuously with increasing simulated altitude. Moreover,
Haws
Neurobiology 159 (2007) 178–186 183
VO2 max, in absolute and relative terms, was greater in TW thanW at and above 1000 m, which confirms that the VO2 max decre-ent is more important in endurance athletes than in sedentary
ubjects (Woorons et al., 2005). This greater VO2 max decrementn TW than UW explains that the decrease in VO2 max appearedignificant at a lower altitude in TW (1000 m) than UW (2500 m).hese results are in agreement with a previous experiment that
eported a VO2 max decrement at an altitude of 580 m in eliteemale endurance athletes (Gore et al., 1997). Nevertheless, ourtudy did not confirm the VO2 max decrement previously shownt 1000 m in sedentary subjects (Woorons et al., 2005). The dif-erence in group size and in subjects’ VO2 max level are likelyo impact on the significance level of this altitude threshold andould explain the differences between studies. To explain thisreater �VO2 max in female athletes, we studied the sequentialteps of the pathway for O2 transfer from the atmosphere to theissues.
.1. Ventilatory parameters
We failed to find any correlation between the ventila-ory parameters and VO2 max decrement. Nevertheless, while˙ Emax was not altered in hypoxia in UW, it decreased sig-ificantly at 4500 m in TW. The peripheral chemoreceptorensitivity determines the intensity of the hypoxic ventilatoryesponse at exercise. The HVR and HVRe were lower in TWhan UW, as for men (Mollard et al., 2007, in press), whichould explain the VEmax decrease in TW. Indeed, in acuteypoxia, a positive relationship was found between HVR and
˙ Emax (Benoit et al., 1995). Although it well established thathe control of VE at exercise is not directed to maintain orncrease VO2 but rather to control PaCO2 , a blunting of theentilatory response to exercise in hypoxia would certainly con-ribute to a greater arterial O2 desaturation and decrease in˙O2 max.
Even though the ventilatory parameters did not play a primaryole in the drop of VO2 max, the maximal ventilation decrement inW could anyway contribute to increase the difference betweenroups, especially at 4500 m.
.2. Maximal O2 transport
When pooling all the altitude data, there was a correlationetween �VO2 max and � QaO2 max in both groups. QaO2 maxecrement was significant at and above 1000 m with a dra-atic drop at 4500 m in TW. At this altitude, QaO2 max was
o longer greater in TW in comparison with UW. This decre-ent could not be explained by a decrease in Qmax which was
ot altered in acute hypoxia in both groups. To our knowl-dge, the present study is the first to evaluate Qmax in moderatecute hypoxia in women exclusively. Our results are in agree-ent with previous experiments in men (Stenberg et al., 1966;
artley et al., 1973; Horstman et al., 1980) or both in mennd women (Wagner et al., 1986) even though the comparisonith mixed groups remains difficult. It is important to con-
ider the specific response of women in acute hypoxia. Indeed,
1 logy &
omtmf
id2idtdthcmmhaci2
r
waofi
4
�
abatSdariS4Tostwatopt4
4
dnovbbahiHna
gilaps
acaBrrlTV1eeadvmloohilhiiaTtc
84 P. Mollard et al. / Respiratory Physio
ur study confirms that fH max remains unchanged in UW inoderate acute hypoxia (Woorons et al., 2005). On the con-
rary, a study has demonstrated a fH max decrement in sedentaryen at low altitude (Ferretti et al., 1997). In trained women,
H max decreased at 4500 m and was significantly lower thann UW. It was previously shown that TW had a greater fH maxecrease in hypoxic condition at 4500 m, but also at and above500 m (Woorons et al., 2005). It is clear that fH max reductionn acute hypoxia is training dependent, but the reason of thisecrement remains unclear. Several hypotheses could explainhis decrement. Hypoxia could have a direct effect on the car-iac electrophysiological properties: repolarization length andransmission time on the AV node (Roche et al., 2003). Anotherypothesis is that maximal skeletal muscle VO2 dictates maximalardiac output in hypoxia (Wagner, 2000). Arterial hypoxemiaay induce a decrease in muscle VO2 max which in turn deter-ines a similar decrease in cardiac output. Contrarily to chronic
ypoxia where the decrease in fH max has been clearly limited tomodulation of the sympathetic and parasympathetic control ofhronotropic function, the precise mechanisms of fH max declinen acute hypoxia remain to be identified (Favret and Richalet,007).
QaO2 max decrement is fully explained by the decrease in arte-ial O2 content, linked to a decrease in Sa′
O2 max. At 4500 m, there
as no more difference in QaO2 max between groups. Thus, thedvantage of a high QaO2 max which is a primary characteristicf trained subjects, is completely abolished at 4500 m. This dif-erence between groups explains the greater VO2 max decrementn trained women in moderate acute hypoxia.
.3. Tissue O2 extraction
O2ERmax was the second important parameter explainingVO2 max in acute hypoxia. O2ERmax had a tendency to increase
t 4500 m in both groups. This adaptation was interestingecause it allowed to partly limit the decrease in SaO2 maxnd thus in VO2 max but remained insufficient to compensatehe large decrease in SaO2 max. Furthermore, the decrease invO2 max suggests that there was a compensation of the SaO2 maxecline with altitude that limited the Da − vO2 max decrementnd thus O2 availability for the muscle. We can note that theesponse was different between the two populations. Indeedn acute hypoxia the SvO2 max decrement was lower and thea′
O2 max decrement greater in TW than UW. Consequently, at500 m there was no more difference in Da − vO2 max betweenW and UW. This result could be explained by the abilityf UW to decrease SvO2 max at 4500 m in order to compen-ate the drop of SaO2 max, unlike TW who certainly reachedheir lowest PvO2 max. Linear regression showed that �VO2 maxas correlated with � Da − vO2 max in both group. Thus, the
dvantage of a large Da − vO2 max in TW, characteristic of
rained subjects, was progressively reduced with the severityf acute hypoxia and completely abolished at 4500 m. Thishenomenon partly explains the difference in VO2 max reduc-ion in acute hypoxia between TW and UW, especially at500 m.mhOTa
Neurobiology 159 (2007) 178–186
.4. Arterial O2 desaturation
Several hypotheses could account for the greater arterialesaturation in TW in comparison with UW. The first expla-ation was a possible relative hypoventilation in athletes. Inur study, there was no evidence of insufficient exercise hyper-entilation at VO2 max in TW compared to UW as indicatedy PAO2 and PET CO2 values. Nevertheless, as we mentionedefore, VEmax decreased by about 14 L/min in TW at 4500 mnd remained unchanged in UW. We could assume that if TWad been able to keep the normoxic VEmax value at 4500 m,t may have had an impact on PAO2 and thus SaO2 decrement.owever, this hypothesis was only valid at 4500 m and couldot explain the lower SaO2 max in TW in comparison with UWt 2500 m.
The second explanation concerns alterations in pulmonaryas exchange: venoarterial shunt, ventilation–perfusion inequal-ty (VA/Qc), and alveolar–pulmonary capillary diffusionimitation. At maximal exercise, there was a tendency in TW togreater alveolar–pulmonary capillary difference in O2 in com-arison with UW. Most authors agree to say that venoarterialhunt does not play an important role in PAO2 − Pa′
O2(Hopkins
nd McKenzie, 1989). VA/Qc deteriorates with increasing exer-ise intensity at sea level, and with increasing altitude as wells with the combined stresses of exercise and hypoxia (Torre-ueno et al., 1985; Wagner et al., 1986). Diffusion limitation
esults from the increase in cardiac output, which consequentlyeduces blood transit time in the pulmonary capillary. Diffusionimitation appears in normoxia for an important level of VO2 .his phenomenon has been estimated to account for 2/3 and
˙ A/Qc inequality for 1/3 in PAO2 − PaO2 at 4500 m (Gale et al.,985). In the present study, Qmax remained unchanged in mod-rate acute hypoxia suggesting that in hypoxic conditions, therythrocyte transit time in pulmonary capillaries is not modifiednd probably does not contribute per se to the hypoxia-inducedecrease in Sa′
O2 max. The third explanation concerns the loweralue of PvO2 max at maximal exercise in hypoxia than in nor-oxia, as shown by others (Roca et al., 1992). PvO2 max was also
ower in TW in comparison with UW which was a direct effectf endurance training due to a greater arterial-mixed venousxygen difference. A lower PvO2 max could aggravate arterialypoxemia by increasing the required amount of O2 to diffusen order to reach a given SaO2 at the end of the pulmonary capil-ary. This hypothesis is in agreement with a previous study whichas shown that at any given PAO2 , PvO2 max has a considerablenfluence on the rate of O2 diffusion (Wagner, 1982). Situationsn which PvO2 was low were associated with an increased vulner-bility of O2 exchange to diffusion limitation (Wagner, 1982).hus a lower PvO2 max associated with a greater diffusion limi-
ation in TW could explain the lower Sa′O2 max in this group in
omparison with untrained subjects.In summary, the present study demonstrated that the pri-
ary determinant factor of VO2 max decrement in moderate acute
ypoxia in trained and untrained women is a reduced maximal2 transport that cannot be compensate by tissue O2 extraction.he greater VO2 max decrement in trained women was linked tolower Sa′O2 max, due to a lower PvO2 associated with a greater
logy &
lNio
A
teH
R
A
B
B
C
C
C
D
D
E
F
F
G
G
G
H
H
H
H
H
K
L
M
M
M
M
P
P
R
R
R
R
R
R
R
S
S
P. Mollard et al. / Respiratory Physio
ung diffusion limitation in comparison with sedentary women.o major difference in physiological adjustments to exercise
n hypoxia was found in women when compared to previousbservations in male counterparts.
cknowledgments
The authors thank all the volunteers for their participation inhis study and the technicians of the “Service de physiologie,xplorations fonctionnelles et medecine du sport” of Avicenneospital, Bobigny for their help.
eferences
ltman, P.L., 1961. Blood O2 dissociation line charts. In: Biological Hand-book. Blood and Other Body Fluids. Federation of American Societies forExperimental Biology, Dittmer, DS, p. 165 (Chapter 7).
enoit, H., Busso, T., Castells, J., Denis, C., Geyssant, A., 1995. Influenceof hypoxic ventilatory response on arterial O2 saturation during maximalexercise in acute hypoxia. Eur. J. Appl. Physiol. 72, 101–105.
enoit, H., Busso, T., Castells, J., Geyssant, A., Denis, C., 2003. Decrease inpeak heart rate with acute hypoxia in relation to sea level VO2 max. Eur. J.Appl. Physiol. 90, 514–519.
albet, J.A.L., Boushel, R., Radegran, G., Sodergaard, H., Wagner, P.D., Saltin,B., 2003. Determinant of maximal oxygen uptake in severe acute hypoxia.Am. J. Physiol. Regul. Integr. Comp. Physiol. 284, 291–303.
hapman, R.F., Emery, M., Stager, J.M., 1999. Degree of arterial desaturationin normoxia influences VO2 max decline in mild hypoxia. Med. Sci. SportsExerc. 31, 658–663.
harloux, A., Lonsdorfer-Wolf, E., Richard, R., Lampert, E., Oswald-Mammosser, M., Mettauer, B., Geny, B., Lonsdorfer, J.A., 2000. Newimpedance cardiograph device for the non-invasive evaluation of cardiacoutput at rest and during exercise: comparison with the “direct” Fick method.Eur. J. Appl. Physiol. 85, 313–320.
empsey, J.A., Hanson, P.G., Pegelow, D., Claremont, A., Rankin, J., 1982.Limitations to exercise capacity and endurance: pulmonary system. Can. J.Appl. Sport Sci. 7, 4–13.
rinkwater, B.L., Folinsbee, L.J., Bedi, J.F., Plowman, S.A., Loucks, A.B., Hor-vath, S.M., 1979. Response of women mountaineers to maximal exerciseduring hypoxia. Aviat. Space Environ. Med. 50, 657–662.
kblom, B., Huot, R., Stein, E.M., Thorstensson, A.T., 1975. Effect of changesin arterial oxygen content on circulation and physical performance. J. Appl.Physiol. 39, 71–75.
avret, F., Richalet, J.P., 2007. Exercise and hypoxia: the role of the autonomicnervous system. Respir. Physiol. Neurobiol. 158, 280–286.
erretti, G., Moia, C., Thomet, J.M., Kayser, B., 1997. The decrease of maximaloxygen consumption during hypoxia in man: a mirror image of the oxygenequilibrium curve. J. Physiol. 498, 231–237.
ale, G.E., Torre-Bueno, J., Moon, R.E., Saltzman, H.A., Wagner, P.D., 1985.Ventilation–perfusion inequality in normal humans during exercise at sealevel and simulated altitude. J. Appl. Physiol. 58, 978–988.
ore, C.J., Hahn, A.G., Scroop, G.C., Watson, D.B., Norton, K.I., Wood, R.J.,Campbell, D.P., Emonson, D.L., 1996. Increased arterial desaturation intrained cyclists during maximal exercise at 580 m altitude. J. Appl. Physiol.80, 2204–2210.
ore, C.J., Little, S.C., Hahn, A.G., Scroop, G.C., Norton, K.I., Bourdon, P.C.,Woolford, S.M., Buckley, J.D., Stanef, T., Campbell, D.P., Watson, D.B.,Emonson, D.L., 1997. Reduced performance of male and female athletes at580 m altitude. Eur. J. Appl. Physiol. 75, 136–143.
artley, L.H., Vogel, J.A., Landowne, M., 1973. Central, femoral, and brachial
circulation during exercise in hypoxia. J. Appl. Physiol. 34, 87–90.opkins, S.R., McKenzie, D.C., 1989. Hypoxic ventilatory response and arterialdesaturation during heavy work. J. Appl. Physiol. 67, 1119–1124.
opkins, S.R., Bogaard, H.J., Niizeki, K., Yamaya, Y., Ziegler, M.G., Wag-ner, P.D., 2003. �-Adrenergic or parasympathetic inhibition, heart rate and
S
S
Neurobiology 159 (2007) 178–186 185
cardiac output during normoxic and acute hypoxic exercise in humans. J.Physiol. 15, 605–616.
orstman, D., Weiskopf, R., Jackson, R.E., 1980. Work capacity during 3-wksojourn at 4,300 m: effects of relative polycythemia. J. Appl. Physiol. 49,311–318.
ughes, R.L., Clode, M., Edwards, R.H.T., Goodwin, T.J., Jones, N.L., 1968.Effect of inspired O2 on cardiopulmonary and metabolic responses to exer-cise in man. J. Appl. Physiol. 24, 336–347.
oistinen, P., Takala, T., Martikkala, V., Leppaluoto, J., 1995. Aerobic fitnessinfluences the response of maximal oxygen uptake and lactate threshold inacute hypobaric hypoxia. Int. J. Sports Med. 16, 78–81.
awler, J., Power, S.K., Thompson, D., 1988. Linear relationship betweenVO2 max and VO2max decrement during exposure to acute hypoxia. J. Appl.Physiol. 64, 1486–1492.
artin, D., O’Kroy, J., 1993. Effects of acute hypoxia on the VO2 max of trainedand untrained subjects. J. Sports Sci. 11, 37–42.
cGuire, B.J., Secomb, T.W., 2004. Theoretical predictions of maximal oxy-gen consumption in hypoxia: effect of transport limitations. Respir. Physiol.Neurobiol. 143, 87–97.
ollard, P., Woorons, X., Letournel, L., Cornolo, J., Lamberto, C., Beaudry, M.,Richalet, J.P., 2007. Role of maximal heart rate and arterial O2 saturation onthe decrement of VO2 max in moderate acute hypoxia in trained and untrainedmen. Int. J. Sports Med. 28, 186–192.
ollard, P., Woorons, X., Letournel, L., Lamberto, C., Favret, F., Pichon, A.,Beaudry, M., Richalet, J.P., in press. Determinants of maximal oxygen uptakein moderate acute hypoxia in endurance athletes. Eur. J. Appl. Physiol.
aterson, D.J., Pinnington, H., Pearce, A.R., Morton, A.R., 1987. Maximal exer-cise cardiorespiratory responses of men and women during acute exposureto hypoxia. Aviat. Space Environ. Med. 58, 243–247.
eltonen, J.E., Tikkanen, H.O., Rusko, H.K., 2001. Cardiorespiratory responsesto exercise in acute hypoxia, hyperoxia and normoxia. Eur. J. Appl. Physiol.85, 82–88.
ichalet, J.-P., Keromes, A., Dersch, B., Corizzi, F., Mehdioui, H., Pophillat, B.,Chardonnet, H., Tassery, F., Herry, J.-P., Rathat, C., Chaduteau, C., Darnaud,B., 1988. Caracteristiques physiologiques des alpinistes de haute altitude.Sci. Sports 3, 89–108.
ichard, R., Lonsdorfer-Wolf, E., Charloux, A., Doutreleau, S., Buchheit, M.,Oswald-Mammosser, M., Lampert, E., Mettauer, B., Geny, B., Lonsdorfer,J., 2001. Non-invasive cardiac output evaluation during a maximal progres-sive exercise test, using a new impedance cardiograph device. Eur. J. Appl.Physiol. 85, 202–207.
iley, R., Lilienthal, J., Proemmel, D., Frankee, R., 1946. On the determinationof the physiologically effective pressure of oxygen and carbon dioxide inalveolar air. Am. J. Physiol. 147, 191–198.
obergs, R.A., Quintana, R., Parker, D.L., Frankel, C.C., 1998. Multiple vari-ables explain the variability in the decrement in VO2 max during acutehypobaric hypoxia. Med. Sci. Sports Exerc. 30, 869–879.
oca, J., Hogan, M.C., Story, D., Bebout, D.E., Haab, P., Rodriguez, R., Ueno,O., Wagner, P.D., 1989. Evidence for tissues diffusion limitation of VO2 maxin normal humans. J. Appl. Physiol. 67, 291–299.
oca, J., Agusti, A.G.N., Alonso, A., Poole, D.C., Viegas, C., Barbera, J.A.,Rodriguez-Roisin, R., Ferrer, A., Wagner, P.D., 1992. Effects of training onmuscle O2 transport at VO2 max. J. Appl. Physiol. 65, 1067–1076.
oche, F., Reynaud, C., Pichot, V., Duverney, D., Costes, F., Garet, M., Gaspoz,J.M., Barthelemy, J.C., 2003. Effect of acute hypoxia on QT rate depen-dence and corrected QT interval in healthy subjects. Am. J. Cardiol. 91,916–919.
altin, B., Calbet, J.A.L., 2006. Point: in health and in normoxic environmentVO2max is limited primarily by cardiac output and locomotor muscle bloodflow. J. Appl. Physiol. 100, 744–745.
hephard, R.J., Bouhlel, E., Vandewalle, H., Monod, H., 1988. Peak oxygenintake and hypoxia: influence of physical fitness. Int. J. Sports Med. 9,279–283.
quires, R.W., Buskirk, E.R., 1982. Aerobic capacity during acute exposureto simulated altitude, 914 to 2286 meters. Med. Sci. Sports Exerc. 14,36–40.
tenberg, J., Ekblom, B., Messin, G., 1966. Hemodynamic response to work atsimulated altitude. J. Appl. Physiol. 21, 1589–1594.

1 logy &
T
T
W
W
W
W
W
W
W
86 P. Mollard et al. / Respiratory Physio
ordi, N., Mourot, L., Matusheski, B., Hughson, R.L., 2004. Measurement ofcardiac output during constant exercise: comparison of two non-invasivetechniques. Int. J. Sports Med. 25, 145–149.
orre-Bueno, J.R., Wagner, P.D., Saltzman, H.A., Gale, G.E., Moon, R.E., 1985.Diffusion limitation in normal humans during exercise at sea level andsimulated altitude. J. Appl. Physiol. 58, 989–985.
agner, J.A., Miles, D.S., Horvath, S.M., Reyburn, J.A., 1979. Maximal workcapacity of women during acute hypoxia. J. Appl. Physiol. Respir. Environ.Exerc. Physiol. 47, 1223–1227.
agner, P.D., 1982. Influence of mixed venous PO2 on diffusion of O2 acrossthe pulmonary blood: gas barrier. Clin. Physiol. 2, 105–115.
agner, P.D., Gale, G.E., Moon, R.E., Torre-Bueno, J.R., Stolp, B.W., Saltzman,H.A., 1986. Pulmonary gas exchange in humans exercising at sea level andsimulated altitude. J. Appl. Physiol. 61, 260–270.
Z
Neurobiology 159 (2007) 178–186
agner, P.D., 2000. Reduced maximal cardiac output at altitude—mechanismsand significance. Respir. Physiol. 120, 1–11.
agner, P.D., 2006. Counterpoint: in health and in normoxic environmentVO2 max is not limited primarily by cardiac output and locomotor muscleblood flow. J. Appl. Physiol. 100, 745–748.
elsman, J., Bywater, K., Farr, C., Welford, D., Armstrong, N., 2005. Relia-bility of peak VO(2) and maximal cardiac output assessed using thoracicbioimpedance in children. Eur. J. Appl. Physiol. 94, 228–234.
oorons, X., Mollard, P., Lamberto, C., Letournel, M., Richalet, J.P., 2005.
Effect of acute hypoxia on maximal exercise in trained and sedentary women.Med. Sci. Sports Exerc. 37, 147–154.avorsky, G.S., Cao, J., Mayo, N.E., Gabbay, R., Murias, J.M., 2007. Arterialversus capillary blood gases: a meta-analysis. Respir. Physiol. Neurobiol.155, 268–279.
Related Documents