Deterioration status of asbestos-cement roofing sheets assessed by analyzing hyperspectral data Cristiana Bassani a , Rosa Maria Cavalli a , Francesco Cavalcante b , Vincenzo Cuomo b , Angelo Palombo b , Simone Pascucci a , Stefano Pignatti b, ⁎ a National Research Council, Institute for Atmospheric Pollution, Italy b National Research Council, Institute of Methodologies for Environmental Analysis, C.da S. Loja-Zona Industriale, Tito Scalo (PZ), 85050, Italy Received 1 June 2006; received in revised form 18 January 2007; accepted 20 January 2007 Abstract This paper describes a systematic procedure for recognizing corrugated asbestos-cement roofing sheets and evaluating their deterioration status related to the asbestos fiber air dispersion that can cause lung cancer. To develop this procedure, we made field and laboratory measurements and gathered airborne MIVIS data covering two industrial test areas in Italy. Laboratory analyses of asbestos-cement samples representing various levels of deterioration allowed for: (a) recognizing dominant minerals using XRD and FTIR instruments, (b) identifying their optical characteristics using portable field spectrometers (ASD and μFTIR), (c) assessing the abundance of surfacing asbestos fibers using a high resolution scanner. Based on the spectral analyses, two linear regression lines were identified by relating optical asbestos-cement material characteristics (i.e. band- depth ratio of the continuum removed calculated for the two asbestos diagnostic bands at 2.32 μm and at 9.44 μm) to the relative percentage of surfacing asbestos fibers related to AC deterioration status. Suitable MIVIS spectral regions were used in a spectral classification procedure to map asbestos-cement roofs. The detected roofs were further analyzed using the obtained linear regression lines to estimate surfacing asbestos fiber abundance, using the MIVIS TIR range at 9.44 μm, selected by means of the asbestos-cement detection limit analysis. The results showed that a hyperspectral scanner with suitable operational characteristics allows for good clustering of AC roofs as a function of their deterioration status. Therefore, this technique can furnish government authorities with an efficient, rapid and repeatable environmental mapping procedure that can provide information about the location of hazardous AC roofing sheets. © 2007 Elsevier Inc. All rights reserved. Keywords: Asbestos cement; Urban remote sensing; Hyperspectral data; Detection thresholds 1. Introduction In Europe, as well as in North America, asbestos was used widely as a building material because of its resistance to heat and corrosive chemicals. It was used in roofing materials (flat and corrugated sheets, tiles, building board), cement pipes, roads and apparatus (such as brakes), in high temperature equipment (such as industrial boilers) and in shipbuilding (Virta, 2003). Europe has large natural deposits of asbestos (Coutts, 2005). Currently asbestos is mined in Russia and Canada, as well as in China, Brazil, Zimbabwe and South Africa. In 2004, the “world production of asbestos was estimated to be 2.23 ⁎ 10 6 Tons” (United States Geological Survey Mineral Resource Program, 2004) and “in 2005 it was estimated to be 2.40 ⁎ 10 6 Tons” (Virta, 2006). Today asbestos chrysotile is the only commer- cialized asbestos fiber. The emerging picture is that of flourishing asbestos mining, processing and manufacturing installations in developing countries; however, intense public pressure exists to cease activity (asbestos mining and use) altogether in developed nations. According to the United States Environmental Protection Agency (EPA), a material containing asbestos is deemed potentially hazardous only in a “friable state”, i.e. when it can Remote Sensing of Environment 109 (2007) 361 – 378 www.elsevier.com/locate/rse ⁎ Corresponding author. E-mail address: [email protected] (S. Pignatti). 0034-4257/$ - see front matter © 2007 Elsevier Inc. All rights reserved. doi:10.1016/j.rse.2007.01.014

Welcome message from author
This document is posted to help you gain knowledge. Please leave a comment to let me know what you think about it! Share it to your friends and learn new things together.
Transcript
nt 109 (2007) 361–378www.elsevier.com/locate/rse
Remote Sensing of Environme
Deterioration status of asbestos-cement roofing sheets assessedby analyzing hyperspectral data
Cristiana Bassani a, Rosa Maria Cavalli a, Francesco Cavalcante b, Vincenzo Cuomo b,Angelo Palombo b, Simone Pascucci a, Stefano Pignatti b,⁎
a National Research Council, Institute for Atmospheric Pollution, Italyb National Research Council, Institute of Methodologies for Environmental Analysis, C.da S. Loja-Zona Industriale, Tito Scalo (PZ), 85050, Italy
Received 1 June 2006; received in revised form 18 January 2007; accepted 20 January 2007
Abstract
This paper describes a systematic procedure for recognizing corrugated asbestos-cement roofing sheets and evaluating their deterioration statusrelated to the asbestos fiber air dispersion that can cause lung cancer. To develop this procedure, we made field and laboratory measurements andgathered airborne MIVIS data covering two industrial test areas in Italy.
Laboratory analyses of asbestos-cement samples representing various levels of deterioration allowed for: (a) recognizing dominant mineralsusing XRD and FTIR instruments, (b) identifying their optical characteristics using portable field spectrometers (ASD and μFTIR), (c) assessingthe abundance of surfacing asbestos fibers using a high resolution scanner.
Based on the spectral analyses, two linear regression lines were identified by relating optical asbestos-cement material characteristics (i.e. band-depth ratio of the continuum removed calculated for the two asbestos diagnostic bands at 2.32 μm and at 9.44 μm) to the relative percentage ofsurfacing asbestos fibers related to AC deterioration status.
Suitable MIVIS spectral regions were used in a spectral classification procedure to map asbestos-cement roofs. The detected roofs were furtheranalyzed using the obtained linear regression lines to estimate surfacing asbestos fiber abundance, using the MIVIS TIR range at 9.44 μm, selectedby means of the asbestos-cement detection limit analysis.
The results showed that a hyperspectral scanner with suitable operational characteristics allows for good clustering of AC roofs as a function oftheir deterioration status. Therefore, this technique can furnish government authorities with an efficient, rapid and repeatable environmentalmapping procedure that can provide information about the location of hazardous AC roofing sheets.© 2007 Elsevier Inc. All rights reserved.
Keywords: Asbestos cement; Urban remote sensing; Hyperspectral data; Detection thresholds
1. Introduction
In Europe, as well as in North America, asbestos was usedwidely as a building material because of its resistance to heat andcorrosive chemicals. It was used in roofing materials (flat andcorrugated sheets, tiles, building board), cement pipes, roads andapparatus (such as brakes), in high temperature equipment (suchas industrial boilers) and in shipbuilding (Virta, 2003). Europehas large natural deposits of asbestos (Coutts, 2005). Currentlyasbestos is mined in Russia and Canada, as well as in China,
⁎ Corresponding author.E-mail address: [email protected] (S. Pignatti).
0034-4257/$ - see front matter © 2007 Elsevier Inc. All rights reserved.doi:10.1016/j.rse.2007.01.014
Brazil, Zimbabwe and South Africa. In 2004, the “worldproduction of asbestos was estimated to be 2.23⁎106 Tons”(United States Geological Survey Mineral Resource Program,2004) and “in 2005 it was estimated to be 2.40⁎106 Tons”(Virta, 2006). Today asbestos chrysotile is the only commer-cialized asbestos fiber. The emerging picture is that offlourishing asbestos mining, processing and manufacturinginstallations in developing countries; however, intense publicpressure exists to cease activity (asbestos mining and use)altogether in developed nations.
According to the United States Environmental ProtectionAgency (EPA), a material containing asbestos is deemedpotentially hazardous only in a “friable state”, i.e. when it can
362 C. Bassani et al. / Remote Sensing of Environment 109 (2007) 361–378
be crumbled or reduced to powder by hand pressure. Asbestos-cement products become “friable” (EPA) when severe deteri-oration disturbs the cement matrix due to ice, acid rains, windand so on, or when mechanical means are used for chipping,grinding, sawing, or sanding, therefore allowing particles tobecome airborne.
Unlike the United States, where the use of asbestos is stilllegal but tightly controlled, on January 1, 2005 (following thedirective 76/769/CEE) the marketing and use of asbestos-containing products was banned throughout the EuropeanUnion. Prohibition is due to the possible diffusion of asbestosfibers into the environment that, when inhaled for a long periodof time, constitute a health hazard leading to asbestosis(mesothelioma), a form of lung cancer (Suzuki et al., 2005;Spurny et al., 1989). This health risk prompted the establish-ment of strict environmental regulations about working withasbestos and the creation of a policy intended to forbid the useof asbestos products. In particular, in Italy asbestos wasextracted up until 1994. Its production and manufacture ortrades were prohibited by law n.257/92, thereby entrusting themonitoring of buildings to provincial governments. The mostrecent assessment reported that there are still 2.5⁎109 m2 ofcorrugated asbestos-cement (AC) roofing sheets (known as“Eternit”), equivalent to 32⁎106 ton of mineral asbestos, inItalian urban areas (Marabini et al., 2002). Therefore, the ItalianPublic Administration, in conformance with Law D.M. 101/2003, which provides for the mapping of asbestos-containingmaterials, focused intervention programs on the controlled re-moval of asbestos-containing roofs from industrial areas andfrom private buildings. However, to date complete mapping ofasbestos fiber-cement roofing products is still not available in Italy.
Hyperspectral data for urban area analysis and mappingappear to be particularly useful in this situation. This procedureis currently used in research activity within the framework ofurban planning and management, since it allows for spectralanalysis of inaccessible surfaces and roof materials. As a result,many authors (Ben-Dor et al., 2001; Heiden et al., 2001; Hepner& Chen, 2002; Herold et al., 2003, 2004; Roessner et al., 2001;Segl et al., 2003) have studied the spectral features of urbanmaterials and their separation and have developed specificspectral libraries in order to supply the remote sensing urbanmapping applications. For example, Clark et al. (2001), in theirenvironmental studies on the World Trade Center area after theSeptember 11, 2001 attack, successfully applied hyperspectralremote sensing to map asbestos material in the surroundingarea. These authors used AVIRIS data with continuum-removedspectral feature analysis to obtain an accurate map of asbestosmaterial/dust accumulations.
In this study, we first used hyperspectral data to distinguishAC roofs from those made out of other materials (Fiumi et al.,1998; Marino et al., 2001); then we assessed their weatheringconditions, i.e. level of deterioration on the basis of asbestosfiber exposure. For this purpose, airborne images coveringindustrial areas of the town of Follonica and the province ofRimini (Italy), and surveyed by Multispectral Infrared VisibleImage Spectrometer (MIVIS) (Bianchi et al., 1994), were used.The diagnostic AC spectral features and their remote sensing
detection requirements were obtained using field and laboratorymeasurements. As a result of band-depth analysis, as describedin Clark et al. (1990b), at 2.32 μm and at 9.44 μm a relationshipexists between AC optical properties and abundance ofsurfacing asbestos fibers. This relationship was tested onMIVIS TIR data in view of the calculated minimum fractionalabundance of asbestos fibers required for detection by theMIVIS instrument.
1.1. Asbestos-cement characteristics
Asbestos is the name used to describe a group of fibroushydrous silicates which have outstanding physical propertiesincluding resistance to high temperatures and biodegradation,non combustibility and stability in the high pH range of thecement matrix, low electrical conductivity and a very powerfuladsorbant (Virta, 2003; Rawalt, 1998). Asbestos minerals fallinto two major classes, serpentines (chrysotile, lizardite andantigorite) and amphiboles (e.g. asbestos amosite).
Approximately 95% of the asbestos used in building materialsare derived from chrysotile (white asbestos, Mg3Si2O5 (OH) 4),whereas the other amphiboles are rarely used since they areconsidered more hazardous because of their excessively brittleand thin fibers.
Chrysotile asbestos fibers are long, ranging from a minimumof 20 μm up to greater than 1000 μm, and exhibit high tensilestrength. They are sufficiently flexible to be spun and,macroscopically resemble organic fibers such as cellulose.
Asbestos cement is a composite material composed of“Portland” cement reinforced with asbestos fibers, with asbestosin the matrix ranging from 12% to 18% (Chandra & Berntsson,2003).
The “Portland” cement matrix binds the asbestos fibers into ahard mass in order to create a more durable material that ismechanically and chemically compatible with the fibers. Sheetsof AC are manufactured in the typical grey cement color and areusually adopted only for industrial purposes. Inherently, AC is abrittle material with low impact resistance. Therefore, even withthe added reinforcement provided by the long thin asbestosfibers, the material is susceptible to cracking and chipping oftencaused by low impact forces, repeated cyclical loadings ordeteriorated fasteners. The surface area of asbestos fibers in ACmaterials depends on the extent of their defiberization (i.e.opening and loss of cement matrix and resulting increase inexposure of asbestos fibers). In addition to their primary dete-rioration tendency, manufactured AC products can potentiallydiscolor, erode, spall, flake, form efflorescence and create anenvironment suitable for biotic growths (Spurny et al., 1989).The most frequent alterations of AC roofs consist of organicgrowths such as mushrooms and lichens which have clearlydiscernable spectral features in the VNIR region. Also,inorganic fractionation can yield calcium sulphate, gypsumand bassanite, as by-products of sulfate-reaction of calciumcarbonate with acid rains and sometimes with calcium oxalate.
The weathering status of corrugated AC roof sheets dependsmainly on exposure and on local climate. The importance of thealterations of the AC matrix and their attack intensity is
363C. Bassani et al. / Remote Sensing of Environment 109 (2007) 361–378
described in studies conducted by Spurny et al. (1989) andSuzuki et al. (2005), who state that 1 m3 of an AC sheet, canlose up to 3 g of asbestos in a year.
1.2. Airborne hyperspectral remote sensing
Much progress has been made in understanding the nominalrange of wavelengths suitable for detecting a variety ofminerals, and the relationship between spectral absorptionfeature intensity and mineral abundance using hyperspectralimaging sensor analysis (Boardman & Kruse, 1994; Hook et al.,1999; Kahle et al., 1993; Kahle & Rowan, 1980; Kruse et al.,1999, 2003).
Hyperspectral sensors operating in the solar reflected rangeof 0.4–2.5 μm, such as AVIRIS (0.37–2.50 μm with 224bands), DAIS-7915 (0.45–2.45 μmwith 72 bands; 3–5 μmwith1 band; 8.0–12.6 μm with 6 bands), MIVIS (Table 1), and mostrecently HYMAP (0.45–2.5 μm with 126 bands), Probe-1(0.44–2.54 μm with 224 bands), HYDICE (0.4–2.5 μm with210 bands), EO-1 Hyperion (0.43–2.4 μm with 196 bands) andAHS-160 (0.43–2.54 μm with 63 bands; 3.3–5.4 μm with 7bands; 8.0–12.7 μm with 10 bands) have provided a wealth ofinformation on the composition of terrestrial materials (e.g.Hubbard et al., 2003). Of these, DAIS-7915, MIVIS, AHS-160sensors and MASTER simulator (0.46–2.39 μm with 25 bands;3.14–5.26 μm with 15 bands; 7.76–12.87 μm with 10 bands)(Hook et al., 2001) also operate across the TIR range. Amongthe TIR region, the TIMS instrument (8.2–12.6 μm with 6bands; Kahle & Goetz, 1983), the SEBASS airborne sensor(7.57–13.5 μm with 128 bands; Kirkland et al., 2002; Vaughanet al., 2003), the ARES instrument (8.32–12.97 μm with 32bands; Richter et al., 2005) and the AHI airborne sensor (7.5–11.7 μm with 256 bands; Carlisle et al., 2006) operate justwithin the TIR spectral region. However, only the AHI and theSEBASS sensors are hyperspectral in the TIR region.
Exploitation of the TIR spectral region is becomingincreasingly important, thus enhancing the use of multi-channelTIR instruments to differentiate geologic surface materialsincluding carbonates, sulfates, clays, and felsic vs.mafic silicateminerals (Gillespie et al., 1984; Ramsey & Christensen, 1998;Sabine et al., 1994).
In particular, airborne hyperspectral sensors being charac-terized by a high spectral and/or spatial resolution, allowreliable quantitative measurements of specific absorptionfeatures of urban materials. Small (2003) and Welch (1982) intheir studies argue that a spatial resolution at least of 5 m is
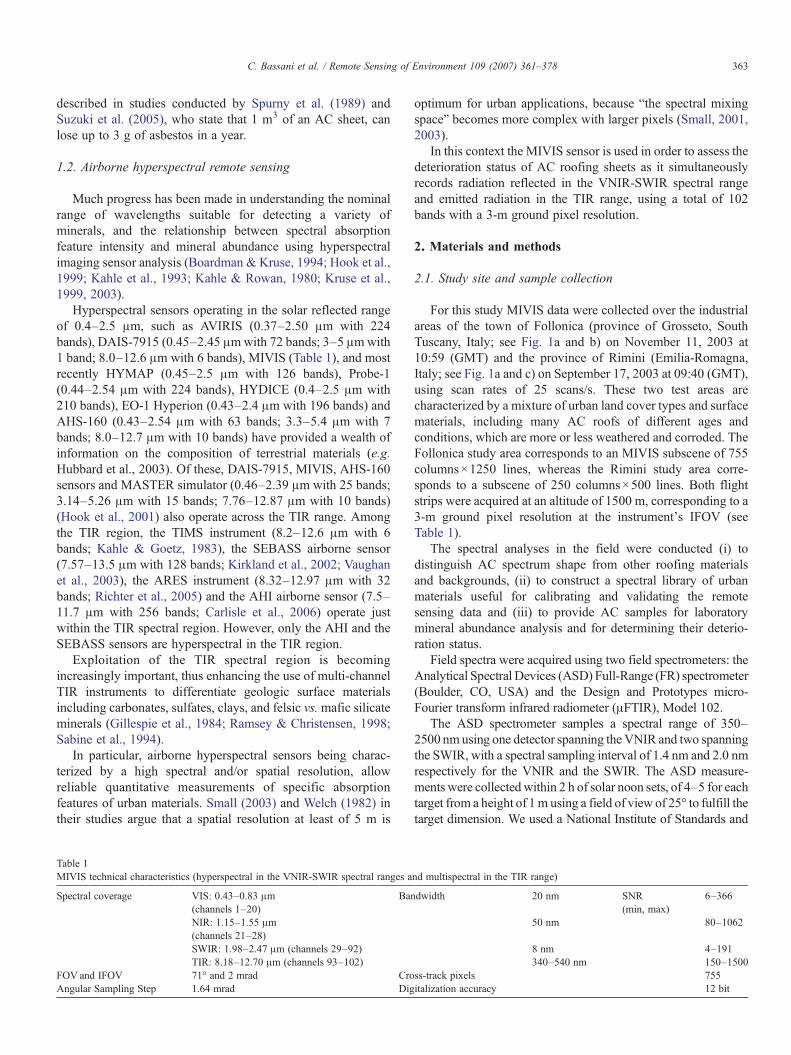
Table 1MIVIS technical characteristics (hyperspectral in the VNIR-SWIR spectral ranges a
Spectral coverage VIS: 0.43–0.83 μm(channels 1–20)
Ban
NIR: 1.15–1.55 μm(channels 21–28)SWIR: 1.98–2.47 μm (channels 29–92)TIR: 8.18–12.70 μm (channels 93–102)
FOV and IFOV 71° and 2 mrad CroAngular Sampling Step 1.64 mrad Dig
optimum for urban applications, because “the spectral mixingspace” becomes more complex with larger pixels (Small, 2001,2003).
In this context the MIVIS sensor is used in order to assess thedeterioration status of AC roofing sheets as it simultaneouslyrecords radiation reflected in the VNIR-SWIR spectral rangeand emitted radiation in the TIR range, using a total of 102bands with a 3-m ground pixel resolution.
2. Materials and methods
2.1. Study site and sample collection
For this study MIVIS data were collected over the industrialareas of the town of Follonica (province of Grosseto, SouthTuscany, Italy; see Fig. 1a and b) on November 11, 2003 at10:59 (GMT) and the province of Rimini (Emilia-Romagna,Italy; see Fig. 1a and c) on September 17, 2003 at 09:40 (GMT),using scan rates of 25 scans/s. These two test areas arecharacterized by a mixture of urban land cover types and surfacematerials, including many AC roofs of different ages andconditions, which are more or less weathered and corroded. TheFollonica study area corresponds to an MIVIS subscene of 755columns×1250 lines, whereas the Rimini study area corre-sponds to a subscene of 250 columns×500 lines. Both flightstrips were acquired at an altitude of 1500 m, corresponding to a3-m ground pixel resolution at the instrument's IFOV (seeTable 1).
The spectral analyses in the field were conducted (i) todistinguish AC spectrum shape from other roofing materialsand backgrounds, (ii) to construct a spectral library of urbanmaterials useful for calibrating and validating the remotesensing data and (iii) to provide AC samples for laboratorymineral abundance analysis and for determining their deterio-ration status.
Field spectra were acquired using two field spectrometers: theAnalytical Spectral Devices (ASD) Full-Range (FR) spectrometer(Boulder, CO, USA) and the Design and Prototypes micro-Fourier transform infrared radiometer (μFTIR), Model 102.
The ASD spectrometer samples a spectral range of 350–2500 nmusing one detector spanning theVNIR and two spanningthe SWIR, with a spectral sampling interval of 1.4 nm and 2.0 nmrespectively for the VNIR and the SWIR. The ASD measure-ments were collected within 2 h of solar noon sets, of 4–5 for eachtarget from a height of 1m using a field of view of 25° to fulfill thetarget dimension. We used a National Institute of Standards and
nd multispectral in the TIR range)
dwidth 20 nm SNR(min, max)
6–366
50 nm 80–1062
8 nm 4–191340–540 nm 150–1500
ss-track pixels 755italization accuracy 12 bit
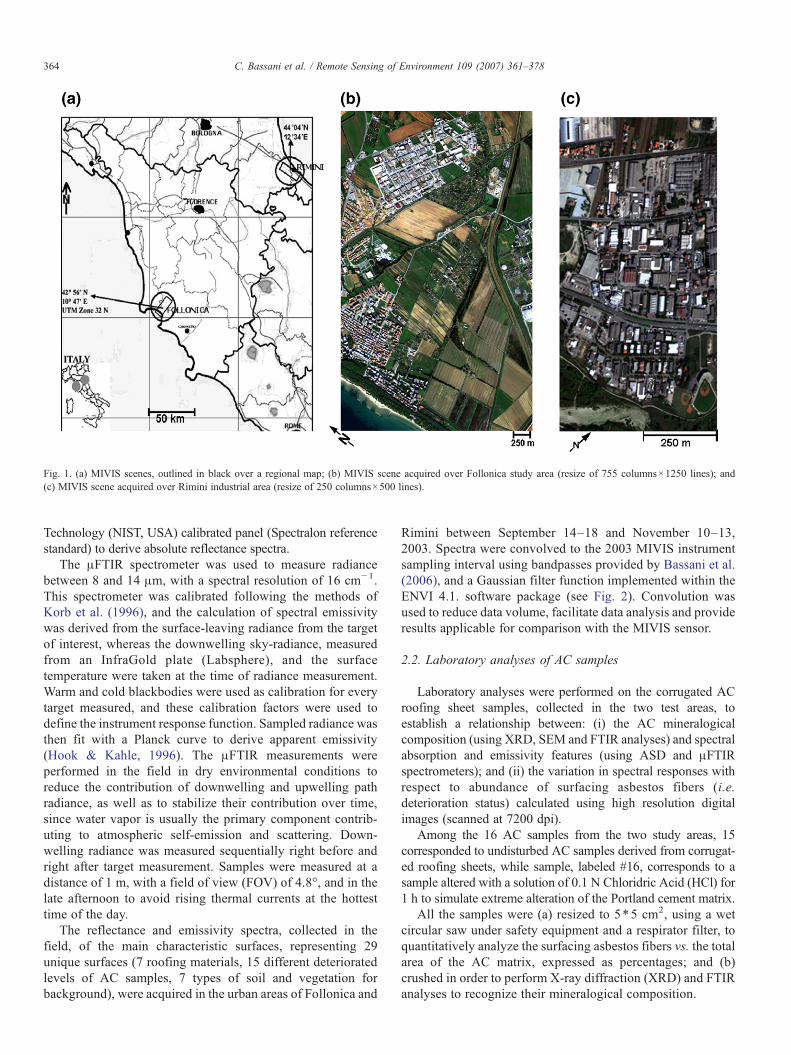
Fig. 1. (a) MIVIS scenes, outlined in black over a regional map; (b) MIVIS scene acquired over Follonica study area (resize of 755 columns×1250 lines); and(c) MIVIS scene acquired over Rimini industrial area (resize of 250 columns×500 lines).
364 C. Bassani et al. / Remote Sensing of Environment 109 (2007) 361–378
Technology (NIST, USA) calibrated panel (Spectralon referencestandard) to derive absolute reflectance spectra.
The μFTIR spectrometer was used to measure radiancebetween 8 and 14 μm, with a spectral resolution of 16 cm−1.This spectrometer was calibrated following the methods ofKorb et al. (1996), and the calculation of spectral emissivitywas derived from the surface-leaving radiance from the targetof interest, whereas the downwelling sky-radiance, measuredfrom an InfraGold plate (Labsphere), and the surfacetemperature were taken at the time of radiance measurement.Warm and cold blackbodies were used as calibration for everytarget measured, and these calibration factors were used todefine the instrument response function. Sampled radiance wasthen fit with a Planck curve to derive apparent emissivity(Hook & Kahle, 1996). The μFTIR measurements wereperformed in the field in dry environmental conditions toreduce the contribution of downwelling and upwelling pathradiance, as well as to stabilize their contribution over time,since water vapor is usually the primary component contrib-uting to atmospheric self-emission and scattering. Down-welling radiance was measured sequentially right before andright after target measurement. Samples were measured at adistance of 1 m, with a field of view (FOV) of 4.8°, and in thelate afternoon to avoid rising thermal currents at the hottesttime of the day.
The reflectance and emissivity spectra, collected in thefield, of the main characteristic surfaces, representing 29unique surfaces (7 roofing materials, 15 different deterioratedlevels of AC samples, 7 types of soil and vegetation forbackground), were acquired in the urban areas of Follonica and
Rimini between September 14–18 and November 10–13,2003. Spectra were convolved to the 2003 MIVIS instrumentsampling interval using bandpasses provided by Bassani et al.(2006), and a Gaussian filter function implemented within theENVI 4.1. software package (see Fig. 2). Convolution wasused to reduce data volume, facilitate data analysis and provideresults applicable for comparison with the MIVIS sensor.
2.2. Laboratory analyses of AC samples
Laboratory analyses were performed on the corrugated ACroofing sheet samples, collected in the two test areas, toestablish a relationship between: (i) the AC mineralogicalcomposition (using XRD, SEM and FTIR analyses) and spectralabsorption and emissivity features (using ASD and μFTIRspectrometers); and (ii) the variation in spectral responses withrespect to abundance of surfacing asbestos fibers (i.e.deterioration status) calculated using high resolution digitalimages (scanned at 7200 dpi).
Among the 16 AC samples from the two study areas, 15corresponded to undisturbed AC samples derived from corrugat-ed roofing sheets, while sample, labeled #16, corresponds to asample altered with a solution of 0.1 N Chloridric Acid (HCl) for1 h to simulate extreme alteration of the Portland cement matrix.
All the samples were (a) resized to 5⁎5 cm2, using a wetcircular saw under safety equipment and a respirator filter, toquantitatively analyze the surfacing asbestos fibers vs. the totalarea of the AC matrix, expressed as percentages; and (b)crushed in order to perform X-ray diffraction (XRD) and FTIRanalyses to recognize their mineralogical composition.
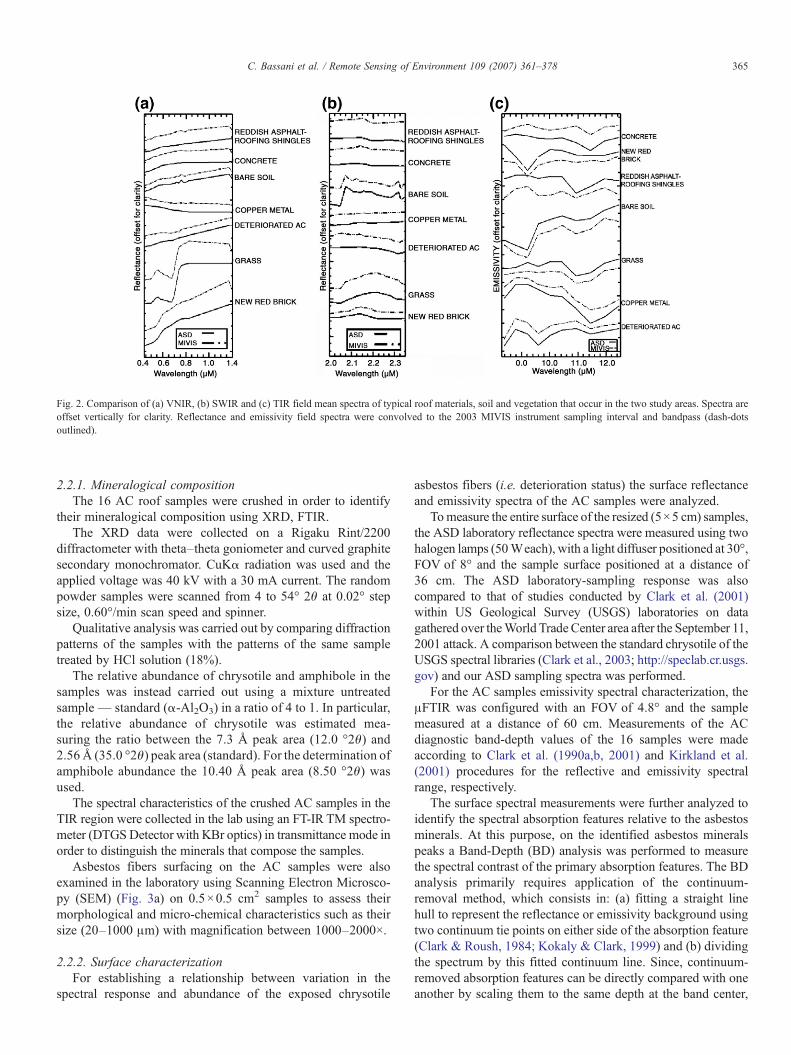
Fig. 2. Comparison of (a) VNIR, (b) SWIR and (c) TIR field mean spectra of typical roof materials, soil and vegetation that occur in the two study areas. Spectra areoffset vertically for clarity. Reflectance and emissivity field spectra were convolved to the 2003 MIVIS instrument sampling interval and bandpass (dash-dotsoutlined).
365C. Bassani et al. / Remote Sensing of Environment 109 (2007) 361–378
2.2.1. Mineralogical compositionThe 16 AC roof samples were crushed in order to identify
their mineralogical composition using XRD, FTIR.The XRD data were collected on a Rigaku Rint/2200
diffractometer with theta–theta goniometer and curved graphitesecondary monochromator. CuKα radiation was used and theapplied voltage was 40 kV with a 30 mA current. The randompowder samples were scanned from 4 to 54° 2θ at 0.02° stepsize, 0.60°/min scan speed and spinner.
Qualitative analysis was carried out by comparing diffractionpatterns of the samples with the patterns of the same sampletreated by HCl solution (18%).
The relative abundance of chrysotile and amphibole in thesamples was instead carried out using a mixture untreatedsample— standard (α-Al2O3) in a ratio of 4 to 1. In particular,the relative abundance of chrysotile was estimated mea-suring the ratio between the 7.3 Å peak area (12.0 °2θ) and2.56 Å (35.0 °2θ) peak area (standard). For the determination ofamphibole abundance the 10.40 Å peak area (8.50 °2θ) wasused.
The spectral characteristics of the crushed AC samples in theTIR region were collected in the lab using an FT-IR TM spectro-meter (DTGSDetector with KBr optics) in transmittance mode inorder to distinguish the minerals that compose the samples.
Asbestos fibers surfacing on the AC samples were alsoexamined in the laboratory using Scanning Electron Microsco-py (SEM) (Fig. 3a) on 0.5×0.5 cm2 samples to assess theirmorphological and micro-chemical characteristics such as theirsize (20–1000 μm) with magnification between 1000–2000×.
2.2.2. Surface characterizationFor establishing a relationship between variation in the
spectral response and abundance of the exposed chrysotile
asbestos fibers (i.e. deterioration status) the surface reflectanceand emissivity spectra of the AC samples were analyzed.
Tomeasure the entire surface of the resized (5×5 cm) samples,the ASD laboratory reflectance spectra were measured using twohalogen lamps (50Weach), with a light diffuser positioned at 30°,FOV of 8° and the sample surface positioned at a distance of36 cm. The ASD laboratory-sampling response was alsocompared to that of studies conducted by Clark et al. (2001)within US Geological Survey (USGS) laboratories on datagathered over theWorld TradeCenter area after the September 11,2001 attack. A comparison between the standard chrysotile of theUSGS spectral libraries (Clark et al., 2003; http://speclab.cr.usgs.gov) and our ASD sampling spectra was performed.
For the AC samples emissivity spectral characterization, theμFTIR was configured with an FOV of 4.8° and the samplemeasured at a distance of 60 cm. Measurements of the ACdiagnostic band-depth values of the 16 samples were madeaccording to Clark et al. (1990a,b, 2001) and Kirkland et al.(2001) procedures for the reflective and emissivity spectralrange, respectively.
The surface spectral measurements were further analyzed toidentify the spectral absorption features relative to the asbestosminerals. At this purpose, on the identified asbestos mineralspeaks a Band-Depth (BD) analysis was performed to measurethe spectral contrast of the primary absorption features. The BDanalysis primarily requires application of the continuum-removal method, which consists in: (a) fitting a straight linehull to represent the reflectance or emissivity background usingtwo continuum tie points on either side of the absorption feature(Clark & Roush, 1984; Kokaly & Clark, 1999) and (b) dividingthe spectrum by this fitted continuum line. Since, continuum-removed absorption features can be directly compared with oneanother by scaling them to the same depth at the band center,
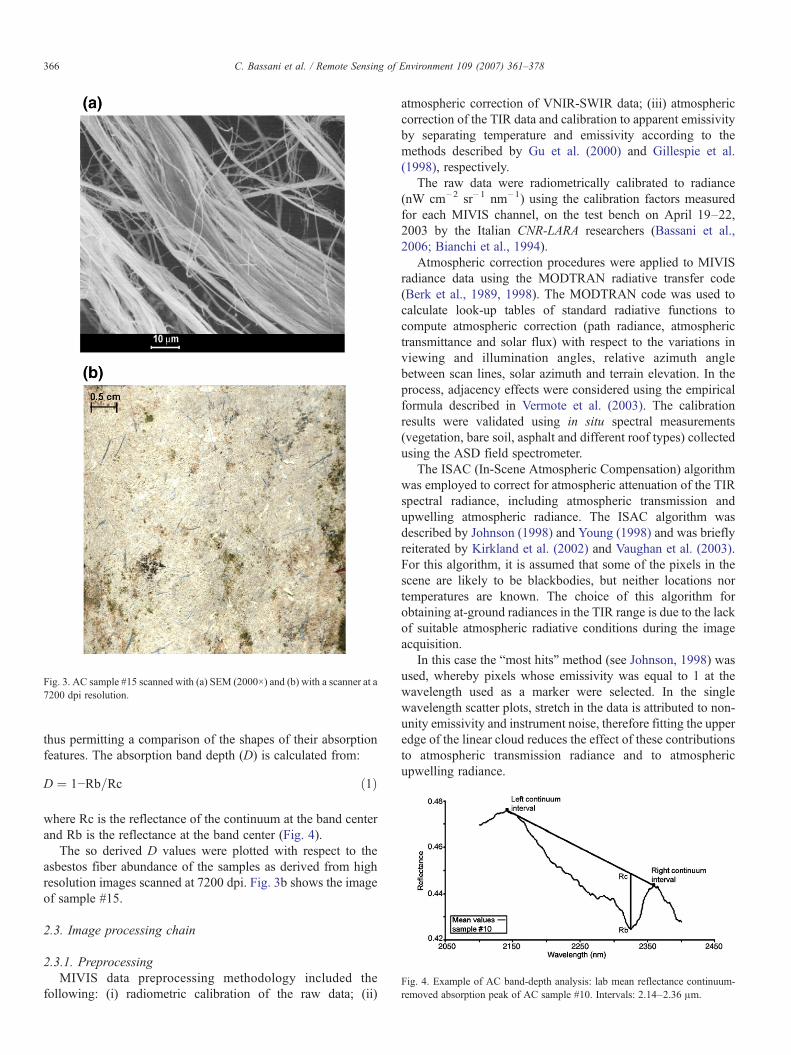
Fig. 4. Example of AC band-depth analysis: lab mean reflectance continuum-removed absorption peak of AC sample #10. Intervals: 2.14–2.36 μm.
Fig. 3. AC sample #15 scanned with (a) SEM (2000×) and (b) with a scanner at a7200 dpi resolution.
366 C. Bassani et al. / Remote Sensing of Environment 109 (2007) 361–378
thus permitting a comparison of the shapes of their absorptionfeatures. The absorption band depth (D) is calculated from:
D ¼ 1−Rb=Rc ð1Þ
where Rc is the reflectance of the continuum at the band centerand Rb is the reflectance at the band center (Fig. 4).
The so derived D values were plotted with respect to theasbestos fiber abundance of the samples as derived from highresolution images scanned at 7200 dpi. Fig. 3b shows the imageof sample #15.
2.3. Image processing chain
2.3.1. PreprocessingMIVIS data preprocessing methodology included the
following: (i) radiometric calibration of the raw data; (ii)
atmospheric correction of VNIR-SWIR data; (iii) atmosphericcorrection of the TIR data and calibration to apparent emissivityby separating temperature and emissivity according to themethods described by Gu et al. (2000) and Gillespie et al.(1998), respectively.
The raw data were radiometrically calibrated to radiance(nW cm−2 sr−1 nm−1) using the calibration factors measuredfor each MIVIS channel, on the test bench on April 19–22,2003 by the Italian CNR-LARA researchers (Bassani et al.,2006; Bianchi et al., 1994).
Atmospheric correction procedures were applied to MIVISradiance data using the MODTRAN radiative transfer code(Berk et al., 1989, 1998). The MODTRAN code was used tocalculate look-up tables of standard radiative functions tocompute atmospheric correction (path radiance, atmospherictransmittance and solar flux) with respect to the variations inviewing and illumination angles, relative azimuth anglebetween scan lines, solar azimuth and terrain elevation. In theprocess, adjacency effects were considered using the empiricalformula described in Vermote et al. (2003). The calibrationresults were validated using in situ spectral measurements(vegetation, bare soil, asphalt and different roof types) collectedusing the ASD field spectrometer.
The ISAC (In-Scene Atmospheric Compensation) algorithmwas employed to correct for atmospheric attenuation of the TIRspectral radiance, including atmospheric transmission andupwelling atmospheric radiance. The ISAC algorithm wasdescribed by Johnson (1998) and Young (1998) and was brieflyreiterated by Kirkland et al. (2002) and Vaughan et al. (2003).For this algorithm, it is assumed that some of the pixels in thescene are likely to be blackbodies, but neither locations nortemperatures are known. The choice of this algorithm forobtaining at-ground radiances in the TIR range is due to the lackof suitable atmospheric radiative conditions during the imageacquisition.
In this case the “most hits” method (see Johnson, 1998) wasused, whereby pixels whose emissivity was equal to 1 at thewavelength used as a marker were selected. In the singlewavelength scatter plots, stretch in the data is attributed to non-unity emissivity and instrument noise, therefore fitting the upperedge of the linear cloud reduces the effect of these contributionsto atmospheric transmission radiance and to atmosphericupwelling radiance.
367C. Bassani et al. / Remote Sensing of Environment 109 (2007) 361–378
The radiance at the sensor, L, for a particular pixel, i, is givenas a function of wavelength, λ, and is related to the emissivity,ελ,i and the temperature-dependent blackbody radiance Bλ(Ti)(as predicted by Planck's Law) of the ground target (fromJohnson, 1998, and also Hook et al., 1999; Kahle et al., 1993).These authors show forms of those standard equations:
Lk;i ¼ ½ek;iBkðTiÞ þ ð1−ek;iÞLSKYk �sk þ LATMk ð2Þ
where ελ,i=surface spectral emissivity, a function of wave-length (λ) and pixel (i); Bλ (Ti)=Planck function, spectralradiance from a blackbody for the temperature (T) of pixel (i);LSKYλ
=spectral radiance incident on the surface from theatmosphere i.e. downwelling radiance; τλ=spectral atmospherictransmission; LATMλ
=spectral radiance from atmospheric emis-sion and scattering reaching the sensor directly (upwelling).
The latter atmospheric parameters are the radiation emittedby the atmosphere itself either reflected by the surface oremitted directly into the instrument. All the atmosphericparameters (τλ, LATMλ
, LSKYλ) are assumed to be homogeneous
across the image (i.e. independent of pixel location) (seeKirkland et al., 2002; Vaughan et al., 2003). Extraction ofemissivity values requires the separation of temperature andemissivity components of TIR radiance as shown in Eq. (2).This separation represents the greatest difficulty in the use of theTIR spectral region because there is a ε value for each imageband plus the kinetic T and the other atmospheric parameters(Gillespie et al., 1998). In the assumptions of the ISACalgorithm, for each wavelength, there is a linear relationbetween observed radiance and the Planck function, whoseslope is related to the atmospheric transmission, τλ, and whoseoffset is the upwelling atmospheric radiance, LATMλ
, at thatwavelength.
Bk;Ti ¼ ½Lk;i−LATMk �skek;i
ð3Þ
or, conversely, the emissivity as
ek;i ¼ ½Lk;i−LATMk �½bkðTiÞsk�
ð4Þ
Substituting in Eq. (4) the Eq. (2) and solving for T, thengives
Ti ¼ C2
kln½ðek;iC1sk=pk5ðLk;i−LATMkÞÞ þ 1� ð5Þ
Since we were interested in determining spectral featureshapes and band depths, relative emissivities were necessary.Several methods, all of which recover spectral shape, areproposed in literature for deriving emissivity such as thereference channel method (Kahle & Rowan, 1980), theemissivity normalization method (Gillespie et al., 1996), thetemperature-independent spectral indices (Becker & Li, 1990),the thermal log residuals and alpha residuals (Hook et al., 1992),and the spectral emissivity ratios (Watson, 1992). Several of
these methods are compared and reviewed by Gillespie (1992,1998, 1999), by Hook et al. (1992, 1999) and by Li et al. (1999).
In this study we applied the emissivity normalization routineproposed by Realmuto (1990), Hook et al. (1992), Kealy andHook (1993) and Gu et al. (2000) and implemented in ENVI4.1. (RSI, 2005) image processing software. This routineconverts the spectrum of each pixel to brightness temperature.At the wavelength of the maximum brightness temperature, thesurface emissivity was set to 0.96 to represent a reasonableaverage of likely values for exposed mineral surfaces (accordingto Kealy & Hook, 1993), then the temperature was used todetermine the Planck curve. The original radiance spectrum wasdivided by the Planck curve, and an apparent emissivity imageand a single band image of temperature at each pixel wasobtained. Unfortunately, the corrected spectra still have residualatmospheric features, mostly due to strong atmosphericabsorption, which are partially related to the assumption ofatmospheric homogeneity in the scene (Vaughan et al., 2003).According to Cudahy et al. (2000) these effects can be partiallycorrected by using an upper hull fit rather than a strict Planckcurve for the data, however, this is yet to be fully implementedwithin our preprocessing methodology.
2.3.2. Spectral feature fitting to map AC roofsTo develop a method for automated image analysis of the AC
roofs, on the basis of the significant AC samples reflectance andemissivity spectral features, (a) a segmentation approach and (b)a least-squares fitting procedure (Spectral Feature Fitting) wereused, thus allowing verification of the laboratory results.
An image segmentation approach was first adopted in orderto flag the roofs (Boskovitz & Guterman, 2002), and, then, usedas an input mask in the classification procedure.
The Spectral Feature Fitting (SFF) classification method(Clark et al.'s, 1991, 1992; Swayze & Clark, 1995), as imple-mented in ENVI 4.1, was applied to MIVIS spectral regionswith an SNR suitable to map the AC spectral features in order tocompare the fit of image spectra with the reference spectracollected on the ground. The reference field spectra were scaledto match the image spectra after they were normalized with thecontinuum removal (Clark & Roush, 1984) to allow thecomparison of individual absorption features using a commonbaseline (Clark, 1999). In particular, the SFF algorithm matchesthe image pixel spectrum to a reference spectrum from either aspectral library or a field/lab spectrum by examining its specificabsorption features after continuum removal. Pixel spectra arecompared to sample spectra using two evaluation parameters:(a) the depth of the absorption feature of the pixel is comparedto that of the feature in the reference target; (b) the shape of thefeature in the pixel is compared to that of the reference targetfeature using the least-squares approach. A correlation fit is thencalculated on a band-by-band basis between each referencespectrum and the target spectrum. The total root mean square(RMS) error is calculated for each endmember and output as on“RMS error” image. SFF outputs a “scale” image for eachreference spectrum, which is a measure of absorption featuredepth related to material abundance. Scaling is usuallynecessary for reference spectra because absorption features in
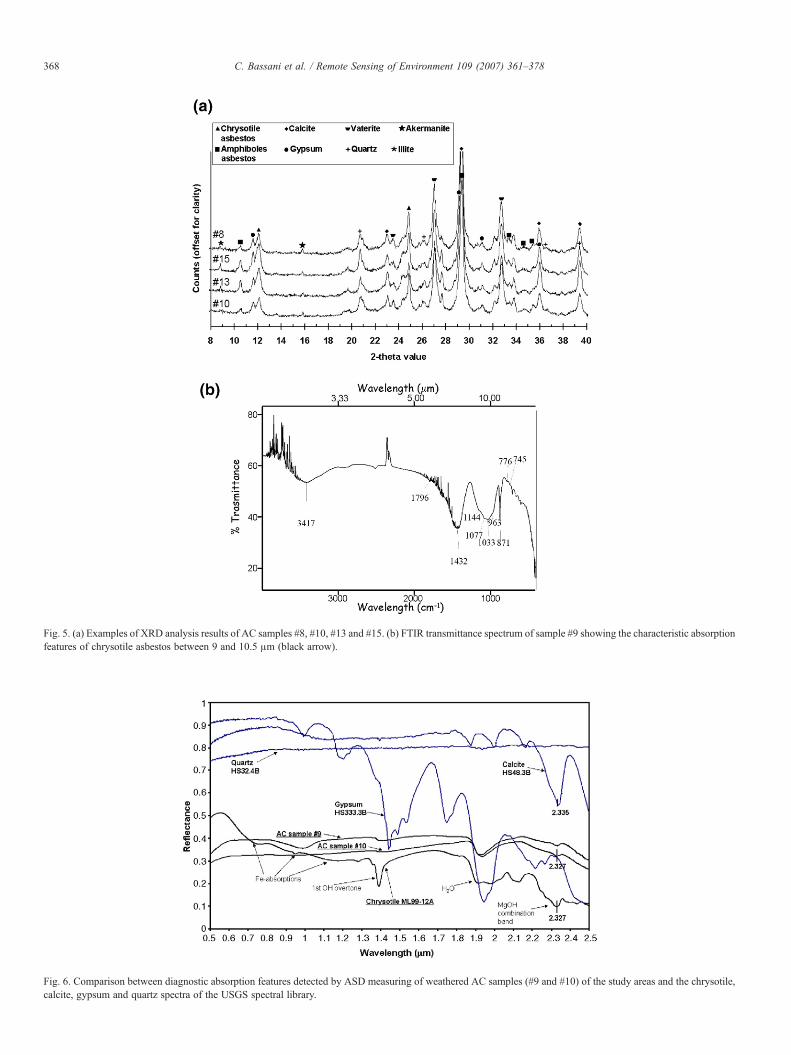
Fig. 6. Comparison between diagnostic absorption features detected by ASD measuring of weathered AC samples (#9 and #10) of the study areas and the chrysotile,calcite, gypsum and quartz spectra of the USGS spectral library.
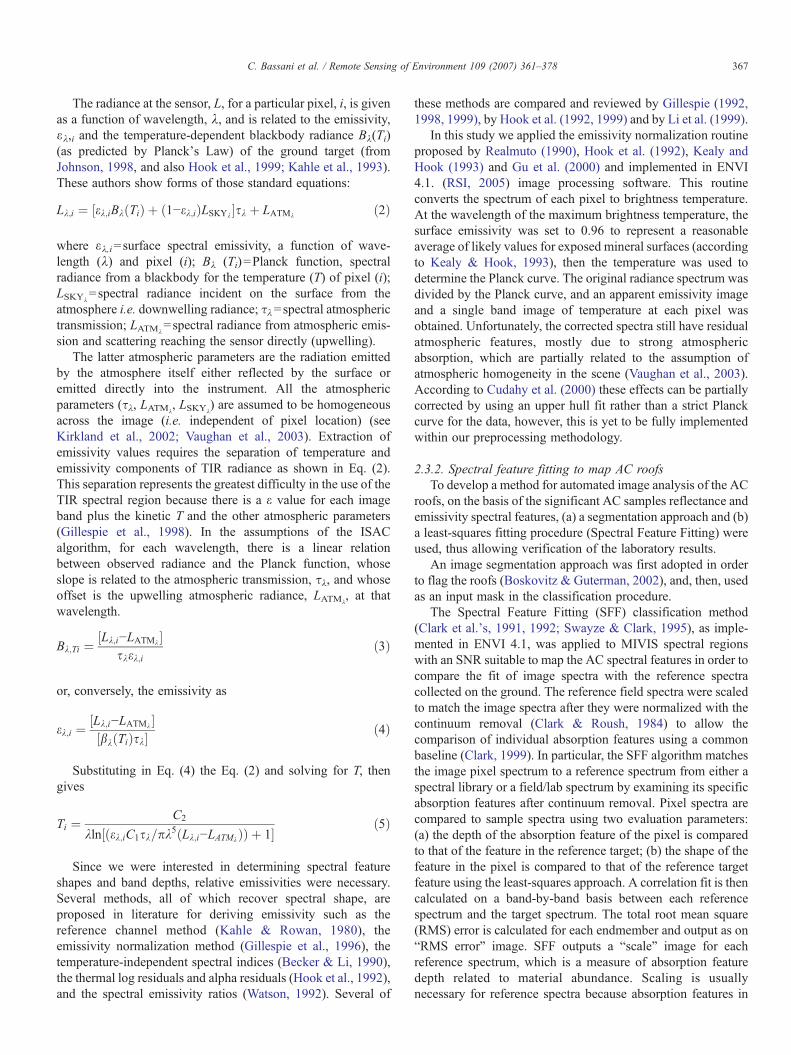
Fig. 5. (a) Examples of XRD analysis results of AC samples #8, #10, #13 and #15. (b) FTIR transmittance spectrum of sample #9 showing the characteristic absorptionfeatures of chrysotile asbestos between 9 and 10.5 μm (black arrow).
368 C. Bassani et al. / Remote Sensing of Environment 109 (2007) 361–378
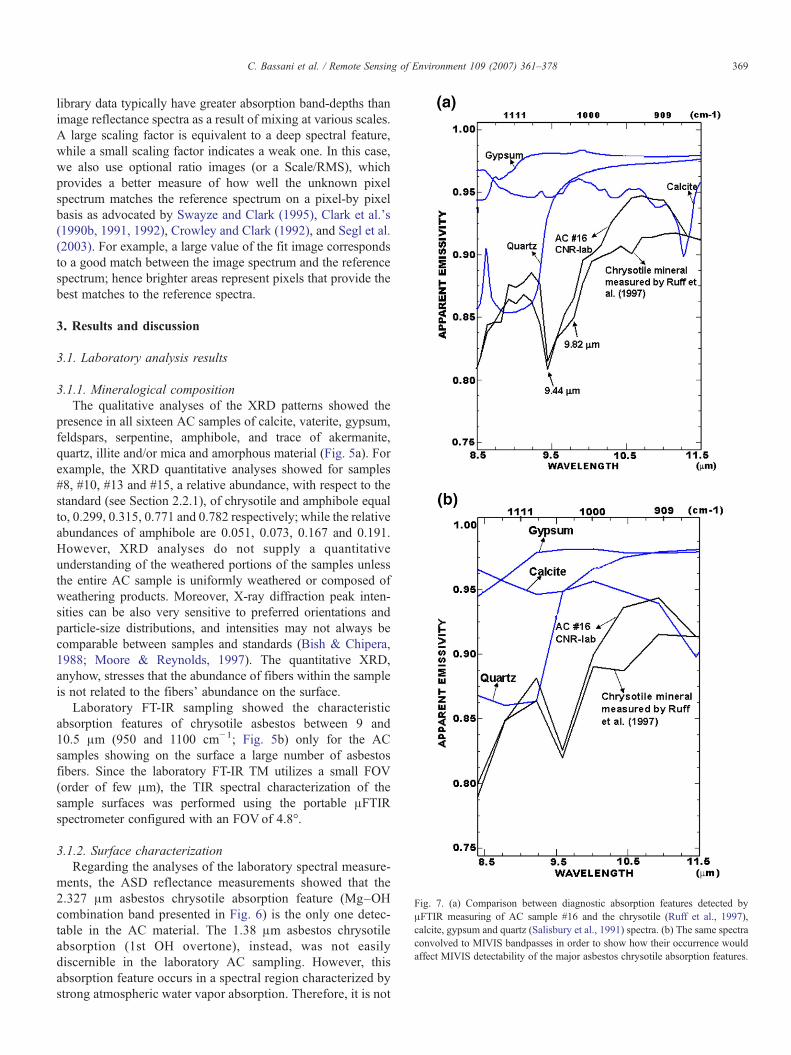
Fig. 7. (a) Comparison between diagnostic absorption features detected byμFTIR measuring of AC sample #16 and the chrysotile (Ruff et al., 1997),calcite, gypsum and quartz (Salisbury et al., 1991) spectra. (b) The same spectraconvolved to MIVIS bandpasses in order to show how their occurrence wouldaffect MIVIS detectability of the major asbestos chrysotile absorption features.
369C. Bassani et al. / Remote Sensing of Environment 109 (2007) 361–378
library data typically have greater absorption band-depths thanimage reflectance spectra as a result of mixing at various scales.A large scaling factor is equivalent to a deep spectral feature,while a small scaling factor indicates a weak one. In this case,we also use optional ratio images (or a Scale/RMS), whichprovides a better measure of how well the unknown pixelspectrum matches the reference spectrum on a pixel-by pixelbasis as advocated by Swayze and Clark (1995), Clark et al.'s(1990b, 1991, 1992), Crowley and Clark (1992), and Segl et al.(2003). For example, a large value of the fit image correspondsto a good match between the image spectrum and the referencespectrum; hence brighter areas represent pixels that provide thebest matches to the reference spectra.
3. Results and discussion
3.1. Laboratory analysis results
3.1.1. Mineralogical compositionThe qualitative analyses of the XRD patterns showed the
presence in all sixteen AC samples of calcite, vaterite, gypsum,feldspars, serpentine, amphibole, and trace of akermanite,quartz, illite and/or mica and amorphous material (Fig. 5a). Forexample, the XRD quantitative analyses showed for samples#8, #10, #13 and #15, a relative abundance, with respect to thestandard (see Section 2.2.1), of chrysotile and amphibole equalto, 0.299, 0.315, 0.771 and 0.782 respectively; while the relativeabundances of amphibole are 0.051, 0.073, 0.167 and 0.191.However, XRD analyses do not supply a quantitativeunderstanding of the weathered portions of the samples unlessthe entire AC sample is uniformly weathered or composed ofweathering products. Moreover, X-ray diffraction peak inten-sities can be also very sensitive to preferred orientations andparticle-size distributions, and intensities may not always becomparable between samples and standards (Bish & Chipera,1988; Moore & Reynolds, 1997). The quantitative XRD,anyhow, stresses that the abundance of fibers within the sampleis not related to the fibers' abundance on the surface.
Laboratory FT-IR sampling showed the characteristicabsorption features of chrysotile asbestos between 9 and10.5 μm (950 and 1100 cm−1; Fig. 5b) only for the ACsamples showing on the surface a large number of asbestosfibers. Since the laboratory FT-IR TM utilizes a small FOV(order of few μm), the TIR spectral characterization of thesample surfaces was performed using the portable μFTIRspectrometer configured with an FOV of 4.8°.
3.1.2. Surface characterizationRegarding the analyses of the laboratory spectral measure-
ments, the ASD reflectance measurements showed that the2.327 μm asbestos chrysotile absorption feature (Mg–OHcombination band presented in Fig. 6) is the only one detec-table in the AC material. The 1.38 μm asbestos chrysotileabsorption (1st OH overtone), instead, was not easilydiscernible in the laboratory AC sampling. However, thisabsorption feature occurs in a spectral region characterized bystrong atmospheric water vapor absorption. Therefore, it is not
370 C. Bassani et al. / Remote Sensing of Environment 109 (2007) 361–378
usable for further spectral and shape feature identifications ofdeteriorated AC roofs by remote sensing. Starting from thisassessment, it is evident that the diagnostic chrysotile absorp-tion feature, Mg–OH combination centered at 2.327 μm(Clark, 1999), was the only one detected in ASD laboratorysampling on the AC samples. Fig. 6 shows a comparisonbetween the chrysotile diagnostic absorption feature at2.32 μm and the other mineral absorption features containedin the samples, i.e. calcite, gypsum and quartz (from the USGSspectral libraries). Moreover, only the calcite spectrum showsan absorption feature, at 2.335 μm, approaching that ofchrysotile at 2.327 μm.
The μFTIR lab emissivity measurements of the 16 ACsamples showed, instead, the characteristic asbestos chrysotileabsorption feature, centered at 9.44 μm, which occur in theTIR spectral region between 9.0–10.5 μm. The 10.5 μmabsorption feature identified in the laboratory by Ruff et al.(1997), Salisbury et al. (1991) and Salisbury (1993) forchrysotile asbestos, was not easily detectable by the μFTIRmeasurements. Fig. 7a shows diagnostic absorption features(centered at 9.44 μm) detected by μFTIR measuring ACsample #16 and the chrysotile (Ruff et al., 1997), calcite,gypsum and quartz (from Salisbury et al., 1991) spectra forcomparison purposes. These spectra are shown in Fig. 7bwhen convolved to MIVIS bandpasses (Bassani et al., 2006)to highlight that the diagnostic absorption features are stilldetectable within MIVIS data set.
Of the minerals that compose the AC samples, only quartzemissivity spectrum exhibits an absorption feature close to thatof chrysotile at 9.44 μm (Fig. 7a). The spectral contrast of thechrysotile absorption feature at 9.44 can be influenced by (a) therestrahlen bands diagnostic of quartz that occur in this spectral
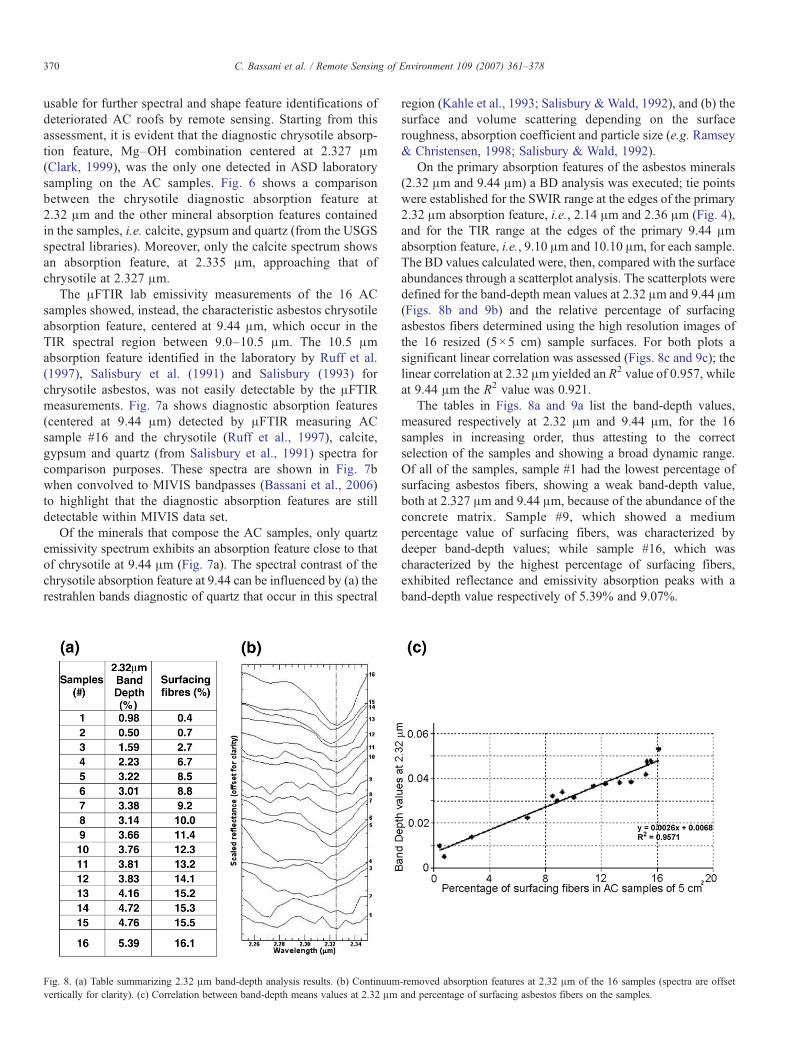
Fig. 8. (a) Table summarizing 2.32 μm band-depth analysis results. (b) Continuumvertically for clarity). (c) Correlation between band-depth means values at 2.32 μm
region (Kahle et al., 1993; Salisbury &Wald, 1992), and (b) thesurface and volume scattering depending on the surfaceroughness, absorption coefficient and particle size (e.g. Ramsey& Christensen, 1998; Salisbury & Wald, 1992).
On the primary absorption features of the asbestos minerals(2.32 μm and 9.44 μm) a BD analysis was executed; tie pointswere established for the SWIR range at the edges of the primary2.32 μm absorption feature, i.e., 2.14 μm and 2.36 μm (Fig. 4),and for the TIR range at the edges of the primary 9.44 μmabsorption feature, i.e., 9.10 μm and 10.10 μm, for each sample.The BD values calculated were, then, compared with the surfaceabundances through a scatterplot analysis. The scatterplots weredefined for the band-depth mean values at 2.32 μm and 9.44 μm(Figs. 8b and 9b) and the relative percentage of surfacingasbestos fibers determined using the high resolution images ofthe 16 resized (5×5 cm) sample surfaces. For both plots asignificant linear correlation was assessed (Figs. 8c and 9c); thelinear correlation at 2.32 μm yielded an R2 value of 0.957, whileat 9.44 μm the R2 value was 0.921.
The tables in Figs. 8a and 9a list the band-depth values,measured respectively at 2.32 μm and 9.44 μm, for the 16samples in increasing order, thus attesting to the correctselection of the samples and showing a broad dynamic range.Of all of the samples, sample #1 had the lowest percentage ofsurfacing asbestos fibers, showing a weak band-depth value,both at 2.327 μm and 9.44 μm, because of the abundance of theconcrete matrix. Sample #9, which showed a mediumpercentage value of surfacing fibers, was characterized bydeeper band-depth values; while sample #16, which wascharacterized by the highest percentage of surfacing fibers,exhibited reflectance and emissivity absorption peaks with aband-depth value respectively of 5.39% and 9.07%.
-removed absorption features at 2.32 μm of the 16 samples (spectra are offsetand percentage of surfacing asbestos fibers on the samples.
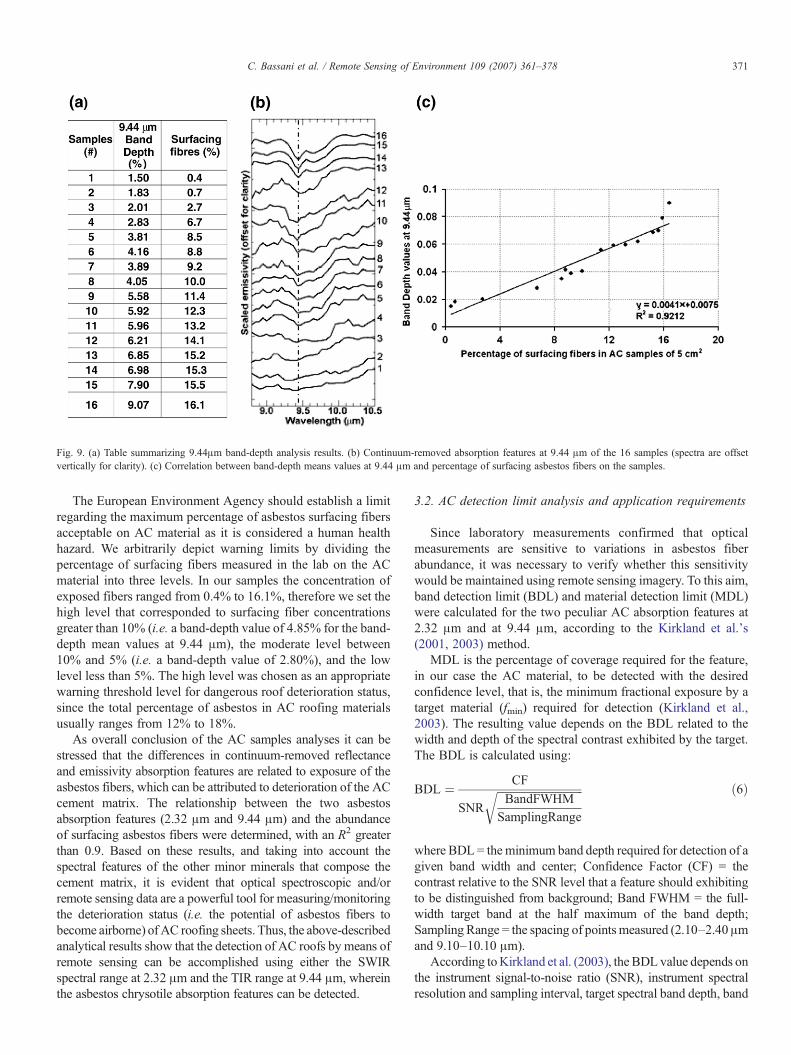
Fig. 9. (a) Table summarizing 9.44μm band-depth analysis results. (b) Continuum-removed absorption features at 9.44 μm of the 16 samples (spectra are offsetvertically for clarity). (c) Correlation between band-depth means values at 9.44 μm and percentage of surfacing asbestos fibers on the samples.
371C. Bassani et al. / Remote Sensing of Environment 109 (2007) 361–378
The European Environment Agency should establish a limitregarding the maximum percentage of asbestos surfacing fibersacceptable on AC material as it is considered a human healthhazard. We arbitrarily depict warning limits by dividing thepercentage of surfacing fibers measured in the lab on the ACmaterial into three levels. In our samples the concentration ofexposed fibers ranged from 0.4% to 16.1%, therefore we set thehigh level that corresponded to surfacing fiber concentrationsgreater than 10% (i.e. a band-depth value of 4.85% for the band-depth mean values at 9.44 μm), the moderate level between10% and 5% (i.e. a band-depth value of 2.80%), and the lowlevel less than 5%. The high level was chosen as an appropriatewarning threshold level for dangerous roof deterioration status,since the total percentage of asbestos in AC roofing materialsusually ranges from 12% to 18%.
As overall conclusion of the AC samples analyses it can bestressed that the differences in continuum-removed reflectanceand emissivity absorption features are related to exposure of theasbestos fibers, which can be attributed to deterioration of the ACcement matrix. The relationship between the two asbestosabsorption features (2.32 μm and 9.44 μm) and the abundanceof surfacing asbestos fibers were determined, with an R2 greaterthan 0.9. Based on these results, and taking into account thespectral features of the other minor minerals that compose thecement matrix, it is evident that optical spectroscopic and/orremote sensing data are a powerful tool for measuring/monitoringthe deterioration status (i.e. the potential of asbestos fibers tobecome airborne) of AC roofing sheets. Thus, the above-describedanalytical results show that the detection of AC roofs by means ofremote sensing can be accomplished using either the SWIRspectral range at 2.32 μm and the TIR range at 9.44 μm, whereinthe asbestos chrysotile absorption features can be detected.
3.2. AC detection limit analysis and application requirements
Since laboratory measurements confirmed that opticalmeasurements are sensitive to variations in asbestos fiberabundance, it was necessary to verify whether this sensitivitywould be maintained using remote sensing imagery. To this aim,band detection limit (BDL) and material detection limit (MDL)were calculated for the two peculiar AC absorption features at2.32 μm and at 9.44 μm, according to the Kirkland et al.'s(2001, 2003) method.
MDL is the percentage of coverage required for the feature,in our case the AC material, to be detected with the desiredconfidence level, that is, the minimum fractional exposure by atarget material (fmin) required for detection (Kirkland et al.,2003). The resulting value depends on the BDL related to thewidth and depth of the spectral contrast exhibited by the target.The BDL is calculated using:
BDL ¼ CF
SNR
ffiffiffiffiffiffiffiffiffiffiffiffiffiffiffiffiffiffiffiffiffiffiffiffiffiffiffiffiffiffiffiBandFWHM
SamplingRange
r ð6Þ
where BDL = the minimum band depth required for detection of agiven band width and center; Confidence Factor (CF) = thecontrast relative to the SNR level that a feature should exhibitingto be distinguished from background; Band FWHM = the full-width target band at the half maximum of the band depth;Sampling Range = the spacing of pointsmeasured (2.10–2.40μmand 9.10–10.10 μm).
According toKirkland et al. (2003), the BDL value depends onthe instrument signal-to-noise ratio (SNR), instrument spectralresolution and sampling interval, target spectral band depth, band
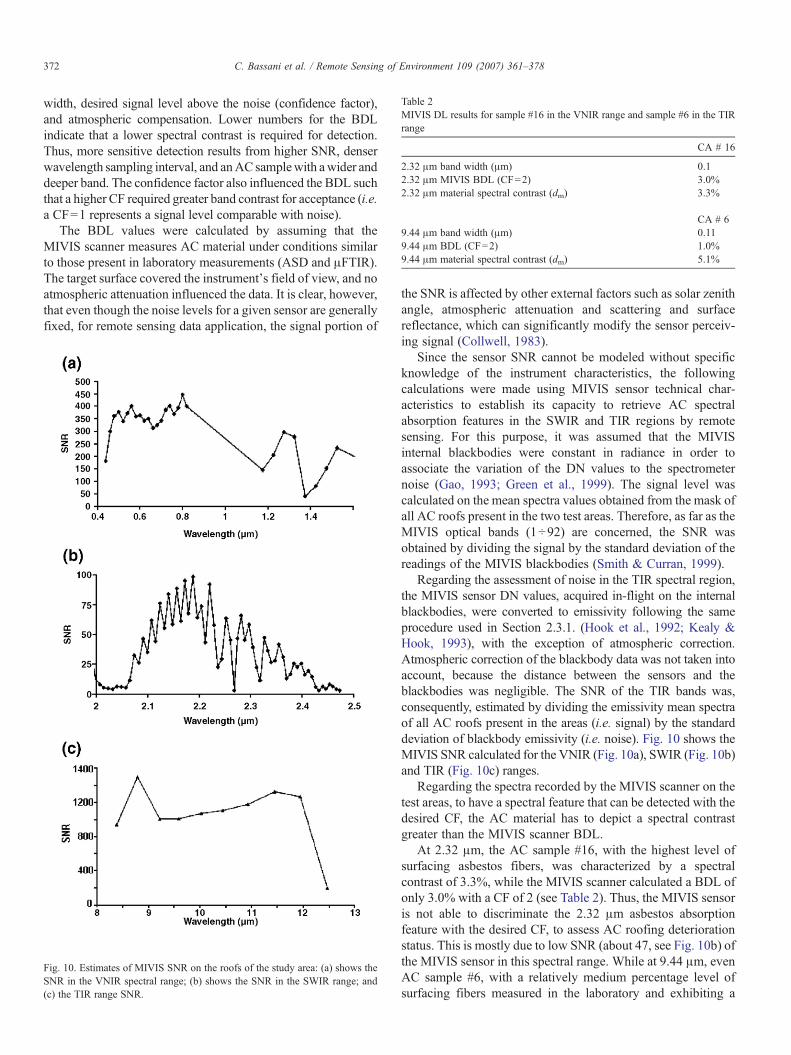
Table 2MIVIS DL results for sample #16 in the VNIR range and sample #6 in the TIRrange
CA # 16
2.32 μm band width (μm) 0.12.32 μm MIVIS BDL (CF=2) 3.0%2.32 μm material spectral contrast (dm) 3.3%
CA # 69.44 μm band width (μm) 0.119.44 μm BDL (CF=2) 1.0%9.44 μm material spectral contrast (dm) 5.1%
372 C. Bassani et al. / Remote Sensing of Environment 109 (2007) 361–378
width, desired signal level above the noise (confidence factor),and atmospheric compensation. Lower numbers for the BDLindicate that a lower spectral contrast is required for detection.Thus, more sensitive detection results from higher SNR, denserwavelength sampling interval, and anACsamplewith awider anddeeper band. The confidence factor also influenced the BDL suchthat a higher CF required greater band contrast for acceptance (i.e.a CF=1 represents a signal level comparable with noise).
The BDL values were calculated by assuming that theMIVIS scanner measures AC material under conditions similarto those present in laboratory measurements (ASD and μFTIR).The target surface covered the instrument's field of view, and noatmospheric attenuation influenced the data. It is clear, however,that even though the noise levels for a given sensor are generallyfixed, for remote sensing data application, the signal portion of
Fig. 10. Estimates of MIVIS SNR on the roofs of the study area: (a) shows theSNR in the VNIR spectral range; (b) shows the SNR in the SWIR range; and(c) the TIR range SNR.
the SNR is affected by other external factors such as solar zenithangle, atmospheric attenuation and scattering and surfacereflectance, which can significantly modify the sensor perceiv-ing signal (Collwell, 1983).
Since the sensor SNR cannot be modeled without specificknowledge of the instrument characteristics, the followingcalculations were made using MIVIS sensor technical char-acteristics to establish its capacity to retrieve AC spectralabsorption features in the SWIR and TIR regions by remotesensing. For this purpose, it was assumed that the MIVISinternal blackbodies were constant in radiance in order toassociate the variation of the DN values to the spectrometernoise (Gao, 1993; Green et al., 1999). The signal level wascalculated on the mean spectra values obtained from the mask ofall AC roofs present in the two test areas. Therefore, as far as theMIVIS optical bands (1÷92) are concerned, the SNR wasobtained by dividing the signal by the standard deviation of thereadings of the MIVIS blackbodies (Smith & Curran, 1999).
Regarding the assessment of noise in the TIR spectral region,the MIVIS sensor DN values, acquired in-flight on the internalblackbodies, were converted to emissivity following the sameprocedure used in Section 2.3.1. (Hook et al., 1992; Kealy &Hook, 1993), with the exception of atmospheric correction.Atmospheric correction of the blackbody data was not taken intoaccount, because the distance between the sensors and theblackbodies was negligible. The SNR of the TIR bands was,consequently, estimated by dividing the emissivity mean spectraof all AC roofs present in the areas (i.e. signal) by the standarddeviation of blackbody emissivity (i.e. noise). Fig. 10 shows theMIVIS SNR calculated for the VNIR (Fig. 10a), SWIR (Fig. 10b)and TIR (Fig. 10c) ranges.
Regarding the spectra recorded by the MIVIS scanner on thetest areas, to have a spectral feature that can be detected with thedesired CF, the AC material has to depict a spectral contrastgreater than the MIVIS scanner BDL.
At 2.32 μm, the AC sample #16, with the highest level ofsurfacing asbestos fibers, was characterized by a spectralcontrast of 3.3%, while the MIVIS scanner calculated a BDL ofonly 3.0% with a CF of 2 (see Table 2). Thus, the MIVIS sensoris not able to discriminate the 2.32 μm asbestos absorptionfeature with the desired CF, to assess AC roofing deteriorationstatus. This is mostly due to low SNR (about 47, see Fig. 10b) ofthe MIVIS sensor in this spectral range. While at 9.44 μm, evenAC sample #6, with a relatively medium percentage level ofsurfacing fibers measured in the laboratory and exhibiting a
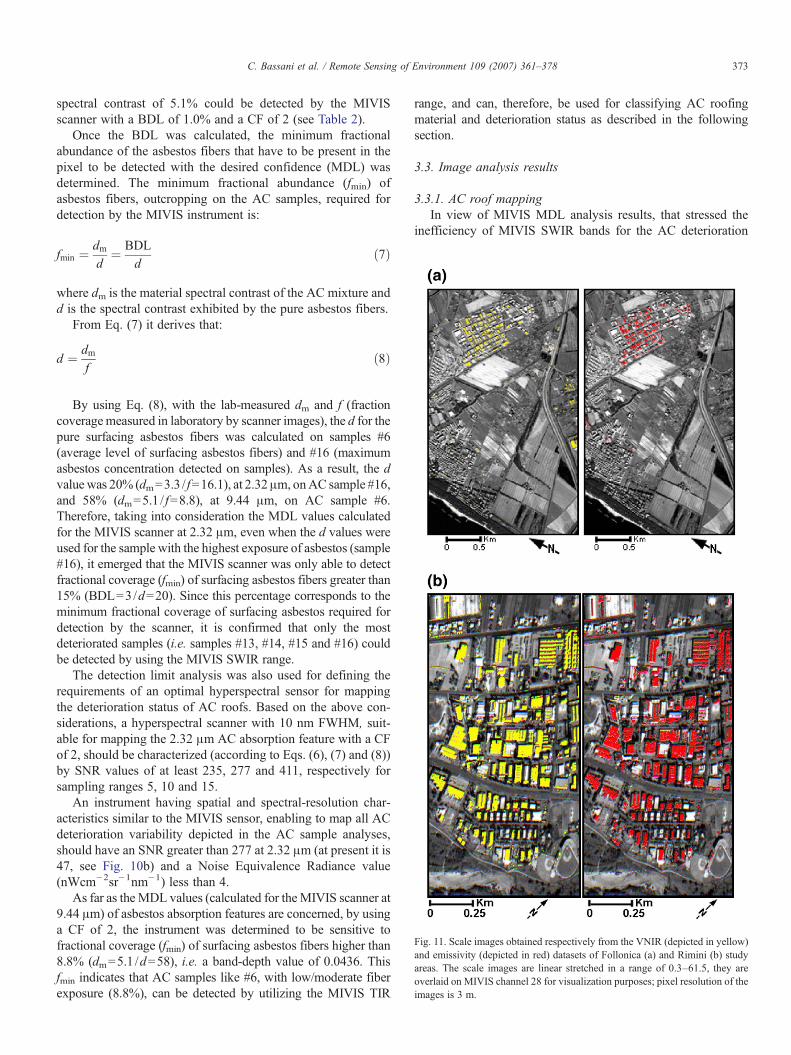
Fig. 11. Scale images obtained respectively from the VNIR (depicted in yellow)and emissivity (depicted in red) datasets of Follonica (a) and Rimini (b) studyareas. The scale images are linear stretched in a range of 0.3–61.5, they areoverlaid on MIVIS channel 28 for visualization purposes; pixel resolution of theimages is 3 m.
373C. Bassani et al. / Remote Sensing of Environment 109 (2007) 361–378
spectral contrast of 5.1% could be detected by the MIVISscanner with a BDL of 1.0% and a CF of 2 (see Table 2).
Once the BDL was calculated, the minimum fractionalabundance of the asbestos fibers that have to be present in thepixel to be detected with the desired confidence (MDL) wasdetermined. The minimum fractional abundance (fmin) ofasbestos fibers, outcropping on the AC samples, required fordetection by the MIVIS instrument is:
fmin ¼ dmd
¼ BDLd
ð7Þ
where dm is the material spectral contrast of the AC mixture andd is the spectral contrast exhibited by the pure asbestos fibers.
From Eq. (7) it derives that:
d ¼ dmf
ð8Þ
By using Eq. (8), with the lab-measured dm and f (fractioncoveragemeasured in laboratory by scanner images), the d for thepure surfacing asbestos fibers was calculated on samples #6(average level of surfacing asbestos fibers) and #16 (maximumasbestos concentration detected on samples). As a result, the dvaluewas 20% (dm=3.3 / f=16.1), at 2.32μm, onAC sample #16,and 58% (dm=5.1 / f=8.8), at 9.44 μm, on AC sample #6.Therefore, taking into consideration the MDL values calculatedfor the MIVIS scanner at 2.32 μm, even when the d values wereused for the sample with the highest exposure of asbestos (sample#16), it emerged that the MIVIS scanner was only able to detectfractional coverage (fmin) of surfacing asbestos fibers greater than15% (BDL=3/d=20). Since this percentage corresponds to theminimum fractional coverage of surfacing asbestos required fordetection by the scanner, it is confirmed that only the mostdeteriorated samples (i.e. samples #13, #14, #15 and #16) couldbe detected by using the MIVIS SWIR range.
The detection limit analysis was also used for defining therequirements of an optimal hyperspectral sensor for mappingthe deterioration status of AC roofs. Based on the above con-siderations, a hyperspectral scanner with 10 nm FWHM, suit-able for mapping the 2.32 μm AC absorption feature with a CFof 2, should be characterized (according to Eqs. (6), (7) and (8))by SNR values of at least 235, 277 and 411, respectively forsampling ranges 5, 10 and 15.
An instrument having spatial and spectral-resolution char-acteristics similar to the MIVIS sensor, enabling to map all ACdeterioration variability depicted in the AC sample analyses,should have an SNR greater than 277 at 2.32 μm (at present it is47, see Fig. 10b) and a Noise Equivalence Radiance value(nWcm−2sr−1nm−1) less than 4.
As far as theMDL values (calculated for theMIVIS scanner at9.44 μm) of asbestos absorption features are concerned, by usinga CF of 2, the instrument was determined to be sensitive tofractional coverage (fmin) of surfacing asbestos fibers higher than8.8% (dm=5.1 /d=58), i.e. a band-depth value of 0.0436. Thisfmin indicates that AC samples like #6, with low/moderate fiberexposure (8.8%), can be detected by utilizing the MIVIS TIR
range, and can, therefore, be used for classifying AC roofingmaterial and deterioration status as described in the followingsection.
3.3. Image analysis results
3.3.1. AC roof mappingIn view of MIVIS MDL analysis results, that stressed the
inefficiency of MIVIS SWIR bands for the AC deterioration
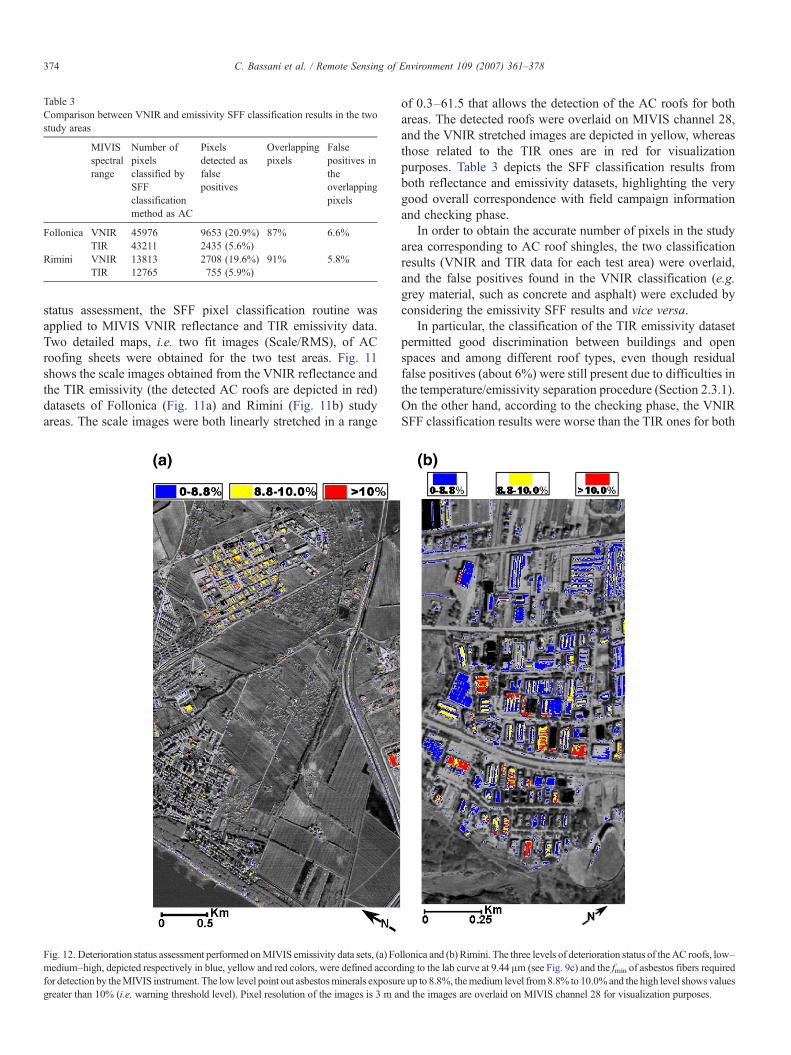
Table 3Comparison between VNIR and emissivity SFF classification results in the twostudy areas
MIVISspectralrange
Number ofpixelsclassified bySFFclassificationmethod as AC
Pixelsdetected asfalsepositives
Overlappingpixels
Falsepositives intheoverlappingpixels
Follonica VNIR 45976 9653 (20.9%) 87% 6.6%TIR 43211 2435 (5.6%)
Rimini VNIR 13813 2708 (19.6%) 91% 5.8%TIR 12765 755 (5.9%)
374 C. Bassani et al. / Remote Sensing of Environment 109 (2007) 361–378
status assessment, the SFF pixel classification routine wasapplied to MIVIS VNIR reflectance and TIR emissivity data.Two detailed maps, i.e. two fit images (Scale/RMS), of ACroofing sheets were obtained for the two test areas. Fig. 11shows the scale images obtained from the VNIR reflectance andthe TIR emissivity (the detected AC roofs are depicted in red)datasets of Follonica (Fig. 11a) and Rimini (Fig. 11b) studyareas. The scale images were both linearly stretched in a range
Fig. 12. Deterioration status assessment performed onMIVIS emissivity data sets, (a) Fomedium–high, depicted respectively in blue, yellow and red colors, were defined accordfor detection by theMIVIS instrument. The low level point out asbestosminerals exposurgreater than 10% (i.e. warning threshold level). Pixel resolution of the images is 3 m a
of 0.3–61.5 that allows the detection of the AC roofs for bothareas. The detected roofs were overlaid on MIVIS channel 28,and the VNIR stretched images are depicted in yellow, whereasthose related to the TIR ones are in red for visualizationpurposes. Table 3 depicts the SFF classification results fromboth reflectance and emissivity datasets, highlighting the verygood overall correspondence with field campaign informationand checking phase.
In order to obtain the accurate number of pixels in the studyarea corresponding to AC roof shingles, the two classificationresults (VNIR and TIR data for each test area) were overlaid,and the false positives found in the VNIR classification (e.g.grey material, such as concrete and asphalt) were excluded byconsidering the emissivity SFF results and vice versa.
In particular, the classification of the TIR emissivity datasetpermitted good discrimination between buildings and openspaces and among different roof types, even though residualfalse positives (about 6%) were still present due to difficulties inthe temperature/emissivity separation procedure (Section 2.3.1).On the other hand, according to the checking phase, the VNIRSFF classification results were worse than the TIR ones for both
llonica and (b) Rimini. The three levels of deterioration status of theAC roofs, low–ing to the lab curve at 9.44 μm (see Fig. 9c) and the fmin of asbestos fibers requirede up to 8.8%, themedium level from8.8% to 10.0%and the high level shows valuesnd the images are overlaid on MIVIS channel 28 for visualization purposes.
375C. Bassani et al. / Remote Sensing of Environment 109 (2007) 361–378
study areas. They often included roads, town squares andcement products, which could easily be confused due to theirsimilar grey color.
Based on a visual field accuracy assessment, AC roofs can beproperly identified in both study areas with accuracy rangingfrom 80 to 90%. In the Follonica area 89 AC roofs werecorrectly identified, corresponding to a total surface area ofabout 340,000 m2, while in the Rimini area 74 AC roofs wererecognized, corresponding to a surface area of about 94,950 m2.
3.3.2. AC roof deterioration status assessmentOnce the AC roofs were detected in the two study areas by
means of the SFF classification procedure, band-depth analysesat 9.44 μm were performed on MIVIS emissivity data sets toestablish surfacing asbestos fiber abundance and to evaluatetheir deterioration status. This was carried out by correlating thelab regression curve, at 9.44 μm, to the band depth calculated onthe MIVIS band centered at 9.44 μm for the AC roofs.
Fig. 12 shows the AC deterioration status assessment resultsfor the Follonica (Fig. 12a) and Rimini (Fig. 12b) study areas.The three levels of deterioration status, low–medium–high,were selected according to the lab regression line at 9.44 μmand the fmin of asbestos fibers required for detection by theMIVIS instrument. Since MIVIS fmin is 8.8% (corresponding toa band-depth value of 4.36%), the warning level thresholds,previously identified on the regression curves at 9.44 μm, haveto be re-defined to merge the MIVIS sensitivity. A new lowlevel was defined to describe the asbestos abundance up to8.8% (blue color in Fig. 12); therefore, surfaces showing anabundance of asbestos mineral below this threshold can be justrecognized as asbestos bearing material, even though any
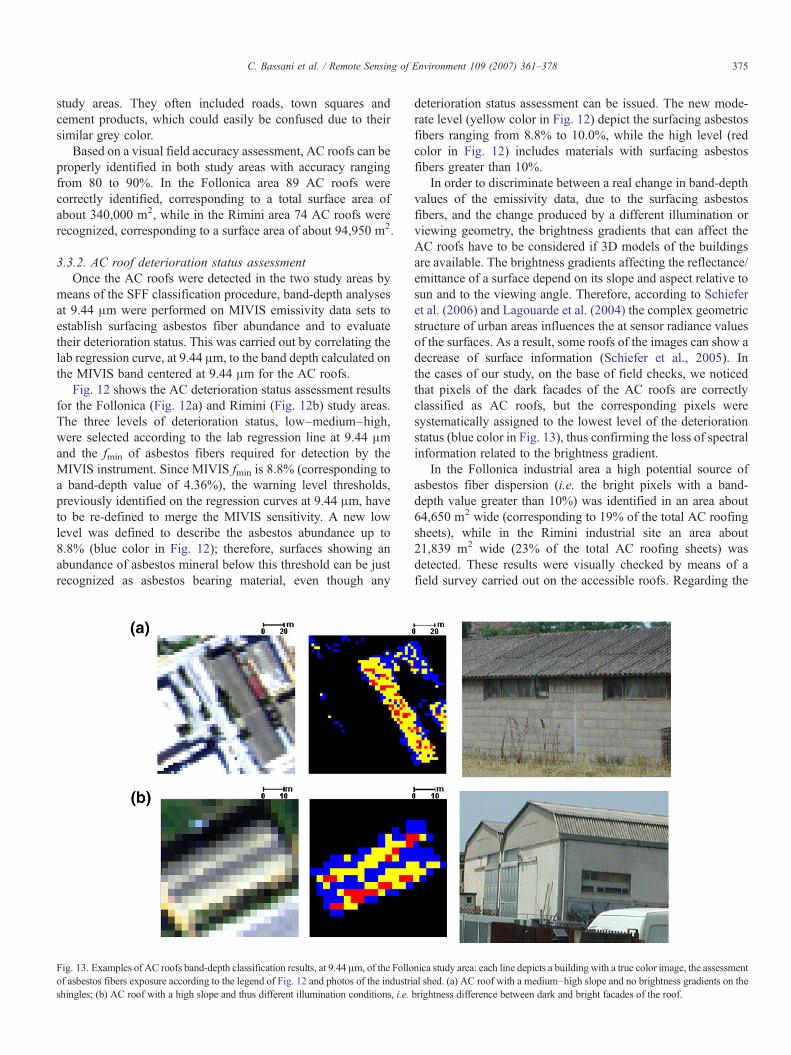
Fig. 13. Examples of AC roofs band-depth classification results, at 9.44 μm, of the Folloof asbestos fibers exposure according to the legend of Fig. 12 and photos of the industrishingles; (b) AC roof with a high slope and thus different illumination conditions, i.e.
deterioration status assessment can be issued. The new mode-rate level (yellow color in Fig. 12) depict the surfacing asbestosfibers ranging from 8.8% to 10.0%, while the high level (redcolor in Fig. 12) includes materials with surfacing asbestosfibers greater than 10%.
In order to discriminate between a real change in band-depthvalues of the emissivity data, due to the surfacing asbestosfibers, and the change produced by a different illumination orviewing geometry, the brightness gradients that can affect theAC roofs have to be considered if 3D models of the buildingsare available. The brightness gradients affecting the reflectance/emittance of a surface depend on its slope and aspect relative tosun and to the viewing angle. Therefore, according to Schieferet al. (2006) and Lagouarde et al. (2004) the complex geometricstructure of urban areas influences the at sensor radiance valuesof the surfaces. As a result, some roofs of the images can show adecrease of surface information (Schiefer et al., 2005). Inthe cases of our study, on the base of field checks, we noticedthat pixels of the dark facades of the AC roofs are correctlyclassified as AC roofs, but the corresponding pixels weresystematically assigned to the lowest level of the deteriorationstatus (blue color in Fig. 13), thus confirming the loss of spectralinformation related to the brightness gradient.
In the Follonica industrial area a high potential source ofasbestos fiber dispersion (i.e. the bright pixels with a band-depth value greater than 10%) was identified in an area about64,650 m2 wide (corresponding to 19% of the total AC roofingsheets), while in the Rimini industrial site an area about21,839 m2 wide (23% of the total AC roofing sheets) wasdetected. These results were visually checked by means of afield survey carried out on the accessible roofs. Regarding the
nica study area: each line depicts a building with a true color image, the assessmental shed. (a) AC roof with a medium–high slope and no brightness gradients on thebrightness difference between dark and bright facades of the roof.
376 C. Bassani et al. / Remote Sensing of Environment 109 (2007) 361–378
validation phase, difficulties were encountered in the checkingphase, because the owners of the buildings (mainly industrialsheds) did not allow us to carry the spectrometers on the roofs orto walk on them (AC sheets have a low bearing capacity) mostlyfor safety reasons. In any case, good correspondence was foundbetween deterioration status, derived from the MIVIS data andthe visually checked weathering status of the roofs. Inparticular, in the Follonica area it was observed that surfacedeterioration was greater on AC roofing sheets in the industrialdistrict than on AC sheets in rural settlements.
4. Summary and conclusions
This study demonstrates the utility of remote sensing data foridentifying asbestos-cement roofing sheets. In particular, thefeasibility of assessing the effect of asbestos roof deteriorationstatus, based on the amount of mineral fibers exposed, by usingSWIR and/or TIR multi or hyperspectral data, was established.These results are noteworthy because, as confirmed in themedical literature (see Suzuki et al., 2005), asbestos fiber airdispersion is a pathogenic agent which can cause lung cancer.
A sensitivity analysis of the band depth of the continuum-removed absorption features related to surfacing asbestos fibervariations shows a significant linear regression (R2N0.90) at2.32 μmand at 9.44 μm.Moreover, the spectral characteristics ofthe samples, based on detection limit analysis, were used tosimulate the instrumental characteristics (i.e., SNR, FWHM andsampling range) most suitable for detecting the two diagnosticasbestos absorption features in the SWIR and TIR. The detectionlimit analysis, carried out using the MIVIS noise characteristics,showed that a hyperspectral instrument optimal for assessing ACdeterioration status with an FHWM=10 and using a ConfidenceFactor value of 2, should have a signal-to-noise ratio greater than277 in the SWIR range. Furthermore, in order to minimize thebrightness effects due to illumination that influence the absolutedepth of AC absorption features, a radiative transfer model,working within 3D geometry of the roofs, has to be used.
For this study, only the TIR spectral region of the MIVISspectral ranges met these requirements and was applied todetect the asbestos roofing shingles and classify the bright pixelsdeterioration status based on the abundance of exposed asbestosfibers.
Although it is challenging to measure ground surface emis-sivity because of the difficulties of atmospheric correction andtemperature/emissivity separation, we believe that a better exploi-tation of TIR data allows for a more accurate discrimination of ACminerals based onmore diagnostic emissivity minima. This can befurther improved using more advanced hyperspectral thermalinstruments, such as SEBASS and AHI airborne scanners.
In the SWIR range, improvement in instrumental designcharacteristics such as SNR and spectral resolution wouldsignificantly enhance the ability to assess the deterioration levelof AC roofs, especially given that many of the diagnosticabsorption features related to AC minerals are within this range.Therefore, highly performing hyperspectral scanner in theSWIR range may supply enough information to identify ACroofs and, then, perform their deterioration status assessment.
At present, limitations in the use of low-cost remote-sensed data(i.e. satellite-borne) are mostly due to inadequate spatial resolution(i.e. pixel size), which creates problems in resolving small-sizedstructures such as AC roofs in complex mixing situations.
In conclusion, the spectral shape-based analysis used in thisstudy allows for a rapid discrimination of weathered AC roofsfrom neighboring open spaces. Therefore, these methods couldbe of great use in those areas where the AC roofing census iseither limited or not periodically updated. The link between theAC condition and hazardous deterioration status of roofs isimportant information for local authorities concerned withenvironmental health. This will allow for a development ofeffective intervention policies (i.e. for selecting roofs to beremoved or treated) and monitoring programs.
Acknowledgments
We would like to thank Dr. Luca Merucci, of the ItalianINGV (Istituto Nazionale di Geofisica e Vulcanologia), for hisassistance in thermal μFTIR field data collection.
References
Bassani, C., Cavalli, R. M., Palombo, A., Pignatti, S., & Madonna, F. (2006).Laboratory activity for a new procedure of MIVIS calibration and relativevalidation with test data. Annals of Geophysics, 49(1), 45−56.
Becker, F., & Li, Z. L. (1990). Temperature-independent spectral indices inthermal infrared bands. Remote Sensing of Environment, 32, 17−33.
Ben-Dor, E., Levin, N., & Saaroni, H. (2001). A spectral based recognition ofthe urban environment using the visible and near-infrared spectral region(0.4–1.1 m). A case study over Tel-Aviv. International Journal of RemoteSensing, 22(11), 2193−2218.
Berk, A., Bernstein, L. S., Anderson, G. P., Acharya, P. K., Robertson, D. C.,Chetwynd, J. H., et al. (1998). MODTRAN cloud and multiple scatteringupgrades with application to AVIRIS. Remote Sensing of Environment, 65,367−375.
Berk, A., Bernstein, L. S., & Robertson, D. C. (1989).MODTRAN: A moderateresolution model for LOWTRAN 7, Final report, GL-TR-0122, AFGL.Hanscomb AFB, MA 42 pp.
Bianchi, R., Marino, C. M., & Pignatti, S. (1994). Airborne hyperspectralremote sensing in Italy. Proc. EUROPTO series recent advances in remotesensing and hyperspectral remote sensing, SPIE, Rome (Italy), Vol. 2318(pp. 29−37).
Bish, D. L., & Chipera, S. J. (1988). Problems and solutions in quantitativeanalysis of complex mixtures by X-ray powder diffraction. In C. Barrett(Ed.), Advances in X-ray Analysis, Vol. 31 (pp. 295−308): Plenum Pub. Co.
Boardman, J. W., & Kruse, F. A. (1994). Automated spectral analysis: Ageologic example using AVIRIS data, north Grapevine Mountains, Nevada.Proceedings of the tenth thematic conference on geologic remote sensing(pp. 1407−1418). Ann. Arbor., MI: Environ. Res. Inst. of Michigan.
Boskovitz, V., & Guterman, H. (2002). An adaptive neuro-fuzzy system forautomatic image segmentation and edge detection. IEEE Transactions onFuzzy Systems, 10, 247−262.
Carlisle, O., Lucey, P. G., & Sherman, S. B. (2006,March 13–17).Thermal infraredweathering trajectories in Hawaiian basalts: Results from airborne, field andlaboratory observations. Lunar Planetary Sciences, Vol. XXXVII. Honolulu, HI96822: Hawaii Institute of Geophysics and Planetology, University of HawaiiLeague City, Texas.
Chandra, S., & Berntsson, L. (2003). Lightweight aggregate concrete-science.Technology and applications Norwich, NY: Noyes Publications 430 pp.
Clark, R. N. (1999). Spectroscopy of rocks and minerals and principles ofspectroscopy, Chapter 1. In A. N. Rencz (Ed.), Manual of remote sensing(pp. 3−58). New York: John Wiley and Sons.
377C. Bassani et al. / Remote Sensing of Environment 109 (2007) 361–378
Clark, R. N., Gallagher, A. J., & Swayze, G. A. (1990). Material absorption banddepth mapping of imaging spectrometer data using the complete bandshape least-squares algorithm simultaneously fit to multiple spectral featuresfrom multiple materials. Proceedings of the Third Airborne Visible/Infrared Imaging Spectrometer (AVIRIS) Workshop, JPL Publication,Vol. 90–54 (pp. 176−186).
Clark, R. N., Green, R. O., Swayze, G. A., Meeker, G., Sutley, S., Hoefen, T. M.,et al. (2001). Environmental studies of the World Trade Center area after theSeptember 11, 2001 attack. U.S. Geological Survey, Open File Report OFR-01-0429. http://speclab.cr.usgs.gov/wtc/ (accessed: February 2004).
Clark, R. N., King, T. V. V., Klejwa, M., & Swayze, G. A. (1990). High spectralresolution spectroscopy of minerals. Journal of Geophysical Research, 95(B8), 12653−12680.
Clark, R. N., & Roush, T. D. (1984). Reflectance spectroscopy: Quantitativeanalysis techniques for remote sensing applications. Journal of GeophysicalResearch, 89, 6329−6340.
Clark, R. N., Swayze, G. A., & Gallagher, A. (1992). Mapping the mineralogyand lithology of Canyon lands, Utah, with imaging spectrometer data andthe multiple spectral feature mapping algorithm. Summaries of the ThirdAnnual JPL Airborne Geoscience Workshop, JPL Publication 92-14, Vol. 1(pp. 11−13).
Clark, R. N., Swayze, G. A., Gallagher, A., Gorelick, N., & Kruse, F. A. (1991).Mapping with imaging spectrometer data using the complete band shapeleast-squares algorithm simultaneously fit to multiple spectral features frommultiple materials. Proc., 3rd Airborne Visible/Infrared Imaging Spectrom-eter (AVIRIS) workshop, JPL Publ., Vol. 91–28 (pp. 2−3).
Clark, R. N., Swayze, G. A., Wise, R., Livo, K. E., Hoefen, T. M., Kokaly, R. F.,et al. (2003). USGS Digital Spectral Library splib05a. U.S. GeologicalSurvey, Open File Report 03-395.
Collwell, R. N., (1983). Manual of Remote Sensing, 2nd Edition, AmericanSociety of Photogrammetry and Remote Sensing (ASPRS), pp. 344–363, andp. 1196.
Coutts, F. S. P. (2005). A review of Australian research into natural fibre cementcomposites. Cement and Concrete Composites, 27, 518−526.
Crowley, J. K., & Clark, R. N. (1992). AVIRIS study of Death Valley evaporitedeposits using least-squares band-fitting methods. Summaries of theThird Annual JPL Airborne Geoscience Workshop, JPL Publ. 92-14, Vol. 1(pp. 29−31).
Cudahy, T. J., Okada, K., Yamato, Y., Maekawa, M., Hackwell, J. A., &Huntington, J. F. (2000).Mapping skarn and porphyry alteration mineralogyat Yerington, Nevada, using airborne hyperspectral TIR SEBASS data.CSIRO Exploration and Mining Report, Vol. 734R. Floreat Park, WA,Australia: CSIRO Exploration and Mining.
Fiumi, L., Leone, A. P., & Marino, C. M. (1998). Uso dei dati MIVIS per lamappatura delle superfici in aree urbane, con particolare attenzione alcemento-amianto. Rivista Italiana di Telerilevamento, 13, 25−30.
Gao, B. (1993). An operational method for estimating signal to noise ratios fromdata acquired with imaging spectrometers. Remote Sensing of Environment,43, 23−33.
Gillespie, A. R. (1992). Spectral mixture analysis of multispectral thermalinfrared images. Remote Sensing of Environment, 42, 137−145.
Gillespie, A. R., Kahle, A. B., & Palluconi, F. D. (1984). Mapping alluvial fansin Death Valley, CA, using multispectral thermal infrared images. Geophy-sical Research Letters, 11(11), 1153−1156.
Gillespie, A. R., Rokugawa, S., Hook, S., Matsunaga, T., & Kahle, A. B.(1996, August). Temperature/emissivity separation algorithm theoreticalbasis document, version 2.3. Pasadena, CA: Jet Propulsion Laboratory.http://asterweb.jpl.nasa.gov/asterhome/atbd/ATBD-AST-03.doc
Gillespie, A. R., Rokugawa, S., Hook, S., Matsunaga, T., & Kahle, A. B. (1999).ASTER temperature/emissivity separation algorithm theoretical basisdocument, version 2.4. Washington, DC: NASA.
Gillespie, A. R., Rokugawa, S., Matsunaga, T., Cothern, J. S., Hook, S., &Kahle, A. B. (1998). A temperature and emissivity separation algorithm forAdvanced Spaceborne Thermal Emission and Reflection Radiometer(ASTER) images. IEEE Transactions on Geoscience and Remote Sensing,36(4), 1113−1126.
Green, R. O., Pavri, B., Faust, J., & Williams, O. (1999). AVIRIS radiometriclaboratory calibration, inflight validation, and a focused sensitivity analysis
in 1998. Proceedings of the 8th JPL Airborne Earth Science Workshop: JetPropulsion Laboratory Publication 99-17 (pp. 161−175).
Gu, D. G., Gillespie, A. R., Kahle, A. B., & Palluconi, F. D. (2000).Autonomous Atmospheric Compensation (AAC) of high-resolution hyper-spectral thermal infrared remote-sensing imagery. IEEE Transactions onGeoscience and Remote Sensing, 38(6), 2557−2570.
Heiden, U., Roessner, S., Segl, K., & Kaufmann, H. (2001). Analysis of spectralsignatures of urban surfaces for their area-wide identification usinghyperspectral HyMap data. Proc. IEEE-ISPRS Joint Workshop on RemoteSensing and Data Fusion over Urban Areas, Rome, Italy (pp. 173−177).
Hepner, G. F., & Chen, J. (2002). Investigation of imaging spectroscopy fordiscriminating urban land covers and surface materials. Proc. AVIRIS EarthScience and Applications Workshop, Palo Alto, CA. Available: [Online]http://popo.jpl.nasa.gov/docs/workshops/%2001_docs/2001Chen_web.pdf
Herold, M., Gardner, M., & Roberts, D. (2003). Spectral resolution requirementsfor mapping urban areas. IEEE Transactions on Geoscience and RemoteSensing, 41(9), 1907−1919.
Herold, M., Roberts, D. A., Gardner, M. E., & Dennison, P. E. (2004).Spectrometry for urban area remote sensing. Development and analysis of aspectral library from 350 to 2400 nm. Remote Sensing of Environment (91),304−319.
Hook, S. J., Abbott, E. A., Grove, C., Kahle, A. B., & Palluconi, F. D. (1999). InA. N. Rencz (Ed.), Use of multispectral thermal infrared data in geologicalstudies, (3rd ed.). Remote sensing for the earth sciences: manual of remotesensing, Vol. 3 (pp. 59−110) New York: Wiley.
Hook, S. J., Gabell, A. R., Green, A. A., & Kealy, P. S. (1992). A comparison oftechniques for extracting emissivity information from thermal infrared datafor geologic studies. Remote Sensing of Environment, 42, 123−135.
Hook, S. J., & Kahle, A. B. (1996). The Micro Fourier Transform Interferometer((FTIR) — A new field spectrometer for acquisition of Infrared data ofnatural surfaces. Remote Sensing of Environment, 56, 172−181.
Hook, S. J., Meyers, J. J., Thome, K. J., Fitzgerald, M., & Kahle, A. B. (2001).The MODIS/ASTER airborne simulator (MASTER) — A new instrumentfor earth science studies. Remote Sensing of Environment, 76(1), 93−102.
Johnson, B. R. (1998). In scene atmospheric compensation: Application toSEBASS data collected at the ARM site. Part I. Aerospace Corporationtechnical report, ATR-99, (8407)-1.
Kahle, A. B., & Goetz, A. F. (1983). Mineralogic information from a newairborne thermal infrared multispectral scanner. Science, 222, 24−27.
Kahle, A. B., Palluconi, F. D., & Christensen, P. R. (1993). Thermal emissionspectroscopy: Application to Earth and Mars. In C. M. Englert & P. A. J.Englert (Eds.), Topics in remote sensing for remote geochemical analysis:elemental and mineralogical composition (pp. 99−120). Cambridge, UK:Cambridge University Press.
Kahle, A. B., & Rowan, L. C. (1980). Evaluation of multispectral middleinfrared aircraft images for lithologic mapping in the East Tintic Mountains,Utah. Geology, 8, 234−239.
Kealy, P. S., & Hook, S. J. (1993). Separating temperature and emissivity inthermal infrared multispectral scanner data: Implications for recovery ofland surface temperatures. IEEE Transactions on Geoscience and RemoteSensing, 31, 1155−1164.
Kirkland, L. E., Herr, K. C., & Adams, P. M. (2003). Infrared stealthy surfaces:Why TES and THEMIS may miss some substantial mineral deposits onMars and implications for remote sensing of planetary surfaces. Journal ofGeophysical Research, [Planets], 108(E12), 5137.
Kirkland, L., Kenneth, H., Keim, E., Adams, P., Salisbury, J., Hackwell, J., et al.(2002). First use of an airborne thermal infrared hyperspectral scanner forcompositional mapping. Remote Sensing of Environment, 80, 447−459.
Kirkland, L. E., Kenneth, C. H., & Salisbury, J. W. (2001). Thermal infraredspectral band detection limits for unidentified surface materials. AppliedOptics, 40(27), 4852−4864.
Kokaly, R. F., & Clark, R. N. (1999). Spectroscopic determination of leafbiochemistry using band-depth analysis of absorption features andstepwise multiple linear regression. Remote Sensing of Environment, 67,267−287.
Korb, A. R., Dybwad, P., Wadsworth, W., & Salisbury, J. W. (1996). PortableFourier transform infrared spectroradiometer for field measurements ofradiance and emissivity. Applied Optics, 35(10), 1679−1692.
378 C. Bassani et al. / Remote Sensing of Environment 109 (2007) 361–378
Kruse, F. A., Boardman, J. W., & Huntington, J. F. (2003). Comparison ofairborne hyperspectral data and EO-1 Hyperion for mineral mapping. IEEETransactions on Geoscience and Remote Sensing, 41(6), 1388−1400.
Kruse, F. A., Boardman, J. W., & Huntington, J. F. (1999). Fifteen years ofhyperspectral data: Northern Grapevine Mountains, Nevada. Proceedingsof the eighth JPL airborne earth science workshop, JPL Publ., Vol. 99–17(pp. 247−256) Pasadena, CA: Jet Propulsion Lab.
Lagouarde, J. P., Moreaua, P., Irvinea, M., Bonnefonda, J. M., Voogtb, J. A., &Sollieca, F. (2004). Airborne experimental measurements of the angularvariations in surface temperature over urban areas: Case study of Marseille(France). Remote Sensing of Environment, 93, 443−462.
Li, Z. L., Becker, F., Stoll, M. P., & Wan, Z. (1999). Evaluation of six methodsfor extracting relative emissivity spectra from thermal infrared images. Re-mote Sensing of Environment, 69, 197−214.
Marabini, A., Fonda, A., and Plescia, P. (2002). Amianto manuale tecnico eoperativo. In Consiglio Nazionale delle Ricerche (Eds.) (pp. 18–25). Rome(Italy).
Marino, C. M., Panigada, C., & Busetto, L. (2001). Airborne hyperspectralremote sensing application in urban areas: Asbestos concrete sheetingidentification and mapping. IEEE/ISPRS joint workshop on remote sensingand data fusion over urban areas, Vol. 1 (pp. 212−216).
Moore, D. M., & Reynolds, R. C. (1997). X-ray diffraction and the identificationand analysis of clay minerals, second ed. : Oxford University Press, 378 pp.
Ramsey, M. S., & Christensen, P. R. (1998). Mineral abundance determination:Quantitative deconvolution of thermal emission spectra. Journal ofGeophysical Research, 103, 577−596.
Rawalt, C. J. (1998). Asbestos Project for GO 536 optical mineralogy. available.http://www.emporia.edu/earthsci/amber/students/rawalt/asbestos.htm(accessed: July 2005).
Realmuto, V. J. (1990). Separating the effects of temperature and emissivity:Emissivity spectrum normalization. Proc. 2nd TIMS WorkshopJPLPublication, Vol. 90–55 (pp. 31−35).
Roessner, S., Segl, K., Heiden, U., & Kaufmann, H. (2001). Automateddifferentiation of urban surfaces based on airborne hyperspectral imagery.IEEE Transactions on Geoscience and Remote Sensing, 39(7), 1525−1532.
Richter, R., Müller, A., Habermeyer, M., Dech, S., Segl, K., & Kaufmann, H.(2005). Spectral and radiometric requirements for the airborne thermalimaging spectrometer ARES. International Journal of Remote Sensing, 26(15), 3149−3162.
RSI, Research Systems, Inc. (2005). ENVI-Environment for Visualizing Images,Version 4.1.
Ruff, S. W., Christensen, P. R., Barbera, P. W., & Anderson, D. L. (1997).Quantitative thermal emission spectroscopy of minerals: A laboratorytechnique for measurement and calibration. Journal of GeophysicalResearch, 102(14), 899−913.
Sabine, C., Realmuto, V. J., & Taranik, J. V. (1994). Quantitative estimation ofgranitoid composition from thermal infrared multispectral scanner (TIMS)data, desolation wilderness, Northern Sierra Nevada, California. Journal ofGeophysical Research, 99(B3), 4261−4271.
Salisbury, J. W. (1993). Mid-infrared spectroscopy: Laboratory data, ch.4. In C.Pieters, & P. Englert (Eds.), Remote geochemical analysis: Elemental andmineralogical composition : Cambridge UP.
Salisbury, J. W., & Wald, A. (1992). The role of volume scattering in reducingspectral contrast of restrahlen bands in spectra of powdered minerals. Icarus,96, 121−128.
Salisbury, J. W., Walter, L. S., Vergo, N., & D'Aria, D. M. (1991). Infraredspectra of minerals (2.1–25 micrometers). Baltimore: Johns Hopkins UP294 pp.
Schiefer, S., Hostert, P., & Damm, A. (2005). Analysis of view-angle effects inhyperspectral data of urban areas. Proceedings of the joint URS/URBANConference, March 14–16 2005, Tempe, AZ CD-ROM.
Schiefer, S., Hostert, P., & Damm, A. (2006). Correcting brightness gradients inhyperspectral data from urban areas. Remote Sensing of Environment, 101(1), 25−37.
Segl, K., Heiden, U., Roessner, S., & Kaufmann, H. (2003). Fusion of spectral andshape features for identification of urban surface cover types using reflectiveand thermal hyperspectral data. ISPRS Journal of PERS, 58, 99−112.
Small, C. (2001). Scaling properties of urban reflectance spectra. AVIRISEarth Science and Applications Workshop, 27 Feb-2 Mar 2001,Pasadena, CA. available: http://popo.jpl.nasa.gov/docs/workshops/01_docs/2001Proceedings.zip (accessed: September 2003).
Small, C. (2003). High spatial resolution spectral mixture analysis of urbanreflectance. Remote Sensing of Environment, 88, 170−186.
Smith, G.M., &Curran, P. J. (1999). Methods for estimating image signal-to-noiseratio (SNR). In P. M. Atkinson &N. J. Tate (Eds.),Advances in remote sensingand GIS analysis (pp. 61−74). New York: John Wiley & Sons.
Spurny, K. R., Marfels, H., Boose, C., Weiss, G., Opiela, H., & Wulbeck, F. J.(1989). Fiber emissions from weathered and corroded asbestos cementproducts. Part 2. Physical and chemical properties of the released asbestosfibres. Zentralblatt fuer Hygiene und Umweltmedizin, 188(3,4), 262−270.
Suzuki, Y., Yuen, S. R., & Ashley, R. (2005). Short, thin asbestos fibrescontribute to the development of human malignant mesothelioma:pathological evidence. International Journal of Hygiene and EnvironmentalHealth, 208, 201−210.
Swayze, G. A., & Clark, R. N. (1995). Spectral identification of mineralsusing imaging spectrometry data: evaluating the effects of signal to noiseand spectral resolution using the Tricorder Algorithm. Summaries of theFifth Annual JPL Airborne Earth Science Workshop, JPL Pub., Vol. 95–1(pp. 157−158).
United States Geological Survey Mineral Resource Program. (2004). Available:http://minerals.usgs.gov/(accessed:05/ 2005).
Vaughan, R. G., Wendy, M. C., & Taranik, J. V. (2003). SEBASS hyperspectralthermal infrared data: Surface emissivity measurement and mineralmapping. Remote Sensing of Environment, 85, 48−63.
Vermote, E. F., El Saleous, N., Justice, C. O., Kaufman, Y. J., Privette, J. L., Remer,L., et al. (2003). Asbestos: Geology, Mineralogy, Mining, and Uses. U.S.Department of the Interior, U.S. Geological Survey, Open-File Report 02-149.Available: http://minerals.usgs.gov/minerals/pubs/commodity/asbestos/(accessed:05/ 2005).
Virta, R. L. (2003). Asbestos: Geology, Mineralogy, Mining, and Uses. U.S.Department of the Interior, U.S. Geological Survey, Open-File Report 02-149.Available: http://minerals.usgs.gov/minerals/pubs/commodity/asbestos/(accessed:05/ 2005).
Virta, R. L. (2006). 2005 Minerals Year Book: Asbestos. U.S. Department of theInterior, USGS.Available. http://minerals.usgs.gov/minerals/pubs/commodity/asbestos/asbesmyb05.pdf (accessed:06/ 2006).
Watson, K. (1992). Spectral ratio method for measuring emissivity. RemoteSensing of Environment, 42, 113−116.
Welch, R. (1982). Spatial resolution requirements for urban studies. Interna-tional Journal of Remote Sensing, 3(2), 139−146.
Young, S. J. (1998). In scene atmospheric compensation: Application toSEBASS data collected at the ARM Site. Part II. Aerospace Corporationtechnical report, ATR-99 (8407)-1.
Glossary
AC: Asbestos cementXRD: X-ray diffractionFTIR: Fourier transform infra redSEM: Scanning electron microscopyVIS: VisibleSWIR: Short wave infra redTIR: Thermal infra redBDL: Band detection limitMDL: Material detection limitCF: Confidence factorMIVIS: Multispectral infrared visible imagine spectrometerHIS: Hyperspectral imaging sensorFWHM: Full-width half-maximum
Related Documents