Detectors of single photons (…on the road to nano) O. Haderka Regional Center for Advanced Technologies and Materials, Joint Laboratory of Optics, Palacký University, 17. listopadu 50a, 772 07 Olomouc, Czech Republic.

Detectors of single photons (…on the road to nano) O. Haderka Regional Center for Advanced Technologies and Materials, Joint Laboratory of Optics, Palacký.
Dec 27, 2015
Welcome message from author
This document is posted to help you gain knowledge. Please leave a comment to let me know what you think about it! Share it to your friends and learn new things together.
Transcript

Detectors of single photons (…on the road to nano)
O. Haderka
Regional Center for Advanced Technologies and Materials, Joint Laboratory of Optics, Palacký University, 17. listopadu 50a, 772 07 Olomouc, Czech Republic.

Why to detect single photons?
In classical optics – every photon is valuable (e.g., in astronomy)
In quantum optics/information time-correlated photon counting (TCPC) some tasks benefit from single photons (QKD,
QM) other tasks require single photons (LOQC)
Other applications in particle physics, biomedical research, atmospheric pollution measurements, LIDAR etc.
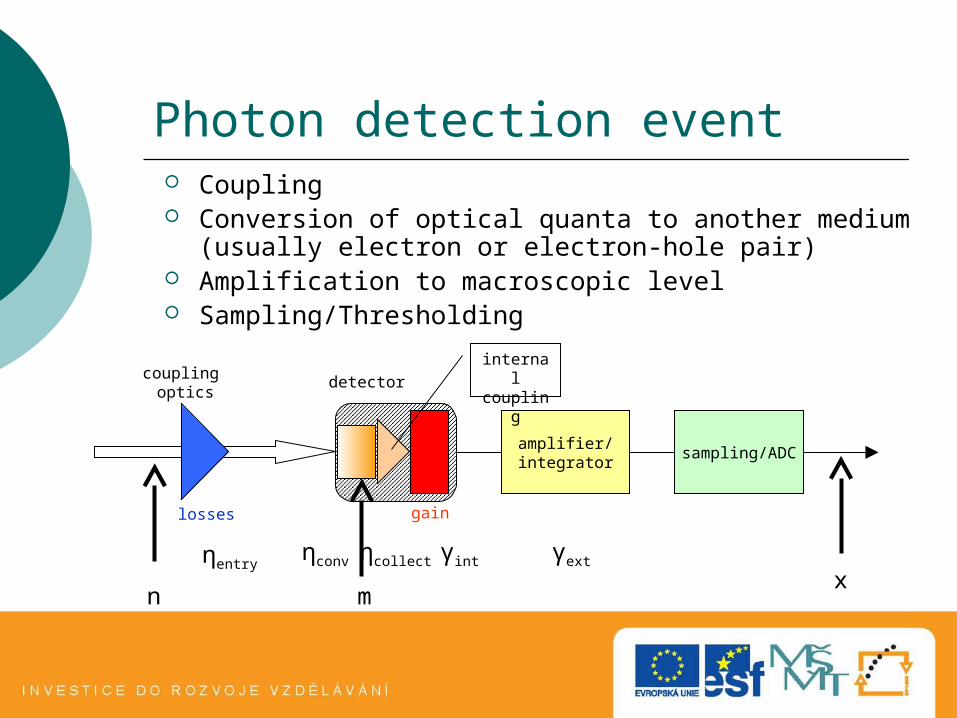
Photon detection event Coupling Conversion of optical quanta to another medium
(usually electron or electron-hole pair) Amplification to macroscopic level Sampling/Thresholding
amplifier/integrator
sampling/ADC
coupling optics
gain
internal couplingdetector
n mx
losses
ηentryηconv ηcollect γint γext
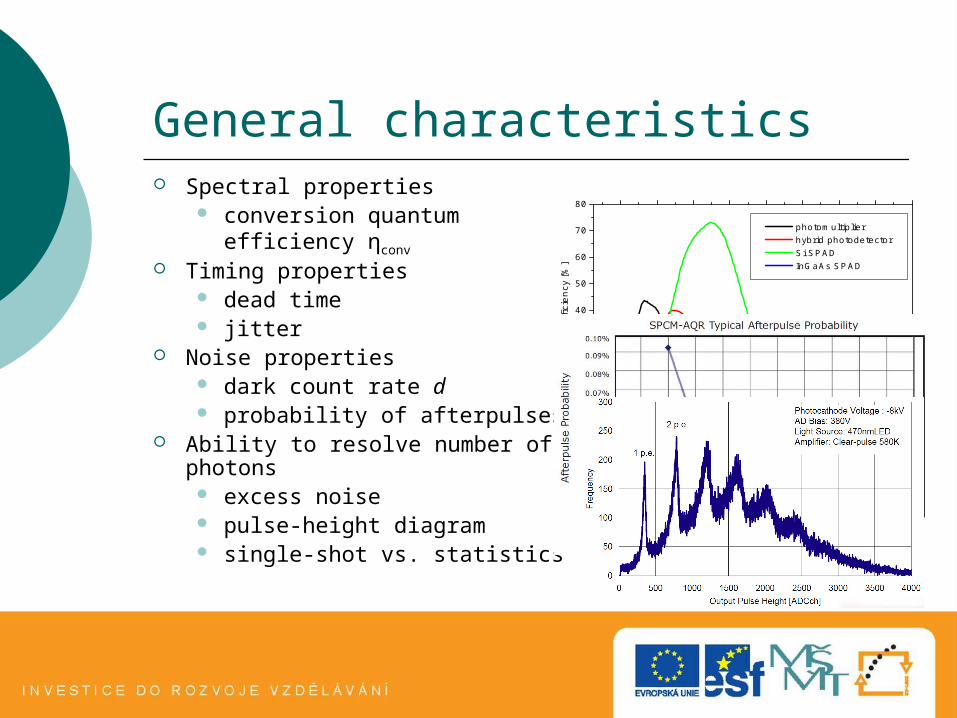
General characteristics Spectral properties
conversion quantum efficiency ηconv
Timing properties dead time jitter
Noise properties dark count rate d probability of afterpulses
Ability to resolve number of photons excess noise pulse-height diagram single-shot vs. statistics
200 400 600 800 1000 1200 1400 1600 18000
10
20
30
40
50
60
70
80
Qua
ntum
eff
icie
ncy
[%]
Wavelength [nm]
photomultiplier hybrid photodetector Si SPAD InGaAs SPAD
Overview of current technologies
Photomultiplier tubes Avalanche photodiodes Hybrid photodetectors Visible light photon counters Transition-edge sensors Frequency up-conversion Superconducting nanowires Quantum dots & defects Carbon nanotubes (?)

Photomultiplier tubes
the oldest photon-counting detector (1949)
large active areas ( > 10 mm)
amplification excess noise can be lowered using first dynode from suitable material (GaP)
η = 40% @ 500 nm (GaAsP)d ≈ 100 Hz, Δt ≈ 300 ps
η = 2% @ 1550 nm (InP/InGaAs @ 200 K), d ≈ 200 kHz
HamamatsuBurle
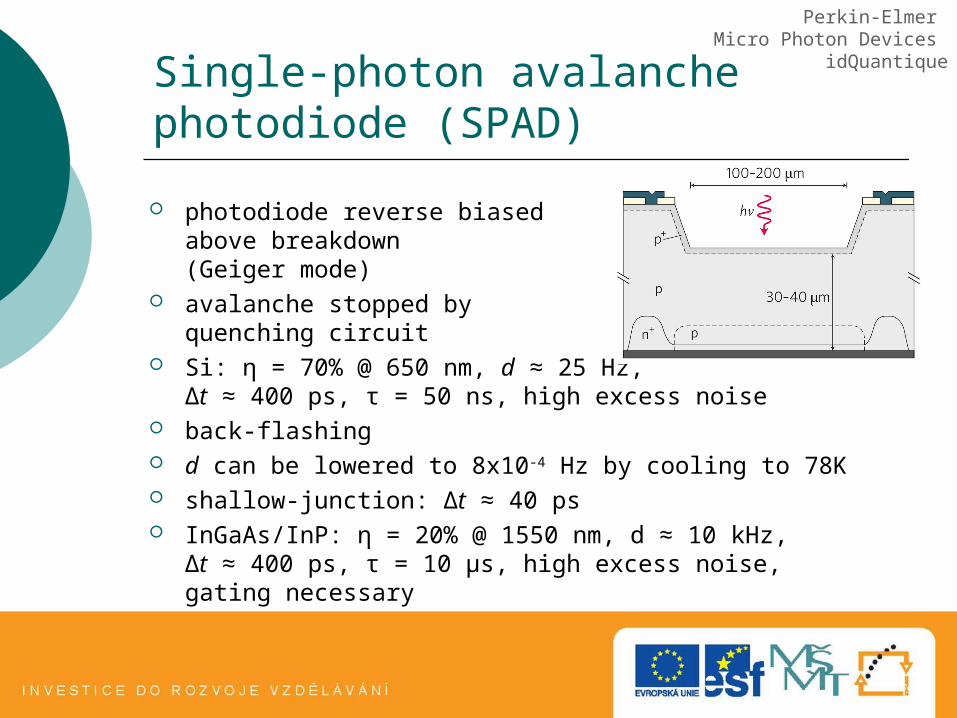
Single-photon avalanche photodiode (SPAD)
photodiode reverse biased above breakdown (Geiger mode)
avalanche stopped by quenching circuit
Si: η = 70% @ 650 nm, d ≈ 25 Hz,Δt ≈ 400 ps, τ = 50 ns, high excess noise
back-flashing d can be lowered to 8x10⁻⁴ Hz by cooling to 78K shallow-junction: Δt ≈ 40 ps InGaAs/InP: η = 20% @ 1550 nm, d ≈ 10 kHz,
Δt ≈ 400 ps, τ = 10 μs, high excess noise, gating necessary
Perkin-Elmer Micro Photon Devices
idQuantique

Hybrid photodetectors
combination of a photocathode with avalanche photodiode
low excess noise due to single large-amplification step
η = 46% @ 500 nm, d ≈ 1 kHz, Δt ≈ 35 ps
Hamamatsu

Frequency up-conversion conversion
of IR-photons to a region with better detectors
PPLN: 90% conversion very intense pumping needed (cavity or
waveguide) high-noise (background nonlinear processes
emitting at target wavelength due to strong pumping)
η = 46% @ 1550 nm, d ≈ 800 kHz, Δt ≈ 400 ps (thick junction Si SPAD)
coherent up-conversion is feasible
Albota et al., OL 29, 1449 (2004)Langrock et al., OL 30, 1725 (2005)
1550 nm
1064 nm 630 nm

Visible-light photon counters (VLPC)
controlled single-carrier multiplication process @ 6K temperature
avalanche triggered by a hole in As-doped region confined to 20 μm
resolves up to 5 photons ηconv = 88% @ 694 nm
(ηconv = 93% @ near IR), d ≈ 20 kHz, Δt ≈ 250 ps, τ = 100 ns
Kim et al., APL 74, 902 (1999)Takeuchi et al., APL 74, 1063 (1999)
Figure by Y. Yamamoto
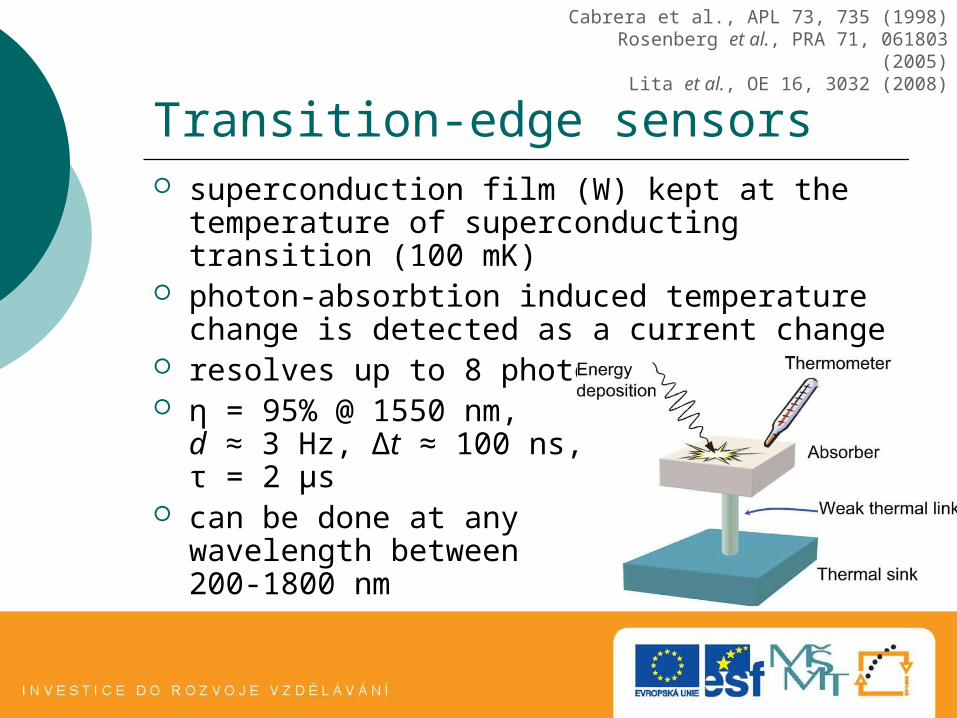
Transition-edge sensors superconduction film (W) kept at the
temperature of superconducting transition (100 mK)
photon-absorbtion induced temperature change is detected as a current change
resolves up to 8 photons η = 95% @ 1550 nm,
d ≈ 3 Hz, Δt ≈ 100 ns, τ = 2 μs
can be done at anywavelength between200-1800 nm
Cabrera et al., APL 73, 735 (1998)Rosenberg et al., PRA 71, 061803 (2005)
Lita et al., OE 16, 3032 (2008)
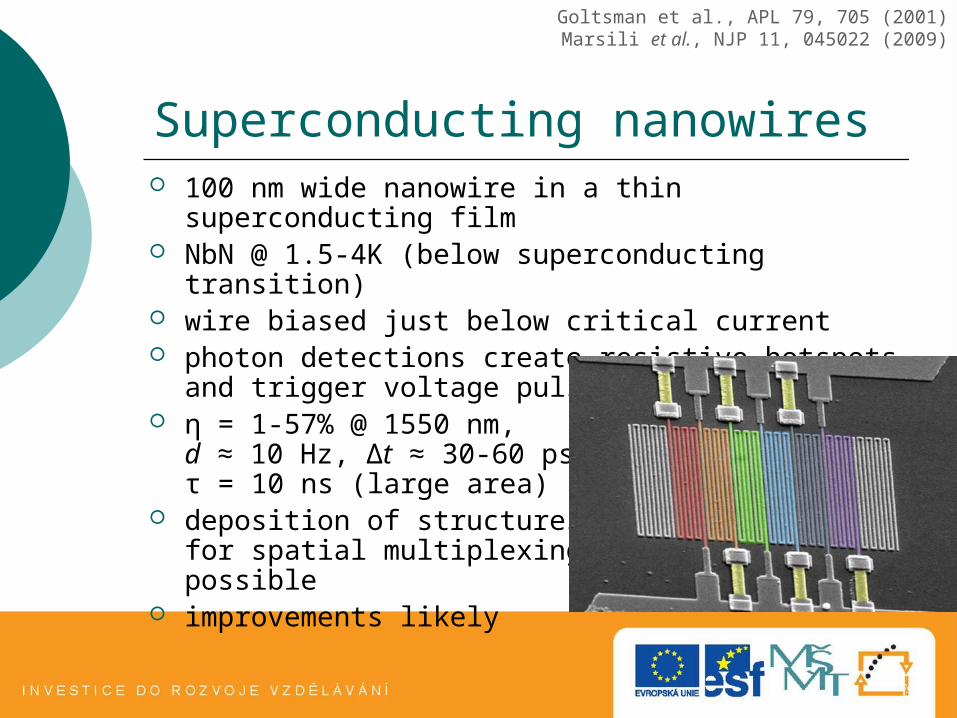
Superconducting nanowires 100 nm wide nanowire in a thin superconducting
film NbN @ 1.5-4K (below superconducting transition) wire biased just below critical current photon detections create resistive hotspots and
trigger voltage pulses η = 1-57% @ 1550 nm,
d ≈ 10 Hz, Δt ≈ 30-60 ps,τ = 10 ns (large area)
deposition of structures for spatial multiplexing possible
improvements likely
Goltsman et al., APL 79, 705 (2001)Marsili et al., NJP 11, 045022 (2009)

Quantum dots or defects trapping of charge in defects heterostructures based on III-V compounds
trapped charge alters conductance in a field-effect transistor (ηconv = 68% @ 805 nm, resolves up to 3 photons)
alters tunneling probabilityin a resonant tunnel diode (ηconv = 12% @ 550 nm, d = 2x10⁻³ Hz)
4K temperature needed improvements likely
Rowe et al., APL 89, 253505 (2006)Kardynal et al., APL 90, 181114 (2007)
Blakesley et al., PRL 94, 067401 (2005)

Carbon nanotubes (?) multi-wall carbon
nanotubes are grown (CVD) on p-doped silicon substrate
structure behaves like a photodiode with η≈50%
Ambrosio et al., NIMPRA 617, 378 (2010)

Multichannel detectors
[VLPC, HD, nanowires] Fiber-loops Solid state photomultipliers i-CCD cameras EM-CCD cameras
input statevariable ratio
couplerAPD
10m delay loop
connector
2 0 0 4 0 0 6 0 0 8 0 0 1 0 0 0 1 2 0 01 0 -5
1 0-4
1 0 -3
1 0 -2
1 0 -1
1 00
Pro
ba
bili
ty o
f de
tect
ion
T im e D e la y a fte r sta rt p u lse [n s]
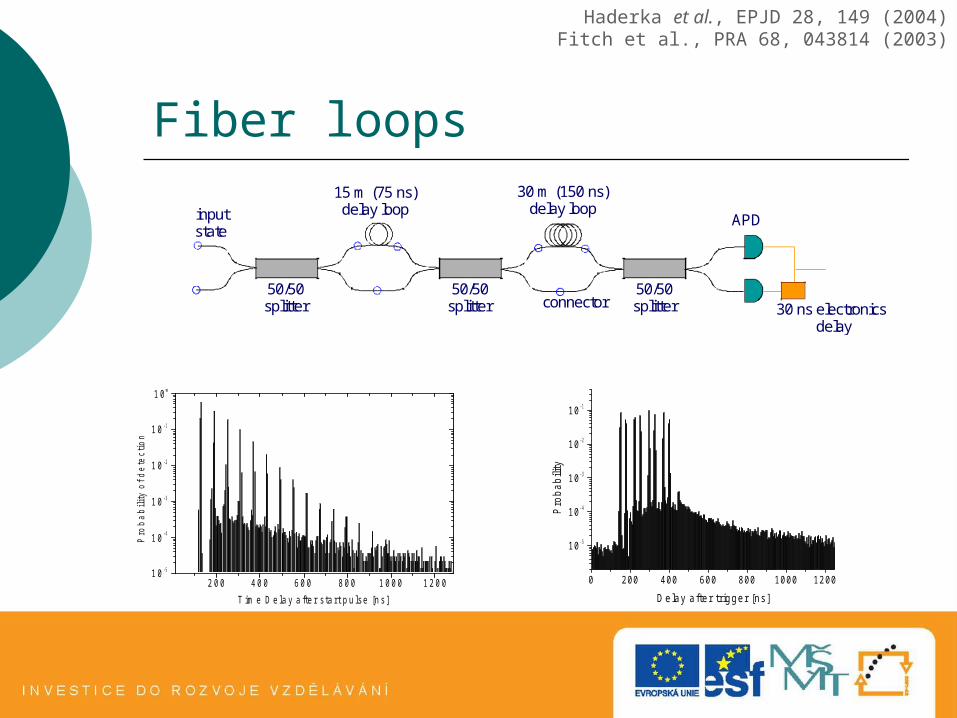
Fiber loops
0 200 400 600 800 1000 1200
10 -5
10 -4
10 -3
10 -2
10 -1
Pro
ba
bili
ty
D elay a fte r trigger [ns ]
Haderka et al., EPJD 28, 149 (2004)Fitch et al., PRA 68, 043814 (2003)
15 m (75 ns)delay loop
30 m (150 ns) delay loop
30 ns electronicsdelay
APD
50/50 splitter
50/50 splitter
50/50 splitter
input state
connector
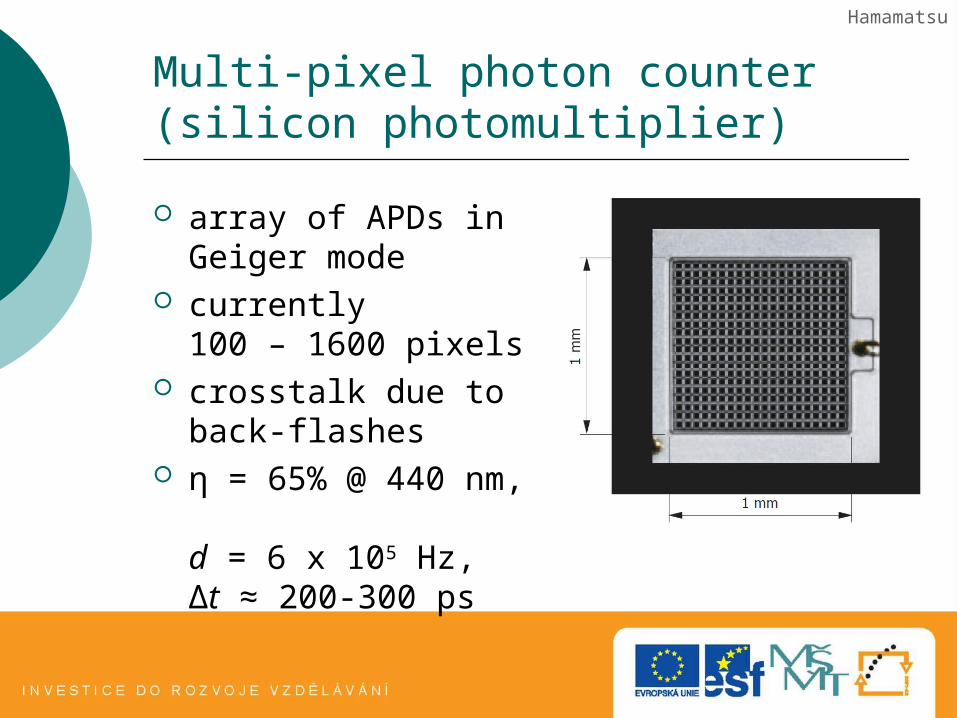
Multi-pixel photon counter (silicon photomultiplier)
array of APDs in Geiger mode
currently 100 – 1600 pixels
crosstalk due to back-flashes
η = 65% @ 440 nm, d = 6 x 10⁵ Hz, Δt ≈ 200-300 ps
Hamamatsu
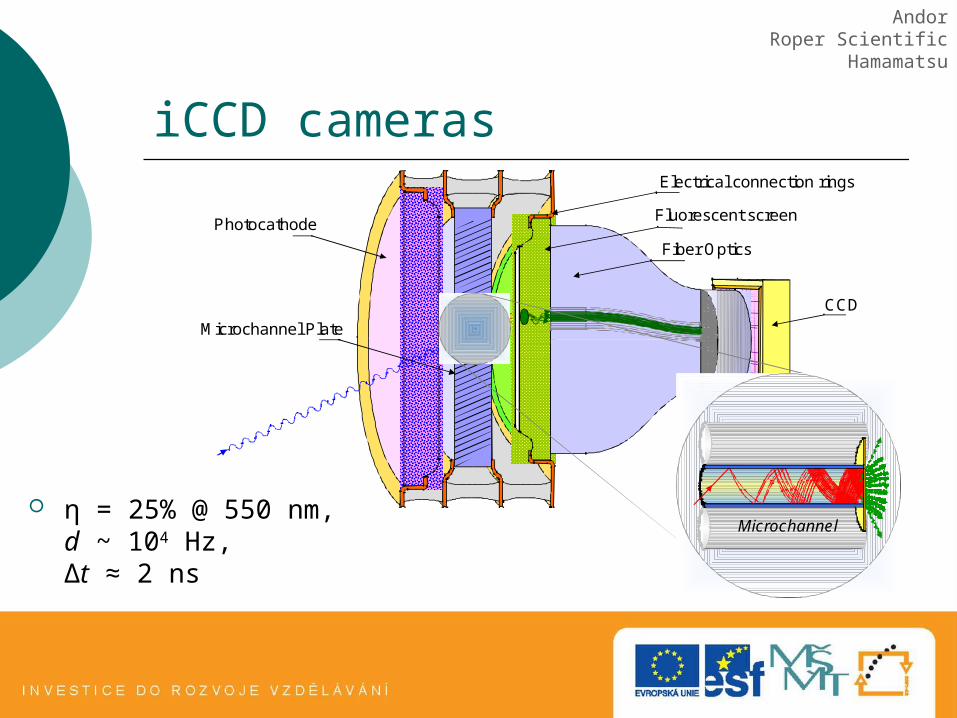
iCCD cameras
Photocathode
Microchannel Plate
Fluorescent screen
Electrical connection rings
Fiber Optics
CCD
Microchannel
AndorRoper Scientific
Hamamatsu
η = 25% @ 550 nm, d ~ 104 Hz, Δt ≈ 2 ns

EM-CCD (L3) cameras high η of back-
illuminated CCDs single photon sensitivity CIC noise ‘slow’ shutter η = 97% @ 550 nm
AndorRoper Scientific
Hamamatsu

Figures of merit
For binary detectors:
efficiency factor Qeff
For photon-number resolving detectors:peak-to-valley contrastnumber of resolvable peaks
effective number of channels
n-photon fidelity
tdQeff
tdN 1ENC

Detector comparison chart [Qeff]
400 600 800 1000 1200 1400 1600
2
4
6
8
10
Bur
le 8
850
Ham
amat
su H
1033
0A-7
5
Per
kin-
Elm
er A
QR
16
MP
D
idQ
uant
ique
id20
1
HP
D
Take
sue
et a
l. (2
005)
Take
uchi
et a
l. (1
999)
Lita
et a
l. (2
008)
.
Ros
fjord
et a
l. (2
006)
Row
e et
al.
(200
6)
Had
erka
et a
l. (2
004)
Mič
uda
et a
l. (2
008)
PI-M
AX
512
And
or iS
tar 7
34
And
or iX
on+
888
Ham
amat
su M
PC
C
Jian
g et
al.
(200
7)
log
(Qe
ff)
Wavelength [nm]
photomultiplier SPAD hybrid photodetector up-conversion VLPC TES nanowire quantum dot fiberloop iCCD EMCCD MPPC

Detector comparison chart [ENC]
0 1 2 3 4 5 6
0
20
40
60
80
100
PMT Burle 8850
PMT VIS
PMT IR
Si SPAD PE
Si SPAD MPD
InGaAs SPAD
HPD
up-conversion
VLPC
TES
nanowire
QD
fiberloop
fiberloop
iCCD IR
iCCD VIS
EMCCD
MPPC VIS
MPPC IR
QE
[%]
log(ENC)
photomultiplier SPAD hybrid photodetector up-conversion VLPC TES nanowire quantum dot fiberloop iCCD EMCCD MPPC

n-photon fidelity
0 2 4 6 8 10 12 14 16 18 2010-2
10-1
100
Fid
elity
Fn
Input photon number n
photomultiplier hybrid detector VLPC TES quantum dot fiber loop iCCD MPCC EM-CCD
Olomouc: Application of single-photon detectors to twin photon beams
Characterization of photon-number correlations
Spatial correlations Absolute quantum efficiency
measurement Noise reduction techniques
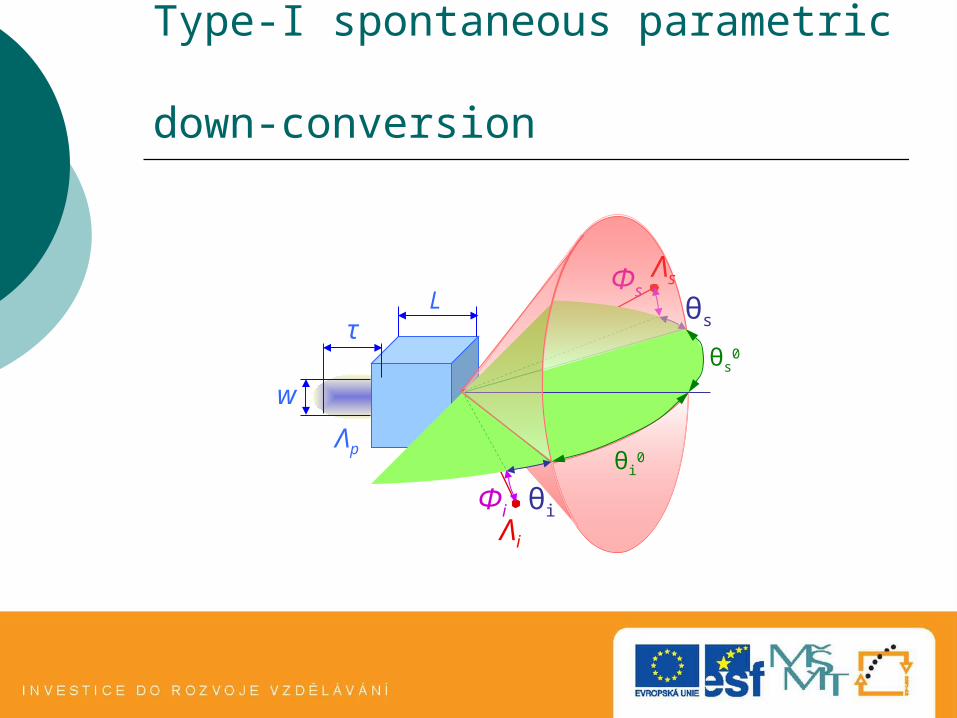
θi0
θs0
Φs
Φi θi
θsL
τ
w
Λp
Λi
Λs
Type-I spontaneous parametric down-conversion

Generation and measurement of photon twins

Detection with iCCD camerasignal strip idler strip
noise reference
summed image

Photon-number correlations
0 %
0 %
0 %
0 %
0 5 10 15 20 250
5
10
15
20
25
nS
nI
-15 %
-12 %
-9 %
-6 %
-3 %
0 %
3 %
6 %
9 %
12 %
15 %
5060
7080
90100
110120
5060
7080
90100
110120
n S
nI
Haderka et al., PRA 71, 033815 (2005)

Spatial correlations
S I
S I
ideal phasematching
area of correlation
-40 -30 -20 -10 0 10 20 30 40
-40
-30
-20
-10
0
10
20
30
40
S [m rad ]
I [
mra
d]

Spatial correlations:varying the pump beam spectrum
Spatial spectrum of the pump beamTemporal pump-field spectrum
Experimental radial cross-section of the correlation area
Experimental angular cross-section of the correlation area

Spatial correlations:varying the pump beam shape

CONCLUSION
Single photon detection technology makes big leaps
Promising nanotechnologies appear Both intrinsic and multichannel photon-
number resolution improves This all should contribute to present &
future quantum information systems
Related Documents