Detection of physiological singularities in respiratory dynamics analyzed by recurrence quantification analysis of tracheal sounds Antonio Vena a,c , Elio Conte b,c , Gaetano Perchiazzi a,c , Antonio Federici b,c , Rocco Giuliani a,c , Joseph P. Zbilut d, * a Department of Emergency and Transplantation, Bari University Hospital, Bari, Italy b Department of Pharmacology and Human Physiology, Bari University Hospital, Bari, Italy c TIRES––Center for Innovative Technologies for Signal Detection and Processing, University of Bari, Bari, Italy d Department of Molecular Biophysics and Physiology, Rush University, 1653 W. Congress, Chicago, IL 60612, USA Accepted 8 March 2004 Abstract Following a previous analysis that was performed on lung sounds of right and left apexes [Chaos, Solitons & Fractals 2004;21:869–77], in the present paper we studied tracheal sounds by recurrence quantification analysis, adding chaos analysis as estimation of correlation dimension and Lyapunov spectrum. The results confirm the presence of singularities indicating that respiratory dynamics is controlled by a discrete non-deterministic dynamics based on violation of Lipschitz conditions. On the basis of the results, it is also evidenced the possibility to introduce new indexes having interest in respiratory diagnostic routine. Ó 2004 Elsevier Ltd. All rights reserved. 1. Introduction Nonlinear system theory became widely used in recent years to characterize the behavior of a physiological dynamical system from a single experimental time series especially in the analysis of electrocardiogram (ECG) and electroencephalogram (EEG) [1]. The concept of the cardiac rhythm as expression of a periodic oscillator was chal- lenged in the late 1980s when the scientific research showed the heart to be associated with irregular and possibly chaotic-deterministic dynamics. Studies indicated that externally stimulated cardiac tissue develops bifurcation patterns like period doubling or intermittences that are characteristic of nonlinear dynamical systems. Several authors advanced the suggestion that the fractal structure of the His-Purkinje system should represent a structural substrate of chaotic- deterministic cardiac dynamics [2]. It was deduced that strictly periodic cardiac dynamics should not represent a healthy condition but, on the contrary, turned out to be correlated with pathological states. The whole paradigmatic framework of biology and medicine was designed for change. Since then, the idea that nonlinear methods might reflect properties associated with normal as well as pathological heart functioning more accurately than conventional ones, stimulated increasing interest in the application of tools from nonlinear dynamics to a multitude of investigated biological and physiological signals. * Corresponding author. Tel.: +1-312-942-6008; fax: +1-312-942-8711. E-mail address: [email protected] (J.P. Zbilut). 0960-0779/$ - see front matter Ó 2004 Elsevier Ltd. All rights reserved. doi:10.1016/j.chaos.2004.03.005 Chaos, Solitons and Fractals 22 (2004) 869–881 www.elsevier.com/locate/chaos

Welcome message from author
This document is posted to help you gain knowledge. Please leave a comment to let me know what you think about it! Share it to your friends and learn new things together.
Transcript
Chaos, Solitons and Fractals 22 (2004) 869–881
www.elsevier.com/locate/chaos
Detection of physiological singularities in respiratorydynamics analyzed by recurrence quantification analysis
of tracheal sounds
Antonio Vena a,c, Elio Conte b,c, Gaetano Perchiazzi a,c, Antonio Federici b,c,Rocco Giuliani a,c, Joseph P. Zbilut d,*
a Department of Emergency and Transplantation, Bari University Hospital, Bari, Italyb Department of Pharmacology and Human Physiology, Bari University Hospital, Bari, Italy
c TIRES––Center for Innovative Technologies for Signal Detection and Processing, University of Bari, Bari, Italyd Department of Molecular Biophysics and Physiology, Rush University, 1653 W. Congress, Chicago, IL 60612, USA
Accepted 8 March 2004
Abstract
Following a previous analysis that was performed on lung sounds of right and left apexes [Chaos, Solitons &
Fractals 2004;21:869–77], in the present paper we studied tracheal sounds by recurrence quantification analysis, adding
chaos analysis as estimation of correlation dimension and Lyapunov spectrum. The results confirm the presence of
singularities indicating that respiratory dynamics is controlled by a discrete non-deterministic dynamics based on
violation of Lipschitz conditions. On the basis of the results, it is also evidenced the possibility to introduce new indexes
having interest in respiratory diagnostic routine.
� 2004 Elsevier Ltd. All rights reserved.
1. Introduction
Nonlinear system theory became widely used in recent years to characterize the behavior of a physiological
dynamical system from a single experimental time series especially in the analysis of electrocardiogram (ECG) and
electroencephalogram (EEG) [1]. The concept of the cardiac rhythm as expression of a periodic oscillator was chal-
lenged in the late 1980s when the scientific research showed the heart to be associated with irregular and possibly
chaotic-deterministic dynamics. Studies indicated that externally stimulated cardiac tissue develops bifurcation patterns
like period doubling or intermittences that are characteristic of nonlinear dynamical systems. Several authors advanced
the suggestion that the fractal structure of the His-Purkinje system should represent a structural substrate of chaotic-
deterministic cardiac dynamics [2]. It was deduced that strictly periodic cardiac dynamics should not represent a healthy
condition but, on the contrary, turned out to be correlated with pathological states. The whole paradigmatic framework
of biology and medicine was designed for change. Since then, the idea that nonlinear methods might reflect properties
associated with normal as well as pathological heart functioning more accurately than conventional ones, stimulated
increasing interest in the application of tools from nonlinear dynamics to a multitude of investigated biological and
physiological signals.
* Corresponding author. Tel.: +1-312-942-6008; fax: +1-312-942-8711.
E-mail address: [email protected] (J.P. Zbilut).
0960-0779/$ - see front matter � 2004 Elsevier Ltd. All rights reserved.
doi:10.1016/j.chaos.2004.03.005
870 A. Vena et al. / Chaos, Solitons and Fractals 22 (2004) 869–881
Currently, some physiological and pathological systems seem to exhibit what we could call an apparent random
behavior whose actual nature must be further investigated. The purpose of studies is usually to define whether
dynamical indices, usually employed, such as correlation dimension, Lyapunov exponents and entropy can be used as
useful parameters in clinical studies in order to identify existing deterministic-chaos.
The basic difficulty remains to ascertain whether the experimental time series is generated by a deterministic-chaotic
dynamics or by an alternative mechanism having strong stochastic features but arising from non-deterministic chaotic
behavior. It has been recognized that the usual measures employed in such studies as saturation of correlation
dimension and existence of positive Lyapunov exponents cannot be definitive by themselves to establish the chaotic-
deterministic behavior of the system. Errors associated with the acquisition of data as inappropriate sampling fre-
quency, noise filtering and digitization errors can lead to uncertainties in the value of correlation dimension. Even for
uncorrelated random data, one may have correlation dimension values converging to D2 ¼ ð�2 logNÞ= log e where N is
the number of points in the experimental time series and e is the length scale at which the slope of the correlation
integral is calculated.
Therefore, we cannot conclude for system behavior to be deterministic-chaotic based solely on the convergence of
D2–values. For a time series without noise, the largest Lyapunov exponent, kmax, gives the exponential rate of divergence
of two neighboring trajectories in the phase space. However, the existence of positive kmax is true also for stochastic
dynamical systems. Therefore, also the Lyapunov index does not necessarily indicate that a given system is deter-
ministic-chaotic on the basis of its being positive. The emerging feature is that we have, in conclusion, the need to re-
frame the problem under the perspective of a more complete elaboration.
It is possible to analyze some of the fundamental questions that still remain to be considered. The first point regards
the problem of establishing the real features of the assumed existing determinism in the dynamics of living systems.
Determinism represented the basic paradigm of physical science during the last 300 years. It may be defined as
proposition that each event is necessarily and uniquely consequence of past (future) events: such events evolve in
temporally ordered sequence directed by an implication that flows along the sequence fixing each successive (past) event
on the basis of the preceding (future) events according with some definite rule. Determinism became incorporated into
modern science around the 1500 AD. supporting as universal the tenet that cause and effect mechanism governs all
motion and structure of the material level of reality. The major feature of determinism is its rigidity. Chaotic deter-
minism exhibits the same rigidity since, in spite of the chaotic behavior of the system, in any way the strong requirement
of the acting deterministic rule, remains. The deterministic system is linked to its initial conditions: every time it
operates only if it is able to remember the initial conditions from which it started. In living matter it is difficult to accept
such an extreme dependence of a physiological system from its initial conditions. A physiological system, in fact, is
required to adapt continuously its behavior to the requirements imposed from the environmental conditions in which it
operates. On a qualitative level of elaboration, this is the first reason for having doubts on the possibility to apply the
rigid deterministic paradigm to living matter.
The second reason regards experimental facts that directly may be observed and thus they may represent the basic
foundation of a different approach. The biological systems often exhibit oscillations in their behavior that result to be
not periodic. In addition to such oscillating behavior, the biological signals also exhibit some ‘‘pauses’’ that were de-
fined for the first time ‘‘singularities’’ in previous works [3]. Obviously, such singularities cannot be indicative of
deterministic behavior. Consequently, the purpose to progressively analyze various kinds of physiological systems in
order to experimentally identify their possible singularities and to formulate them under the profile of a theoretical
elaboration, represents an important objective of our activity.
Rather recently, we were able to detect for the first time physiological singularities in respiratory dynamics utilizing
the recurrence quantification analysis of lung sounds [4]. The present paper represents a following development of that
one [4]: we will employ here the same methodology in order to detect physiological singularities using, this time, tra-
cheal sounds. Moreover, in this paper we will include also a complete chaos analysis of such sounds based mainly on
phase space reconstruction, on estimation of correlation dimension and of Lyapunov spectrum. In addition to the
undoubted interest for this kind of analysis here, one must account however that the employed data exhibited often
non-stationary behavior.
2. The theory
Let us recall briefly some basic theoretical features that were previously discussed in detail [4]. Singularities
indicate, first of all, non-stationarity in biological signals. The problem of their correct interpretation becomes the
basic step in order to coherently describe the dynamics of living matter. To explain singularities we have to reconsider
determinism.
A. Vena et al. / Chaos, Solitons and Fractals 22 (2004) 869–881 871
The basic key in determinism is represented by Lipschitz conditions whose validity ensures uniqueness of solutions
for differential equations and thus uniqueness of trajectory in the considered dynamics of the corresponding system.
If a dynamical system is represented by an equation that is non-Lipschitz at a singular point, several solutions will
possibly intersect at this point. After the singular point is intersected, the dynamics of the system will not be determined
by the dynamics before, and thus, the system will exhibit a non-deterministic behavior. In detail, whenever a phase
space trajectory comes near the singularity, any arbitrary small perturbation will put the trajectory on a completely
different solution. The time evolution of the system will consist of a series of transient trajectories with a new one chosen
randomly whenever the solution nears the non-Lipschitz point in the presence of noise. In conclusion, such system will
be able to exhibit also non-deterministic chaos [3]. Control mechanisms will also act in this framework.
It is well known that the control of deterministic-chaotic systems using small perturbations has been the subject of
various studies. It involves the stabilization of unstable periodic orbits which are embedded in phase space of chaotic
motion. As there exists an infinity of orbits, a great variety of behaviors may be extracted from the controlled deter-
ministic-chaotic system. This allows the optimization of system’s behavior [5]. In the case of systems exhibiting non-
deterministic chaos, the situation is quite similar. We have a continuum of different solutions intersecting at a single
point. In this case, control may be realized via an appropriate perturbation. Similar to the case of control for deter-
ministic-chaos, there is the possibility of optimization of behavior for the system in proximity of the singularity.
The above arguments may be considered sufficient for a preliminary exposition of a new theory. It remains to outline
here the importance of such a theory for application to physiological data.
3. On some basic features of the cardio-pulmonary system
It is known that the essential physiological functions of the cardio-pulmonary system are to provide periodically gas
exchange and supply organs and cells with oxygenated blood. Alveoli provide exchange of oxygen and carbon dioxide
in the lungs. Fresh air flows into the lung through the airways constituting a three-dimensional branching structure and
diffuses through the thin walls of the capillaries in the blood. The oxygenated blood then enters the heart through the
pulmonary circulation. The coordinated electrical activity of the heart provides a rhythmic contraction of the heart
muscles and the oxygenated blood is pumped through the arteries in the body including also the brain and the
extremities.
Let us follow the excellent analysis that was developed by Suki et al. [6]. The first experimental appearance is that the
structure as well as the functioning of cardio-pulmonary system is complex since it includes many subsystems that are
themselves inhomogeneous and irregular. The reopening of the closed airway segments during inspiration occurs in
avalanches and the distribution of avalanches seems to follow a power law. The pulmonary vascular tree running
parallel to the airway tree is a fractal structure and the resistance to blood flow of the tree shows scaling behavior. The
His-Purkinje conduction system of heart, by which we have propagation voltage pulses, seems to generate complex
patterns with fractal properties [6]. Various physiological time series measured on the cardio-pulmonary system result
to be extremely inhomogeneous and non-stationary, exhibiting fluctuations according to an irregular and complex
behavior. Such noise, often neglected in studies on cardio-pulmonary system, plays instead an important role in the
function and in the structure of heart and lungs [6]. Newborns and premature infants often develop irregular breathing
patterns. Respiratory system regulation develops substantial differences in post natal period respect to later life. The
major underlying source of irregularities may be identified in brain stem rhythm generators or in immature central and
peripheral chemoreceptors [6].
Generally speaking, three basic contributions were identified in order to explain the systematic presence of irreg-
ularities measured on cardio-respiratory signals. The first was the existence of an inherent noise. Noisy operation of
neurons, or heterogeneity of maturation of the vagal nerve were found to play a role in infants. Since myelination
processes mainly determine the spread of propagation of action potentials, noise should appear as due to the heter-
ogeneity of transmission times in a nerve made by a bundle of parallel neurons. The second was the observed presence
of singularities that resulted to produce large variations in inter-breath intervals for small variations of TNI (tonic
neural inputs). If the average value of one or more TNI is sufficiently close to a singularity of the oscillator, then the
irregularities will be distributed according to a power law. The third significant feature is that, with maturation, a shift
in TNI away from the singularity significantly reduces the irregularities appearing in the breathing pattern of infants [6].
Zbilut et al. [7] considered, for the first time, that inspiratory and expiratory phases represent a deterministic process
but that some existing pauses (singularities) should ensure that the appropriate automatic trajectory is selected during
each and every breathing cycle.
We would outline here the particular importance to have suggested such non-deterministic mechanism. In fact, since
these pauses ensure that the appropriate automatic trajectory is selected for each and every breathing cycle, it follows
872 A. Vena et al. / Chaos, Solitons and Fractals 22 (2004) 869–881
that this type of regulation strategy permits cycle-by-cycle updates as well as the failure of this update mechanism
should be implicated in the variety of pathological patterned breathing processes.
In conclusion, these authors introduced a specific mathematical model, fitting the data and exhibiting the admitted
singularities by violation of Lipschitz condition [3,7].
It makes sense now to articulate such research pointing to a more general attempt to identify physiological sin-
gularities in respiratory dynamics. Following the results previously obtained [4], we attempted, this time, to detect
physiological singularities by analyzing respiratory sounds recorded over the trachea.
4. The experimental data
Eighteen healthy subjects (12 male and 6 female) were recruited in this study. All subjects were no-smokers and
without any known cardio-respiratory disease. Their mean age was 37± 12 years and their mean weight was 72± 15 kg.
Respiratory sounds were recorded from the extra-thoracic part of the trachea at level of the anterior cervical tri-
angle, 2 cm to the right of the midline. The subjects were asked to breathe spontaneously in the sitting position,
according to the European Respiratory Society recommendations for short-term recording of breath sounds [8].
In order to minimize any background noise and acquire acoustic signals as much as possible clean, the sound
recording sessions were carried out in a quiet room. Overall, the length of time of the sound recording was of 30 s and
an average number of ten respiratory acts were collected from each subject.
Normal breath sounds were picked up over the trachea by an electronic amplified stethoscope (ES-120, Electromag
Stethoscope, Japan) and its output was connected to a digital recorder (Portable MiniDisc Recorder––MZ-R37, Sony
Corporation, Japan) that acquired the input signals at 44.1 kHz sampling frequency and 16 bit resolution. Simulta-
neously with its recording, it was possible to hear in real-time, the acoustic signal by a headphone connected to the
audio output of the digital recorder. Afterwards, each sound trace was transferred on a personal computer (Intel
Pentium 500 Mhz. Intel Corp., USA) and saved in �:wav file format.
The sound files were then displayed by a Fourier transform based software (CoolEdit pro 1.0, Syntrillium Software
Corp., USA) that provided spectrograms (three-dimensional graphs to show the acoustic energy distribution of the
signal in the time and frequency domain) relating to the stored respiratory acoustic patterns.
This pre-analyzing phase allowed to identify visually (on the spectrogram) and to verify acoustically (on digital-to-
analog playback) the segments from each sound trace that were affected by noise. The signals were checked for artefacts
(usually emanating from defective contact between acoustic sensor and neck or background noise): contaminated
segments were excluded and the best breath exempt from technical disturbances was considered suitable for further
analysis.
The selected breath coming from each subject and including both inspiration and expiration phase, was then read in
numeric format and band-pass filtered at 50–2000 Hz. The high-pass filtering at 50 Hz allowed to reduce the muscle
sounds and the heart sounds, whereas the cut-off frequency of 2000 Hz ensured to study the tracheal sound features
since frequency spectra of normal tracheal sounds decline rapidly above 900–1000 Hz.
Fig. 1 shows the recorded respiratory act for one subject after filtering.
5. Nonlinear analysis of tracheal sounds
Nonlinear analysis of measured data is generally based on the so-called embedding, that is the reconstruction of the
signal in a multidimensional phase space. We calculated autocorrelation function and mutual information function for
each single respiratory act of each subject. Such analysis enabled us to check for the presence of nonlinear contributions
in the examined time series data and to evaluate proper time delay [9]. The results are given in Table 1.
Fig. 2 indicates autocorrelation function (AF) and mutual information (MI) for subject no. 4. As application of the
false nearest neighbors (FNN) method [10], an embedding dimension d ¼ 4 was obtained for all the examined subjects.
A complete chaos analysis was then performed. As previously obtained [11], the correlation dimension resulted from
D2 ¼ limR!0
lnCðR; dÞlnR
where CðR; dÞ ¼XN
i;j¼1;i<j
hðR� jyi � yjjÞ;
hðxÞ ¼ 1 for x > 0; hðxÞ ¼ 0 otherwise;
with yi state vector in the embedding space, CðRÞ correlation sums, R––Euclidean distance. D2 results are reported in
Table 2 while in Fig. 3 we report an example of saturation––D2––curve for the subject no. 4. In Fig. 3 we also illustrate

Fig. 1. Time series data of low-pass filtered tracheal sounds (subject no. 4).
Table 1
Phase space reconstruction of time series data of tracheal sounds
Subject no. AF (s-time delay) MI (s-time delay) FNN embedding dimension
1 66 19 4
2 86 21 4
3 50 33 4
4 71 4 4
5 63 27 4
6 80 37 4
7 84 34 4
8 121 24 4
9 60 34 4
10 61 6 4
11 100 37 4
12 60 25 4
13 49 41 4
14 34 21 4
15 32 17 4
16 36 12 4
17 66 29 4
18 40 27 4
Mean 64.39 24.89
SD 23.62 10.56
(AF): autocorrelation function; (MI): mutual information; (FNN): false nearest neighbors.
A. Vena et al. / Chaos, Solitons and Fractals 22 (2004) 869–881 873
the results of all the tests that we executed in order to establish chaotic behavior of the employed data. In particular
surrogate data were used and we performed Hurst and IFS Clumpiness tests and BDS statistics. As seen in Fig. 3, all the
results deposed to conclude for a deterministic-chaotic behavior of the experimental data. D2-values were included
between 2.920± 0.266 and 4.194± 0.175.
In conclusion, our approach seems to correctly suggest that embedding dimension of 3–4 may be regarded as
suitable for the topologically proper reconstruction of the time series data connected to the recorded respiratory sounds.
Instead, such result must be taken with care since the employed routine should not be used for non-stationary data as in
fact we expect in our case. In fact, all that one needs in these cases is to over-embed the data since embedding the data in
high space will contain all the relevant dynamics [12].
Let us examine now the results that were obtained for Lyapunov spectrum. It is known that, for a time series without
noise, the largest Lyapunov exponent, kmax, gives the exponential rate of divergence of two neighboring trajectories in
phase space. The existence of positive kmax is true for deterministic-chaotic systems.
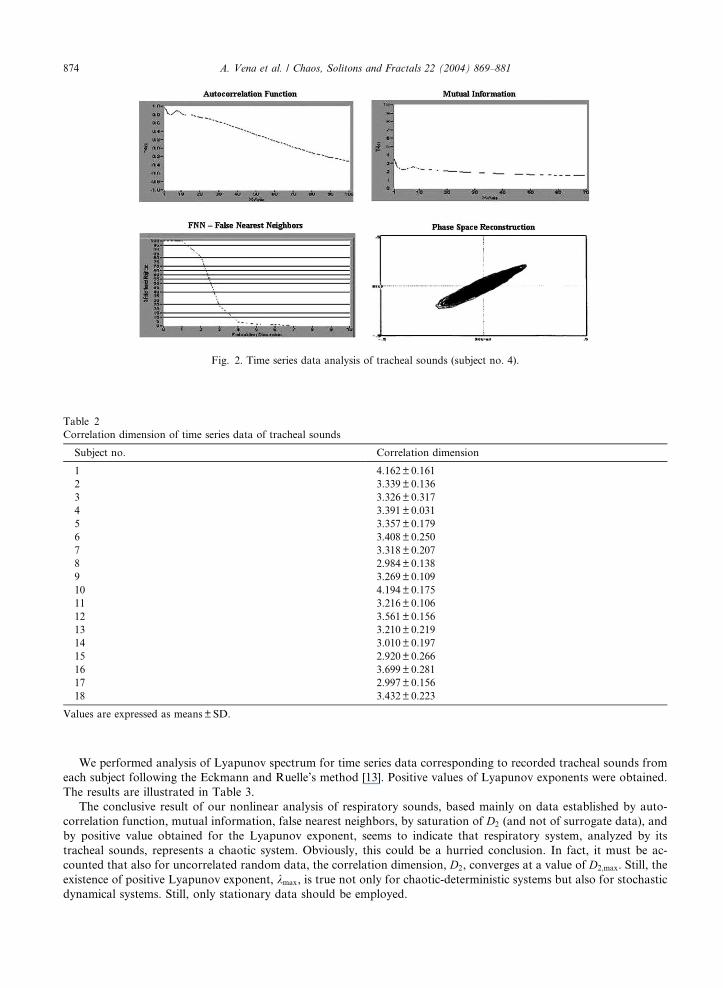
Fig. 2. Time series data analysis of tracheal sounds (subject no. 4).
Table 2
Correlation dimension of time series data of tracheal sounds
Subject no. Correlation dimension
1 4.162± 0.161
2 3.339± 0.136
3 3.326± 0.317
4 3.391± 0.031
5 3.357± 0.179
6 3.408± 0.250
7 3.318± 0.207
8 2.984± 0.138
9 3.269± 0.109
10 4.194± 0.175
11 3.216± 0.106
12 3.561± 0.156
13 3.210± 0.219
14 3.010± 0.197
15 2.920± 0.266
16 3.699± 0.281
17 2.997± 0.156
18 3.432± 0.223
Values are expressed as means±SD.
874 A. Vena et al. / Chaos, Solitons and Fractals 22 (2004) 869–881
We performed analysis of Lyapunov spectrum for time series data corresponding to recorded tracheal sounds from
each subject following the Eckmann and Ruelle’s method [13]. Positive values of Lyapunov exponents were obtained.
The results are illustrated in Table 3.
The conclusive result of our nonlinear analysis of respiratory sounds, based mainly on data established by auto-
correlation function, mutual information, false nearest neighbors, by saturation of D2 (and not of surrogate data), and
by positive value obtained for the Lyapunov exponent, seems to indicate that respiratory system, analyzed by its
tracheal sounds, represents a chaotic system. Obviously, this could be a hurried conclusion. In fact, it must be ac-
counted that also for uncorrelated random data, the correlation dimension, D2, converges at a value of D2;max. Still, the
existence of positive Lyapunov exponent, kmax, is true not only for chaotic-deterministic systems but also for stochastic
dynamical systems. Still, only stationary data should be employed.

Fig. 3. Chaos analysis of time series data of tracheal sounds (subject no. 4).
A. Vena et al. / Chaos, Solitons and Fractals 22 (2004) 869–881 875
Therefore, the conclusion of this analysis is that we cannot confidently end considering the system behavior as
deterministic-chaotic based solely on the convergence of such obtained results. More and detailed results are required in
order to clear actually the true nature of the phenomena under investigation.
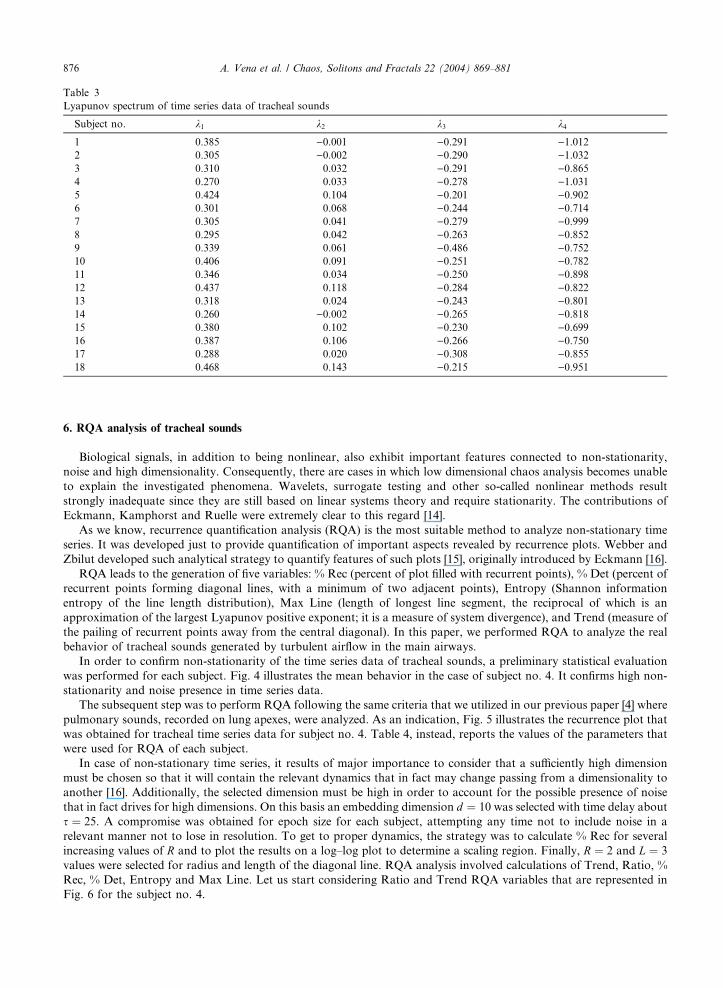
Table 3
Lyapunov spectrum of time series data of tracheal sounds
Subject no. k1 k2 k3 k4
1 0.385 )0.001 )0.291 )1.0122 0.305 )0.002 )0.290 )1.0323 0.310 0.032 )0.291 )0.8654 0.270 0.033 )0.278 )1.0315 0.424 0.104 )0.201 )0.9026 0.301 0.068 )0.244 )0.7147 0.305 0.041 )0.279 )0.9998 0.295 0.042 )0.263 )0.8529 0.339 0.061 )0.486 )0.75210 0.406 0.091 )0.251 )0.78211 0.346 0.034 )0.250 )0.89812 0.437 0.118 )0.284 )0.82213 0.318 0.024 )0.243 )0.80114 0.260 )0.002 )0.265 )0.81815 0.380 0.102 )0.230 )0.69916 0.387 0.106 )0.266 )0.75017 0.288 0.020 )0.308 )0.85518 0.468 0.143 )0.215 )0.951
876 A. Vena et al. / Chaos, Solitons and Fractals 22 (2004) 869–881
6. RQA analysis of tracheal sounds
Biological signals, in addition to being nonlinear, also exhibit important features connected to non-stationarity,
noise and high dimensionality. Consequently, there are cases in which low dimensional chaos analysis becomes unable
to explain the investigated phenomena. Wavelets, surrogate testing and other so-called nonlinear methods result
strongly inadequate since they are still based on linear systems theory and require stationarity. The contributions of
Eckmann, Kamphorst and Ruelle were extremely clear to this regard [14].
As we know, recurrence quantification analysis (RQA) is the most suitable method to analyze non-stationary time
series. It was developed just to provide quantification of important aspects revealed by recurrence plots. Webber and
Zbilut developed such analytical strategy to quantify features of such plots [15], originally introduced by Eckmann [16].
RQA leads to the generation of five variables: % Rec (percent of plot filled with recurrent points), % Det (percent of
recurrent points forming diagonal lines, with a minimum of two adjacent points), Entropy (Shannon information
entropy of the line length distribution), Max Line (length of longest line segment, the reciprocal of which is an
approximation of the largest Lyapunov positive exponent; it is a measure of system divergence), and Trend (measure of
the pailing of recurrent points away from the central diagonal). In this paper, we performed RQA to analyze the real
behavior of tracheal sounds generated by turbulent airflow in the main airways.
In order to confirm non-stationarity of the time series data of tracheal sounds, a preliminary statistical evaluation
was performed for each subject. Fig. 4 illustrates the mean behavior in the case of subject no. 4. It confirms high non-
stationarity and noise presence in time series data.
The subsequent step was to perform RQA following the same criteria that we utilized in our previous paper [4] where
pulmonary sounds, recorded on lung apexes, were analyzed. As an indication, Fig. 5 illustrates the recurrence plot that
was obtained for tracheal time series data for subject no. 4. Table 4, instead, reports the values of the parameters that
were used for RQA of each subject.
In case of non-stationary time series, it results of major importance to consider that a sufficiently high dimension
must be chosen so that it will contain the relevant dynamics that in fact may change passing from a dimensionality to
another [16]. Additionally, the selected dimension must be high in order to account for the possible presence of noise
that in fact drives for high dimensions. On this basis an embedding dimension d ¼ 10 was selected with time delay about
s ¼ 25. A compromise was obtained for epoch size for each subject, attempting any time not to include noise in a
relevant manner not to lose in resolution. To get to proper dynamics, the strategy was to calculate % Rec for several
increasing values of R and to plot the results on a log–log plot to determine a scaling region. Finally, R ¼ 2 and L ¼ 3
values were selected for radius and length of the diagonal line. RQA analysis involved calculations of Trend, Ratio, %
Rec, % Det, Entropy and Max Line. Let us start considering Ratio and Trend RQA variables that are represented in
Fig. 6 for the subject no. 4.
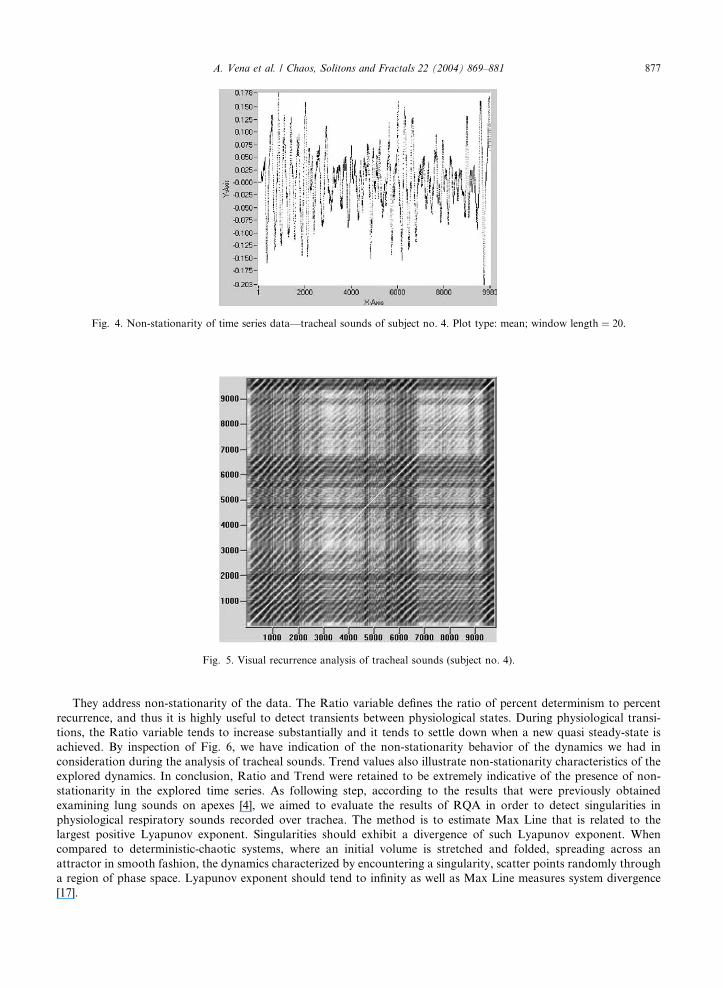
Fig. 4. Non-stationarity of time series data––tracheal sounds of subject no. 4. Plot type: mean; window length ¼ 20.
Fig. 5. Visual recurrence analysis of tracheal sounds (subject no. 4).
A. Vena et al. / Chaos, Solitons and Fractals 22 (2004) 869–881 877
They address non-stationarity of the data. The Ratio variable defines the ratio of percent determinism to percent
recurrence, and thus it is highly useful to detect transients between physiological states. During physiological transi-
tions, the Ratio variable tends to increase substantially and it tends to settle down when a new quasi steady-state is
achieved. By inspection of Fig. 6, we have indication of the non-stationarity behavior of the dynamics we had in
consideration during the analysis of tracheal sounds. Trend values also illustrate non-stationarity characteristics of the
explored dynamics. In conclusion, Ratio and Trend were retained to be extremely indicative of the presence of non-
stationarity in the explored time series. As following step, according to the results that were previously obtained
examining lung sounds on apexes [4], we aimed to evaluate the results of RQA in order to detect singularities in
physiological respiratory sounds recorded over trachea. The method is to estimate Max Line that is related to the
largest positive Lyapunov exponent. Singularities should exhibit a divergence of such Lyapunov exponent. When
compared to deterministic-chaotic systems, where an initial volume is stretched and folded, spreading across an
attractor in smooth fashion, the dynamics characterized by encountering a singularity, scatter points randomly through
a region of phase space. Lyapunov exponent should tend to infinity as well as Max Line measures system divergence
[17].
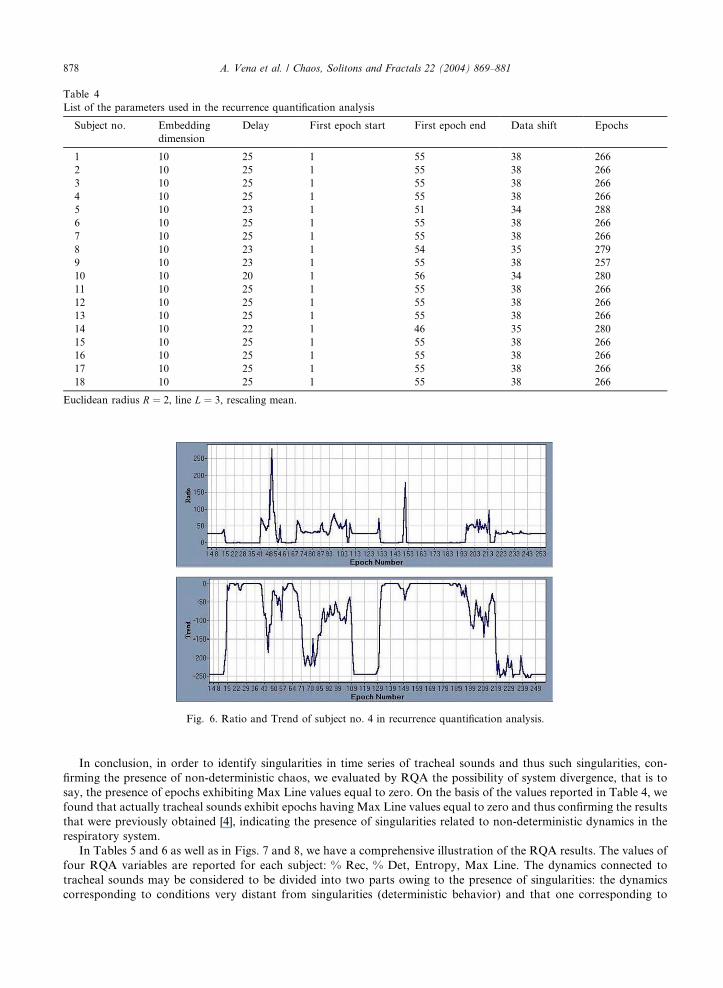
Table 4
List of the parameters used in the recurrence quantification analysis
Subject no. Embedding
dimension
Delay First epoch start First epoch end Data shift Epochs
1 10 25 1 55 38 266
2 10 25 1 55 38 266
3 10 25 1 55 38 266
4 10 25 1 55 38 266
5 10 23 1 51 34 288
6 10 25 1 55 38 266
7 10 25 1 55 38 266
8 10 23 1 54 35 279
9 10 23 1 55 38 257
10 10 20 1 56 34 280
11 10 25 1 55 38 266
12 10 25 1 55 38 266
13 10 25 1 55 38 266
14 10 22 1 46 35 280
15 10 25 1 55 38 266
16 10 25 1 55 38 266
17 10 25 1 55 38 266
18 10 25 1 55 38 266
Euclidean radius R ¼ 2, line L ¼ 3, rescaling mean.
Fig. 6. Ratio and Trend of subject no. 4 in recurrence quantification analysis.
878 A. Vena et al. / Chaos, Solitons and Fractals 22 (2004) 869–881
In conclusion, in order to identify singularities in time series of tracheal sounds and thus such singularities, con-
firming the presence of non-deterministic chaos, we evaluated by RQA the possibility of system divergence, that is to
say, the presence of epochs exhibiting Max Line values equal to zero. On the basis of the values reported in Table 4, we
found that actually tracheal sounds exhibit epochs having Max Line values equal to zero and thus confirming the results
that were previously obtained [4], indicating the presence of singularities related to non-deterministic dynamics in the
respiratory system.
In Tables 5 and 6 as well as in Figs. 7 and 8, we have a comprehensive illustration of the RQA results. The values of
four RQA variables are reported for each subject: % Rec, % Det, Entropy, Max Line. The dynamics connected to
tracheal sounds may be considered to be divided into two parts owing to the presence of singularities: the dynamics
corresponding to conditions very distant from singularities (deterministic behavior) and that one corresponding to
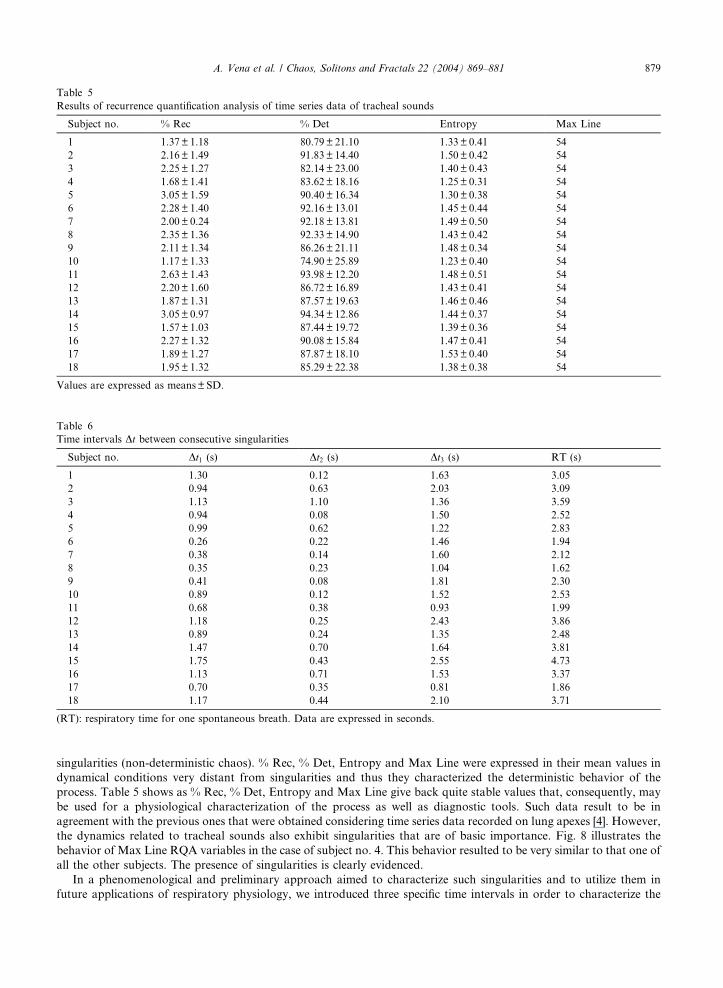
Table 5
Results of recurrence quantification analysis of time series data of tracheal sounds
Subject no. % Rec % Det Entropy Max Line
1 1.37± 1.18 80.79± 21.10 1.33± 0.41 54
2 2.16± 1.49 91.83± 14.40 1.50± 0.42 54
3 2.25± 1.27 82.14± 23.00 1.40± 0.43 54
4 1.68± 1.41 83.62± 18.16 1.25± 0.31 54
5 3.05± 1.59 90.40± 16.34 1.30± 0.38 54
6 2.28± 1.40 92.16± 13.01 1.45± 0.44 54
7 2.00± 0.24 92.18± 13.81 1.49± 0.50 54
8 2.35± 1.36 92.33± 14.90 1.43± 0.42 54
9 2.11± 1.34 86.26± 21.11 1.48± 0.34 54
10 1.17± 1.33 74.90± 25.89 1.23± 0.40 54
11 2.63± 1.43 93.98± 12.20 1.48± 0.51 54
12 2.20± 1.60 86.72± 16.89 1.43± 0.41 54
13 1.87± 1.31 87.57± 19.63 1.46± 0.46 54
14 3.05± 0.97 94.34± 12.86 1.44± 0.37 54
15 1.57± 1.03 87.44± 19.72 1.39± 0.36 54
16 2.27± 1.32 90.08± 15.84 1.47± 0.41 54
17 1.89± 1.27 87.87± 18.10 1.53± 0.40 54
18 1.95± 1.32 85.29± 22.38 1.38± 0.38 54
Values are expressed as means±SD.
Table 6
Time intervals Dt between consecutive singularities
Subject no. Dt1 (s) Dt2 (s) Dt3 (s) RT (s)
1 1.30 0.12 1.63 3.05
2 0.94 0.63 2.03 3.09
3 1.13 1.10 1.36 3.59
4 0.94 0.08 1.50 2.52
5 0.99 0.62 1.22 2.83
6 0.26 0.22 1.46 1.94
7 0.38 0.14 1.60 2.12
8 0.35 0.23 1.04 1.62
9 0.41 0.08 1.81 2.30
10 0.89 0.12 1.52 2.53
11 0.68 0.38 0.93 1.99
12 1.18 0.25 2.43 3.86
13 0.89 0.24 1.35 2.48
14 1.47 0.70 1.64 3.81
15 1.75 0.43 2.55 4.73
16 1.13 0.71 1.53 3.37
17 0.70 0.35 0.81 1.86
18 1.17 0.44 2.10 3.71
(RT): respiratory time for one spontaneous breath. Data are expressed in seconds.
A. Vena et al. / Chaos, Solitons and Fractals 22 (2004) 869–881 879
singularities (non-deterministic chaos). % Rec, % Det, Entropy and Max Line were expressed in their mean values in
dynamical conditions very distant from singularities and thus they characterized the deterministic behavior of the
process. Table 5 shows as % Rec, % Det, Entropy and Max Line give back quite stable values that, consequently, may
be used for a physiological characterization of the process as well as diagnostic tools. Such data result to be in
agreement with the previous ones that were obtained considering time series data recorded on lung apexes [4]. However,
the dynamics related to tracheal sounds also exhibit singularities that are of basic importance. Fig. 8 illustrates the
behavior of Max Line RQA variables in the case of subject no. 4. This behavior resulted to be very similar to that one of
all the other subjects. The presence of singularities is clearly evidenced.
In a phenomenological and preliminary approach aimed to characterize such singularities and to utilize them in
future applications of respiratory physiology, we introduced three specific time intervals in order to characterize the

Fig. 7. Recurrence quantification analysis (% Rec, % Det and Entropy) of time series data of subject no. 4.
Fig. 8. Detection of singularities in time series data of subject no. 4.
880 A. Vena et al. / Chaos, Solitons and Fractals 22 (2004) 869–881
singularities in each respiratory act: Dt1, Dt2 and Dt3. Dt1 represents the sum of all time intervals characterizing sin-
gularities before Dt2; Dt2 essentially represents the time extended absence of singularities; Dt3 is defined as Dt1. The Dt1,Dt2 and Dt3 values were calculated for each subject and are reported in Table 6.
Although only preliminary, such indexes could provide a physiological characterization of the singularities in the
dynamics connected to tracheal sounds. In future works, it will be tested their possible utilization as diagnostic tools.
References
[1] Babloyantz A, Nicolis C, Salazar M. Evidence of chaotic dynamics during the sleep cycle. Phys Lett 1985;A111:152–6;
Babloyantz A, Destexhe A. Low dimensional chaos in an instance of epilepsy. Proc Nat Acad Sci USA 1986;83:3513–7.
A. Vena et al. / Chaos, Solitons and Fractals 22 (2004) 869–881 881
[2] Babloyantz A, Destexhe A. Is the normal heart a periodic oscillator? Biol Cybernet 1988;58:203–11;
Zbilut JP, Mayer-Kress G, Sobotka PA, O’Toole M, Thomas JX. Bifurcation and intrinsic chaotic and 1=f dynamics in an
isolated perfused rat heart. Biol Cybernet 1989;61:371–8.
[3] Zbilut JP, Zak M, Webber Jr CL. Nondeterministic chaos approach to neural intelligence. In: Intelligent engineering systems
through artificial neural networks, vol. 4. NY: ASME Press; 1994. p. 819–24;
Zbilut JP, Hubler A, Webber Jr CL. Physiological singularities modeled by nondeterministic equations of motion and the effect of
noise. In: Millonas M, editor. Fluctuations and Order: The New Synthesis. NY: Springer Verlag; 1996. p. 397–417;
Zak M, Zbilut JP, Meyers RE. From instability to intelligence: complexity and predictability in nonlinear dynamics. In: Lecture
notes in physics. Springer Verlag; 1997;
Zbilut JP, Mayer-Kress G, Geist K. Dimensional analysis of heart rate variability in heart transplant recipients. Math Biosci, 90.
p. 49–70;
Zbilut JP, Zak M, Meyers Ronald E. A terminal dynamics model of the heartbeat. Biol Cybernet 1996;75:277–80;
Zak M. Non-Lipschitzian dynamics for neural net modeling. Appl Math Lett 1989;2(1):69–74;
Zak M. The problem of irreversibility in newtonian dynamics. Int J Theoret Phys 1992;31(2):333–42;
Zak M. Postinstability models in dynamics. Int J Theoret Phys 1994;33(11):2215–80;
Zack M. Dynamical simulation of probabilities. Chaos, Solitons & Fractals 1997;5:793–804.
[4] Conte E, Vena A, Federici A, Giuliani R, Zbilut JP. A brief note on possible detection of physiological singularities in respiratory
dynamics by recurrence quantification analysis of lung sounds. Chaos, Solitons & Fractals 2004;21:869–77.
[5] Hubinger B, Doerner R, Martienssen W, Herdering W, Pitka R, Dressier U. Controlling chaos experimentally in systems
exhibiting large effective Lyapunov exponents. Phys Rev E 1994;50:932–48;
Christini DJ, Collins JJ. Control of chaos in excitable physiological systems: a geometric approach. Chaos 1997;7:544–9.
[6] Suki B, Alencar AM, Frey U, Ivanov PC, Buldyrev SV, Mayumdar A, et al. Fluctuations, noise and scaling in the cardio-
pulmonary system. Fluctuations Noise Lett 2003;3(1):1–25, World Scientific Publishing Company.
[7] Zbilut JP, Zak M, Webber Jr CL. Physiological singularities in respiratory and cardiac dynamics. Chaos, Solitons & Fractals
1995;5:1509–16.
[8] Rossi M, Sovijarvi ARA, Piirila P, Vannuccini L, Dalmasso F, Vanderschoot J. Environmental and subject conditions and
breathing manoeuvres for respiratory sound recordings. Eur Respir Rev 2000;10(77):611–5.
[9] Freser AH, Swinney HL. Independent coordinates for strange attractors from mutual information. Phys Rev A 1986;33:1134–40.
[10] Kennel MB, Abarbanel HDI. Determining embedding dimension for phase-space reconstruction using a geometrical construction.
Phys Rev A 1992;45:3403–12.
[11] Grassberger P, Procaccia I. Measuring the strangness of strange attractors. Physica D 1983;9:189–208.
[12] Zbilut JP, Thomasson N, Webber CL. Recurrence quantification analysis as a tool for nonlinear exploration of nonstationary
cardiac signals. Medical Eng Phys 2002;24:53–60;
Schreiber T. Interdisciplinary application of non-linear time series methods. Phys Rep 1999;308:1–64.
[13] Wolf A, Swift JB, Swinney HL. Determining Lyapunov exponents from a time series. Physica D 1985;16:285–317.
[14] Eckmann JP, Ruelle D. Fundamental limitations for estimating dimensions and Lyapunov exponents in dynamical systems.
Physica D 1992;56:185–7.
[15] Webber CL, Zbilut JP. Dynamical assessment of physiological systems and states using recurrence plot strategies. J Appl Physiol
1994;76(2):965–73.
[16] Eckmann JP, Kamphorst SO, Ruelle D. Recurrence plots of dynamical systems. Europhys Lett 1987;4:973–7.
[17] Zbilut JP, Zaldivar-Comenges JM, Strozzi F. Recurrence quantification based-Lyapunov exponents for monitoring divergence in
experimental data. Phys Lett A 2002;297:173–81;
Zbilut JP, Dixon DD, Zak M. Detecting singularities of piecewise deterministic (terminal) dynamics in experimental data. Phys
Lett A 2002;304:95–101.
Related Documents