Eng Int Syst (2009) 1: 49–63 © 2009 CRL Publishing Ltd Engineering Intelligent Systems Detection of microcalcifications in digital mammograms using the dual-tree complex wavelet transform V. Alarcon-Aquino 1 , O. Starostenko 1 , J. M. Ramirez-Cortes 2 , R. Rosas-Romero 1 , J. Rodriguez-Asomoza 1 , O. J. Paz-Luna 1 and K. Vazquez-Muñoz 1 1 Communications and Signal Processing Research Group, Department of Computing, Electronics, and Mechatronics, Universidad de las Americas Puebla, Sta. Catarina Martir, Cholula, Puebla. 72820 Mexico. E-mail: [email protected] 2 Department of Electronics Engineering, National Institute for Astrophysics, Optics, and Electronics, Tonantzintla, Puebla, Mexico In this paper we propose an approach to detect microcalcifications in digital mammograms using the dual-tree complex wavelet trans- form (DT-CWT).The approach follows four basic strategies, namely, image denoising, band suppression, morphological transformation and inverse complex wavelet transform. Recently, the DT-CWT has shown a good performance in applications that involve image processing due to more data phase information, shift invariance, and directionality than other wavelet transforms. The procedure of image denoising is carried out with a thresholding algorithm that computes recursively the optimal threshold at each level of wavelet decomposition. In order to maximise the detection a morphological conversion is then proposed and applied to the high frequencies subbands of the wavelet transformation. This procedure is applied to a set of digital mammograms from the mammography image analysis society (MIAS) database. Experimental results show that the proposed denoising algorithm and morphological transformation in combination with the DT-CWT procedure performs better than the stationary and discrete wavelet transforms and the top-hat filtering. The approach reported in this paper seems to be meaningful to aid in the results on mammogram interpretation and to get an earlier and opportune diagnostic for breast cancer. Keywords: Microcalcifications, dual-tree complex wavelet transforms, Mammography, breast cancer, MIAS database, wavelets. 1. INTRODUCTION A mammography exam, called a mammogram, is used to aid in the diagnosis of breast diseases in women. A mammogram is a specialised X-ray exam in which a set of plates is taken from breast tissue to detect suspect tissue and microcalcifica- tions (MCs). The main reason to perform a mammogram is the detection of clinically hidden breast cancer at early time. The early detection of breast cancer with a mammogram is difficult due to the fact that small tumours and MCs are very similar to normal glandular tissue. Recently, tools for computer- aided diagnosis have been developed especially in the image- processing field that permits an easy visualisation of mam- mograms. In this regard, the wavelet transform (WT) has an important merit, since it has been employed to eliminate noise in mammogram image. The results have shown an improve- ment of the image, making easy the visualisation of suspicious lesions [1]. The WT analysis provides good time resolution and poor frequency resolution at high frequencies, and good frequency resolution and poor time resolution at low frequen- cies. Wavelets are a powerful tool to image compression with low information losses and have been applied in biomedical signals because they provide an analysis of non-stationary sig- nals that contains a high amount of complex frequencies [1]. vol 17 no 1 March 2009 49

Welcome message from author
This document is posted to help you gain knowledge. Please leave a comment to let me know what you think about it! Share it to your friends and learn new things together.
Transcript
Eng Int Syst (2009) 1: 49–63© 2009 CRL Publishing Ltd Engineering
Intelligent Systems
Detection of microcalcifications indigital mammograms using thedual-tree complex wavelettransform
V. Alarcon-Aquino1, O. Starostenko1, J. M. Ramirez-Cortes2, R. Rosas-Romero1,J. Rodriguez-Asomoza1, O. J. Paz-Luna1 and K. Vazquez-Muñoz1
1Communications and Signal Processing Research Group, Department of Computing, Electronics, and Mechatronics, Universidad delas Americas Puebla, Sta. Catarina Martir, Cholula, Puebla. 72820 Mexico. E-mail: [email protected] of Electronics Engineering, National Institute for Astrophysics, Optics, and Electronics, Tonantzintla, Puebla, Mexico
In this paper we propose an approach to detect microcalcifications in digital mammograms using the dual-tree complex wavelet trans-form (DT-CWT).The approach follows four basic strategies, namely, image denoising, band suppression, morphological transformationand inverse complex wavelet transform. Recently, the DT-CWT has shown a good performance in applications that involve imageprocessing due to more data phase information, shift invariance, and directionality than other wavelet transforms. The procedure ofimage denoising is carried out with a thresholding algorithm that computes recursively the optimal threshold at each level of waveletdecomposition. In order to maximise the detection a morphological conversion is then proposed and applied to the high frequenciessubbands of the wavelet transformation. This procedure is applied to a set of digital mammograms from the mammography imageanalysis society (MIAS) database. Experimental results show that the proposed denoising algorithm and morphological transformationin combination with the DT-CWT procedure performs better than the stationary and discrete wavelet transforms and the top-hatfiltering. The approach reported in this paper seems to be meaningful to aid in the results on mammogram interpretation and to getan earlier and opportune diagnostic for breast cancer.
Keywords: Microcalcifications, dual-tree complex wavelet transforms, Mammography, breast cancer, MIAS database, wavelets.
1. INTRODUCTION
A mammography exam, called a mammogram, is used to aidin the diagnosis of breast diseases in women. A mammogramis a specialised X-ray exam in which a set of plates is takenfrom breast tissue to detect suspect tissue and microcalcifica-tions (MCs). The main reason to perform a mammogram is thedetection of clinically hidden breast cancer at early time. Theearly detection of breast cancer with a mammogram is difficultdue to the fact that small tumours and MCs are very similarto normal glandular tissue. Recently, tools for computer-aided diagnosis have been developed especially in the image-
processing field that permits an easy visualisation of mam-mograms. In this regard, the wavelet transform (WT) has animportant merit, since it has been employed to eliminate noisein mammogram image. The results have shown an improve-ment of the image, making easy the visualisation of suspiciouslesions [1]. The WT analysis provides good time resolutionand poor frequency resolution at high frequencies, and goodfrequency resolution and poor time resolution at low frequen-cies. Wavelets are a powerful tool to image compression withlow information losses and have been applied in biomedicalsignals because they provide an analysis of non-stationary sig-nals that contains a high amount of complex frequencies [1].
vol 17 no 1 March 2009 49
DETECTION OF MICROCALCIFICATIONS IN DIGITAL MAMMOGRAMS USING THE DUAL-TREE COMPLEX WAVELET TRANSFORM
Lately, several approaches have been proposed to detectMCs in digital mammograms. A system based on fuzzy logichas been reported in [2], a mathematical morphologist studyis reported in [3], and several methods based on wavelet trans-forms are reported in [4–8, 12, 14, 18, 21]. For example in [4]Strickland and Hahn introduced a two stages method for detec-tion and segmentation of MCs. The first stage is based on theuse of undecimated wavelet transform and the segmentationprocess is realised with matched filters. A similar approachis also reported in [18]. In [5], Wang and Karayiannis re-ported an approach to detect MCs using the decimated wavelettransform so that suppression in the low-band frequencies isperformed. The visualisation of MCs is improved using a non-linear threshold based on the arc-tan method. In [6], Mellouland Joscowicz proposed MCs detection in two steps. The firstconsists in total elimination of background mammogram withmulti-scale morphological filtering then an optimal threshold(entropy threshold) is applied to segmentation step. In [14]an algorithm for early breast cancer diagnosis that employs acombination of neural networks and wavelet-based subbandimage decomposition that detects microcalcifications in digi-tal mammograms is proposed. This algorithm uses a wavelettransform that performs the wavelet decomposition througha down-sampling process, which produces shifting. In gen-eral, the aforementioned approaches have disadvantages thatlimit the performance of these methods in image processingapplications. These disadvantages are shift sensibility derivedfrom the down-sampling process of the discrete wavelet trans-form, low directionality of the horizontal, vertical and diag-onal orientations of the image, and information inexistenceabout phase.
In this paper we report an approach to detect microcal-cifications in digital mammograms using the dual-tree com-plex wavelet transform (DT-CWT). The DT-CWT has showna good performance in applications that involve image pro-cessing due to more data phase information, shift invariance,and directionality than other wavelet transforms. The ap-proach consists of four stages, namely, image denoising byoptimal thresholding, band suppression of low frequencies,morphological transformation, and inverse complex wavelettransform. The remainder of this paper is organised as fol-lows. In Section 2, a description of MCs and MIAS databaseis presented. Section 3 presents an overview of wavelet the-ory including the DT-CWT. The proposed approach to detectmicrocalcifications is reported in Section 4. Experimental re-sults are reported in Section 5. Conclusions and future workare discussed in Section 6.
2. DESCRIPTION OF MCS INMAMMOGRAMS
Initially, the breast tissue study was performed in the radiologyfield by analogical images including all kind of image modal-ities such as magnetic resonance image and nuclear medicine.The basic idea for using different image methods was to detectand to diagnose at early stage the breast cancer tissue whenthe probability of cure was greater and the treatment was lessaggressive. It helped by some means to decide the best ther-apy for each lesion. Currently, mammogram screening is the
only way for detection at a short period of time. The objec-tive of a mammogram is to produce detailed images of theinternal structures in breast tissue to make earlier cancer de-tection. Due to the need of details, high quality spatial imagesare required because the X-ray attenuation between normaland abnormal tissue is very small. Conventional mammo-gram uses film-screen detectors to record the photons that gothrough breast tissue, and it produces an analogical image.Due to the large amount of data that need to be stored, a pieceof film is an excellent storage medium. Unfortunately, it isnot possible to perform modifications in the image to improvethe visualisation of present elements. In order to overcomethe intrinsic limitations of conventional mammograms the useof digital mammograms is desirable. One of the fundamen-tals benefits of a digital mammogram is the facility to modifythe image information. There are several kinds of lesions inbreast tissue that can be detected in a mammogram, viz [9].
1. Primary signs:
• Dominant mass: This lesion is frequently found byanalysing mammogram information. The lesionfall into one of four categories: benign, probablybenign, probably malignant, and malignant.
• Dashed lesions (architecture alteration): Distortedareas of breast architecture with irregular edges thatadopt a radiated morphology indicate an earlier signof cancer but it is difficult to diagnostic.
• Microcalcifications: Frequently discovered and theanalysis of its characteristics permits to differen-tiate a benign lesion from suspicious and clearlymalignant lesions.
2. Secondary signs:
• Skin enlarger: Caused by lymphatic congestion andedema.
• Vascularisation increase: Due to cellular needs bycell proliferation.
• Lymphatic affectation: Due to permeabilitychanges in lymphatic vases.
• Ductal dilation: Because liquid excess is present atthe breast tissue.
2.1 Microcalcifications
Breast calcifications are commonly discovered in the radio-logical study on asymptomatic women. These are depositsof calcium at the thickness of mammary tissue and are repre-sented as little white dots, and normally show the first sign ofcancerous process. The main characteristics to determine thelevel of MCs abnormality are [9]
i. Size: Larger than 2mm are classified as macrocalcifi-cations and are usually benign. Microcalcifications areunder 2mm length and are suspicious of malignant whenthey are small and grouped.
ii. Morphology: Malignant calcifications usually are het-erogeneous in form and size, namely, pointed, angu-lar, and irregular, in “comma”, graft and with form of
50 Engineering Intelligent Systems
V. ALARCON-AQUINO ET AL
point and ray. The benign ones usually are homogenous,round, and sometimes annular and with clear centre.
iii. Quantity: A suspect of malignity is considered whenthere are five or more calcifications less to 1mm into anarea of 1cm2.
iv. Distribution: Segmental distribution of calcifications,not random distribution, is indicative of biopsy.
v. Calcification time variance: Stable calcifications into aperiod of 1.5-2 years are benign whereas malignant cal-cifications vary in time.
vi. Calcifications associated with breast tissue: These arethe first sign of breast cancer in young women.
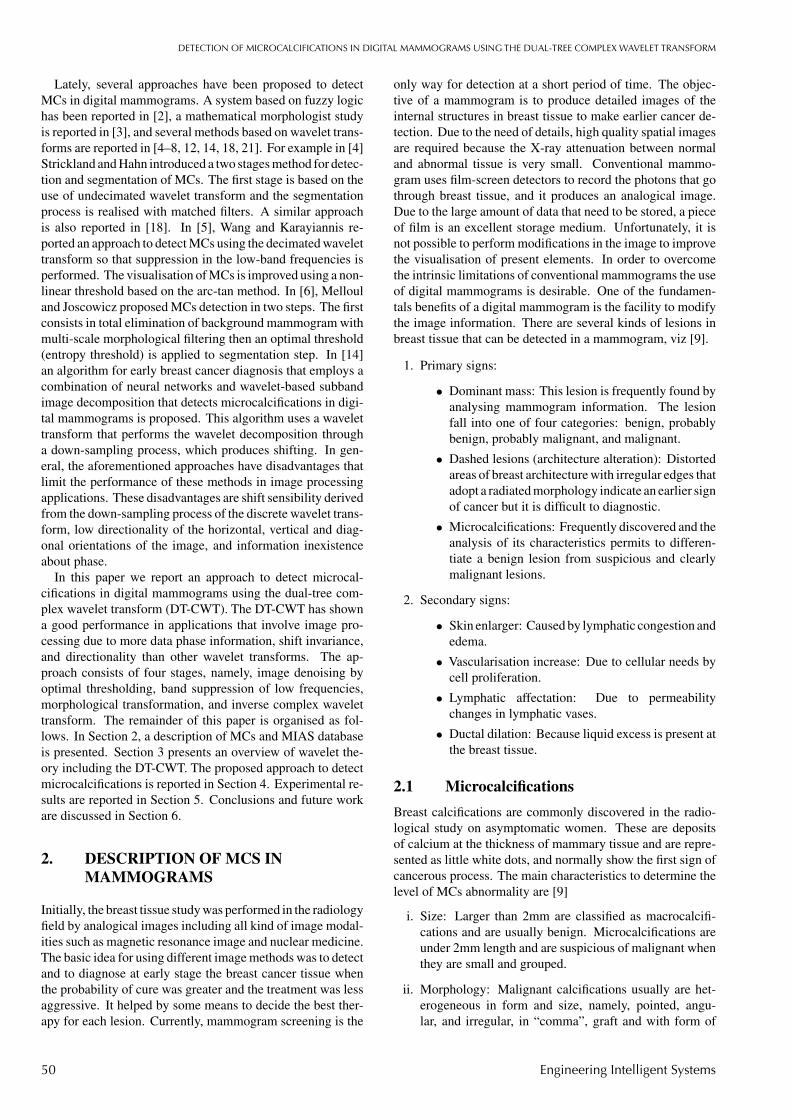
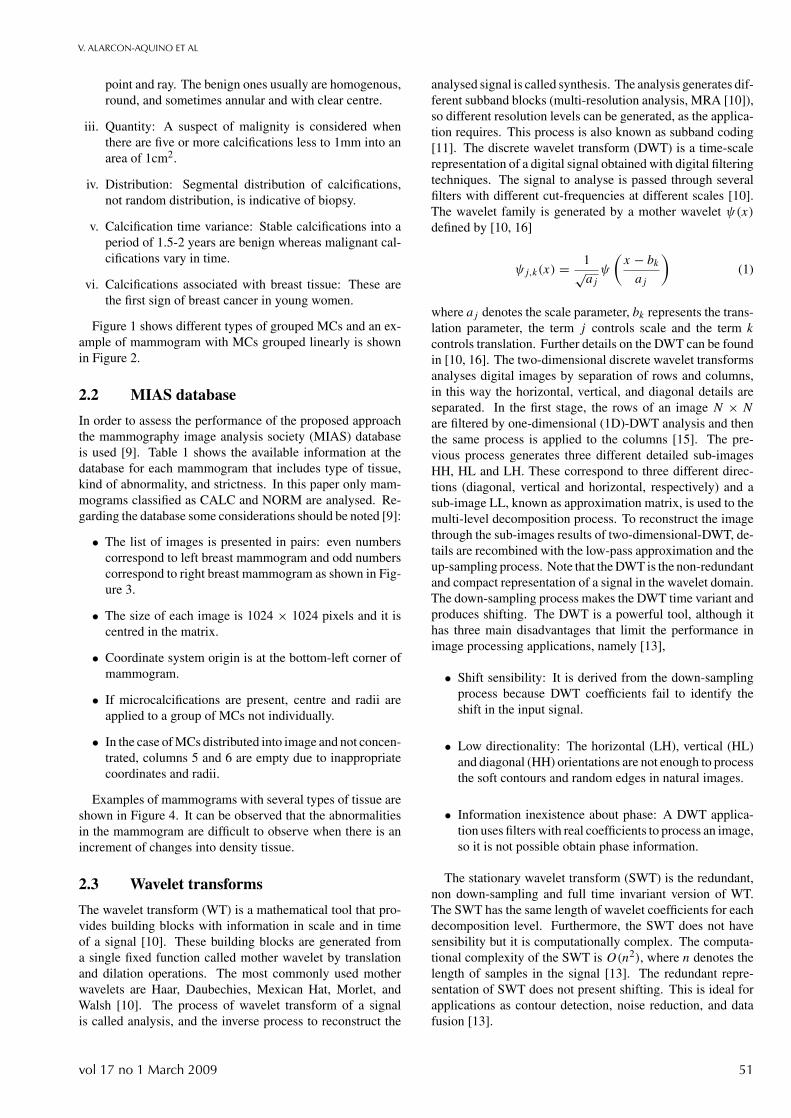
Figure 1 shows different types of grouped MCs and an ex-ample of mammogram with MCs grouped linearly is shownin Figure 2.
2.2 MIAS database
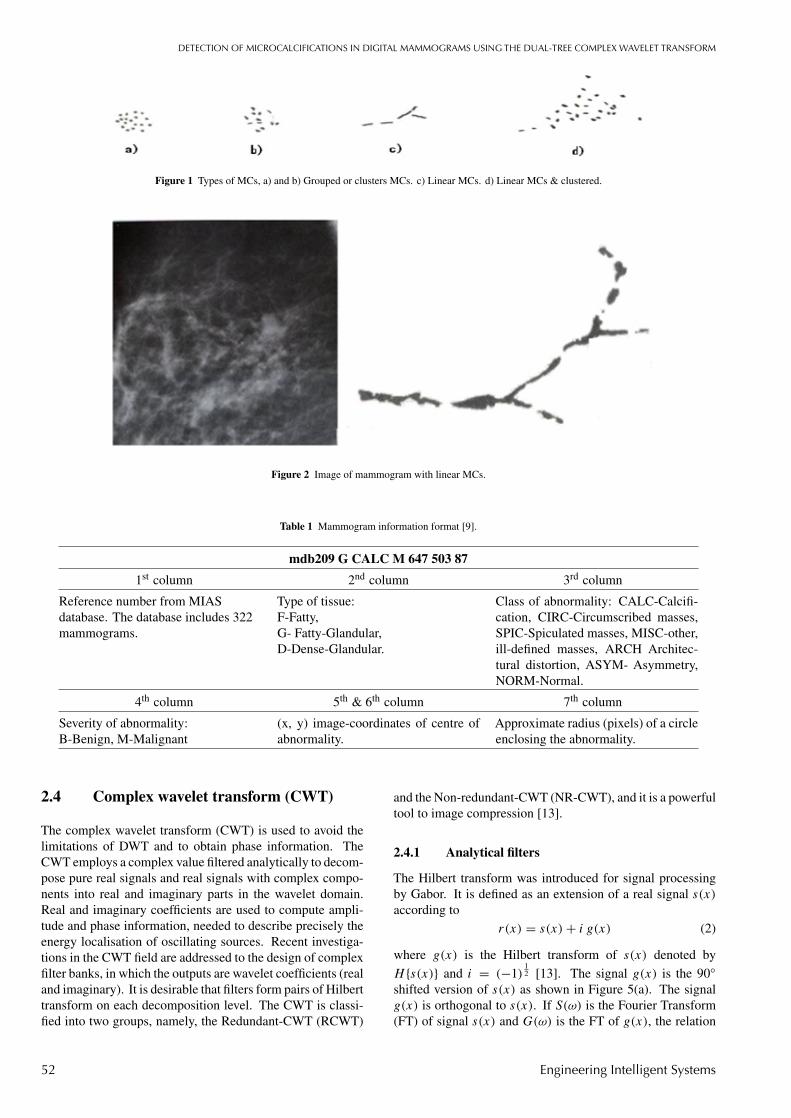
In order to assess the performance of the proposed approachthe mammography image analysis society (MIAS) databaseis used [9]. Table 1 shows the available information at thedatabase for each mammogram that includes type of tissue,kind of abnormality, and strictness. In this paper only mam-mograms classified as CALC and NORM are analysed. Re-garding the database some considerations should be noted [9]:
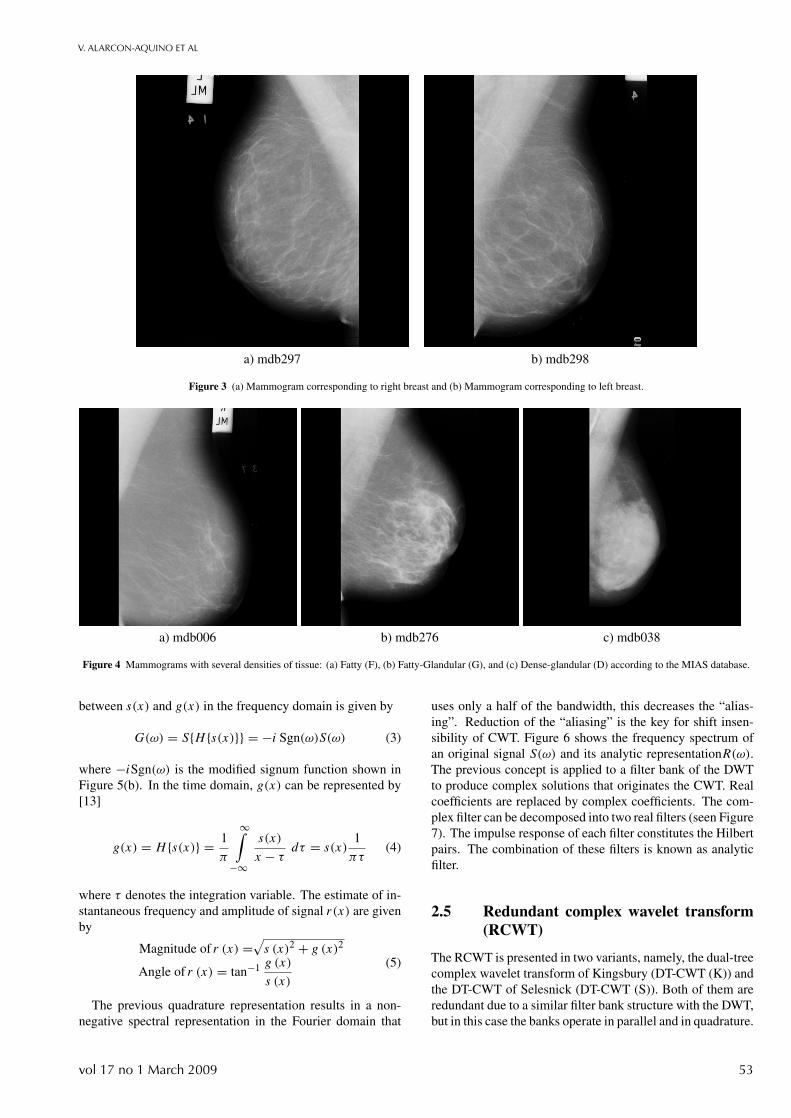
• The list of images is presented in pairs: even numberscorrespond to left breast mammogram and odd numberscorrespond to right breast mammogram as shown in Fig-ure 3.
• The size of each image is 1024 × 1024 pixels and it iscentred in the matrix.
• Coordinate system origin is at the bottom-left corner ofmammogram.
• If microcalcifications are present, centre and radii areapplied to a group of MCs not individually.
• In the case of MCs distributed into image and not concen-trated, columns 5 and 6 are empty due to inappropriatecoordinates and radii.
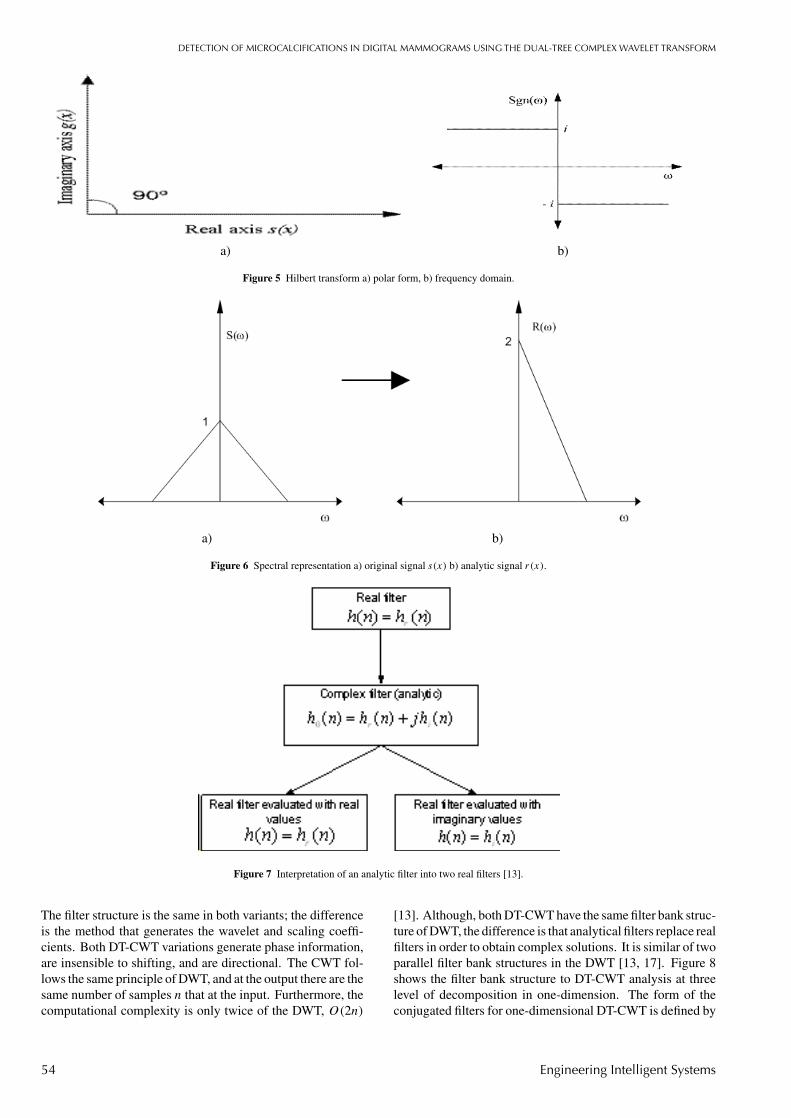
Examples of mammograms with several types of tissue areshown in Figure 4. It can be observed that the abnormalitiesin the mammogram are difficult to observe when there is anincrement of changes into density tissue.
2.3 Wavelet transforms
The wavelet transform (WT) is a mathematical tool that pro-vides building blocks with information in scale and in timeof a signal [10]. These building blocks are generated froma single fixed function called mother wavelet by translationand dilation operations. The most commonly used motherwavelets are Haar, Daubechies, Mexican Hat, Morlet, andWalsh [10]. The process of wavelet transform of a signalis called analysis, and the inverse process to reconstruct the
analysed signal is called synthesis. The analysis generates dif-ferent subband blocks (multi-resolution analysis, MRA [10]),so different resolution levels can be generated, as the applica-tion requires. This process is also known as subband coding[11]. The discrete wavelet transform (DWT) is a time-scalerepresentation of a digital signal obtained with digital filteringtechniques. The signal to analyse is passed through severalfilters with different cut-frequencies at different scales [10].The wavelet family is generated by a mother wavelet ψ(x)defined by [10, 16]
ψj,k(x) = 1√ajψ
(x − bk
aj
)(1)
where aj denotes the scale parameter, bk represents the trans-lation parameter, the term j controls scale and the term k
controls translation. Further details on the DWT can be foundin [10, 16]. The two-dimensional discrete wavelet transformsanalyses digital images by separation of rows and columns,in this way the horizontal, vertical, and diagonal details areseparated. In the first stage, the rows of an image N × N
are filtered by one-dimensional (1D)-DWT analysis and thenthe same process is applied to the columns [15]. The pre-vious process generates three different detailed sub-imagesHH, HL and LH. These correspond to three different direc-tions (diagonal, vertical and horizontal, respectively) and asub-image LL, known as approximation matrix, is used to themulti-level decomposition process. To reconstruct the imagethrough the sub-images results of two-dimensional-DWT, de-tails are recombined with the low-pass approximation and theup-sampling process. Note that the DWT is the non-redundantand compact representation of a signal in the wavelet domain.The down-sampling process makes the DWT time variant andproduces shifting. The DWT is a powerful tool, although ithas three main disadvantages that limit the performance inimage processing applications, namely [13],
• Shift sensibility: It is derived from the down-samplingprocess because DWT coefficients fail to identify theshift in the input signal.
• Low directionality: The horizontal (LH), vertical (HL)and diagonal (HH) orientations are not enough to processthe soft contours and random edges in natural images.
• Information inexistence about phase: A DWT applica-tion uses filters with real coefficients to process an image,so it is not possible obtain phase information.
The stationary wavelet transform (SWT) is the redundant,non down-sampling and full time invariant version of WT.The SWT has the same length of wavelet coefficients for eachdecomposition level. Furthermore, the SWT does not havesensibility but it is computationally complex. The computa-tional complexity of the SWT is O(n2), where n denotes thelength of samples in the signal [13]. The redundant repre-sentation of SWT does not present shifting. This is ideal forapplications as contour detection, noise reduction, and datafusion [13].
vol 17 no 1 March 2009 51
DETECTION OF MICROCALCIFICATIONS IN DIGITAL MAMMOGRAMS USING THE DUAL-TREE COMPLEX WAVELET TRANSFORM
Figure 1 Types of MCs, a) and b) Grouped or clusters MCs. c) Linear MCs. d) Linear MCs & clustered.
Figure 2 Image of mammogram with linear MCs.
Table 1 Mammogram information format [9].
mdb209 G CALC M 647 503 87
1st column 2nd column 3rd column
Reference number from MIASdatabase. The database includes 322mammograms.
Type of tissue:F-Fatty,G- Fatty-Glandular,D-Dense-Glandular.
Class of abnormality: CALC-Calcifi-cation, CIRC-Circumscribed masses,SPIC-Spiculated masses, MISC-other,ill-defined masses, ARCH Architec-tural distortion, ASYM- Asymmetry,NORM-Normal.
4th column 5th & 6th column 7th column
Severity of abnormality:B-Benign, M-Malignant
(x, y) image-coordinates of centre ofabnormality.
Approximate radius (pixels) of a circleenclosing the abnormality.
2.4 Complex wavelet transform (CWT)
The complex wavelet transform (CWT) is used to avoid thelimitations of DWT and to obtain phase information. TheCWT employs a complex value filtered analytically to decom-pose pure real signals and real signals with complex compo-nents into real and imaginary parts in the wavelet domain.Real and imaginary coefficients are used to compute ampli-tude and phase information, needed to describe precisely theenergy localisation of oscillating sources. Recent investiga-tions in the CWT field are addressed to the design of complexfilter banks, in which the outputs are wavelet coefficients (realand imaginary). It is desirable that filters form pairs of Hilberttransform on each decomposition level. The CWT is classi-fied into two groups, namely, the Redundant-CWT (RCWT)
and the Non-redundant-CWT (NR-CWT), and it is a powerfultool to image compression [13].
2.4.1 Analytical filters
The Hilbert transform was introduced for signal processingby Gabor. It is defined as an extension of a real signal s(x)according to
r(x) = s(x)+ i g(x) (2)
where g(x) is the Hilbert transform of s(x) denoted by
H {s(x)} and i = (−1)12 [13]. The signal g(x) is the 90◦
shifted version of s(x) as shown in Figure 5(a). The signalg(x) is orthogonal to s(x). If S(ω) is the Fourier Transform(FT) of signal s(x) and G(ω) is the FT of g(x), the relation
52 Engineering Intelligent Systems
V. ALARCON-AQUINO ET AL
a) mdb297 b) mdb298
Figure 3 (a) Mammogram corresponding to right breast and (b) Mammogram corresponding to left breast.
a) mdb006 b) mdb276 c) mdb038
Figure 4 Mammograms with several densities of tissue: (a) Fatty (F), (b) Fatty-Glandular (G), and (c) Dense-glandular (D) according to the MIAS database.
between s(x) and g(x) in the frequency domain is given by
G(ω) = S{H {s(x)}} = −i Sgn(ω)S(ω) (3)
where −iSgn(ω) is the modified signum function shown inFigure 5(b). In the time domain, g(x) can be represented by[13]
g(x) = H {s(x)} = 1
π
∞∫−∞
s(x)
x − τdτ = s(x)
1
πτ(4)
where τ denotes the integration variable. The estimate of in-stantaneous frequency and amplitude of signal r(x) are givenby
Magnitude of r (x) =√s (x)2 + g (x)2
Angle of r (x) = tan−1 g (x)
s (x)
(5)
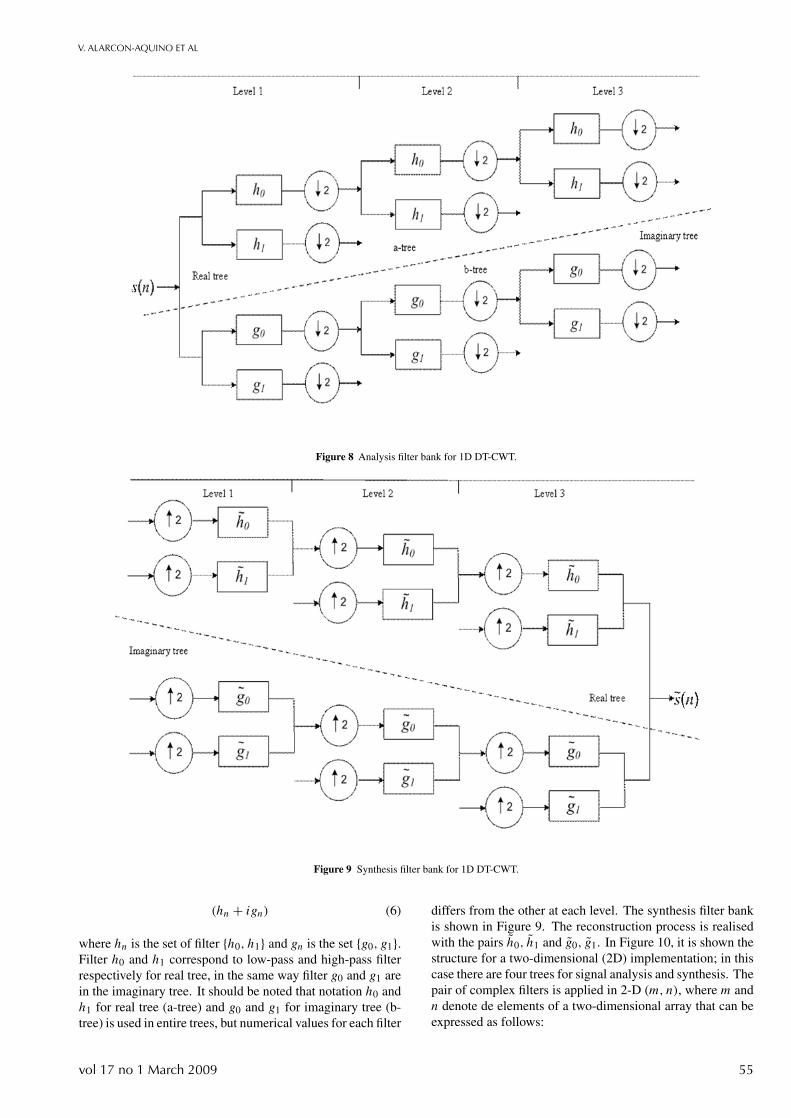
The previous quadrature representation results in a non-negative spectral representation in the Fourier domain that
uses only a half of the bandwidth, this decreases the “alias-ing”. Reduction of the “aliasing” is the key for shift insen-sibility of CWT. Figure 6 shows the frequency spectrum ofan original signal S(ω) and its analytic representationR(ω).The previous concept is applied to a filter bank of the DWTto produce complex solutions that originates the CWT. Realcoefficients are replaced by complex coefficients. The com-plex filter can be decomposed into two real filters (seen Figure7). The impulse response of each filter constitutes the Hilbertpairs. The combination of these filters is known as analyticfilter.
2.5 Redundant complex wavelet transform(RCWT)
The RCWT is presented in two variants, namely, the dual-treecomplex wavelet transform of Kingsbury (DT-CWT (K)) andthe DT-CWT of Selesnick (DT-CWT (S)). Both of them areredundant due to a similar filter bank structure with the DWT,but in this case the banks operate in parallel and in quadrature.
vol 17 no 1 March 2009 53
DETECTION OF MICROCALCIFICATIONS IN DIGITAL MAMMOGRAMS USING THE DUAL-TREE COMPLEX WAVELET TRANSFORM
a) b)
Figure 5 Hilbert transform a) polar form, b) frequency domain.
a) b)
Figure 6 Spectral representation a) original signal s(x) b) analytic signal r(x).
Figure 7 Interpretation of an analytic filter into two real filters [13].
The filter structure is the same in both variants; the differenceis the method that generates the wavelet and scaling coeffi-cients. Both DT-CWT variations generate phase information,are insensible to shifting, and are directional. The CWT fol-lows the same principle of DWT, and at the output there are thesame number of samples n that at the input. Furthermore, thecomputational complexity is only twice of the DWT, O(2n)
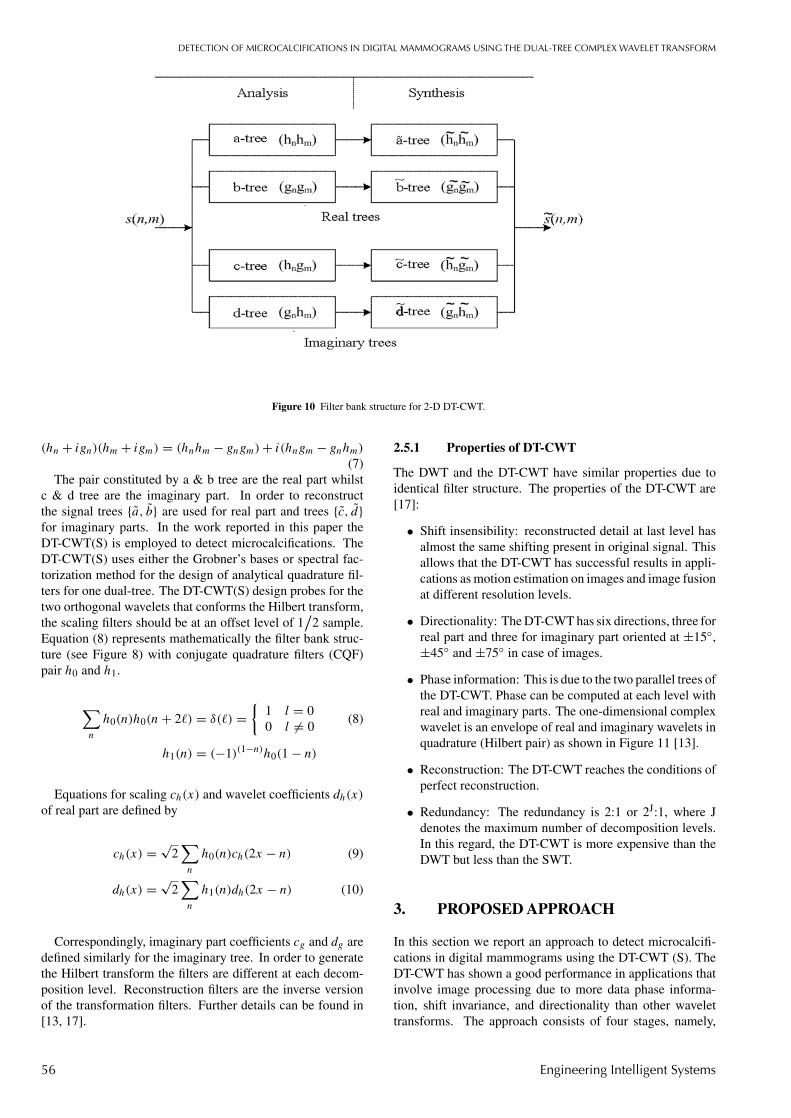
[13]. Although, both DT-CWT have the same filter bank struc-ture of DWT, the difference is that analytical filters replace realfilters in order to obtain complex solutions. It is similar of twoparallel filter bank structures in the DWT [13, 17]. Figure 8shows the filter bank structure to DT-CWT analysis at threelevel of decomposition in one-dimension. The form of theconjugated filters for one-dimensional DT-CWT is defined by
54 Engineering Intelligent Systems
V. ALARCON-AQUINO ET AL
Figure 8 Analysis filter bank for 1D DT-CWT.
Figure 9 Synthesis filter bank for 1D DT-CWT.
(hn + ign) (6)
where hn is the set of filter {h0, h1} and gn is the set {g0, g1}.Filter h0 and h1 correspond to low-pass and high-pass filterrespectively for real tree, in the same way filter g0 and g1 arein the imaginary tree. It should be noted that notation h0 andh1 for real tree (a-tree) and g0 and g1 for imaginary tree (b-tree) is used in entire trees, but numerical values for each filter
differs from the other at each level. The synthesis filter bankis shown in Figure 9. The reconstruction process is realisedwith the pairs h0, h1 and g0, g1. In Figure 10, it is shown thestructure for a two-dimensional (2D) implementation; in thiscase there are four trees for signal analysis and synthesis. Thepair of complex filters is applied in 2-D (m, n), where m andn denote de elements of a two-dimensional array that can beexpressed as follows:
vol 17 no 1 March 2009 55
DETECTION OF MICROCALCIFICATIONS IN DIGITAL MAMMOGRAMS USING THE DUAL-TREE COMPLEX WAVELET TRANSFORM
Figure 10 Filter bank structure for 2-D DT-CWT.
(hn + ign)(hm + igm) = (hnhm − gngm)+ i(hngm − gnhm)
(7)The pair constituted by a & b tree are the real part whilst
c & d tree are the imaginary part. In order to reconstructthe signal trees {a, b} are used for real part and trees {c, d}for imaginary parts. In the work reported in this paper theDT-CWT(S) is employed to detect microcalcifications. TheDT-CWT(S) uses either the Grobner’s bases or spectral fac-torization method for the design of analytical quadrature fil-ters for one dual-tree. The DT-CWT(S) design probes for thetwo orthogonal wavelets that conforms the Hilbert transform,the scaling filters should be at an offset level of 1
/2 sample.
Equation (8) represents mathematically the filter bank struc-ture (see Figure 8) with conjugate quadrature filters (CQF)pair h0 and h1.
∑n
h0(n)h0(n+ 2�) = δ(�) ={
1 l = 00 l �= 0
(8)
h1(n) = (−1)(1−n)h0(1 − n)
Equations for scaling ch(x) and wavelet coefficients dh(x)of real part are defined by
ch(x) = √2
∑n
h0(n)ch(2x − n) (9)
dh(x) = √2
∑n
h1(n)dh(2x − n) (10)
Correspondingly, imaginary part coefficients cg and dg aredefined similarly for the imaginary tree. In order to generatethe Hilbert transform the filters are different at each decom-position level. Reconstruction filters are the inverse versionof the transformation filters. Further details can be found in[13, 17].
2.5.1 Properties of DT-CWT
The DWT and the DT-CWT have similar properties due toidentical filter structure. The properties of the DT-CWT are[17]:
• Shift insensibility: reconstructed detail at last level hasalmost the same shifting present in original signal. Thisallows that the DT-CWT has successful results in appli-cations as motion estimation on images and image fusionat different resolution levels.
• Directionality: The DT-CWT has six directions, three forreal part and three for imaginary part oriented at ±15◦,±45◦ and ±75◦ in case of images.
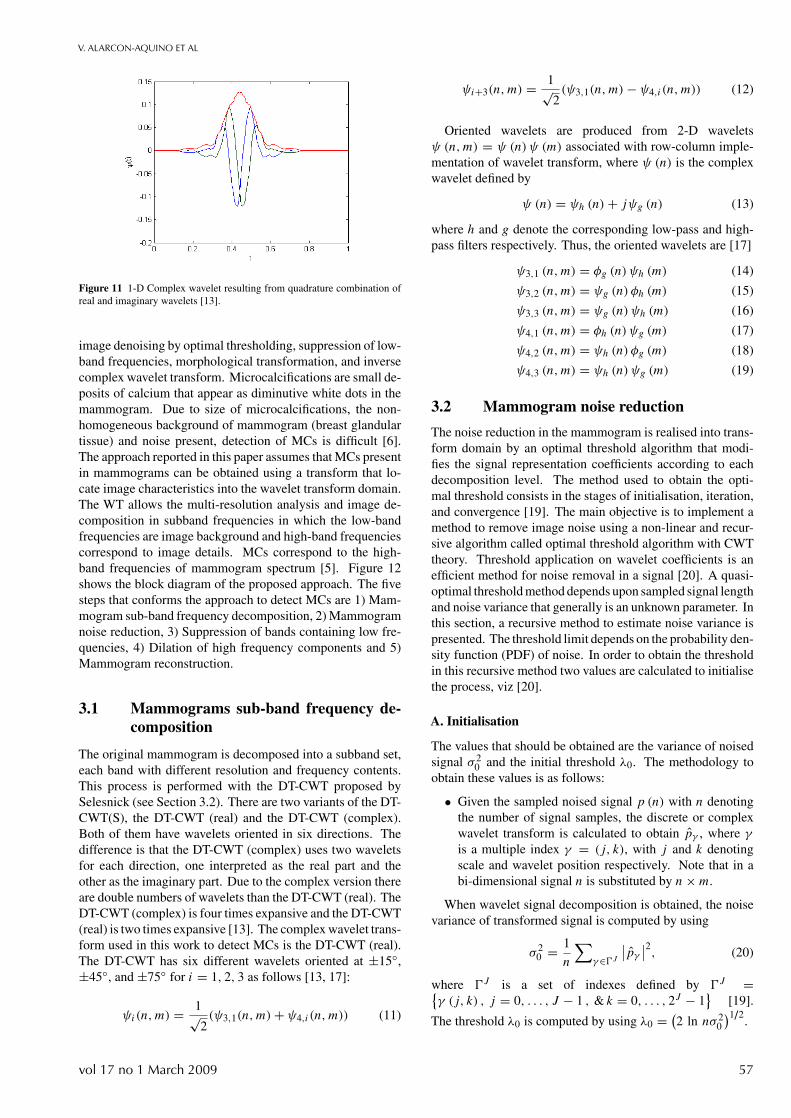
• Phase information: This is due to the two parallel trees ofthe DT-CWT. Phase can be computed at each level withreal and imaginary parts. The one-dimensional complexwavelet is an envelope of real and imaginary wavelets inquadrature (Hilbert pair) as shown in Figure 11 [13].
• Reconstruction: The DT-CWT reaches the conditions ofperfect reconstruction.
• Redundancy: The redundancy is 2:1 or 2J:1, where Jdenotes the maximum number of decomposition levels.In this regard, the DT-CWT is more expensive than theDWT but less than the SWT.
3. PROPOSED APPROACH
In this section we report an approach to detect microcalcifi-cations in digital mammograms using the DT-CWT (S). TheDT-CWT has shown a good performance in applications thatinvolve image processing due to more data phase informa-tion, shift invariance, and directionality than other wavelettransforms. The approach consists of four stages, namely,
56 Engineering Intelligent Systems
V. ALARCON-AQUINO ET AL
Figure 11 1-D Complex wavelet resulting from quadrature combination ofreal and imaginary wavelets [13].
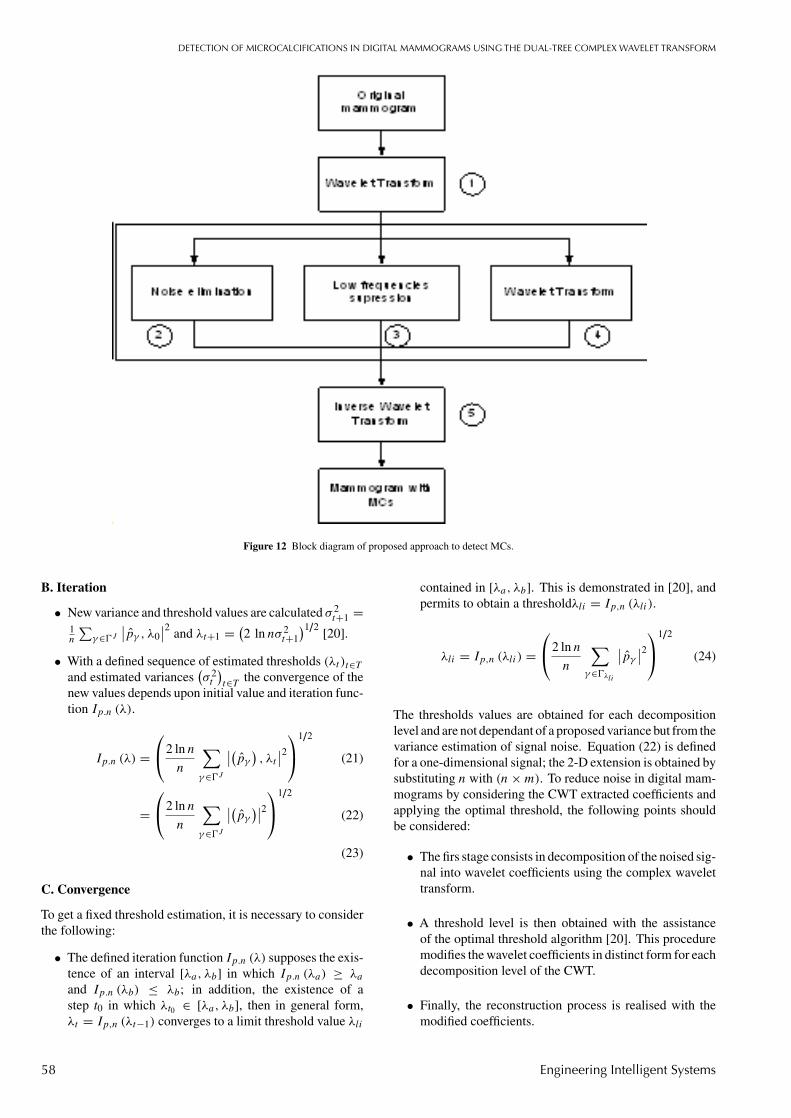
image denoising by optimal thresholding, suppression of low-band frequencies, morphological transformation, and inversecomplex wavelet transform. Microcalcifications are small de-posits of calcium that appear as diminutive white dots in themammogram. Due to size of microcalcifications, the non-homogeneous background of mammogram (breast glandulartissue) and noise present, detection of MCs is difficult [6].The approach reported in this paper assumes that MCs presentin mammograms can be obtained using a transform that lo-cate image characteristics into the wavelet transform domain.The WT allows the multi-resolution analysis and image de-composition in subband frequencies in which the low-bandfrequencies are image background and high-band frequenciescorrespond to image details. MCs correspond to the high-band frequencies of mammogram spectrum [5]. Figure 12shows the block diagram of the proposed approach. The fivesteps that conforms the approach to detect MCs are 1) Mam-mogram sub-band frequency decomposition, 2) Mammogramnoise reduction, 3) Suppression of bands containing low fre-quencies, 4) Dilation of high frequency components and 5)Mammogram reconstruction.
3.1 Mammograms sub-band frequency de-composition
The original mammogram is decomposed into a subband set,each band with different resolution and frequency contents.This process is performed with the DT-CWT proposed bySelesnick (see Section 3.2). There are two variants of the DT-CWT(S), the DT-CWT (real) and the DT-CWT (complex).Both of them have wavelets oriented in six directions. Thedifference is that the DT-CWT (complex) uses two waveletsfor each direction, one interpreted as the real part and theother as the imaginary part. Due to the complex version thereare double numbers of wavelets than the DT-CWT (real). TheDT-CWT (complex) is four times expansive and the DT-CWT(real) is two times expansive [13]. The complex wavelet trans-form used in this work to detect MCs is the DT-CWT (real).The DT-CWT has six different wavelets oriented at ±15◦,±45◦, and ±75◦ for i = 1, 2, 3 as follows [13, 17]:
ψi(n,m) = 1√2(ψ3,1(n,m)+ ψ4,i (n,m)) (11)
ψi+3(n,m) = 1√2(ψ3,1(n,m)− ψ4,i (n,m)) (12)
Oriented wavelets are produced from 2-D waveletsψ (n,m) = ψ (n)ψ (m) associated with row-column imple-mentation of wavelet transform, where ψ (n) is the complexwavelet defined by
ψ (n) = ψh (n)+ jψg (n) (13)
where h and g denote the corresponding low-pass and high-pass filters respectively. Thus, the oriented wavelets are [17]
ψ3,1 (n,m) = φg (n)ψh (m) (14)
ψ3,2 (n,m) = ψg (n) φh (m) (15)
ψ3,3 (n,m) = ψg (n)ψh (m) (16)
ψ4,1 (n,m) = φh (n)ψg (m) (17)
ψ4,2 (n,m) = ψh (n) φg (m) (18)
ψ4,3 (n,m) = ψh (n)ψg (m) (19)
3.2 Mammogram noise reduction
The noise reduction in the mammogram is realised into trans-form domain by an optimal threshold algorithm that modi-fies the signal representation coefficients according to eachdecomposition level. The method used to obtain the opti-mal threshold consists in the stages of initialisation, iteration,and convergence [19]. The main objective is to implement amethod to remove image noise using a non-linear and recur-sive algorithm called optimal threshold algorithm with CWTtheory. Threshold application on wavelet coefficients is anefficient method for noise removal in a signal [20]. A quasi-optimal threshold method depends upon sampled signal lengthand noise variance that generally is an unknown parameter. Inthis section, a recursive method to estimate noise variance ispresented. The threshold limit depends on the probability den-sity function (PDF) of noise. In order to obtain the thresholdin this recursive method two values are calculated to initialisethe process, viz [20].
A. Initialisation
The values that should be obtained are the variance of noisedsignal σ 2
0 and the initial threshold λ0. The methodology toobtain these values is as follows:
• Given the sampled noised signal p (n) with n denotingthe number of signal samples, the discrete or complexwavelet transform is calculated to obtain pγ , where γis a multiple index γ = (j, k), with j and k denotingscale and wavelet position respectively. Note that in abi-dimensional signal n is substituted by n×m.
When wavelet signal decomposition is obtained, the noisevariance of transformed signal is computed by using
σ 20 = 1
n
∑γ∈�J
∣∣pγ ∣∣2, (20)
where �J is a set of indexes defined by �J ={γ (j, k) , j = 0, . . . , J − 1 , & k = 0, . . . , 2J − 1
}[19].
The threshold λ0 is computed by using λ0 = (2 ln nσ 2
0
)1/2.
vol 17 no 1 March 2009 57
DETECTION OF MICROCALCIFICATIONS IN DIGITAL MAMMOGRAMS USING THE DUAL-TREE COMPLEX WAVELET TRANSFORM
Figure 12 Block diagram of proposed approach to detect MCs.
B. Iteration
• New variance and threshold values are calculated σ 2t+1 =
1n
∑γ∈�J
∣∣pγ , λ0∣∣2 and λt+1 = (
2 ln nσ 2t+1
)1/2[20].
• With a defined sequence of estimated thresholds (λt )t∈Tand estimated variances
(σ 2t
)t∈T the convergence of the
new values depends upon initial value and iteration func-tion Ip.n (λ).
Ip.n (λ) =2 ln n
n
∑γ∈�J
∣∣(pγ ), λt
∣∣2
1/2
(21)
=2 ln n
n
∑γ∈�J
∣∣(pγ )∣∣2
1/2
(22)
(23)
C. Convergence
To get a fixed threshold estimation, it is necessary to considerthe following:
• The defined iteration function Ip.n (λ) supposes the exis-tence of an interval [λa, λb] in which Ip.n (λa) ≥ λaand Ip.n (λb) ≤ λb; in addition, the existence of astep t0 in which λt0 ∈ [λa, λb], then in general form,λt = Ip,n (λt−1) converges to a limit threshold value λli
contained in [λa, λb]. This is demonstrated in [20], andpermits to obtain a thresholdλli = Ip,n (λli).
λli = Ip,n (λli) =2 ln n
n
∑γ∈�λli
∣∣pγ ∣∣2
1/2
(24)
The thresholds values are obtained for each decompositionlevel and are not dependant of a proposed variance but from thevariance estimation of signal noise. Equation (22) is definedfor a one-dimensional signal; the 2-D extension is obtained bysubstituting n with (n×m). To reduce noise in digital mam-mograms by considering the CWT extracted coefficients andapplying the optimal threshold, the following points shouldbe considered:
• The firs stage consists in decomposition of the noised sig-nal into wavelet coefficients using the complex wavelettransform.
• A threshold level is then obtained with the assistanceof the optimal threshold algorithm [20]. This proceduremodifies the wavelet coefficients in distinct form for eachdecomposition level of the CWT.
• Finally, the reconstruction process is realised with themodified coefficients.
58 Engineering Intelligent Systems
V. ALARCON-AQUINO ET AL
3.3 Suppression of bands containing low fre-quencies
To eliminate mammogram background that difficult visibilityof MCs the suppression of bands that contain mammogramlow-band frequencies is performed. This objective is achievedby scaling coefficient suppression from real and imaginarypart of DT-CWT(S), defined in Equation (9), then
ch (x) = √2
∑n
h0 (n) ch (2x − n) = 0 (25)
3.4 Dilation of high frequency components
It is necessary to stand out the subbands components thatcontain high frequencies in which MCs are present. This isachieved by a morphological operation of dilation. The re-sult of dilation is the set of origins points of the structuringelement Y in which the structuring element contains someelement from X set when the element is displaced throughthe space that contains both sets. The equation that modelsdilation δY (X) is given by [3, 6]
δY (X) = {x|Yx ∩X �= 0} (26)
where X is a pixel set, Y is a structuring element (with circle,triangle or hexagonal shape) and xis the set of pixels con-cerned to X. The wavelet coefficients contain image detailsso it is necessary to dilate each of six oriented bands; thusδY (ψi (x, y)) for i = 1, . . . , 6. The used structuring elementY is a circle that contains the MCs.
3.5 Mammogram reconstruction
Finally, DT-CWT synthesis is applied to the filter bank as ex-plained in Section 3.2 and the DT-CWT subbands, previouslyprocessed with the described methods of image denoising, lowfrequencies subband suppression, and high frequencies com-ponents dilation in which is obtained the mammogram thatcontains only the MCs.
4. EXPERIMENTAL RESULTS
To assess the performance of the proposed approach experi-mental results using the SWT and the top-hat transformationare also presented. The results after applying these methods inmammograms from the MIAS database are reported. The top-hat transformation is mainly employed for detail extraction inimages. There are two kinds of top-hat transformation. Thewhite top-hat transformation for brighten details extractionand the black top-hat transformation for dark details extraction[6]. Because MCs are present as bright particles rounded bya black background, then the white top-hat transformation isconsidered. The top-hat transformation consists on recoveringthe structures eliminated in the open or closed process. Usinga structuring element with suitable shape, size and orientationit is possible to filter the image and eliminate particular ele-ments of the original image. The white top-hat transform isthe residue between original image and morphological open.
Equation (25) shows the definition of white top-hat filtering[3].
ρ (X) = X
γ (X)(27)
where ρ (·) denotes the white top-hat transform and γ (·)is theopen process or morphological dilation δY (X). Furthermore,to compare the efficiency of the proposed approach simula-tions are first realised with mammograms using the DWT, theSWT, and the morphological top-hat filtering. In the SWT andthe DWT case, the fourth order Daubechies (db4) wavelet isused. Other wavelets may also be considered.
4.1 MCs detection using DWT and SWT
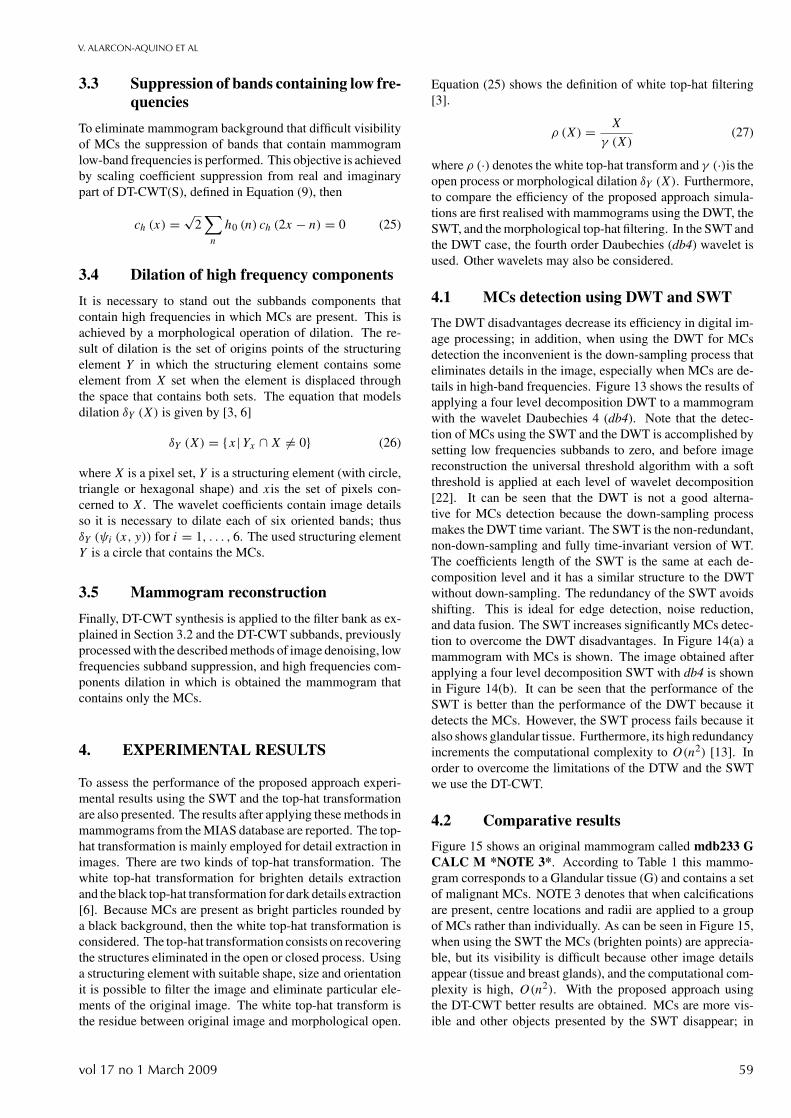
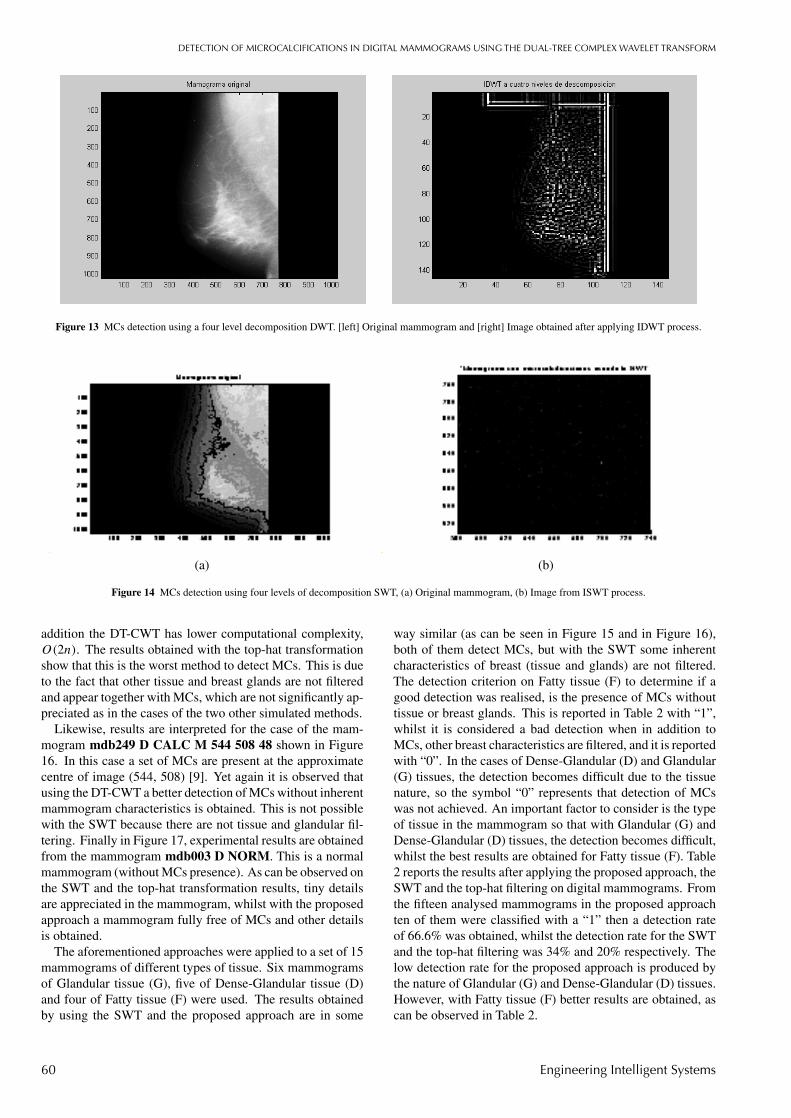
The DWT disadvantages decrease its efficiency in digital im-age processing; in addition, when using the DWT for MCsdetection the inconvenient is the down-sampling process thateliminates details in the image, especially when MCs are de-tails in high-band frequencies. Figure 13 shows the results ofapplying a four level decomposition DWT to a mammogramwith the wavelet Daubechies 4 (db4). Note that the detec-tion of MCs using the SWT and the DWT is accomplished bysetting low frequencies subbands to zero, and before imagereconstruction the universal threshold algorithm with a softthreshold is applied at each level of wavelet decomposition[22]. It can be seen that the DWT is not a good alterna-tive for MCs detection because the down-sampling processmakes the DWT time variant. The SWT is the non-redundant,non-down-sampling and fully time-invariant version of WT.The coefficients length of the SWT is the same at each de-composition level and it has a similar structure to the DWTwithout down-sampling. The redundancy of the SWT avoidsshifting. This is ideal for edge detection, noise reduction,and data fusion. The SWT increases significantly MCs detec-tion to overcome the DWT disadvantages. In Figure 14(a) amammogram with MCs is shown. The image obtained afterapplying a four level decomposition SWT with db4 is shownin Figure 14(b). It can be seen that the performance of theSWT is better than the performance of the DWT because itdetects the MCs. However, the SWT process fails because italso shows glandular tissue. Furthermore, its high redundancyincrements the computational complexity to O(n2) [13]. Inorder to overcome the limitations of the DTW and the SWTwe use the DT-CWT.
4.2 Comparative results
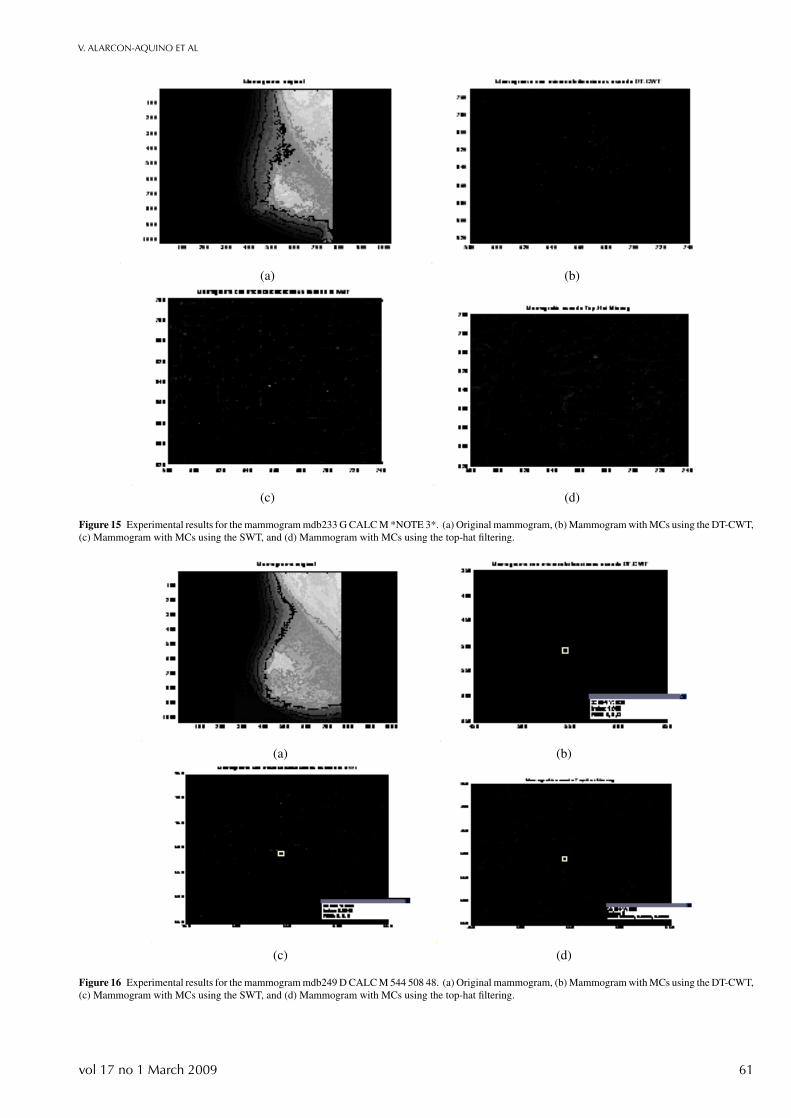
Figure 15 shows an original mammogram called mdb233 GCALC M *NOTE 3*. According to Table 1 this mammo-gram corresponds to a Glandular tissue (G) and contains a setof malignant MCs. NOTE 3 denotes that when calcificationsare present, centre locations and radii are applied to a groupof MCs rather than individually. As can be seen in Figure 15,when using the SWT the MCs (brighten points) are apprecia-ble, but its visibility is difficult because other image detailsappear (tissue and breast glands), and the computational com-plexity is high, O(n2). With the proposed approach usingthe DT-CWT better results are obtained. MCs are more vis-ible and other objects presented by the SWT disappear; in
vol 17 no 1 March 2009 59
DETECTION OF MICROCALCIFICATIONS IN DIGITAL MAMMOGRAMS USING THE DUAL-TREE COMPLEX WAVELET TRANSFORM
Figure 13 MCs detection using a four level decomposition DWT. [left] Original mammogram and [right] Image obtained after applying IDWT process.
(a) (b)
Figure 14 MCs detection using four levels of decomposition SWT, (a) Original mammogram, (b) Image from ISWT process.
addition the DT-CWT has lower computational complexity,O(2n). The results obtained with the top-hat transformationshow that this is the worst method to detect MCs. This is dueto the fact that other tissue and breast glands are not filteredand appear together with MCs, which are not significantly ap-preciated as in the cases of the two other simulated methods.
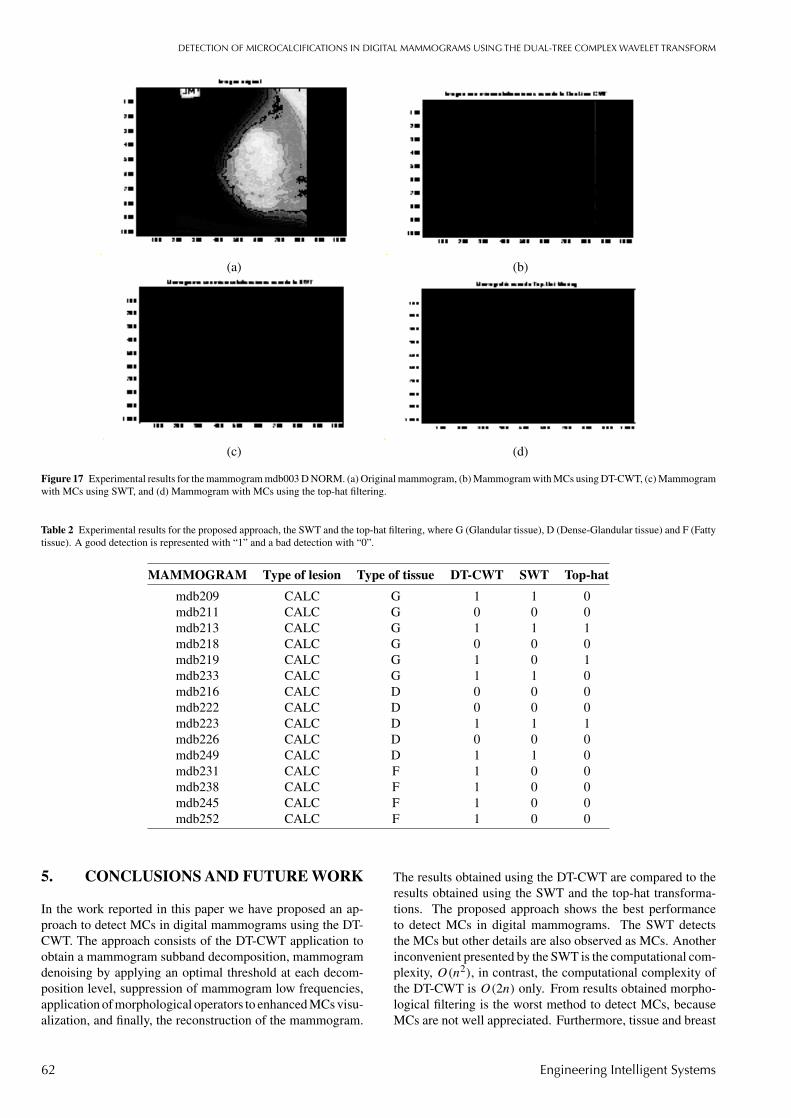
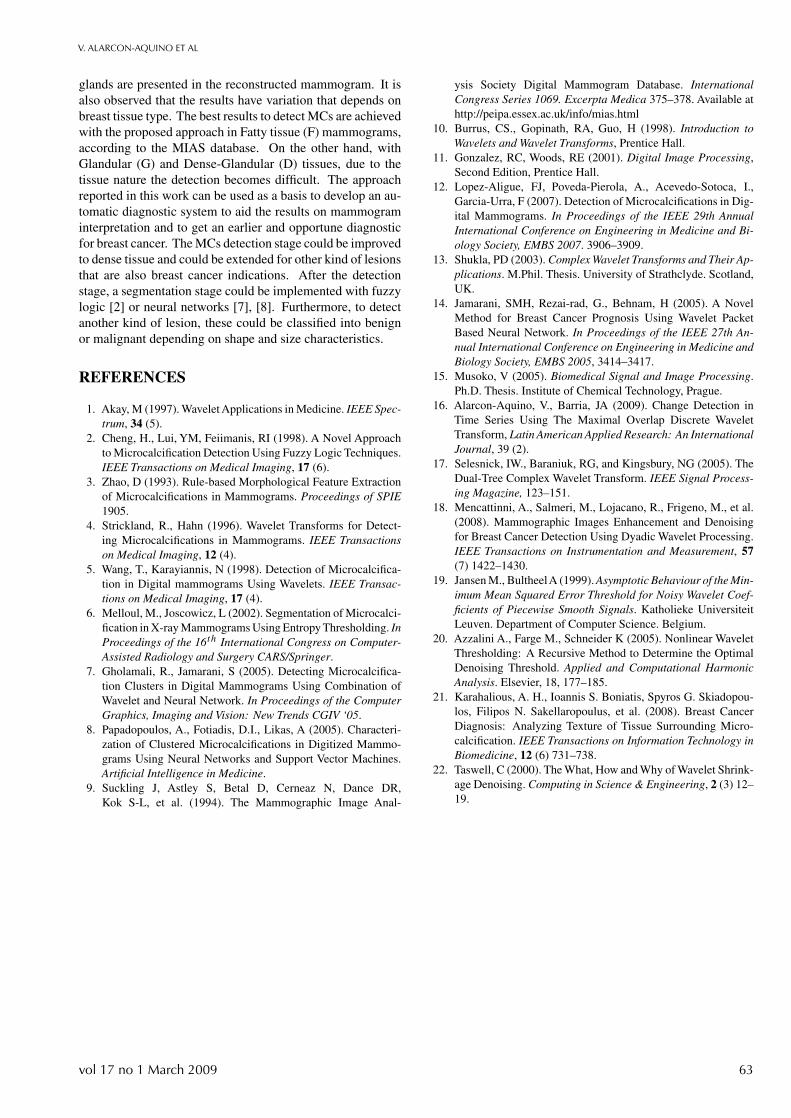
Likewise, results are interpreted for the case of the mam-mogram mdb249 D CALC M 544 508 48 shown in Figure16. In this case a set of MCs are present at the approximatecentre of image (544, 508) [9]. Yet again it is observed thatusing the DT-CWT a better detection of MCs without inherentmammogram characteristics is obtained. This is not possiblewith the SWT because there are not tissue and glandular fil-tering. Finally in Figure 17, experimental results are obtainedfrom the mammogram mdb003 D NORM. This is a normalmammogram (without MCs presence). As can be observed onthe SWT and the top-hat transformation results, tiny detailsare appreciated in the mammogram, whilst with the proposedapproach a mammogram fully free of MCs and other detailsis obtained.
The aforementioned approaches were applied to a set of 15mammograms of different types of tissue. Six mammogramsof Glandular tissue (G), five of Dense-Glandular tissue (D)and four of Fatty tissue (F) were used. The results obtainedby using the SWT and the proposed approach are in some
way similar (as can be seen in Figure 15 and in Figure 16),both of them detect MCs, but with the SWT some inherentcharacteristics of breast (tissue and glands) are not filtered.The detection criterion on Fatty tissue (F) to determine if agood detection was realised, is the presence of MCs withouttissue or breast glands. This is reported in Table 2 with “1”,whilst it is considered a bad detection when in addition toMCs, other breast characteristics are filtered, and it is reportedwith “0”. In the cases of Dense-Glandular (D) and Glandular(G) tissues, the detection becomes difficult due to the tissuenature, so the symbol “0” represents that detection of MCswas not achieved. An important factor to consider is the typeof tissue in the mammogram so that with Glandular (G) andDense-Glandular (D) tissues, the detection becomes difficult,whilst the best results are obtained for Fatty tissue (F). Table2 reports the results after applying the proposed approach, theSWT and the top-hat filtering on digital mammograms. Fromthe fifteen analysed mammograms in the proposed approachten of them were classified with a “1” then a detection rateof 66.6% was obtained, whilst the detection rate for the SWTand the top-hat filtering was 34% and 20% respectively. Thelow detection rate for the proposed approach is produced bythe nature of Glandular (G) and Dense-Glandular (D) tissues.However, with Fatty tissue (F) better results are obtained, ascan be observed in Table 2.
60 Engineering Intelligent Systems
V. ALARCON-AQUINO ET AL
(a) (b)
(c) (d)
Figure 15 Experimental results for the mammogram mdb233 G CALC M *NOTE 3*. (a) Original mammogram, (b) Mammogram with MCs using the DT-CWT,(c) Mammogram with MCs using the SWT, and (d) Mammogram with MCs using the top-hat filtering.
(a) (b)
(c) (d)
Figure 16 Experimental results for the mammogram mdb249 D CALC M 544 508 48. (a) Original mammogram, (b) Mammogram with MCs using the DT-CWT,(c) Mammogram with MCs using the SWT, and (d) Mammogram with MCs using the top-hat filtering.
vol 17 no 1 March 2009 61
DETECTION OF MICROCALCIFICATIONS IN DIGITAL MAMMOGRAMS USING THE DUAL-TREE COMPLEX WAVELET TRANSFORM
(a) (b)
(c) (d)
Figure 17 Experimental results for the mammogram mdb003 D NORM. (a) Original mammogram, (b) Mammogram with MCs using DT-CWT, (c) Mammogramwith MCs using SWT, and (d) Mammogram with MCs using the top-hat filtering.
Table 2 Experimental results for the proposed approach, the SWT and the top-hat filtering, where G (Glandular tissue), D (Dense-Glandular tissue) and F (Fattytissue). A good detection is represented with “1” and a bad detection with “0”.
MAMMOGRAM Type of lesion Type of tissue DT-CWT SWT Top-hat
mdb209 CALC G 1 1 0mdb211 CALC G 0 0 0mdb213 CALC G 1 1 1mdb218 CALC G 0 0 0mdb219 CALC G 1 0 1mdb233 CALC G 1 1 0mdb216 CALC D 0 0 0mdb222 CALC D 0 0 0mdb223 CALC D 1 1 1mdb226 CALC D 0 0 0mdb249 CALC D 1 1 0mdb231 CALC F 1 0 0mdb238 CALC F 1 0 0mdb245 CALC F 1 0 0mdb252 CALC F 1 0 0
5. CONCLUSIONS AND FUTURE WORK
In the work reported in this paper we have proposed an ap-proach to detect MCs in digital mammograms using the DT-CWT. The approach consists of the DT-CWT application toobtain a mammogram subband decomposition, mammogramdenoising by applying an optimal threshold at each decom-position level, suppression of mammogram low frequencies,application of morphological operators to enhanced MCs visu-alization, and finally, the reconstruction of the mammogram.
The results obtained using the DT-CWT are compared to theresults obtained using the SWT and the top-hat transforma-tions. The proposed approach shows the best performanceto detect MCs in digital mammograms. The SWT detectsthe MCs but other details are also observed as MCs. Anotherinconvenient presented by the SWT is the computational com-plexity, O(n2), in contrast, the computational complexity ofthe DT-CWT is O(2n) only. From results obtained morpho-logical filtering is the worst method to detect MCs, becauseMCs are not well appreciated. Furthermore, tissue and breast
62 Engineering Intelligent Systems
V. ALARCON-AQUINO ET AL
glands are presented in the reconstructed mammogram. It isalso observed that the results have variation that depends onbreast tissue type. The best results to detect MCs are achievedwith the proposed approach in Fatty tissue (F) mammograms,according to the MIAS database. On the other hand, withGlandular (G) and Dense-Glandular (D) tissues, due to thetissue nature the detection becomes difficult. The approachreported in this work can be used as a basis to develop an au-tomatic diagnostic system to aid the results on mammograminterpretation and to get an earlier and opportune diagnosticfor breast cancer. The MCs detection stage could be improvedto dense tissue and could be extended for other kind of lesionsthat are also breast cancer indications. After the detectionstage, a segmentation stage could be implemented with fuzzylogic [2] or neural networks [7], [8]. Furthermore, to detectanother kind of lesion, these could be classified into benignor malignant depending on shape and size characteristics.
REFERENCES
1. Akay, M (1997). Wavelet Applications in Medicine. IEEE Spec-trum, 34 (5).
2. Cheng, H., Lui, YM, Feiimanis, RI (1998). A Novel Approachto Microcalcification Detection Using Fuzzy Logic Techniques.IEEE Transactions on Medical Imaging, 17 (6).
3. Zhao, D (1993). Rule-based Morphological Feature Extractionof Microcalcifications in Mammograms. Proceedings of SPIE1905.
4. Strickland, R., Hahn (1996). Wavelet Transforms for Detect-ing Microcalcifications in Mammograms. IEEE Transactionson Medical Imaging, 12 (4).
5. Wang, T., Karayiannis, N (1998). Detection of Microcalcifica-tion in Digital mammograms Using Wavelets. IEEE Transac-tions on Medical Imaging, 17 (4).
6. Melloul, M., Joscowicz, L (2002). Segmentation of Microcalci-fication in X-ray Mammograms Using Entropy Thresholding. InProceedings of the 16th International Congress on Computer-Assisted Radiology and Surgery CARS/Springer.
7. Gholamali, R., Jamarani, S (2005). Detecting Microcalcifica-tion Clusters in Digital Mammograms Using Combination ofWavelet and Neural Network. In Proceedings of the ComputerGraphics, Imaging and Vision: New Trends CGIV ‘05.
8. Papadopoulos, A., Fotiadis, D.I., Likas, A (2005). Characteri-zation of Clustered Microcalcifications in Digitized Mammo-grams Using Neural Networks and Support Vector Machines.Artificial Intelligence in Medicine.
9. Suckling J, Astley S, Betal D, Cerneaz N, Dance DR,Kok S-L, et al. (1994). The Mammographic Image Anal-
ysis Society Digital Mammogram Database. InternationalCongress Series 1069. Excerpta Medica 375–378. Available athttp://peipa.essex.ac.uk/info/mias.html
10. Burrus, CS., Gopinath, RA, Guo, H (1998). Introduction toWavelets and Wavelet Transforms, Prentice Hall.
11. Gonzalez, RC, Woods, RE (2001). Digital Image Processing,Second Edition, Prentice Hall.
12. Lopez-Aligue, FJ, Poveda-Pierola, A., Acevedo-Sotoca, I.,Garcia-Urra, F (2007). Detection of Microcalcifications in Dig-ital Mammograms. In Proceedings of the IEEE 29th AnnualInternational Conference on Engineering in Medicine and Bi-ology Society, EMBS 2007. 3906–3909.
13. Shukla, PD (2003). Complex Wavelet Transforms and Their Ap-plications. M.Phil. Thesis. University of Strathclyde. Scotland,UK.
14. Jamarani, SMH, Rezai-rad, G., Behnam, H (2005). A NovelMethod for Breast Cancer Prognosis Using Wavelet PacketBased Neural Network. In Proceedings of the IEEE 27th An-nual International Conference on Engineering in Medicine andBiology Society, EMBS 2005, 3414–3417.
15. Musoko, V (2005). Biomedical Signal and Image Processing.Ph.D. Thesis. Institute of Chemical Technology, Prague.
16. Alarcon-Aquino, V., Barria, JA (2009). Change Detection inTime Series Using The Maximal Overlap Discrete WaveletTransform, Latin American Applied Research: An InternationalJournal, 39 (2).
17. Selesnick, IW., Baraniuk, RG, and Kingsbury, NG (2005). TheDual-Tree Complex Wavelet Transform. IEEE Signal Process-ing Magazine, 123–151.
18. Mencattinni, A., Salmeri, M., Lojacano, R., Frigeno, M., et al.(2008). Mammographic Images Enhancement and Denoisingfor Breast Cancer Detection Using Dyadic Wavelet Processing.IEEE Transactions on Instrumentation and Measurement, 57(7) 1422–1430.
19. Jansen M., BultheelA (1999). Asymptotic Behaviour of the Min-imum Mean Squared Error Threshold for Noisy Wavelet Coef-ficients of Piecewise Smooth Signals. Katholieke UniversiteitLeuven. Department of Computer Science. Belgium.
20. Azzalini A., Farge M., Schneider K (2005). Nonlinear WaveletThresholding: A Recursive Method to Determine the OptimalDenoising Threshold. Applied and Computational HarmonicAnalysis. Elsevier, 18, 177–185.
21. Karahalious, A. H., Ioannis S. Boniatis, Spyros G. Skiadopou-los, Filipos N. Sakellaropoulus, et al. (2008). Breast CancerDiagnosis: Analyzing Texture of Tissue Surrounding Micro-calcification. IEEE Transactions on Information Technology inBiomedicine, 12 (6) 731–738.
22. Taswell, C (2000). The What, How and Why of Wavelet Shrink-age Denoising. Computing in Science & Engineering, 2 (3) 12–19.
vol 17 no 1 March 2009 63

Related Documents