Musani V1, Sabol M, Car D, Ozretic P, Oreskovic S, Leovic D, Levanat S. LOH of PTCH1 region in BCC and ovarian carcinoma: microsatellite vs. HRM analysis. Front Biosci (Elite Ed). 2012 Jan 1;4:1049-57. DOI: 10.2741/440 (postprint version) Loss of heterozygosity of PTCH1 region in basal cell carcinoma and ovarian carcinoma: comparison of microsatellite analysis and high resolution melting Vesna Musani 1 , Maja Sabol 1 , Diana Car 1 , Petar Ozretic 1 , Slavko Oreskovic 2 , Dinko Leovic 3 , Sonja Levanat 1 1 Division of Molecular Medicine, Rudjer Boskovic Institute, Zagreb, Croatia 2 Department of Obstetrics and Gynecology, University of Zagreb School of Medicine, Zagreb, Croatia 3 Department of Maxillofacial Surgery, University Hospital Osijek, Osijek, Croatia TABLE OF CONTENTS: 1. Abstract 2. Introduction 3. Materials and methods 3.1. Patient samples and DNA extraction 3.2. Microsatellite analysis of LOH 3.3. High resolution melting analysis of SNPs 3.4. DNA sequencing 3.5. Statistical analysis 4. Results

Welcome message from author
This document is posted to help you gain knowledge. Please leave a comment to let me know what you think about it! Share it to your friends and learn new things together.
Transcript
Musani V1, Sabol M, Car D, Ozretic P, Oreskovic S, Leovic D, Levanat S. LOH of PTCH1 region in BCC
and ovarian carcinoma: microsatellite vs. HRM analysis. Front Biosci (Elite Ed). 2012 Jan 1;4:1049-57.
DOI: 10.2741/440 (postprint version)
Loss of heterozygosity of PTCH1 region in basal cell carcinoma and ovarian
carcinoma: comparison of microsatellite analysis and high resolution melting
Vesna Musani1, Maja Sabol1, Diana Car1, Petar Ozretic1, Slavko Oreskovic2, Dinko Leovic3,
Sonja Levanat1
1 Division of Molecular Medicine, Rudjer Boskovic Institute, Zagreb, Croatia
2 Department of Obstetrics and Gynecology, University of Zagreb School of Medicine,
Zagreb, Croatia
3 Department of Maxillofacial Surgery, University Hospital Osijek, Osijek, Croatia
TABLE OF CONTENTS:
1. Abstract
2. Introduction
3. Materials and methods
3.1. Patient samples and DNA extraction
3.2. Microsatellite analysis of LOH
3.3. High resolution melting analysis of SNPs
3.4. DNA sequencing
3.5. Statistical analysis
4. Results

Musani V1, Sabol M, Car D, Ozretic P, Oreskovic S, Leovic D, Levanat S. LOH of PTCH1 region in BCC
and ovarian carcinoma: microsatellite vs. HRM analysis. Front Biosci (Elite Ed). 2012 Jan 1;4:1049-57.
DOI: 10.2741/440 (postprint version)
4.1. Microsatellite analysis
4.2. HRM analysis
4.3. Comparison of two methods
5. Discussion
6. References
7. Figure legends
8. Tables
Musani V1, Sabol M, Car D, Ozretic P, Oreskovic S, Leovic D, Levanat S. LOH of PTCH1 region in BCC
and ovarian carcinoma: microsatellite vs. HRM analysis. Front Biosci (Elite Ed). 2012 Jan 1;4:1049-57.
DOI: 10.2741/440 (postprint version)
1. ABSTRACT
Loss of heterozygosity (LOH) of tumor suppressor genes is a frequent event in tumorigenesis.
LOH is most often analyzed by microsatellite typing, but here we offer a fast and efficient
method for simultaneous SNP genotyping and mutation scanning, which can also be used for
LOH detection. High resoultion melting (HRM) provides simple variant detection, and can be
adopted for a wide range of applications. When a melting profile for a specific SNP is
determined, the screening can be done without the need for sequencing, and only the
melting profiles differing from the established melting profiles should be sequenced or
analyzed by other methods. LOH of PTCH1 gene is often found in a series of different
tumors, for example basal cell carcinoma (BCC) and ovarian carcinoma (OC). In this study
LOH was detected in 50% of BCC and 27.27% of OC, and the detection rates of microsatellite
typing and HRM were comparable. Both methods depended only on the heterozygosity of
the loci analyzed, but HRM offers an additional advantage of detection of all sequence
variants in the gene of interest.
2. INTRODUCTION
Loss of heterozygosity (LOH) is a change from a state of heterozygosity in a normal genome
to a homozygous state in a paired tumor genome. LOH is a sign of somatic deletion and is
most often regarded as a mechanism for disabling tumor suppressor genes during the course
of oncogenesis (1). Tumor suppressor genes are generally inactivated by an intragenic
mutation within one allele and the subsequent loss of the corresponding (wild type) allele
(2).
Musani V1, Sabol M, Car D, Ozretic P, Oreskovic S, Leovic D, Levanat S. LOH of PTCH1 region in BCC
and ovarian carcinoma: microsatellite vs. HRM analysis. Front Biosci (Elite Ed). 2012 Jan 1;4:1049-57.
DOI: 10.2741/440 (postprint version)
Identification of deleted regions usually relies on genotyping tumor and counterpart normal
DNA with polymorphic DNA markers, such as microsatellites. Microsatellites are short,
polymorphic, tandem repeat segments dispersed throughout the human genome. Most
procedures to detect LOH are based on comparing alleles in tumor and normal tissue after
PCR amplification with fluorescently labeled fragments, followed by capillary electrophoresis
on an automated DNA sequencer (3).
High resolution melting (HRM) analysis is a simple, powerful and robust method for
detecting DNA sequence variants. The method is based on differences in melting curves
caused by variations in nucleotide sequence, detected as the change in fluorescence during
the heating (melting) of the PCR product in the presence of the intercalating dye. The
advantages of high resolution melting analysis for variant scanning include rapid turn-around
times, a closed-system environment that greatly reduces contamination risk and, unlike
other methods, no sample processing or separation after PCR. The method is an ideal choice
for scanning of novel variants or genotyping known ones. (4).
Patched (PTCH1) gene is a tumor suppressor gene associated with development of
basocellular carcinomas (BCC) of the skin. It is a member of the Hedgehog-Gli signaling
pathway, a pathway that plays a major role in embryonic development and stem cell
maintenance. The pathway is activated by binding of Hedgehog (Hh) protein to its
transmembrane receptor Patched (Ptch). Ptch is then internalized, and releases its inhibition
of Smoothened (Smo) protein, which is transported to the cell surface (reviewed in 5). A
phosphorylation cascade is then triggered in the cytoplasm, leading to activation of
transcription factor Gli, which translocates to the nucleus and triggers transcription of target
genes: Cyclin D2, Cyclin E (6), members of the Wnt signaling pathway (7, 8), N-MYC (9),
PTCH1 (10), Ceruloplasmin, ITIH3 (11), bcl-2 (12), FOXM1 (13).
PTCH1 gene is located on chromosome 9, in the chromosome region 9q22.32, with 24 exons
streching through 70 kb (14). PTCH1 gene has one polymorphic CGG repeat marker located
directly upstream of the first ATG codon of exon 1b (rs71366293) (15), and at least 48 single
nucleotide polymorphisms (SNP) throughout the gene (16), 7 of them common (17).

Musani V1, Sabol M, Car D, Ozretic P, Oreskovic S, Leovic D, Levanat S. LOH of PTCH1 region in BCC
and ovarian carcinoma: microsatellite vs. HRM analysis. Front Biosci (Elite Ed). 2012 Jan 1;4:1049-57.
DOI: 10.2741/440 (postprint version)
Germline mutations of the PTCH1 gene lead to Gorlin syndrome, a syndrome characterized
with various developmental malformations and tumors (18, 19, 10). Tumor suppressor role
of the gene causing the Gorlin syndrome was known even before it was cloned in 1996 (20).
Even then LOH analysis was based on microsatellite markers throughout the whole 9q22.31-
9q22.33 region. Sporadic mutations of the PTCH1 gene are involved in a series of sporadic
tumors, including BCC (21, 22), medulloblastomas (23), skin trichoepitheliomas (24),
esophageal squamous cell carcinomas (25), squamous cell carcinomas (26), breast cancer
(23), as well as in odontogenic keratocysts (27).
According to the recent research, Hh-Gli signaling pathway is involved in one third of all
malignant tumors, so it is becoming an interesting target for new cancer therapies (28). The
role of Hh-Gli signaling pathway in ovarian carcinoma (OC) has been discovered only
recently. Unlike healthy epithelial ovarian tissue, OC shows increased protein expression of
the members of the pathway (29). Also, ovarian tumors often show LOH of the PTCH1 gene
(30). Benign tumors of the ovary also show promoter hypermethylation (31), while OC do
not (32).
We aim to provide evidence that the high resolution melting analysis is a simple, fast,
accurate and inexpensive method to detect LOH, comparable to microsatellite analysis in
both sensitivity and specificity.
3. MATERIALS AND METHODS
3.1. Patient samples and DNA extraction
Tumor tissue samples and blood samples from BCC patients were collected at Department of
Maxillofacial Surgery, Clinical Hospital Osijek, in Osijek, Croatia. Tumor tissue samples and
blood samples from OC patients were collected at Department of Obstetrics and
Musani V1, Sabol M, Car D, Ozretic P, Oreskovic S, Leovic D, Levanat S. LOH of PTCH1 region in BCC
and ovarian carcinoma: microsatellite vs. HRM analysis. Front Biosci (Elite Ed). 2012 Jan 1;4:1049-57.
DOI: 10.2741/440 (postprint version)
Gynecology, Zagreb University School of Medicine, in Zagreb, Croatia. All samples were
collected with patients’ consent according to Declaration of Helsinki, and ethical committees
of both institutions approved the study. In total 25 BCC samples from 19 patients and 12 OC
samples from 12 patients were collected. DNA was extracted from tissues using the standard
phenol-chloroform method, and from blood using the desalting method.
3.2. Microsatellite analysis of LOH
LOH analysis was done using fluorescent labeled forward primers, followed by fragmental
analysis detection on ABI PRISM 310 Genetic Analyzer (Applied Biosystems, USA).
DNA of 25 BCC and 12 OC samples were typed for CGG repeat in 5’UTR of PTCH1 gene
(rs71366293) using following primers: F: 5' CCCCCGCGCAATGTGGCAATGGAA '3 and R: 5'
CGTTACCAGCCGAGGCCATGTT '3 (33). Samples that were uninformative were further typed
for three additional STR markers (D9S196, D9S287 and D9S180) (17).
PCR conditions for CGG repeat were: initial denaturation at 95°C for 10 min, followed by 30
cycles of 95°C 30s, 61°C 2 min, 72°C 1 min, and final extension at 72°C 30 min using AmpliTaq
Gold polymerase (Applied Biosystems, USA).
PCR conditions for the multiplex PCR with other STR markers: initial denaturation at 95°C for
15 min, followed by 19 cycles of 95°C 30 s, 55°C 90s, 72°C 1min, and final extension at 72°C
30 min using QIAGEN Multiplex PCR kit (QIAGEN, Germany).
3.3. High resolution melting analysis of SNPs
PCR reactions were performed in a 10 µl reaction mixture in Roche LightCycler capillaries
using the following components: 50 ng template DNA, 0.2 mM dNTPs (Roche, Mannheim,
Germany), 0.4 U FastStart Taq DNA Polymerase (Roche), 1x fluorescent dye LCGreen Plus
(Idaho Technology, Salt Lake City, ID, USA), 2 mM MgCl2 (Idaho Technology) and forward
and reverse primers (0.5 mM each) for each gene segment. PCR reaction was performed in
an adapted RapidCycler2 instrument (Idaho Technology). Coding region of the PTCH1 gene

Musani V1, Sabol M, Car D, Ozretic P, Oreskovic S, Leovic D, Levanat S. LOH of PTCH1 region in BCC
and ovarian carcinoma: microsatellite vs. HRM analysis. Front Biosci (Elite Ed). 2012 Jan 1;4:1049-57.
DOI: 10.2741/440 (postprint version)
was split into 24 PCR products, sized between 168 and 428 bp. PCR conditions were
optimized to temperatures between 52oC and 64oC for each segment. After 40 cycles of
amplification, PCR products underwent an additional 1 min at 98oC and then 5 min at 40oC to
promote heteroduplex formation. Each capillary was then transferred to the High Resolution
Melter instrument (HR-1, Idaho Technology) for high resolution melting and curve analysis.
Samples were melted at 0.2oC/s ramp rate (34). Melting profiles were analyzed with HR-1
software using fluorescence normalization, temperature shift and conversion to difference
and derivative plots. Paired blood and tissue samples were compared, and samples showing
a difference in melting profiles were sequenced.
3.4. DNA sequencing
Before sequencing, the chosen PCR products were purified with ExoSAP-IT (USB, Cleveland,
OH, USA) and then sequenced in both directions using the Big Dye Terminator 1.1 Cycle
Sequencing kit (Applied Biosystems, Foster City, CA, USA). Sequencing reaction was
performed on an automatic sequencer ABI PRISM 310 Genetic Analyzer (Applied
Biosystems), and sequences were analyzed using BioEdit program.
3.5. Statistical analysis
Kappa statistics κ (35) were used for evaluating inter-rater agreement between two LOH
analysis methods and κ values were interpreted according to Landis and Koch (36). Fisher’s
exact test was used for assessing difference in LOH distribution between BCC and OC
samples (two-tailed P value < 0.05 was considered statistically significant). Statistical
analyses were performed with MedCalc for Windows, version 11.4.2.0 (MedCalc Software,
Mariakerke, Belgium).
4. RESULTS

Musani V1, Sabol M, Car D, Ozretic P, Oreskovic S, Leovic D, Levanat S. LOH of PTCH1 region in BCC
and ovarian carcinoma: microsatellite vs. HRM analysis. Front Biosci (Elite Ed). 2012 Jan 1;4:1049-57.
DOI: 10.2741/440 (postprint version)
4.1. Microsatellite analysis
LOH of the PTCH1 region was determined in 10 of 25 BCC from 9 patients (40%) (Figure 1,
Table 1-left part). Twelve BCC samples from 11 patients had no LOH, while 3 samples from 2
patients were uninformative for all 4 markers used (D9S196, rs71366293, D9S287 and
D9S180). So the prevalence of LOH in BCC was 45.45% (10/22).
Six patients had two BCCs analyzed. Of those, three had LOH in one tumor but not in the
other, one had LOH in both tumors, one had no LOH, and one was uninformative for all
markers.
In OC samples, LOH of the PTCH1 region was determined in 3 of 12 cases (25%) (Table 1-left
part). Seven OC samples had no LOH, and 2 samples were uninformative for all markers
analyzed. The prevalence of LOH in OC was 30% (3/10).
4.2. HRM analysis
Using the HRM analysis and sequencing, LOH was detected in BCC samples with SNPs
located in exons 5 (c.735A>G), 12 (c.1665T>C, c.1686C>T), 14 (c.2199A>G) and 23
(c.3944C>T), and introns 1 (c.202-539delC), 5 (c.747-55T>C), 10 (c.1504-51C>G) and 15
(c.2560+9G>C) (Figure 2, Figure 3, Table 1-right part).
We considered 1 informative SNP enough evidence for confirmation of LOH, and in all
samples analyzed all SNPs corresponded together, that is, when more than one SNP was
informative they all either showed LOH or did not. LOH was detected in 10 BCC samples,
with 1 up to 4 SNPs being informative.
Eleven samples showed no LOH, with 1 to 4 SNPs being informative. Four samples were
homozygotic for all PTCH1 exons analyzed, so no information about LOH could be gathered.
The prevalence of LOH in BCCs detected by HRM was 47.6% (10/21)

Musani V1, Sabol M, Car D, Ozretic P, Oreskovic S, Leovic D, Levanat S. LOH of PTCH1 region in BCC
and ovarian carcinoma: microsatellite vs. HRM analysis. Front Biosci (Elite Ed). 2012 Jan 1;4:1049-57.
DOI: 10.2741/440 (postprint version)
In ovarian carcinoma samples LOH was found in exons 12 (c.1686CT) and 23 (c.3944C>T),
and introns 1(c.202-539delC), 5 (c.747-55T>C) and 15 (c.2560+9G>C). LOH was found in 3
samples, with 4 or 5 SNPs being informative (Table 1-right part).
LOH was not found in 7 samples, with 2 up to 6 SNPs being informative. Two samples were
homozygotic for all PTCH1 exons analyzed, so no information about LOH could be gathered.
In ovarian carcinomas, the prevalence of LOH detected by HRM was 30% (3/10)
4.3. Comparison of two methods
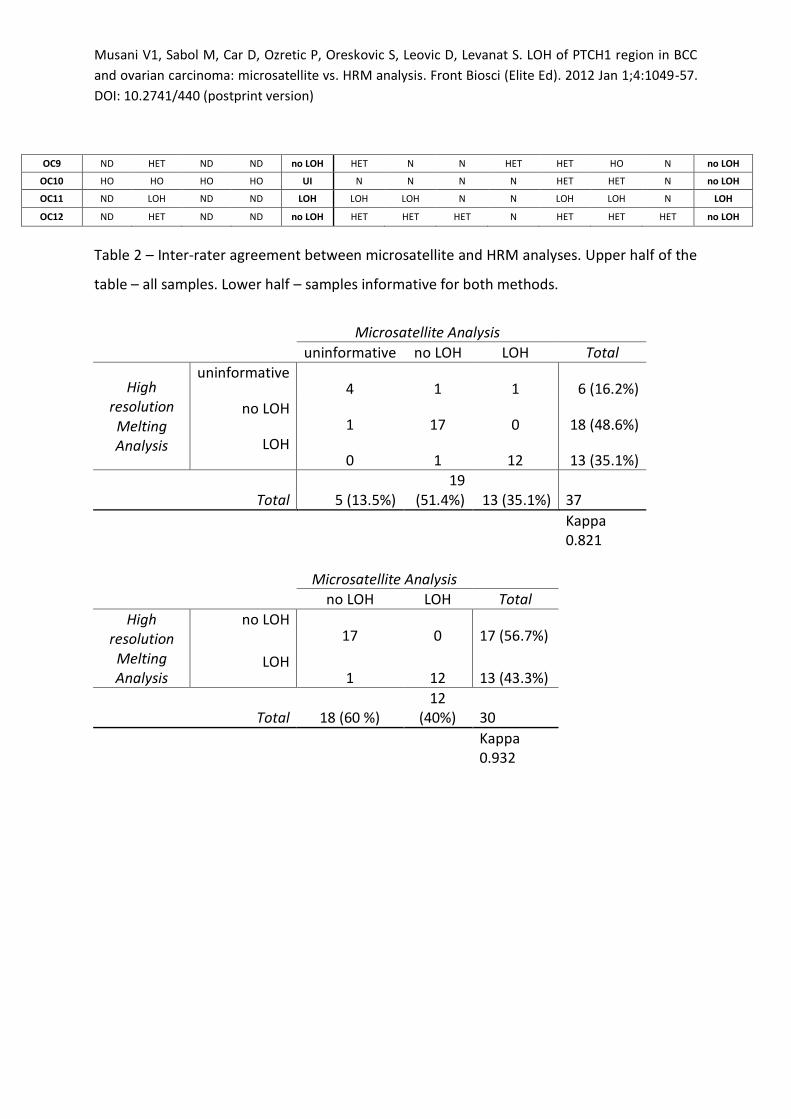
The inter-rater agreement between microsatellite and HRM LOH analyses obtained a κ value
of 0.821, what can be interpreted as very good agreement (Table 2-upper half). When we
excluded samples that were uninformative by either method, the κ value was even higher:
0.932 (Table 2-lower half). For BCC samples, data from microsatellite and HRM analysis
corresponded in nine samples that showed LOH, 11 samples that did not show LOH and
three samples that were uninformative. The results did not match in two cases: in one case
(BCC18) microsatellite analysis showed LOH, while the HRM analysis was uninformative. In
this case the microsatellite analysis showed itself to be more accurate. In the second case
(BCC21), the microsatellite analysis showed no LOH, while the HRM analysis showed LOH in
4 SNPs. Here the HRM analysis was more accurate.
For OC samples, data from two analyses corresponded in three samples that showed LOH, 6
samples that showed no LOH, and one uninformative sample. The data did not match in two
cases. In one case (OC5) the microsatellite analysis showed no LOH, while the SNPs were
uninformative, and in the second (OC10), the microsatellite were uninformative; while the
SNPs showed that there was no LOH.
Combining the results from both methods, the prevalence of LOH in BCCs was 50.0% (11/22)
while in OC samples was 27.27% (3/11). There was no statistically significant difference
between the prevalence in BCCs and OC (P=0.278, Figure 4).
Musani V1, Sabol M, Car D, Ozretic P, Oreskovic S, Leovic D, Levanat S. LOH of PTCH1 region in BCC
and ovarian carcinoma: microsatellite vs. HRM analysis. Front Biosci (Elite Ed). 2012 Jan 1;4:1049-57.
DOI: 10.2741/440 (postprint version)
5. DISCUSSION
High resolution melting analysis has mostly been used for mutation scanning or genotyping
(detection of SNPs) in a variety of different systems (reviewed in 37). So far only one paper
mentions the possibility of LOH detection using melting curve analysis (38), although a
similar concept was established previously using denaturing high-performance liquid
chromatography (DHPLC) (39). LOH has previously mostly been detected by microsatellite
typing (3). More recently, oligonucleotide SNP arrays have become another tool for LOH
detection although it is limited by availability (1). HRM has become widely available in a
variety of applications, which has been demonstrated by the number of publications in the
recent years (reviewed in 4).
In our research we compared the HRM approach with the classic microsatellite analysis. We
determined that LOH can be easily detected using HRM when comparing melting curves
from blood and tissue samples, on SNP locations. In these cases there is a visible difference
in melting curve profiles between tumor and blood sample from the same patient. Usually
the difference is a clear shift of the melting profile from a heterozygous towards wild type or
homozygous form, indicating complete or partial loss of one of the alleles. When a melting
profile for a specific SNP is determined, the screening can be done without the need for
sequencing, and only the melting profiles differing from the established melting profiles
should be sequenced or analyzed by other methods.
The detection rate between HRM and microsatellite analysis was comparable, and both
were dependant on the heterozygosity of the used loci. The prevalence of LOH was 50% for
BCC, and 27.27% for OC. In literature the prevalence of LOH in BCCs is between 35 and 75%
(40, 22, 41, 42, 26) and 70% for ovarian tumors, both benign and malignant (30). Our data is
comparable with published data for BCC, but is significantly lower for OC. That is probably
because of the small number of our OC samples, but we are confident in our results, because
of high agreement of both methods used.

Musani V1, Sabol M, Car D, Ozretic P, Oreskovic S, Leovic D, Levanat S. LOH of PTCH1 region in BCC
and ovarian carcinoma: microsatellite vs. HRM analysis. Front Biosci (Elite Ed). 2012 Jan 1;4:1049-57.
DOI: 10.2741/440 (postprint version)
When we compared the HRM and microsatellite analysis, our data corresponded in most
samples. The data differed in four samples, two BCCs and two OC. In one sample (BCC18),
microsatellite analysis showed LOH, while it was uninformative for the SNPs. While we can
predict that this means the sample has the LOH in the PTCH1 gene, since the microsatellite
marker (D9S180) is almost 2 Mb away, we cannot say anything for certain. In the second BCC
case, where the microsatellite analysis showed no LOH, while the HRM analysis showed LOH,
we can be 100% confident that there is a LOH in the PTCH1 gene. In one OC case, where the
microsatellite analysis showed no LOH and the SNPs were uninformative, we cannot say for
sure if there really was no LOH (again because of the 2 Mb distance of D9S180). For the
second OC case, the microsatellites were uninformative, while the SNPs confirmed that
there was no LOH. So, while in two cases the microsatellites were more informative, due to
the distance of markers used, it cannot be certain that the PTCH1 gene itself was lost. In the
second two cases, where the SNPs were more informative, the data is more certain, because
the SNPs are located in the gene itself.
The only limitation of the HRM method (as well as the microsatellite, or SNP microarray) is
the need for SNPs. There are some methods for LOH detection that do not need SNPs, such
as Multiplex ligation-dependent probe amplification (MLPA) (43), comparative genomic
hybridization (CGH) (44), or whole genome sequencing but they are still not widely used.
For researchers interested in complete genetic analysis of a gene, we recommend HRM as
the method of choice, due to its ability to perform scanning for point mutations and LOH
analysis in the same reaction. Here we show it with the PTCH1 gene, but the method could
be equally applied to any gene containing common SNPs.
Acknowledgements
This work was supported by The Croatian Ministry of Science, Education and Sports, Republic
of Croatia, grant number: 098-0982464-2461. The authors wish to thank the patients who

Musani V1, Sabol M, Car D, Ozretic P, Oreskovic S, Leovic D, Levanat S. LOH of PTCH1 region in BCC
and ovarian carcinoma: microsatellite vs. HRM analysis. Front Biosci (Elite Ed). 2012 Jan 1;4:1049-57.
DOI: 10.2741/440 (postprint version)
agreed to participate in this study, and Mirela Levacic Cvok, for the assistance in the
experimental work.
6. REFERENCES
1. R. Beroukhim, M. Lin, Y. Park, K. Hao, X. Zhao, L. A. Garraway, E. A. Fox, E. P. Hochberg, I.
K. Mellinghoff, M. D. Hofer, A. Descazeaud, M. A. Rubin, M. Meyerson, W. H. Wong, W. R.
Sellers, C. Li: Inferring loss-of-heterozygosity from unpaired tumors using high-density
oligonucleotide SNP arrays. PLoS Comput Biol 2(5):e41, 323-332 (2006)
2. A. G. Knudson: Antioncogenes and human cancer. Proc Natl Acad Sci U S A 90(23), 10914-
10921 (1993)
3. F. Canzian, R. Salovaara, A. Hemminki, P. Kristo, R. B. Chadwick, L. A. Aaltonen, A. de la
Chapelle: Semiautomated assessment of loss of heterozygosity and replication error in
tumors. Cancer Res 56(14), 3331-3337 (1996)
4. J. L. Montgomery, L. N. Sanford, C. T. Wittwer: High-resolution DNA melting analysis in
clinical research and diagnostics. Expert Rev Mol Diagn 10(2), 219-240 (2010)
5. Y. Wang, A. P. McMahon, B. L. Allen: Shifting paradigms in Hedgehog signaling. Curr Opin
Cell Biol 19(2), 159-165 (2007)
6. M. Duman-Scheel, L. Weng, S. Xin, W. Du: Hedgehog regulates cell growth and
proliferation by inducing Cyclin D and Cyclin E. Nature 417(6886), 299-304 (2002)
7. J. L. Mullor, N. Dahmane, T. Sun, A. Ruiz i Altaba: Wnt signals are targets and mediators of
Gli function. Curr Biol 11, 769-773 (2001)
8. X. Li, W. Deng, S. M. Lobo-Ruppert, J. M. Ruppert: Gli1 acts through Snail and E-Cadherin
to promote nuclear signaling by β-catenin. Oncogene 26, 4489-4498 (2007)
Musani V1, Sabol M, Car D, Ozretic P, Oreskovic S, Leovic D, Levanat S. LOH of PTCH1 region in BCC
and ovarian carcinoma: microsatellite vs. HRM analysis. Front Biosci (Elite Ed). 2012 Jan 1;4:1049-57.
DOI: 10.2741/440 (postprint version)
9. T. G. Oliver, L. L. Grasfeder, A. L. Carroll, C. Kaiser, C. L. Gillingham, S. M. Lin, R.
Wickramasinghe, M. P. Scott, R. J. Weschler-Reya: Transcriptional profiling of the Sonic
hedgehog response: a critical role for N-myc in proliferation of neuronal precursors. PNAS
100(12), 7331-7336 (2003)
10. S. S. Cross, J. P. Bury: The hedgehog signaling pathways in human pathology. Curr Diag
Pathol 10, 157-168 (2003)
11. M. Kato, N. Seki, S. Sugano, K. Hashimoto, Y. Masuho, M. Muramatsu, K. Kaibuchi, M.
Nakafuku: Identification of Sonic Hedgehog-responsive genes using cDNA microarray.
Biochem Biophys Res Comm 289, 472-478 (2001)
12. R. L. Bigelow, N. S. Chari, A. B. Undén, K. B. Spurgers, S. Lee, D. R. Roop, R. Toftgård, T. J.
McDonnell: Transcriptional regulation of bcl-2 mediated by the Sonic Hedgehog signaling
pathway through gli-1. J Biol Chem 279(9), 1197-1205 (2004)
13. M.-T. Teh, S.-T. Wong, G. W. Neill, L. R. Ghali, M. P. Phillpot, A. G. Quinn: FOXM1 is a
downstream target of Gli1 in basal cell carcinomas. Cancer Res 62, 4773-4780 (2002)
14. R. D. Klein, D. J. Dykas, A. E. Bale: Clinical testing for the nevoid basal cell carcinoma
syndrome in a DNA diagnostic laboratory. Genet Med 7(9), 611-619 (2005)
15. K. Nagao, K. Fujii, M. Yamada, T. Miyashita: Identification of a novel polymorphism
involving a CGG repeat in the PTCH gene and a genome-wide screening of CGG-containing
genes. J Hum Genet 49(2), 97-101 (2004)
16. E. Lindström, T. Shimokawa, R. Toftgård, P. G. Zaphiropoulos: PTCH mutations:
distribution and analyses. Hum Mutat 27(3), 215-219 (2006)
17. S. Levanat, V. Musani, A. Komar, S. Oreskovic: Role of the hedgehog/patched signaling
pathway in oncogenesis: a new polymorphism in the PTCH gene in ovarian fibroma. Ann N Y
Acad Sci 1030, 134-143 (2004)

Musani V1, Sabol M, Car D, Ozretic P, Oreskovic S, Leovic D, Levanat S. LOH of PTCH1 region in BCC
and ovarian carcinoma: microsatellite vs. HRM analysis. Front Biosci (Elite Ed). 2012 Jan 1;4:1049-57.
DOI: 10.2741/440 (postprint version)
18. H. Hahn, C. Wicking, P. G. Zaphiropoulous, M. R. Gailani, S. Shanley, A. Chidambaram, I.
Vorechovsky, E. Holmberg, A. B. Unden, S. Gillies, K. Negus, I. Smyth, C. Pressman, D. J.
Leffell, B. Gerrard, A. M. Goldstein, M. Dean, R. Toftgard, G. Chenevix-Trench, B. Wainwright,
A. E. Bale: Mutations of the human homolog of Drosophila patched in the nevoid basal cell
carcinoma syndrome. Cell 85(6), 841-851 (1996)
19. R. L. Johnson, A. L. Rothman, J. Xie, L. V. Goodrich, J. W. Bare, J. M. Bonifas, A. G. Quinn,
R. M. Myers, D. R. Cox, E. H. Epstein Jr, M. P. Scott: Human homolog of patched, a candidate
gene for the basal cell nevus syndrome. Science 272(5268), 1668-1671 (1996)
20. S. Levanat, R. J. Gorlin, S. Fallet, D. R. Johnson, J. E. Fantasia, A. E. Bale: A two-hit model
for developmental defects in Gorlin syndrome. Nat Genet 12(1), 85-87 (1996)
21. M. Wolter, J. Reifenberger, C. Sommer, T. Ruzicka, G. Reifenberger: Mutations in the
human homologue of the Drosophila segment polarity gene patched (PTCH) in sporadic
basal cell carcinomas of the skin and primitive neuroectodermal tumors of the central
nervous system. Cancer Res 57(13), 2581-2585 (1997)
22. E. Heitzer, A. Lassacher, F. Quehenberger, H. Kerl, P. Wolf: UV fingerprints predominate
in the PTCH mutation spectra of basal cell carcinomas independent of clinical phenotype. J
Invest Dermatol 127(12), 2872-2881 (2007)
23. J. Xie, R. L. Johnson, X. Zhang, J. W. Bare, F. M. Waldman, P. H. Cogen, A. G. Menon, R. S.
Warren, L. C. Chen, M. P. Scott, E. H. Epstein Jr: Mutations of the PATCHED gene in several
types of sporadic extracutaneous tumors. Cancer Res 57(12), 2369-2372 (1997)
24. I. Vorechovský, A. B. Undén, B. Sandstedt, R. Toftgård, M. Ståhle-Bäckdahl:
Trichoepitheliomas contain somatic mutations in the overexpressed PTCH gene: support for
a gatekeeper mechanism in skin tumorigenesis. Cancer Res 57(21), 4677-4681 (1997)
25. C. Maesawa, G. Tamura, T. Iwaya, S. Ogasawara, K. Ishida, N. Sato, S. Nishizuka, Y. Suzuki,
K. Ikeda, K. Aoki, K. Saito, R. Satodate: Mutations in the human homologue of the Drosophila

Musani V1, Sabol M, Car D, Ozretic P, Oreskovic S, Leovic D, Levanat S. LOH of PTCH1 region in BCC
and ovarian carcinoma: microsatellite vs. HRM analysis. Front Biosci (Elite Ed). 2012 Jan 1;4:1049-57.
DOI: 10.2741/440 (postprint version)
patched gene in esophageal squamous cell carcinoma. Genes Chromosomes Cancer 21(3),
276-279 (1998)
26. H. Danaee, M. R. Karagas, K. T. Kelsey, A. E. Perry, H. H. Nelson: Allelic loss at Drosophila
patched gene is highly prevalent in Basal and Squamous Cell Carcinomas of the skin. J Invest
Dermatol 126(5), 1152-1158 (2006)
27. S. Pan, L. L. Xu, L. S. Sun, T. J. Li: Identification of known and novel PTCH mutations in
both syndromic and non-syndromic keratocystic odontogenic tumors. Int J Oral Sci 1(1), 34-
38 (2009)
28. S. J. Scales, F. J. de Sauvage: Mechanisms of Hedgehog pathway activation in cancer and
implications for therapy. Trends Pharmacol Sci 30(6), 303-312 (2009)
29. X. Chen, A. Horiuchi, N. Kikuchi, R. Osada, J. Yoshida, T. Shiozawa, I. Konishi: Hedgehog
signal pathway is activated in ovarian carcinomas, correlating with cell proliferation: it's
inhibition leads to growth suppression and apoptosis. Cancer Sci 98(1), 68-76 (2007)
30. J. Byrom, V. Mudaliar, C. W. Redman, P. Jones, R. C. Strange, P. R. Hoban: Loss of
heterozygosity at chromosome 9q22-31 is a frequent and early event in ovarian tumors. Int J
Oncol 24(5), 1271-1277 (2004)
31. M. Cretnik, V. Musani, S. Oreskovic, D. Leovic, S. Levanat: The Patched gene is
epigenetically regulated in ovarian dermoids and fibromas, but not in basocellular
carcinomas. Int J Mol Med 19(6), 875-883 (2007)
32. Z. M. Löf-Öhlin, S. Levanat, M. Sabol, B. Sorbe, T. K. Nilsson: Promoter methylation in the
PTCH gene in cervical epithelial cancer and ovarian cancer tissue as studied by eight novel
Pyrosequencing® assays. Int J Oncol 38, 685-692 (2011)
Musani V1, Sabol M, Car D, Ozretic P, Oreskovic S, Leovic D, Levanat S. LOH of PTCH1 region in BCC
and ovarian carcinoma: microsatellite vs. HRM analysis. Front Biosci (Elite Ed). 2012 Jan 1;4:1049-57.
DOI: 10.2741/440 (postprint version)
33. D. Leovic, M. Sabol, P. Ozretic, V. Musani, D. Car, K. Marjanovic, V. Zubcic, I. Sabol, M.
Sikora, M. Grce, Lj. Glavas-Obrovac, S. Levanat: Hh-Gli signaling pathway activity in oral and
oropharyngeal squamous cell carcinoma. Head Neck (in press).
34. M. L. Cvok, M. Cretnik, V. Musani, P. Ozretic, S. Levanat: New sequence variants in BRCA1
and BRCA2 genes detected by high-resolution melting analysis in an elderly healthy female
population in Croatia. Clin Chem Lab Med 46(10), 1376-1383 (2008)
35. J. Cohen: A coefficient of agreement for nominal scales. Educ Psychol Meas, 20(1), 37-46
(1960)
36. J. R. Landis, G. G. Koch: The measurement of observer agreement for categorical data.
Biometrics, 33(1), 159–174 (1977)
37. M. G. Herrmann, J. D. Durtschi, C. T. Wittwer, K. V. Voelkerding: Expanded instrument
comparison of amplicon DNA melting analysis for mutation scanning and genotyping. Clin
Chem 53(8), 1544-1548 (2007)
38. D. Vageli, Z. Daniil, J. Dahabreh, E. Karagianni, T. Liloglou, G. Koukoulis, K. Gourgoulianis:
Microsatellite instability and loss of heterozygosity at the MEN1 locus in lung carcinoid
tumors: A novel approach using real-time PCR with melting curve analysis in histopathologic
material. Oncol Rep 15, 557-564 (2006)
39. E. Kleymenova, C. L. Walker: Determination of loss of heterozygosity in frozen and
paraffin embedded tumors by denaturing high-performance liquid chromatography (DHPLC).
J Biochem Biophys Methods 47, 83-90 (2001)
40. K. Iwata, N. Takamura, M. Nakashima, G. Alipov, M. Mine, N. Matsumoto, K. Yoshiura, Y.
Prouglo, I. Sekine, I. Katayama, S. Yamashita: Loss of heterozygosity on chromosome 9q22.3
in microdissected basal cell carcinomas around the Semipalatinsk Nuclear Testing Site,
Kazakhstan. Hum Pathol 35(4), 460-464 (2004)

Musani V1, Sabol M, Car D, Ozretic P, Oreskovic S, Leovic D, Levanat S. LOH of PTCH1 region in BCC
and ovarian carcinoma: microsatellite vs. HRM analysis. Front Biosci (Elite Ed). 2012 Jan 1;4:1049-57.
DOI: 10.2741/440 (postprint version)
41. J. Reifenberger, M. Wolter, C. B. Knobbe, B. Köhler, A. Schönicke, C. Scharwächter, K.
Kumar, B. Blaschke, T. Ruzicka, G. Reifenberger: Somatic mutations in the PTCH, SMOH,
SUFUH and TP53 genes in sporadic basal cell carcinomas. Br J Dermatol 152(1), 43-51 (2005)
42. M. Y. Kim, H. J. Park, S. C. Baek, D. G. Byun, D. Houh: Mutations of the p53 and PTCH
gene in basal cell carcinomas: UV mutation signature and strand bias. J Dermatol Sci 29(1), 1-
9 (2002)
43. C. Franco-Hernández, V. Martínez-Glez, J. M. de Campos, A. Isla, J. Vaquero, M.
Gutiérrez, C. Casartelli, JA. Rey: Allelic status of 1p and 19q in oligodendrogliomas and
glioblastomas: multiplex ligation-dependent probe amplification versus loss of
heterozygosity. Cancer Genet Cytogenet 190(2), 93-96 (2009)
44. K. Agelopoulos, N. Tidow, E. Korsching, R. Voss, B. Hinrichs, B. Brandt, W. Boecker, H.
Buerger: Molecular cytogenetic investigations of synchronous bilateral breast cancer. J Clin
Pathol 56(9), 660-665 (2003)
Musani V1, Sabol M, Car D, Ozretic P, Oreskovic S, Leovic D, Levanat S. LOH of PTCH1 region in BCC
and ovarian carcinoma: microsatellite vs. HRM analysis. Front Biosci (Elite Ed). 2012 Jan 1;4:1049-57.
DOI: 10.2741/440 (postprint version)
Abbreviations
LOH: loss of heterozygosity, HRM: high resolution melting, PTCH1: Patched1 gene, BCC: basal
cell carcinoma, Hh: Hedgehog protein, Ptch: Patched protein, Smo: Smoothened protein, OC:
ovarian carcinoma, UTR: untranslated region, STR: short tandem repeat, SNP: single
nucleotide polymorphism, PCR: polymerase chain reaction, dNTP: deoxyribonucleotide
triphosphate, dHPLC: denaturating high performance liquid chromatography, Mb:
megabase, MLPA: multiplex ligation-dependent probe amplification, CGH: comparative
genomic hybridization, HET: heterozygous, HO: homozygous, N: normal, UI: uninformative,
ND: not done
Key words
loss of heterozygosity, high resolution melting, PTCH1, basal cell carcinoma, ovarian
carcinoma
Corresponding author
Sonja Levanat, PhD
Division of Molecular Medicine, Rudjer Boskovic Institute, Bijenicka 54, 10002 Zagreb,
Croatia
phone number: +385 (1) 4561110
fax number: +385 (1) 4561010
e-mail: [email protected]

Musani V1, Sabol M, Car D, Ozretic P, Oreskovic S, Leovic D, Levanat S. LOH of PTCH1 region in BCC
and ovarian carcinoma: microsatellite vs. HRM analysis. Front Biosci (Elite Ed). 2012 Jan 1;4:1049-57.
DOI: 10.2741/440 (postprint version)
Running title
LOH in PTCH1: microsatellites vs. HRM

Musani V1, Sabol M, Car D, Ozretic P, Oreskovic S, Leovic D, Levanat S. LOH of PTCH1 region in BCC
and ovarian carcinoma: microsatellite vs. HRM analysis. Front Biosci (Elite Ed). 2012 Jan 1;4:1049-57.
DOI: 10.2741/440 (postprint version)
7. FIGURE LEGENDS
Figure 1. Microsatellite analysis for marker rs71366293 showing two typical LOH results
compared to control sample. LOH is calculated from peak height ratio using the following
formula: LOH<0.66<normal<1.5<LOH.
Musani V1, Sabol M, Car D, Ozretic P, Oreskovic S, Leovic D, Levanat S. LOH of PTCH1 region in BCC
and ovarian carcinoma: microsatellite vs. HRM analysis. Front Biosci (Elite Ed). 2012 Jan 1;4:1049-57.
DOI: 10.2741/440 (postprint version)
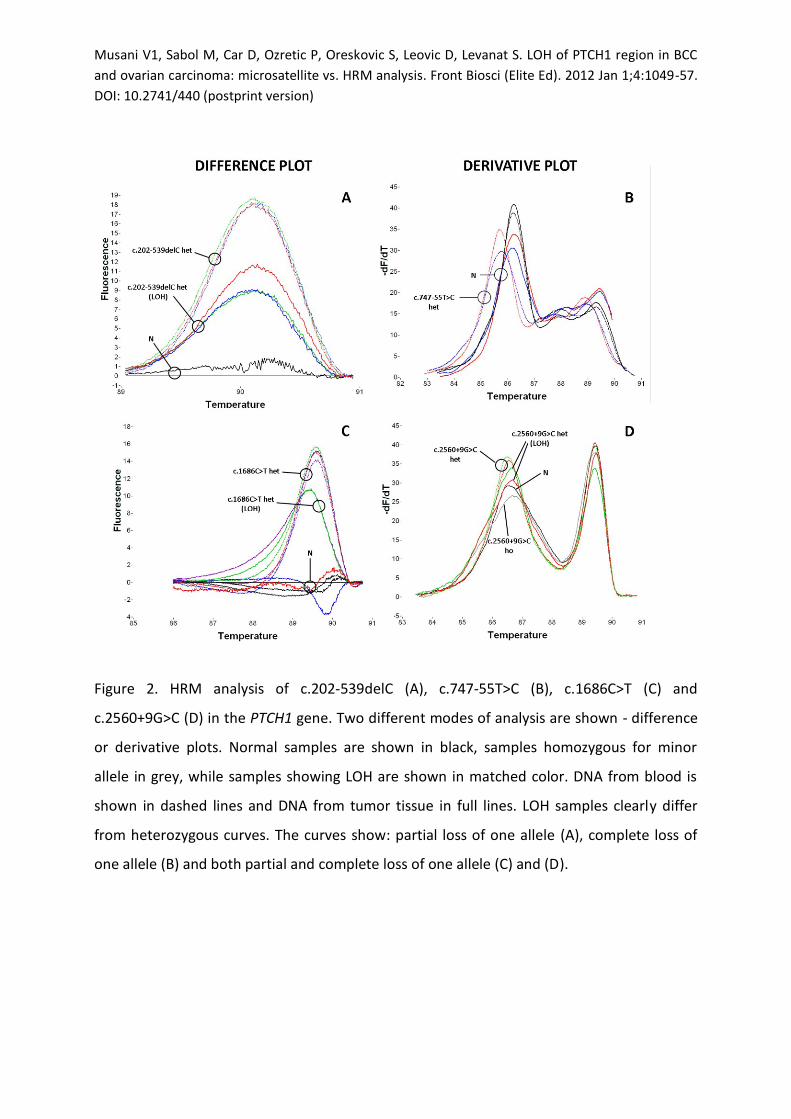
Figure 2. HRM analysis of c.202-539delC (A), c.747-55T>C (B), c.1686C>T (C) and
c.2560+9G>C (D) in the PTCH1 gene. Two different modes of analysis are shown - difference
or derivative plots. Normal samples are shown in black, samples homozygous for minor
allele in grey, while samples showing LOH are shown in matched color. DNA from blood is
shown in dashed lines and DNA from tumor tissue in full lines. LOH samples clearly differ
from heterozygous curves. The curves show: partial loss of one allele (A), complete loss of
one allele (B) and both partial and complete loss of one allele (C) and (D).
Musani V1, Sabol M, Car D, Ozretic P, Oreskovic S, Leovic D, Levanat S. LOH of PTCH1 region in BCC
and ovarian carcinoma: microsatellite vs. HRM analysis. Front Biosci (Elite Ed). 2012 Jan 1;4:1049-57.
DOI: 10.2741/440 (postprint version)
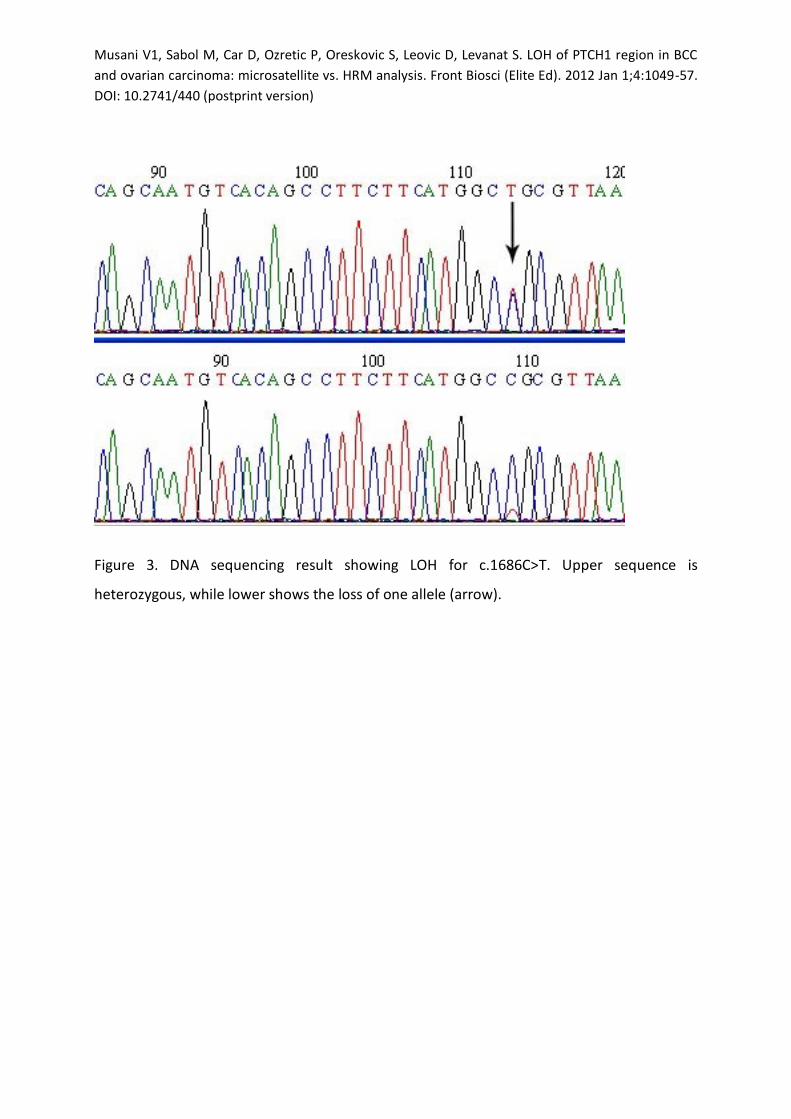
Figure 3. DNA sequencing result showing LOH for c.1686C>T. Upper sequence is
heterozygous, while lower shows the loss of one allele (arrow).

Musani V1, Sabol M, Car D, Ozretic P, Oreskovic S, Leovic D, Levanat S. LOH of PTCH1 region in BCC
and ovarian carcinoma: microsatellite vs. HRM analysis. Front Biosci (Elite Ed). 2012 Jan 1;4:1049-57.
DOI: 10.2741/440 (postprint version)
Figure 4. The prevalence of PTCH1 LOH in BCC and OC. Lighter bars represent samples
without LOH, darker bars represent samples with LOH. No statistically significant difference
was observed between BCC and OC (P value for Fisher's exact test was 0.278).

Musani V1, Sabol M, Car D, Ozretic P, Oreskovic S, Leovic D, Levanat S. LOH of PTCH1 region in BCC
and ovarian carcinoma: microsatellite vs. HRM analysis. Front Biosci (Elite Ed). 2012 Jan 1;4:1049-57.
DOI: 10.2741/440 (postprint version)
8. TABLES
Article in press - uncorrected proof

Musani V1, Sabol M, Car D, Ozretic P, Oreskovic S, Leovic D, Levanat S. LOH of PTCH1 region in BCC
and ovarian carcinoma: microsatellite vs. HRM analysis. Front Biosci (Elite Ed). 2012 Jan 1;4:1049-57.
DOI: 10.2741/440 (postprint version)
Table 1 – LOH status of BCC (BCC1-BCC25) and OC (OC1-OC12) samples for four microsatellite loci in PTCH1 gene region and 7 common SNPs detected with HRM in PTCH1 gene. N – normal, HET – heterozygous, HO – homozygous for minor allele, LOH – loss of heterozygosity, UI – uninformative, ND – not done, - - PCR amplification unsuccessful. No lines between samples – two samples from the same patient.
Marker
D9S
196
rs7
136
6293
D9S
287
D9S
180
LOH Status
rs1
136
2678
rs2
297
087
rs5
746
88
rs1
805
155
rs2
066
836
rs2
066
829
rs3
575
64
LOH Status
Sample
c.20
2-5
39d
elC
c.74
7-5
5T>C
c.15
04-5
1C>G
c.16
65T>
C
c.16
86C
>T
c.25
60+9
G>C
c.39
44C
>T
BCC1 HET HO HO HET no LOH N N HET N N N HET no LOH
BCC2 HO HO HO HO UI N N HO N N N HO UI
BCC3 LOH HO HO LOH LOH N HO N N HO N LOH LOH
BCC4 HET HO HO HET no LOH N HO N N HO N HET no LOH
BCC5 HET HO HET HO no LOH N HET N N HET HET N no LOH
BCC6 LOH HO HO LOH LOH N N LOH N N N LOH LOH
BCC7 HET HO HO LOH LOH N N LOH N N N LOH LOH
BCC8 HO LOH LOH LOH LOH N N N LOH N LOH LOH LOH
BCC9 HO HO HO HET no LOH N N HET N N N HET no LOH
BCC10 HET HO HET HO no LOH N N HET N N N N no LOH
BCC11 HET HO HET HO no LOH N N HET N N N N no LOH
BCC12 HET HO HET HO no LOH N N N N N N HET no LOH
BCC13 HO HO HO HO UI N N HO N N N HO UI
BCC14 HO HO HO HO UI N N HO N N N HO UI
BCC15 LOH HO HO LOH LOH N N LOH N N N LOH LOH
BCC16 HO HO HO LOH LOH N N LOH N N N N LOH
BCC17 HO HO HO HET no LOH N N HET N N N N no LOH
BCC18 HO HO HO LOH LOH N N - N N N N UI
BCC19 HO HO HO HET no LOH N N HET HET N HET HET no LOH
BCC20 HO LOH LOH LOH LOH LOH LOH N N LOH LOH N LOH
BCC21 HO HO HO HET no LOH N N LOH LOH N LOH LOH LOH
BCC22 HO HO HET HET no LOH N N HET N N HET N no LOH
BCC23 ND LOH ND ND LOH N N LOH N N LOH N LOH
BCC24 ND LOH ND ND LOH N LOH LOH N LOH LOH LOH LOH
BCC25 ND HET ND ND no LOH N HET HET N HET HET HET no LOH
OC1 - LOH LOH LOH LOH LOH LOH N N LOH LOH LOH LOH
OC2 HET HET HET HO no LOH HET N HET N HET HET HET no LOH
OC3 HO HO HET HO no LOH HO N HET N HET HET N no LOH
OC4 HO HET HET HO no LOH HET N HET N HET HET HET no LOH
OC5 HO HO HO HET no LOH N N N N N N N UI
OC6 - HO - - UI N HO N N HO HO N UI
OC7 HO LOH ND ND LOH LOH LOH HO N LOH LOH N LOH
OC8 ND HET ND ND no LOH HET N HET N N HET N no LOH
Musani V1, Sabol M, Car D, Ozretic P, Oreskovic S, Leovic D, Levanat S. LOH of PTCH1 region in BCC
and ovarian carcinoma: microsatellite vs. HRM analysis. Front Biosci (Elite Ed). 2012 Jan 1;4:1049-57.
DOI: 10.2741/440 (postprint version)
OC9 ND HET ND ND no LOH HET N N HET HET HO N no LOH
OC10 HO HO HO HO UI N N N N HET HET N no LOH
OC11 ND LOH ND ND LOH LOH LOH N N LOH LOH N LOH
OC12 ND HET ND ND no LOH HET HET HET N HET HET HET no LOH
Table 2 – Inter-rater agreement between microsatellite and HRM analyses. Upper half of the
table – all samples. Lower half – samples informative for both methods.
Microsatellite Analysis
uninformative no LOH LOH Total
High resolution Melting Analysis
uninformative 4 1 1 6 (16.2%)
no LOH 1 17 0 18 (48.6%)
LOH 0 1 12 13 (35.1%)
Total 5 (13.5%) 19
(51.4%) 13 (35.1%) 37
Kappa 0.821
Microsatellite Analysis
no LOH LOH Total
High resolution Melting Analysis
no LOH 17 0 17 (56.7%)
LOH 1 12 13 (43.3%)
Total 18 (60 %) 12
(40%) 30
Kappa 0.932
Related Documents