tr) ì c,) G DBTnCTIOI\ OT DNMETHYLATION IXHTUTING FUXCICIDE RESISTANCE IN THE Gn¡pEVINE POWNERY Mrr,OEW FUXCUS, Ur,tctNULA NECAToR Saxon¡'' SnvoccHIA B.Ag.Sc (Hons), The University of Adelaide Thesis submitted for the degree of Doctor of Philosophy at Adelaide University Department of Applied and Molecular Ecology Faculty of Agricultural and Natural Resource Sciences September 2001.

Welcome message from author
This document is posted to help you gain knowledge. Please leave a comment to let me know what you think about it! Share it to your friends and learn new things together.
Transcript
tr) ì c,) G
DBTnCTIOI\ OT DNMETHYLATION IXHTUTINGFUXCICIDE RESISTANCE IN THE
Gn¡pEVINE POWNERY Mrr,OEW FUXCUS,
Ur,tctNULA NECAToR
Saxon¡'' SnvoccHIAB.Ag.Sc (Hons), The University of Adelaide
Thesis submitted for the degree ofDoctor of Philosophy
atAdelaide University
Department of Applied and Molecular EcologyFaculty of Agricultural and Natural Resource Sciences
September 2001.
T¡,nr,n Or CONTENTS
AssrRAcr I
AcxNowTBDcMENTS IV
PusLrcA.rIoNs AND Coursn¡Nce PnocnnDINGS V
AenREvrArIoNS........ ........... vIl
CHAPTER 1.0 Lrrnn¡.runn RnvIE\ry .......................................................... L
l.l lNrnorucrloN ........1
1.2 Hnronv aND EcoNoMIc IMPoRTANcE oF U. ¡'løctron .........,..2
L.3 TuB causar, FrlNcus AI\D Hosr sPEcIALIsATIoN......... ..............4
L.4 DrsB¡,sE EpIDEMIoLoGY .........5
1.4. 1 Disease symptoms ................. 5
L4.2 Disease cycle ..... 6
1.4.3 Factors affecting disease development.'.....'....'... .8
1.5.1 Quarantine and cultural control....... 11
1.5.2 Biological control .................... t2
1.5.3 Breeding for disease resistance 12
1.6.1 Sulphur and other 'multi-site' fungicides. I4
I.6.2 The demethylation inhibiting fungicides.........'.......'. 15
I.6.2.I DMIs: biochemistry, mode of action, and inhibition of sterol biosynthesis ....18
1.7 FuNcrcIDE REsrsrANcE .........20
1.7.1 Resistance to DMI fungicides ......... 2t
I.7.zDlvtr resistance in Uncinula necator ...............22
...............241.7. 3 Cross-resistance
1.7.4 Mechanisms of resistance to DMI fungicides 26
L.8 GnNBucs AND popLJLATIoN DYNAMICS oF FLJNcTcIDE RESISTANCE ........28
1.8.1 Origins of fungicide resistance 30
1.8.2 Genetics of DMI resistance ................ 33
L.9 MoNnoRINc FUNcIcIDE REsISTANcE ............... ......35
1.9.1 Bioassays for fungicide sensitivity.... 36
I.g.ZManagement of fungicide resistance '.....'..........38
1.L0 Molpcr.rLARMARKERs .......40
1.10.1 RFLP markers .... 4t
I.10.2 PCR markers .43
1.I0.2.I RAPD markers .. 43
LI0.2.2 PCR detection of fungicide resistance 44
1.10.3 Applications of molecular markers to U. necator .46
1.11 SurvrrvrARy .......... ..,,....,...........47
1.12 RnsnrRcn oBJEcrrvES........ ...................................48
CHAPTER 2.0 Gnwnnal Mnrnnr¡.Ls aND Mnrrroos.............................. 50
2.1CotrncrroNoF U. NECATqR sAMPLES .....................50
2.2PnoptcATroN oF GLASSHoUsE-cRowN cRAPEVINEs....... .......50
2.3 Dnr¡,cHED LEAF cLJLTLIRE aND IsoLATIoN oF sINGLE-sPoRE ISoLITnS...................56
2.4 MrcnopRopacATroN oF GRApEVTNESrN vrrRo AND cLJLTURE MAINTENA,NcE..........58
2.5 Mlss pRoDUCTToN AND coLLEcrIoN oF coNIDrl............. ......58
2.6 DNA EXTRACTIONFROM CONIDIA ..........60
2.7 DNA EXTRACTION FROM U. ¡,IncITon INFECTED MICROPROPAGATED GRAPEVINE
PLANTLETS AND FIELD MATERIAL ..................61
CHAPTER 3.0 lonNrrrrcarloN oF MATING TYPES................................. 63
3.L lNrnooucrroN ......63
3.2 M.rrBnraLS aND Mnrnots .....................64
3.2.I ldentification of mating types.............. 64
3.2.2Mating of isolates in vitro 65
3.3.1 Identification of mating types 66
4.2.I U. necator samples....
4.2.2 Culture of U. necator isolates . 74
4.2.3 Preparation of fungicides 74
4.2.4 Bioassay for fungicide sensitivity 75
4.2.4.L Preparation, inoculation and incubation of leaf discs ......... ...........75
4.2.4.2 Measurement of hyphal length 77
4.2.4.3 Determination of 507o effective concentration (ECso) and resistance factor
values 78
4.2.5Development and morphology of U. necator after treatment with triadimenol......80
4.2.5.1 Preparation of triadimenol and experimental set-up ......................80
804.2.5.2 Microscopy and data analysis.
4.3.1 Measurement of hyphal length 81
4.3.2Determination of 50Vo effective concentration (ECso) and resistance factor values
81
4.3.3 Cross-resistance.. 94
4.3.4Development and morphology of U. necator aftq treatment with triadimenol......95
4.4 DrscussroN......... ....................99
CHAPTER 5.0 DNA SneunNcn ANALysrs oF rHE CL4o(-DEMETHYLASE
GrcNn (CYP51) AND PCR AvrplrnrcarloN oF A SpncrrrcAf.frnfre.............................................................................108
5.l INrnonucrroN .....108
5.2 Mlrnnrar,s AND Mnrnons ...................109
5.2.1 U. necator isolates..... 109
5.2.2 Assessment of methods for DNA template preparation from conidia and U
necator-infected grapevine materia1................ .........110
5.2.3 PCR primers 110
5.2.4 PCR amplification and cloning of the U. necator CYP51 gene............................I12
5.2.5 Automated DNA sequencing and analysis 113
5.2.6 PCR amplification of a specific allele.... 115
5.2.6.1Optimisation of PCR amplification of a specific allele of CYP51 ................115
5.2.6.2 Nested PCR amplification of a specific allele...... ......117
5.3 Rrsur,rs............. ...................119
5.3.1 Cloning and sequence analysis of the U. necator CYP51 gene from two Australian
isolates 119
5.3.2 PCR amplification of a specific allele associated with DMI resistance................I24
5.4 DrscussroN......... ..................132
CHAPTER 6.0 GnNnrrc B^tsrs oF Rnsrsraxcn ro Tnr¡.orvrnNolIN I/NCTNULA NÛCATqR....................... ............... 138
6.2.I U. necator isolates............. t39
6.2.2 Crossing of U. necator isolates and production of progeny.... ............139
6.2.3 Identification of mating types................ r43
6.2.4 Fungicide testing of progeny ............... 143
6.2.5 DNA extraction and nested PCR amplification of a specific allele (PASA) ........I43
6.2.6 Genetic analysis of parental and progeny isolates.. ...........I44
6.3 Rrsur,rs............. ..................145
6.3.1 Crossing of U. necator isolates and production of progeny.... r45
6.3.2Identification of mating types......... .................I47
6.3.3 Sensitivity of progeny to triadimenol............ ....................147
6.3.4 Nested PCR amplification of a specific allele (PASA) in progeny isolates..........151
6.3.5 Genetic analysis of parental and progeny isolates.. t54
CHAPTER 7.0 GBrvenal DrscussroN 160
CHAPTER 8.0 RnnnnnNCNS 168
Appnxorx.. 185
AssrRAcr
Grapevine powdery mildew caused by Uncinula necator (Schw.) Burr. is of major
economic importance to the grape and wine industry worldwide. Prior to this research
little was known about the sensitivity of (J. necator to DMI (Demethylation inhibiting)
fungicides in Australian vineyards. In this study, baseline sensitivities were established for
two commonly used DMIs (triadimenol and fenarimol) and a PCR-based assay was
developed to detect triadimenol resistance in (J. necator on infected grapevine material
collected from the field.
(1. necator isolates were collected from vineyards with no previous exposure to
DMIs ('unexposed' population) and from vineyards in which DMI sprays had failed to
control powdery mildew ('selected' population). Single-spore isolates were established
and maintained on micropropagated grapevines in vitro. The mating type of each isolate
was established by pairing with isolates of known mating type. A bioassay for fungicide
sensitivity (Erickson and 'Wilcox, 1997) was modified and used to test 60 single-spore
isolates of (J. necator for sensitivity to triadimenol. Of these, 34 were tested for sensitivity
to fenarimol. Median EC5¡ values for the unexposed population were 0.065 mg/L for
triadimenol and 0.081 mglL for fenarimol. For the selected population, ECso values were
0.83 mg/L for triadimenol and 0.191 mglL for fenarimol. Cut-off EC5s values, used to
define individual isolates as resistant, were >0.42 mgll- for triadimenol and >0.I2 mg/L for
fenarimol. A moderate level of cross-resistance between triadimenol and fenarimol was
observed following, first, correlation analysis of ECso values and, second, the use of the
EC5s cut-off values to group isolates as sensitive or resistant.
Using PCR @élye et aL, L997c), a DNA fragment, encompassing the target site of
DMI fungicides (14cr-demethylase), was amplified in 54 Australian isolates of U. necator.
u
DNA fragments from triadimenol-sensitive and -resistant isolates of U. necator were
cloned and sequenced, and an A-to-T point mutation at nucleotide 462 íden1.jfied in the
resistant isolate. Both sequences contained an open reading frame encoding 524 amlno
acids. Alignment of the deduced amino acid sequence from the sensitive isolate to
sequences in the GenBank data base revealed L00Vo homology to another triadimenol-
sensitive isolate of U. necator @élye et aI., I997c) and the sequence for the resistant
isolate showed I007o homology to a resistant isolate of U. necator also displaying the same
point mutation @élye et aI., I997d). Using published primers (Délye et a1.,1997d) and
primers designed in this study, a DNA fragment encompassing the A-to-T mutation was
amplified only in isolates of (J. necaror displaying EC5s values >0.42 mgll-. The PCR was
performed on both (J. necator-infected micropropagated plantlets and field material.
A triadimenol-sensitive and a -resistant isolate were crossed and 27 progeny were;
analysed for mating type, fungicide sensitivity (bioassay), presence of the A-to-T mutation
using the PCR assay and RFLP analysis using the multi-copy probe pUnl22-I1 (Stummer
et a1.,2000). All progeny isolates were of the 'minus' mating type. Five progeny were
classed as triadimenol-sensitive and 22 as tnadimenol-resistant using the bioassay. Based
on the PCR assay, mating type, and hybridisation with the pUn122-11 probe, all progeny
were identical to the resistant parent. This suggested the possibility of selfing amongst
isolates of U. necator.
This study has provided baseline sensitivity data for triadimenol and fenarimol in
Australian isolates of U. necator and has shown that, since the introduction of DMI
fungicides into Australian vineyards, there has been a shift in sensitivity to triadimenol and,
to a lesser extent, fenarimol. This information coupled with the PCR diagnostic test for
resistance will be useful when developing disease management strategies that reduce and
delay the development of resistance to DMI fungicides.
lll
Dpcr,¡,n¡.TroN
This work contains no material which has been accepted for the award of any otherdegree or diploma in any university or other tertiary institution and, to the best of myknowledge and belief, contains no material previously published or written byanother person, except where due reference is given in the text.
I give consent to this copy of my thesis, when deposited in the University Library'being available for loan or photocopying.
Signed Date ]Þl:l 2-Oc)\
lv
AcTNOwLEDGMENTS
I wish sincerely to thank my supervisors Dr Eileen Scott, Dr Belinda Stummer, Dr Robyn
van Heeswijck and Dr Trevor Wicks for their advice, lengthy discussions, encouragement
and support during the production of this thesis. I particularly wish to thank Dr Eileen
Scott and Dr Belinda Stummer for their effort and time taken to proof read this thesis.
Also, I am indebted to Dr Robyn van Heeswijck who agreed to supervise me following the
departure of a previous supervisor, Dr Dara Melanson.
I also wish to thank:
o The first Cooperative Research Centre for Viticulture (CRCV) for initially
supporting this project and the Grape and 'Wine Research and Development
Corporation (GWRDC) for providing further support.
o Mr TimZanker, Ms Vicki Barrett, Ms Karolina Pniewska and Mr Martin Barski for
providing technical assistance in the tissue culture of grapevines.
o Mr Steven Kurtz, Mr Peter Magarey, Dr Bob Emmett and Ms Sarah Emms for
providing diseased samples and the viticulturists for continued interest in this study.
o Bayer Australia Ltd and Dow AgroSciences for providing technical grade
fungicides.
o Dr Giovanni Del Sorbo (Institute of Plant Pathology, The University of Naples
"Federico II", Italy) for providing valuable information and clones for preliminary
work regarding ABC transPorters.
o Dr Cyndi Bottema for discussions on the development of the PASA technique.
o Mr Rob Skinner (Flinders University of South Australia DNA Sequencing Core
Facility) for DNA sequence analyses.
o Ms Michelle Lorimer (Biometrics SA) for statistical advice.
o Ms Emily Shepherd and Ms Sharon Clapham for photographic assistance.
. Special thanks to Ms Belinda Rawnsley, Dr Nicole Thompson, members of N107
and N105 labs and other members of the Department of Applied and Molecular
Ecology for continually providing a friendly work environment.
o My family and Benjamin Stodat for their continued support and patience on this
long and challenging road called study.
v
PUSLTCATIONS AND CO¡WNNNNCE PNOCNNDINGS
Publications in industry journals
Savocchia, S., Stummer,8., Wicks, T., Van Heeswijck, R. and Scott, E. (2000) Resistance
of grapevine powdery mildew to DMI fungicides in Australian vineyards. The
Aust ralian Grap e grow e r and Winemake r 440: 4l -44.
Savocchia, S., Stummer, 8., Wicks, T. and Scott, E. (1999). Detection of DMI resistance
among populations of powdery mildew in Australia. The Australian Grapegrower and
Winemaker 429:39-4I.
Conference proceedings
Savocchia, S., Stummer, B.E., Melanson, D.L., Scott, E.S. and Wicks, T.J. (1999).
Detection of DMI fungicide resistance among populations of Uncinula necator inAustralia. Abstracts, 12th Biennial Australasian Plant Pathology Society Conference,
Canberra, Australia, 27 -30 September . pp. 221.
Savocchia, S., Melanson, D.L., Stummer, I}.E., Scheper, R.W.A., Brant, B. and Scott, E.
(1999). Genetic analysis of fungal pathogens of grapevines: a practical approach. InAbstracts, IXth International congress of bacteriology and applied microbiology and
International congress of mycology, Sydney, Australia, 16-20 August. pp. 192.
Savocchia, S., Stummer, 8.E., Melanson, D.L., Scott, E.S. and V/icks, T.J. (1999).
Detection of DMI fungicide resistance among populations of Uncinula necator inAustralia. In Abstracts, lst International Powdery Mildew Conference, Avignon,France, 29 August-3 September. pp. 45.
Savocchia, S., Stummer, 8.E., Whisson, D.L., 'Wicks, T.J. and Scott, E.S. (1998).
Detection of DMI fungicide resistant strains of Uncinula necator in Australianvineyards. In Abstracts, Vol 3, 7th International Congress of Plant Pathology,
Edinburgh, Scotland, 9-16 August.
Savocchia, S., Stummer, B.E., Whisson, D.L., Wicks, T.J. and Scott, E.S. (1998).
Detection of DMI fungicide resistant strains of Uncinula necator in Australianvineyards. In Abstracts, Tenth Australian Wine Industry Technical Conference,
Sydney, Australia, 2-5 August. Blair, R. J., Sas, A. N., Hayes, P. F. and Høj, P. B.(Eds.). pp.282.
vl
Savocchia, S., Stummer, 8.E.,'Whisson, D.L., Wicks, T.J. and Scott, E.S. (1998)' DNtr
Fungicide Resistance in Uncinula necator in Australian Vineyards: Detection and
Development of New Tools. In, SARDI Research Report Series No.50. Proceedings ofthe Third International'Workshop on Grapevine Downy and Powdery Mildew, Loxton,
Australia, 2000. 2I-28 March. Magarey, P. A., Thiele, S. 4., Tschirpig, K. L., Emmett,
R. W., Clarke, K. and Magarey, R. D. (Eds.).
Savocchia, S., Stummer, B.S., Whisson, D., Wicks, T.J. and Scott, E.S. (1997). DNtr
resistance in Uncinula necalor in Australian vineyards: detection and development ofnew tools. In Abstracts, 2nd Australasian Mycological Society Conference, Adelaide,
Australia. 28 September - 3 October.
Savocchia, S., Stummer, B.S., 'Whisson, D., 'Wicks, T.J. and Scott, E.S. (1997). DlvIIresistance in Uncinula necator in Australian vineyards: detection and development ofnew tools. Abstracts, Inaugural South Australian Viticulture Technical Conference,
Adelaide, SA, 15 September.
Scott, E. S., Savocchia, S. and Wicks, T.J. (1997). Resistance to DMI fungicides in the
grapevine powdery mildew fungus. Paper presented at the Riverlink Grapevine Pest
and Disease Review Meeting, Loxton, South Australia, 18th June.
vll
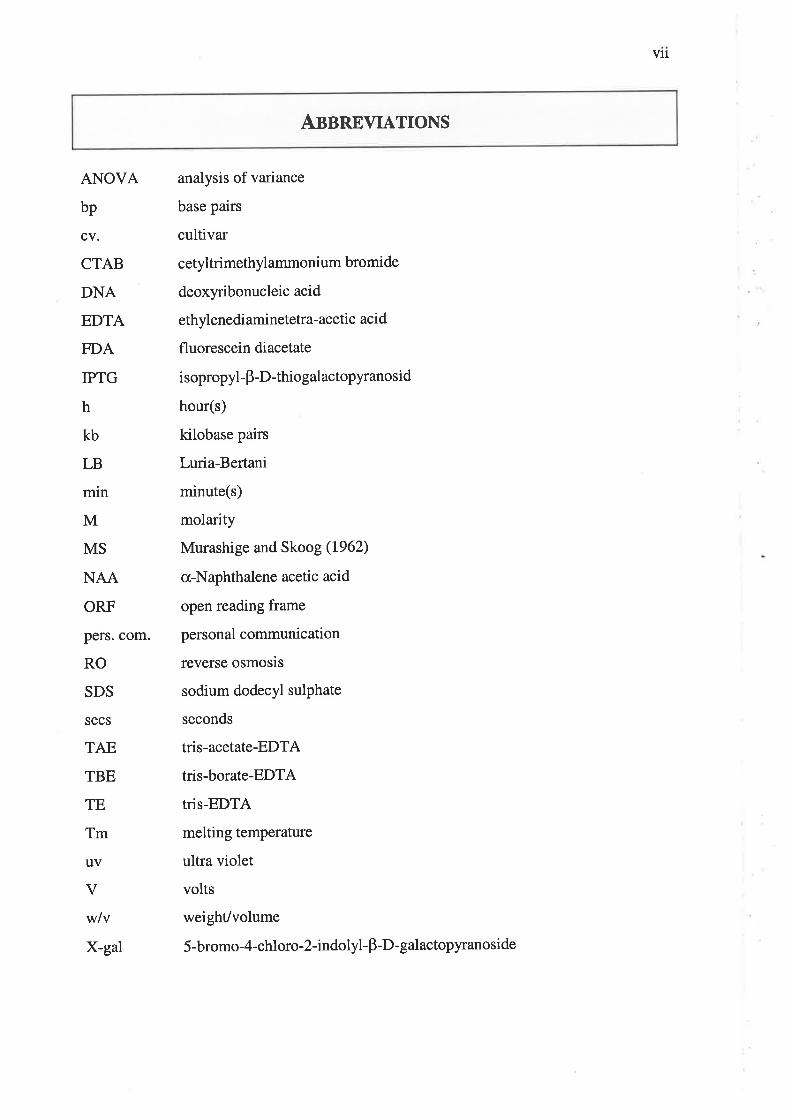
AnnnnVIATIONS
ANOVA
bp
cv.
CTAB
DNA
EDTA
FDA
IPTG
h
kb
LB
min
M
MS
NAA
ORF
pers. com.
RO
SDS
secs
TAE
TBE
TE
Tm
uv
V
w/v
X-gal
analysis of variance
base pairs
cultivar
cetyltrimethylammonium bromide
deoxyribonucleic acid
ethylenediaminetetra-acetic acid
fluorescein diacetate
isopropyl- p-D-thiogalactopyranosid
hour(s)
kilobase pairs
Luria-Bertani
minute(s)
molarity
Murashige and Skoog (L962)
a-Naphthalene acetic acid
open reading frame
personal communication
reverse osmosis
sodium dodecyl sulphate
seconds
tris-acetate-EDTA
tris-borate-EDTA
tris-EDTA
melting temperature
ultra violet
volts
weight/volume
5 -bromo-4-chloro-2-indolyl- p -D- galactopyranoside
1
CHAPTER 1.0
Lrrnn¡TURE Rnvrnw
1.1. IurnoDUCTIoN
Grapevine powdery mildew caused by [Jncinula necator (Schw.) Burr. is of major
economic importance on cultivated grapevines worldwide. It is a destructive disease,
occurring in all viticultural regions of Australia. When fungicides are not applied, the
disease can cause complete crop loss in some seasons. Viticulturists have used sulphur to
control grapevine powdery mildew for over 100 years, however its use has limitations. The
systemic demethylation inhibiting (DMIs) fungicides were first introduced in the late 1970s
and have since been widely and intensively used worldwide in all viticultural regions'
Consequently, a decrease in sensitivity of grapevine powdery mildew to these fungicides
has been reported in Europe, South America and USA (Steva et aL, 1988; Steva et aI.,
1989; Gubler et a1.,1994).
Recently, efforts have been directed towards the use of molecular techniques that
allow the rapid detection of DMl-resistant isolates within the vineyard. The 14ct-
demethylase (target-site of DMIs) has been cloned and sequenced in a number of plant
pathogenic fungi, including (J. necator @élye et al., I997c). A mutation in the 14cr-
demethylase gene is thought to be responsible for the appearance of DMI resistant isolates
of (J. necatorin French vineyards (Délye et al., I997d). Prior to this study, it was not
known whether Australian populations of U. necator showed reduced sensitivity to DMIs,
however, there had been reports of poor control of powdery mildew in some Australian
vineyards. 'Whether this could be attributed to poor management practices or to the
development of resistance was yet to be known.
2
In this review, the causal organism of the disease, the use of DMIs for the control of
grapevine powdery mildew and the subsequent development of fungicide resistance will be
discussed. The molecular genetics of plant pathogenic fungi, fungicide resistance and the
tools used to study these are reviewed to determine the most suitable approach to
understanding the development and management of fungicide resistance in U. necator. A
statement of the objectives of this study follows the literature review.
1.2 HIsTORY AND ECONOMIC IMPORTANCE OF U. NECATOR
(J. necator was first described in eastern North America in 1834 by Schweinitz and
the disease was later observed in a glasshouse in England in 1847 (Pearson and Gadoury,
1992). By the 1850s, the fungus had spread to all major grape-growing areas of Europe
where it caused considerable crop loss (Bulit and Lafon, 1978). In 1850 it was discovered
that the disease could be controlled with sulphur. Application of sulphur was successful in
killing the powdery mildew on affected shoots preventing further disease spread.
(J. necator appears to have been introduced into Europe on American grapevines,
suggesting its origin was from Vitis species native to North America. Furthermore, U.
necator appears to have been present in Australia since at least 1866 (Emmett et al., 1990).
The sexual stage of U. necator is characterised by the formation of cleistothecia.
Cleistothecia have been observed in Europe since 1893, (Yarwood, 1978), however, it was
not until 1984 that cleistothecia were found in Australia (Wicks and Magarey, 1985). One
possible explanation for the sudden appearance of cleistothecia in Australia is that an
opposite mating strain of (J. necator, necessary for the production of cleistothecia, was
introduced (Wicks and Magarey, L995). The heterothallic nature of U. necator was
confirmed in Australia by Evans et al. (1997a) who found that two mating types of U.
3
necetor, Ma(+) and Mat(-), exist in Australian vineyards. Heterothallism was previously
observed in isolates of (J. necator in other regions of the world (Smith, L970; Gadoury and
Pearson, 1991).
In 2000 a record 1.3 million tonnes of grapes was produced in Australia from 146,
177 hectares of grapevines (Anon, 2000). The economic importance of a disease can be
measured in terms of direct crop loss (quantity and quality) and also the cost of disease
management and research (Emmett et al., 1990). Grapevine powdery mildew has been
estimated to cost the Australian wine and grape industry $30 million per year; $20 million
directly due to yield loss and $10 million due to the use of chemicals to control the disease
(Wicks et al., 1997). In addition, in perennial crops, consideration must be given to the
effects of disease development in one season on the development of disease in future
seasons (Pool et a1.,1984).
In order to obtain information on the economic impact of powdery mildew, Pool et
al. (1984) studied the relationship between disease development on Rosette (Vitis
interspecific hybrid) grapevines and quantity and quality of fruit in New York. When
unsprayed and sprayed vines were compared a 407o reduction in vine size was observed in
unsprayed vines. This was then associated with a 65Vo reduction of vine capacity and,
furthermore, bud fruitfulness was adversely affected by powdery mildew. In grape
production, the impact of disease on fruit quality must also be considered. For example,
bunches with as little as 37o disease may be rejected by wineries due to the off-flavours and
greater acidity caused to the resulting wine (Pool et aL,1984). Table grapes infected with
powdery mildew become unmarketable due to skin scarring and secondary infections due
to Botrytis cinerea and other sour-rot organisms gaining entry when berries split.
4
1.3 THn CAUSAL FUNGUS AND HOST SPECIALISATION
(J. necator is an obligately biotrophic fungus belonging to the family Erysiphaceae
and the sub-family Erysipheae. The hyphae are semi-persistent septate, hyaline and 4-5
pm in diameter. Conidiophorcs (6.2-7.5 pm) form perpendicularly on the hyphae. Conidia
(32-39 x l7-2I pm) are hyaline, cylindro-ovoid and are formed singly but may accumulate
in long chains. Cleistothecia are spherical and hyaline when immature, but yellow and
darken as they mature. Mature cleistothecia are 84-105 pm in diameter, dark brown and
bear equatorially inserted, upwardly directed, multi-septate appendages, one to six times as
long as the diameter of the ascocarp. Cleistothecia contain four to six, rarely six to nine
ovate to subglobose asci (50-60 x 25-40 pm). Asci contain four to six ovate to ellipsoid,
hyaline ascospores (15-25 x 10-14 ¡rm) (Pearson and Gadoury, 1992).
L,U. necator infects members of the Vitaceae, chiefly Vitis viniferg,, but also
Parthenocisszs spp. and Ampelopsis sp. Pathogenic specialisation was not found among
isolates of (J. necator collected from various genera of the Vitaceae (Gadoury and Pearson,
1991).
A number of reports have been made on the effects of leaf and fruit maturity on
grapevine powdery mildew (Delp, 1954; Doster and Schnathorst, 1985; Chellemi and
Marois, 1992). Field and glasshouse investigations by Delp (1954) showed that U. necator
developed poorly on mature leaves. Leaves, newly opened to 2 month old were studied
periodically; no significant difference in germination was found on leaves of different ages,
but infection, growth and sporulation were inversely proportional to leaf age. On leaves up
to 1 week old, 607o germination, 40Vo infection and radial colony growth of 300pm was
observed. In contrast, only I\Vo infection and radial growth of 150 pm were observed in 2
month old leaves, while germination remained the same. Berries are most susceptible
5
when sugar levels are below 67o Qelp,1954). However, once infection has occurred, the
fungus will continue to sporulate as berries mature to a sugar content of at least I5Vo.
These observations are in accordance with those of Chellemi and Marois (1992) who
showed that the susceptibility of berries to grapevine powdery mildew decreased
exponentially with the accumulation of soluble solids ("Brix). They indicated that berries
become resistant to new infections above 7o Brix.
1..4 DTSnNSE EPIDEMIOLOGY
1.4.1 Disease symptoms
The powdery mildew fungus can infect all green tissues of the grapevine (Pearson
and Goheen, 1988). The disease appears as a whitish-grey dust on young shoots, tendrils
and leaves. Small, yellow-green blotches develop on the upper surface of leaves (Bulit and
Lafon, 1973) and the presence of mycelia with conidiophores bearing conidia gives a
whitish-grey appearance. Infected, expanding leaves may curl upward and become
distorted and stunted (Pearson and Gadoury, 1992). Infected shoots appear with an ash-
grey layer of spores and become stunted. Reddish-brown weblike patterns appear on the
surface of dormant canes (Bulit and Lafon, 1978; Sall and Teviotdale, 1981).
Powdery mildew can also spread rapidly onto the berries and bunch stalks. The
bunch stalks may become brittle and bunches become withered when they are immature.
When mature, berries may crack, thereby providing entry sites for other organisms such as
B. cinerea (Bulit and Lafon, 1978; Sall and Teviotdale, 1981).
6
Cleistothecia appear on the surface of infected leaves, shoots, bunches and bark
(Cortesi et a1.,1995) as yellow to orange (immature) or brown to black (mature) globose
structures toward the end of the growing season.
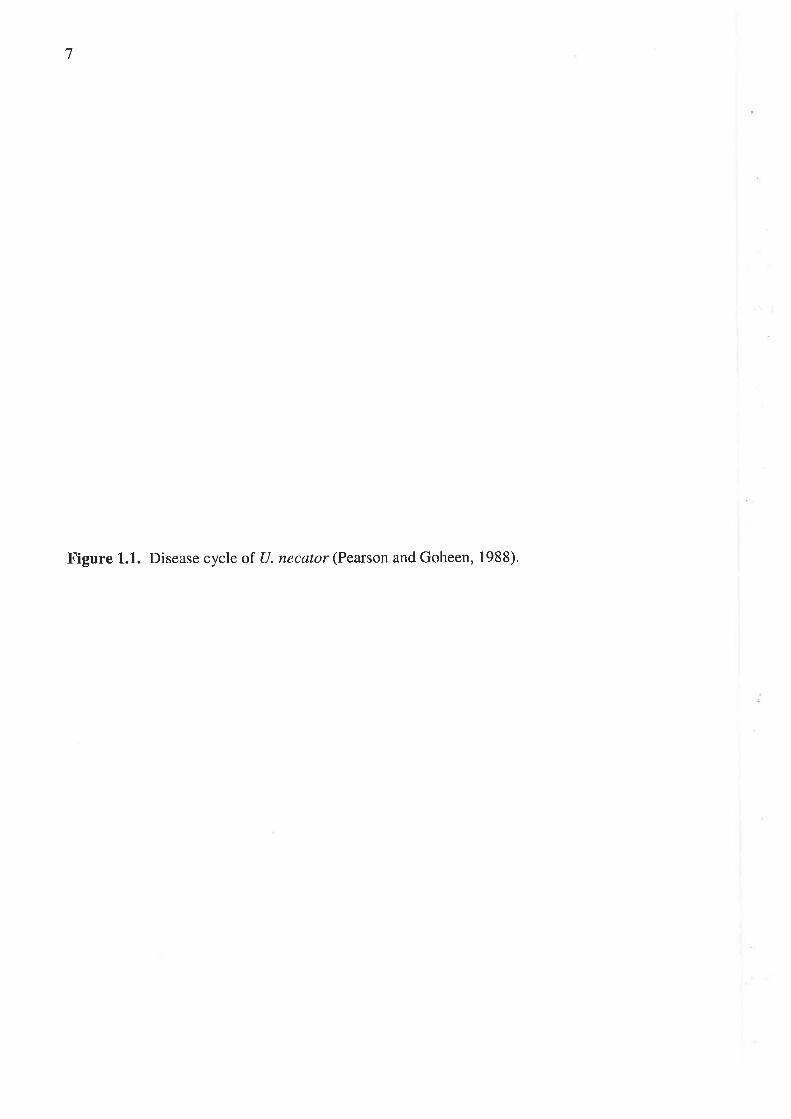
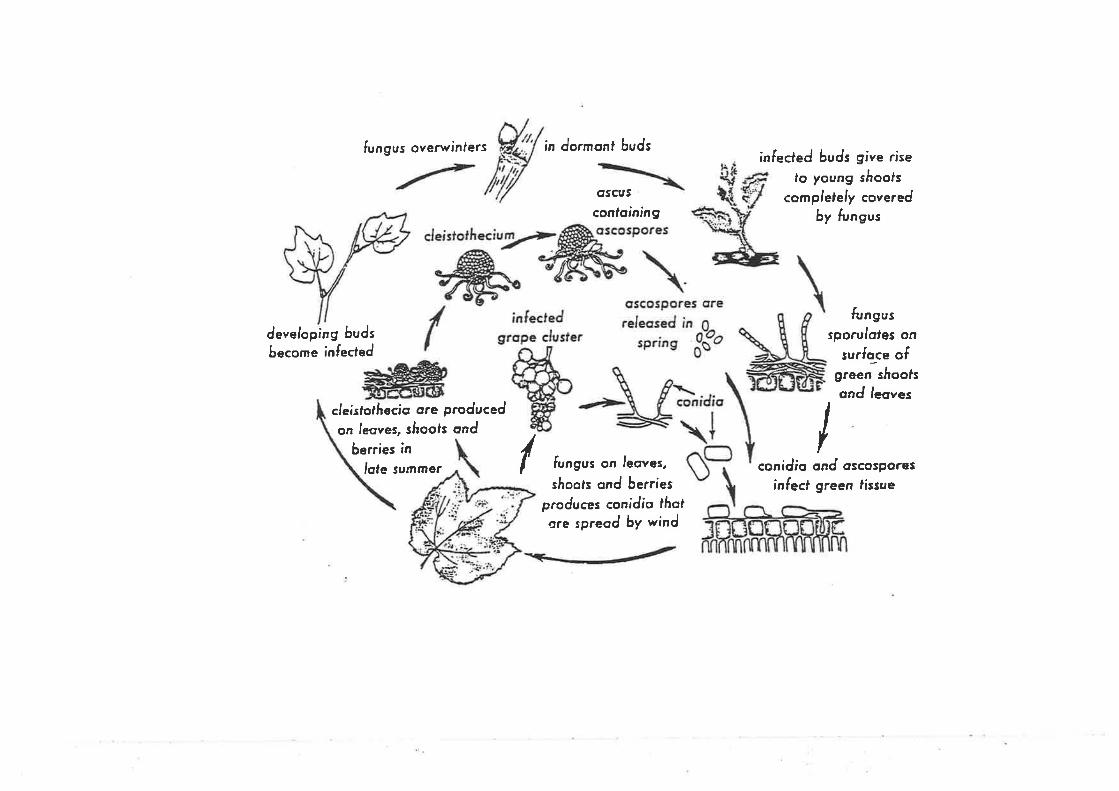
1.4.2 Disease cycle
The development of (J. necator (Figwe 1.1) on susceptible grapevine tissue begins
with the germination of a conidium, followed by the growth of a germ tube ending in a
multilobed appressorium. The germ tube penetrates the leaf surface and a primary hypha
develops from the end of the conidium opposite the germ tube and grows across the surface
of the host tissue. Eventually conidiophores bearing conidia develop (Delp, 1954). Both
sides of the leaf can be attacked.
(J. necator may overwinter as hyphae inside dormant buds that produce shoots
('flag shoots) partly or entirely covered with powdery mildew in spring (Sall and
Wrysinski, 1982; Pearson and Gärtel, 1985; Emmett et al., 1992a). It is thought that
infection of developing buds occurs early during the growing season (Pearson and Glirtel,
1985). (J. necator grows into the bud, where it remains dormant until the next season.
Following bud burst, the shoots may be covered with hyphae and conidia. The conidia are
readily dispersed by wind to neighbouring vines or vineyards. Despite evidence for the
occurrence of hyphae in mature buds, this is not the only means of survival of U. necator.
In fact, 'flag shoots'have not been observed in vineyards in South Africa (S. Ferriera; pers.
com.) or Scotland (J Duncan; pers. com.) and are rare in New York vineyards (D. Gadoury;
pers. com).
(J. necator can also survive from one growing season to the next as ascospores in
cleistothecia. This was demonstrated for the first time by Pearson and Gadoury (1987) in
New York, where no evidence has been found of U. necalor surviving as mycelium in
7
Figure L.1. Disease cycle of U. necator (Pearson and Goheen, 1988).
developing bu ds
become infecled
fungus overwinlers in dormonf budsinfecled buds gi"e rise
lo young sl¡oofs
complelely coreredby fungus
frrngus
sporuloles oa
sudoc" ofgreen shookond leores
Iconidio ond oscospores
infecf green lissue
crscuS
confoining
Íungus on leoves,
sl¡oofs ond berriesproduces conidio lfiotore spreod by wind
--v\i"clei¡tolheci a o¡e produced
on leoves, slroofs ondberries in
lole sumroer /
8
dormant buds. Ascospores therefore are assumed to be the only primary inoculum in New
York vineyards. Before this discovery, it was believed that cleistothecia v/ere unnecessary
for overwintering and that the ascogenous state was of minor or no importance in the
disease cycle (Schnathorst, 1965; Bulit and Lafon, 1978).
Efforts have been directed towards determining the role of cleistothecia, and hence
sexual reproduction, in Australian vineyards. Mature cleistothecia can be washed from
leaves by rain and often lodge themselves in bark crevices. The number of cleistothecia
overwintering on the bark of vines or in leaf litter on the vineyard floor has been
determined at Loxton (South Australia) and Mildura (Victoria) (Magarey et al., 1992).
Under laboratory conditions, ascospores released from cleistothecia may infect detached
leaves, however the infection efficiency of ascospores was found to be low (Magarcy et al,
1993; Evans et al., 1997a; Gee et a1.,2000). Field studies conducted in South Australia
showed that ascospore-derived infection occurred in early September, however, no
colonies were established by ascospores released from October to February (Gee et ø1.,
2000).
1.4.3 Factors affecting disease developmen
The effects of environmental factors such as temperature, moisture and light on
grapevine powdery mildew have been studied extensively. Temperature appears to be the
major limiting factor for the development of the fungus (Pearson and Gadoury,1992). In
the field, temperatures of 20 to 27"C are optimal for infection and disease development,
however fungal growth can occur from 6 to 32oC (Pearson and Gadoury, 1992). During
the growing season (J. necator spreads asexually, therefore the germination rate of conidia
is important for infection, and can be affected by temperature (Fessler and Kassemeyer,
1995). Delp (1954) showed that germination was completed within 30h after inoculation
9
at 12 to 30oC. At the optimum of 25oC conidia germinated in approximately 5h, however,
some conidia may take up to 5 days to germinate. Furthermore, by lowering the
temperature to |oC, germination of conidia was delayed for 32 days or more @elp, 1954).
Germination of conidia is inhibited above 35"C (Delp,1954).
Studies on the temperature requirements of ascospores of U. necator are limited.
However, Gadoury and Pearson (1990a) showed that ascospores, the principal source of
primary inoculum in New York, germinated after 24h at 10 to 25"C. Germination was
significantly reduced at 5oC and 3loC, where infection failed to take place. Furthermore, at
4oC or less, ascospore discharge was suppressed (Gadoury and Pearson, 1990b).
Therefore, the conditions suitable for ascospore release in New York occur between bud
burst and bloom. In contrast, cleistothecia collected in Australian vineyards were capable
of releasing ascospores during late spring and all throughout suÍtmer (Gee et a1.,2000)
Infection by U. necalor is also influenced by free water. According to Delp (1954),
on the host plant low humidity is buffered by transpiration moisture gradients, and
germination can still occur even under severe moisture stress. The deleterious effects of
water on conidia have been reported (Delp, 1954; Chellemi and Marois, 1991; Sivapalan,
1993). Both Delp (1954) and Sivapalan (1993) have demonstrated that conidia of U.
necator germinate poorly and may burst on or in free water. Rainfall can be detrimental to
disease development by washing conidia from, and disrupting mycelium, on the host tissue.
Conidial germination has been reported to occur in 20 to I00Vo relative humidity (Delp,
1954).
In contrast, ascospore discharge and germination require free water and high
humidity. Gadoury and Pearson (1990a) showed that the germination of ascospores
decreased as the relative humidity decreased. Also, ascospore discharge requires greater
than 2.5 mm of rain and free water. Between bud burst and bloom, ascospores were
10
detected in New York vineyards whenever rainfall exceeded 2.5 mm (Gadoury and
Pearson, 1990b).
Low, diffuse light is needed for the development of grapevine powdery mildew and
bright sunlight may inhibit the germination of conidia (Gadoury and Pearson, L992). Diehl
andHeintz (1987) found that exposure of cleistothecia to UV light for 2h had no effect on
ascospore release, however, exposure for 5h reduced dehiscence.
L.5 DrsnnsE MANAcEMENT
During favourable conditions, vines develop powdery mildew before flowering if
there is a source of inoculum in the vineyard and no control measures have been applied.
From flowering to berry softening the disease can spread rapidly on leaves and developing
berries. By the time berries are pea-size, powdery mildew epidemics are often well
advanced and cannot readily be controlled, especially on vines with dense canopies.
Hence, preventing disease development in the period from bud burst until berry set is
essential for good powdery mildew control, particularly in vineyards where there is a high
incidence of disease caffyover from the previous season (Emmett et al., L992a). A number
of methods can be used to control powdery mildew, and these are discussed below.
Successful disease management involves monitoring for diseases early in the
season. Monitoring should be carried out every I to 2 weeks in parts of vineyards that are
historically prone to early powdery mildew development (Emmett et a1.,1990). For this to
be effective, it is essential that monitors know the symptoms of powdery mildew and, in
particular, the appearance of flag shoots and early signs of disease on leaves. Weather
stations also allow growers to improve disease forecasting and management in their
11
vineyards by correlating weather data with disease increase and spread. Using this
information, effective spray schedules may be developed.
1.5.1 Quarantine and cultural control
In the mid 1800s the movement of powdery mildew to Europe via dormant cuttings
caused widespread destruction (Bulit and Lafon, Ig78). The enforcement of quarantine
measures may be important in preventing the introduction of new strains of U. necator.
The introduction of new strains could be detrimental to the viticultural industry as
fungicide resistant strains and strains with increased virulence toward certain cultivars may
be introduced (Pearson and Gadoury,1992).
Cultural practices can reduce the severity of disease and increase the effectiveness
of chemical control (Pearson and Gadoury,1992). For example, the vineyard microclimate
(temperature, humidity and light intensity) may be controlled by altering the vine canopy
and row orientation. According to Emmett et al. (1990), cultural practices that keep vine
canopies open, improve air circulation, light penetration and spray penetration can
significantly reduce development of powdery mildew. Canopy management practices such
as pruning, training and trellising, therefore, can affect disease development @mmett et al.,
1994) and spray coverage. Emmett et aI. (1994) found fewer overwintering cleistothecia
on minimally-pruned vines when compared to mechanically hedged and cane-pruned vines.
They also found that the number of flag shoots was greater on minimally-pruned vines than
on vines with other canopy management systems.
t2
1.5.2 Biological control
A number of biological control agents have been tested against U. necator in
glasshouse conditions. The most commonly reported mycoparasites of U. necator ate
Ampelomyces quisqualis Ces. and Tilletiopsis spp. These naturally occurring
mycoparasites grow internally within the mycelium, conidiophores and cleistothecia of
several important species of Erysiphaceae,includingU. necator (Knudsen and Skou, 1993;
Falk et aI., 1995). To infect (J. necator, A. quisqualis reqtires free water and high
humidity. In New York State foliar infections by U. necator are observed in mid-May, or
approximately 2 weeks after bud burst. However, Gadoury and Pearson (1988) have not
observed infection of powdery mildew colonies by A. quisqualis before August. As with
Tilletiopsis spp., the requirement of free water for infection by A. quisqualis has often
compromised biocontrol in the vineyard. In 1995, A. quisqualls, AQ10 WDG @cogen
Inc.) was registered as the first biocontrol agent for grapevine powdery mildew in
California. However, field trials have suggested that AQ10 is ineffective in controlling
powdery mildew in Australian vineyards (T. Wicks; pers. com')'
1,.5.3 Breeding for disease resistance
Significant differences have been observed within Viris species, with regard to
susceptibility to powdery mildew (Pearson and Gadoury, 1992; Doster and Schnathorst,
(uiclaaox)1985; Chellemi and Marois, 1991), however, only Muscadinia rotundiþliø^is known to be
resistant to (J. necator (Olmo,1986). Gadoury and Pearson (1991) showed that there was
no pathogenic specialisation among isolates of U. necator from Vlris spp. on Chancellor
plantlets in vitro or on seedlings of V. vinifera. However, isolates from Vilis and
Parthenocissøs spp. differed in pathogenicity and virulence in reciprocal inoculations.
There are inconsistencies in the literature with regard to the relative susceptibility of
T3
various cultivars to powdery mildew. According to Pearson and Gadoury (1992), these
relative susceptibilities are temporal as well as spatial. For example, Bulit and Lafon
(1973) reported that V. Iabrusca and V. riparia were almost immune to powdery mildew
infection in Europe. However, in north-eastern America, 507o or more of the leaf surface
on wild vines of these species is commonly colonised by U. necator.
Classical breeding techniques have, so far, been unsuccessful in producing resistant
varieties. Transgenic grapevines expressing a rice chitinase gene with enhanced resistance
to (J. necator have been initiated (Yamamoto et a1.,2000) and molecular techniques for the
transformation and regeneration of a number of important grapevine cultivars used in wine
production have been developed (Iocco et al., 2001). However, before transgenic
grapevines are introduced into vineyards, researchers must be sure that resistance is durable
and cannot be overcome by virulent strains of U. necator.
1.6 CuBvucAL coNTRoL
The most efficient and successful approach to control grapevine powdery mildew is
the use of chemical fungicides. The conventional fungicide for controlling grapevine
powdery mildew is sulphur, which was introduced in the late 1850s. However, in the late
1960s the sterol biosynthesis inhibitors (SBIs), with a specific mode of action, were
discovered and were first used in the 1970s (Köller and Scheinpflug, 1987). These
fungicides have proven very effective in controlling powdery mildew. The use of sulphur
and other multi-site inhibitors to control powdery mildew will be discussed in section 1.6.1
and the use of DMIs will be discussed in section I.6.2.
L4
1.6.1 Sulphur and other'multi-site' fungicides
Sulphur is a 'multi-site' fungicide, which penetrates fungal cells and acts as a
general enzyme inhibitor. Due to its efficacy, both preventative and curative, and low cost,
it is still widely used (Bulit and Lafon, 1978). Sulphur can be applied as a dust or as
wettable powder formulations. In most regions of Australia wettable sulphur sprays are
preferred because they are relatively cheap and are also effective for controlling vine mites
(Emmett et aI., I992b). However, the use of sulphur has limitations. Most importantly,
the effectiveness of sulphur is highly dependent on temperature (Pearson and Gadoury,
Igg2). Sulphur is most active at 25 to 30oC, however, retains some effect at 18oC @ulit
and Lafon, 1978). Sulphur may be phytotoxic to young growth on vines above 30oC,
which creates a problem in Australia where temperatures in summer often exceed this.
Another limitation is the effect of sulphur residues on table grapes and wine quality.
Sulphur applied within 1 month of harvest may contaminate wine and reduce the quality of
table grapes.
Applying lime sulphur to dormant grapevines appears to be successful in
eradicating the primary inoculum of grapevine powdery mildew in New York State. Lime
sulphur applied as "over-the-trellis" sprays to dormant grapevines in spring, killed
cleistothecia on the bark of vines and delayed the development of powdery mildew
epidemics (Gadoury et a1.,1994). The results indicated that lime sulphur may be useful in
reducing the primary inoculum of U. necator, however, these treatments are not
competitive with the modern fungicides in either efficacy or total seasonal cost.
Some al{ern¿tti V<¡ fungicides are being tested for control of powdery
mildew in Australia (Magarey, 1992; T. J. Wicks; pers. com; Crisp et al., 2000). These
include sodium bicarbonate and ammonium bicarbonate, which have proved to be as
effective as some of the systemic fungicides used (Magarey, 1992). In addition, milk,
15
whey, potassium bicarbonate and Bacillus subtilis are cuffently being tested in both
glasshouse and field studies in Australia (Crisp et a1.,2000). Mineral oils and the wetting
agent Cittowet@ have also shown some potential in controlling powdery mildew (T. J.
Wicks, pers. com.; Wicks and Hitch, 1993). Formulated petroleum oil products (Stylet-
Oil@, Sunspray UFO@ and Safe-T-Side@) are as effective as the DMI, Nova@ for controlling
powdery mildew (Northover and Schneider, 1996).
Foliar sprays of phosphate have also been used to control powdery mildew on field-
grown wine grapes (Reuveni and Reuveni, 1995). However, the mode of action of
phosphate salts has not been determined, therefore, they should be used only in rotation
with existing fungicides. Reuveni and Reuveni (1995) suggest that a combined program of
phosphates plus timed applications of conventional fungicides is cóst-effective and may
reduce the development of fungicide resistance during the season.
Potassium silicate has proved successful in controlling grapevine powdery mildew,
however, under heavy disease pressure it did not provide the same level of control as
sulphur (Reynolds et aI., 1996). Reynolds et aI. (1996) suggested that, at appropriate
application interval and concentration, potassium silicate has potential as an alternative
spray to sulphur because the cost of the material is lower, the risk of hydrogen sulphide in
wine is reduced and it would potentially fall within guidelines for use by organic
viticulturists.
I.6.2 The demethylation inhibiting fungicides
DMIs such as the triazoles, imidazoles and triforine are sterol biosynthesis
inhibitors (SBIs) that inhibit the cytochrome P45O-dependent l4ø-demethylase enzyme
(CYP51). DMIs are translaminar, are applied as protective sprays and can be applied
t6
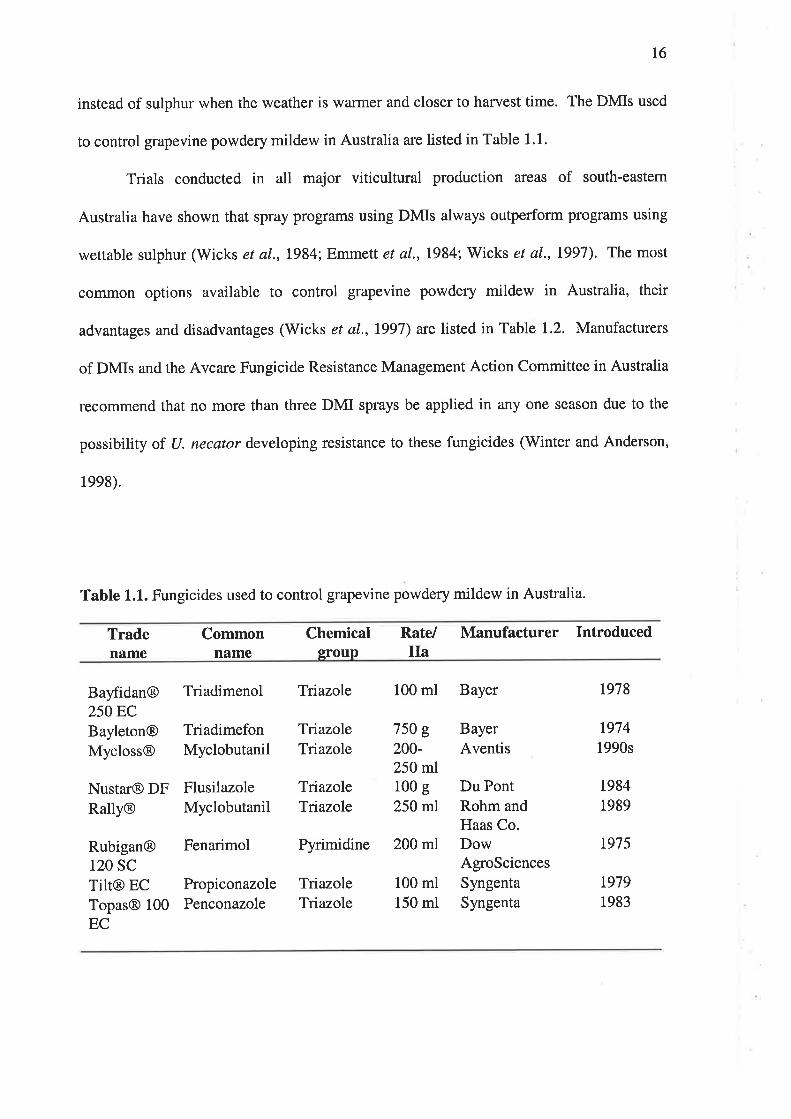
instead of sulphur when the weather is warmer and closer to harvest time. The DMIs used
to control grapevine powdery mildew in Australia are listed in Table 1.1.
Trials conducted in all major viticultural production areas of south-eastern
Australia have shown that spray programs using DMIs always outperform programs using
wettable sulphur (Wicks et al., L984; Emmett et aL,1984; Wicks et al.,1997). The most
common options available to control grapevine powdery mildew in Australia, their
advantages and disadvantages (Wicks et aL,1997) are listed in Table 1.2. Manufacturers
of DMIs and the Avcare Fungicide Resistance Management Action Committee in Australia
recommend that no more than three DMI sprays be applied in any one season due to the
possibility of (J. necator developing resistance to these fungicides (Winter and Anderson,
1998).
Table 1.L. Fungicides used to control grapevine powdery mildew in Australia.
Tradename
Commonname
Chemicalqroup
Rate/ Manufacturer IntroducedHa
Bayfidan@25OECBayleton@Mycloss@
Nustar@ DFRally@
Rubigan@120 SC
TiIt@ ECTopas@ 100EC
TriadimefonMyclobutanil
FlusilazoleMyclobutanil
PropiconazolePenconazole
Triadimenol Triazole 100 ml Bayer
TnazoleTriazole
TriazoleTriazole
TnazoleTriazole
750 g
200-250 ml100 g
250 ml
100 ml150 ml
t978
r9741990s
19841989
t975
t9791983
Fenarimol Pyrimidine 200 ml
BayerAventis
Du PontRohm andHaas Co.DowAgroSciencesSyngentaSyngenta
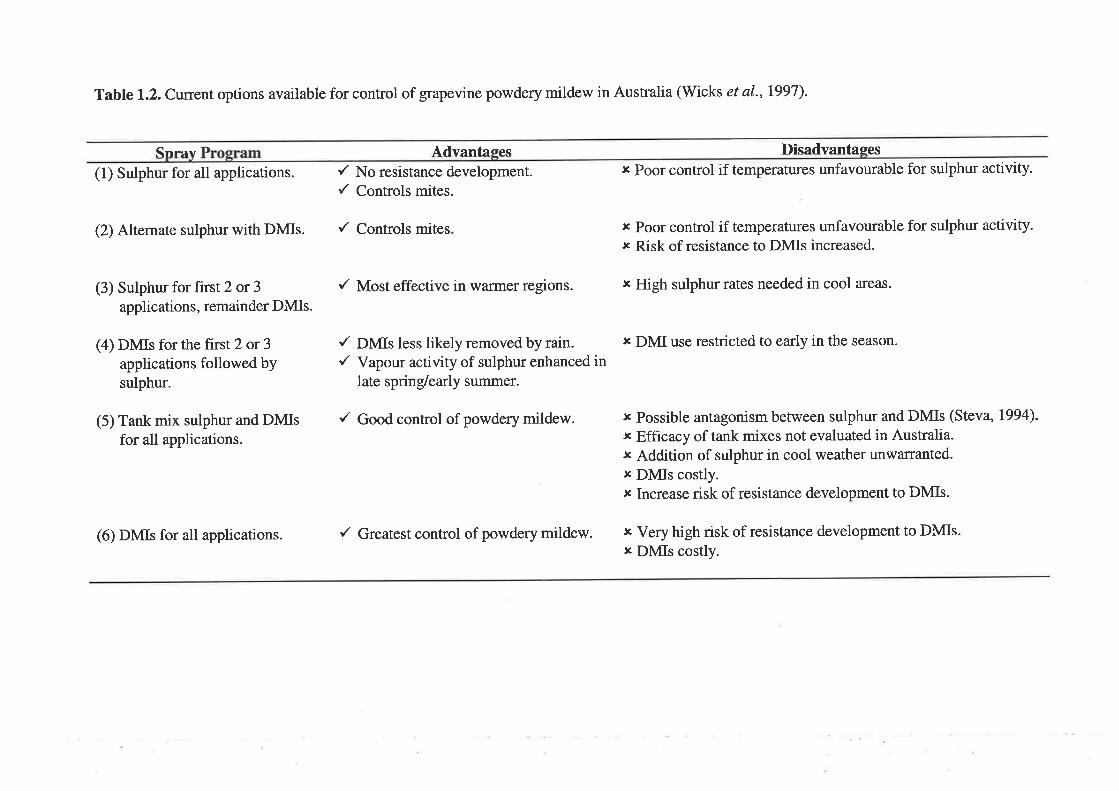
Table 1.2. Current options available for control of grapevine powdery mildew in Australia (Wicks et al., L99l).
Snrav Advanfeqesr' No resistance development./ Controls mites.
Disadvantases,c Poor control if temperatures unfavourable for sulphur activity.
t Poor control if temperatures unfavourable for sulphur activity.r Risk of resistance to DMIs increased.
r Possible antagonism between sulphur and DMIs (Steva, 1994)-
x Efficacy of tank mixes not evaluated in Australia.r Addition of sulphur in cool weather unwarranted.¡ DMIs costly.r Increase risk of resistance development to DMIs.
(1) Sulphur for all applications
(2) Alternate sulphur with DMIs. { Controls mites
(3) Sulphur for first 2 or 3applications, remainder DMIs.
(4) DMIs for the first 2 or 3applications followed bysulphur.
(5) Tank mix sulphur and DMIsfor all applications.
(6) DMIs for all applications.
/ Most effective in warmer regions. ¡ High sulphur rates needed in cool areas.
/ DNfls less likely removed by rain./ Vapour activity of sulphur enhanced in
late spring/early summer.
r DMI use restricted to early in the season.
/ Good control of powdery mildew.
/ Greatest control of powdery mildew. x VeT high risk of resistance development to DMIs.¡ DMIs costly.
18
1.6.2.I DMIs: biochemistry, mode of action, and inhibition of sterol biosynthesis
Sterols and their derivatives are important in promoting and maintaining growth
and development in most plants and fungi. Sterols are membrane constituents, and align
with the phospholipid bilayer, regulating fluidity and probably also function as cellular
metabolites or hormones, which may be involved in the control of metabolism (Burden er
at., 1989). Most fungi contain the major sterol, 24þ-methylcholesta-5,7,228-tien-3p-ol
(ergosterol), whereas certain taxa of the Ascomycota contain 24þ-methylcholesta-5,228-
dien-38-ol (brassicasterol) and some powdery mildew fungi, including U. necator, contain
ergosta-5,24(28)-dien-3 B-ol as the predominant sterol.
To understand the mode of action of DMI fungicides the biosynthesis of ergosterol
must be explained. The first sterol structure formed in the ergosterol biosynthesis pathway
of animals and most yeast is lanosterol (Mercer, 1984). However, for filamentous fungi,
such as (J. necator, the first sterol structure formed is eburicol 14,4,14u-tnmethyl-methyl-
cholesta-8,24(24\-dlen-39-oll (Aoyama et a1.,1996). This is formed by the cyclization of
2,3-epoxysqualene, which originates from mevalonic acid via the isoprenoid pathway
(Mercer, 1984). The first step in the conversion of eburicol into ergosterol in most
filamentous fungi, or into ergosta-S,24(28)-dien-3B-ol in U. necalor, involves methylation
at the C-24 position. This is followed by the oxidative removal of the methyl groups in the
C-14 and C-4 positions (Mercer, 1984). As will be described later, in the presence of DMI
fungicides, the removal of the methyl group in the C-14 position does not takes place.
Following side-chain methylation and oxidative demethylations, several double bonds are
rearranged leading to the end product of sterol biosynthesis.
According to Köller (1988), C-14 demethylation, and thus the target site for DMIs,
is not affected by the structural variability of final sterols contained in different fungi. The
t9
mode of action of DMI fungicides was originally deduced by studying the most prominent
precursor of 24-methylenedihydrolanosterol in DMl-treated cells (Buchefrauet,1987; Kato,
1986; Sisler and Ragsdale, 1984). The sequence of the C-14 demethylation steps begins
with the hyroxylation of the C-14 methyl group. This step is mediated by a cytochrome P-
450 mono-oxygenase. This is followed by two oxidation steps in which formic acid is
released, leading to an intermediate characterised by a double bond in the C-14 position.
The reduction of this double bond is the final step of the demethylation sequence (Mercer,
1934). According to Mercer (1984), DMIs act most effectively on the very first
hydroxylation step of C-14 demethylation. This is characterised by the absence of
oxygenated intermediates in DMl-treated cells.
DMIs are highly specific inhibitors of the fungal cytochrome P-450 mono-
oxygenase active in sterol demethylation. DMIs bind to a site of the cytochrome P-450
normally occupied by the substrate lanosterol or 24-methylenedihydrolanosterol. This
blocks the binding of an oxygen molecule that would normally bind to the cytochrome and
which is essential for sterol biosynthesis (Oritz de Montellano, 1986). DMIs can inhibit
fungal growth directly or indirectly, through disturbance of membrane integrity or through
effects on membrane-bound enzy me, respectively.
The direct effect of DMIs on membrane integrity was first demonstratedin Ustilago
maydis treated with triarimol (Ragsdale, 1975) and later with other DMIs and fungi.
Initially, DMIs result in a two-fold effect in fungi involving: (i) the fast accumulation of
sterol precursors (l4c-methyl sterols) bearing a methyl group in the C-14 position and (ii)
the rapid depletion of ergosterol (ergosta-5,24(28)-dien-3p-ol in U. necalor) (Buchenauer,
1987; Kato, 1986; Sisler and Ragsdale, 1984). The l4cr-methyl sterols are incorporated
into the plasma membranes of the fungal cell resulting in altered membrane fluidity or
membrane leakage, followed by cell death.
20
DMIs can inhibit fungal growth indirectly by affecting membrane-bound enzymes,
which are important for fungal growth. For example, ergosterol depletion and the
accumulation of 14cr-methyl sterols may affect chitin synthase, which is involved in the
formation of septa and hyphal walls in fungi (Vanden Bossche, 1985). In addition to the
depletion of ergosterol, Sisler and Ragsdale (1984) observed the accumulation of free fatty
acids in U. maydis treated with triarimol. The high levels of free fatty acids that
accumulated were found to be lethal to U. maydis. As observed with U. maydis, the effects
of DMIs become apparent after a relatively short time (Ragsdale, 1975). Cytological
studies by Leinhos et aI. (1997) have shown that pre- and post-infectional treatment of U.
necator with the DMI penconazole did not inhibit spore germination, but prevented hyphal
development and caused distortion with hyphal tip swelling. Similar observations were
recorded for the effect of DMIs on the development of Erysiphe gramínis (Heller et aI.,
1 990) and Venturia inaequalrs (Siebels and Mendg en, 1994).
1.7 FuNcrcrDE RESISTANCE
The inorganic fungicides (sulphur and copper compounds) and the organic
fungicides (dithiocarbamates or phthalimides) are protectants and have been used for
decades without the development of resistance (Koller and Scheinpflug, 1987). They
interfere with a variety of metabolic processes and would require multiple changes or
mutations in the pathogen genome for resistance to occur (Lyr,1977). However, the use of
systemic and curative fungicides with a specific mode of action (inhibiting only one or two
metabolic sites), such as the DMI fungicides, over the past 30 years, has led to the
appearance of resistance. In this case, a modification in only one fungal gene can be
sufficient to induce a change at the site of action, and a resistant strain can develop.
2t
Brent (1995) has suggested that resistance be referred to as "laboratory" resistance,
"field" resistance or "practical" resistance, where "field" resistance is frequent and severe
enough to compromise disease control. "Field" resistance is caused by the exclusive and
continuous use of a fungicide. Therefore, sooner or later during years of commercial use of
a fungicide, individuals within the population of the target pathogen begin to show a
heritable, reduced sensitivity to the fungicide (Brent, 1995). The fungicide concerned can
no longer adequately control these individuals. The use of systemic fungicides with a
single mode of action poses a high risk for resistance development and there may be a
temptation for growers and advisers to blame resistance for all cases of poor disease
control. However, there are many other factors which can contribute to this including:
poor spray application; intensity of fungicide use (dose, rate, number of applications per
season and area treated); deteriorated product; misidentification of the pathogen; and
unusually heavy disease pressure (Brent, 1995).
1.7.1 Resistance to DMI fungicides
DMIs have a site-specific mode of action, therefore, there is a high risk of
resistance developing to these fungicides. However, Fuchs and Drandarevski (1976) stated
that the development of resistance to DMIs in practice would be unlikely becaúse strains
found to be resistant in the laboratory tended to be less fit than wild-type strains. This
statement has been disproved by the many reported cases of decreased sensitivity or
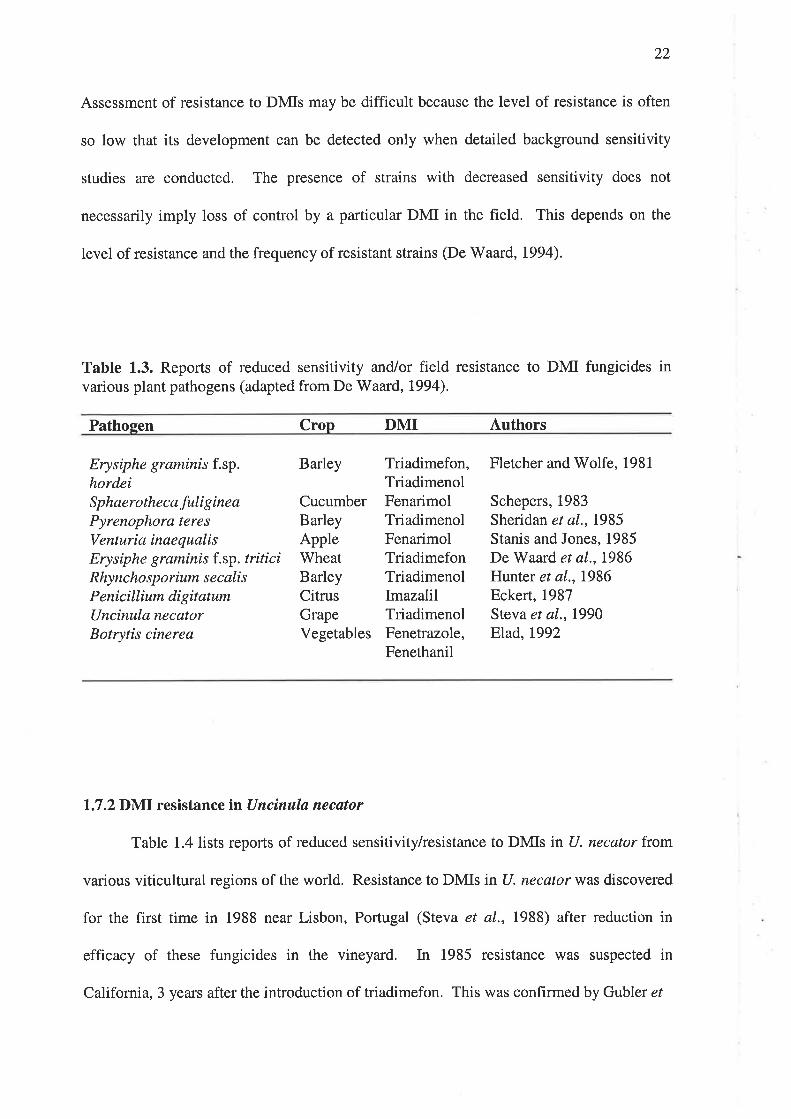
resistance to DMIs in various plant pathogens. Table 1.3 lists first reports of reduced
sensitivity and"/or resistance to DMIs in field isolates of various plant pathogens. The most
clearly defined practical resistance has been in the apple scab fungus and the powdery
mildew fungi of barley, cucumber and wheat. According to De Waard (1994), resistance to
the DMIs has developed slowly compared with other classes of site-specific fungicides.
22
Assessment of resistance to DMIs may be difficult because the level of resistance is often
so low that its development can be detected only when detailed background sensitivity
studies are conducted. The presence of strains with decreased sensitivity does not
necessarily imply loss of control by a particular DMI in the field. This depends on the
level of resistance and the frequency of resistant strains @e Waard, 1994).
Table 1.3. Reports of reduced sensitivity and/or field resistance to DMI fungicides invarious plant pathogens (adapted from De'Waard, 1994).
Pathoeen Crop DMI Authors
Erysiphe graminis f.sp.hordeiSphaerotheca fuIigineaPyrenophora teresVenturia inaequalisErysiphe graminis f.sp. triticiRhyncho sp o rium s e c ali sPenicillium digitatumUncinula necatorBotrytis cinerea
Barley
CucumberBarleyAppleWheatBarleyCitrusGrapeVegetables
Triadimefon,TriadimenolFenarimolTriadimenolFenarimolTriadimefonTriadimenolImazalilTriadimenolFenetrazole,Fenethanil
Fletcher and Wolfe, 1981
Schepers, 1983Sheridan et aL,1985Stanis and Jones, 1985De Waard et al., L986Hunter et al., L986Eckert, 1987Steva et a1.,1990Elad,1992
1.7 .2 DÌl[I resistance in Uncìnul.a ne cator
Table 1.4 lists reports of reduced sensitivity/resistance to DMIs in U. necator from
various viticultural regions of the world. Resistance to DMIs in U. necator was discovered
for the first time in 1988 near Lisbon, Portugal (Steva et al., 1988) after reduction in
efficacy of these fungicides in the vineyard. In 1985 resistance was suspected in
California, 3 years after the introduction of triadimefon. This was confirmed by Gubler ¿r
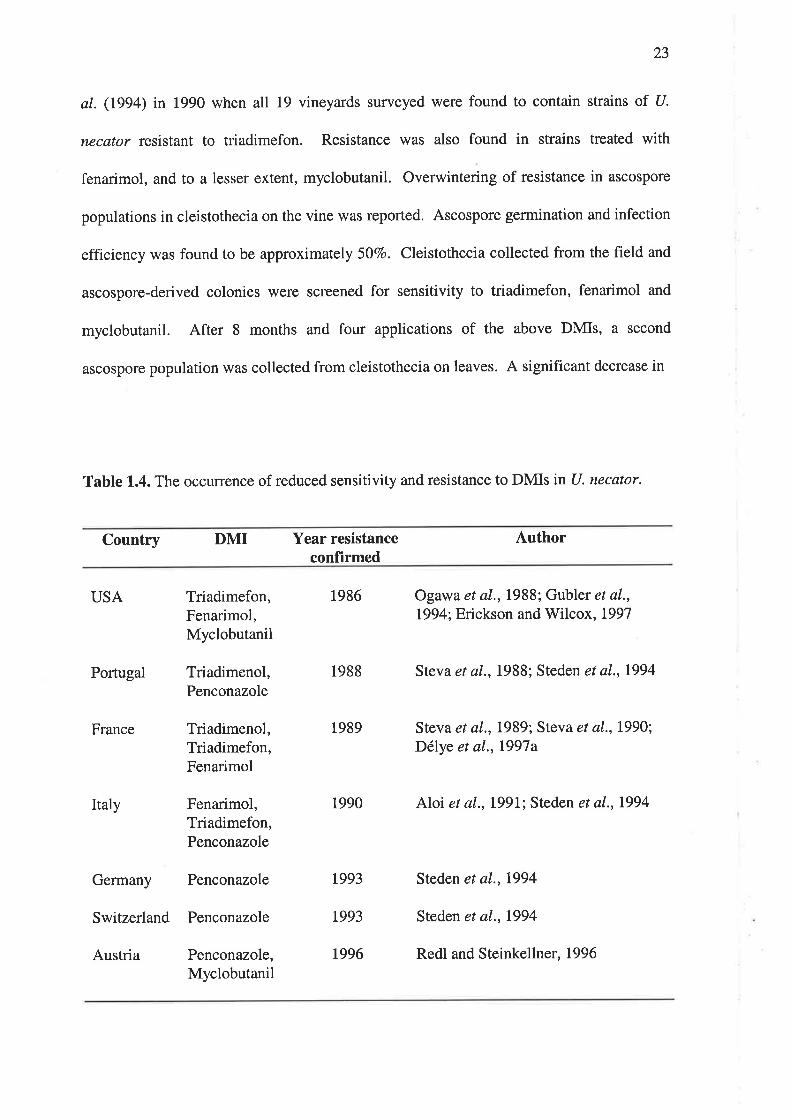
23
aI. (1994) in 1990 when all 19 vineyards surveyed were found to contain strains of U.
necator resistant to triadimefon. Resistance was also found in strains treated with
fenarimol, and to a lesser extent, myclobutanil. Overwintering of resistance in ascospore
populations in cleistothecia on the vine was reported. Ascospore germination and infection
efficiency was found to be approximately 507o. Cleistothecia collected from the field and
ascospore-derived colonies were screened for sensitivity to triadimefon, fenarimol and
myclobutanil. After 8 months and four applications of the above DMIs, a second
ascospore population was collected from cleistothecia on leaves. A significant decrease in
Table 1.4. The occuffence of reduced sensitivity and resistance to DMIs in U. necator.
Country DMI Year resistanceconfirmed
Author
USA
Portugal
Triadimefon,Fenarimol,Myclobutanil
Triadimenol,Penconazole
Triadimenol,Triadimefon,Fenarimol
1986 Ogawa et a1.,1988; Gubler et al.,1994; Erickson and Wilcox,1997
1988 Steva et a\.,1988; Steden et a1.,1994
Steva et a1.,1989; Steva et a1.,1990;Délye et al., t997a
Italy
France 1989
Fenarimol,Triadimefon,Penconazole
1990 AloietaI.,I99I;Steden etaI.,L994
Germany Penconazole 1993 Steden et a1.,1994
Switzerland Penconazole 1993 Steden et a1.,1994
Penconazole,Myclobutanil
Austria t996 Redl and Steinkellner,1996
24
sensitivity was observed for ascospores treated with triadimefon, whereas the decrease in
sensitivity to fenarimol and myclobutanil was not as severe. The decrease in sensitivity to
triadimefon suggested that increased triadimefon resistance was maintained through the
sexual cycle (Gubler et al., 1996). Furthermore, resistance may also increase in areas
where (J. necator survives in its asexual state as flag shoots.
Sixty two U. necator isolates collected from vineyards in France, Portugal,
Switzerland and Germany, where grapevine powdery mildew was not fully controlled by
fungicide treatments, were tested for sensitivity to a number of DMI fungicides Qélye et
at., 1997b). Of these, 29 were found to be sensitive and 33 resistant to triadimenol.
Resistance factor (RF) values for the resistant isolates ranged from2.7 to 29.5, however,
the majority of resistant isolates displayed RF values between 2 and 10. The results of this
study indicated that DMI resistance in U. necator is complex.
Reduced sensitivity to triadimenol and myclobutanil and, to a lesser extent,
fenarimol has also been confirmed for U. necator isolates collected in New York State
(Erickson and Wilcox, 1997). Median effective dose (EDso) values were calculated for
isolates collected from two vineyards with no previous exposure to DMIs (unexposed) and
from two vineyards in which powdery mildew was poorly controlled by triadimefon after
prolonged DMI use (selected). Median EDso (pglml) values for the unexposed population
versus the selected population were 0.06 versus 1.9 for triadimenol, 0.03 versus 0.23 for
myclobutanil, and 0.03 versus 0.07 for fenarimol, respectively.
L.7.3 Cross-resistance
Pathogen populations that develop resistance to one fungicide can automatically
and simultaneously become resistant to other fungicides that affect the same gene and,
therefore, have the same resistance mechanism (Georgopoulos, 1982b). Generally, these
25
are fungicides that bear an obvious chemical relationship to the first fungicide, or which
have a similar mechanism of fungitoxicity. This phenomenon is known as 'cross-
resistance'. Cross-resistance cannot be assumed without evidence that the same gene
controls sensitivity to both chemicals. To prove this, a resistant strain may be crossed with
a sensitive strain and the progeny tested against fungicides with the same mode of action.
Furthermore, several independently isolated strains resistant to one fungicide may be tested
for sensitivity to another fungicide (Georgopoulos, 1982b).
Cross-resistance may be difficult to identify due to the relatively low mutation
frequency of the genes involved, or to differences in dosage response (De Waard and
Fuchs, 1982). Cross-resistance in imazalil resistant Aspergillus nidulans isolates to
fenarimol appears to be dependent upon the resistance gene present (De Waard and
Gieskes, 1977). Similar results have been observed for imazalil resistant strains of
Cladosporiun cucumerinum (Fuchs et aI., 1977; van Tuyl, 1977) and Ustilago maydis
(Barug and Kerkenaar,IgTg). Cross-resistance among DMIs has also been reported for V.
inaequalis (Köller et al., 1991), Rhynchosporium secalis (Kendall et al., 1993) and
Cercospora beticola (Karaoglanidis et aI., 2000). In addition, cross-resistance among
DMIs has also been reported for (J. necator in California (Gubler et al., 1996) and New
York State @rickson and Wilcox, 1997). Gubler et aL (1996) have shown that isolates
resistant to triadimefon may also be resistant to myclobutanil and fenarimol. Similar
results were observed in New York State where a substantially greater degree of cross-
resistance between triadimenol and myclobutanil than between either of these fungicides
and fenarimol was detected for U. necator (Erickson and Wilcox, L997). In contrast to
these studies, Délye et aI. (I997b) used six isolates of U. necator to test for cross-resistance
to a number of DMIs (triadimenol, triadimefon, penconazole, tebuconazole, fenbuconazole,
cyproconazole, fenarimol and pyrifenox), however, no consistent cross-resistance was
26
detected between the DMIs. The small number of isolates chosen for the study may have
influenced these results
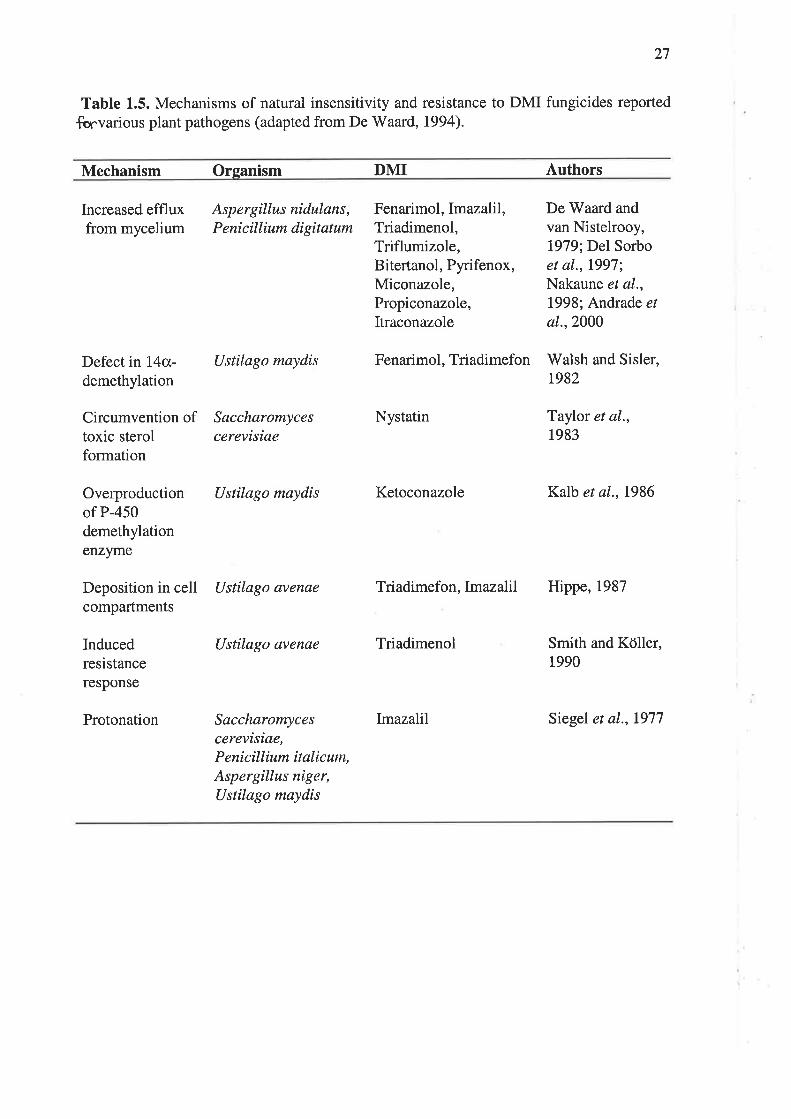
1.7.4 Mechanisms of resistance to DMI fungicides
Various mechanisms have been reported for natural insensitivity and resistance to
DMIs in fungi (Table 1.5). However, further study is needed to fully understand this
phenomenon because there is some evidence that mutation of different genes may elicit a
number of different resistance mechanisms which are unrelated, but which could act
simultaneously and possibly in a synergistic way (Brent, 1995).
The mechanisms of resistance to DMIs have been studied mostly in DMl-resistant
laboratory mutants of Aspergillus nidular¿s and Penicillium italicum (De V/aard and van
Nistelrooy, 1979; De Waard and Fuchs, 1982; Del Sorbo et al., 1997; Andrade et al.,
2000). An increase in energy-dependent efflux in resistant mutants counteracts passive
influx of DMIs in fungal mycelium and results in a relatively low and constant level of
accumulation @e Waard, 1994). This then reduces formation of the complex between
DMIs and the P-450 demethylation enzyme. A study on the uptake of fenarimol into
sensitive and resistant strains of A. nidulans by De V/aard and van Nistelrooy (1979)
showed that in sensitive cells the efflux system was induced by the intracellular
concentrations. In contrast, the efflux system in resistant cells is constitutive and
immediately active upon contact with a fungicide. This resistance mechanism has also
been reported in Nectria haematococca var. cucurbitae (Kalamarakis et al., 1991).
A defect in sterol l4cx-demethylation and circumvention of toxic sterol formation
are common mechanisms of resistance in U. maydis, C. albicans and S. cerevisiae, but do
not seem to operate in filamentous fungi (De Waard, 1994). Walsh and Sisler (1982)
showed that demethylation-defective mutants of U. maydís contained not ergosterol but
27
Table 1.5. Mechanisms of natural insensitivity and resistance to DMI fungicides reported
ftnvarious plant pathogens (adapted from De Waard, 1994).
Mechanism Orqanism DMI Authors
Increased effluxfrom mycelium
Aspergillus nidulans,Penicillium digitatum
Fenarimol, Imazalil,Triadimenol,Triflumizole,Bitertanol, Pyrifenox,Miconazole,Propiconazole,Itraconazole
Imazalll
De Waard andvan Nistelrooy,1979; Del Sorboet a\.,1997;Nakaune et aI.,1998; Andrade ¿la|.,2000
Siegel et a1.,1977
Defect in 14ct-
demethylation
Circumvention oftoxic sterolformation
Overproductionof P-450demethylationenzyme
Deposition in cell Ustilago avenae
compartments
Inducedresistanceresponse
Ustilago maydis
Saccharomycescerevisiae
Ustilago maydis Ketoconazole
Fenarimol, Triadimefon Walsh and Sisler,1982
Nystatin Taylor et al.,1983
Ustilago avenae Triadimenol
Kalb et al.,1986
Triadimefon,Imazalil Hippe, 1987
Smith and Köller,1990
Protonation Saccharomycescerevisiae,Penicillium italicum,Aspergillus niger,Ustilago maydis
28
various other C14 sterols. Consequently, the presence of these other sterols in the fungal
membrane may inhibit the effect of DMIs.
The common mechanism of DMI fungicide resistance, in general, is a decrease in
the affinity of the P-450 demethylation enzyme for the fungicide. However, reports on
resistance to DMIs due to this mechanism are rare. Furthelanore, the methods used to study
this mechanism of resistance are not suitable for slow growing fungi or obligate parasites,
such as (J. necator (De Waard, 1994). Hollomon et aI. (1990) suggest that the best
approach in this case is to clone and characterise the sterol l4cr-demethylase gene.
1.8 GnwnTICS AND POPULATION DYNAMICS OF FUNGICIDE RESISTANCE
Fungicide resistance can be acquired either in one step, due to mutation of a major
gene, or in multiple steps, by the interaction of several mutant genes, each with a small
individual effect. Qualitative resistance, otherwise referred to as 'single-step', 'major-
gene', 'discrete', 'disruptive' or'discontinuous'resistance, is characterised by a sudden
loss of effectiveness, and by the presence of distinct sensitive and resistant pathogen
populations with widely differing responses to fungicides. With qualitative resistance, a
mutation in a single gene is all that is required for the pathogen to acquire the highest
resistance possible. Mutant genes at different loci do not interact to increase the level of
resistance, however the gene having the greatest effect is epistatic over other genes
affecting sensitivity to the same type of fungicide (Georgopoulos, 1988). This explains
why this type of resistance tends to be stable.
The sensitivity distribution of the target population with resistance due to a major-
gene is described as being discontinuous and the response to selection is qualitative. The
resistant strains, even if extremely rare at the time the fungicide is first used, comprise a
29
subpopulation that is distinct from, and does not overlap with, the sensitive subpopulation
(Georgopoulos, 1988). A resistance problem occurs when the resistant subpopulation
becomes predominant and the fungicide treatments become ineffective. Once this stage is
reached an increase in the rate of application will probably not improve disease control.
Due to the distinct differences between sensitive and resistant strains, selection can proceed
unnoticed in terms of chemical efficacy, therefore, control failures usually occur suddenly.
According to Brent (1986), this is because the target population is perceived as highly
sensitive until the resistant mutants reach a practically detectable proportion. Major-gene
resistance and qualitative population responses have been observed for a number of
systemic fungicides including benzimidazole, dicarboximides and phenylamide fungicides
(Crute et aI., L987; Georgopoulous, 1987; Wheeler et a1.,1994).
In contrast, quantitative resistance, or 'multi-step', 'continuous', 'directional' or
'progressive' resistance, is characterised by a gradual decline in disease control and a
gradual decrease in sensitivity of the pathogen population. Mutations in a number of
different genes, each with a relatively minor effect, appear to be involved. The more genes
that mutate to a resistant form, the greater the degree of resistance (Brent, 1995). This
would account for the gradual development of resistance observed and for the continuous
range of sensitivity that can be found. It is possible to quantify the shift towards decreased
sensitivity or resistance by measuring the ECso (the concentration which inhibits fungal
growth by 507o) at different times after the onset of selection. Disease control may be
affected by the initial position of the practical application rate of the fungicide and the
extent of the shift toward resistance, however, complete loss of fungicide efficacy is
infrequent except under favourable circumstances. This contrasts with major-gene
resistance (Brent, 1995). The quantitative response obtained with polygenic control
provides indications of reduced performance before complete failure occurs. Another
30
important difference is that, with the quantitative response, performance may be improved
by increasing the application rate. Quantitative resistance has been observed in a number
of fungal pathogens. For example, interacting genes have been identified for resistance to
dodine in V. inaequalis (Gilpatrick, 1982), and to DMI fungicides in A. nidulans (van Tuyl,
1977), E. graminis f.sp. hordei (Wolfe, 1985) and S. fuliginea (Schepers, 1984). It is
possible that the resistance that develops with the use of DMIs to control U. necator may
also be controlled by more than one gene.
1.8.1 Origins of fungicide resistance
Fungicide resistance results from one or more changes in the genetic make-up of
the fungal population and it may be heritable. Variations within a fungal population are
largely affected by mutation, selection and recombination and their implications are
discussed below.
Mutations are heritable changes in the DNA of an organism. A mutation may
involve deletion, transposition, insertion or duplication of a section of DNA, or the
substitution of one or more nucleotides in the molecule (Curtis and Barnes, 1989).
Mutations may be responsible for the genetic variability observed within a fungal
population. Spontaneous mutations may generate a range of variation in fungicide
sensitivity. The rate of mutation can be increased greatly in the laboratory by exposing the
fungus concerned to UV light or chemical mutagens and, therefore, resistant mutants can
be produced artificially. However, the resistant mutants induced in the laboratory will not
necessarily have resistance mechanisms identical to those that arise in the field. Mutants
occurring in the field may exist at an initial frequency of the order of I x lõe (Brent, 1995)
and are selected for both fitness and fungicide sensitivity. However, following fungicide
treatment the population of resistant organisms will increase. Resistance genes, which
31
carry a. fitness penalty, will tend to remain rare in natural populations (Brent and
Hollomon, 1938). The risk that resistance will develop in field populations depends on the
range of variations present, the heritability of those variations, and the intensity of the
selection applied (Brent and Hollomon, 1988).
One of the first reports of the generation of DMI resistant mutants resulted from
treating A. nidulans with UV light and nitrosoguanidine (van Tuyl, L977). Attempts to
generate triadimenol resistant mutants in E. graminls f.sp. hordei have been unsuccessful
thus far (Brent and Hollomon, 1988). This is attributed to the fact that in E. graminis f.sp.
hordei, DMI resistance appears to be controlled by many genes and, therefore, changes at
several loci would be required. Consequently, mutation experiments may provide only a
useful indication of the likelihood of resistance when this is conferred by a single gene
expressing a large effect on fungicide sensitivity. Brent and Hollomon (1988) suggested
that, for DMIs, mutagenesis will be inadequate for estimating variation in field
populations. Furthermore, experience suggests that failure to generate mutants with
unimpaired fitness, in the laboratory, is usually associated with stability of performance in
the field (Dekker, 1982).
Selection can produce change and it can maintain variability within a population,
resulting in the adaptation of the population to their environment. An effective fungicide
treatment will result in few survivors and selection will be very rapid. However, if the
fungicide is ineffective in controlling the total population, resistance build-up will be
slower. Studies on selection have been conducted for a number of fungi (Stanis and Jones,
1985; Hunter et al., 1986). During glasshouse tests, fenarimol was applied to apple
seedlings infected with single-spore isolates of V. inaequalis, at a rate that normally
prevented infection by a sensitive strain. However, V. inaequalis was not controlled
indicating the selection of resistant strains. Similarly, populations of R. secalis collected
32
from barley were inoculated onto glasshouse-grown barley plants treated with a DMI
fungicide (Hunter et al., 1986). This resulted in a population that infected barley plants
even after treatment with commercial rates of the DMI. Furthermore, the transfer of these
selected populations onto untreated plants did not restore the original wild-type sensitivity,
indicating stability of the response in the absence of any fungicide. Studies like these can
reveal the presence of pathogenic and DMI resistant strains within some fungal
populations, and clearly have predictive value. A negative result, however, would require
analysis of many different field populations to ensure that the gene pool was sufficiently
wide, before deciding that resistance was unlikely (Brent and Hollomon, 1988).
In sexually reproducing fungal populations where fungicide resistance is controlled
by many genes, analysis of the progeny from sexual crosses can be very effective in
revealing the extent of possible variation and the genetic basis of resistance (Brent and
Hollomon, 1988). Sexual crosses between triadimenol-sensitive field isolates of E
graminis f.sp. hordei were analysed with respect to variations in sensitivity of their
progeny (Hollomon et al., 1984). The progeny from the cross were found to be less
sensitive than both parents, indicating that the genotypes of the two parental phenotypes
were different. This study showed the extent of variation possible in resistance to triazole
fungicides that could be generated in field populations and indicated how the population
might shift under selection (Brent and Hollomon, 1988). In fungal populations where the
role of the sexual stage is not always clear, such studies may yield data that are difficult to
interpret.
33
1.8.2 Genetics of DMI resistance
Detailed studies on the genetic basis of resistance to DMIs have been carried out
with laboratory-generated mutants of A. nidulans (van Tuyl, 1977) and N. haematococca
var. cucurbitae (Kalamarakis et al., l99l) and field isolates of E. gramlnis f.sp. hordei
(Hollomon et al., 1984; Butters et aI., 1986), V. inaequalrs (Stanis and Jones, 1985) and
Pyrenophora teres (Peever and Milgroom, 1992). Analysis of A. nidular¿s mutants showed
thatimazalil resistance was based on a system involving eight different loci allocated to six
different linkage groups. The large number of linkage groups indicates that the loci
conferring resistance are not clustered but distributed over the fungal genome @e Waard
and Fuchs, L982). These mutants also showed cross-resistance to fenarimol. Mutations at
two loci occurred most frequently and led individually to resistant factors of approximately
10 to 20. Resistance factors attributed to mutations at all other loci were considerably
smaller. However, when different single-gene mutations were combined in the same
isolate, the resistance factor was large, suggesting an additive interaction of different genes
and hence demonstrating that resistance to DMIs in A. nidulans is controlled by many
genes.
Laboratory-induced mutants of N. haematococca var. cucurbitae were selected for
resistance to fenarimol. Kalamarakis et al. (1989) showed that when 30 mutants of N.
haematococca vaÍ. cucurbitae with high resistance to triadimenol were analysed only one
locus was involved. Cross-resistance was also observed to other triazole DMIs, but not to
the imidazole DMIs. From these results, Kalamarakis et al. (1989) suggested that
resistance in N. haematococca var. cucurbitae was caused by a single major gene.
However, in more recent experiments Kalamarakis ¿l al. (1991) analysed 51 mutants and
concluded that at least nine chromosomal loci were involved.
34
The genetic basis of DMI resistance in V. inaequalis was studied by crossing
sensitive-sensitive, sensitive-resistant and resistant-resistant fenarimol-treated field
isolates. It was found that fenarimol resistance was, in all cases, determined by a single
gene (Stanis and Jones, 1985). However, a more recent report suggests that DMI resistance
in V. inaequalis is controlled by many genes (Sholberg and Haag, 1993). From nine
crosses of V. inaequalis, eight progeny were as insensitive to flusilazole or myclobutanil as
the least sensitive parent. Mating between isolates with different sensitivities did not
produce a consistent pattern of sensitivity levels in the progeny. Sholberg and Haag (1993)
argued that the single gene effect may not have been detected in their studies due to the
fungicide concentrations being too high. It is also possible that this effect is specific to
fenarimol and does not operate with flusilazole or myclobutanil. In section 1.7.1 the
occuffence of cross-resistance was discussed, and it seems that from this study that the
level of resistance to one DMI may differ considerably from that of another.
Assessments of the genetic basis of DMI resistance in E. graminis f.sp. hordei vary
in the literature. Crosses between triadimenol sensitive-sensitive and sensitive-resistant
field isolates were analysed with respect to sensitivity variations of their progeny
(Hollomon et aL,1984). The progeny produced from both crosses had a wide sensitivity
distribution and some were less sensitive than both parents. This continuous distribution
of sensitivity suggested that resistance may be controlled by many genes. However, Brown
et al. (L992) concluded that alleles at a single locus control sensitivity and resistance in
such crosses. The progeny from a cross between sensitive and moderately resistant isolates
produced responses similar to those of the moderately resistant parent. In addition, all
progeny showed the parental phenotype rather than the phenotypes of control isolates with
lower or higher resistance. Similarly, all resistant progeny of the sensitive-highly resistant
cross, produced responses similar to the highly resistant isolate, rather than moderate or
35
low resistance. In all cases, the segregation ratio was 1:1, indicating that two alleles at a
single locus controlled resistance and sensitivity to triadimenol in crosses of sensitive with
moderately resistant and highly resistant isolates. There was no evidence for polygenic
control for triadimenol resistance. In further tests, all progeny classified as resistant to
triadimenol were also classified as resistant to four other triazoles. This is consistent with
the triadimenol resistance allele also conferring cross-resistance to other triazoles (Blatter
et a1.,1998).
Preliminary studies on the inheritance of DMI resistance in U. necator have been
initiated by crossing DMl-sensitive and -resistant strains (Corio-Costet et a1.,1999). The
progeny were characterised and five major phenotypes were detected, suggesting that
resistance in U. necator is polygenically governed. Results from this study and those
reported above for different fungi and DMIs will be useful in determining the inheritance
and the number of genes controlling DMI resistance in Australian isolates of U. necator.
1.9 MONITORING FUNGICIDE RESISTANCE
Monitoring for fungicide resistance involves testing samples of field populations of
target pathogens for variation in fungicide sensitivity. According to Staub and Sozzi
(1984), monitoring can be used to gather information about fungicides used and the target
population such as: assessing resistance risk and establishing 'baseline sensitivity' data
during the development or release of a new fungicide; analysing product failures and
rumours of resistance; evaluating the success of anti-resistance strategies; and in
determining stability of resistance between growing seasons or after withdrawal of a
fungicide. However, where resistance is controlled by one or two genes, each exerting a
large effect, monitoring techniques may not be sufficiently sensitive to provide adequate
36
warning of the development of resistance. Consequently, rapid, molecular-based,
diagnostic tools may help to identify resistant strains in the field. In contrast, where
resistance is controlled by many genes, and changes are more gradual, partially resistant
strains may exist at a high frequency before practical loss of disease control occurs. These
can be detected by monitoring, which will indicate the risk of more severe resistance
developing.
Sampling method, size, number and distribution is very important when monitoring
for fungicide resistance (Brent, 1988). Bulk samples or many single lesions at different
times may be analysed. Sample size depends upon the aim of the monitoring study, that is,
if initial signs of resistance are sought, then a larger sample is needed to reveal any rare
resistant forms that may be present in the population. However, to determine the
proportion of resistant isolates or differences in sensitivity in the population, smaller
samples may be better (Brent, 1988).
1.9.1 Bioassays for fungicide sensitivity
The method used to test for fungicide sensitivity depends on the purpose of the
monitoring and the fungus/fungicide combination (Staub and Sozzi, 1984). Furthermore,
tests must give realistic, quantitative, reproducible and readily understandable results. The
Food and Agriculture Organisation (FAO) and Fungicide Resistance Action Committee
(FRAC) have both published details of recommended methods for a number of crop
pathogens (Anon, 1982; Anon, 1991). 'When monitoring for fungicide resistance, baseline
sensitivities of wild, untreated populations should be established to detect shifts in the
sensitivity of treated populations. The ease of bioassay will depend largely on the test
fungus, for instance, the obligate grapevine powdery mildew pathogen is difficult to
manipulate in the laboratory.
37
A number of general bioassay methods used to determine baseline sensitivities are
provided by Georgopoulos (I982a). These include: the rate of increase of colony diameter
on treated agar medium; the rate of dry weight increase in liquid medium containing
fungicide; and the germination of spores, gerln tube elongation and morphology in
fungicide solutions or on solid medium, plants or plant parts treated with fungicide. Only
the latter approach is suitable for U. necator due to its obligately biotrophic nature.
However, spore germination does not provide a good indication of resistance to DMI
fungicides that inhibit primarily mycelial growth and are much less active on spore
germination (Staub and Sozzi, 1984). It is generally best to study the response of the
fungus to various concentrations of fungicide. From this the degree of resistance may be
measured by: comparing the response to the same concentration; determining the
concentration that results in minimal growth; and determining the concentration that
inhibits fungal growth by 50Vo (ECso). During testing, it is important to observe
differences in pathogenicity, growth rate, sporulation, and other properties that contribute
to the "fitness" of the pathogen (Georgopoulos, 1982). This will help to explain and
predict the dynamics of resistant fungal populations.
Bioassays to test for fungicide sensitivity in U. necator have been developed and
vary slightly from one research group to another (Cartolaro and Steva, 1990; Nass, l99I;
Gubler et al., 1996; Erickson and Wilcox, 1997). In all cases, grapevine leaf discs were
imbibed with different concentrations of various DMIs and inoculated with U. necator
conidia. As DMIs act mainly on hyphal elongation, the length of hyphae may be examined
3 days after inoculation with U. necator. Steva (1994) found that isolates with hyphae
longer than 250pm could be classified as resistant whereas those with hyphae less than
250pm and incapable of forming conidiophores and secondary conidia were classified as
sensitive. Germination tests have also been used (Nass, 1991), however, this is not an
38
effective method for determining the effect of DMIs on U. necator because DMIs do not
affect spore germination and have no effect until the formation of the first appressorium
(Steva, 1994). Another method involves scoring each leaf disc 10-14 days after
inoculation, according to the percentage surface area colonised and comparing the mean
scores of each treatment with the control (Gubler et a1.,1996; Erickson and'Wilcox,1997).
The data obtained can then be graphically represented using the probit-log method and the
ECso determined for each isolate tested,
1.9.2 Management of fungicide resistance
There is no universal solution to the management of fungicide resistance.
However, according to Wade (1988), the following fundamental principles may be applied:
(a) minimise selection pressure on the pathogen by "at-risK' fungicides by using a variety
of methods; (b) start anti-resistance strategies early before resistance becomes a problem;
and (c) consider both the biology of the fungus and mode of action of the fungicide.
Furthermore, measures that influence selection pressure in such a way that the chance of
build-up of a resistant fungal population is reduced, without decreasing the impact of the
fungicide, will be important (Dekker, 1982). When developing anti-resistance strategies a
number of factors should be considered, such as: the dose applied; the frequency of
application; the mode of application; the effectiveness of the treatment; the extent of the
area treated with one chemical; and whether fungicides are applied in rotation or as
mixtures.
DMIs were applied extensively when they were first introduced in the early 1970s.
They were marketed as single products, and repeated applications were often recommended
(Brent and Hollomon, 1988). To counteract resistance to DMIs, different strategies are
necessary depending on the region, the disease pressure, the crop, and the target pathogen
39
(Scheinpflug, 1988). In 1987 the FRAC made reconìmendations for the use of DMIs in
Europe (Brent, 1995), the advantages and limitations of which are discussed below:
(a) The repeated application of DMIs alone should be avoided. Repeated DMI
applications allow rapid build-up of resistant individuals within a population, eventually
reducing fungicide efficacy.
(b) For crop diseases requiring multiple applications, mixtures or alternating with
non-cross-resistant fungicides should be used. Steva (1994) found that this
recoÍtmendation was not suitable for controlling grapevine powdery mildew. Mixtures of
DMIs with sulphur or dinocap proved to be ineffective anti-resistance strategies, in the
former case possibly due to antagonism with DMIs (Steva, 1994; Gubler et aI., 1996). In
contrast, alternating DMIs and sulphur or dinocap appeared to slow down resistance
development in U. necator. In Australia, it is coÍrmon for viticulturists to mix DMIs for
the control of grapevine powdery mildew with cupric hydroxide to prevent the
development of downy mildew. Anderson and Wicks (1993) have reported that this
practice reduces the efficacy of myclobutanil, triadimenol and propiconazole and,
therefore, should be avoided. The FRAC recommends that if mixture or alternation is not
possible, DMIs should be reserved for the critical part of the season. This will reduce the
number of DMI applications within a season, however, if grapevine powdery mildew is not
controlled early in the season this may allow the build-up of resistant strains which will be
much more difficult to control later in the season.
(c) DMIs should be used as recommended. Using reduced or increased doses tnay
increase the number of resistant individuals within a population.
(d) Other measures involving the incorporation of resistant varieties, good agronomic
practices and plant hygiene should be adopted whenever possible. This will reduce the
40
amount of chemicals used, thereby decreasing the likelihood of fungicide resistant U.
ne c at o r strains developing.
It is important to note that the above guidelines were developed for managing DMI
resistance in European countries and all may not be suitable for Australian conditions.
AVCARE are currently reviewing recommendations for preventing or delaying the onset of
resistance to DMIs in Australian conditions (8. Winter, pers. com). These
recommendations have been incorporated into the recently AusVitrM Vineyard
Management System which is available to viticulturists Australia-wide. AusVitrM utilises
weather data, crucial to effective pest and disease management, from automatic weather
stations installed in the vineyard. The program includes modules and features for pest and
disease management, spray planning and recording, a chemical database and weather
monitoring. It is hoped that by using this program, viticulturists will improve their
vineyard management skills and reduce the likelihood of fungicide resistance developing in
the vineyard.
1.1.0 MoIECULAR MARKERS
When trying to understand how fungicide applications become less effective in
controlling disease, the origin and maintenance of genetic variation must be considered
(Brown, 1995). Genetic analysis of fungal populations requires the implementation of
various markers used in molecular biology. A wide range of molecular techniques are
available to detect DNA sequence variation within and between fungal populations. These
include the use of either restriction fragment length polymorphisms (RFLP) or polymerase
chain reaction (PCR) based molecular markers. These techniques may be used to detect
4L
fungicide resistant strains of (1. necator and to determine the importance of sexual
reproduction in generating variation with respect to fungicide resistance.
1.10.1 RFLP markers
RFLPs result from mutations or specific differences in the DNA sequence, that alter
fragment sizes obtained after digestion with specific restriction enzymes (Michelmore and
Hulbert, 1987). A number of different probes can be used to detect RFLPs of the nuclear
genome. Single (or low) copy probes have been used widely and these may be isolated as
random or defined genomic clones or as cDNA (complementary DNA) clones. Multicopy
probes, recognising dispersed repetitive sequences, can be used to look at more than one
locus at a time and can be used to generate DNA fingerprints of individuals. They have
been used in filamentous fungi to identify genetic subpopulations and to differentiate
individual isolates within a species by means of DNA fingerprinting (McDonald and
McDermott, 1993). DNA probes have been developed to differentiate among isolates of E
graminis f .sp. hordei (ODell et aL,1989; Christiansen and Giese, 1990). A sequence of
about 4 kb of E. graminis f.sp. hordei genomic DNA has been used as a probe (E9) to
detect variation among individuals of E. graminis f.sp. hordei with different levels of
resistance (sensitive, low, medium, high) to triadimenol (Brown et a1.,1990). However, no
RFLP was found to be completely associated with triadimenol resistance due to extensive
diversity among isolates with the same level of resistance. Brown et aI. (1990) suggested
that the different levels of resistance may have evolved individually many times, and that it
is incorrect to assume that resistance to triazole DMIs is controlled by a polygenic system.
Inconsistencies in the literature on the genetic control of triazole resistance in E. graminis
f.sp. hordei demonstrate that further work is required to determine whether triadimenol
resistance is indeed under monogenic or polygenic control.
42
Another example where DNA probes have been used to determine the genetic
structure of fungicide sensitive and resistant strains is for Alternaria alternata, a pathogen
of Japanese pears. Adachi et aI. (L996) cloned four moderately repetitive DNA sequences
from A. alternata (AAR clones) and used them as DNA fingerprinting probes for
comparison of genetic structure of polyoxin sensitive and resistant subpopulations. The
resulting hybridisation patterns were variable and could not be used to differentiate
sensitive, moderately resistant, and highly resistant subpopulations. They suggested that
the two levels of polyoxin resistance must have evolved several times, resulting in a
random distribution of resistance gene(s) within the different genotypes.
RFLPs have been used to identify polymorphisms in Australian populations of U.
necator. Cloned sequences of total U. necator were used as probes to identify RFLPs
among total DNA from clonal lines of U. necalor (Evans et al., 1997b; Stummer et al.,
2000). Polymorphisms were detected using four probes that hybridised to multi-copy
sequences. To date,34 unique haplotypes have been identified among 81 clonal lines of U.
necator, revealing genetic variation within different viticultural regions in Australia
(Stummer et a1.,2000). In addition, the isolates studied were observedto fall into one of
two broad genetic groups. These studies have provided tools to examine the biology and
epidemiology of (J. necator. The development of additional U. necator-specific DNA
markers, linked to DMI resistance/sensitivity, in the future will allow sensitivity to DMIs to
be studied.
43
1.10.2 PCR markers
PCR is one of the most popular techniques to detect polymorphisms among target
sequences in phytopathogenic fungi (Foster et aL, 1993; Brown, 1995). The method is
simple and allows a large number of individuals to be screened using small amounts of
DNA. PCR markers can be divided into two groups; those based on arbitrary primers
(Welsh and McClelland, 1990; Williams et aL,1990) and those known as sequence tagged
sites (STSs) with primers designed from a known sequence (Olsen et al., 1989). PCR-
based markers include, random amplified polymorphic DNAs (RAPDs), mini- and
microsatellites (STSs), and amplified fragment length polymorphisms (AFLPs).
L.10.2.1RAPD markers
RAPD markers are produced by amplification of random DNA segments by using
single primers of arbitrary sequence (usually 10 bases in length) (Welsh and McClelland,
1990; Williams et aI., 1990). Polymorphisms are usually detected as the presence or
absence of amplified DNA sequences. RAPDs have been used to study variation in many
fungi, including; E. graminis f.sp. hordei (McDermott et al., 1994), Rhizoctonia solani
(Duncan et al., 1993), Botrytis cinerea (van der Vlugt-Bergmans et al., 1993),
Cladosporium fulvum (Arnau et al., 1994), Verticillium fungicola (Bonnen and Hopkins,
1997) and U. necator (Délye et a1.,1995; Délye et al.,1997a and b). Bonnen and Hopkins
(1997) used RAPD analysis to detect DNA polymorphisms in isolates of V. fungicola
treated with benzimidazole fungicides. This allowed isolates collected prior to 1993 to be
divided into four groups, nevertheless, limited correlations could be drawn between RAPD
groupings and fungicide response. However, isolates collected from 1993 to 1995 were
found to be highly resistant to benomyl and thiabendazole and they all belonged to RAPD
44
group four. The level of homogeneity observed in the V. fungicolø population may be due
to the intensive use of fungicides on the crop.
A RAPD assay on DNA extracted from conidia and mycelium of U. necator has
been described by Délye et al. (1995), in which 16 of 95 primers tested on 13 strains of U.
necator, from Switzerland, Portugal and France, revealed DNA polymorphisms. A
subsequent phenogram revealed two distinct groups, a French group and a Swiss-
Portuguese group. Recent studies by Délye et al. (I997a) have assessed the genetic
variation of U. necaf.or isolates collected from Europe, India and Australia. They found
that two mating types and three main genetic groups exist, two groups comprising
European and Australian isolates and one group comprising only Indian isolates. This is
consistent with studies by Evans et al. (I997b) and Stummer et al. (2000) who found that
Australian isolates could be allocated to two main groups. Furthermore, a PCR primer
pair, derived from a RAPD fragment specific to the Indian isolates, was shown to be
suitable for use with field material. Using the RAPD assay developed previously (Délye et
al., 1995) the genetic diversity of DMI-treated U. necator isolates was investigated (Délye
et aI.,I997b), DMl-resistant isolates were found in all genetic groupings and could not be
distinguished from DMl-sensitive isolates.
1.10.2.2 PCR detection of fungicide resistance
Rapid methods utilising PCR are being trialed to detect fungicide resistant isolates
within population of a number of fungal pathogens. Specific oligonucleotide markers have
been used to identify benzimidazole resistant isolates of B. cinereø (Luck and Gillings,
1995), V. inaequalls (Koenraadt and Jones, L992), R. secalis (Wheeler et aI., 1994) and
DMI resistant isolates of U. necator (Délye, et aI,I997d).
45
Benzimidazoles bind to the B-tubulin protein, consequently, resistance to these
fungicides has been associated with point mutations in the B-tubulin genes. Luck and
Gillings (1995) amplified a fragment of the p-tubulin gene from B. cinerea in a PCR
reaction using generic primers, and cloned and sequenced the DNA. The sequence
obtained was used to design primers specific to the B. cinerea p-tubulin gene, from which
amplified products were cloned and sequenced. All benzimidazole sensitive isolates were
found to contain the sequence GAG (Glu) at a specific codon whereas resistant isolates had
a single base substitution to GCG (Ala). From this, a rapid detection method was designed
which relied on allele-specific PCR using an internal primer with the codon mutation at its
3'base. This approach was used to amplify specifically a p-tubulin gene fragment from a
highly resistant strain of B. cinerea. A simple microwave-based procedure has been
developed to prepare samples for PCR directly from infected tissue, so that benzimidazole
resistance could be detected without culturing the fungus on medium treated with
fungicides and without the use of lengthy DNA extraction methods (Luck and Gillings,
1e9s).
More recently, the U. necator gene encoding the target-site of DMIs, from five
triadimenol-sensitive and seven triadimenol-resistant isolates was cloned and sequenced
(Délye, et al,I997c). PCR primers, which correspond to sequences flanking the 1683 bp
gene were used to amplify a 1756 bp fragment. This fragment was cloned and sequenced
for each of the isolates. A single mutation (A{o-T) leading to the substitution of a
phenylalanine residue for a tyrosine residue at position 136, was found in all isolates with
RF values greater than 5 @élye, et aI, I997d). No mutation was found in sensitive or
weakly resistant isolates. An allele-specific PCR assay was developed using an internal
primer with the codon (T) mutation at its 3' base. Of the isolates tested, only those with
46
RF values greater than 5 carried the mutation. This is the first study in which a mutation in
the target-site of DMIs has been shown to be responsible for high levels of resistance to
triadimenol
1.10.3 Applications of molecular markers to U, necator
Molecular markers can be applied to rapidly detect fungicide resistant strains of U.
necator. In addition, both RFLP and PCR based markers can be used to identify individual
genotypes and therefore may be useful in discriminating between DMI sensitive and
resistant isolates of U. necator. Molecular markers will also be useful in studying the
epidemiology, population genetics and inheritance of fungicide resistance in U. necator.
RFLPs can provide large numbers of polymorphic markers. Modified restriction sites
rarely occur within fungicide resistance alleles and, as RFLPs are not generally specific for
a particular resistance mechanism, correlations must be established between RFLPs and
fungicide resistance (Hollomon, 1990).
As the Cl4-demethylase gene from U. necator has been cloned and sequenced, we
may be able to use the specific PCR primers that flank the gene, to clone and sequence the
same gene in Australian isolates of U. necator. In addition, many genes and their
corresponding proteins ^te
highly conserved throughout species (Hollomon, 1990),
therefore genes isolated from A. nidulans or S. cerevisiae may be useful as heterologous
probes to isolate the equivalent gene from fungi such as U. necator.
47
1.11 SUvTMARY
Resistance to DMIs has been identified in populations of U. necator collected from
different viticultural regions within Europe, South America and USA. In Australia, DMIs
have been used widely to control grapevine powdery mildew, however, the extent of
resistance to these fungicides in U. necator is not known. Consequently, baseline
sensitivities should be determined by examining wild-type populations of U. necator. The
extent of DMI resistance in U. necator from different viticultural regions in Australia can
be established by means of a bioassay. Once this information is gained, recombination
studies will be important to determine the inheritance and the number of genes controlling
DMI resistance in U. necator. This may then provide information on the relative
importance of the sexual stage and its involvement in the development and maintenance of
fungicide resistant strains.
Molecular markers have been developed to study variation of U. necaror within and
among different viticultural regions in Australia. In addition, specific primers have been
developed to detect a mutation associated with resistance to triadimenol (Délye, et al,
I997d). These existing markers need to be tested for their ability to discriminate between
DMI sensitive and resistant Australian isolates of U. necator. If necessary, additional and
different molecular markers may need to be developed for rapid detection of DMI resistant
strains of U. necator. DNA detection methods should be valuable in research on the
dynamics of fungicide resistance genes in field populations of U. necator.
48
1.12 RnSEARCH OBJECTIVES
Bioassays for fungicide resistance have been developed previously to screen U.
necator isolates for reduced sensitivity to DMI fungicides (Steva, L994; Gubler et aI.,
1996; Erickson and Wilcox , 1997). In addition, the U. necator gene encoding the target-
site of DMIs, l4q-demethylase (CYP51), has previously been cloned and sequenced, and a
mutation in this gene shown to be responsible for triadimenol resistance (Délye, et al,
1997c; Délye, et aI, I997d). In the late 1990 s the development of resistance become a
concern to viticulturists in South Australia due to the poor performance of DMIs in
controlling powdery mildew and due to reports of the development of DMI resistance
overseas. Consequently, existing spray programs to control powdery mildew must be
continually evaluated to prevent these problems from occurring in Australian vineyards. It
is unknown if Australian populations of U. necator have developed reduced sensitivity to
DMIs, therefore, the objectives of the research presented in this thesis were:
1. to determine a suitable bioassay for fungicide sensitivity to
(a) establish baseline sensitivities for isolates of U. necator previously unexposed to DMIs
(b) determine if isolates previously exposed to DMIs show reduced sensitivity to DMIs
commonly used to control powdery mildew in Australian vineyards
(c) identify representative DMl-sensitive and -resistant isolates of U. necator
(d) examine the existence of cross-resistance between commonly used DMIs;
2. to develop DNA markers for rapid detection of DMl-resistant field isolates of U. necator
by
(a) cloning and sequencing thel4ø-demethylase gene from representative DMl-sensitive
and -resistant isolates, and

49
(b) comparing sequences from DMl-sensitive and -resistant isolates to detect mutations
associated with DMI resistance;
3. to elucidate the inheritance of DMI resistance by
(a) crossing isolates of opposite mating type and of known DMI sensitivity, and
(b) analysing progeny using the bioassay for fungicide sensitivity and molecular markers
50
CHAPTER 2.0
GBuBnAr, M¡.TBRIALS AND MNTTTOUS
2.I CoITECTIoN on U. NECATOR SAMPLES
Diseased leaves or berries were collected from vineyards or home gardens in South
Australia (SA), non-phylloxera infested regions of Victoria (Vic) and Western Australia
(WA) (Figure 2.1): five sites with no previous exposure to DMI fungicides (unexposed
population) and nine sites where practical resistance (selected population) to these
fungicides was suspected. The vineyards sampled, the number and type of sprays applied
to control powdery mildew and the number of single-spore isolates established from each,
are listed in Table 2.1. Diseased material from vineyards with suspected practical
resistance to DMI fungicides was generally collected from 'hot-spots' (small areas of
powdery mildew infected leaves and berries that had survived DMI fungicide sprays)
otherwise; material was collected at random within the vineyard. Following collection,
diseased material was transferred to the Waite Campus laboratory and established in
culture on detached leaves.
2.2 PnopacarroN oF cr.AssHousE- cRo\ryN cRApEvINES
In order to establish a constant supply of disease-free leaves for the mass
production of conidia, grapevines were established and maintained in the glasshouse.
Grapevines (Vitis viniþra cv. Cabernet Sauvignon, clone LC10) were propagated from
chinosol-treated hardwood cuttings obtained from the Riverland Vine Improvement
Committee, Barmera, South Australia. Propagation of cuttings was initiated by soaking
them in RO (reverse osmosis) water for 8 h, followed by soaking in 0.0L7o sodium
51
Figure 2.L. A map of viticultural regions in Australia showing areas where U. necatorsamples were collected during the study.
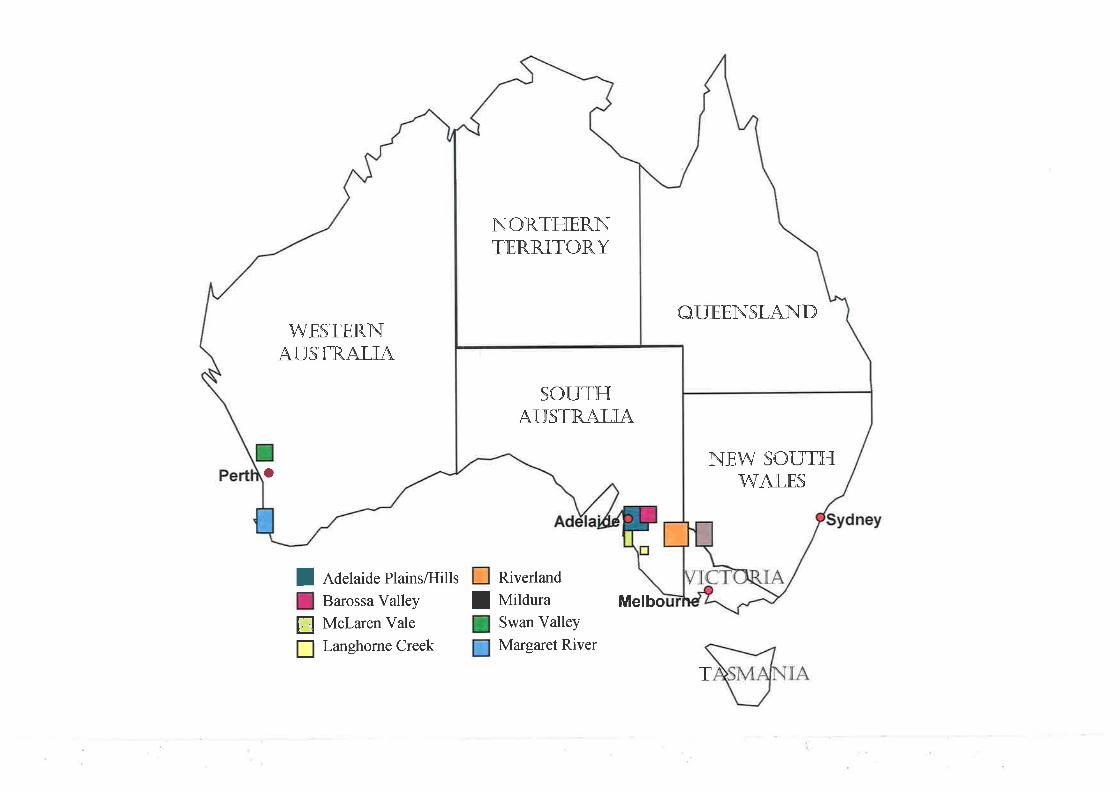
NEW SOUTHWA]LES
OUIEENSLAND
SOUTHAUSTRALTA
NORTTtrRNTERR]ITORY
o
WESTERNAUSTRALNA
I a¿.tuide PlainsiHills Riverland
Barossa Valley I tvtitdura
I Mclaren Vale Swan Valley
! Langhome Creek Margaret River
Melbo
T
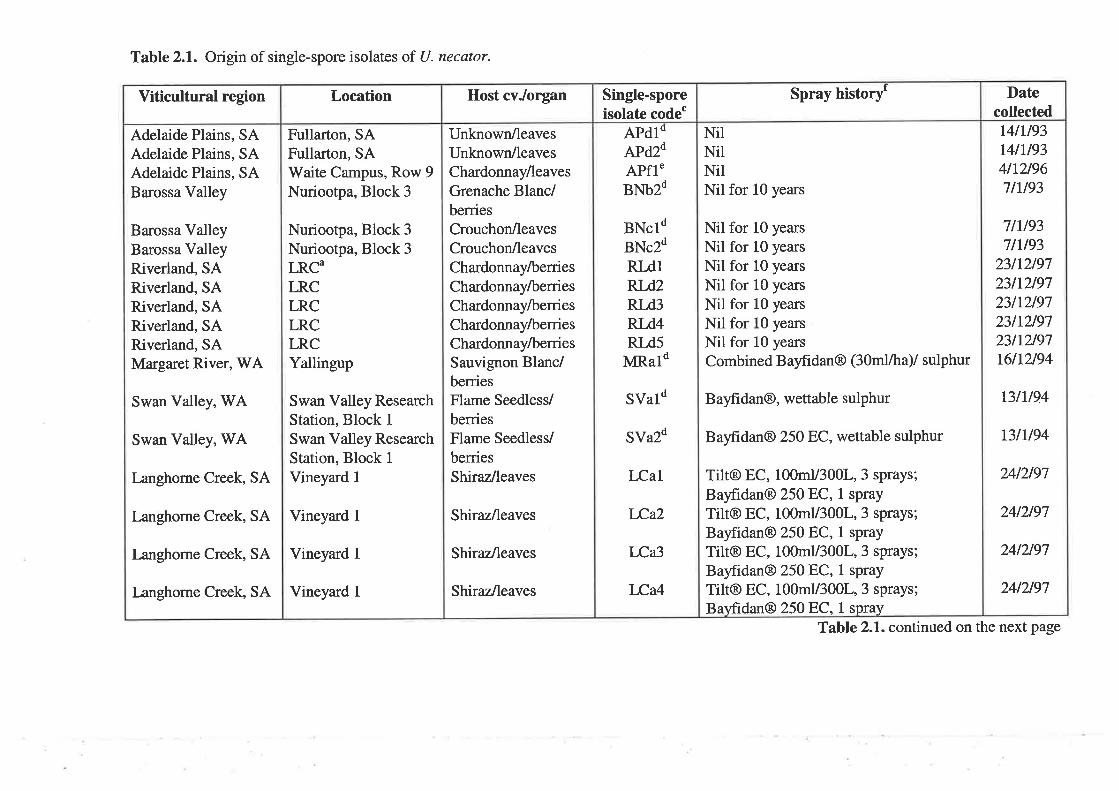
Table 2.1. Origin of single-spore isolates of U. necator.
DatecollectedL4tu93L4tU934tr2t9611U93
71U937tU93
231t219723112197
23112197
2yra9723t1219716lr2l94
13tu94
r3tU94
24t2t91
24t2t97
24t2t97
2412197
Spray historf
NilNilNilNil for 10 years
Nil for 10 years
Nil for 10 years
Nil for 10 years
Nil for 10 years
Nil for 10 years
Nil for 10 years
Nil for 10 years
Combined Bayfidan@ (30m1/ha/ sulphur
Bayhdan@, wettable sulphur
Bayfidan@ 25OEC, wettable sulphur
Tilr@ EC, 100my300l, 3 sprays;
Bayfrdan@ 250 E;C, 1 spray
Tilt@ EC, 100my300l,3 sprays;
Bayfidan@ 250 EC, 1 spray
Tilt@ EC, 100my300l,3 sprays;
Bayfidan@ 250 EC, 1 spray
Tilt@ EC, 100my300l, 3 sprays;
Bayfidan@ 250 EC, 1 spray
Single-sporeisolate code"
APdIOAPd2'tAPfl.BNb2d
BNcldBNc2dRI-d1RI-d2RT-d3
RT.d4
RT-d5
MRald
SVald
SVa2d
LCal
LCa2
LCa3
LCa4
Host cvJorgan
Unknown/leavesUnknown/leavesChardonnay/leavesGrenache Blanc/berriesCrouchon/leavesCrouchon/leavesChardonnay/berriesChardonnay/berriesChardonnay/berriesChardonnay/berriesChardonnay/berriesSauvignon Blanc/beniesFlame Seedless/
berriesFlame Seedless/
berriesShiraz:/leaves
Shiraz/leaves
Shiraz/leaves
Shiraz/leaves
Location
Fullarton, SAFullarton, SAWaite Campus, Row 9Nuriooþa, Block 3
Nuriootpa, Block 3
Nuriootpa, Block 3
LRC"LRCLRCLRCLRCYallingup
Swan Valley Research
Station, Block 1
Swan Valley Research
Station, Block 1
Vineyard 1
Vineyard 1
Vineyard 1
Vineyard 1
Viticultural region
Adelaide Plains, SAAdelaide Plains, SAAdelaide Plains, SABarossa Valley
Barossa ValleyBarossa ValleyRiverland, SARiverland, SARiverland, SARiverland, SARiverland, SAMargaret River, WA
Swan Valley, WA
Swan Valley, V/A
I-anghorne Creek, SA
I-anghorne Creek, SA
I-anghorne Creek, SA
Langhorne Creek, SA
Table 2.1. continued on the next page
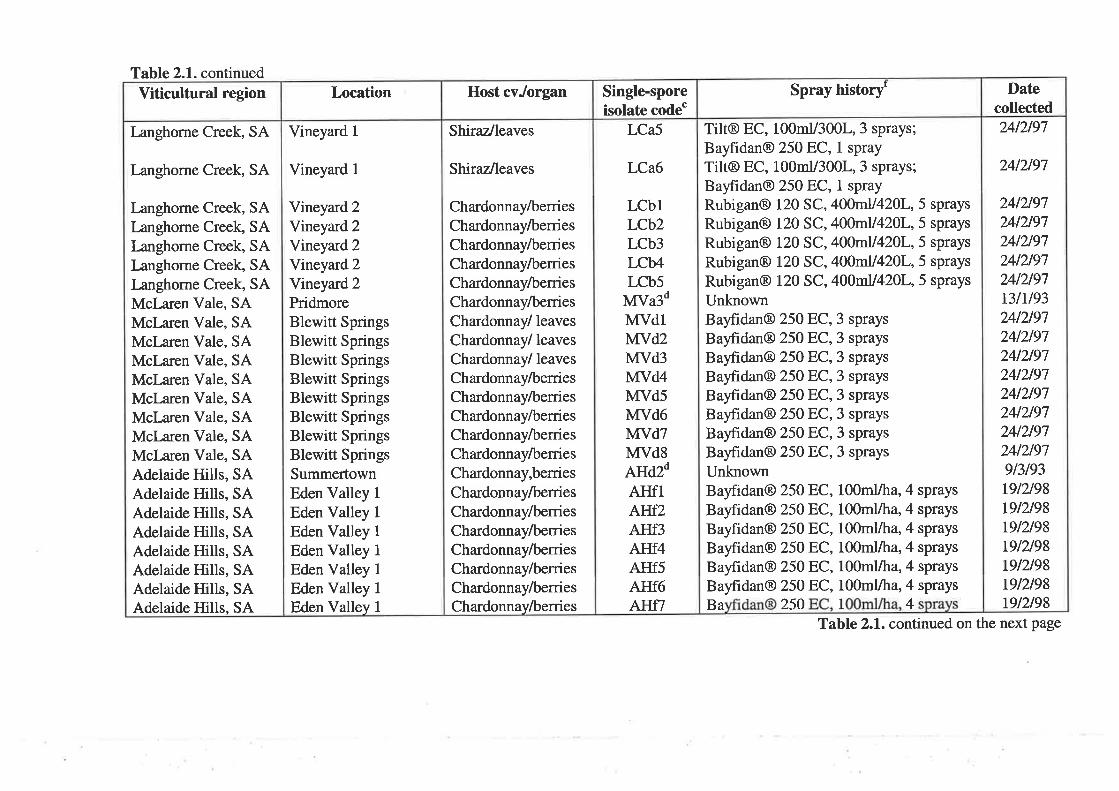
Table 2.1. continuedDate
collected24t2197
2412197
2412197
2412197
2412197
24t219724t2t97t3lU9324/2197
2412197
2412197
24t219724t21972412197
24t2197
24l2l9l9t3t93t9t2t9819t2198
19t2198
ßt49819l2l98t9l2198L9l2l98
Spray historyr
Tilt@ EC, 100mU300L,3 sprays;
Bayfidan@ 250 F:C, 1 spray
Tilt@ EC, 100mY300L, 3 sprays;
Bayfidan@ 25O E,C, 1 spray
Rubigan@ 120 SC, 400m1J420L, 5 sprays
Rubigan@ 120 SC, 400fü420L,5 sprays
Rubigan@ 120 SC, 400rn11420l-,5 sprays
Rubigan@ 120 SC, 400mU420L,5 sprays
Rubigan@ 120 SC, 4O0fü1420L,5 sprays
UnknownBayfidan@ 250 F;C, 3 sprays
Bayfidan@ 25O F:C, 3 sprays
Bayfidan@ 250 E;C, 3 sprays
Bayfrdan@ 250 EC, 3 sprays
Baylrdan@ 250 F;C, 3 sprays
Bayfidan@ 250 F:C, 3 sprays
Bayfidan@ 25O E;C, 3 sprays
Bayflrdan@ 25O E,C, 3 sprays
UnknownBayfidan@ 250 F;C, 100m1/ha, 4 sprays
Bayfidan@ 25O F:C, 100m1/ha, 4 sprays
Bayfidan@ 250 F:C, 100m1/ha, 4 sprays
Bayfidan@ 250 E;C, 100m1,/ha, 4 sprays
Bayfidan@ 250 E;C, 100mUha, 4 sprays
Bayfidan@ 25OE:C,100mUha, 4 sprays
Ba 250 1 4
Single-sporeisolate code"
LCa5
LCa6
LCblLCb2LCb3rcb4LCb5
MVa3dMVdlMVd2MVd3MVd4MVd5MVd6MVdTMVdSAHd2dAIIfIAHfzAHf3AI{f4AIIf5AIIf6AHfT
Host cvJorgan
Chardonnay/berriesCha¡donnay/berriesChardonnay/berriesChardonnay/berriesChardonnay/berriesChardonnay/berriesChardonnay/ leaves
Chardonnay/ leaves
Chardonnay/ leaves
Chardonnay/berriesChardonnay/berriesChardonnay/berriesChardonnay/berriesChardonnay/berriesChardonnay,berriesChardonnay/berriesChardonnay/berriesChardonnay/berriesChardonnay/berriesChardonnay/berriesChardonnay/berriesChardonnay/berries
Shiraz/leaves
Shiraz/leaves
Location
Vineyard 2Vineyard 2
Vineyard 2Vineyard 2Yineyard2PridmoreBlewitt SpringsBlewitt SpringsBlewitt SpringsBlewitt SpringsBlewitt SpringsBlewitt SpringsBlewitt SpringsBlewitt SpringsSummertownEden Valley 1
Eden Valley 1
Eden Valley 1
Eden Valley 1
Eden Valley 1
Eden Valley 1
Vineyard 1
Vineyard 1
Eden Valley 1
Viticultural region
Langhorne Creek, SA
I-anghorne Creek, SA
Langhorne Creek, SALanghorne Creek, SAI-anghorne Creek, SAI-anghorne Creek, SAI-anghorne Creek, SAMcl¿ren Vale, SAMcl¡ren Vale, SAMcl^aren Vale, SAMcl¿ren Vale, SAMcl-aren Vale, SAMcl-aren Vale, SAMclaren Vale, SAMcl¿ren Vale, SAMcl¡ren Vale, SAAdelaide Hills, SAAdelaide Hills, SAAdelaide Hills, SAAdelaide Hills, SAAdelaide Hills, SAAdelaide Hills, SAAdelaide Hills, SAAdelaide Hills, SA
Table 2.1. continued on the next page
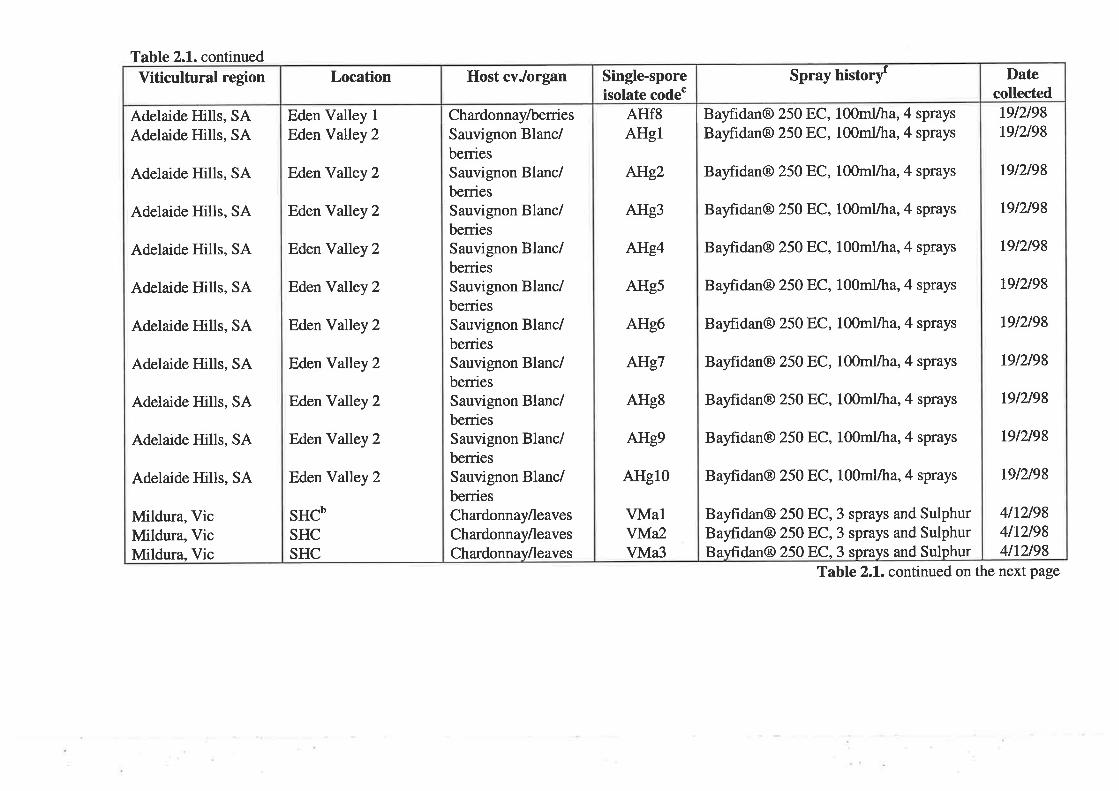
Table 2.1. continuedDate
collected19/219819t2t98
t9l2198
19t2t98
19t2t98
19t2t98
t9l2198
19l2l98
19t2t98
t9t2t98
19l2l98
4tr2l984tL2t984n2/98
Spray history'
Bayfidan@ 25O F:C, 100m1/ha, 4 sprays
Baylrdan@ 250 F;C, 100m1/ha, 4 sprays
Bayfidan@ 250EC,100mUha, 4 sprays
Bayflrdan@ 250 F:C, 100m1/ha, 4 sprays
Bayfidan@ 250EC,100mUha, 4 sprays
Bayfidan@ 25O E;C, 100m1/ha, 4 sprays
Baylrdan@ 250 F,C, 100m1/ha, 4 sprays
Bayfidan@ 25O F;C, 100mVha, 4 sprays
Bayfidan@ 25OEC,3 sprays and SulphurBayfidan@ 250F;C,3 sprays and SulphurBayfidan@ 25OF;C,3 sprays and Sulphur
Bayfidan@ 250 F;C, 100mUha, 4 sprays
Bayfidan@ 25OF;C,100mVha, 4 sprays
Bayfidan@ 250 E;C, 100m1/ha, 4 sprays
Single-sporeisolate code"
AIIf8AHgl
AfIg2
AHg3
ArIg4
AHg5
AHg6
AHgT
AHgS
AHg9
AHgl0
VMalVM¿VMa3
Host cvJorgan
Chardonnay/berriesSauvignon Blanc/berriesSauvignon Blanc/berriesSauvignon Blanc/berriesSauvignon Blanc/berriesSauvignon Blanc/berriesSauvignon Blanc/berriesSauvignon Blanc/berriesSauvignon Blanc/berriesSauvignon Blanc/beniesSauvignon Blanc/berriesChardonnay/leavesChardonnay/leavesChardonnay/leaves
Location
Eden Valley 1
Eden Valley 2
Eden Valley 2
Eden Valley 2
Eden Valley 2
Eden Valley 2
Eden Valley 2
Eden Valley 2
Eden Valley 2
Eden Valley 2
F/renYalley 2
SHCbSHCSHC
Viticultural region
Adelaide Hills, SAAdelaide Hills, SA
Adelaide Hills, SA
Adelaide Hills, SA
Adelaide Hills, SA
Adelaide Hills, SA
Adelaide Hills, SA
Adelaide Hills, SA
Adelaide Hills, SA
Adelaide Hills, SA
Adelaide Hills, SA
Mildura, VicMildura, VicMildura, Vic
Table 2.1. continued on the next page
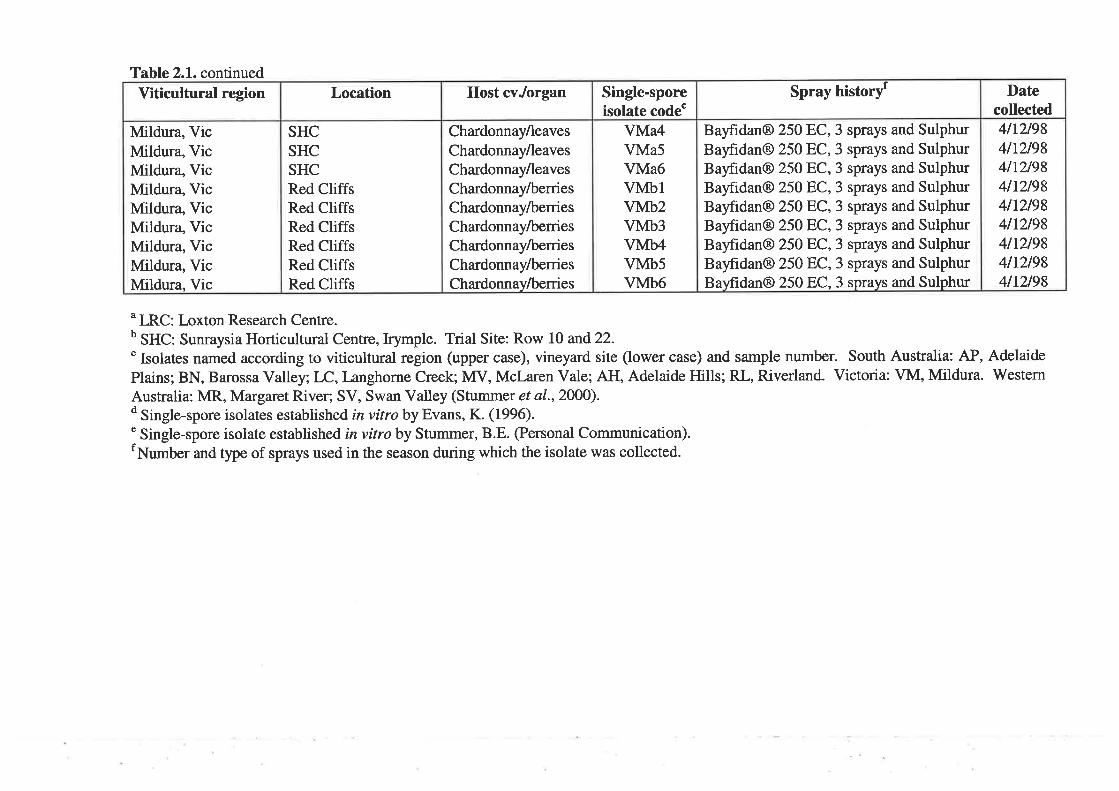
Table 2.1. continued
" IRC: Loxton Research Centre.o SHC: Sunraysia Horticultural Centre, Irymple. Trial Site: Row 10 and22." Isolates named according to viticultural region (upper case), vineyard site (lower case) and sample number. South Australia: AP, Adelaide
Plains; BN, Barossa Valley; LC,I-anghorne Creek; MV, Mcl-aren Vale; AH, Adelaide Hills; RL, Riverland. Victoria: VM, Mildura. Western
Australia: MR, Margaret River; SV, Swan Valley (Stummer et a1.,2000).d Single-spore isolates established in vitro by Evans, K. (1996).
" Single-spore isolate established invitro by Stummer, B.E. (Personal Communication).rNumber and type of sprays used in the season during which the isolate was collected.
Datecollected4lr2l984tr2t984lL2l984nzt984n2t984n21984tLA984tr2t984lr2l98
Spray historyr
Bayfidan@ 250F;C,3 sprays and SulphurBayfidan@ 25OF;C,3 sprays and SulphurBayfidan@ 25OEC,3 sprays and SulphurBayfidan@ 2508C,3 sprays and SulphurBayfidan@ 2508C,3 sprays and SulphurBayfidan@ 25OF;C,3 sprays and SulphurBayfidan@ 25OE;C,3 sprays and SulphurBayfidan@ 2508C,3 sprays and SulphurBayfidan@ 25OEC,3 sprays and Sulphur
Single-sporeisolate code"
VMa4VMa5VMa6VMblVMb2VMb3VMb4VMb5VMb6
Host cvJorgan
Chardonnay/leavesChardonnay/leavesChardonnay/leavesChardonnay/berriesChardonnay/berriesChardonnay/berriesChardonnay/berriesChardonnay/berriesChardonnay/berries
Location
SHCSHCSHCRed CliffsRed CliffsRed CliffsRed CliffsRed CliffsRed Cliffs
Viticultural region
Mildura, VicMildura, VicMildura, VicMldura, VicMildura, VicMildura, VicMildura, VicMldura, VicMildura, Vic
56
hypochlorite for 24 h and, finally, soaking in RO water overnight. Treatment for bud mite
(Colomerus vlris) was achieved by dipping the cuttings in 50 ml/L lime sulphur. The base
of each cutting was trimmed to remove the lower node. Following this, lower buds were
removed with a scalpel so only 4-6 buds remained per cutting. The base of each cutting
was dipped in 2000 ppm indole-3-butyric acid (IBA) for 40 secs and planted into a hot bed
(in a cold room maintained at 4"C) with the heating coil set at 25"C. After 6-8 weeks,
cuttings with roots and dormant buds were planted into 20 cm diameter pots containing
potting mix (see Appendix). After 6 weeks, cuttings were fertilised fortnightly with a
complete water soluble fertiliser (1:200 Moeco 30@ (NPK I2Vo:37o;87o), Moeco Pty Ltd,
Australia). During the autumn and winter months, active shoot growth was maintained by
providing a th photoperiod, from 00.00 to 01.00h (330 pE s-1m-2 from cool white
fluorescent bulbs) positioned above the plants. Grapevines were watered for 15 min/day
using an automatic dripper system and were maintained free from powdery mildew by
burning sulphur powder in a 220Y,2 wave verdamper (Nivola 8.V., Sassenheim Holland)
for t h/day. The predatory mites, Phytoseiulus persímilis (BioProtection Pty Ltd, Victoria)
or Typhlodromus occidentalis (Biological Services, Loxton, South Australia) were used to
control two-spotted mite (Tetranychus urticae). Flying insects, including white flies and
aphids, were controlled by sticky aphid and white fly traps (IPM Bugs for Bugs,
Mundubbera, Queensland).
2.3 DnT¡.cHED LEAF cULTURE AND ISoLATIoN oF SINGLE.SPoRE ISoLATES
A detached leaf technique, based on that described by Evans et aI. (1996), was used
for the isolation and establishment of single conidial-chain isolates of U. necator (Table
2.1). Petri plates (10 cm diameter, 2 cm deep: Falcon@, Becton Dickinson Europe, France)
57
containing 20 ml of l7o distilled water agar (Bitek, Difco Laboratories, Michigan) and 25
ttgllll pimaricin (Sigma Chemical Co., St Louis) were prepared. Four sterile toothpicks
were placed parallel to each other on the agar surface in order to minimise contact of the
leaf with the moist agar surface. In the laminar-flow cabinet, leaves were surface-sterilised
in O.57o sodium hypochlorite for 3 min and rinsed three times, for 2 min each time, in
sterile distilled water. A fresh cut was made to the basal end of the petiole and this was
immersed in the agar. The upper surface of each leaf was air-dried completely by leaving
the Petri plates open for 20 min within the laminar-flow cabinet. A sterile artist's
paintbrush was used to brush conidia from diseased leaves or berries, onto detached leaves.
The number of detached leaves prepared for each diseased bunch or leaf sample varied
according to the amount of infection present. Generally, one to three leaves were prepared
for each diseased sample. Inoculated leaves were incubated in an illuminated growth
chamber (330 pE s-lm-2 from cool white fluorescent bulbs) with a 12 h photoperiod at
25"C.
Single-spore isolates are defined as single conidial-chain isolates of U. necator
which are cultured continuously on grapevine tissue and have previously been referred to
as clonal lines (Evans, 1996) and clonal isolates (Stummer et al., 2000). Single-spore
isolates were established by transferring individual chains of conidia, selected at random,
from 10 to 12 day-old colonies to healthy, surface-sterilised detached leaves. A Pasteur
pipette tip was flamed and stretched to make a thin, sterile, hair-like end. This was used to
transfer individual chains of conidia. After 10 to 14 days incubation in the above
conditions, single colonies, which were free from visible microbial contamination, were
transferred individually, using a sterile artist's paint brush, onto micropropagated
grapevines for culture maintenance in vitro. One to three single spore isolates were
established from each bulk inoculation.
58
2.4 MrcnopnopacATroN oF GRApEvINES IN vITRo aND cULTURE
MAINTENANCE
Single-spore isolates of U. necator were maintained in vitro on V. vinifera cv.
Cabernet Sauvignon, clone CW44. Shoots were cut into nodal segments and five segments
placed upright into 50 ml of half strength MS medium (Murashige & Skoog, 1962),
supplemented with IsglL sucrose, 0.01 mg/L cr-napthaleneacetic acid (NAA), 10 mlll-
vitamins (5 glL myo-inositol, 25 mgtL nicotinic acid, 25 mglL pyridoxine-hydrochloric
acid, 5 mglL thiamine-hydrochloric acid, 100 mgll- glycine) and 8 g[L agar (Bitek, Difco
Laboratories, Michigan). The pH of the medium was adjusted to 5.8 with 1 N sodium
hydroxide before the addition of the agar and autoclaving. Cultures were maintained at
25oC with a 16 h photoperio d (250-450 pE s-rm-2 from cool fluorescent bulbs). After 14
days, nodal segments which had developed roots were transferred to a 500 ml culture tub
with a breather lid containing 70 ml of the same half strength MS medium, minus NAA.
After 14 days, each plantlet, which had developed expanded leaves, was inoculated with
one single-spore isolate of U. necator. The culture cycle was repeated each month to
provide a continuous supply of plantlets for dual culture with U. necator @gure 2.2a).
Single-spore isolates were transferred aseptically to healthy in vitro plantlets by removing
an infected leaf and brushing the conidia against a leaf of the plant being inoculated
(Gadoury and Pearson, 1988).
2.5 M¿.ss pRoDUCTIoN AND coLLECTToN oF coNrDrA
Conidia \ryere mass-produced by inoculating detached leaves with conidia from 14-
day-old infected micropropagated leaves by brushing the infected leaf over the surface of
the detached leaf (Figure 2.2b). After 14 days, cultures were examined for contamination
59
Figure 2.2. (a) Dual culture^o{^f/. necator and V. viniþra cv. Cabernet Sauvignon. (b) Adeiached grapevine leaf ofipftä agar in a Petri plate, 12 days after inoculation with U.
necator. (Photographs from Evans et al., 1996).
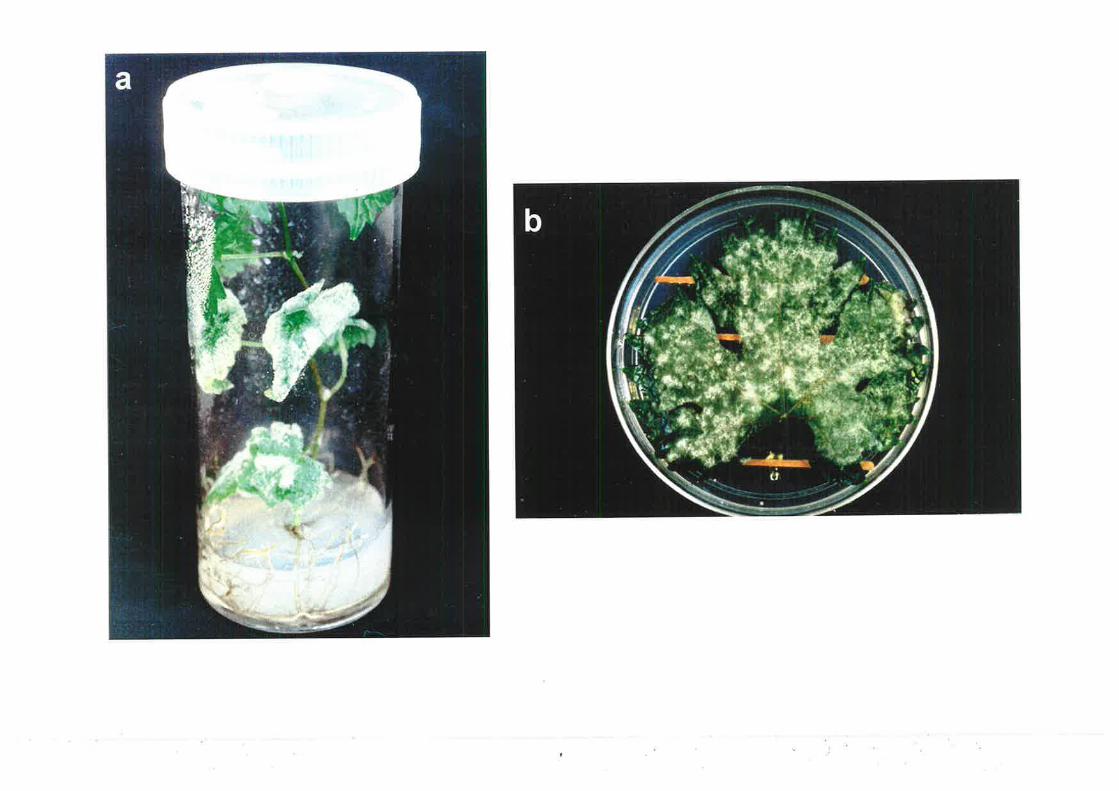
60
by other organisms, under a Wild stereomicroscope at 50x magnification. Conidia were
harvested using a cyclone separator connected to a vacuum pump (Evans et al., 1996).
Conidia were collected into 1.5 ml eppendorf tubes, frozen in liquid nitrogen and stored at
-70oC until needed. All collections of conidia were performed inside a perspex hood
which had been sprayed with 707o ethanol. Cross-contamination between isolates was
prevented by disinfecting all equipment with TOVo ethanol. This technique was used to
collect conidia for subsequent experiments involving DNA extractions.
2.6 DNA ExTRACTIoN FRoM coNIDIA
A method based on that described by Evans et aI. (1996) was used to extract DNA
from frozen conidia. This method was previously used to extract DNA from 30 to 40 mg
of conidia, however, as little as 5 mg of conidia may be used. A I20 to 900 pl volume of
extraction buffer (see Appendix) containing 2 mglml pre-digested pronase was added to 5
to 40 mg of frozen conidia. The conidia were immediately suspended in the buffer. To
rupture the conidia, glass beads were added to the tube and vortexed for 1 min. The
suspension was incubated at 37"C for 30 min and decanted into a new tube. The volume of
suspension was increased by washing the glass beads twice with 100 ¡rl of DNA wash
buffer (see Appendix). The suspension was extracted by adding an equal volume of
phenol:chloroform and centrifuging at 14000 rpm for 10 min. RNaseA was added to the
supernatant at a final concentration of 0.2 m{ml and incubated at 37"C for 30 min. The
suspension was extracted with an equal volume of chloroform/isoamyl alcohol and
centrifugation. The supernatant was transferred to a new tube and the DNA was
precipitated by adding 0.4 volumes of 4M ammonium acetate (pH 5.0) and 0.6 volumes of
cold isopropanol, and placing the tubes on ice for 2h or at -20oC overnight. The DNA was
6l
centrifuged at 14000 rpm for 15 min and the pellet was washed with 500 pl of coldTÙVo
(w/v) ethanol containing 10mM magnesium acetate, dried and resuspended in 3 to 30 pl of
TE buffer, pH 8.0 (see Appendix). The quantity of DNA extracted from each sample was
estimated by running aliquots, along with Hindtn digested lambda DNA of known
concentration, on a lEo ag rose gel with Tris-acetate-EDTA (TAE) buffer (see Appendix)
and visualising the bands under UV light following ethidium bromide staining. The
intensity of the U. necator bands were compared to bands of HindIJJ. digested lambda
DNA. (J. necator DNA yields ranged from 5 to 29 ngper mg of conidia.
2.7 DNA ExTRACTIoN FRoM U. Nøc¿,Ton INFECTED MICROPROPAGATED
GRAPEVINE PLANTLETS AND FIELD MATERIAL
Total DNA was extracted from micropropagated grapevine plantlets infected with
single-spore isolates of U. necator and field collected grapevine leaves and berries using
one of two methods; (a) CTAB (hexadecyltrimethylammonium bromide) extraction
method modified from Doyle and Doyle (1980) and (b) the DNEasy Plant DNA extraction
kit (Qiagen).
For the method based on that of Doyle and Doyle (1980), micropropagated
grapevine leaflets inoculated with single-spore isolates of U. necator were frozen in liquid
nitrogen. Approximately 1.0 g of frozen tissue was ground to a fine powder in liquid
nitrogen and suspended in 5 volumes (5 ml) of CTAB buffer (see Appendix) pre-heated to
60oC. The sample was incubated at 60oC for 20 min with occasional gentle mixing. An
equal volume of chloroform:isoamyl alcohol (24:I) was added to the homogenate and
placed on a rotating disc for 10 min. The tubes were centrifuged at 2000 rpm for 10 min at
15oC and the supernatant removed to a fresh tube. To remove proteins and cell debris, an
62
equal volume of phenol:chloroform was added to the supernatant and the tube placed on a
rotating disc for 15 min. The tubes were then centrifuged at 2000 rpm for 10 min. The
supernatant was removed and RNaseA was added to a final concentration of 0.1 mg/ml and
incubated at37"C for 30 min. The aqueous phase was then extracted with an equal volume
of chloroform:isoamyl alcohol (24:l) by placing the tubes on a rotating disc for 5 min. The
tubes were then centrifuged at 2000 rpm for 10 min at 15oC and the nucleic acids were
precipitated from the aqueous phase by the addition of 0.1 volumes of 10 M ammonium
acetate and 0.6 volumes of cold isopropanol overnight at 4"C. The tubes were centrifuged
at 12000 rpm for 15 min at 4"C. The pellet containing DNA was washed for 10 min with
cold 767o ethanol containing 10 mM ammonium acetate and the tubes were then
centrifuged at 12000 rpm for 12 min. The supernatant was poured off and the pellet dried
in a vacuum desiccator for 3 min before being resuspended in 200 pl of TE buffer, pH 8.0.
The quantity of DNA was estimated by running aliquots, along with Flindltr
digested lambda DNA of known concentration, on a IVo agarcse gel with TAE buffer and
visualising the bands under UV light following ethidium bromide staining. The intensity
of the (J. necator bands was compared to bands of Hindln digested lambda DNA. This
extraction procedure yielded approximately 23 pg of DNA per g of leaf tissue.
63
CHAPTER 3.0
Innxrn'rcarloN on MarrNc TvpBs
3.1. I¡nnoDUCTION
Cleistothecia, the sexual structures of U. necatorhave been observed worldwide on
many species of Vitaceae. In 1970, heterothallism was observed in isolates of U. necator,
however it was not until 1991 that Gadoury and Pearson (1991) demonstrated the existence
of two mating types among U. necator isolates from New York State. Cleistothecia were
first observed in Australia in 1984 (Wicks and Magarey, 1985) and, the heterothallic nature
of the fungus was confirmed in Australian isolates of the fungus in 1997 (Evans et aI.,
I997a). The two mating types were termed Mat(+) and Mat(-) and were identified among
17 clonal lines of U. necator, with ten being designated Mat (+) and seven Mat(-). Further
studies with 81 Australian isolates of U. necator found that 4l were designated Mat(-) and
40 Mat(+) (Stummer et aL,2000).
In order to study the genetics of fungicide resistance and to determine whether gene
flow is occurring within a population, a reproducible mating system is required.
Heterothallic fungi that have been used for research on the genetics of fungicide resistance
include, A. nidulans (van Tuyl,1977) and E graminis (Hollomon, 1981; Hollomon et al.,
1984) (see Section 1.8.2). The mating types of isolates collected from a population must
first be identified to determine which isolates may be used in crossing experiments to
generate offspring for genetic analyses. Once the mating types of fungicide resistant or
sensitive isolates are known, two isolates of opposite mating type may be crossed. The
progeny may be analysed for sensitivity to the fungicide concerned and the number of
64
genes controlling this phenotype can be determined, consequently this information may be
used to predict the likelihood of fungicide resistant strains developing.
For U. necator, the mating type of an isolate may be determined by crossing with
isolates representing Mat(+) and Mat(-) on grapevine tissue in vitro and examining the dual
cultures for the formation of cleistothecia after incubation in a controlled environment
(Gadoury and Pearson, 1988; Evans et al. 1997 a). Evans (1996) and Stummer et al. (2000)
evaluated techniques for the production of cleistothecia and viable ascospores in vitro. The
most successful and reproducible technique involved inoculating 2I-day-old
micropropagated grapevines in 500 ml containers and incubating them at 25oC with a 16 h
photoperiod for 4 weeks, followed by incubation at 20oC with a 12 h photoperiod
(Stummer et al., 2000). As a result, this method was chosen for the determination of
mating type for the isolates in this study and the production of cleistothecia.
The aims of the experiments described in this chapter were to determine the mating
type of U. necator isolates and to identify which would be suitable for use in crosses to
study the inheritance of fungicide resistance (see Chapter 6.0).
3.2 M¡.TnRIALS AND METHODS
3.2.1 ldentification of mating types
The mating type (Mat) of 27 single-spore isolates was determined by pairing each
with two isolates of known mating type on micropropagated plantlets. The remaining
isolates (see Table 2.I) werc not subjected to mating type analyses as they were not
maintained in vitro due to limited tissue culture resources. The 27 single-spore isolates
were paired invitro with isolate BNcl, representing Ma(l and BNc2, representing Mat(+),
65
using methods based on Evans (1996) and Stummer et al. (2000). Each cross was
conducted at least twice.
3.2.2Mating of isolates ín vitro
Conidia of isolates of unknown mating type and of BNcl and BNc2 were bulked
separately on two micropropagated grapevines per isolate. After incubation for 31 days at
25'C with a 16 h photoperiod (250-450 ¡rE s-rm-2¡, each isolate of unknown mating type
was paired separately with BNcl and BNc2 on micropropagated grapevines by brushing a
sporulating leaf onto the first two to three apical leaves of the healthy recipient plantlet.
Each healthy leaf received conidia from both an isolate of unknown mating type and BNcl
or BNc2 in close proximity to one another. Each unknown isolate was also paired with
itself as a control for self- compatibility. Only one micropropagated grapevine was used
per cross due to limited availability of plantlets. The inoculated plantlets were incubated at
25"C with a 16 h photoperiod (as above) for 4 weeks after which the formation of
cleistothecia was assessed using an Olympus SZ-PT stereo-microscope at 18x to 50x
magnification. Each culture was assessed at weekly intervals thereafter. Cultures in which
no cleistothecia had formed after 4 weeks were transferred to an illuminated growth
chamber (330 pE r-t--') with a 12 h photoperiod at 20oC and assessed weekly for the
formation of cleistothecia. Unknown isolates were considered to be Mat(-) or Mat(+) if
cleistothecia formed with standard isolates of Mat(+) and Mat(-), respectively. The time
taken to form cleistothecia and early morphology of cleistothecia were recorded for each
successful cross. The numbers of Mat(-) or Mat(+) occurring in each viticultural region
were subjected to an analysis of variance.
66
The viability of ascospores was assessed by squashing cleistothecia in l0 pdml
fluorescein diacetate (FDA, Sigma) as described by Evans et al. (I997a), allowing 2 to 5
min for the stain to be taken up before viewing. This stain was prepared fresh each time by
diluting a stock solution of 2 mglml in acetone with distilled water. The asci and
ascospores were examined under W illumination with an Olympus BH2-RFCA
microscope.
3.3 Rnsulrs
3.3.1 Identification of mating types
All 27 isolates of unknown mating type formed cleistothecia when paired with
either isolate BNcl or BNc2, thus mating types were assigned (Table 3.1). Cleistothecia
did not form when plantlets were inoculated with a single isolate. In all compatible
crosses, immature cleistothecia were observed between 40 and 79 days of co-inoculation of
the plantlets. Cleistothecia appeared yellow-orange when immature and turned brown to
black as they matured. No black cleistothecia were observed less than 40 days after co-
inoculation; cleistothecia matured after prolonged incubation with a 12 h photoperiod at
20"C. Iæaves bearing compatible isolates appeared to have more U. necator hyphae than
leaves bearing incompatible isolates and the hyphae, in most cases, appeared to be matted.
Immature cleistothecia were observed mostly in areas where the hyphae and conidia had
senesced. I-eaves bearing incompatible crosses appeared to have more chains of conidia
and the hyphae of each isolate were observed to grow away from each other forming azone
where no fungal growth was observed between the two isolates. No hyphal or conidial
senescence was observed in these circumstances
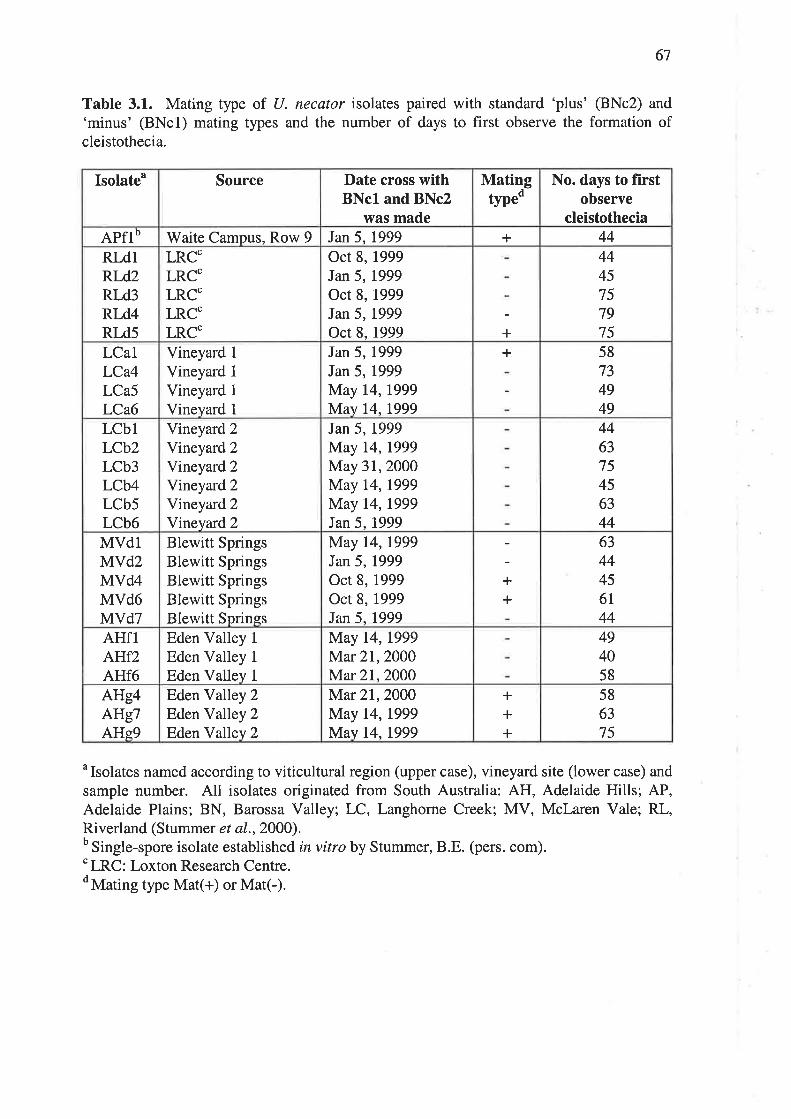
67
Table 3.1. Mating type of U. necator isolates paired with standard 'plus' (BNc2) and'minus' (BNcl) mating types and the number of days to first observe the formation ofcleistothecia.
u Isolates named according to viticultural region (upper case), vineyard site (lower case) and
sample number. All isolates originated from South Australia: AH, Adelaide Hills; AP,Adelaide Plains; BN, Barossa Valley; LC, Langhorne Creek; MV, Mclaren Vale; RL,Riverland (Stummer et a1.,2000).b Single-spore isolate established in vitro by Stummer, B.E. (pers. com)."LRC: Loxton Research Centre.dMating type Mat(+) or Mat(-).
Isolate" Source Date cross withBNcl and BNc2
was made
Matingtyp"u
No. days to firstobserve
cleistotheciaAPflb Waite Campus, Row 9 Jan 5, 1999 + 44RLdlRLd2RLd3RLd4RLd5
LRC.LRC.LRC"LRC"LRC"
Oct 8, 1999Jan 5, 1999Oct 8, 1999Jan 5, 1999Oct 8, 1999 +
4445757975
LCalLCa4LCa5LCa6
Vineyard 1
Vineyard IVineyard 1
Vineyard 1
Jan 5, 1999Jan 5, 1999ÌN,day 14,1999M¿v L4.1999
+ 5873
4949
LCblLCb2LCb3LCb4LCb5LCb6
Vineyard 2
Vineyard 2Yineyard2Vineyard 2
Vineyard 2
Yineyard2
Jan 5, 1999IVf,ay 14, L999May 31,2000i|llay 14,1999I;V4ay L4,1999Jan 5, 1999
446375456344
MVdlMVd2MVd4MVd6MVdT
Blewitt SpringsBlewitt SpringsBlewitt SpringsBlewitt SpringsBlewitt Sprinss
I;N|.ay 14,1999Jan 5, 1999Oct 8, 1999Oct 8, 1999Jan 5, 1999
++
63444561
44AHflAHf2AHf6
Eden Valley 1
Eden Valley 1
Eden Valley 1
J0l'fay 14,1999]V'[ar 2I,2000jÙ[ar2I,2000
494058
AHg4AHgTAHe9
Eden Valley 2Eden Valley 2Eden Valley 2
]Vfar21,2000May 14,1999N'Iav 14,1999
+++
58
6375
68
Semi-mature, brown and mature, black cleistothecia were chosen at random from
the above compatible crosses and the contents examined under the microscope. Asci
contained four to five ascospores which fluoresced bright yellow-green in colour when
stained with FDA and viewed under UV light (Figure 3.1). In some cases, one or two
ascospores were abofed, appeared shrivelled and did not fluoresce.
Both mating types were detected in all viticultural regions examined, except for the
Adelaide Plains region where the mating type of only one isolate was characterised.
Among viticultural regions there was considerable variation (P = 0.001) in the proportion
of either mating type. However, only one mating type was detected in some vineyards. For
example, only Mat(-) isolates were found at Vineyard 2 in Langhorne Creek and Vineyard
1 in Eden Valley, whereas only Mat(+) isolates were found at Vineyard 2 in Eden Valley.
In summary,707o of the isolates examined were of the 'minus' mating type whereas only
307o werc of the 'plus' mating type.
3.4 DrscussroN
Heterothallism was first identified in Australian isolates of U. necator by Evans e/
aL (1997a), providing this study with the 'reference isolates', BNcl and BNc2, needed to
determine the mating type of previously uncharacterised isolates. Mating types were
assigned to all single-spore isolates which were paired separately with the two isolates of
known mating type. The time to first observe cleistothecia on micropropagated grapevines
in vitro ranged from 40 to 79 days. In contrast, Evans (1996) found that cleistothecia could
be initiated on detached leaves within 14 days of co-inoculation of single-spore isolates
However, the leaves senesced before the cleistothecia could mature.
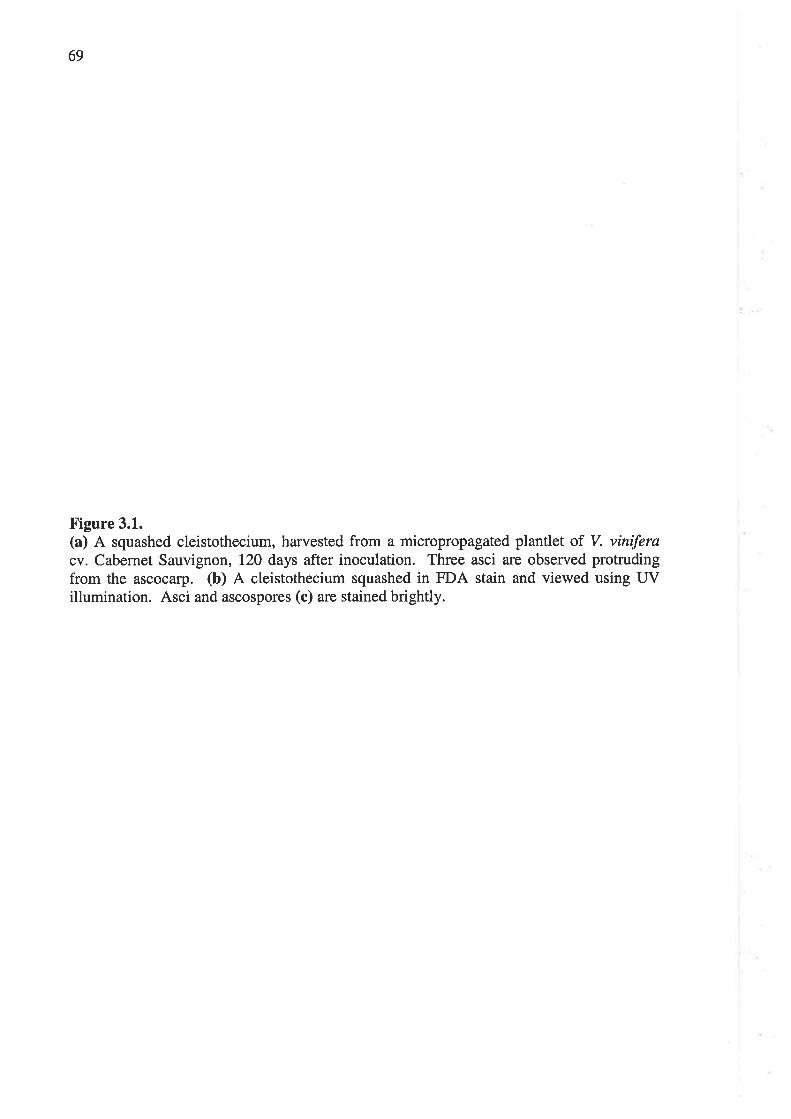
69
Figure 3.1.(a) A squashed cleistothecium, harvested from a micropropagated plantlet of V. viniþracv. Cabemet Sauvignon, 120 days after inoculation. Three asci are observed protrudingfrom the ascocaq). (b) A cleistothecium squashed in FDA stain and viewed using UVillumination. Asci and ascospores (c) are stained brightly.
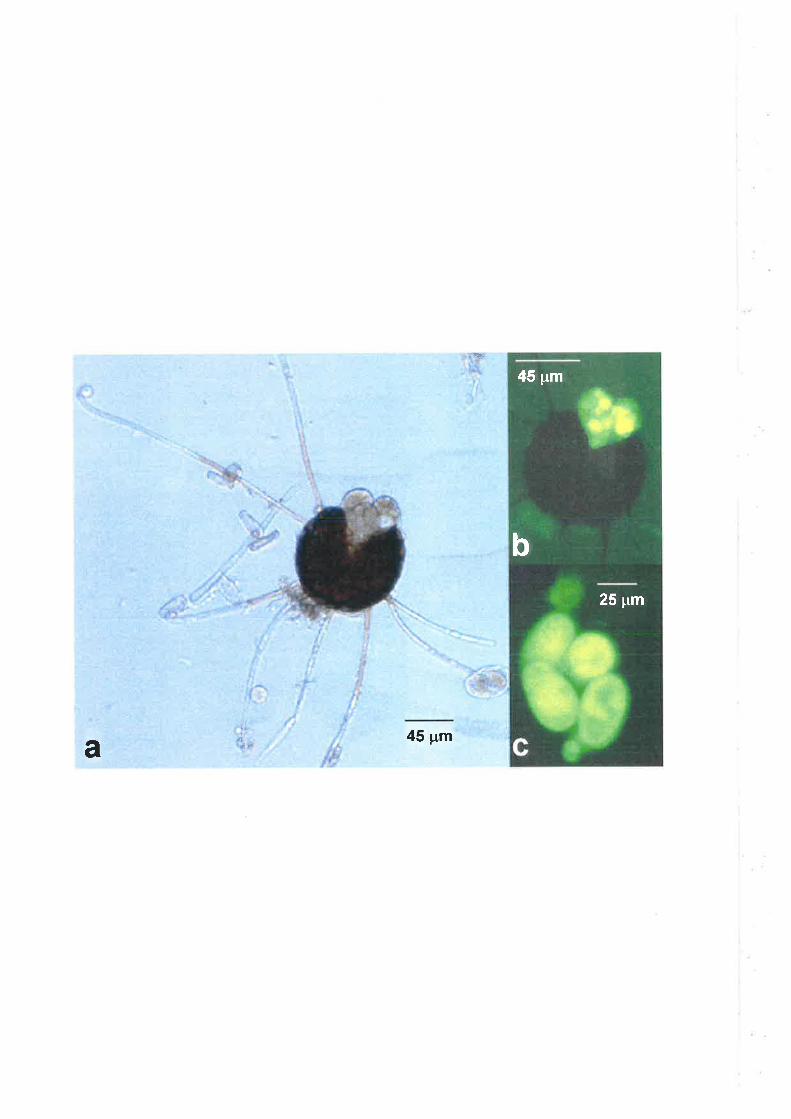
¡!
45 prm
25 pm
b
45 pm{a
70
The variation in the number of days to the first observation of cleistothecia may be
related to the amount of inoculum placed on the leaf surface, host colonization, the
difference in fitness of isolates being paired and the time taken for physical contact
between compatible hyphae. Evans (L996) also observed variation in the time taken for
cleistothecia to form and in the density of cleistothecia on leaves and noted that, in areas on
the leaf surface where immature cleistothecia had formed, hyphae and conidia had
senesced. This suggested that asexual reproduction appeared to have been reduced or
ceased once hyphal contact between the two isolates was established. This has also been
observed for U. necator in the vineyard (Gee et a1.,2000) and in other ascomycetous fungi
such as A. nidulans and N. haematococca (Champe andBl-Zayat, 1989; Dyer et aL,1993).
FDA staining demonstrated that viable ascospores were present in mature cleistothecia
from each cross, providing evidence that viable progeny could be obtained in further
experiments (see Chapter 6.0).
Once mating types are assigned to individuals within a population, information
regarding the principal mode of reproduction may be obtained. In populations where one
mating type predominates, asexual reproduction would most likely be the primary or sole
mode of reproduction (Anderson and Kohn, 1995). In contrast, in populations where both
mating types are present in equal proportions, sexual reproduction is likely to be involved
in the survival of the population (Drenth et al.,1994; Hermansen et a1.,2000).
The results from this study suggest that the frequencies of mating types are not in
equal proportion. For example, in some vineyards only one mating type was detected.
Generally, Mat(-) was found more frequently than Mat(+). In contrast, Stummer et al.
(2000) found that both mating types were present in equal proportions among the 81
Australian isolates characterised for mating type. Similarly, after assigning mating types to
17 isolates, Evans et al. (I997a) found that ten were Mat(+) and seven were Mat(-).
7I
The distribution of mating type and the presence of cleistothecia can also be a
useful characteristic for studying the mode of reproduction of U. necator in different
viticultural regions. Both mating types have been found in all viticultural regions
represented (Stummer et a1.,2000), suggesting that sexual reproduction may be important
for the survival of the fungus. Why only one mating type was found in some vineyards is
not clear. A similar observation was made for the distribution of Phytophthora infestans
mating types in Norway and Finland, where only one mating type was found in some areas
(Hermansen et a1.,2000). Hermansen et al. (2000) proposed that the particular genotype
detected may be more fit in those areas because of differences in response to environmental
conditions. This is supported by earlier studies by Mizubuti and Fry (1998), who reported
that clonal lineages differed in response to temperature. Additionally, the results obtained
from this study may also be influenced by the small number of isolates collected from each
vineyard. Unfortunately, only a limited number of samples could be collected from certain
vineyards due to the majority of powdery mildew colonies being eradicated by fungicides
applied by growers prior to collection. The main requirement of this project, however, was
to identify and study isolates with reduced sensitivity to DMI fungicides, therefore isolates
that had survived chemical sprays were the main target for collection. In future studies,
more isolates will need to be collected from within individual vineyards and between
viticultural regions to give a true indication of the frequency and distribution of the two
mating types.
72
CHAPTER 4.0
DBvBT,OPMENT OF A BIO¡,SS¡.Y FOR FUUCTCTOB SNNSITIVITY
4.1 IurnoDUCTroN
During the late 1970s the DMIs were introduced world-wide and are currently used
extensively to control grapevine powdery mildew in Australian vineyards. Triadimefon
(Bayleton@) and fenarimol (Rubigan@) were registered in Australia in the early 1980s to
control grapevine powdery mildew and in 1990, triadimenol (Bayfidan@¡, the active form
of triadimefon, was registered. For approximately five years, prior to these dates, these
DMIs were tested only in limited areas of Australia. Trials conducted by Wicks er a/.
(1984) in the period 1978 to 1982 showed that spray programs using sulphur followed by
propiconazole, triadimefon or fenarimol provided commercially acceptable control of
grapevine powdery mildew in Australian vineyards and could, therefore, be used as an
alternative to sulphur-only programs.
In the mid-1990s, growers in Australia expressed concerns that DMIs were losing
effectiveness against U. necator in the field. The main aim of this study was to determine
if this loss in effectiveness was due to the development of resistance in U. necator to these
chemicals. Poor control of U. necator has been attributed to DMI resistance in a number of
countries (Steva, 1988; Gubler et a1.,1996; Erickson and V/ilcox, 1997). However, poor
control can also be due to management issues, such as the timing of sprays and spray
coverage. It is important that growers can differentiate between these causes of control
failure, so that informed decisions can be made regarding the management of grapevine
powdery mildew.
73
To determine if there has been a shift in sensitivity to the DMIs, it is necessary to
compare the sensitivity distribution of a U. necator population exhibiting practical
resistance to a given DMI with that of a population not previously exposed to DMI
fungicides. This can be achieved using a quantitative method of measuring sensitivity
levels of individual isolates within a given population. Some factors that must be taken
into account when quantifying the distribution of sensitivity to a DMI include; sample size,
genetic make up of a sample (single-spore or bulk isolate) and assay method. These and
other factors have been considered in a number of different bioassays for assessing
sensitivity of U. necator to a range of DMIs (Nass, l99l; Steva, 1994; Steden et al., 1994;
Gubler et a1.,1996; Erickson and'Wilcox,1997) (see Section 1.9.1).
The objectives of this study were to (i) determine the most informative and
reproducible method to assay individual isolates of U. necator for sensitivity to DMI
fungicides; (ii) determine distributions of sensitivity to triadimenol and fenarimol, two
DMIs commonly used in Australian vineyards; (iii) determine the degree of cross-
resistance between these DMIs; and (iv) examine the effects of triadimenol on the
morphology of U. necator.
4.2 IÙ,I¡Tr,RIALS AND METHODS
4.2.I U. necator samples
In total, 60 single-spore isolates (see Section 2.1) were tested for sensitivity to
triadimenol; L2 were from vineyards with no previous exposure to DMI fungicides
(unexposed population) and 48 were from vineyards with suspected practical resistance to
74
DMI fungicides (selected population). Of the 60 isolates, 34 were tested for sensitivity to
fenarimol, 11 from the unexposed population and 23 from the selected population.
4.2.2 Culture of U. necøtor isolates
(J. necator isolates were maintained on micropropagated grapevines in vitro (see
Section 2.4). When required, isolates were mass-produced by culturing on surface-
sterilised detached leaves (see Sections 2.3 and2.5). For each isolate tested, two detached
leaves were prepared. Prior to use in the bioassay for fungicide sensitivity, inoculated
leaves were incubated in an illuminated growth chamber (330 FE r-t--') with a 12 h
photoperiod at 25"C for 14 days. All inoculated leaves were examined under a Wild
microscope at 50x magnification to confirm that the fungus had completely colonised the
leaf, had produced conidial chains and that there was no contamination by other organisms.
4.2.3 Preparation of fungicides
Technical grade triadimenol and fenarimol were stored at 4"C until use in bioassays
for fungicide sensitivity. Fungicides were dissolved in 500 pl acetone and diluted to
concentrations of 10.0, 5.0, 2.0,1.O,0.5, 0.1,0.01 mg/L immediately prior to each assay.
All dilutions were made in sterile distilled water containing 0.O5Vo Tween 20. Erickson
and Wilcox (1997) showed that the highest final acetone concentration used (-0.57o) had
no effect on conidial germination and hyphal growth of U. necator.
75
4.2.4 Bioassay for fungicide sensitivity
4.2.4.L Preparation, inoculation and incubation of leaf discs
The following was adapted from Erickson and Wilcox (1997). Disease-free,
immature, bright, shiny leaves were harvested from the third or fourth node of glasshouse-
grown V. viniftra cv. Cabernet Sauvignon, clone LC10 (see Section2.2) and were surface
sterilised as described in Section 2.3. Sufficient leaves were harvested to provide four
discs per fungicide concentration for each isolate being tested. In the laminar-flow cabinet,
six to eight discs were cut from each leaf using a sterile cork borer (11 mm diameter). The
leaf discs were randomised and placed into 90 Írm x 14 mm Petri plates (Techno-Plas,
Australia) containing 4 ml of a given fungicide concentration. Sterile distilled water
containing 0.057o Tween 20 was used for the control. Each disc was considered a
replicate. After 30 min, leaf discs were removed from the fungicide solution and blotted
dry with sterile paper towel. I-eaf discs were allowed to air-dry for 5 min before being
placed, adaxial side up, in pairs, into 36 mm Petri plates (Sarstedt Australia) containing 3.5
ml l%o water agar amended with 10 mg/L rifampicin, 5 ttdL pimaricin and 150 mglL
sodium ampicillin (all amendments from Sigma Chemical Co., St. Louis) (Figure 4.1).
Leaf discs were left for 3 h before being inoculated with U. necator.
In preliminary experiments, the leaf discs were transferred into multi-well dishes
(Nunc", 24 wells) containing 4 ml of l%o stenle distilled water agar amended with
antibiotics, however, because of possible confounding effects due to the volatility of
certain DMIs and cross-contamination by air-borne fungi, the 36mm diameter Petri plates
were substituted for the multi-well dishes.
Each of the four replicate discs in two Petri plates was inoculated with a single
isolate of U. necator. For this, eight open Petri plates, containing two leaf discs each, were
76
Figure 4.1. Bioassay for determining sensitivity of U. necator to DMI fungicides. Prior toinoculation with one test isolate of U. necator,leaf discs (11 mm in diameter) are treatedwith 0 to 10 mg/L of fungicide and are placed adaxial side up, in pairs, into 36 mm Petriplates containing I7o water agar amended with antibiotics.
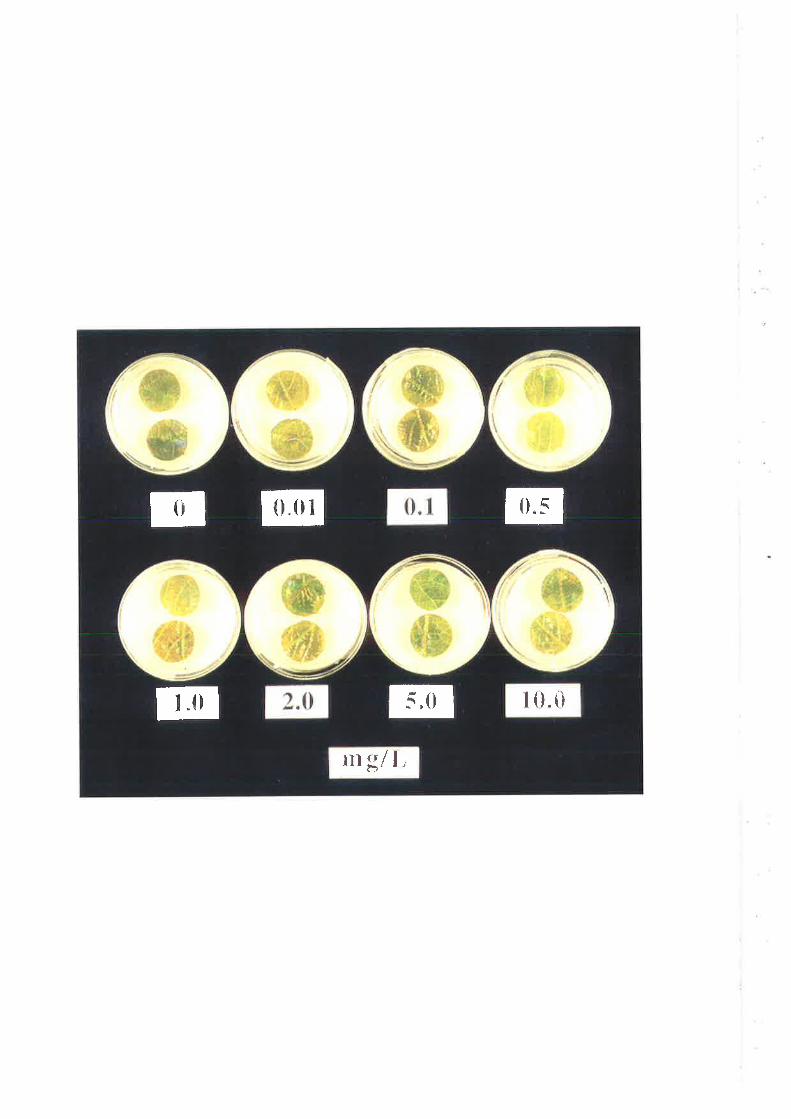
t {}. {i
ilt g/ l.
r@ E
Itr
77
placed at the base of a galvanised-iron settling tower (14 cm diameter, 58 cm length).
Inoculation of leaf discs was achieved by dislodging conidia from infected detached leaves,
at the top of the tower, by gently tapping the abaxial side of the leaf with a sterile
paintbrush. The conidia were allowed to settle onto the leaf discs for 1 min before the
tapping was repeated. This method allowed even distribution of conidia over the surface of
the leaf discs. The procedure was repeated once for each isolate. The settling tower was
sterilised with 9O7o ethanol after each inoculation. A haemocytometer was placed among
the Petri dishes during inoculation to allow the density of conidia deposited per m-'to b"
estimated. The average density was 12 conidia per mm2. In preliminary experiments
where hyphal length was measured, inoculated leaf discs were incubated in an illuminated
growth chamber (330 pE r-trn-t) with a 12 h photoperiod at25"C for 3 days, however, for
measurement of surface area colonised by the fungus, inoculated leaf discs were incubated
in the same conditions for 12 days.
4.2.4.2 Measurement of hyphal length
A preliminary experiment was conducted using the method of Steva (1994) to asses
its suitability as a most rapid and reliable method of discriminating triadimenol-sensitive
and resistant isolates of U. necator. As this method was not used further, only brief details
are given. Isolates LCbl, LCb5 (previously exposed to DMIs) and APfl (not previously
exposed to DMIs) were inoculated onto leaf discs as described above. After 3 days, the
fungal growth was peeled from each leaf disc using Scotchru tape. The Scotchru tape was
placed with the fungal material uppermost on a glass microscope slide. Each sample was
stained for 5 min in lactophenol cotton blue, covered with a coverslip and examined
immediately with an Olympus BH2-RFCA microscope at 200x magnification. For each
treatment, the percentage of hyphae greater than 250 pm long in one field of vision was
78
calculated. This was repeated three times for each isolate and for each fungicide
concentration tested. The non-parametric Kruskal-Wallis test (Statistix) was used to
determine significant differences between the isolates and fungicide concentrations.
4.2.4.3 Determination of 507o effective concentration (ECso) and resistance factor
values
Twelve days after inoculation, infection and sporulation were examined under a
Wild stereomicroscope at 50x magnification using a graticule with a grid of 100 x 1 mm2
(Leica). The percentage surface area colonised by the fungus was determined for each leaf
disc. A score was assigned to each leaf disc using a scheme modified from Nass (1991)
(Table 4.1) and the mean of the four scores (discs) per fungicide concentration per isolate
was calculated. Fungicide concentrations were transformed by adding 0.001 mgtL to each
(providing a log value of -3.0 for the zero-concentration control treatment), and relative
growth data were plotted against the log of the appropriate transformed fungicide
concentration and fitted to a negative logistic regression curve using Genstat 5 (Lawes
Agricultural Trust, Hertfordshire, England). A copy of the program used is given in the
Appendix. The mean ECso of isolates not previously exposed to DMI fungicides was
calculated separately for each fungicide tested. This value was used as a basis to calculate
the EC56 of isolates exposed to fenarimol and triadimenol. Resistance factor (RF) values
were calculated for each isolate exposed to a DMI as follows: RF= EC56r"1""¡"¿/lvlean
EC5ouor*por.d.
The distributions of ECso values for each fungicide in the unexposed and selected
populations were tested for normality using the Wilk-Shapiro/Rankit Plot procedure
(Statistix for'Windows Version 2.0 Analytical Software). The non-parametric Wilcoxon-
Mann-Whitney two-sample tests (Statistix) and parametric Two-Sample T Test (Statistix)
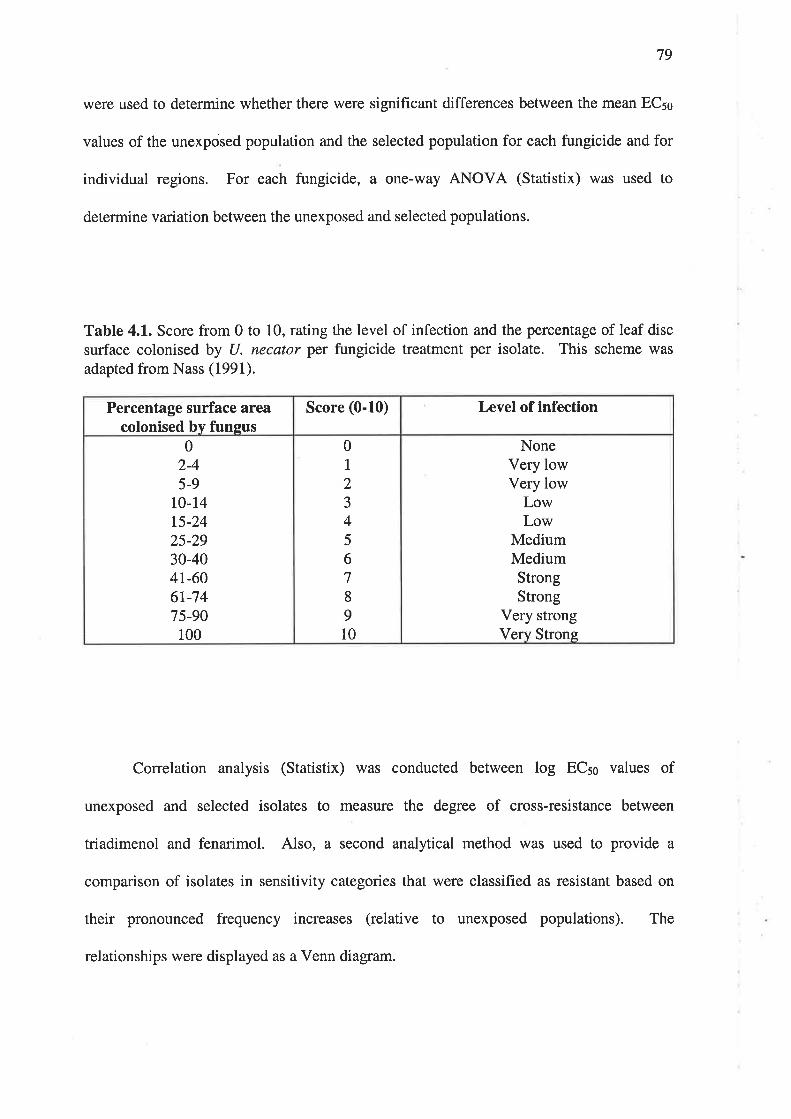
79
were used to determine whether there were significant differences between the mean ECso
values of the unexposed population and the selected population for each fungicide and for
individual regions. For each fungicide, a one-way ANOVA (Statistix) was used to
determine variation between the unexposed and selected populations.
Table 4.1. Score from 0 to 10, rating the level of infection and the percentage of leaf discsurface colonised by U. necator per fungicide treatment per isolate. This scheme was
adapted from Nass (1991).
Correlation analysis (Statistix) was conducted between log ECso values of
unexposed and selected isolates to measure the degree of cross-resistance between
triadimenol and fenarimol. Also, a second analytical method was used to provide a
comparison of isolates in sensitivity categories that were classified as resistant based on
their pronounced frequency increases (relative to unexposed populations). The
relationships were displayed as a Venn diagram.
Percentage surface areacolonised by fungus
Score (0-10) Level of infection
02-45-9
IO-1415-2425-2930-404r-606r-7475-90
100
0I2
J
45
6
7
8
9
10
NoneVery lowVery low
LowLow
MediumMediumStrongStrong
Very strongVery Strong
80
4.2.SDevelopment and morphology of U. necator after treatment with triadimenol
4.2.5.1 Preparation of triadimenol and experimental set-up
Technical grade triadimenol was prepared as described in Section 4.2.3.
Preparation and inoculation of leaf discs was as in Section 4.2.4.I except for the number of
replications of each treatment and the number of detached leaves prepared to bulk-up
conidia from each isolate. Two leaf discs in one Petri plate, treated with one concentration
of triadimenol, was considered to be one replication. Single-spore isolates APdz and LCb6
were used and four detached leaves were prepared for each isolate. Inoculated leaf discs
were incubated in an illuminated growth chamber (330 pE r-t^-') with a 12 h photoperiod
at25"C for 4 days. The entire experiment was repeated once.
4.2.5.2 Microscopy and data analysis
After 4 days, the fungal samples were prepared as described in Section 4.2.4.2.
Each sample was examined with an Olympus BH2-RFCA microscope at 200x or 400x
magnification. For each treatment, 100 conidia on each of four different leaf discs were
examined and the percentage germination, the number of appressoria formed and the
number of spores producing hyphae longer than 250 pm were recorded. The non-
parametric 'Wilcoxon-Mann-Whitney two-sample tests (Statistix) were used to determine
significant differences between the two isolates.
81
4.3 Rnsulrs
4.3.L Measurement of hyphal length
Hyphal length was examined for isolates LCbl, LCb5 and APfl on leaf discs
treated with different concentrations of triadimenol @gure 4.2). For each of the isolates
tested, the percentage of hyphae greater than 250¡rm decreased with increasing
concentration of triadimenol. Isolate LCbl was found to differ significantly from APfl and
LCb5 (P < 0.05) as follows. Exposure to 0.1 mgll- triadimenol resulted in only 6 and l47o
of hyphae of APfl and LCb5 being greater than 250¡rm in length, respectively, whereas the
corresponding figure for LCbl was 577o. At 10 mglL triadimenol, no hyphae greater than
250¡tm were observed for APfl and LCbl whereas ISVo of hyphae of LCbl were in this
category. These results suggested reduced sensitivity to triadimenol in LCbl. However,
this method of discriminating triadimenol-sensitive and resistant isolates was found to be
laborious and time-consuming, therefore it was not used in further experiments.
4.3.2 Determination of 507o effective concentration (ECso) and resistance factor
values
The origin, mean ECso values and resistance factor values for each isolate and each
fungicide are given inTable 4.2. Of the unexposed population, isolates from the Barossa
Valley and Adelaide Hills were most sensitive to triadimenol, whereas isolates from the
Riverland were most sensitive to fenarimol. The selected population showed a much
greater range in sensitivity to each fungicide tested. For triadimenol, RF values ranged
from 0.2 (VMal) to 59 (MVd6), and for fenarimol, 0.1 (LCb4) to 12 (SVal).
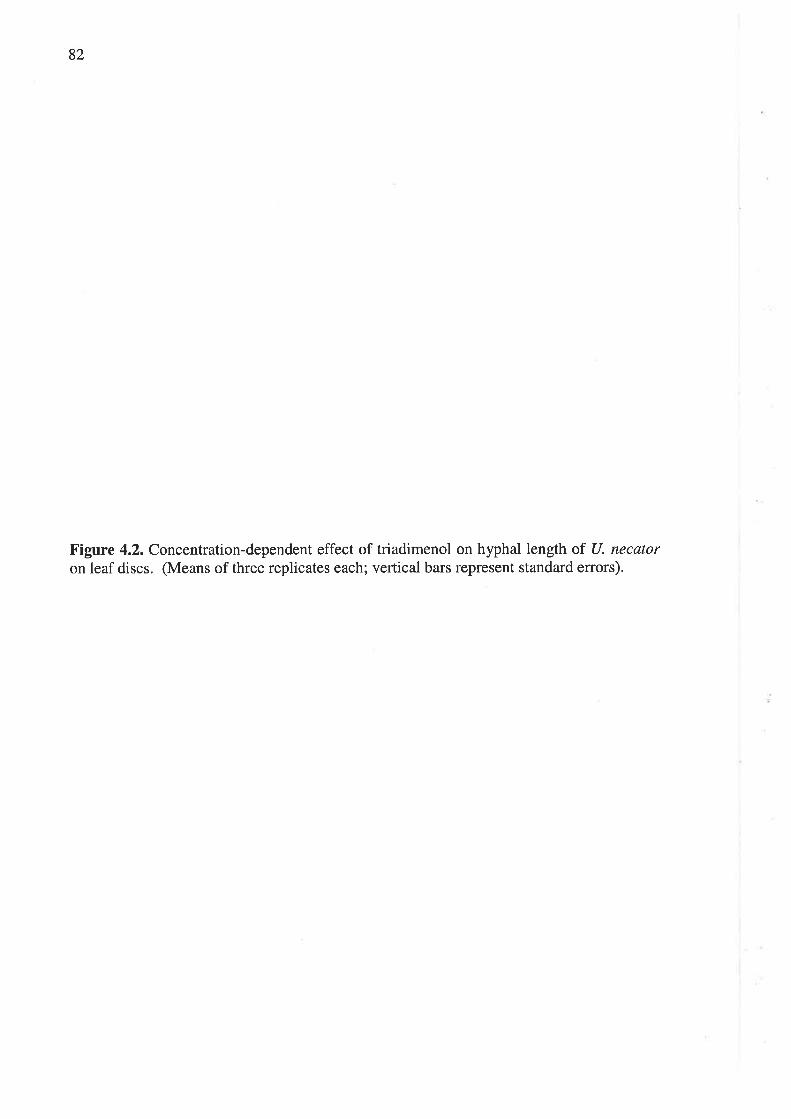
82
Figure 4.2. Concentration-dependent effect of triadimenol on hyphal length of U. necatoron leaf discs. (Means of three replicates each; vertical bars represent standard errors).
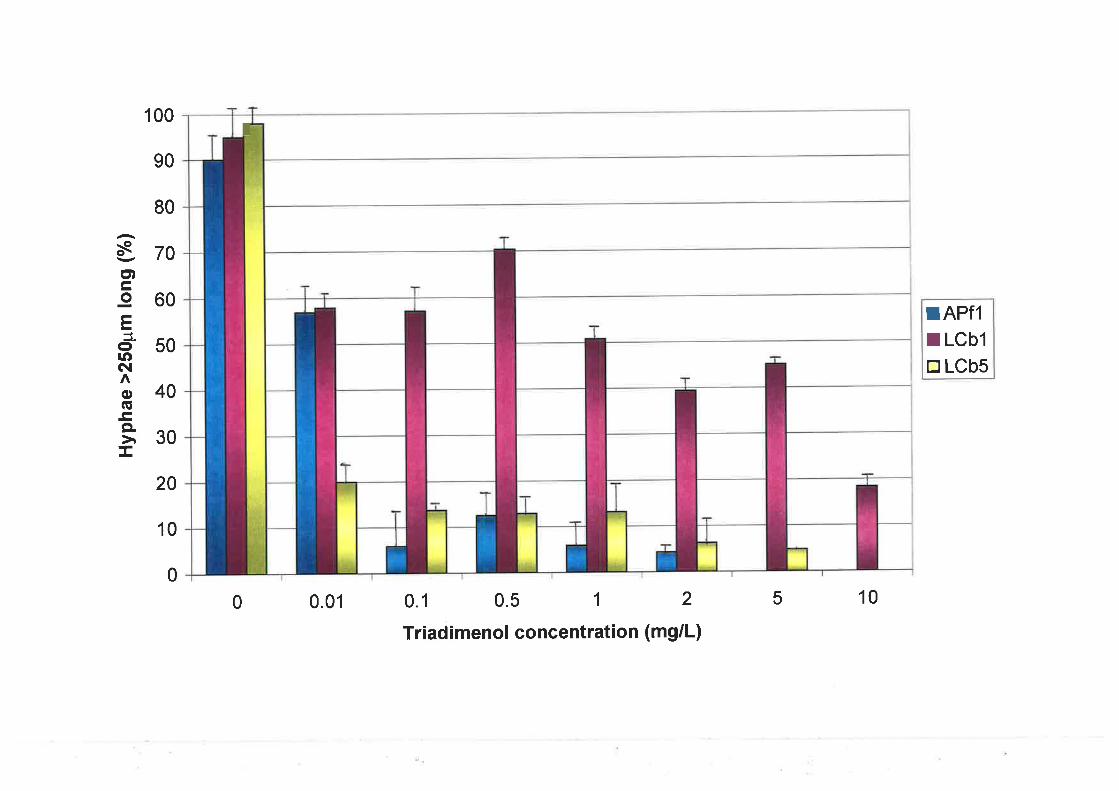
100
90
80
EroËt¡Fo60Eå50lON
o40((t
*30!
20
10
01050.1 0.5 1 2
Triadimenol concentration (mg/L)
0 0.01
I
rAPflr LCblE LCbs
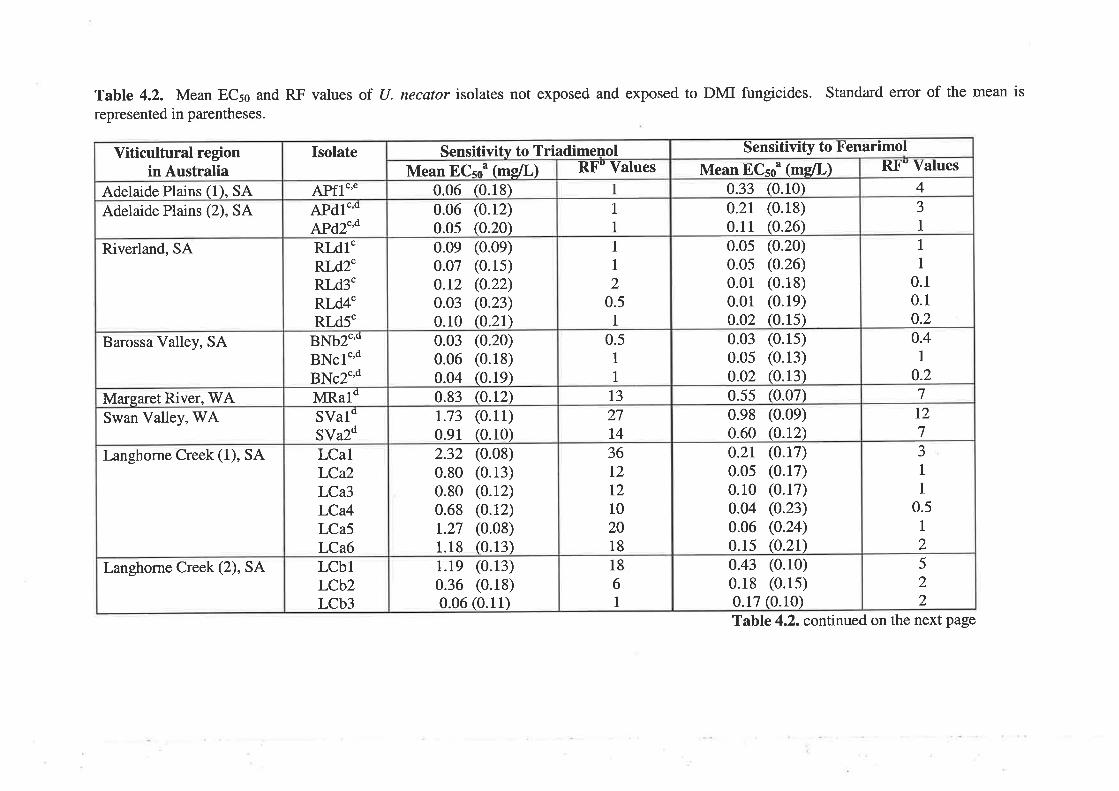
Table 4.2. Mean EC5s and RF values of (J. necator isolates not exposed and exposed to DMI fungicides. Standard error of the mean is
represented in parentheses.
Sensitivity to FenarimolRF'Values
4J1
1
1
0.10.10.20.4
1
0.27
12
7-J1
I0.5
1
2
5
22
Mean ECso" (me/L)0.33 (0.10)
0.2r (0.18)0.11 (0.26)
0.050.050.010.010.02
(0.20)(0.26)(0.18)(0.1e)(0.1s)
0.03 (0.1s)0.0s (0.13)0.02 (0.13)
0.55 (0.07)
0.98 (0.09)0.60 (0.r2)0.2r0.050.100.040.060.15
(0.17)(0.17)(0.17)(o.23)(0.24)(0.2r)
0.43 (0.10)0.18 (0.15)0.17 (0.10)
Sensitivity to TriadimenolRF" Values
1
1
1
1
1
20.5
1
0.51
I13
27I436L2
12
10
2018
18
61
Mean ECso" (mgll)0.06 (0.18)
0.06 (0.r2)0.0s (0.20)
0.090.070.t20.030.10
(0.0e)(0.1s)(0.22)(0.23)(0.2r\
0.03 (0.20)0.06 (0.18)0.04 (0.19)
0.83 Q.rz)1.73
0.91
(0.11)(0.10)
2.32 (0.08)0.80 (0.13)0.80 (0.r2)0.68 (0.r2)r.27 (0.08)1.18 (0.13)
1.le (0.13)0.36 (0.18)0.06 (0.11)
Isolate
APfl"''APdl"'"APd2"'dRI-d1"R[.d2"RI,d3.RI-d4"RI-d5"
BNb2"'oBNc1"'dBNc2"'dMRaldSValoSVa2d
LCalLCa2LCa3LCa4LCa5LCa6LCblLCb2LCb3
Viticultural regionin Australia
Adelaide Plains (1), SAAdelaide Plains (2), SA
Riverland, SA
Barossa Valley, SA
Margaret River, WASwan Valley, WA
Langhorne Creek (1), SA
Langhorne Creek (2), SA
Table 4.2. continued on the next page
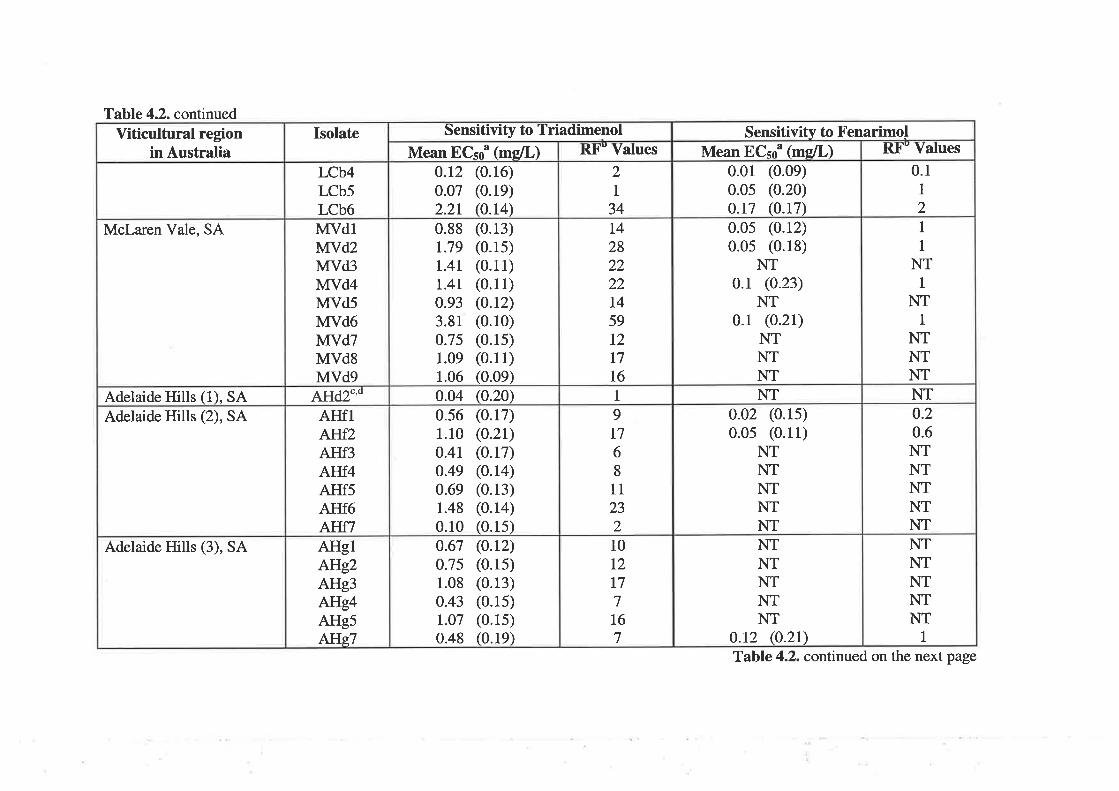
Table 4.2. continuedSensitivity to Fenarimol
Rl'" Values
0.11
2
1
INT
1
NT1
NTNTNTNT0.20.6NTNTNTNTNTNTNTNTNTNT
1
Mean ECsn" @gIL\0.01 (0.0e)0.0s (0.20)0.r7 (0.17)
0.05 (o.r2)0.0s (0.18)
NT0.1 (0.23)
NT0.1 (0.21)
NTNTNTNT
0.02 (0.1s)0.0s (0.11)
NTNTNTNTNTNTNTNTNTNT
(0.0.r2 2r)
Sensitivity to TriadimenolRl' Values
2I
34L4
282222L4
59T2
T7
T6
1
9I76
8
11
23210
t2t77
L6
7
Mean ECso" (me/L)0.r2 (0.16)0.07 (0.19)2.2r (0.14)
0.881.79L.4tr.4r0.933.81o.751.09
1.06
(0.13)(0.1s)(0.11)(0.11)(0.12)(0.10)(0.1s)(0.11)(o.oe)
0.04 (0.20)0.561.100.410.490.691.480.10
(0.17)(0.21)(0.17)(0.14)(0.13)(0.14)(0.15)
0.67 (0.12)o.7s (0.15)1.08 (0.13)0.43 (0.1s)r.o7 (0.1s)0.48 (0.19)
Isolate
LCb4LCb5LCb6MVdlMVd2MVd3MVd4MVd5MVd6MVdTMVd8MVd9Afld2"'dAIIfIAf{12AHf3ATIf4AIIf5AIIf6AITfTAHglAHg2AHg3AHg4AHg5AHgT
Viticultural regionin Australia
Mclaren Vale, SA
Adelaide Hills (1), SAAdelaide Hills (2), SA
Adelaide Hills (3), SA
Table 4.2. contínued on the next page
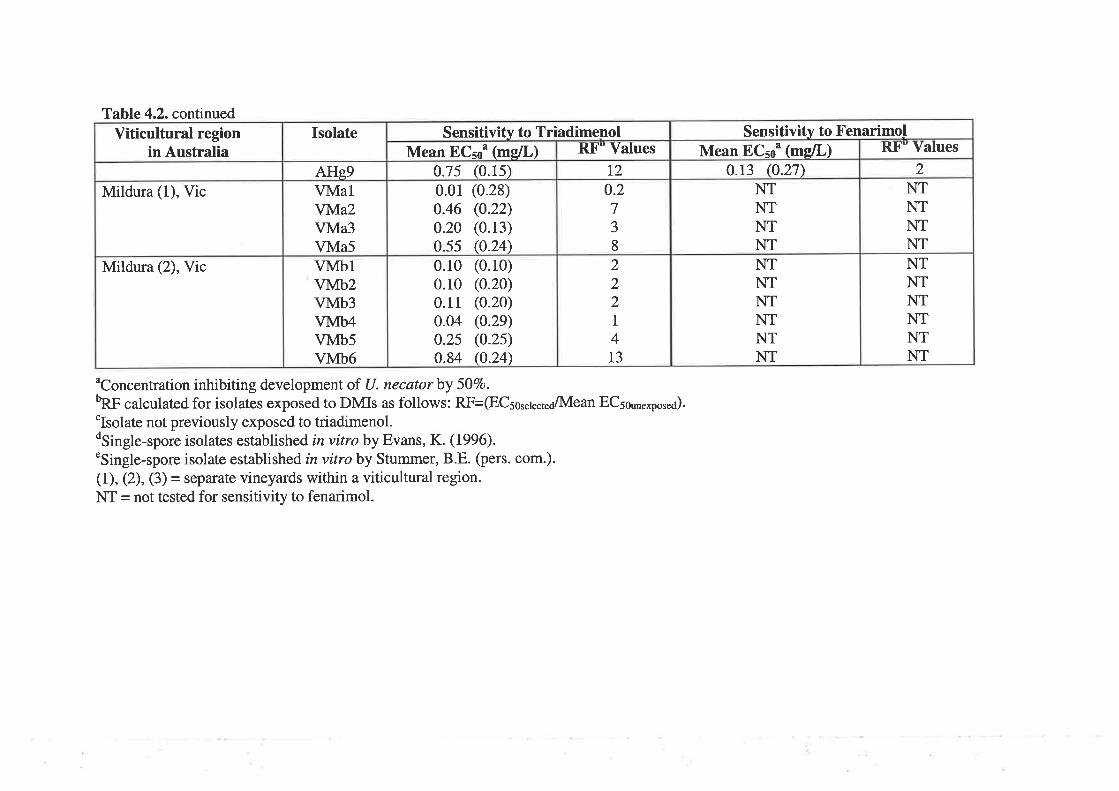
Table 4.2. continued
nConcentration inhibiting development of U. necatorby 507o.bRF calculated for isolates exposed to DMIs as follows: RF=(ECsor.1""¡"¿/lVlean ECso*"*por"¿).
'Isolate not previously exposed to triadimenol.dSingle-spore isolates established in vitro by Evans, K. (1996).
"Single-spore isolate established in vitro by Stummer, B.E. (pers. com.).(l), (2), (3) = separate vineyards within a viticultural region.NT = not tested for sensitivity to fenarimol.
Sensitivity to FenarimolRl'" Values
2
NTNTNTNTNTNTNTNTNTNT
Mean ECso" (mg/L)0.13 (0.27)
NTNTNTNTNTNTNTNTNTNT
Sensitivity to TriadimenolR-t'" Values
12
0 .2
7-J8
2221
4T3
Mean ECso" (mg/L)0.ts (0.1s)0.01 (0.28)0.46 (0.22)0.20 (0.13)0.55 (0.24)0.100.100.110.040.250.84
(0.10)(0.20)(0.20)(0.2e)(0.2s)(0.24)
Isolate
AHe9VMalYMa2VMa3VMa5VMblVMb2VMb3VMb4VMb5VMb6
Viticultural regionin Australia
Mildura (1), Vic
Mildura (2), Vic
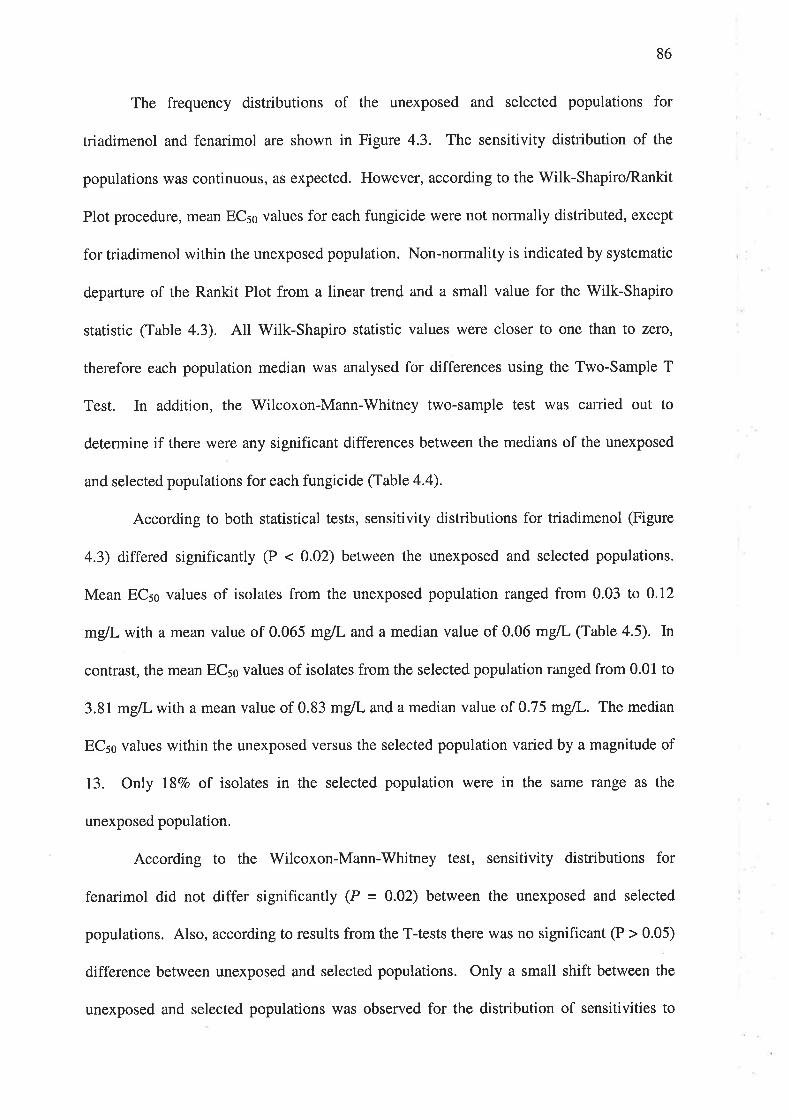
86
The frequency distributions of the unexposed and selected populations for
triadimenol and fenarimol are shown in Figure 4.3. The sensitivity distribution of the
populations was continuous, as expected. However, according to the Wilk-ShapirolRankit
Plot procedure, mean ECso values for each fungicide were not normally distributed, except
for triadimenol within the unexposed population. Non-normality is indicated by systematic
departure of the Rankit Plot from a linear trend and a small value for the Wilk-Shapiro
statistic (Table 4.3). All Wilk-Shapiro statistic values were closer to one than to zero,
therefore each population median was analysed for differences using the Two-Sample T
Test. In addition, the 'Wilcoxon-Mann-Whitney two-sample test was carried out to
determine if there ''vere any significant differences between the medians of the unexposed
and selected populations for each fungicide (Table 4.4).
According to both statistical tests, sensitivity distributions for triadimenol (Figure
4.3) differed significantly (P < 0.02) between the unexposed and selected populations.
Mean EC5¡ values of isolates from the unexposed population ranged from 0.03 to 0.I2
mgll- with a mean value of 0.065 mglL and a median value of 0.06 mgll- (Table 4.5). In
contrast, the mean ECso values of isolates from the selected population ranged from 0.01 to
3.81 mg/L with a mean value of 0.83 mglL and a median value of 0.75 mglL. The median
EC5s values within the unexposed versus the selected population varied by a magnitude of
13. Only ISVo of isolates in the selected population were in the same range as the
unexposed population.
According to the Wilcoxon-Mann-Whitney test, sensitivity distributions for
fenarimol did not differ significantly (P = 0.02) between the unexposed and selected
populations. Also, according to results from the T-tests there was no significant (P > 0.05)
difference between unexposed and selected populations. Only a small shift between the
unexposed and selected populations was observed for the distribution of sensitivities to
87
Figure 4.3. 507o effective concentration (ECso) frequency distributions for U. necatorpopulations to (a) triadimenol (i) with no history of demethylation inhibitor fungicideexposure (unexposed, û = 12) and (ii) exhibiting practical resistance to triadimenol(selected, n = 48); (b) fenarimol (i) with no history of demethylation inhibitor fungicideexposure (unexposed, n = 11) and (ii) exhibiting practical resistance to fenarimol (selected,
n = 23).
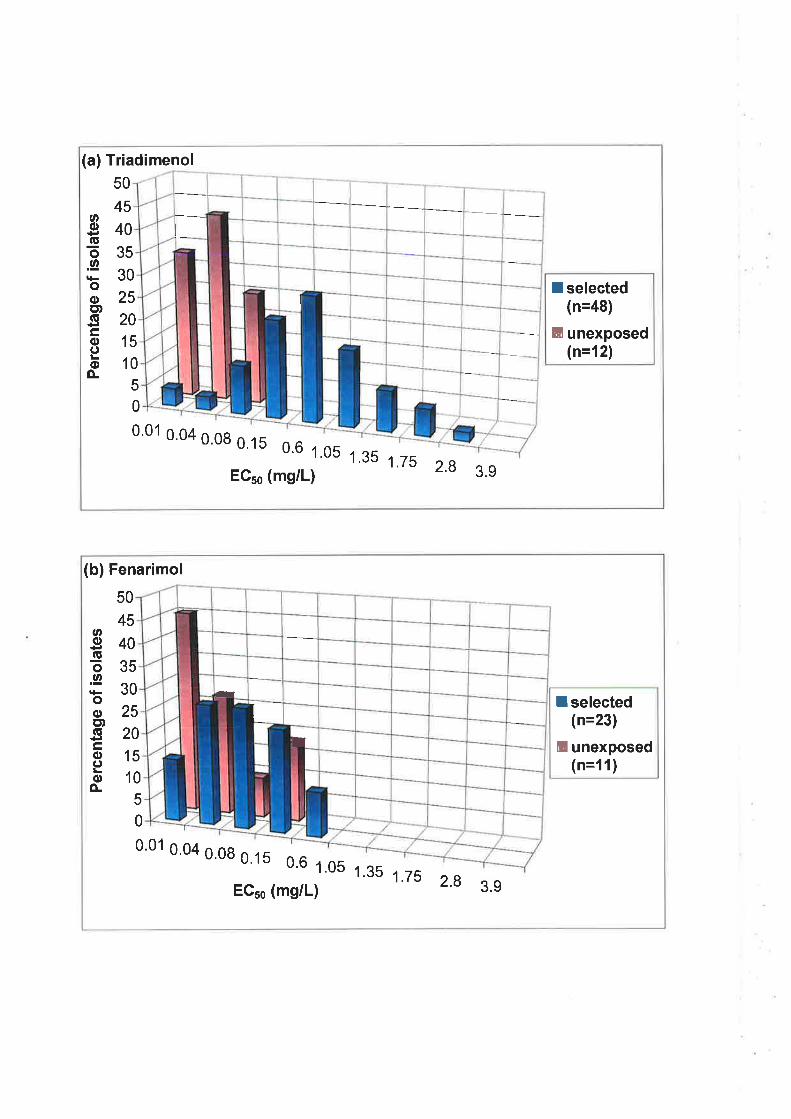
I
t
(a) Triadimenol50
45oo-go.9,
ooct)(E
trooLoÈ
40
35
30
25I selected
(n=48)
il unexposed(n=12)
20
15
10
5
0
0.01 o,o4 o.o8 o.ts 0.6 1'05 1,35 t.zsEG5s (mg/L) 2'8 3.9
(b) Fenarimol
ooaú
o..2
ooct)(ú
trooLoÈ
50
45
40
35
30
25
20
15
10
5
0
0.01 o.o4 o.o8 o.t s 0.6 1.05 1.35 t.zsEGso (mg/L) 2'8 3.9
-rL
¡
I selected(n=23)
E unexposed(n=11)
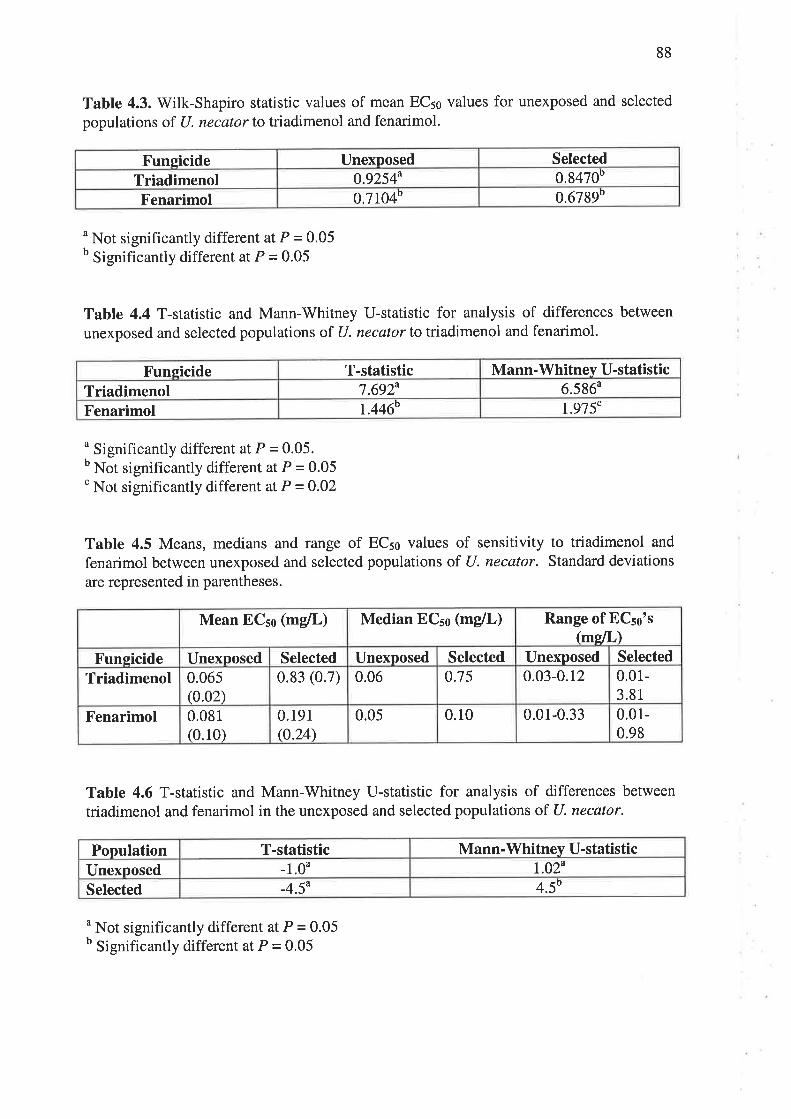
88
Table 4.3. Wilk-Shapiro statistic values of mean ECso values for unexposed and selected
populations of U. necator to triadimenol and fenarimol.
u Not significantly different at P = 0.05b Significantly different at P = 0.05
Table 4.4 T-statistic and Mann-Whitney U-statistic for analysis of differences between
unexposed and selected populations of U. necator to triadimenol and fenarimol.
u Significantly different at P = 0.05.b Not significantly different at P = 0.05
' Not significantly different at P = 0.02
Table 4.5 Means, medians and range of ECso values of sensitivity to triadimenol and
fenarimol between unexposed and selected populations of U. necator. Standard deviations
are represented in parentheses.
Table 4.6 T-statistic and Mann-Whitney U-statistic for analysis of differences between
triadimenol and fenarimol in the unexposed and selected populations of U. necator.
u Not significantly different at P = 0.05b Significantly different at P = 0.05
Fungicide Unexposed Selected
Triadimenol 0.9254u 0.8470b
Fenarimol o.7ro4b 0.67ggb
Funeicide T-statistic Mann-Whitney U-statisticTriadimenol 7.692n 6.586u
Fenarimol r.446b 1.975"
Mean ECso (mg/L) Median ECso (mg/L) Range of ECso's(ms4Ll
Funsicide Unexposed Selected Unexposed Selected Unexposed Selected
Triadimenol 0.065(0.02)
0.83 (0.7) 0.06 0.75 0.03-0.12 0.01-3.81
Fenarimol 0.081(0.10)
0.191
Q.24\0.05 0.10 0.01-0.33 0.01-
0.98
Population T-statistic Mann-Whitney U-statisticUnexposed -1.0u r.02u
Selected -4.50 4.5b
89
fenarimol (Figure 4.3). Mean ECso values of isolates from the unexposed population
ranged from 0.01 to 0.33 mglL with a mean value of 0.081 mgtL and a median value of
0.05 mg/L (Table 4.5). In contrast, the mean ECso values of isolates from the selected
population ranged from 0.01 to 0.98 mglL with a mean value of 0.191 mglL and a median
value of 0.1 mglL. The median EC5s values within the unexposed versus the selected
population only varied by a magnitude of two. Of the isolates in the selected population,
SOVo were in the same range as the unexposed population.
The same statistical tests, as described above, were carried out to analyse
differences between the mean EC5s values of isolates from the unexposed population for
triadimenol and fenarimol and the selected population for triadimenol and fenarimol (Table
4.6). The effect of both triadimenol and fenarimol on the mean EC5s values obtained for
the unexposed population did not differ significantly (P > 0.05). These values were found
to differ only by a factor of one. According to the Wilcoxon-Mann-Whitney two-sample
test, for the selected population, a significant (P < 0.05) difference was observed between
the two fungicides in that the mean EC5s values were found to differ by a magnitude of
four. However, results from the Two-Sample T Test suggest that no difference between
the two fungicides was observed.
Specific EC56 values used to classify isolates as resistant to triadimenol and
fenarimol were calculated using the data presented in Figure 4.3. An isolate was classified
as resistant to a fungicide if its ECso placed it in a category with decreased sensitivity
relative to the unexposed population. For triadimenol, the percentage of U. necator in the
selected population exceeded the percentage of isolates in the unexposed population in the
category with ECso values between 0.15 and 0.6 mg/L (Figure 4.3). The mean ECso of
isolates in this category was 0.42 mglL. For fenarimol, the percentage of the selected
population exceeded the percentage of the unexposed population in the category with ECso
90
values between 0.08 and 0.15 mg/L (Figure 4.3). The mean ECso of isolates in this
category was 0.12 mgtL. Hence, the cut-off values used to define individual isolates as
resistant to triadimenol or fenarimol were >0.42 mgll- and>0.12 mglL, respectively.
The small number of isolates collected from individual vineyards within a region
made it difficult to analyse each as a single population. Therefore, sensitivity data for
triadimenol were combined for vineyards within a region to form a single sample
representative of a population with practical resistance to DMI fungicides. Due to the
small number of isolates tested for sensitivity to fenarimol, only results from Langhorne
Creek for this fungicide were analysed statistically. The EC5s values obtained for isolates
from the Adelaide Hills, Mclaren Vale, Mildura and Langhorne Creek tested for
sensitivity to triadimenol were also analysed and compared to EC56 values obtained for the
unexposed population (Figure 4.4). A shift from the unexposed population in sensitivity to
triadimenol was observed for isolates from all viticultural regions. The smallest shift in
sensitivity was observed for isolates from Mildura and the greatest shift was observed for
isolates from Mclaren Vale.
According to the Wilk-Shapiro/Rankit Plot procedure, mean EC5s values for
isolates tested for sensitivity to triadimenol from Mclaren Vale and isolates tested for
sensitivity to fenarimol from Langhorne Creek were not normally distributed (Table 4.7).
However, EC5s values for isolates tested for sensitivity to triadimenol from Langhorne
Creek, Mildura and the Adelaide Hills were normally distributed. Therefore, both the
Two-Sample T Test and Wilcoxon-Mann-Whitney two-sample tests were carried out to
determine if there were any significant differences between isolates from a particular
region and the unexposed population (Table 4.8). According to both statistical methods,
there was a significant difference between ECso values of isolates, tested for sensitivity to
triadimenol, from Langhorne Creek, Mclaren Vale and the unexposed population (P <
9l
Figure 4.4. 507o effective concentration (ECso) frequency distributions for U. necatorpopulations from individual viticultural regions exhibiting practical resistance totriadimenol (Langhorne Creek, n = 12; Adelaide Hills, n = L4; Mclaren Vale, n = 9;
Mldura, n = 10) and from regions with no history of demethylation inhibitor fungicideexposure (unexposed, n = I2).
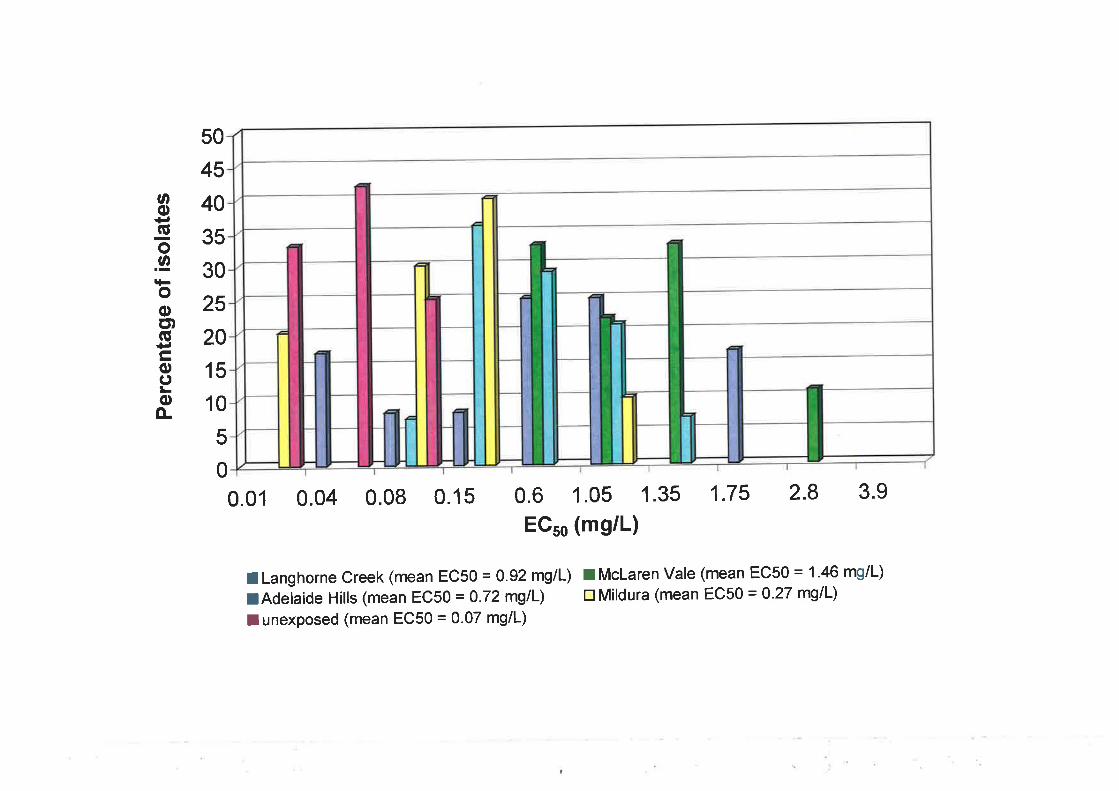
oo+,-go.9,rFooE)(E*,?o(JLoo-
50
45
40
35
30
25
20
15
10
5
0
0.01 0.04 0.08 0.15 0.6 1 .05 1 .35 1.75 2.8 3.9
ECso (mg/L)
I Langhorne Creek (mean ECSO = 0.92 mg/L) I Mclaren Vale (mean EC50 = 1'46 mg/L)
EAdelaide Hills (mean EC50 = 0.72 mg/L) tr Mildura (mean EC50 = O-27 mg/L)
I unexposed (mean EC50 = 0.07 mg/L)
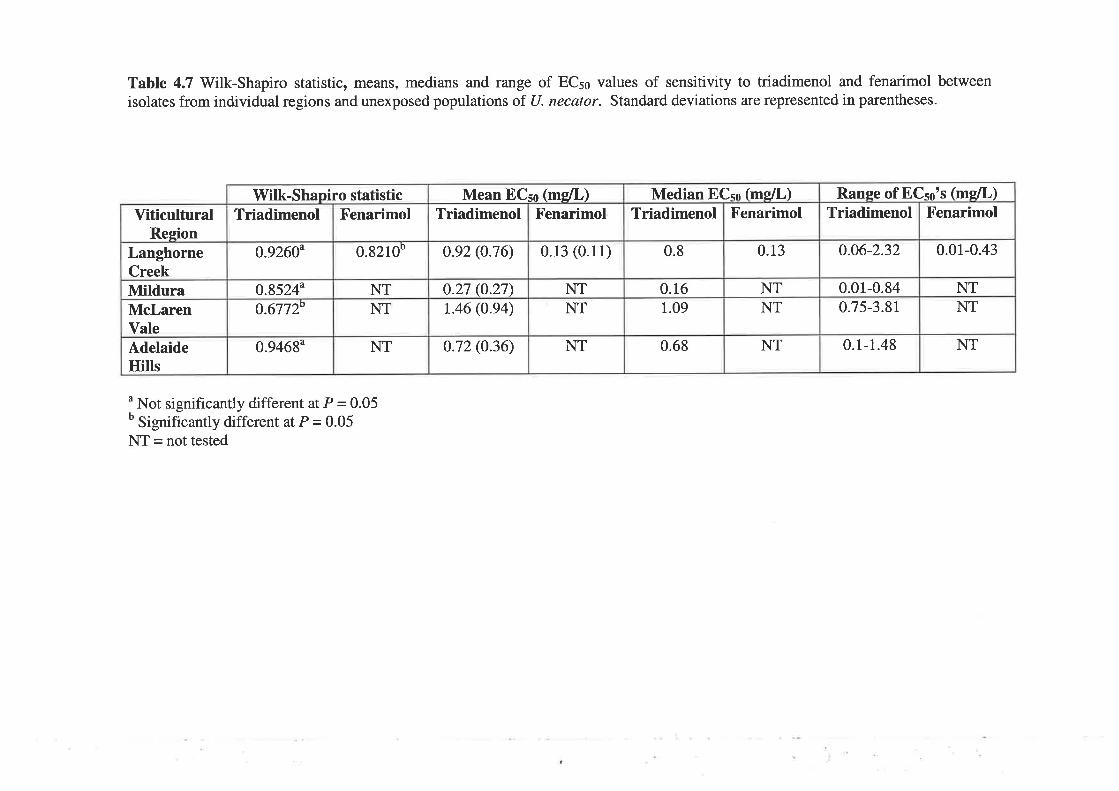
Table 4.7 Wilk-Shapiro statistic, means, medians and range of ECso values of sensitivity to triadimenol and fenarimol between
isolates from individual regions and unexposed populations of U. necator. Standard deviations are represented in parentheses.
Ranse of ECso's (me/L)Fenarimol
0.01-0.43
NTNT
NT
Triadimenol
0.06-2.32
0.01-0.840.75-3.81
0.1-1.48
Median ECsn (me/L)Fenarimol
0.13
NTNT
NT
Triadimenol
0.8
0.161.09
0.68
Mean ECso (me/L)Fenarimol
0.13 (0.11)
NTNT
NT
Triadimenol
0.92 (0.76)
0.27 (0.27\1.46 (0.e4)
o.72 (0.36)
Wilk-Shapiro statistictr'enarimol
0.82100
NTNT
NT
Triadimenol
0.9260^
0.8524^0.67720
o.946g^
ViticulturalResion
LanghorneCreekMilduraMcLarenValeAdelaideHills
" Not significantly different at P = 0.05b Significantly different at P = 0.05NT = not tested
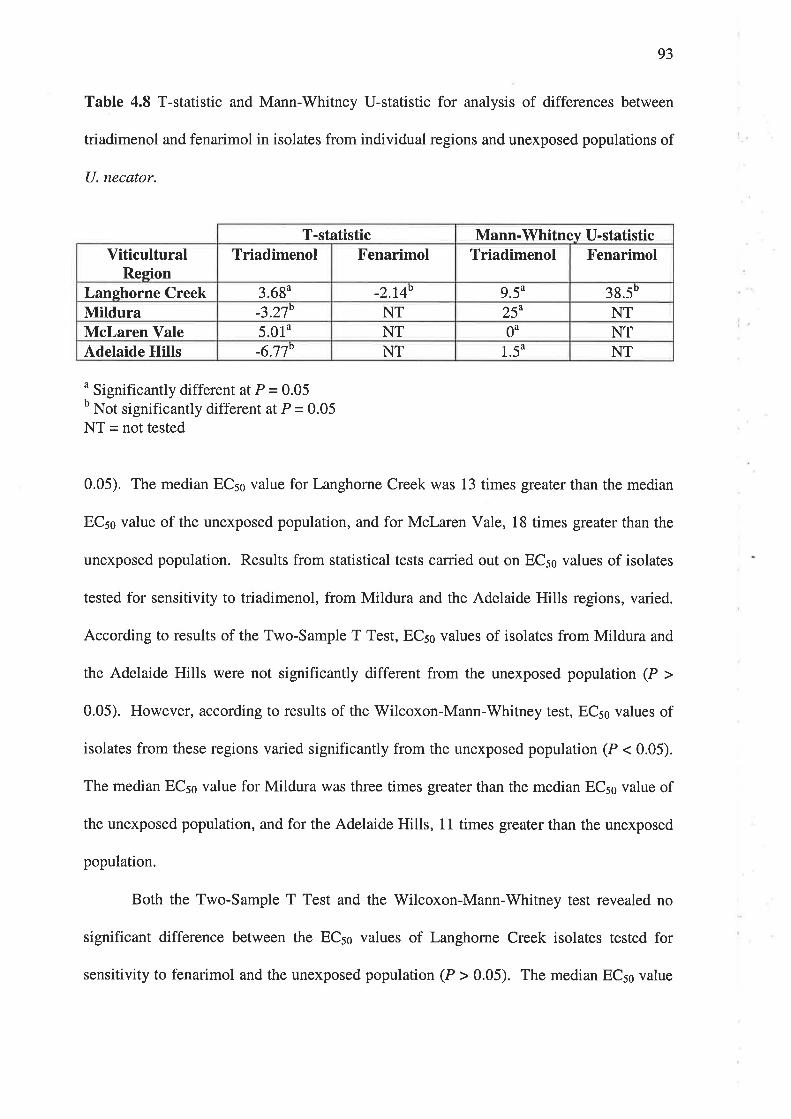
93
Table 4.8 T-statistic and Mann-Whitney U-statistic for analysis of differences between
triadimenol and fenarimol in isolates from individual regions and unexposed populations of
U. necator.
u Significantly different at P = 0.05b Not significantly different at P = 0.05NT = not tested
0.05). The median EC5s value for Langhorne Creek was 13 times greater than the median
EC5s value of the unexposed population, and for Mclaren Vale, 18 times greater than the
unexposed population. Results from statistical tests carried out on EC5¡ values of isolates
tested for sensitivity to triadimenol, from Mildura and the Adelaide Hills regions, varied.
According to results of the Two-Sample T Test, EC5e values of isolates from Mildura and
the Adelaide Hills were not significantly different from the unexposed population (P >
0.05). However, according to results of the Wilcoxon-Mann-Whitney test, EC5¡ values of
isolates from these regions varied significantly from the unexposed population (P < 0.05).
The median EC5s value for Mildura was three times greater than the median EC5s value of
the unexposed population, and for the Adelaide Hills, 11 times greater than the unexposed
population.
Both the Two-Sample T Test and the Wilcoxon-Mann-Whitney test revealed no
significant difference between the ECso values of Langhorne Creek isolates tested for
sensitivity to fenarimol and the unexposed population (P > 0.05). The median EC5s value
T-statistic Mann-Whitnev U-statisticViticultural
ReeionTriadimenol Fenarimol Triadimenol Fenarimol
Lanshorne Creek 3.69u -2.r40 g.5u 39.5b
Mildura 4.27D NT 25n NTMclaren Vale 5.01u NT 0u NTAdelaide Hills -6.llo NT 1.5u NT
94
for the Langhorne Creek population was only three times greater than the median EC5s
value of the unexposed population
4.3.3 Cross-resistance
The degree of cross-resistance between triadimenol and fenarimol was estimated by
two different methods (Erickson and Wilcox, 1997). In the first method, data for all
isolates from both the unexposed and selected populations that were tested for reduced
sensitivity to triadimenol and fenarimol were combined, the individual log EC5s values for
each fungicide were regressed against the same isolates log EC5s values for the remaining
fungicide and examined for correlation (Figure 4.5a). Based on this analysis, there was a
moderate correlation (r = 0.43) in EC5s values for triadimenol and fenarimol. This
correlation was highly significant (P = 0.00003).
In the second method, isolates in sensitivity categories that were classified as
resistant based on their pronounced frequency increases (relative to unexposed
populations) from vineyards exhibiting practical resistance were compared according to the
method of Köller et al. (1997) and Erickson and Wilcox (1997). The specific EC5e cut-off
values used to classify isolates as resistant to triadimenol (> 0.42 mgtL) and fenarimol (>
0.I2 mgtL) were used in this method. Based on this, 87Vo and 48Vo of the 23 selected
isolates tested were classified as resistant to triadimenol and fenarimol, respectively. Of
the 20 isolates classified as resistant to triadimenol, 437o were classified as cross-resistant
to fenarimol. Only 4Vo of the 23 selected isolates were resistant to fenarimol only and 97o
were sensitive to both. These results are represented by a Venn diagram in Figure 4.5b.
95
Figure 4.5. (a) Scatterplot depicting correlations among the log 50Vo effectiveconcentration (EC5s) values relative to triadimenol and fenarimol for individual isolates ofU. necator within the combined unexposed and selected grapevine populations (n = 34).(b) Venn diagram depicting the two-way comparison of resistance to triadimenol (Tri) andfenarimol (Fen) among selected U. necator isolates. An isolate was identified resistant to afungicide if its 507o effective concentration (ECso) value placed it in a sensitivity categorywith a pronounced frequency increase relative to the composite unexposed population.Specific EC56 values classifying isolates as resistant to triadimenol and fenarimol were>0.42 mgil- and >0.12 mglL, respectively. The large circle represents the full set of 23
isolates tested for resistance to both triadimenol and fenarimol from the selectedpopulation; each smaller circle represents the set of isolates with ECso values classifyingthem as resistant to the fungicide(s) indicated according to the above criteria. Numberswithin the circles represent the number of individual isolates within each indicated subset.
Two isolates were classified as resistant to neither of the two fungicides.
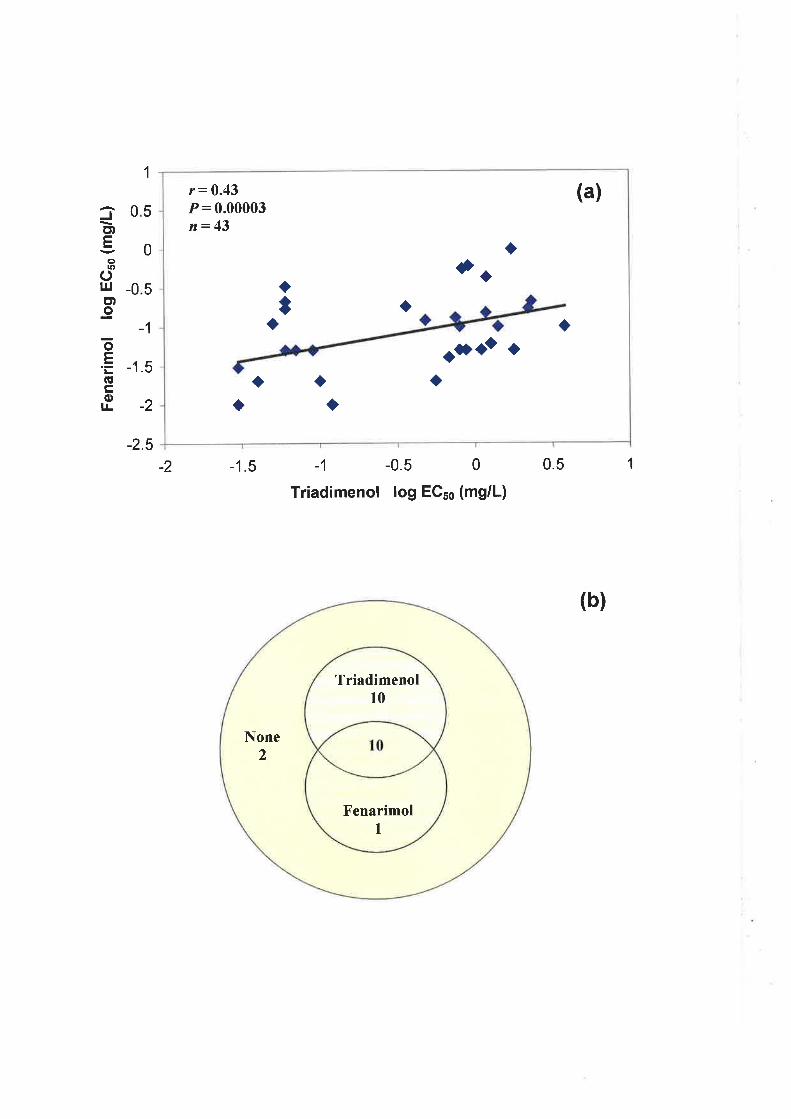
1
05
-0
Jc¡)Eo(,
oulEto
oE
IEtrolr
0
5
-1
-1.5
-2.5
-2
-2 -1.5 -1 -0.5 0
Triadimenol log EC5s (mg/L)
0.5 1
(b)
(a)
aI
aa a
aa a
aaa
all' l
r= 0.43P:0.00003n= 43
aa
Triadimenol10
Fenarimol1
None2
96
4.3.4 Development and morphology of U. necator after treatment with triadimenol
Isolates characterised as triadimenol-sensitive and resistant using the bioassay were
studied microscopically to observe the morphological effects of triadimenol on U. necator
on leaf discs. Detailed microscopic studies on the early stages of infection (Rumbolz et al.,
2000) and the effect of penconazole on the development and morphology of U. necator
(Leinhos et al., 1997) have been described previously. In general, the growth of the
asexual stage of (J. necator on the grapevine leaf begins with germination of conidia,
followed by the development of appressoria, haustoria, hyphae, hyphal appressoria,
conidiophores and conidia (see Section 1.3).
The morphology of APd2 and LCb6 on untreated (0 mg/L) and triadimenol-treated
leaf discs (0.01 to 10 mg/L) was examined. The morphology of triadimenol-sensitive
isolate ^Pdz
and triadimenol-resistant isolate LCb6, after growth for 4 days on leaf discs
treated with triadimenol is depicted in Figure 4.64-I. Conidia of both APd2 and LCb6 on
untreated leaf discs appeared intact and were ovoid to cylindrical in shape. Germinated
conidia formed appressoria and primary hyphae on opposite ends. Secondary hyphae
formed from appressoria and branching hyphae were observed (Figure 4.64). Triadimenol
had no effect on germination of conidia of APd2 and LCb6 on leaf discs regardless of
concentration (P > 0.05) (Figure 4.7a).
For both APd2 and LCb6, as the concentration of triadimenol increased the
percentage of hyphae greater than 250 pm in length decreased (Figure 4.7b). According to
the'Wilcoxon-Mann-'Whitney test there was no overall difference between the two isolates
(P > 0.05). However, when comparing ^Pd2
to LCb6, a significant decrease in the
percentage of hyphae greater than 250 pm was observed on leaf discs treated with 0.1 mg/L
and 10 mglf- triadimenol. At 0.1 mglL triadimenol, 29Vo of hyphae of APd2 were
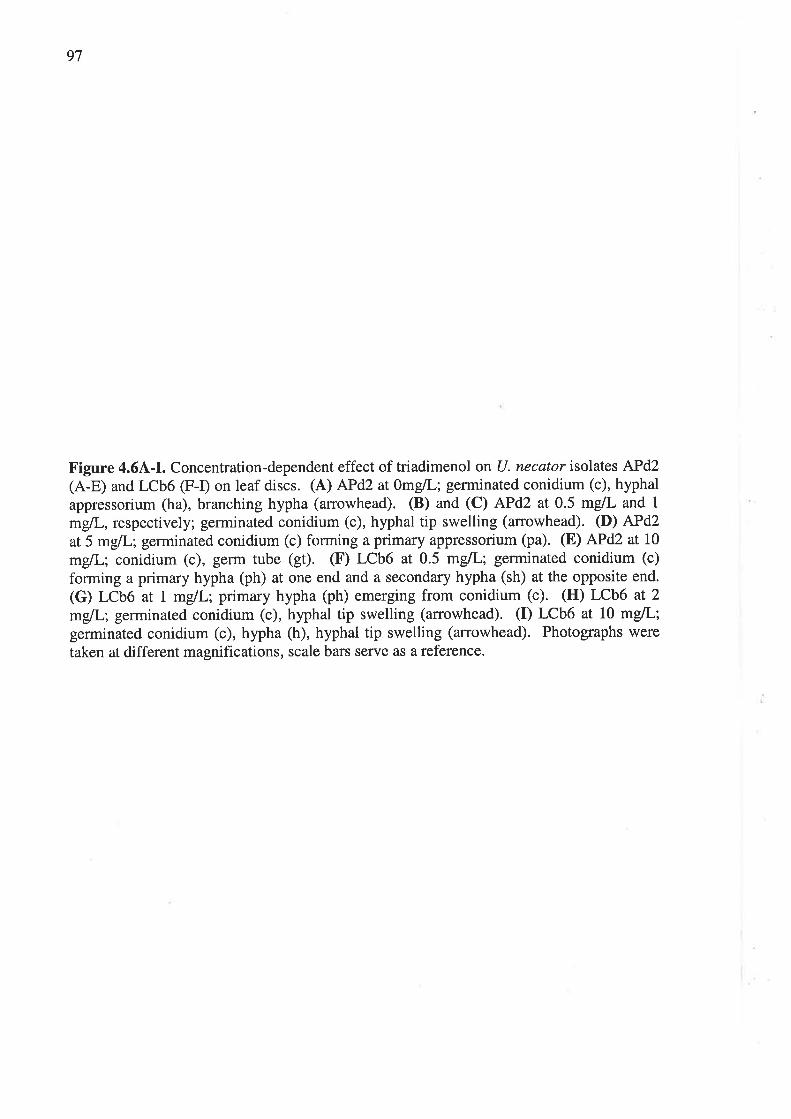
97
Figure 4.6A-1. Concentration-dependent effect of triadimenol on U. necator isolates APd2(A-E) and LCb6 (F-I) on leaf discs. (A) APd2 at 0mglL; germinated conidium (c), hyphalappressorium (ha), branching hypha (anowhead). (B) and (C) APd2 at 0.5 mgtL and 1
mgL, respectively; germinated conidium (c), hyphal tip swelling (anowhead). (D) APd2at 5 mglL; germinated conidium (c) forming a primary appressorium (pa). (E) APd2 at 10
mglL; conidium (c), germ tube (gt). (F) LCb6 at 0.5 mÙL; germinated conidium (c)
forming a primary hypha (ph) at one end and a secondary hypha (sh) at the opposite end.
(G) LCb6 at I mgll-; primary hypha (ph) emerging from conidium (c). (H) LCb6 at 2mglL; germinated conidium (c), hyphal tip swelling (arrowhead). (D LCb6 at 10 mg/L;germinated conidium (c), hypha (h), hyphal tip swelling (arrowhead). Photographs were
taken at different magnifications, scale bars serve as a reference.
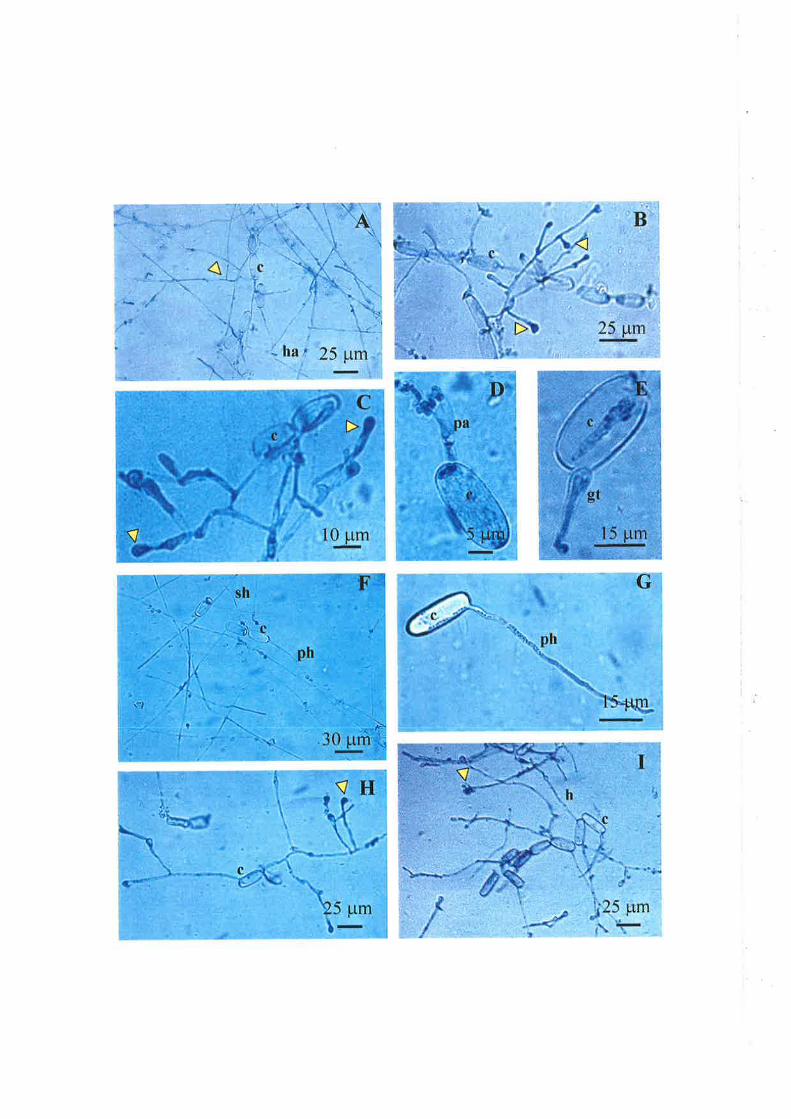
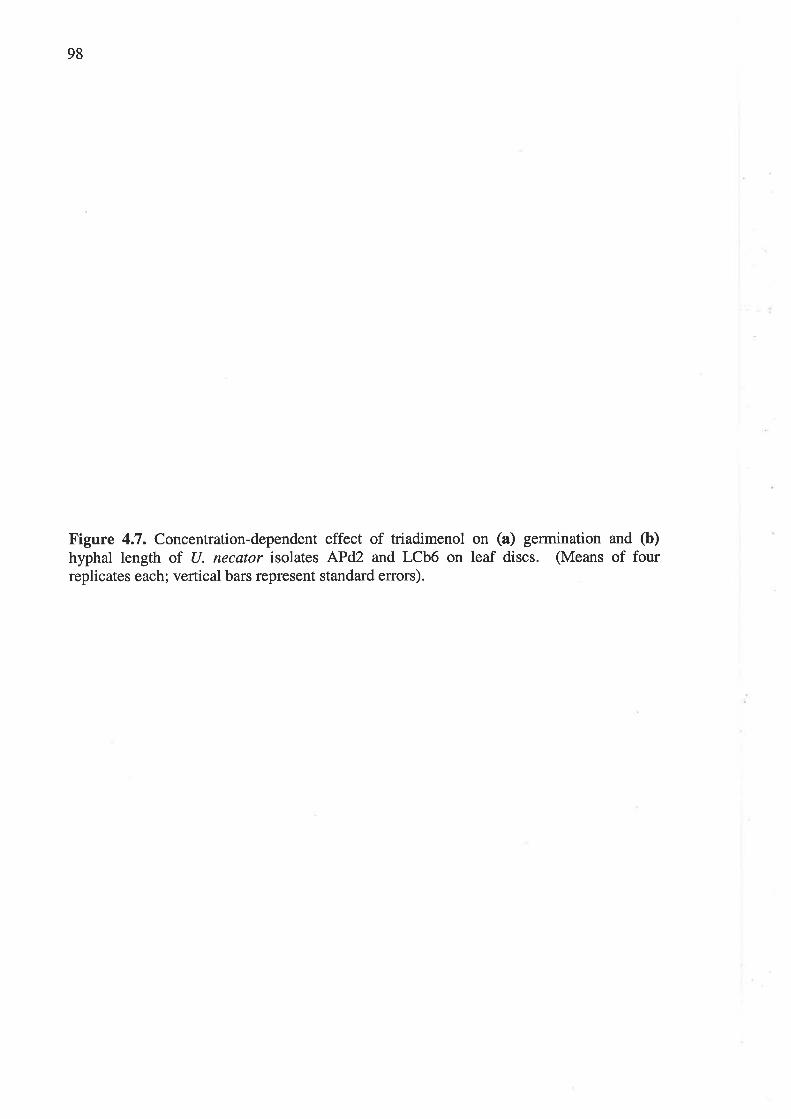
98
Figure 4.7. Concentration-dependent effect of triadimenol on (a) germination and (b)hyphal length of U. necator isolates APd2 and LCb6 on leaf discs. (Means of fourreplicates each; vertical bars represent standard errors).
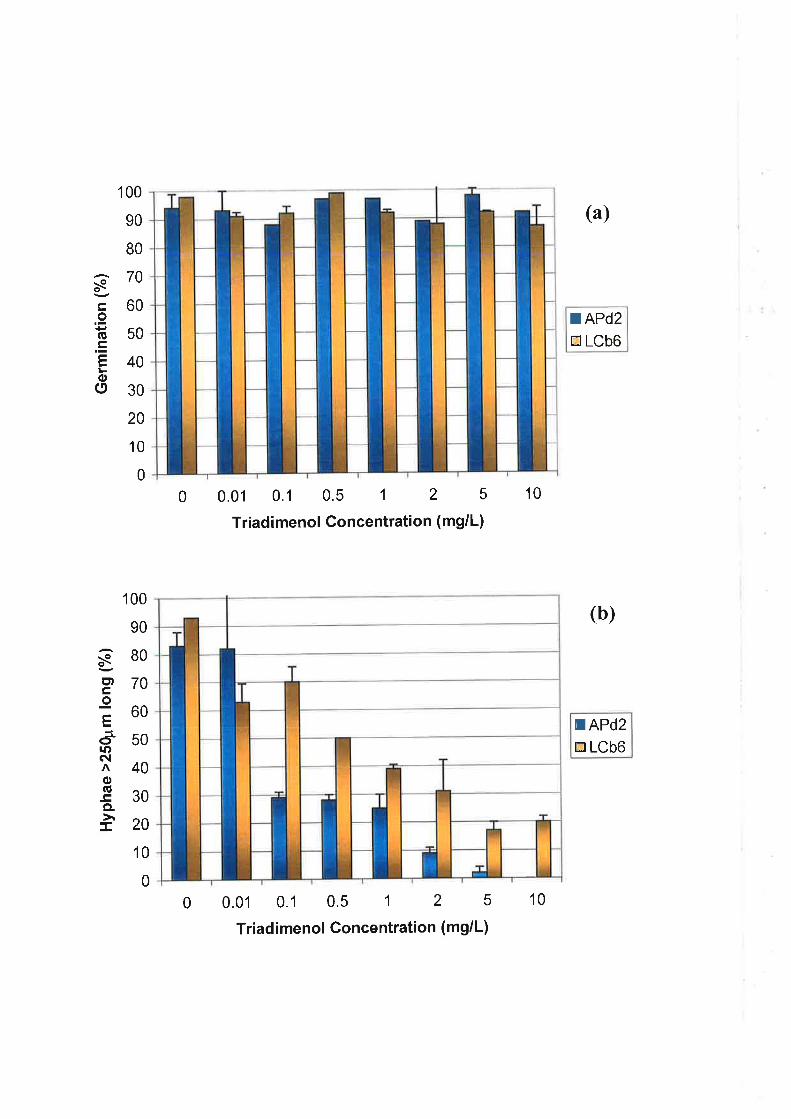
100
90
80
70
60
50
40
30
20
10
0
(a)
so(5
.E
oo
I APd2
E LCb6
(b)
tr APd2
tr LCb6
0 0.01 0.1 0.5 I 2 5
Triadimenol Concentration (mg/L)
0.01 0.1 0.5 1 2 5
Triadimenol Goncentration (mg/L)
10
scttcoEãrOñl
o(ú
o.
100
90
BO
70
60
50
40
30
20
10
0
0 10
99
Figure 4.8. Concentration-dependent effect of triadimenol on the percentage of U. necatorAPdz and LCb6 conidia germinated and forming appressoria. (Means of four replicates
each; vertical bars represent standard errors).
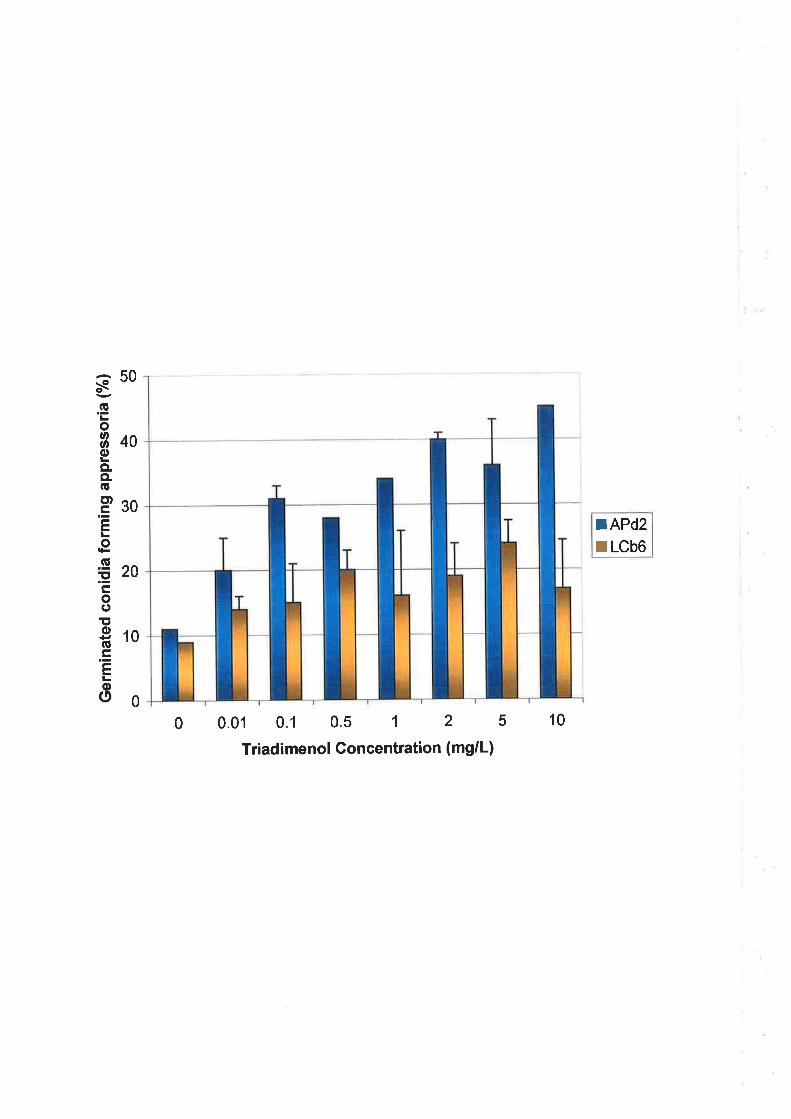
rAPd2¡ LCb6
,- 50S;'Lo3, 40oLCLCL(ú
Pgo.E
orÊ.g ^^ît ¿v.E
oo!t€10g.E
Loo0100.01 0.1 0.5 1 2 5
Triadimenol Concentration (mgrl)0
100
longer than 250 pm whereasT0To of LCb6 hyphae were longer than 250 pm' For APd2 at
10 mg/L triadimenol, some conidia had germinated, however, no hyphal extension was
observed, whereas for LCb6, 20Vo of hyphae were longer than 250 pm @igure 4.6E and I
and Figure 4.7b). Morphological aberrations became apparent in APd2 at 0.5 mgll' when
compared to growth on untreated leaf discs, including increased branching from primary
hyphae and hyphal tips swollen, forming club-like structures. Hyphae appeared shorter and
ranged from 2.5 to 5 pm in width (Figure 4.68 and C). In contrast, hyphae on untreated
leaf discs ranged from 1.25 to 2.5 pm in width. At higher concentrations of triadimenol (2
to 10mg/L) conidia formed shorter germ tubes and prevention of hyphal development was
noted. Increased concentrations of triadimenol did not have as pronounced an effect on the
development of LCb6, however, some hyphal tip swelling and increased hyphal branching
were noted (Figure 4.6G and H). At 10mg/L, hyphal extension was observed, however,
some hyphae appeared malformed (Figure 4.6F)'
At all concentrations of triadimenol tested, more appressoria (P < 0.05) were
observed for APd2 than LCb6 (Figure 4.8). For example, at 10 mg/L triadimenol45Vo of
germinated conidia of APd2 had formed appressoria ffigure 4.6D) whereas only ITVo of
germinated conidia of LCb6 had formed appressoria.
4.4 DrscussloN
This study was aimed at determining if reduced sensitivity to triadimenol and
fenarimol, two commonly used DMIs, exists among Australian isolates of U. necator. U.
necator isolates from nine viticultural regions within South Australia, Victoria and
Western Australia were assayed for sensitivity to triadimenol and fenarimol. All isolates
available were tested for sensitivity to triadimenol, however, due to time constraints and
100
the availability of resources, only a selection of these were tested for sensitivity to
fenarimol. Fungicide sensitivity was evaluated in (i) a population of isolates not previously
exposed to DMIs and (ii) a population exhibiting field resistance to DMIs. No U. necator
isolates were collected prior to the release of DMIs in Australian vineyards, therefore,
isolates representing the unexposed population were collected from vineyards in which
sulphur was the only chemical used for the control of grapevine powdery mildew for the
past 10 years. In contrast, the population exhibiting practical resistance to DMIs comprised
isolates collected from vineyards in which up to five DMI sprays were applied in one
grapevine-growing season.
Published methods (Nass, I99I; Steva, 1994; Gubler et al., 1996; Erickson and
Vy'ilcox, 1997) for assaying sensitivity of U. necator isolates to DMI fungicides were
evaluated. The method of Steva (1994) is based on the assessment of the effects of DMIs
on elongation of hyphae of U. necaror. This method was evaluated in a preliminary assay
for usefulness in determining sensitivity differences between three isolates, one previously
unexposed to DMIs and two collected from a population of U. necaror exhibiting practical
resistance to DMIs. Results were consistent with those of Steva (1994) and Steden (1994)
in that a quantitative shift in sensitivity was obvious between the isolates. It is important to
note that LCbl and LCb5 were collected from the same vineyard in which practical
resistance had occurred, hence this shows that a population may be composed of isolates
with a range of sensitivities. The sensitivity of the conidia from the unexposed vineyard
ranged from <0.01 to 2 mglL triadimenol, and the treated isolates ranged from <0.01 to
>10 mgl[.. However, the microscopic measurement of hyphae was time consuming. Also,
only hyphal length is measured and, therefore, the infectivity of conidia is not taken into
account. According to Siebels and Mendgen (1994), this can be a disadvantage because
results do not reveal whether the isolate can penetrate the cuticle and whether it will
101
sporulate on the leaf surface. Therefore, this method may not reflect the situation in the
field. One way to overcome this would be to examine the formation of infection structures
over a period of time, which would involve examining samples over the 3-day period. In
addition, for an obligate biotroph, it may be difficult to examine infection structures over a
period of time because each time a sample was examined it would be destroyed. In
considering the above factors, a more efficient method was sought.
A method modified from Erickson and Wilcox (1997) was evaluated to identify
representative triadimenol-sensitive and resistant isolates for use in further studies and to
determine the distribution of sensitivities among the unexposed and selected isolates. This
method also allowed the comparison of shifts in the sensitivity of isolates to each DMI
tested and the examination of cross-resistance relationships. Determining the EC5s value
of an isolate by conducting assays at several DMI concentrations can be one of the most
precise sensitivity measures (Köller et aI., 1991). Using the bioassay, in this study, the
mean ECso values of the unexposed population were 0.07 and 0.08 mgll- for triadimenol
and fenarimol, respectively. In comparison, Erickson and 'Wilcox (1997) reported EC56
values of 0.09 and 0.03 mglL for triadimenol and fenarimol, respectively, in an assay of 77
(J. necator isolates from New York State. Similarly, Nass (1991) reported ECso values of
0.07 and 0.04 mgll- for triadimenol and fenarimol, respectively, in an assay of three U.
necator isolates from New Zealand. These results suggest that this type of bioassay to
determine ECso values is reproducible amongst different research groups.
The baseline sensitivities obtained for triadimenol and fenarimol showed a
continuous distribution, with EC56 values ranging from 0.03 to 0.12 mglL and 0.01 to 0.33
mgL, respectively. The continuous distribution of ECso values has also been observed for
many other pathogens that have been treated with DMIs (Hsiang et aI.,1997; Köller et al.,
t997; Karaoglanidis et aL,2000). Köller (1991) assigned an operational definition of DMI
102
resistance, based on the response of a DMl-treated population, such that phenotypes are
resistant if their frequencies have increased substantially at sites with unsatisfactory disease
control in response to extensive use of a fungicide. In the present study, the distribution of
isolate sensitivities found in baseline or unexposed populations were compared to the
distribution of isolate sensitivities from the selected population. For both triadimenol and,
to a lesser extent, fenarimol, isolates from the selected population also showed a
continuous distribution of sensitivities and were found to increase over the baseline
population. This indicates that the U. necator populations, in vineyards where DMIs have
been used, have shifted toward resistance to this group of fungicides. This is the first
documented case of DMI resistance in a grapevine powdery mildew population in
Australia.
Distributions of sensitivity for triadimenol was significantly different for the
unexposed versus the selected populations. EC5s values for the selected population ranged
from 0.01 to 3.81 mglL, with 827o of the population showing values greater than the
highest ECso value (0.12 mglL) of the unexposed population. There was a l3-fold increase
in the mean EC5s values for triadimenol in the selected versus the unexposed populations.
This may represent the magnitude of shift that has occurred in the U. necator population
since DMIs were first used in the DMl-treated vineyards. It appears that the Australian
population of U. necator has not shifted as much as the New York State population, in
which a 30-fold increase was observed for triadimenol (Erickson and V/ilcox, 1997). In
decreasing order, the Mclaren Vale, Langhorne Creek, Adelaide Hills and Mildura
populations had the largest shift from the unexposed population. Isolates from Mildura,
40%o of which were obtained from Sunraysia Horticultural Centre, showed the smallest
shift towards resistance. This may reflect the spray program used at this site, which takes
into account DMI anti-resistance strategies (see Section I.6.2). Three vineyards at
103
Langhorne Creek and Adelaide Hills exceeded the recommended number of three DMI
sprays per season, having received either four or five sprays in one season. This may
explain the shift toward a more resistant population in these regions.
A much less pronounced shift was observed in the distribution of sensitivities to
fenarimol. There was no significant difference between unexposed and selected
populations. ECso values for the selected population ranged from 0.01 to 0.98 mg/L, with
only l77o of the population lying above the highest ECso value (0.33 mgL) of the
unexposed population. This ITVo was composed of three isolates from 'Western Australia
and one from Langhorne Creek. In contrast to triadimenol, mean ECso values for fenarimol
in the selected population have shifted only by a factor of two. These results are
comparable to those obtained by Erickson and Wilcox (1997) in New York State vineyards
where a two-fold increase in median EC56 values was observed. Similar results were also
obtained in Californian vineyards where an overall one to three-fold increase was observed
(Gubler et a1.,1996).
Cross-resistance among DMIs has been studied for a number of fungicide-pathogen
combinations (Köller et al., I99I; Kendall et al., 1993; 'Wellmann et al., 1996;
Karaoglanidis ¿r aL,2000). Information on the extent of cross-resistance among DMIs in
Australian vineyards was not available prior to this study, however, cross-resistance among
DMIs has been reported previously for U. necator in California (Gubler et ø1., 1996) and
New York State (Erickson and Wilcox, 1997). In this study, the degree of cross-resistance
between triadimenol and fenarimol was examined by two different methods and the
advantages and limitations of these were discussed by Erickson and V/ilcox (1997). In the
first method, using correlation analysis, all isolates examined in the bioassay were taken
into account. This allows for the maximum number of isolates to be analysed, removing
any bias when selecting isolates. A positive correlation (r = 0.43) was found in
104
sensitivities to triadimenol and fenarimol. Similar results were obtained by Erickson and
Wilcox (1997), who also found sensitivities to triadimenol and fenarimol to be positively
correlated (r = 0.56). In the second method, the degree of cross-resistance was analysed by
combining results from the bioassay with triadimenol and fenarimol, for the selected
isolates, into a Venn diagram. The values for classifying an isolate as resistant to
triadimenol (ECso >0.42 mgL) and fenarimol (ECso >0.I2 mgL) were comparable to those
obtained by Erickson and Wilcox (1997) (>0.56 and >0.18 mgtL for triadimenol and
fenarimol, respectively). Using the first method of analysis, resistance levels obtained in
our study were not as positively correlated as those of Erickson and Wilcox (1997),
however, using the second method, a greater degree of cross-resistance was observed in
this study. For example, of the isolates classified ás resistant to triadimenol (87Vo),467o of
these were also classified as resistant to fenarimol. However, Erickson and Wilcox (1997)
found a slightly greater percentage of isolates were resistant to triadimenol (937o), and of
these, only ITVo were resistant to fenarimol. These differences can be explained by the fact
that, in our study, the mean ECso value for isolates tested for fenarimol (0.19 mg/L) was
greater than that found by Erickson and Wilcox (1997) (0.07 mglL). The use of the Venn
diagram gave a clear interpretation of results and the degree of cross-resistance. As
expected, the Australian isolates showed an overall moderate degree of cross-resistance
between the two fungicides. However, for all isolates except one, EC5q values were always
lower to fenarimol than to triadimenol.
These findings may have implications with respect to managing powdery mildew
and DMI resistance in the vineyard. It has been suggested that differences in cross-
resistance patterns and in sensitivity shifts between DMIs may be due to the intrinsic
activity of certain DMIs (Gubler et aI., 1996). They may also reflect differences in the
genetic control of the variation in sensitivity to triadimenol and fenarimol, despite a known
105
common mode of action, suggesting that there may be a difference in the selection process.
i.ie^hÊe.lTo date, only a single gene h.ts been¡to confer resistance to DMI fungicides in U. necator,
however, multiple gene resistance has been confirmed in other plant pathogens (van Tuyl,
1977; Schepers, 1984; Kalamarakis et al., 1989; Peever and Milgroom, 1993). Other
factors may also account for the difference observed in levels of resistance to triadimenol
and fenarimol (see Section I.9.2). Low application rates of DMIs have been found to
increase the rate at which resistance evolves in Venturia inaequalis by selecting isolates
that withstand low doses (Köller and Wilcox, 1999). However, this was not the case for
Septoria tritici where reduced doses had no effect on shifts in resistance (Shaw and Pijls,
1994). A study conducted in French vineyards showed that, for U. necator, the use of half
the recommended application rate of triadimenol was more effective in selecting resistant
isolates within the population than were full application rates (Steva,1994). In Australian
populations of U. necator, the effects of using different application rates (other than those
recommended by the chemical manufacturer) on DMI resistance levels are unknown. To
determine these effects, there is a need for further studies in which different DMI rates are
applied in field experiments and the U. necator population examined subsequently for
sensitivity to various DMIs. Also, to obtain a true representation of the sensitivity levels
that exist in Australian populations of U. necalor, there is a need to study more isolates
from a number of different vineyards within a region.
Despite the poor performance of triadimenol due to resistance, the results from this
study suggest that the use of an alternative DMI may provide adequate control of U.
necator. This has also been suggested previously by Erickson and Wilcox (1997). DMIs
from different chemical groups could be used in rotation with each other and with other
chemicals commonly used to control grapevine powdery mildew. Field trials to monitor
levels of resistance following application of different DMIs could be conducted in future

106
studies. This may help reduce selection pressure for the development of practical
resistance and, in turn, will provide a larger armoury to control grapevine powdery mildew
effectively.
Fungicides in different groups target different biochemical pathways and, therefore,
different developmental stages of the fungus. This knowledge becomes important when
considering disease management strategies, such as the timing of fungicide applications. In
the case of the DMIs, they primarily inhibit hyphal elongation (Staub and Sozzi, 1984).
Microscopic evaluations on the effect of DMIs on other plant pathogens have also been
documented (Heller et al., 1990; Siebels and Mendgen, 1994). In this study, triadimenol
had no effect on the germination of conidia in both resistant and sensitive isolates. Pontzen
et al. (1989) have shown that ergosterol biosynthesis is not needed for the germination of
spores of Puccinia graminis f. sp. tritici. However, several DMIs have been reported to
cause malformation of infection structures, and branching and swelling of hyphae (Iæinhos
et a1.,1997; Heller et a1.,1990; Buchenauer,l9ST; Smolka and Wolf, 1986). In our study,
the morphology of primary infection structures in both sensitive and resistant isolates was
not affected by triadimenol. However, for the sensitive isolate, as the concentration of
triadimenol increased the number of appressoria increased, secondary hyphae became
shorter, extensive hyphal branching developed and hyphal tips were swollen. These
morphological changes may be due to alterations in the function of the plasmalemma
(Heller et a1.,1990), initially caused by a change in sterol levels induced by triadimenol,
followed by the activation of chitin synthetase (Buchenauer, 1987). The above changes
were not observed in the resistant isolate. However, a decrease in growth of that isolate
was observed at the highest concentration of triadimenol tested. The ability of the resistant
isolate to overcome the effects of the fungicide can be explained by considering the
different mechanisms that may be operating (see Section I.7.2). A number of mechanisms
to7
have been reported for insensitivity to DMIs, the most common being a defect in C14o-
demethylation during sterol biosynthesis.
In summary, a bioassay for fungicide resistance was modified and successfully used
to determine the sensitivity of U. necator to triadimenol and fenarimol DMIs commonly
used in Australian vineyards. Reduced sensitivity to triadimenol and to a lesser extent
fenarimol was confirmed for U. necator isolates collected from vineyards in various
viticultural regions of Australia and partial cross-resistance between these two DMIs was
also confirmed. It is important to note, however, that the bioassay for fungicide resistance
is laborious and time consuming, requiring 12 days before a result becomes available.
Also, there is a constant requirement for disease-free leaves, meaning that grapevine plants
need to be maintained in a controlled environment all year round. Therefore, to increase
the number of isolates screened at any one time, a more rapid means of determining if
resistant isolates exist within a vineyard is required and molecular studies may provide this.
108
CHAPTER 5.0
DNA Sneunxcp AN¡.LysIS oF TIrE Cl4a-nEMETrryLAsE GBNB(CYP51) .tlr PCR Atwr,rrIcATIoN oF A Spncrrrc Alr,nr,n
5.1 INTnoDUCTION
The cytochrome P450 superfamily of proteins is found in all prokaryotic and
eukaryotic organisms. In filamentous fungi, one division of this superfamily, the CYP51
gene family, encodes endoplasmic reticulum membrane proteins (P450r¿orr¡) that catalyse
the l4cr-demethylation of eburicol in the ergosterol biosynthesis pathway. The P450r¿o¡,,r
of animals and yeasts differ from those in filamentous fungi in that the former use
lanosterol as substrate instead of eburicol. These enzymes are a known target site of the
DMI fungicides, and over the past 4 years there has been a dramatic increase in the number
of eukaryotic CYP51 sequences available within genetic databases such as GenBank.
Characterisation of CYP51 genes has led to a better understanding of the molecular
mechanisms of the resistance to DMI fungicides that has developed in a number of target
organisms (De Waard, L994).
CYP51 genes have been studied in numerous yeasts and filamentous fungi
including; Candida albicans (Marichal et aI., 1999), P. italicum (van Nistekooy et al.,
1996) and U. necator (Délye et al., 1997c). Resistance to DMI fungicides has been
associated with point mutations in the CPY51 gene of filamentous fungi and yeasts (Délye
et aL, 1997d; Löffler et al., 1997; Sanglard et al., 1998). PCR based assays have been
developed to detect specific alleles in fungicide resistant plant pathogenic fungi, including
B. cinerea and U. necator (Luck and Gillings, 1995; Délye et al., 1997d). PCR
amplification of specific alleles (PASA) uses specially designed oligonucleotide primers
109
that preferentially amplify the mutant allele and not the normal allele (Sommer et al.,
1992). This can be achieved if a primer matches the mutant allele, but mismatches the
normal allele at the 3' end of the primer. Poor or no amplification of the normal allele
occurs because a mismatch at the 3'end prevents primer extension during the PCR
(Sommer and Tautz, 1989).
The objectives of the work reported in this chapter were to (i) clone and sequence
the CYP51 gene from triadimenol-sensitive and triadimenol-resistant Australian isolates of
(J. necator based on available sequence information (Délye et al., I997c); (ii) to compare
these two sequences to one another and to sequences available in databases; (iii) to
determine whether a published point mutation associated with resistance to triadimenol
was present in Australian isolates of U. necator (Délye et aL, L997d) and; (iv) to develop a
rapid PCR-based diagnostic method to detect DMl-resistant isolates of U. necator from
field material.
5.2 MnrnRrALS aND METHoDS
5.2.1 U. necator isolates
Triadimenol-sensitive isolate APfl (ECso = 0.06 múL; RF = 1) and triadimenol-
resistant isolate LCb6 (ECso = 2.21 mgL, RF = 34) (see Chapter 4.0) were chosen for
cloning and sequence analysis of the CYP51 gene. Mass production of conidia and DNA
extraction for each isolate were as described in Sections 2.5 and 2.6, respectively.
Genomic DNA used to screen for the presence of a specific allele of the CYP51
gene in 62 single-spore isolates of U. necator, eight field samples of grape berries infected
with powdery mildew from two Adelaide Hills vineyards and six other fungi (Alternaria
110
sp., Aspergillus niger, Botrytis cinerea, Cladosporium sp., Phomopsis viticola and
Saccharomyces cerevisiae) isolated from grapevine tissue by B. Stummer (Department of
Applied and Molecular Ecology, Adelaide University).
5.2.2 Assessment of methods for DNA template preparation from conidia and U.
ne cator-infected grapevine material
DNA was extracted from 5 to 40 mg of frozen conidia using a method based on that
described by Evans et aI. (1996) (see Section 1.6). DNA was extracted from U. necator-
infected micropropagated grapevine plantlets and field-collected grape berries using four
methods; (i) based on that described by Doyle and Doyle (1980) (see Section 2.7), (11)
based on that described by Doyle and Doyle (1980) followed by purification using the
Geneclean@ Spin Kit (BIO/101), (iii) use of GeneReleaser* (Bioventures Inc., USA), or
(iv) use of the DNEasy'" Plant Mini Kit (Qiagen) (see Section 2.7). PCR using DNA
extracted by the last method proved to be the most reproducible. Therefore, the DNEasy'"
Plant Mini Kit was used to obtain high quality DNA for all subsequent experiments
involving PCR amplification from infected grapevine tissue.
5.2.3 PCR primers
All previously published and custom-made oligonucleotide primers used in the
work reported in this chapter were synthesised by GeneWorks (South Australia) and are
shown in Table 5.1.
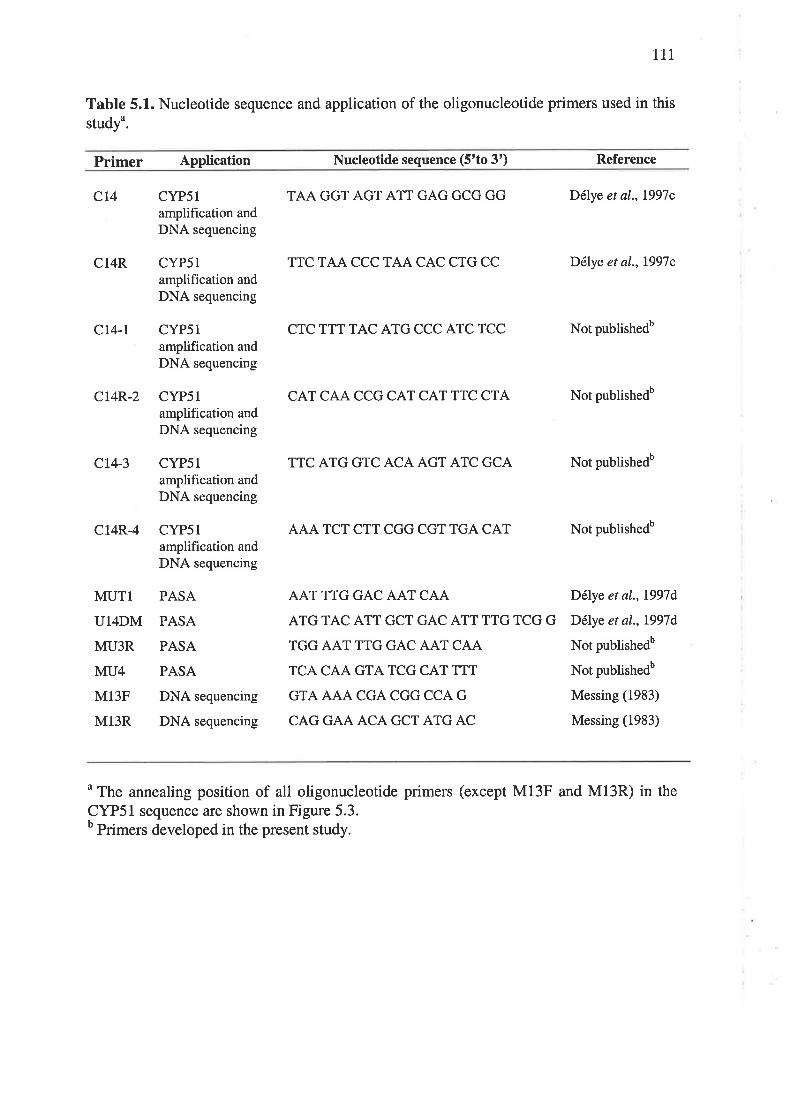
1r1
Table 5.1. Nucleotide sequence and application of the oligonucleotide primers used in this
studyu.
Primer Application Nucleotide sequence (5'to 3') Reference
CL4 CYP5lamplification andDNA sequencing
C14R CYP51amplification and
DNA sequencing
CL4.I CYP51amplification andDNA sequencing
C14R-2 CYP51amplification andDNA sequencing
CT4-3 CYP51amplification andDNA sequencing
c14R-4 CYP5lamplification and
DNA sequencing
TAA GGT AGT ATT GAG GCG GG Délye et aL,1997c
TTC TAA CCC TAA CAC CTG CC Délye et al.,I997c
CTC TTT TAC ATG CCC ATC TCC Not publishedb
CAT CAA CCG CAT CAT TTC CTA Not publishedb
TTC ATG GTC ACA AGT ATC GCA Not publishedb
AAA TCT CTT CGG CGT TGA CAT Not publishedb
MUTl
U14DM
MU3R
MU4
Ml3F
M13R
PASA
PASA
PASA
PASA
DNA sequencing
DNA sequencing
AAT TTG GAC AAT CAA
ATG TAC ATT GCT GAC ATT TTG TCG G
TGG AAT TTG GAC AAT CAA
TCA CAA GTA TCG CAT TTT
GTA AAA CGA CGG CCA G
CAG GAA ACA GCT ATG AC
Délye et qL, t997d
Délye et al.,I997d
Not publishedb
Not publishedb
Messing (1983)
Messing (1983)
n The annealing position of all oligonucleotide primers (except M13F and M13R) in the
CYP51 sequence are shown in Figure 5.3.o Primers developed in the present study.
rt2
5.2.4 PCR amplification and cloning of the U. necator CYP51 gene
Primers C14 and C14R, corresponding to sequences flanking the CYP51 open
reading frame (ORF) of U. necator Qélye et al.,1997c; GenBank accession no.U72657),
were used to generate a 1756 bp DNA fragment by PCR. Each PCR was performed at least
twice on two independent DNA samples. In preliminary experiments, parameters of the
PCR cycling protocol and reaction mix were tested, however, only the optimised
conditions are presented here. Amplification of the DNA fragment was performed in a
Corbett Research FTS-I thermal cycler. A 25 ¡tl reaction mix containing lX Tøq DNA
polymerase buffer (Promega), 2mM MgCl2, 250 pM of each dNTP, 0.2 pM of each primer
(C14 and C14R), 40-60 ng of template DNA and 1 unit of Zaq DNA polymerase
(Promega) was prepared in a 0.5 ml PCR tube and overlaid with sterile mineral oil. The
reaction mix was submitted to an initial denaturation at 94"C for 4 min, followed by 37
cycles of I min denaturation at 94"C, 2 min annealing at 65oC and 2 min extension at
72"C, with a final extension step of 5 min at 72"C. PCR products were analysed on 2Vo
(w/v) agarose gels electrophoresed in 0.5x Tris-borate-EDTA (TBE) buffer (see Appendix)
at 6Ylcm and visualised under UV light following ethidium bromide staining.
The PCR products obtained using template DNA of isolates APfl and LCb6 were
purified using the Jetquick PCR purification kit (Genomed, Astral Scientific). The
concentration of purified product was estimated by visual comparison to a DNA standard
following electrophoresis. Purified PCR products from APfl and LCb6 were cloned in
Escherichia coli JM109 High Efficiency Competent Cells (Promega) using the pGEM@-T
Easy Vector system as described in the Promega technical manual part # TM042. The
vector to insert (PCR product) molar ratio was 2:1. Following transformation of competent
cells, 100 pl of each culture was placed onto Luria-Bertani (LB) agar (see Appendix)
113
containing 100 pglml ampicillin, 0.5mM IPTG and 80 pdml X-Gal and incubated
overnight at 37"C. Single, putative recombinant (white) colonies were removed with a
sterile toothpick and transferred to 10 ml TYP broth (see Appendix) containing 100 pdml
ampicillin and incubated overnight at 37oC.
Plasmid DNA was isolated using the Wizard@ Plus SV Minipreps DNA
Purification System (Promega). Two methods were used to confirm the presence of an
insert. First, the recombinant DNA was digested with the restriction enzyme EcoRI in a 10
pl reaction volume with incubation overnight at 37oC and the presence of an insert was
confirmed by gel electrophoresis. Second, amplification of the cloned insert was
performed using the universal primers, Ml3F and M13R (Messing, 1983) in a 25 ¡tl
reaction mix containing lX laq DNA polymerase buffer (Promega), 1.5mM I|/4.gCl2,250
pM of each dNTP, 0.4 pM of each primer (M13F and M13R), 0.2 units of Iøq DNA
polymerase (Promega) and 5 to 10 ng of plasmid DNA. The reaction mix was submitted to
an initial denaturation at 94"C for 3 min, followed by 25 cycles of 30 secs denaturation at
94"C,30 secs annealing at 48oC and2 min extension at 72"C, with a final extension step of
5 min at72"C. Generation of a PCR product was confirmed by gel electrophoresis.
5.2.5 Automated DNA sequencing and analysis
For each of the isolates APfl and LCb6, one clone and two sets of purified PCR
samples (see Section 5.2.4) containing the amplified product were analysed by automated
DNA sequencing (Flinders University DNA Sequencing Service, South Australia) in both
directions (forward and reverse). Primers Ml3F and M13R used for sequencing of plasmid
clones were supplied by the sequencing service. Custom-made primers (Table 5.1) based
on internal DNA sequences were designed using the program OLIGOTM Version 4.0s (W.
lr4
Rychlik, National Biosciences, Inc. Plyrnouth, USA) and were provided to the sequencing
service for sequencing directly from a purified PCR sample.
DNA sequence editing was carried out using the program SeqEdru Version 1.0.3
(Applied Biosystems Inc., USA). DNA sequence analysis was carried out using programs
of the GCG Sequence Analysis Software Package Version 8 (Genetics Computer Group,
Madison, WI, USA; Devereux et al., 1984) through the webANGIS interface
(http://www.angis.org.au). The BLAST server (National Center for Biotechnology
Information, National Library of Medicine, Bethesda, MD, USA; Altschul et a1.,1990) was
used for DNA and protein similarity searches of the GenBank database.
Sequencing directly from a purified PCR sample proved to be successful and less
time consuming than cloning each fragment, therefore, all subsequent sequencing was
performed using the custom-made primers on purified PCR samples. In order to extend
and complete the 1756bp DNA sequence in both directions, additional PCR primers were
designed using the program, OLIGOru Version 4.0s. PCR amplification of the CYP5I
gene was performed in three parts. Primers C14 and C14R were used to amplify the initial
1756 bp fragment. Following automated sequencing of this fragment, extension was
continued with the custom-made primers Cl4-I and C14R-2 to amplify a 1176 bp
fragment (nucleotides 257 to 1432) of the CYP5I gene. Primers C14-3 and C14R-4 were
used to amplify a 356 bp fragment (nucleotides 64 to 419). The conditions used for
primers CI4-I, CI4R-2, CI4-3 and C14R-4 were as follows; between 10 and 25 ng of
plasmid DNA was added to a 25 pl reaction mix containing Taq DNA polymerase buffer
(Promega), 2 mM MgCl2, 250 pM of each dNTP, 0.1 ¡^tM of each primer and 0.2 unit of
Zaq DNA polymerase (Promega). Each reaction was set up in a 0.5 ml PCR tube. The
PCR cycling conditions and analysis of fragments were as described in Section 5.2.3,
however, annealing was at 58"C (C14-3 and C14R-4) or 60oC (CI -I and C14R-2).
115
5.2.6 PCR amplifïcation of a specifîc allele
Primer MUT1 was specifically designed to prime only those alleles of CYP5I
exhibiting an A-to-T mutation at nucleotide 462 (Délye et al., I997d). Together with
primer U14DM a 476 bp DNA fragment was amplified, which should be indicative of the
presence of the mutant allele in the template DNA. Each amplification reaction was
performed at least twice on two independent DNA samples. Initially, the parameters of the
PCR cycling and components of the reaction mix, as described by Délye et aI. (1997d)
were tested, however, only the final optimised PCR conditions are presented here.
Amplification of the fragment was performed in a Corbett Research FTS-I thermal cycler.
A25 ¡tl reaction mix containing lX Ta4 DNA polymerase buffer (Promega), 2mM MgCl2,
250 pM of each dNTP, 0.1 pM of each primer (MUTI and U14DM), 50-60 ng of template
DNA and I unit of Tøq DNA polymerase (Promega) was set up in a 0.5 ml PCR tube and
overlaid with sterile mineral oil. PCR cycling conditions were as described in Section
5.2.4, except that the annealing temperature was 50oC. PCR products were analysed on
2Vo (wlv) agarose gels run in 0.5x TBE buffer at 6 V/cm and visualised under UV light
following ethidium bromide staining.
5.2.6.1Optimisation of PCR amplification of a specific allele of CYP51
Primers MUT1 and U14DM proved to be unreliable in detecting the presence of the
A+o-T mutation in DNA template extracted from both conidia and from infected grapevine
tissue and required relatively large amounts of template DNA. Using OLIGOTM Version
4.0s, the sequence of primer MUT1 was extended by three nucleotides at the 5'end,
producing the new primer MU3R (Table 5.1). U14DM was replaced with primer MU4
(Table 5.1). MU4 and MU3R were designed to amplify a 409 bp fragment of the CYP51
gene only when the A-to-T mutation is present at nucleotide 462.
t16
To allow the primers to amplify a single base mutation in triadimenol-resistant
isolates (RF value greater than 6) only, the PCR conditions were optimised. Parameters
tested to optimise the PCR using MU3R and MU4 primers included; primer, magnesium
and DNA template concentrations; number of amplification cycles; addition of formamide
and annealing temperature (Sommer et aL,1992). Primer concentrations of 0.06, 0.08, 0.1,
0.2 and 1 pM; magnesium concentrations of; 1.5, 2 and 2.5 mM; DNA (extracted from
conidia) template concentrations of 0.5, 1, 2,5, l0 and25 ng; amplification cycles of 30,
35 and 37; formamide concentrations of 0,2 and 5Vo and; annealing temperatures of 45, 50,
51 and 53oC were tested. The final optimised conditions were as follows; a25 ¡t"l reaction
mix containing lX Zø4 DNA polymerase buffer (Promega), 1.5mM MgC12, 250 pM of
each dNTP, 0.06 pM of each primer (MU4 and MU3R), < 2 ng of U. necator template
DNA and 1 unit of Tøq DNA polymerase (Promega). The components were prepared in a
0.2 ml thin-walled PCR tube and amplification was performed in an MJ Research, Inc.
PTC-100'" programmable thermal controller. The reaction mix was submitted to an initial
denaturation at94"C for 3 min, followed by 35 cycles of 1 min denaturation at94"C,2 min
annealing at 51oC and 2 min extension at 72"C, with a final extension step of 5 min at
72"C. PCR products were analysed on 2Vo (w/v) agarose gels run in 0.5x TBE buffer at 6
V/cm and visualised under UV light following ethidium bromide staining. MU4 and
MU3R were also tested for their ability to amplify the same fragment from DNA extracted
from U. necator-infected grapevine tissue, using the method as described above.
rt7
5.2.6.2 Nested PCR amplification of a specific allele
Further optimisation of the PCR amplification of the CYP51 allele containing the
A-to-T mutation from template DNA, derived from infected grapevine material, involved
development of a two-round, nested PCR procedure based on the method described by
Sommer et al. (1989). Figure 5.1 shows a schematic representation of the PASA reaction
involving two rounds of PCR and the expected DNA fragments. In the first-round, primers
U14DM and Cl4R-2 (nucleotides 1 to 1432) were used to amplify a 1432 bp product from
both mutant and wild-type alleles of CYP51 as follows; the 25 ¡l PCR reaction mixture
contained, IX Taq DNA polymerase buffer (Promega), l.5mM MgCl2, 250 ¡rM of each
dNTP, 0.1 pM of each primer (U14DM and C14R-2), 5 to 10 ng of total DNA (extracted
using the DNEasyru Plant Mini Kit, Qiagen) and 1.25 units of Zaq DNA polymerase
(Promega) in a 0.2 ml thin-walled PCR tube. Amplification was performed in an MJ
Research, Inc. PTC-100* programmable thermal controller. The reaction mix was
submitted to an initial denaturation at 94"C for 3 min, followed by 37 cycles of 1 min
denaturation at 94oC, 1 min 30 secs annealing at 50oC and 1 min 30 secs extension at
72"C, with a final extension step of 5 min at 72"C. PCR products were analysed on 27o
(w/v) agarose gels run in 0.5x TBE buffer at 6 Ylcm and visualised under UV light
following ethidium bromide staining. The size and the amount of product obtained after
the first-round PCR were determined by visual comparison with the SPPl/EcoRI molecular
weight marker (GeneWorks, South Australia).
In the second-round PCR, an aliquot of the first-round PCR mixture was added to a
reaction mix containing primers MU4, MU3R and C14R-2 @gure 5.1). To determine the
amount of DNA to be used from the first-round PCR, a dilution series was performed with
the amplified DNA from a sensitive (APd2) and resistant (LCb6) isolate. DNA
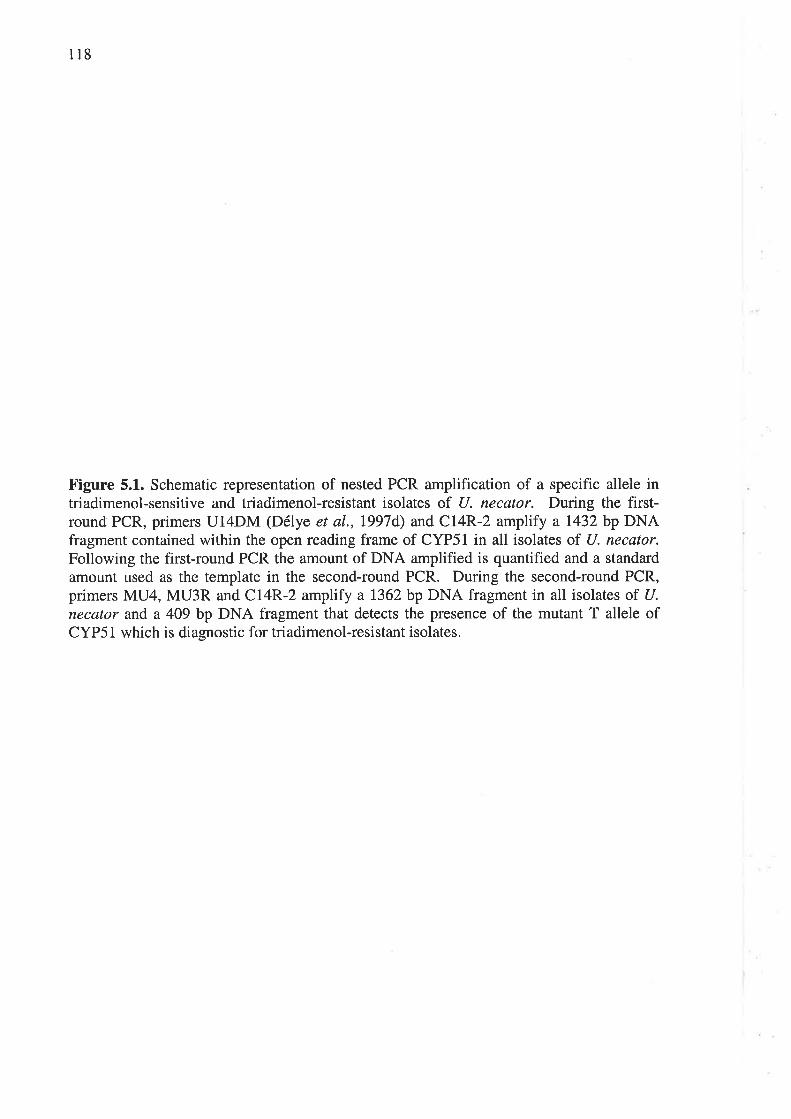
118
Figure 5.1. Schematic representation of nested PCR amplification of a specific allele intriadimenol-sensitive and triadimenol-resistant isolates of U. necator. During the first-round PCR, primers U14DM (Délye et al., I997d) and C14R-2 amplify a 1432 bp DNAfragment contained within the open reading frame of CYP51 in all isolates of U. necator.Following the first-round PCR the amount of DNA amplified is quantified and a standardamount used as the template in the second-round PCR. During the second-round PCR,primers MU4, MU3R and C14R-2 amplify a 1362 bp DNA fragment in all isolates of U.
necator and a 409 bp DNA fragment that detects the presence of the mutant T allele ofCYP51 which is diagnostic for triadimenol-resistant isolates.
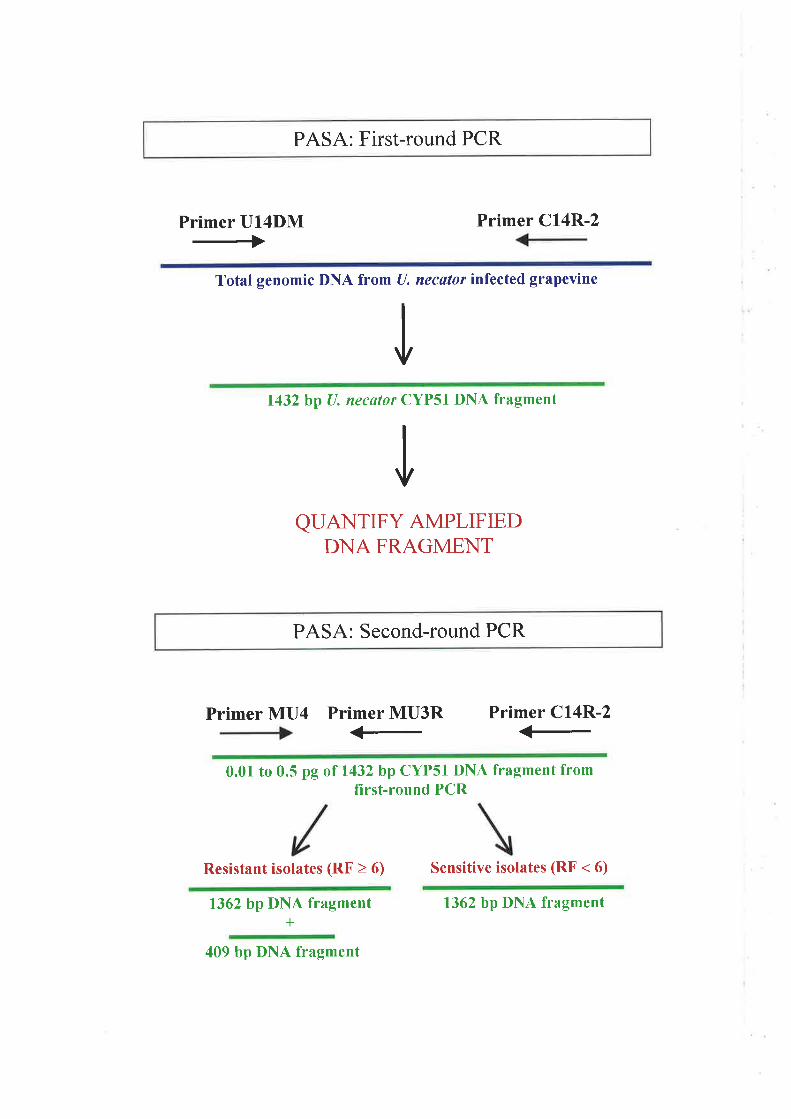
PASA: First-round PCR
Primer U14DM#
Primer C14R-2
Total genomic DNA from U. necøtor infected grapevine
1432 bp U. necator CYP51 DNA fragment
QUANTIFY AMPLIFIEDDNA FRAGMENT
PASA: Second-round PCR
t
I
Primer MU4 Primer MU3R<- Primer C14R-2<-0.01 to 0.5 pg oT 1432 bp CYP5I DNA fragment from
first-round PCR
Resistant isolates (RF > 6) Sensitive isolates (RF < 6)
1362 bp DNA fragment+
409 bp DNA fragment
1362 bp DNA fragment
LL9
concentrations of between 1 x 10⁻⁵ and 1 ng/¡rl were analysed. A 25¡tl reaction mix
containing lX Taq DNA polymerase buffer (Promega), 3 mM MgCl2, 250 pM of each
dNTP, 0.06 ¡lM of each of the primers (MU4, MU3R and C14R-2) and 1.25 units of Taq
DNA polymerase (Promega) or HotStar Iaq DNA polymerase (Qiagen) were prepared in a
0.2 ml thin-walled PCR tube. Amplification was performed in an MJ Research, Inc. PTC-
100'" programmable thermal controller. The reaction mix was submitted to an initial
denaturation at 94"C for 3 min, followed by 25 cycles of 30 secs denaturation at 94"C,30
secs annealing at 50oC and 1 min extension at72"C, with a final extension step of 5 min at
72"C. 'When using the HotStar Taq DNA polymerase (Qiagen), the initial denaturation
step was performed at 95oC for 15 min. PCR products were analysed on 27o (wlv) agarose
gels run in 0.5x TBE buffer at 6 V/cm and visualised under UV light following ethidium
bromide staining.
5.3 Rnsur,rs
5.3.1 Cloning and sequence analysis of the U. necator CYP51 gene from two
Australian isolates
Initially, primers C14 and C14R, flanking the U. necator CYP51 gene (Délye et al.,
I997c), were used to confirm the ability to amplify, by PCR, a single, 1756 bp DNA
fragment from DNA extracted from conidia of 54 Australian U. necator isolates. Figure
5.2 shows the amplification products obtained for 22 of these isolates, which comprised a
single band at 1756 bp. No amplification products were obtained with template DNA from
other fungal species isolated from grapevine tissues (results not shown)
r20
Figure 5.2. PCR amplification of a 1756 bp fragment of CYP51 using primers C14 and
C14R and U. necator DNA as template. The PCR products were analysed on a27o (wlv)agarose gel Lane 1, APfl; Lane 2, APd2; Lane 3, RLd 1; Lane 4, RLd3; Lane 5, RLd4;Lane 6,LCaI; Lane 7,LCaS; Lane 8, LCb6; Lane 9, LCb3; Lane 10, AHfl; Lane 11,
AHf6; Lane 12, AHfT; Lane 13, AHgl; Lane 14, AHg3; Lane 15, MVd4; Lane 16, MVd6,Lane 17, MVd7, Lane 18, VMa1, Lane 19, VMa5; Lane 20, VMb6; Lane 2l,lvRal; Lane
22, SYaL Lane M,300ng molecular weight marker, pGEM@ (Promega). Lane H,Hz}negative control (no template DNA). Fragment sizes (kb) are indicated on the left.
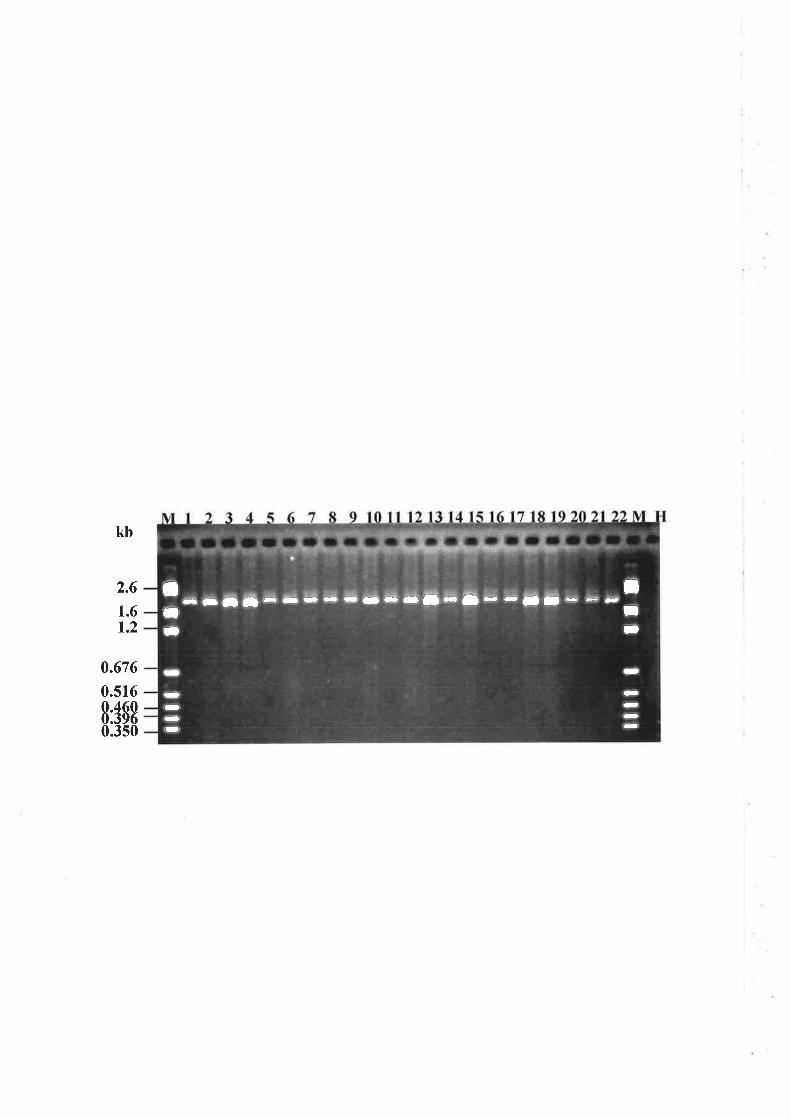
kb
2.6
1.61.2
0.676
0.s16
B:1180.3s0
--a¡----rt-lt-Öf rl- -l-JaB * O
--
It-
I¡I
----
--aa
-
I2l
The DNA sequences were obtained for the CYP51 genes cloned from isolates APfl
and LCb6 (Figure 5.3). Alignment of CYP51 DNA sequences from isolates APfl and
LCb6, revealed a single A-to-T difference at nucleotide 462 for isolate LCb6, which would
result in the presence of a phenylalanine residue at position 136 instead of a tyrosine
residue (Figure 5.3). Both sequences contained an ORF encoding 524 amino acids,
intemrpted by two introns at nucleotides 247 to 301 and 500 to 552.
The deduced amino acid sequences of P450r¿orr¡ from APfl and LCb6 were
compared with previously published CYP51 sequences within the GenBank database using
FastA analysis (Pearson and Lipman, 1988) (see Appendix). The APfl sequence was
demonstrated to be identical to the sequence of a triadimenol-sensitive isolate (FPEll)
from France (Délye et al., 1997c; GenBank accession no. U72657) (Figure 5.4) and LCB6
was identical to a triadimenol-resistant isolate (PAZLI) from Portugal (Délye et aL,1997d;
GenBank accession no. U83840) (results not shown). Alignment with deduced amino acid
sequences of P450r¿orr¿ from the other filamentous fungi; Blumeria graminis f. sp. hordei
(Délye et al., 1998), Botryotinia fuckeliana (unpublished, GenBank accession no.
AF2799I2), Tapesia yallundae (unpublished, GenBank accession no. AF27666I), V.
inaequalis (unpublished, GenBank accession no. AF227920), P. digitatum (Hamamoto e/
a1.,2000), P. ítalicum (van Nistehooy et al., L996) and the yeast, C. albicans (Marichal er
al., 1999) demonstrated 48 to 73Vo sequence identity (Figure 5.4). In all cases, the six
highly conserved P450r¿or'r regions, CRI to CR6 (Délye et aI., I997c) were clearly
identified (Figure 5.4).
122
Figure 5.3. The DNA sequence of the CYP51 genes of triadimenol-sensitive U. necatorisolate APfl and triadimenol-resistant isolate LCb6. Positions of PCR primers C14, C14R,
Cl4-I, CL4R-2, CI4-3, C14R-4, MUT 1, U14DM, MU3R and MU4 are indicated above
the nucleotide sequence. Exons are in upper case, non-coding regions are in lower case
and intron boundaries are in bold type. The open reading frame (ORF) comprises l572bpand continues until the TGA stop codon indicated by the asterisk. The putativetransmembrane region and CYP51 conserved regions (CRl to CR6) are underlined. The
haem-binding cysteine residue in CR6 is in bold type. The A to T mutation in the
conserved region CR2, corresponding to nucleotide 462 (codon 136), was found in isolateLCb6 and is indicated in shaded bold type and by an asterisk.
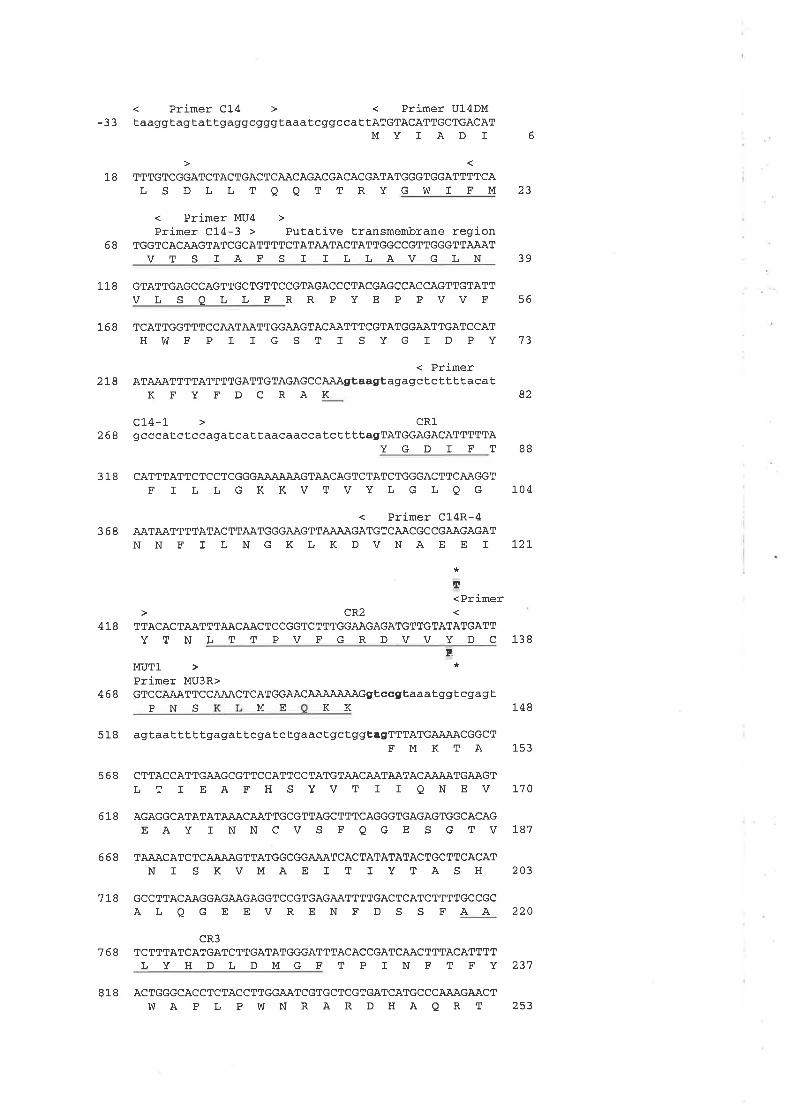
< Primer C!4 > <
-33 taaggtagtattgaggcgggtaaatcggrccatIATGTACATTGCTGACATMYIADI
1 8 TTTGTCGGATCTACTGACTCAACAGACGACACGÀTATGGGTGG.A,TTTTCA
6
LSDLLTQO TTRYGWIFM23
< Primer MU4 >Primer Cl,4-3 > Putative transmembrane region
6 8 TGGTCACA.AGTATCGCATTTTCTATAÀTACTÀTTGGCCGTTGGGTTAAATVTSIAFSIILLAVGLN
1. ]- 8 GTÀTTGAGCCAGTTGCTGTTCCGTÀGACCCT.A,CGAGCCACCAGTTGTATTVLSQLLFRRPYEPPVVF
1 6 8 TCATTGGTTTCCAÀTAÀTTGGAAGTACAÀTTTCGTÀTGGAATTGATCCATHV'TFPIIGSTISYGIDPY
39
56
73
< Primer2 1 I ATAÄATTTTATTTTGATTGTAGAGCCÀÀAgtaagÈ agagc t c t t t t aca t
KFYFDCRÀK 82
c14-1 > CRI-2 6 8 gcccatc tccagatcat taacaaccatc t t TTagTATGGAGACATTTTTA
YGDIFT 88
3 1 8 CATTTATTCTC C TCGGG.A.A.AÀÀAGTAACAGTC TATC TGGGAC TTCAAGGTFILLGKKVTVYLGLQG 104
< Primer C14R-43 6 8 ÀÀTAÀTTTTÄTACTTAÀTGGGAAGTTÀÃÀAGATGTCAACGCCGAÀG.A,GAT
N N F I L N G K L K D V N A E E f 'J,2L
*ñ<Primer
>cR2<4L8 TTÀCACTÀÀTTTAACAACTCCGGTCTTTGGAAGAGATGTTGTATATGATT
YTNLTTPVFGRDVVYDCl3Sl!
MUT1 > *Primer MU3R>
4 6 8 GTC CAAÀTTCCAÀAC TCATGGAACAÀÀÀÀ-AÀGgt' c c g t a a a t gg t c ga g tME KK L48PNS
518 agtaatttttgagatÈcgatctgaactgctggtagTTTATGA.AÀÀCGGCTFMKTÀ 1_53
5 6 8 CTTACCATTGAAGCGTTCCATTCCTATGTAACAATAATACAAAÀTGAÄGTLTIEÀFHSYVTIIQNEVLTO
6 1 8 AGAGGCATATAT.AÄÄCAATTGCGTTAGCTTTCAGGGTGAGAGTGGCACAGEAYINNCVSFQGESGTVLST
6 6 8 TAAACATCTCAÀÀÀGTTATGGCGGAAATCACTATATATACTGCTTCACATNISKVMAEITTYTASH 203
7 T8 GCCTTACAÀGGAGAÄGÀGGTCCGTGAGAATTTTGACTCATCTTTTGCCGCALQGEEVRENFDSSFAA22O
cR37 68 TCTTTATCATGÀTCTTGATATGGGATTTACACCGATCAACTTTACATTTT
LYHDLDMGFTPINFTFY23T
8 1 8 ACTGGGCACCTCTACCTTGGAÀTCGTGCTCGTGATCATGCCCA.AÀGAACTV{APLPWNRARDHAQRT 253
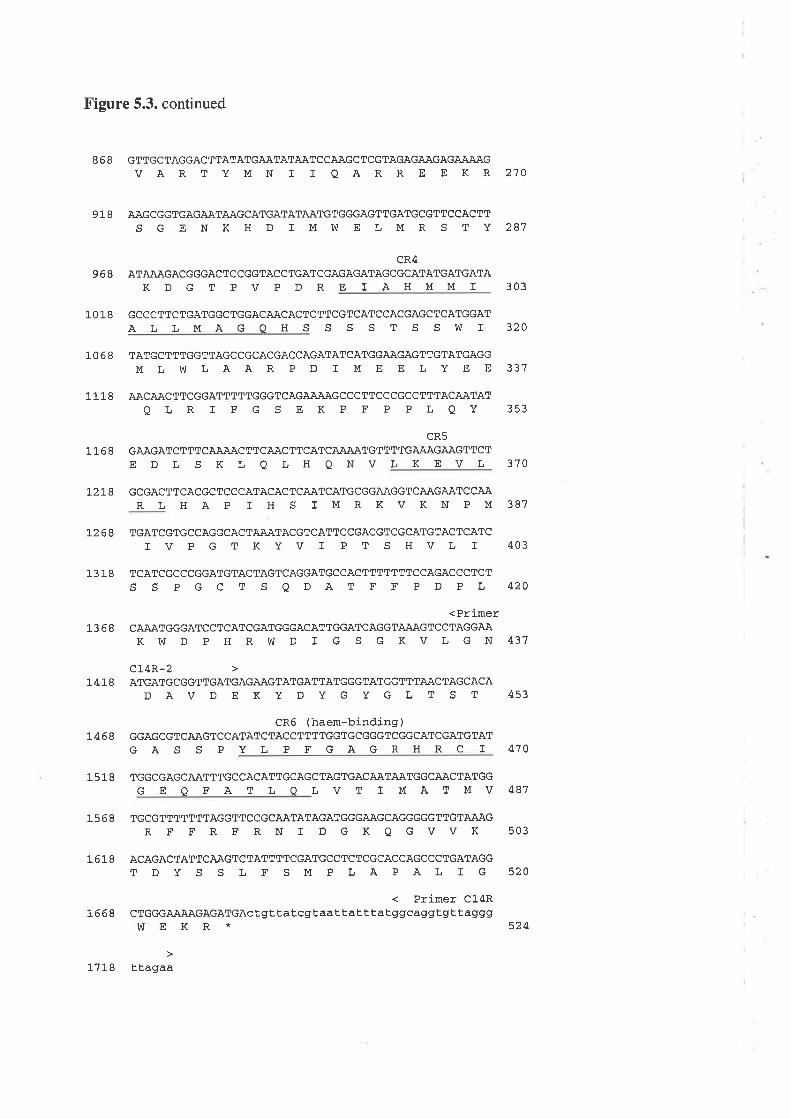
Figure 5.3. continued
8 6 8 GTTGC TAGGAC TTATATGA.ATATAATCCAÀGC TCGTAGAGAAGÀGAAAAG
V A R T Y M N I I Q A R R E E K R 270
9 1- 8 AAGCGGTGAGAATAÀGCATGATATAÀTGÎGGGAGTTGATGCGTTCCACTTSGENKHDTMWELMRSTY2ST
cR49 6 8 ATAÀAGACGGGACTCCGGTÀCCTGATCGAGAGATAGCGCATATGATGATA
KDGTPVPDREIAHMMI3O3
]- O 1- 8 GCCCTTCTGATGGCTGGACAÀCACTCTTCGTCATCCACGAGCTCATGGAT320
1 O 6 8 TATGCTTTGGTTAGCCGCACGACCAGATATCATGGAAGAGTTGTATGAGGMLWLÀÀRPDIMEELYEE33T
ALLMÀGOHSSSSTSSWT
]. 1- 1 8 AACAÀCTTCGGATTTTTGGGTCAGAÀÀAGCCCTTCCCGCCTTTÀC.AÀTÀT
QLRIFGSEKPFPPLQY
cR51 ]. 6 8 GAAGATC TTTCAAAAC TTCAAC TTCATCAA.AATGTTTîGAAAGAÀGTTC T
353
EDLSKLQI,HA NVLKEVI,3TO
t21.8 GCGACTTCACGCTCCCATACÀCTCA.A,TCATGCGGA.AGGTCAÀGAATCCAÀRLHAPIHSIMRKVKNPM3ST
1.2 6B TGATCGTGCCAGGCACTAÂÀTACGTCATTCCGACGTCGCATGTACTCATCIVPGTKYVTPTSHVLI 403
1 3 1 8 TCATCGCCCGGATGTACTAGTCÀGGATGCCACTTTTTTTCCAGACCCTCTSSPGCTSQDATFFPDPL42O
<Primer]- 3 6 8 CÀÄATGGGATCCTCATCGATGGGÀCATTGGATCAGGTÀÂÀGTCCTAGGAA
K W D P H R bI D I G S G K V L G N 437
c14R-2 >
1 4 1- 8 ATGATGCGGTTGATGAGAÀGTATGATTATGGGTATGGTTTÀÀCTAGCÀCADAVDEKYDYGYGLTST 4s3
CR6 (haem-binding)746 8 GGAGCGTCAAGTCCATATCTACCTTTTGGTGCGGGTCGGCATCGATGTAT
GASSPYLPFGAGRHR eï 470
]- 5 ]. 8 TGGCGAGCAÄ,TTTGCCÀCATTGCAGCTAGTGACA.A,T.AATGGCAACTATGGGEQ FATLOLVTIMATMV4ST
1- 5 6 8 TGCGTTTTTTTAGGTTCCGCAATATAGATGGGAAGCAGGGGGTTGT.AAAGRFFRFRNIDGKQGVVK 503
1. 6 1. 8 ACAGACTATlCAAGTCTATTTTCGATGCCTCTCGCÀCCAGCCCTGATAGGT D Y S S I, F SM P LA P AL I G 520
< Primer C14R1-668 cTGGGAAAAGAGATGACtgttatcgtaattatttatggcaggtgtt.aggg
WEKR*
1-71,8 ttagaa
524
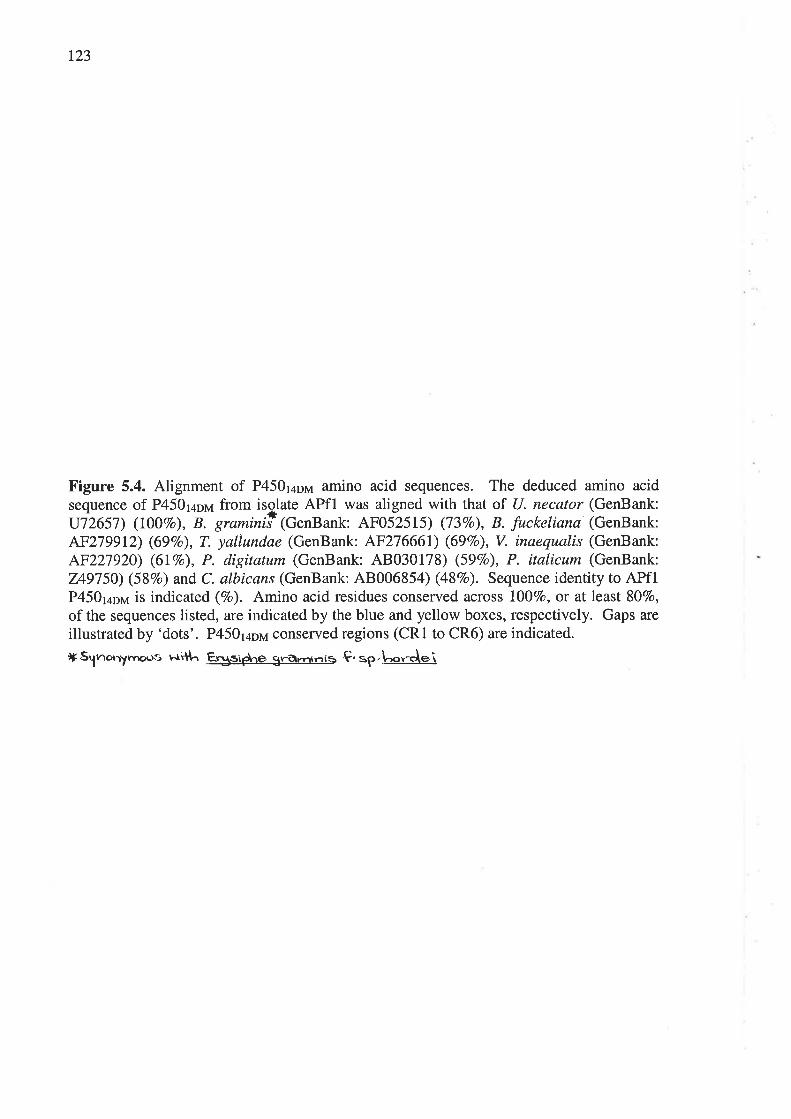
r23
Figure 5.4. Alignment of P45Or¿orvr amino acid sequences. The deduced amino acidsequence of P450r¿¡¡a from isg.late APfl was aligned with that of U. necalor (GenBank:
U72657) (L00Vo), B. gramini.i (GenBank 4F0525I5) (737o), B. fuckeliarcø (GenBank:
AF279912) (697o), T. yallundae (GenBank: AF27666I) (69%o), V. inaequalis (GenBank:
^F227920) (617o), P. digitaturu (GenBank: 4B030178) (59Vo), P. italicutn (GenBank:
7A9750) (58Vo) and C. albicans (GenBank: 48006854) (48Eo). Sequence identity to APflP450r¿trr¿ is indicated (7o). Amino acid residues conserved across I007o, or at least 807o,
of the sequences listed, are indicated by the blue and yellow boxes, respectively. Gaps are
illustrated by 'dots'. P450r¿orr¡ conserved regions (CRl to CR6) are indicated.
|l Sq!,lonyrnoúS v-ri'H^ Ê¡:rrsiáne <rt-Oltilrris Ç, so, [-or-.Ie ì
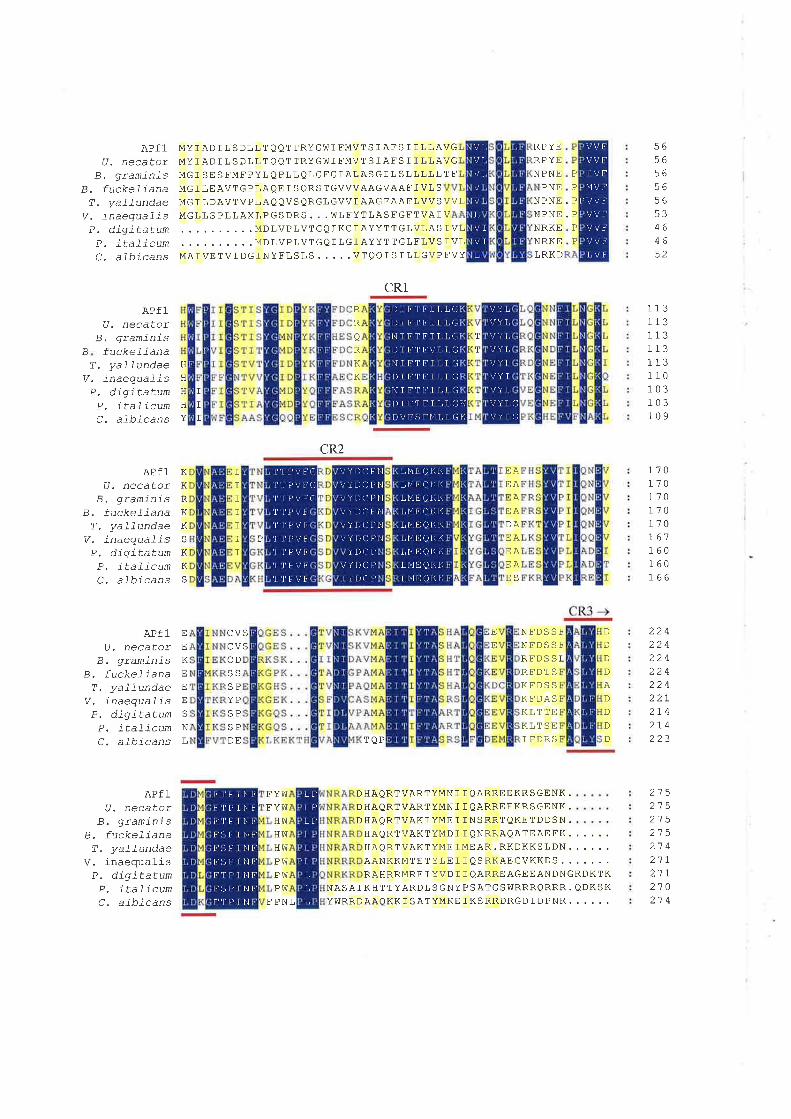
^Pf1U. necatorB. gramlnis
B, fuckelianaT. yaTlundae
V, inaequaJisP, digitatumP, itaficumC. aLbicans
MYIADILSDLLTQQTTRYGWI EMVTS IAFS I IILAMYI ADI L SDLLTQQTTRYGWI FMVTS IAFS I I LLAMG I SE SFMFPYLQPLLQLGFGIALASGI L SLLLLLMG I LEAVTGPLAQE I S QRS TGVVVAAGVAAF ] VL S
MGI LDAVTVPLAQQVS QRGLGVVI AAGFAAFLVVSMGLLSPLLAXLPGSDRS . . . h]TFYTLASFGFTVAI
CRI
NPNE .
NPNE.NRKENRKE],RKD
PNE
NFDSSFNFDSSFRFDS SL
RP YERP YENPNE
RFDT S
KFDSSKFDASKLTTEKLTSE] FDRS
VGVG
TF
565656565653464652
1131131l_3113113110103r03109
170170170170170l6l160160r66
22422422422422422r274214223
P
P
P
P
P
P
VVL
. . . . MDLVPLVTGQIKCIAYYTTGLVLASIVL
. . . . MDLVPLVTGQILGIAYYTTG],FLVSIVLMAIVETVIDGINYFLSLS. . . . .VTQQISILLGVPEVY
B
APflU, necator
B, qraminisfuckeliana
T. yallundae H
V. inaequalis H
P. diqitatun H
P, itaficum H
C, afbicans Y
APfl K
U. necator R
B. graniûis R
B, fuckeliana K
T, yallundae R
V. inaequaTis S
P, diqitatum R
P. itaficum K
C. afbicans S
APfl E
U. necator E
B, g:raminis K
B. fuckeliana E
T. yaffundae E
V. inaequalis E
P. digitatun S
P. i tal.icum N
C. afbicans L
APflU. necator
B. graminisB, fuckel-iana
T. yalTundaeV. inaequaJ-is
P. digitatumP. italicunC - afbicans
R
R
oR
KK
T
T
III
CR2
IIIIIII
EAEA
AEADA
P EAEAEAES
CVSCVS
E
E
D
D
D
D
AD
D
D
D
CD
SSSPYPSP
SPDE
FYVÙ
F YVÙ
HW
HW
HW
PW
PW
PVù
2152152152152'7 4
2tL27L210214
TQP
DHAQRTVARTYMNI ] QARREEKRSGENK .
D HAQRTVARTYMNI I QARREEKRSGENK .
D IIAQRTVAK ] YME I I NSRRTQKE TDDSN .
HAQRTVAKTYMDI I QNRRAQATEAE FKHAQRTVAKTYME IMEAR . RKDKKSLDNAÀNKKMTE TYLE I I OS RKAEGVKKDSRAHRRMRE I YVD I ] QARREAGEEANDNGRDKTK
NASAI KHTTYARDISGNYPSATGSWRRRQRRR. QDKSKYÍÙRRDAAOKKlSATYMKEIKSRRDRGDIDPNR. . . . . .
VT,
L
L
I_t
T
.f
VVFVVFTVFNTV I'VV!VVÉ'
VVI
VV!'tv!
DIT.''1þ'ILLCf)TlìTFTT t,(.;
I{TTT]iTT,I,(,]I) ITTFVI,T,(ìNIIITTII,I(JDTFTFTI ],(;hl TFTF'IT,T,(.]DTITFTT,T,GT(DVF:JF14I,I GI<
VY L
r./ i' T,
\!¡:/ I
\/Y T
\,/.¡ Ì, (-l
v" r, (ì
,1"IPV!
'I"t t-,v !''t' l'P v þ'
't 1 PVþ'1"I P'V !1"l', t'V !'
VYDC]PII\iID(lt)NVYDC]T)I\I
/\:l)(lP¡lVYI)(]PIJVYL)(]PI\I
LtviþioLir.trvtþiQLitiL IVI EJ O Li I,i
Ll'lþt Q rit(L lvl Li o l.i r.
rrqE Q r,KLTVIUQI(Ii
LJV]EJQIiIi
L!lLtoLit(
r" L) Cl t)
'f't P V t'ci'1 tt-'vþ(i'1"t t,v !'ci
vfDatt)Iït)CP
þ'1 t,l l.tt',r ,l t'l t\l t
t"l t-' L Nt !t' :', LJ L ,\t t,
[':.]P I ¡t!TÍJf'TNF'IìTPI NFlì:iPI I'JF
FTP I I{
f,
Lt)LI't,t)
t,
t,
Il,L
f,FPNL
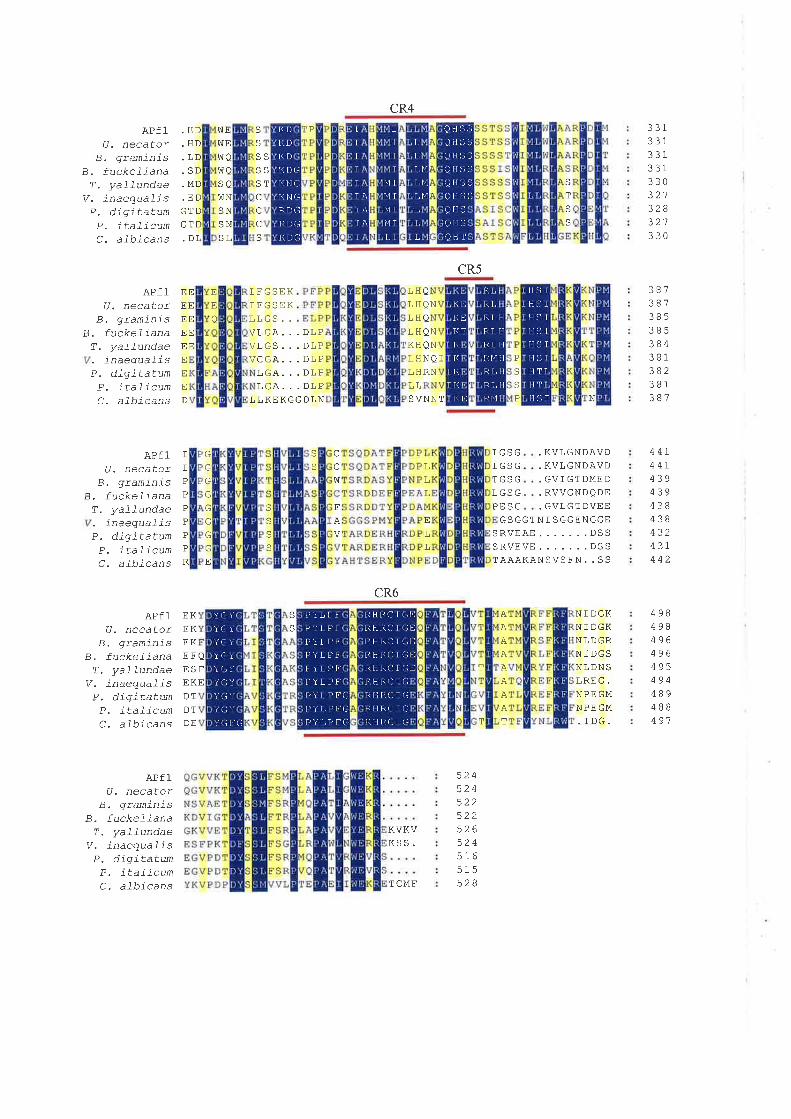
CR4
.HD WE S
.HD f{E S
.LD WO S
.SD WO S
.MD SO S
.ED üÙN C
GTD SN C
GTD SN C
.DL SL S
IGIGPGPGPGPGPGPGRE
B
APflU. necator
B. graminisB. fuckefiana
T. yallundaeV, inaequalisP. digitatunP. italicunC. afbicans
B
APf IU. necatoÍ
B. graninis, fuckeLianaT. yaTTundae. inaequalisP. digitatunP, itaficunC. afbicans
APflU. necator
B, graminis. fuckefianaT. yallundae. inaequalisP. digitatunP. itaficunC. afbicans
APflU. necator
B. graminisB, fuckel-iana
T. yaTTundaeV, inaequaTisP. diqitatumP. itaficunC. afbicans
VLGA. . . DLPVLGS. . . DLPVCGA. . . DLP
LGA. . . DLPLGA. . . DIP
LLKEKGGDLN
331331331331330321328J¿ I
330
EE
EEEE
EEEE
I FGSEKI FGSEKLLGS. .
LHLHLHLHKHrt{LHLI
3873873853853843813823Br.387
P
S
S
T J
T
S
cR5
E
E
o
O
0NO
QN
ONNOIRN
SVNNT
Pê
S
P
E
E
E
D
S
S
C
C
t/ù
FA
CR6
N
. KVLGNDAVD
. KVLGNDAVD
.GVIGTDMED
. RVVGNDQDE
. GVLGTDVEEGSGGTNI SGGENGGE
SRVEAE.......DSSSRVEVE.......DSSTAAAKANSVSEN. . SS
I GSGTGSGLGSGPESG
44L44r439439438438A1a
4 31-
442
S
ò
S
S
LLL
E
LL
APflU, necator
B. graminisB. fuckefiana
T. yallundaeV. inaequalisP. digitatunP, itaficumC. afbicans
EKEKEKEFQ[>rEKEDTDTDE
S
S
T
AAAAAA
AAT
NI DGKNT DGKNL DGRNI DGS
NLDNSLREG,NPE GM
NPE GM
.IDG.
4984984964964954944894BB491
T
KVKVKSS.
TCMF
524524522522526524516515528
KDCì
Kt{rìTiN(ìRT)(ìR D(-ì
r(Dci
t( t)
KL)
Kf)
ItT
T
T
T
it
I
Þ1
t"l
t'l
M
t,
1
1
f
T
I
I
T
I
L
T,
ï,
T,
T,
I
L
Q H:] ';QHS:l
9HSSgIlf]ijgrrtSIil3:j
A
t4
t'{
M
oftflOIIÍJ
QH I'
RLt.itLìL
RT,
RI,Rt"r
RT,
Rf,Rt4
H
I'I
I]
II
IT
ft
HiilH:i IHU, 1
IT:J T
I'I iJ T
ilÍiT
T( lÌ ft:lT
ITTT
ITT
T
T
K!;l( Ei
KFï(IiT(
T(
YGF(i
YCi Y
YC; r-
Y( j'rYCJ IYri Y
Y'i Y
'/ (.i 'i'/ G'/
P Y L I'T.'
PYLI'!'t,Y L l' þ'
PILI'T.PYLI-',tPYL!'!'
LìHLìC-1(]E]
lillLìC (iultHlior.(ìþitìHtìc1cþiLrHtìc1(iLi
PY I r-F(,ì
I"t t, f'F G
f'tt,r,r(,;
liHtìcr liRIIR(]T(ìRIIRr:l T (l
RTTR(JT(;
124
5.3.2 PCR amplifïcation of a specific allele associated with DMI resistance
Following optimisation of PCR conditions, primers MUT1 and U14DM Qélye et
aI., I997d) were successfully used for PCR amplification of a 476 bp fragment using
template DNA extracted from the conidia of 30 U. necator isolates displaying resistance
factor (RF) values greater than 6 (Figure 5.5). Délye et aI. (1997d) reported using
approximately 10 ng of template DNA in the PCR mix, however, in our laboratory
amplification of the DNA fragment was obtained only when 50 to 60 ng template DNA
was used. No amplification was observed in isolates with RF values less than 6. No
amplification was obtained when DNA extracted from U. necator-infected grapevine tissue
was used as template DNA in the PCR.
Since primers MUT1 and U14DM were apparently not functioning with small
amounts of template DNA, their attributes for amplifying a DNA fragment were analysed
using OLIGOTM Version 4.0s. Analysis revealed that MUT1 had two potential false
priming sites in the positive strand of the CYP51 sequence and was likely to form a hairpin
loop at the annealing temperature of 50oC. U14DM was also likely to form a hairpin loop
at 35oC, most likely causing a reduction in the efficiency of the PCR. In addition, MUT1
had a Tm of 31'C while U14DM had a Tm of 54oC. The new primer, MU3R, was
designed to have greater affinity for the target sequence while primer MU4 was designed to
have the same Tm (48"C) as MU3R. Both primers were designed such that hairpin loop
formation was unlikely.
PCR conditions for amplifying the A-to-T mutation using MU4 and MU3R were
optimised by varying the primer, magnesium and DNA template concentrations, the
number of amplification cycles, the concentration of formamide and annealing temperature.
At primer concentrations of 0.1 to 1 pM, amplification was not specific to the mutant T
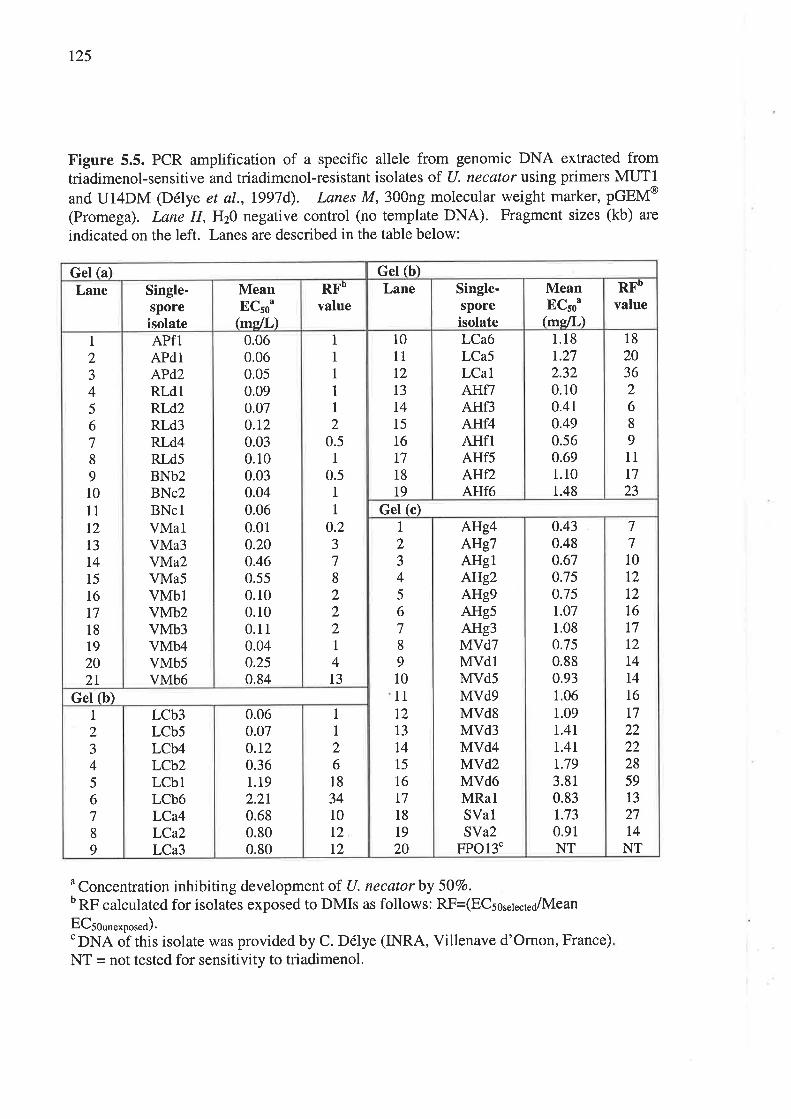
125
Figure 5.5. PCR amplification of a specific allele from genomic DNA extracted fromtriadimenol-sensitive and triadimenol-resistant isolates of U. necalor using primers MUT1
and U14DM (Délye et al., lggTd). Lanes M,300ng molecular weight marker, pGEM@
(Promega). Lane H, H20 negative control (no template DNA). Fragment sizes (kb) are
indicated on the left. Lanes are described in the table below:
nConcentration inhibiting development of U. necatorby 507o.b RF calculated for isolates exposed to DMIs as follows: RF=(ECsor"¡..1.¿/lvlean
EC5ooor*por"¿).
'DNA of this isolate was provided by C. Délye (INRA, Villenave d'Omon, France)NT = not tested for sensitivity to triadimenol.
Gel (a) Gel ft)Lane Single-
sporeisolate
MeanECtou
(ms,lL\
RFbvalue
Lane Single-sporeisolate
MeanECso"
(ms/L)
RFbvalue
1
2J45
67I910
11
t2I3T4
15
I6t718
19
202t
APflAPdlAPd2RLdlRLd2RLd3RLd4RLd5BNb2BNc2BNclVMalVMa3YM.a2VMa5VMblVMb2VMb3VMMVMb5VMb6
0.060.060.050.090.o70.t20.030.100.030.040.060.010.200.460.550.100.100.110.040.250.84
1
I1
I1
20.5
1
0.51
1
0.23
78
2221
413
10
11
12
l3I415
16
I718
19
LCa6LCa5LCalAHf/AHf3AHf4AHflAHf5A}lf2AHf6
1.18r.272.320.100.410.490.560.691.101.48
18
2036268
911
17
23
Gel (c)
1
2J45
678
910
11
L2
13
I415
L6
17
18
19
20
AHg4A}l9TAHglAÍlg2AHg9AHg5AHg3MVdTMVdlMVd5MVd9MVd8MVd3MVd4MVd2MVd6MRalSValSVa2
FPOl3'
0.430.480.670.750.75r.071.080.750.880.931.06
1.09L,4II.4Tr.793.810.83r.730.91NT
7710t2l2t617
12
L4
I4t6L7
2222285913
27t4NT
Gel ft)1
2J45
678
9
LCb3LCb5LCb4LCb2LCbILCb6LCa4LCa2LCa3
0.060.070.r20.361.192.2r0.680.800.80
1
I26l83410t2L2
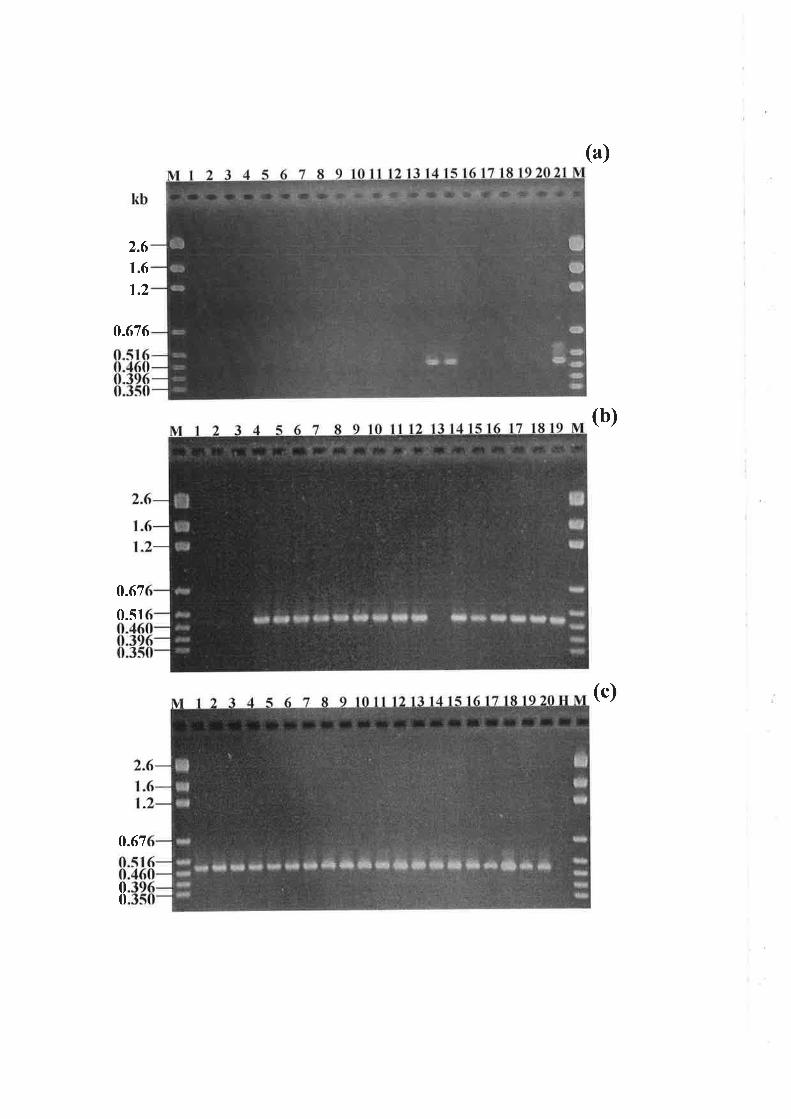
2.6
1.6
1.2
0.676
o-67
0.51
0.67
00
(a)
(b)
(c)
126
allele because the normal A allele also amplified to give a DNA fragment of the
appropriate size. However, at lower primer concentrations of 0.06 to 0.08 pM, the PASA
reaction was specific, that is, the mutant T allele, but not the wild-type A allele, was
amplified to generate a DNA fragment of the appropriate size. Similarly, at magnesium
chloride concentrations of greater than 1.5 mM the reaction was not specific to the mutant
allele. MU4 and MU3R specifically amplified the mutant T allele and not the normal A
allele when both primer concentrations were 0.06pM and the magnesium concentration
was 1.5 mM. However, if concentrations of DNA greater than 5 ng/pl were used, complete
specificity was not achieved, in that, a DNA fragment was also amplified in sensitive
isolates. Annealing temperatures between 45 and 50"C were also found to reduce the
specificity of the primers. An annealing temperature of 51"C was found to be adequate for
the amplification of the mutant T allele in resistant isolates and not in sensitive isolates.
Reducing the number of amplification cycles from 37 to 35 or 30 and the addition of 2Vo
and 5Vo formamide affected sensitivity of the reaction such that amplification of CYP51
was not obtained using template DNA from either sensitive or resistant isolates.
Using the optimised PCR conditions described in Section 5.2.5J, amplification of a
fragment of CYP51 was also tested using MU4 and MU3R and template DNA extracted
from U. necator-infected grapevine tissue. Four methods were evaluated for their efficacy
in extracting DNA from U. necator-infected grapevine tissue suitable for use in PCR.
DNA extracted using the method of Doyle and Doyle (1980) proved to be unsuitable unless
purified using the Genecl"un@ Spin Kit (BIO/101), after which DNA amplification was
possible with most samples. The GeneReleaser'" method was also successfully used to
amplify the CYP51 DNA fragment from infected grapevine tissue, however, only in those
samples with abundant U. necator conidia and mycelium. In addition, amplification
r27
product yields using this method were always lower yields when using DNA isolated from
conidia. The most successful method of extracting DNA from U. necator-infected
grapevine tissue involved the DNEasy'" Plant Mini Kit (Qiagen) (Figure 5.6).
Unfortunately, results were not reproducible when the same amount of total DNA was used
from different DNEasy sample preparations, probably because of the variation in the
amount of U. necatorDNA in each sample. Quantifying the amount of U. necator DNA in
each DNEasy extract was not possible without prior analysis of each total DNA sample by
Southern hybridisation or gel electrophoresis.
In order to avoid the problem of variable, and unknown amounts of U. necator
DNA in the DNA template samples, a method of nested PASA was developed. In the first-
round PCR, primers U14DM and C14R-2 were used to amplify a L432 bp DNA fragment
from template DNA from both sensitive and resistant isolates of U. necaror (Figure 5.7).
The amount of DNA amplified in the first-round was quantified after gel electrophoresis
using visual comparison with the SPPl/EcoRI molecular weight marker (GeneWorks,
South Australia). Approximately I25 to 1400 ng of DNA product was amplified from
initial infected grapevine DNA samples of 5 to 10 ng, respectively. No amplification was
observed with DNA extracted from powdery mildew-free grapevine tissue and from other
fungi associated with grapevines such as; Cladosporium sp., P. viticola, Alternaria sp., S.
cerevisiae, B. cinerea and A. niger.
In the second-round PCR, primers MU4 and MU3R were used to specifically
amplify a 409 bp DNA fragment only from those templates containing the mutant T allele.
In order to maximise the specificity of the second-round PCR, various amounts of PCR
product from the first-round amplification from sensitive (APd2) and resistant (LCb6)
isolates (Figure 5.8) and two different Taq DNA polymerases were tested; Iøq DNA
polymerase (Promega) and HotStar Taq DNA polymerase (Qiagen). 'When first-round
128
Figure 5.6. Agarose gel electrophoresis of total DNA from U. necator-infected grapevinetissue extracted using the DNEasy Plant DNA Extraction Kit (Qiagen). Lane M,300nglambda DNA digested with HindlIli Lanes I to 5, DNA extracted from U. necator-infectedmicropropagated tissue; Lanes 6 to 10, DNA extracted from U. necator-infected fieldmatenali Lane 1/, DNA extracted from healthy micropropagated grapevine tissue.Fragment sizes (kb) are indicated on the left.
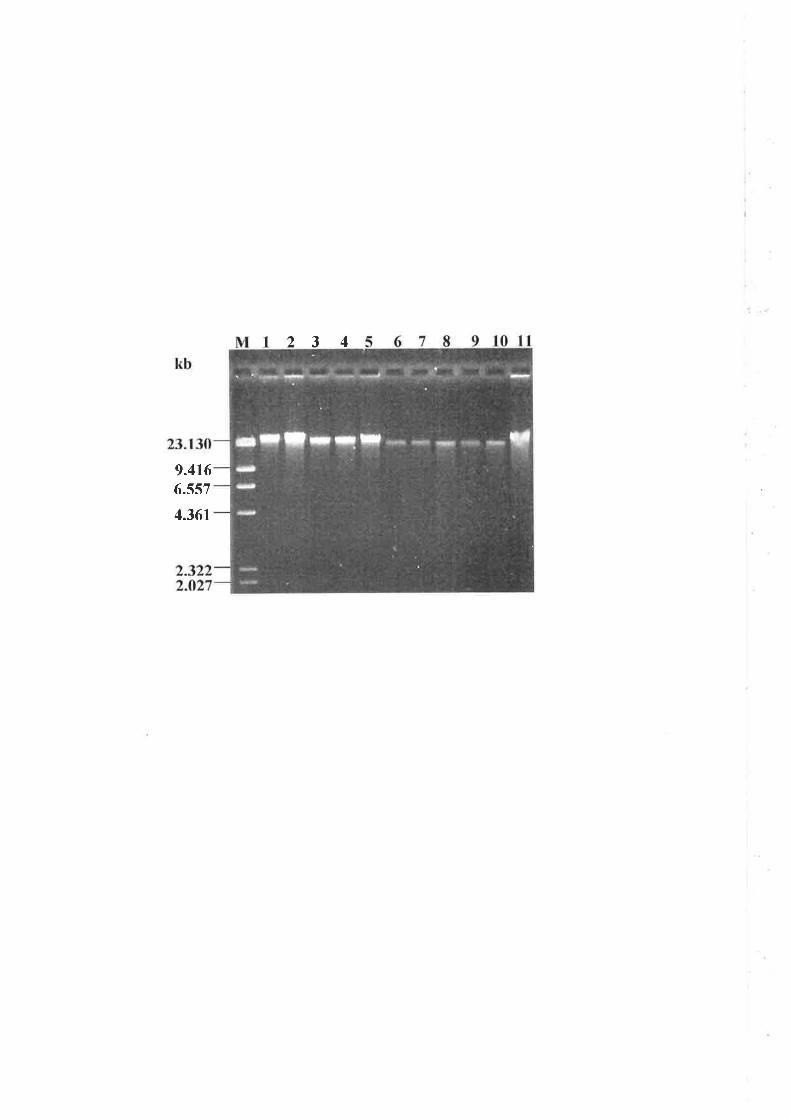
t 2 3 4
9.4166.557
4.361
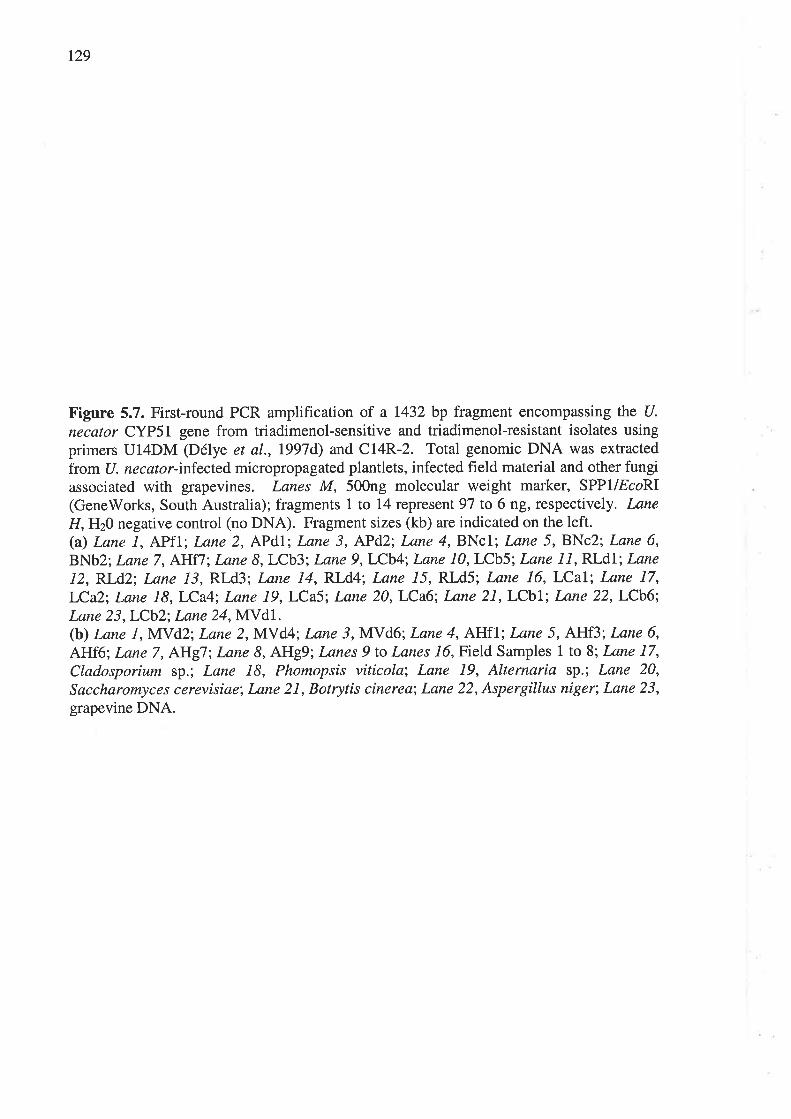
r29
Figure 5.7. First-round PCR amplification of a L432 bp fragment encompassing the U.
necator CYP51 gene from triadimenol-sensitive and triadimenol-resistant isolates usingprimers U14DM (Délye et al., I997d) and C14R-2. Total genomic DNA was extractedfrom U. necator-infected micropropagated plantlets, infected field material and other fungiassociated with grapevines. Lanes M, 500ng molecular weight marker, SPPl/EcoRI(GeneWorks, South Australia); fragments 1 to 14 represent 97 to 6 ng, respectively. LaneH,Hz} negative control (no DNA). Fragment sizes (kb) are indicated on the left.(a) Lane 1, APfl; Lane 2, APdl; Lane 3, ÃPd2; Lane 4, BNcl; Lane 5, BNc2; Lane 6,
BNb2; Lane 7,AHf7; Lane 8, LCb3; Lane 9, LCb4; Lane 10, LCb5; Lane I 1, RI-ùI; Lane
12,Rl-d2; Lane 13, RLd3; Lane 14, RLd4; Lane 15, RLd5; Lane 16, LCal; Lane 17,
LCa2; Lane 18,LCa4; Lane 19, LCa5; Lane 20,LCa6; Lane 21, LCbl; Lane 22, LCb6;Lane 23,LCb2; Lane 24, MVdl.(b) Lane 1,MYIZ; Lane 2, MVd4; Lane 3, MVd6; Lane 4, AHfl; Lane 5, AHf3; lnne 6,
AHf6; Lane 7, AHgT; Lane 8, AHg9; Lanes 9 to Lanes l6,Field Samples 1 to 8; Lane 17,
Cladosporium sp.; Lane 18, Phomopsis viticola; Lane 19, Alternaria sp.; Lane 20,
Saccharomyces cerevisiae; Lane 21, Botrytis cinerea; Lane 22, Aspergillus niger; Lane 23,grapevine DNA.
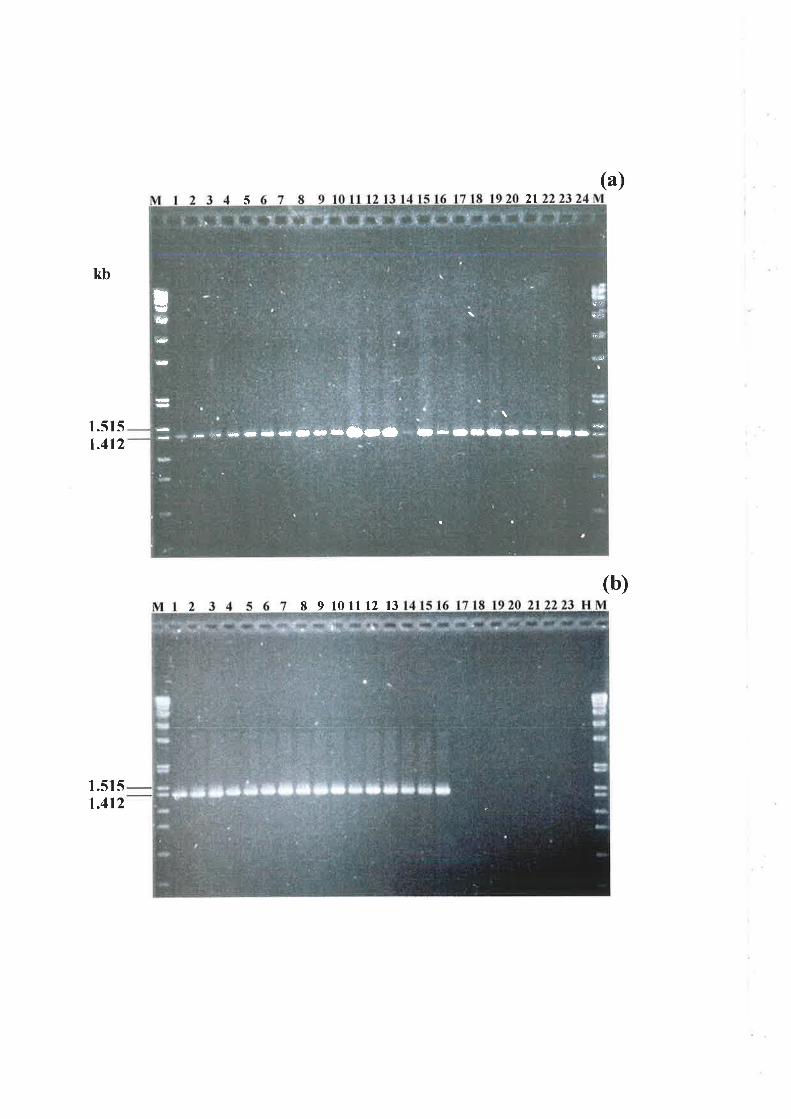
5
kb
2l(a)
(b)
1.5151.412
1.5151.412
8 9 10lll2 13
, a- - r-r-rÕari¡'¡ ¡--r{Dt¡-¡e lI
tUÕ'-
-
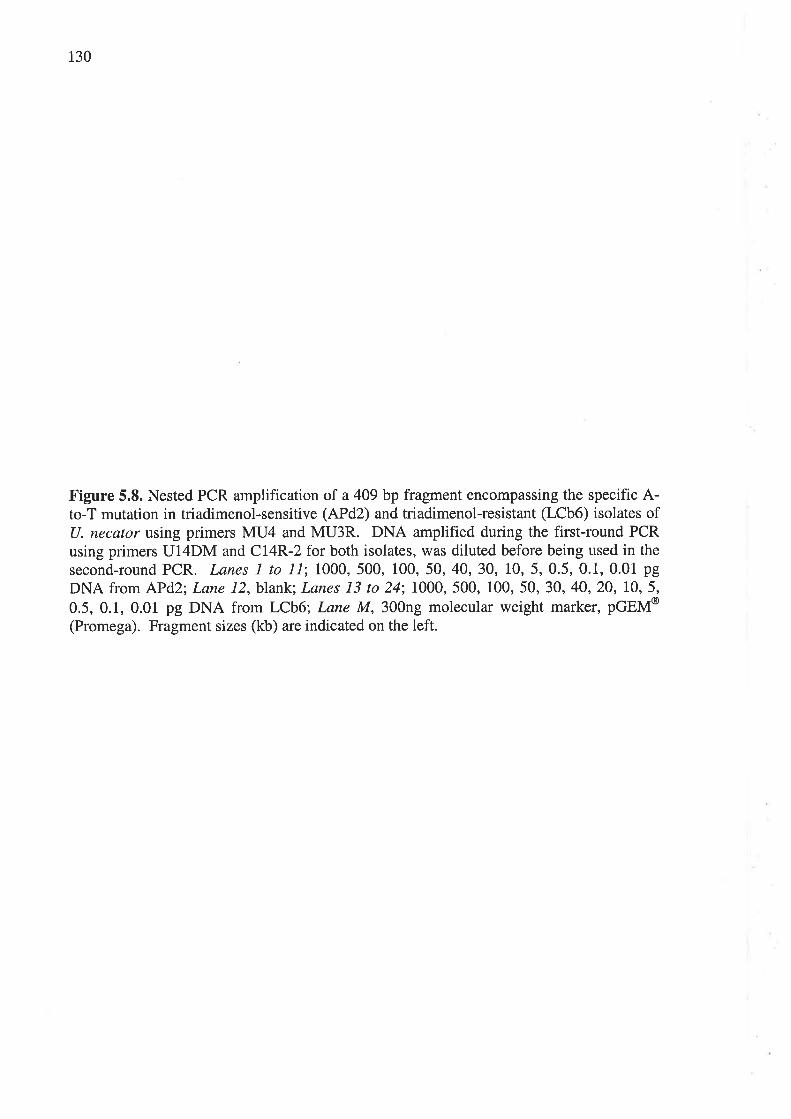
130
Figure 5.8. Nested PCR amplification of a 409 bp fragment encompassing the specific A-to-T mutation in triadimenol-sensitive (APd2) and triadimenol-resistant (LCb6) isolates ofU. necator using primers MU4 and MU3R. DNA amplified during the first-round PCRusing primers U14DM and C14R-2 for both isolates, was diluted before being used in the
second-round PCR. Lanes I to ll;1000, 500, 100, 50,40,30, 10, 5,0.5,0.1,0.01 pg
DNA from APd2; Lane 12,blank; Lanes 13 to 24;1000, 500, 100, 50, 30, 40,20,10, 5,
0.5,0.1,0.01 pg DNA from LCb6; Lane M,300ng molecular weight marker, pGEM@(Promega). Fragment sizes (kb) are indicated on the left.
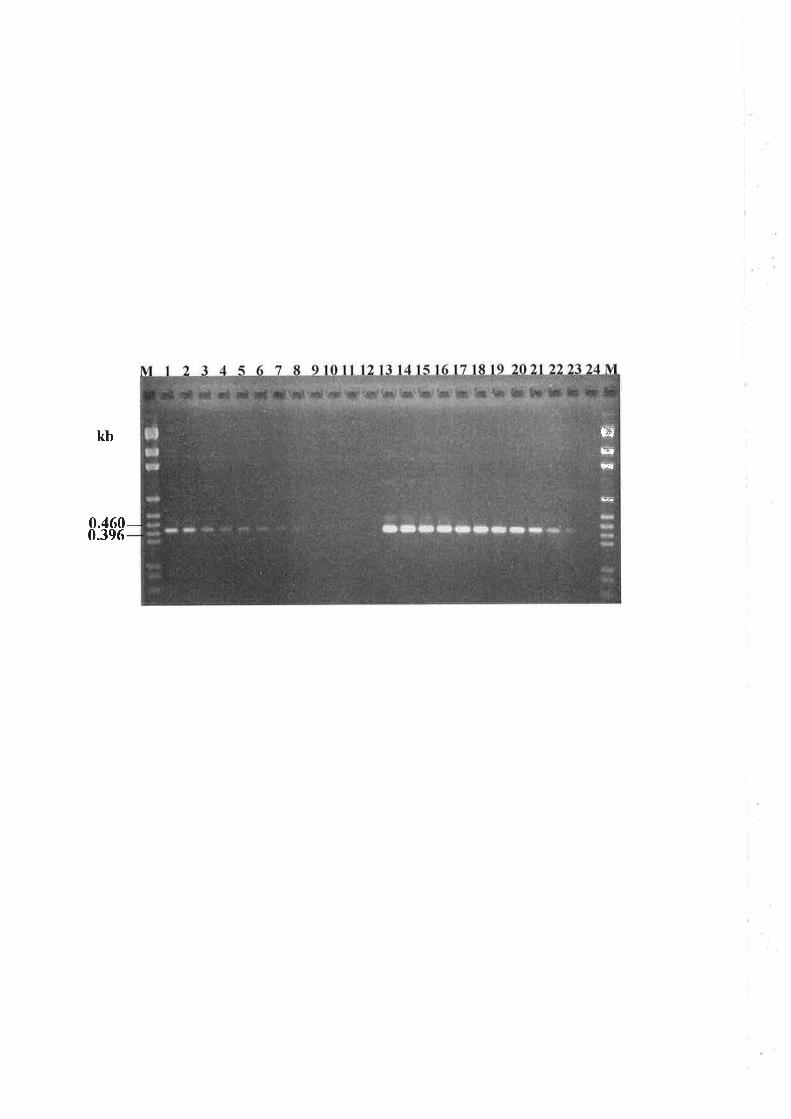
kb
0.4600.396
ËÉ¡
H*r
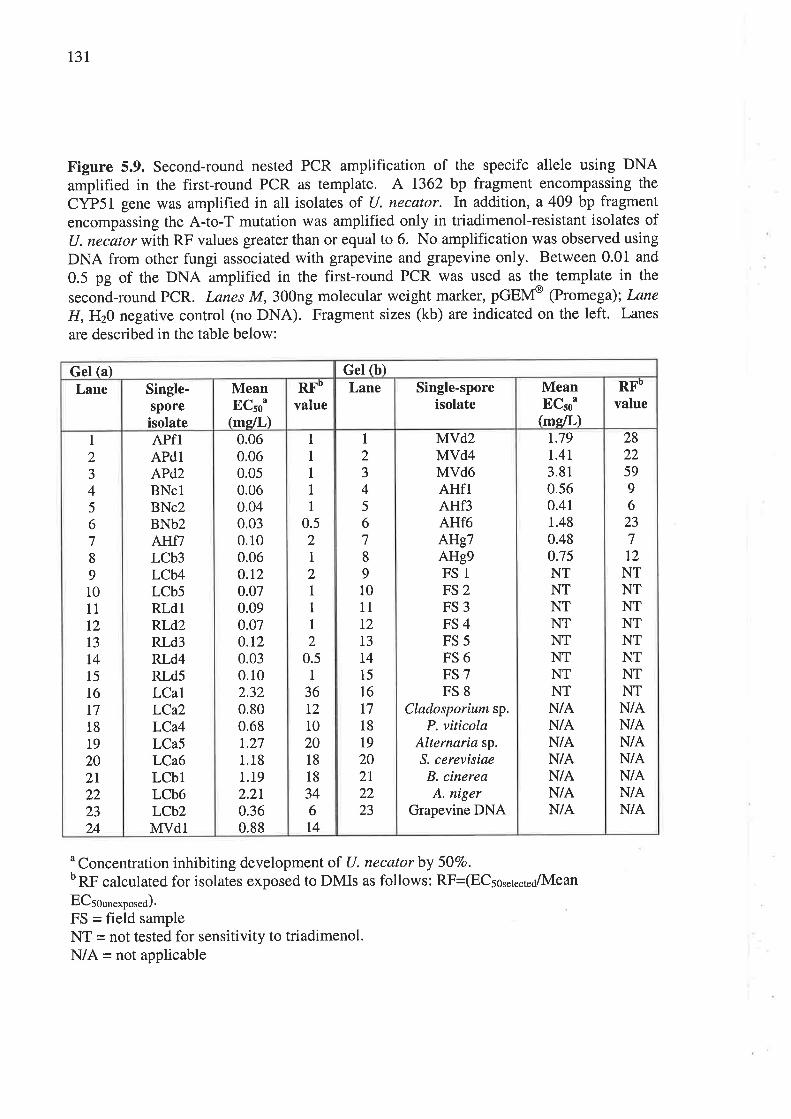
131
Figure 5.9. Second-round nested PCR amplification of the specifc allele using DNAamplified in the first-round PCR as template. A 1362 bp fragment encompassing the
CYP51 gene was amplified in all isolates of U. necator. In addition, a 409 bp fragment
encompassing the A-to-T mutation was amplified only in triadimenol-resistant isolates of(J. necator with RF values greater than or equal to 6. No amplification was observed using
DNA from other fungi associated with grapevine and grapevine only. Between 0.01 and
0.5 pg of the DNA amplified in the first-round PCR was used as the template in the
second-round PCR. Lanes M,300ng molecular weight marker, pGEM@ (Ptomega); Lane
H,IFr20 negative control (no DNA). Fragment sizes (kb) are indicated on the left. Lanes
are described in the table below:
u Concentration inhibiting development of U. necatorby 50Vo.b RF calculated for isolates exposed to DMIs as follows: RF-(ECsor"1..¡r¿/lvlean
ECsooo.*po..¿)'
FS = field sampleNT = not tested for sensitivity to triadimenol.N/A = not applicable
Gel (a) Gel ft)Lane Single-
sporeisolate
MeanECto"
(ms,lLl
RFO
valueLane Single-spore
isolateMeanECsou
(msIL)
RFO
value
1
2J45
678
910
11
1213
t415
I6I718
L9
202l222324
APfIAPdlAPd2BNclBNc2BNb2AHf/LCb3LCb4LCb5RLdlRLd2RLd3RLd4RLd5LCaILCa2LCa4LCa5LCa6LCblLCb6LCbzMVdl
0.060.060.050.060.040.030.100.06o.r20.070.090.07o.r20.030.102.320.800.68t.271.181.192.2t0.360.88
1
1
1
1
I0.52I21
1
1
20.5
1
36t2102018
18
346t4
1
2J45
678
91011
12
I3T4
15
I6T7
18
t9202I2223
MVd2MVd4MVd6AHflAHf3AHf6AÍlg7AHg9FS1FS2FS3FS4FS5FS6FS7FS8
Cladosporium sp.P. viticola
Alternaria sp.S. cerevisiaeB. cinereaA. niger
Grapevine DNA
1.79r.4l3.810.560.411.480.480.75NTNTNTNTNTNTNTNTN/AN/AN/AN/AN/AN/AN/A
28225996
23712
NTNTNTNTNTNTNTNTN/AN/AN/AN/AN/AN/AN/A
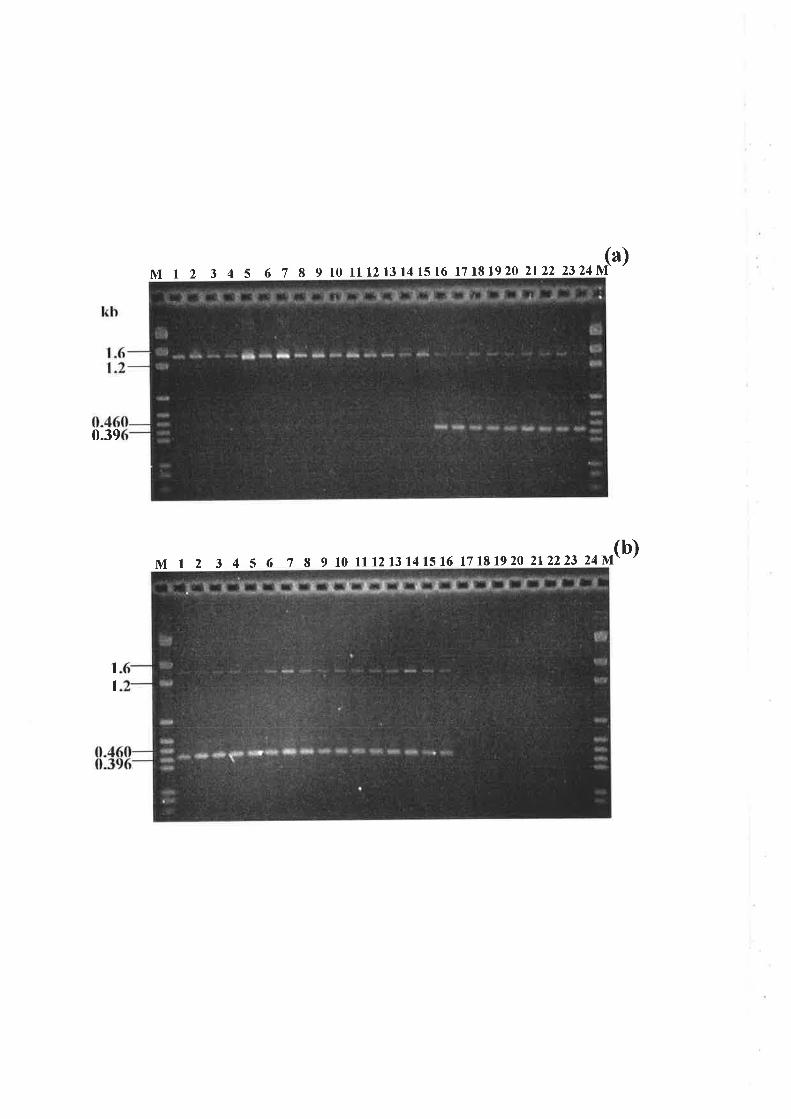
0.39
M1234567
M1234567
8 9 l0 11 121314 rs 16 171819 20 2122 "rOn[u)
s 9 10 11121314 15 16 l7 ls lg 20 2122r, ,o *(b)
1
I
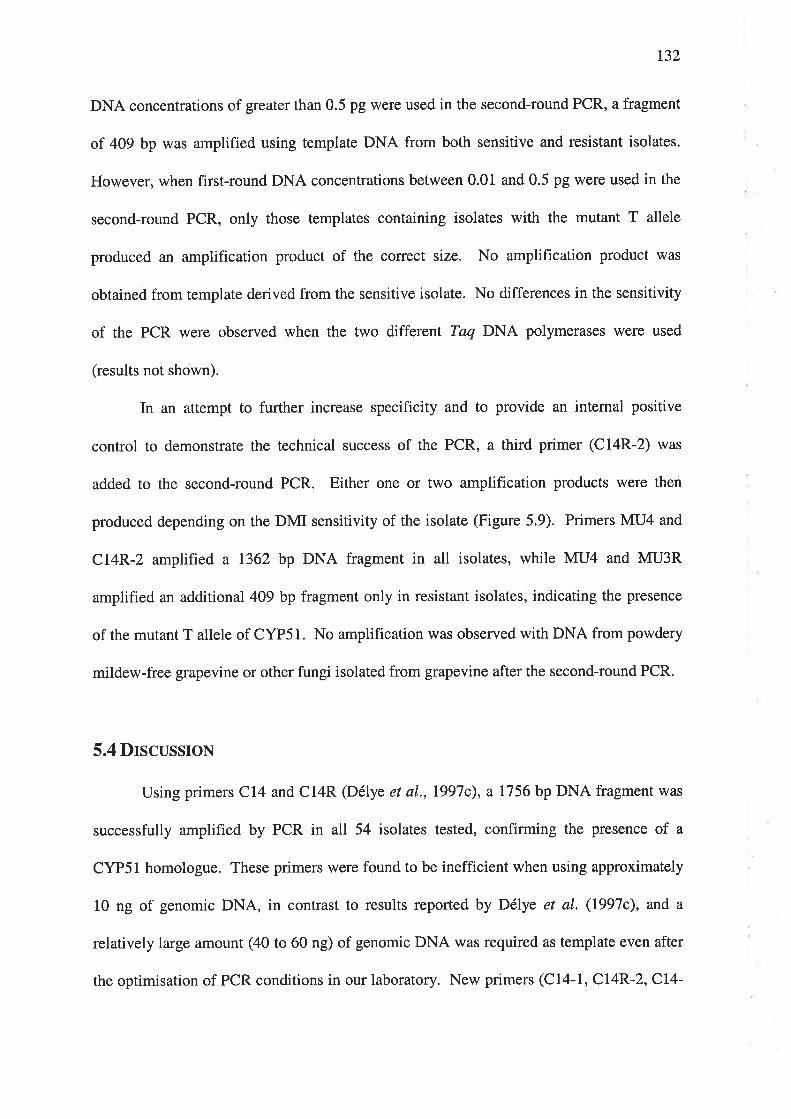
r32
DNA concentrations of greater than 0.5 pg were used in the second-round PCR, a fragment
of 409 bp was amplified using template DNA from both sensitive and resistant isolates.
However, when first-round DNA concentrations between 0.01 and 0.5 pg were used in the
second-round PCR, only those templates containing isolates with the mutant T allele
produced an amplification product of the correct size. No amplification product was
obtained from template derived from the sensitive isolate. No differences in the sensitivity
of the PCR were observed when the two different 7'aq DNA polymerases were used
(results not shown).
In an attempt to further increase specificity and to provide an intemal positive
control to demonstrate the technical success of the PCR, a third primer (C14R-2) was
added to the second-round PCR. Either one or two amplification products were then
produced depending on the DMI sensitivity of the isolate (Figure 5.9). Primers MU4 and
CI4R-2 amplified a 1362 bp DNA fragment in all isolates, while MU4 and MU3R
amplified an additional 409 bp fragment only in resistant isolates, indicating the presence
of the mutant T allele of CYP51. No amplification was observed with DNA from powdery
mildew-free grapevine or other fungi isolated from grapevine after the second-round PCR.
5.4 DrscussroN
Using primers Cl4 and C14R @élye et al., 1997c), a 1756 bp DNA fragment was
successfully amplified by PCR in all 54 isolates tested, confirming the presence of a
CYP51 homologue. These primers were found to be inefficient when using approximately
10 ng of genomic DNA, in contrast to results reported by Délye et al. (1997c), and a
relatively large amount (40 to 60 ng) of genomic DNA was required as template even after
the optimisation of PCR conditions in our laboratory. New primers (C14-1, CI4R-2, CL4-
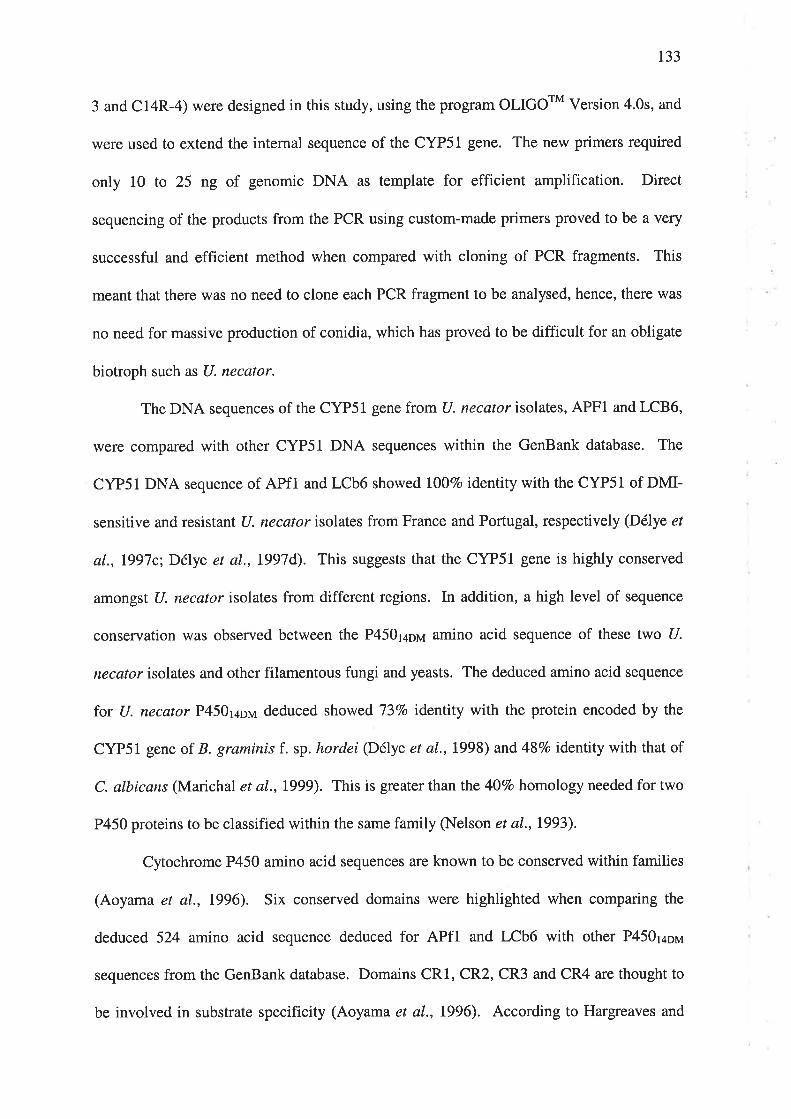
t33
3 and C14R-4) were designed in this study, using the program OLIGOTM Version 4.0s, and
were used to extend the internal sequence of the CYP51 gene. The new primers required
only 10 to 25 ng of genomic DNA as template for efficient amplification. Direct
sequencing of the products from the PCR using custom-made primers proved to be a very
successful and efficient method when compared with cloning of PCR fragments. This
meant that there was no need to clone each PCR fragment to be analysed, hence, there was
no need for massive production of conidia, which has proved to be difficult for an obligate
biotroph such as U. necator.
The DNA sequences of the CYP51 gene from U. necator isolates, APF1 and LCB6,
were compared with other CYP51 DNA sequences within the GenBank database. The
CYP51 DNA sequence of APfl and LCb6 showed I00Vo identity with the CYP51 of DMI-
sensitive and resistant U. necalor isolates from France and Portugal, respectively (Délye et
aL, I997c; Délye et aL, I997d). This suggests that the CYP51 gene is highly conserved
amongst (J. necator isolates from different regions. In addition, a high level of sequence
conservation was observed between the P4501ap¡a amino acid sequence of these two U.
necator isolates and other filamentous fungi and yeasts. The deduced amino acid sequence
for U. necator P450r¿¡rr¡ deduced showed 737o identity with the protein encoded by the
CYP51 gene of B. graminis f. sp. hordei @élye et aL, 1998) and 48Vo identity with that of
C. albicans (Marichal et al., L999). This is greater than the 407o homology needed for two
P450 proteins to be classified within the same family (Nelson et aI.,1993).
Cytochrome P450 amino acid sequences are known to be conserved within families
(Aoyama et al., L996). Six conserved domains were highlighted when comparing the
deduced 524 amino acid sequence deduced for APfl and LCb6 with other P450r¿o¡,¡
sequences from the GenBank database. Domains CR1, CR2, CR3 and CR4 are thought to
be involved in substrate specificity (Aoyama et al., 1996). According to Hargreaves and
134
Keon (1996), domain CR5 contains four consecutive amino acids (ETLR) which may
correspond to a sterol binding domain. This domain has been found in the mammalian
mitochondrial P450 eîzyme, sterol 27-hydroxylase, and in the P450r¿or',¿ of U. maydis and
other organisms. However, in the P450r¿ou of U. necator, the T is replaced by a V residue.
It may, therefore, be that the common motif in U. necator should be EVLR. Domain CR6
is the cytochrome P450 haem-binding site found in all P450s (Poulos, 1986), and contains
a cysteine residue at position 469 that binds to the haem iron atom.
In comparing the CYP51 sequences of APfl and LCb6, a single point mutation (A
to T) was identified at nucleotide 462. The triadimenol-sensitive isolate APfl contained a
tyrosine (TAT) residue at position 136, whereas the triadimenol-resistant isolate LCb6
contained a phenylalanine (TTT) residue at this position. The occurrence of this point
mutation was reported for triadimenol-resistant isolates of U. necator exhibiting an RF
value of greater than 5 (Délye et al., 1997d) and in DMl-resistant B. gramínis and azole-
resistant clinical isolates of C. albicans (Sanglard et al., 1998). Although other point
mutations have been identified within the CYP51 gene of azole-resistant C. albicans
strains (Löffler et aL, 1997), and three more in French isolates of U. necator (Délye et al.,
1999), no further nucleotide differences were found when comparing the CYP51 sequences
of Australian isolates, APfl and LCb6. This suggests that this point mutation at nucleotide
462 may be diagnostic for isolates in which resistance to DMIs has occurred.
The PASA method (Sommer et al., 1989; Luck and Gillings, 1995; Mohler and
Jahoor, 1996; Délye et al., I997d) was found to be suitable for amplification of the A{o-T
mutation in (J. necafor. PCR amplification of the A-to-T mutation at nucleotide 462 was
initially performed using primers MUT1 and U14DM (Délye et al., t997d) with DNA from
60 single-spore isolates of U. necator. These primers proved to be inefficient when
attempting to amplify the mutation in approximately 10 ng of U. necaror DNA as specified
135
by Délye et al. (1997d). In our laboratory, between 50 to 60 ng of template DNA was
needed to allow amplification of the mutation, necessitating the production of massive
quantities of conidia. Once again, this is difficult and time consuming for an obligate
biotroph such as U. necator. Nevertheless, of the 60 isolates screened using MUT1 and
U14DM, 38 (all those with RF values of at least 6) were shown to have the A{o-T
mutation. These results are similar to those obtained by Délye et al. (1997d), in that
isolates with RF values of at least 5 exhibited this mutation. The slight difference in RF
values may be due to variation in the bioassay for fungicide resistance between
laboratories. However, primers MUT1 and U14DM proved not to be specific for the
mutation under our laboratory conditions. This was probably due to the composition of the
primers. Therefore, to increase specificity, primers MU4 and MU3R were designed for
specific amplification of the mutant T allele in isolates of U. necator. After optimising the
PCR conditions for these primers, they were tested on DNA extracted from U. necator
infected grapevine tissue.
PCR amplification of the mutant T allele from DNA extracted using the plant DNA
extraction method of Doyle and Doyle (1980) proved to be unsuccessful. DNA extracted
from plant material often contains inhibitors of the enzymatic reactions involved in PCR
amplification (Levy et al.,1994). However, different methods of preparing plant samples
have made PCR from tissue extracts of grapevine possible (Minafra et al., 1992; Levy et
aI., 1994). Initially, DNA from U. necator-infected micropropagated plantlets and field
material was prepared using the method by Doyle and Doyle (1980) and purified using the
Geneclean@ Spin Kit. Using this DNA, PCR amplification of the mutant T allele was
achieved from U. necator-infected grapevine tissue. However, due to the time consuming
nature of this method, another was sought. Luck and Gillings (1995) reported the
successful identification of benomyl resistant stains of B. cinerea by PCR amplification of
136
infected grapevine tissue, prepared using the commercial product, GeneReleaser'". In this
study, (J. necator-infected micropropagated plantlets and field material were also treated
with GeneReleaser'", however, PCR amplification of the mutant T allele of the (J. necator
was not reproducible. This was probably due to the variation in levels of infection by U.
necator on micropropagated and field-collected grapevine tissue. The amount of U.
necator DNA in a composite grapevine plus U. necator DNA sample can be determined by
a preparing a Slot Blot and probing it with a U. necator specific probe. Once again, this
can be time consuming if many samples are to be processed at any one time. The most
reliable, rapid and cost effective method of obtaining high quality DNA from U. necator,
free of PCR inhibitors, was using the DNeasyru Plant Mini Kit (Qiagen). However, due to
the variation in the amount of (J. necaror DNA present in a total DNA sample, variable
results were obtained using MU4 and MU3R during PCR amplification of the mutant T
allele.
A rapid means of quantifying the amount of U. necator DNA to be used in PASA is
to perform a nested PCR. Two rounds of PCR are carried out and the amount of DNA was
quantified after the first round using a quantifiable marker. Primers U14DM and Cl4R-2
were used in the first-round PCR to specifically amplify a 1432 bp DNA fragment of the
CYP51 gene in all isolates of U. necalor. Amounts of the DNA fragment amplified, varied
with the original sample of infected tissue. Consequently, the amount of DNA used in the
second-round PCR was crucial for successful PCR amplification of the mutant T allele and
not the normal A allele. Following a serial dilution of first-round amplified DNA from a
resistant and sensitive isolate, the optimum amount of first-round amplified DNA to be
used in the second- round PCR was determined as being between 5 x 10-a and 1 x 10-s ng.
According to Sommer et aI. (1992), the inclusion of a third primer in the second-round
PCR may increase specificity of the reaction and can serve to ensure the technical success
137
of the PCR by generating a constant band. This constant band is not at the allele-specific
site. Therefore, in this study an additional primer was also added to the second-round PCR
reaction mix. Following this addition, a 1432 bp DNA fragment was visualised in all U.
necator isolates. However, a second DNA fragment of 409 bp was visualised only in
isolates with RF values of 6 or greater. The nested PASA technique did not produce any
amplification products from grapevine DNA or other fungi and yeasts and, therefore was
considered to be specific for the amplification of DNA from triadimenol-resistant U.
necator.
In summary, it proved possible to detect a triadimenol-resistant isolates of U.
necator from infected micropropagated plantlets and field material by using a simple total
DNA extraction method and nested PASA. At the time this study was conducted, the cost
of performing the PASA technique was estimated to be under $10 per sample (not
including labour). The use of such an assay may allow the rapid detection of fungicide
resistance in powdery mildew-infected material collected in the vineyard, with minimal
sample preparation. Information on the existence and distribution of DMI resistance in the
vineyard would allow the grower to implement control strategies aimed at minimising the
ineffective use offungicides and unnecessary yield loss.
138
CHAPTER 6.0
GnNrrrC BNSrS Or RNSISTANCE rO TNr¡,DIMENOLrN U¡TC¡¡TUI,A NECATOR
6.L I¡unoDUCTroN
The responses of various fungal pathogens to DMI fungicides have been described
as being under both monogenic and polygenic control. However, the question of how
many genes are actually involved in the regulation of DMI resistance is a controversial one
(Hollomon, 1993; Peever and Milgroom, 1992; 1993; Sholberg and Haag, 1993). Few
studies have been conducted to determine the genetic basis for DMI resistance because
many of the pathogens of interest lack a sexual stage or are difficult to cross. However,
analysis of progeny from sexual crosses between isolates of the same and different
sensitivity to the fungicide concerned may be useful in revealing the inheritance of DMI
reslstance.
The genetic basis of resistance to triadimenol has been well documented in E
graminis f .sp. hordei (Hollomon, 1981; Hollomon et a1.,1984; Brown et a1.,1992;Blatter
et al., 1998), however, there have been some conflicting results (see Section 1.8.2).
Published reports on the genetic basis of DMI resistance in U. necator are minimal and, it
is not known whether resistance to triadimenol is monogenically or polygenically
controlled. Preliminary studies by Corio-Costet e/ qL (1999) have detected five major
phenotypes in the progeny from a cross between triadimenol-sensitive and -resistant
isolates of U. necator.
The aims of the experiments reported in this chapter were to determine the
inheritance of triadimenol resistance in progeny from a cross between a triadimenol-
r39
sensitive and a triadimenol-resistant isolate of U. necator. The mating type of all progeny
isolates was determined and all were analysed for sensitivity to triadimenol using the
bioassay described in Chapter 4.0. In addition, each progeny isolate was subjected to the
nested PASA technique (see Chapter 5.0) and RFLP analysis using a multi-copy DNA
probe (Stummer et a1.,2000).
6.2 M¡,InRIALS aND METHoDS
6.2.1 U. necator isolates
Triadimenol-sensitive and resistant isolates, APfl (mating type = Mat *, EC5s =
0.06 mg/L, RF = 0.9) and LCb6 (mating type = Mat -, EC5s = 2.2I mglL' RF = 34),
respectively, of opposite mating type, were chosen for this study. The mating type and
sensitivity to triadimenol of these isolates were reported in Chapters 3 and 4, respectively.
6.2.2 Crossing of U. necator isolates and production of progeny
Conidia of isolates APfl and LCb6 were mass-produced on 10 detached leaves
each as described in Section 2.5. Micropropagated grapevine plantlets were prepared in
vitro according to Section 2.4 and 14 days after roots appeared, they were out-planted into
potting mix (Nu-Earth) in 7 cm diameter potting tubes. The grapevines were transferred to
a glasshouse with a mean daily temperature of 20"C and were watered daily. A relative
humidity of 557o was maintained by covering the plants with plastic. After 6 weeks the
grapevines were assembled in a growth room according to the method described by Gee et
at. (2000) as follows. The growth room day temperature was set at 25'C for 13 h and night
temperature at l7"C for 1lh. The grapevines were watered daily, fertilized fortnightly with
l:200, Moeco 30@: water (NPK L2Vo:3Vo:\Vu Moeco Pty Ltd, Australia) and were kept
r40
disease-free, prior to inoculation, using Topasru (l:320,Topasru: water) incorporated into
gavze strips (Szkolnik, 1983),
Forty-two grapevines in the growth room were inoculated with conidia of isolates
APfl and LCb6 by brushing both isolates onto the upper surface of each of three leaves on
each grapevine (Figure 6.1). The vines were assembled within an aluminium frame (100 x
100 x 90 cm) and covered with Ultra Voileru fabric (mesh size: 60pm x 30pm). The
fabric restricted the movement of conidia in and out of the tent area, however, still allowed
diffuse light and air to penetrate. Inoculated grapevines were examined at weekly intervals
for the formation of cleistothecia. At 48, 62 and 90 days post-inoculation, five leaves were
harvested at random from the 42 plants and examined under an Olympus SZ-PT stereo-
microscope at 18x magnification. For each leaf, a total of 80 cleistothecia were examined
(20 in each of four fields of vision) and the number of immature, intermediate and mature
cleistothecia was recorded. The viability of ascospores from cleistothecia that appeared to
be mature was examined according to Section 3.2.I. All leaves were harvested 90 days
post-inoculation.
Cleistothecia were harvested from leaves according to methods described by
Pearson and Gadoury (1987) and Gee et aI. (2000). I-eaves from each grapevine were
shaken vigorously in sterile distilled water for 3 mins. The suspension was then
sequentially passed through a 300 pm and 53pm mesh Cobb sieve. Cleistothecia collected
on the 53pm sieve were resuspended in sterile distilled water and collected on filter paper
(Whatman 42@, g cm) in a Buchner funnel attached to a vacuum. Each filter paper was
placed on top of a sterile, moist filter paper lining the lid of a Petri plate (10 cm diameter, 2
cm deep: Falcon@, Becton Dickinson Europe, France). Each lid was inverted over a
disease-free, surface-sterilised detached leaf. Detached leaves were prepared according to
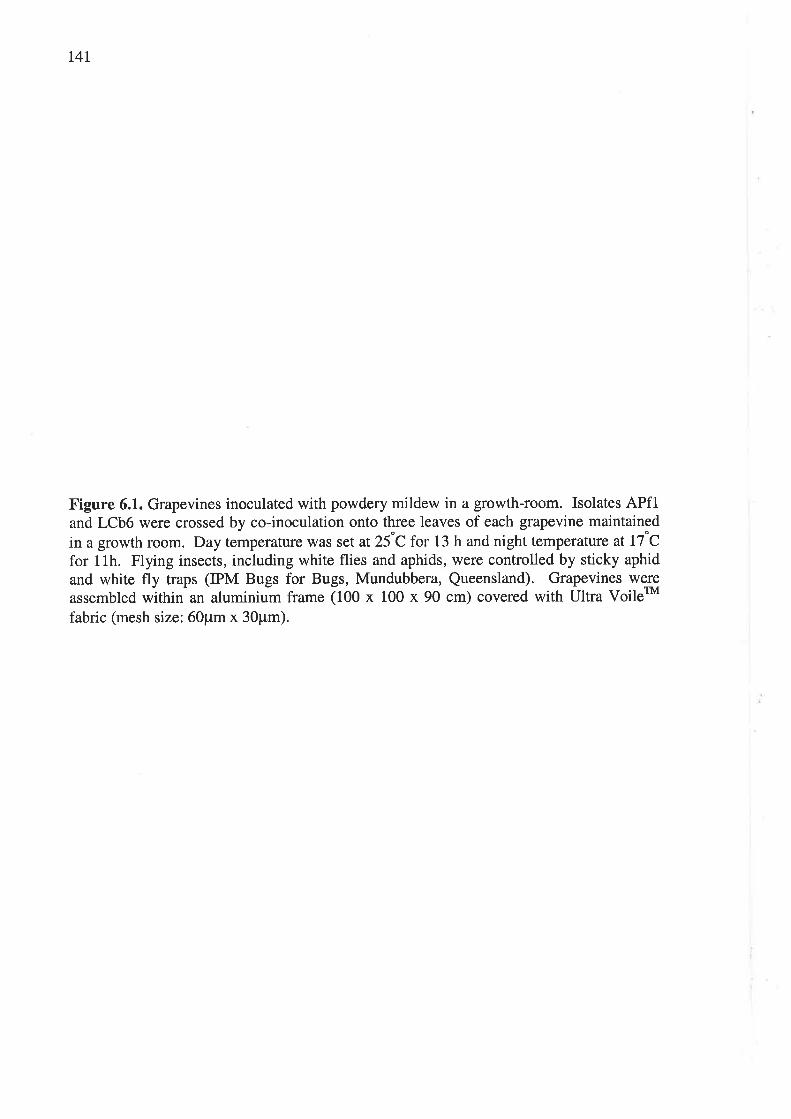
t4r
Figure 6.1. Grapevines inoculated with powdery mildew in a growth-room. Isolates APfland LCb6 were crossed by co-inoculation onto three leaves of each grapevine maintained
in a growth room. Day temperature was set at25"C for 13 h and night temperature at l7"Cfor 11h. Flying insects, including white flies and aphids, were controlled by sticky aphidand white fly traps (PM Bugs for Bugs, Mundubbera, Queensland). Grapevines wereassembled within an aluminium frame (tOO
^ 100 x 90 cm) covered with Ultra Voileru
fabric (mesh size: 60pm x 30pm).
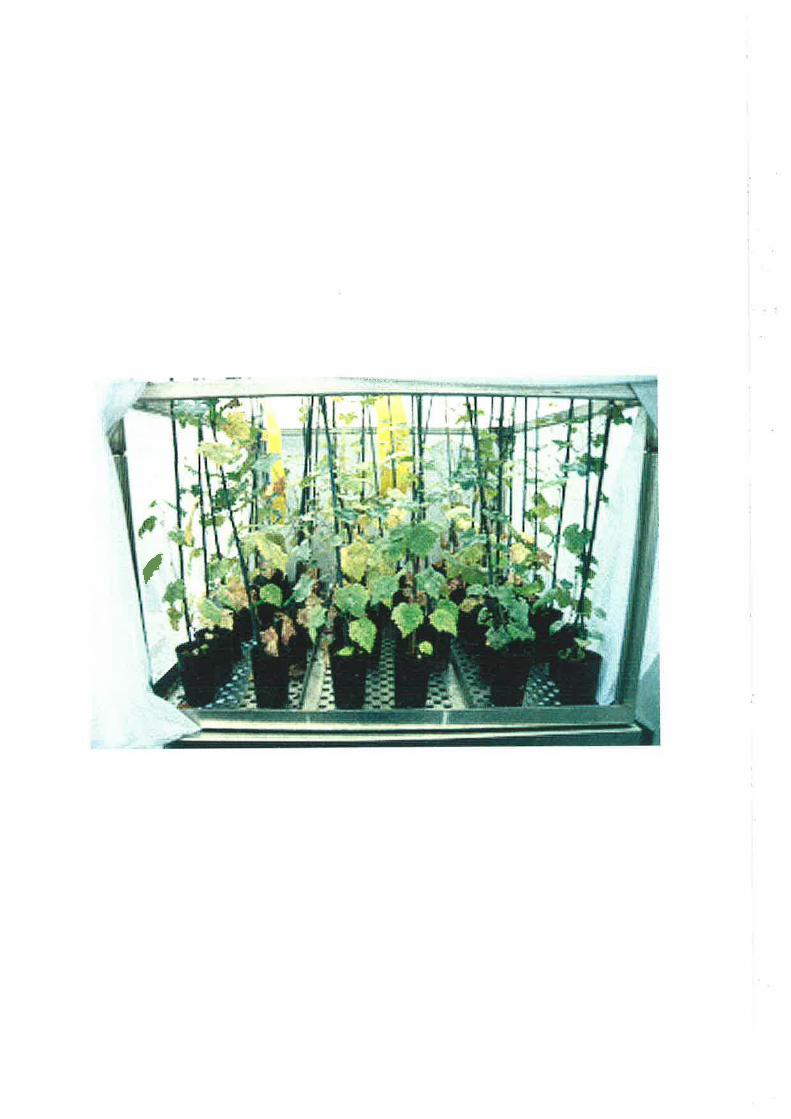
f
r42
Section 2.5. In total, nine filter papers covered with cleistothecia were inverted above nine
detached leaves. Two sterile, moist filter papers (with no cleistothecia) inverted above two
detached leaves served as controls. These Petri plates were left uncovered during
preparation of samples to detect possible contamination by U. necator conidia present in
the air. All filter papers were moistened with 1 ml of sterile distilled water before being
incubated at room temperature (2L to 23'C) in a clear plastic container lined with moist,
sterile paper towel. After 12 h, I ml of sterile distilled water was applied to each filter
paper. After 48 h, filter papers bearing cleistothecia were removed and replaced with new,
sterile, moist, filter papers. The number of immature, intermediate and mature
cleistothecia was recorded in a 1 c ' ur"aon each of five filter papers. After 60 h, all filter
papers were re-moistened with 1 ml of sterile distilled water and the leaves were incubated
for a further 36 h. Following this, the filter papers were removed and the leaf surface was
dried in a laminar flow cabinet for 12 h. The Petri plates were then sealed with Parafilm@
and incubated at room temperature until colonies of U. necator were visible on the
detached leaves. The number of discrete U. necator colonies on each detached leaf was
recorded. From each discrete colony, three single conidia were taken and placed on
separate, surface-sterilised detached leaves according to Section 2.3. In total, 44 single-
spore isolates or progeny were isolated from the discrete U. necator colonies, however,
only 27 of these v/ere successfully established (free from visible microbial contamination)
on detached leaves. Once established, the isolates were transferred individually, using a
sterile artist's paintbrush, onto micropropagated grapevines for maintenance in vitro andfor
subsequent DNA extraction.
r43
6.2.3 ldentifTcation of mating types
The mating type of all single spore-derived progeny isolates was determined by
pairing each with two isolates of known mating type, Mat(-) and Ma(+). All progeny
isolates were paired, at least twice, in vitro with isolate BNcl, MatC) and BNc2, Mat(+)
according to Section 3.2.L. Chi squared (Xl goodness-of-fit values were calculated for
segregation ratios of mating type and tested against tabulated values of 12 with one degree
of freedom.
6.2.4Fungicide testing of progeny
All progeny isolates obtained from the cross between triadimenol-sensitive isolate,
APfl, and triadimenol-resistant isolate, LCb6, were assayed for sensitivity to triadimenol
according to Section 4.2.4. EC5s and RF values were calculated for each progeny isolate
according to Section 4.2.4.3. Chi squared (X\ goodness-of-fit values were calculated for
segregation ratios of triadimenol resistance and tested against tabulated values of 12 with
one degree of freedom.
6.2.5 DNA extraction and nested PCR amplification of a specific allele (PASA)
DNA was extracted from micropropagated grapevines infected in vitro with
individual parental and progeny (see Section 6.2.2) isolates using the DNEasy'" Plant Mini
Kit (Qiagen). All progeny isolates were assayed for the presence of the A{o-T mutation
associated with triadimenol resistance according to the nested PASA method described in
Section 5.2.8. Chi squared (X\ goodness-of-fit values were calculated for segregation
ratios of the mutant T allele and tested against tabulated values of 12 with one degree of
freedom.
144
6.2.6 Genetic analysis of parental and progeny isolates
Total DNA (approximately 750 ng) extracted from the parental (APfl and LCb6)
and progeny isolates was digested with the restriction enzyme, EcoRI, in a 40 pl reaction
volume with incubation overnight at 37"C (Sambrook et al., 1989). The DNA fragments
were fractionated by electrophoresis in I7o agarose gels, run in TAE buffer, at 1.5 V/cm for
22 h (I cm thick, 20 cm long gels). Gels were stained with ethidium bromide to visualise
the DNA before transfer to Hybondru-N+; positively charged nylon membranes
(Amersham) according to the method of Sambrook et aI. (1989). DNA was cross-linked to
the nylon membranes using UV light from a GS Gene Linker (Bio-Rad).
Approximately 50 ng of the multi-copy DNA probe, pUnI22-I1 (Stummer et aL,
2000), was used in Southern hybridisation. The probe was radiolabelled with 30-50 pCi
¡cr-32P1-dCTP by using denatured pUCl9 specific primers (see Appendix) and template
DNA in a pUC19 specific oligolabelling buffer (see Appendix) at 37'C for 30 mins. The
labelled DNA was separated from unincorporated nucleotides by passing through a column
consisting of a 15 cm Pasteur pipette, with a small quantity of glass wool in the neck,
packed with Sephadex G-100 (medium grade suspended in TE buffer). The resulting
radiolabelled probe was denatured by boiling for 5 min, cooled on ice for 5 min and added
to the hybridisation solution. The membranes, separated by nylon mesh inside a 30 cm
bottle, were pre-hybridised overnight at 65'C in 10ml hybridisation solution, then
hybridised with the radiolabelled probe overnight at 65'C in a rolling-bottle hybridisation
oven. Hybridisation solutions are listed in the Appendix. Following hybridisation, the
membranes were washed four times at 65"C for 20 mins each in the following order; once
in 2x SSC, 0.1% SDS, once in lx SSC, 0.17o SDS, once in 0.5x SSC, 0.17o SDS and once
r45
in 0.2x SSC, 0.1% SDS. Membranes were wrapped in plastic and exposed to X-ray film
(X-Omat, Kodak) at -80'C, inside a cassette containing intensifier screens'
The restriction banding patterns produced by hybridisation of the probe to the DNA
on the membranes were compared for the two parents and the progeny isolates. Similarity
indices were not calculated as the banding patterns produced were not complex, instead
differences were recorded by visual inspection. Grapevine DNA was not included on
membranes as a control, because it had been shown that pUnI22-I1 does not produce a
hybridisation sígnal with grapevine DNA (Stummer et a1.,2000). Chi squared (X')
goodness-of-fit values were calculated for segregation ratios of DNA polymorphisms and
tested against tabulated values of ¡2 with one degree of freedom.
6.3 Rnsulrs
6.3.1 Crossing of U. necator isolates and production of progeny
Cleistothecia were first observed mainly on leaves that were beginning to senesce,
48 days after inoculation with isolates APfl and LCb6. Immature cleistothecia appeared
yellow to orange in colour, intermediate cleistothecia were light brown to brown and
mature cleistothecia were dark brown to black with appendages protruding from the
surface. In general, the percentage of immature and intermediate cleistothecia observed on
leaves decreased and the percentage of mature cleistothecia increased with time after
inoculation (Figure 6.2). When the leaves were harvested (90 days after inoculation),77o
of cleistothecia were immature, ISVo were intermediate and 757o were mature. The mature
cleistothecia contained two to five viable ascospores per ascus. The density of cleistothecia
collected on filter papers 90 days after inoculation rwas on average, 4t
r46
Figure 6.2. Percentage of immature, intermediate and mature cleistothecia present on
leaves harvested 48, 62 and 90 days after inoculation with isolates APfl and LCb6. Five
leaves were harvested at random from 42 plants and examined with an Olympus SZ-PT
stereo-microscope at 18x magnification. For each leaf, 80 cleistothecia were examined (20
in each of four fields of vision) and the number of immature, intermediate and mature
cleistothecia was recorded.
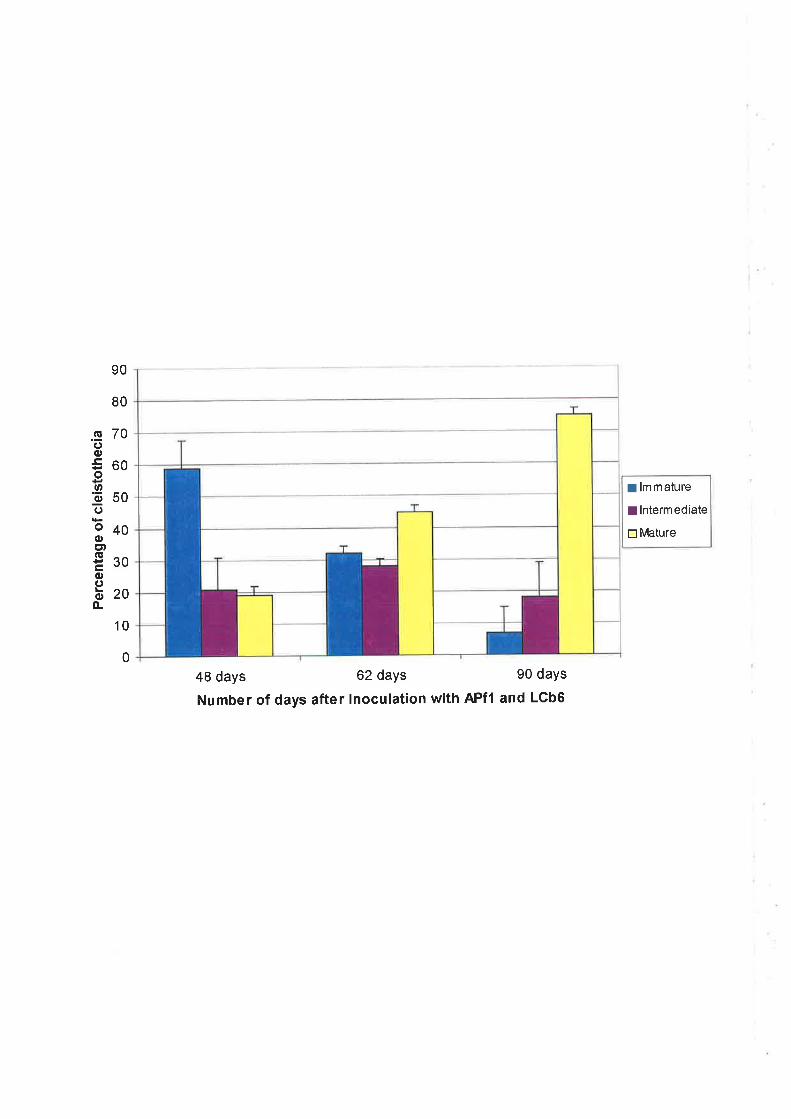
90
80
.g 70(Jo5oooo'õ 50oo40oE)
Esoo(J
bzofL
1 0
0
48 days 62 daYs 90 daYs
Number of days after inoculation with APfl and LGb6
I lmmature
I lntermediate
E lVlature
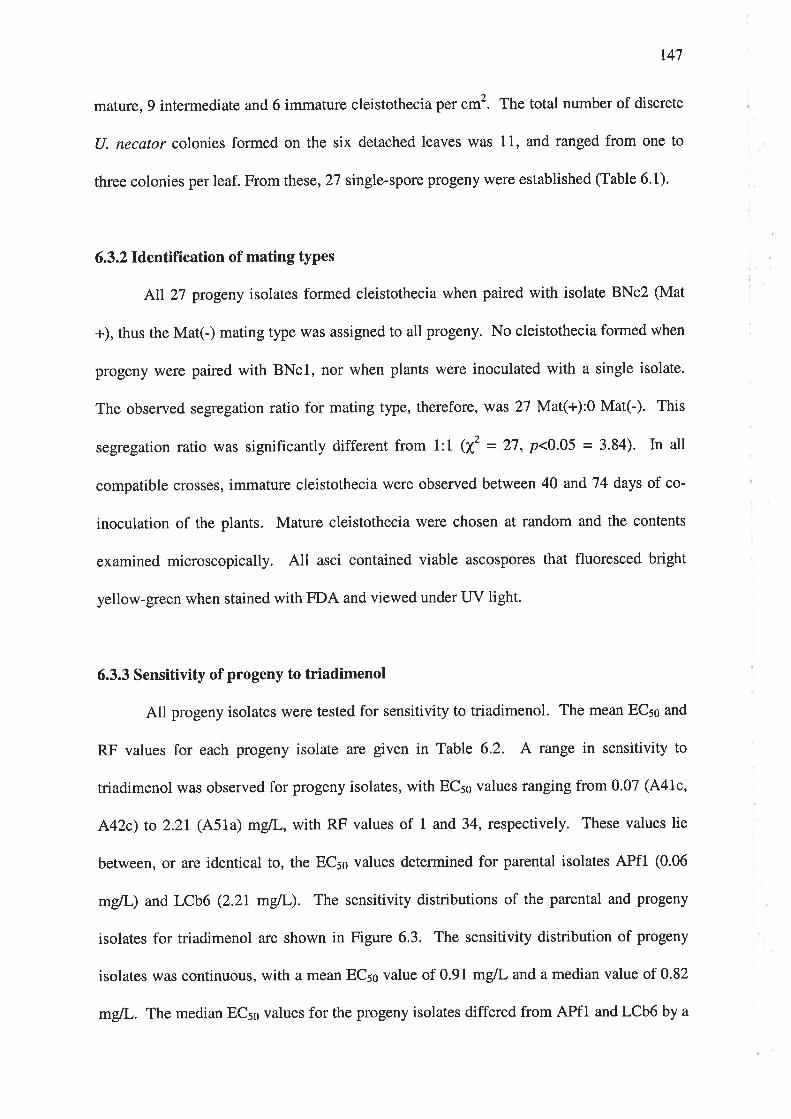
r47
mature, 9 intermediate and 6 immature cleistothecia per cm2. The total number of discrete
(J. necator colonies formed on the six detached leaves was 11, and ranged from one to
three colonies per leaf. From these, 27 single-spore progeny were established (Table 6.1).
6.3.2 IdentifTcation of mating types
All27 progeny isolates formed cleistothecia when paired with isolate BNc2 (Mat
+), thus the MatC) mating type was assigned to all progeny. No cleistothecia formed when
progeny were paired with BNcl, nor when plants were inoculated with a single isolate.
The observed segregation ratio for mating type, therefore, was 27 Mat(+):O Mat(-). This
segregation ratio was significantly different from l:l (742 = 27, p<0.05 = 3.84). In all
compatible crosses, immature cleistothecia were observed between 40 and 74 days of co-
inoculation of the plants. Mature cleistothecia were chosen at random and the contents
examined microscopically. All asci contained viable ascospores that fluoresced bright
yellow-green when stained with FDA and viewed under UV light.
6.3.3 Sensitivity of progeny to triadimenol
All progeny isolates were tested for sensitivity to triadimenol. The mean EC5s and
RF values for each progeny isolate are given in Table 6.2. A range in sensitivity to
triadimenol was observed for progeny isolates, with ECso values ranging from 0.07 (441c,
A42c)to2.2l (451a) mglL, with RF values of 1 and 34, respectively. These values lie
between, or are identical to, the ECso values determined for parental isolates APfl (0.06
mgL) and LCb6 (2.2I mgtL). The sensitivity distributions of the parental and progeny
isolates for triadimenol are shown in Figure 6.3. The sensitivity distribution of progeny
isolates was continuous, with a mean ECso value of 0.91 mgll- and a median value of 0.82
mgtL. The median EC5s values for the progeny isolates differed from APfl and LCb6 by a
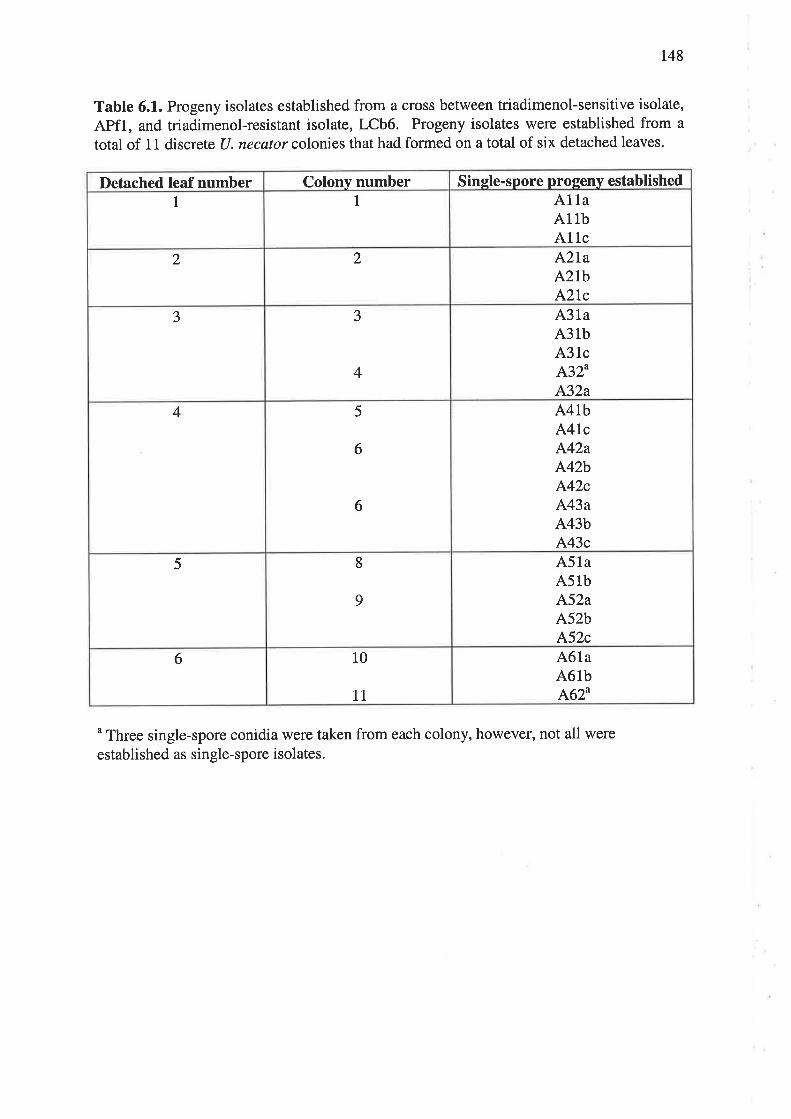
148
Table 6.1.. Progeny isolates established from a cross between triadimenol-sensitive isolate,
APfl, and triadimenol-resistant isolate, LCb6. Progeny isolates were established from atotal of 11 discrete (J. necator colonies that had formed on a total of six detached leaves.
u Three single-spore conidia were taken from each colony, however, not all were
established as single-spore isolates.
Detached leaf number Colony number Sinsle-spore proqeny established
1 1 A1laA1lbA1lc
2 2 A2laAzTbA2Ic
3 3
4
A3laA3lbA3lcA32u
A32a
4 5
6
6
A4lbA4IcA42aA42bA42cA43aA43bA43c
5 8
9
A5laA5lbA52aA52bA52c
6 10
11
A61aA6lbA62u
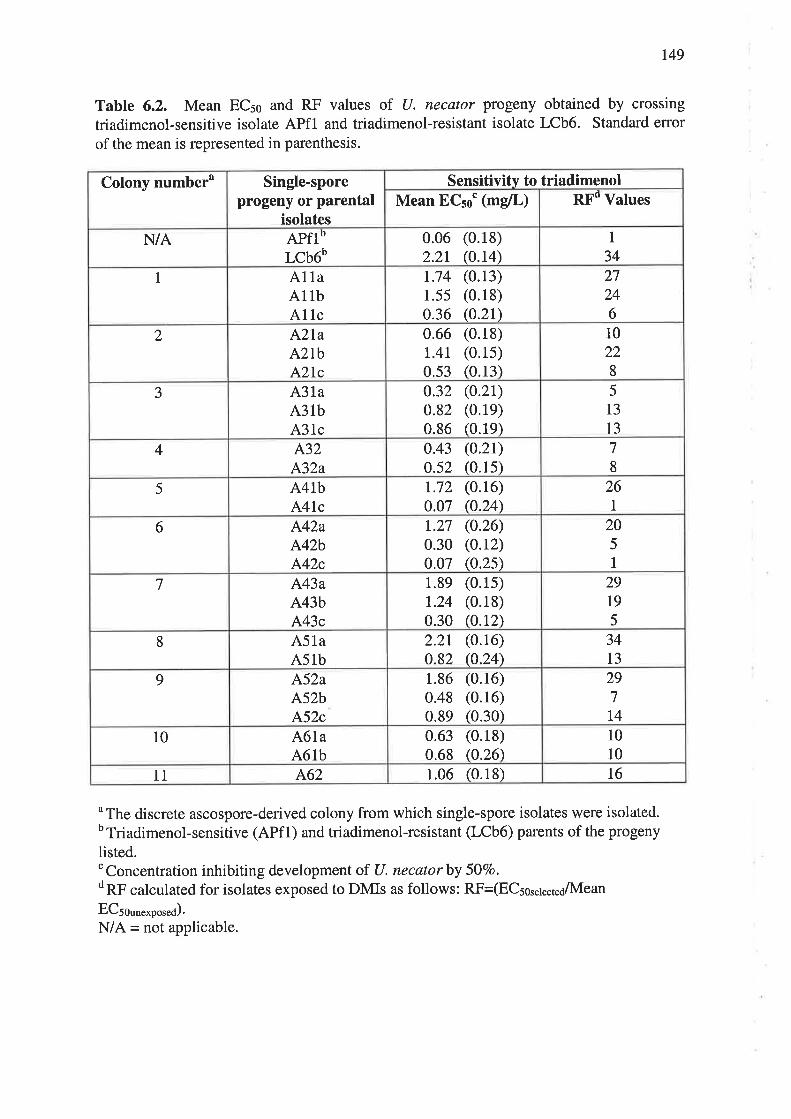
r49
Table 6.2. Mean ECso and RF values of U. necator progeny obtained by crossing
triadimenol-sensitive isolate APfl and triadimenol-resistant isolate LCb6. Standard error
of the mean is represented in parenthesis.
uThe discrete ascospore-derived colony from which single-spore isolates were isolated.oTriadimenol-sensitive (APfl) and triadimenol-resistant (LCb6) parents of the progeny
listed.cConcentration inhibiting development of U. necatorby 507o.dRF calculated for isolates exposed to DMIs as follows: RF-(ECs0."1."¡r¿/ìVIean
EC5ooo.*por"¿).
N/A = not applicable.
Colony number" Single-sporeprogeny or parental
isolates
Sensitivitv to triadimenolMean ECso" (mglL) RFd Values
N/A APflbLCb6b
0.06 (0.18)2.2r (0.14)
1
34
1 A11aA1lbA1lc
r.74 (0.13)1.ss (0.18)0.36 (0.21)
27246
2 AZLaA2IbA2Ic
0.66 (0.
L.4t (0.
0.53 (0.
18)1s)13)
10
228
3 A3laA3lbA3lc
0.32 (O.2r)o.82 (0.1e)0.86 (0.19)
5
13
L3
4 1^32
A32a0.43 (0.21)0.52 (0.15)
7
8
5 A4lbA4Ic
r.72 (0.16)0.07 (0.24)
261
6 A42aA42bA42c
r.27 (0.26)0.30 (0.r2)0.07 (0.2s)
205
1
7 A43aA43bA43c
1.8e (0.1s)r.24 (0.18)0.30 Q.r2\
2919
5
8 A5laA5lb
2.2t (0.16)0.82 (0.24)
3413
9 A52aA52bA52c
1.86 (0.16)0.48 (0.16)0.89 (0.30)
297
T4
10 A61aA6lb
0.63 (0.18)0.68 rc.26')
10
10
11 A62 1.06 (0.18) L6
150
Figure 6.3. 507o effective concentration (ECso) frequency distributions for triadimenol
sensitive parent, APf1, triadimenol-resistant parent, LCb6, and the progeny isolates.
Triadimenol-sensitive parent APfl is in the category labelled 'S' and triadimenol-resistantparent LCb6 is in the category labelled 'R'. All the progeny isolates obtained from the
cross lie either in or between these two categories.
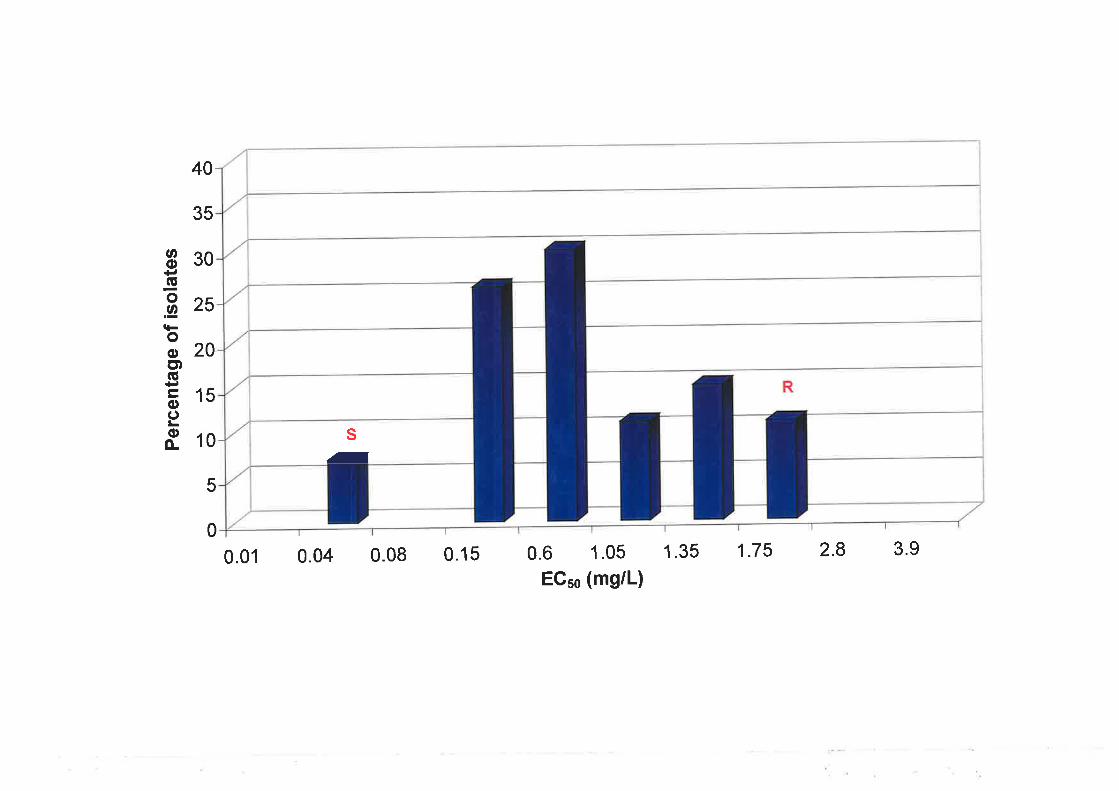
Per
cent
age
of is
olat
es
o(¡o
('lN o
N) ('t
(, o(, (¡
À oo b o b À o b æ I (¡ o
nr b
,o (rì o -a @-.
. I
t-
¿^, (¡ \ (¡ N)
bo (¡)
Ao
Ø I
151
magnitude of 3 and 14, respectively. Of the progeny, '77o were in the same category as
sensitive parent, APf1, and l IVo were in the same category as resistant parent, LCb6. The
majority (307o) of the progeny were in the 0.6 to 1.05 mglL EC56 category. Considerable
variation was also observed among the progeny collected from the same ascospore-derived
colony. For example, the two single-spore progeny (441b and A41c) isolated from
detached leaf 4, colony number 5 showed ECso values of 0.07 and I.72 mglL.
The observed segregation ratio for resistance to triadimenol was 5 (sensitive):22
(resistant) (1:a). This segregation ratio was significantly different from I:I (f = 8.33,
p<0.05 - 3.84), which, given thatU. necator is haploid, is inconsistent with there being a
single gene that controls response to triadimenol.
6.3.4 Nested PCR amplification of a specifTc allele (PASA) in progeny isolates
The nested PASA technique was used to amplify the A-to-T mutation associated
with resistance to triadimenol (see Chapter 5.0). In the first-round PCR, primers U14DM
and C14R-2 amplified a 1432 bp fragment in all parental and progeny isolates (Figure 6.4).
The amount of DNA amplified in the first-round was quantified using the SPPl/EcoRI
molecular weight marker (GeneWorks, South Australia). Approximately I to 41 ng/pl of
DNA was amplified from initial DNA template of 5 to 10 ng, respectively. In the second-
round PCR, primers MU4, MU3R and C14R-2 were used. Two DNA fragments were
amplified in all progeny isolates and parent LCb6, and only one fragment was amplified in
parent APfl (Figure 6.5). Primers MU4 and C14R-2 amplified a 1362 bp DNA fragment
and primers MU4 and MU3R amplified a 409 bp DNA fragment encompassing the A-to-T
mutation. No amplification was observed from DNA of grapevine nor in the water control.
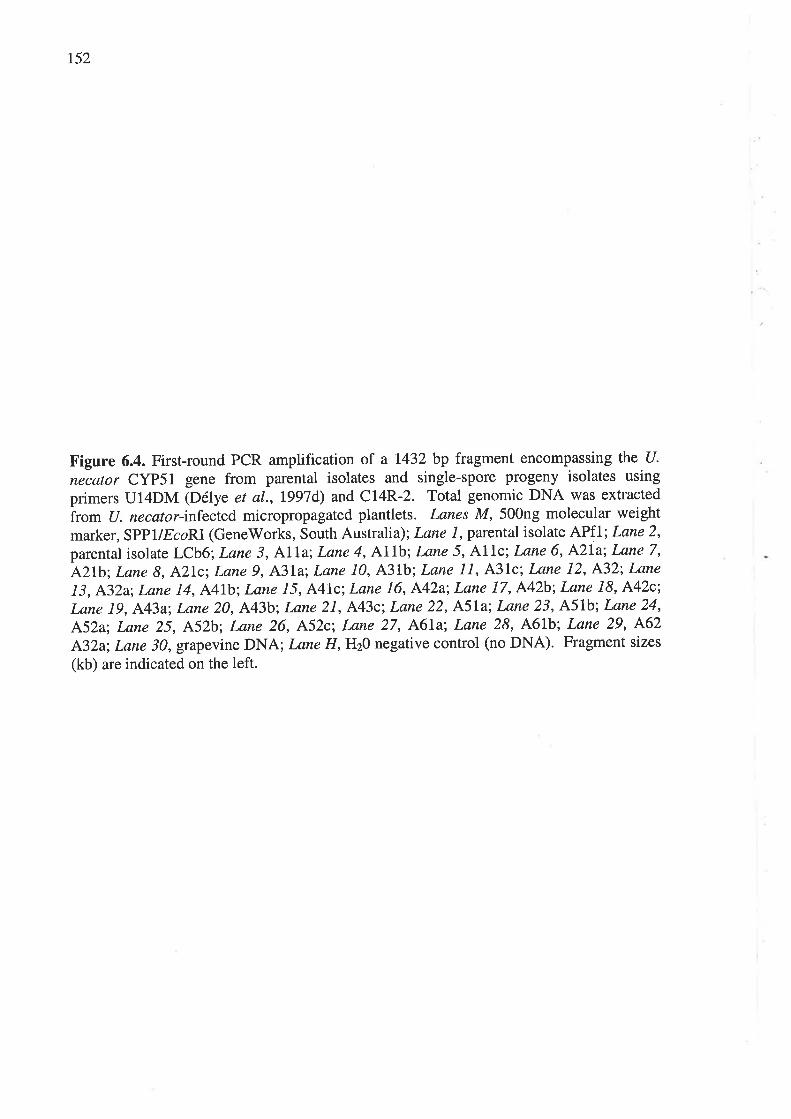
r52
Figure 6.4. First-round PCR amplification of a 1432 bp fragment encompassing the U.
necator CYP51 gene from parental isolates and single-spore progeny isolates using
primers U14DM (Délye et al., I997d) and C14R-2. Total genomic DNA was extracted
irom U. necator-infected micropropagated plantlets. Lanes M, 500ng molecular weight
marker, SPPl/EcoRI (GeneWorks, South Australia); Lane 1, parental isolate APfl; Lane 2,
parental isolate LCb6; Lane 3, A1la; Lane 4, A1lb; Lane 5, A1lc; Lane 6, A2La; Lane 7,
A2Ib; Lane 8, A2Ic Lane 9, A3Ia; Lane 10, A31b; Lane 11, A3lc; Lane 12, A32; Lane
13, A32a; Lane 14, A41b; Lane 15, A4lc; Lane 16, A42a; Lane 17, A42b; Lane 18, A42c;
Lane 19, A43a; Lane 20, A43b; Lane 21, A43c; Lane 22, A51a; Lane 23, A51b; Lane 24,
A52a; Lane 25, A52b; Lane 26, A52c; Lane 27, A61a; Lane 28, A61b; Lane 29, A62
A32a; Lane 30, grapevine DNA; I-ane H, H20 negative control (no DNA). Fragment sizes
(kb) are indicated on the left.
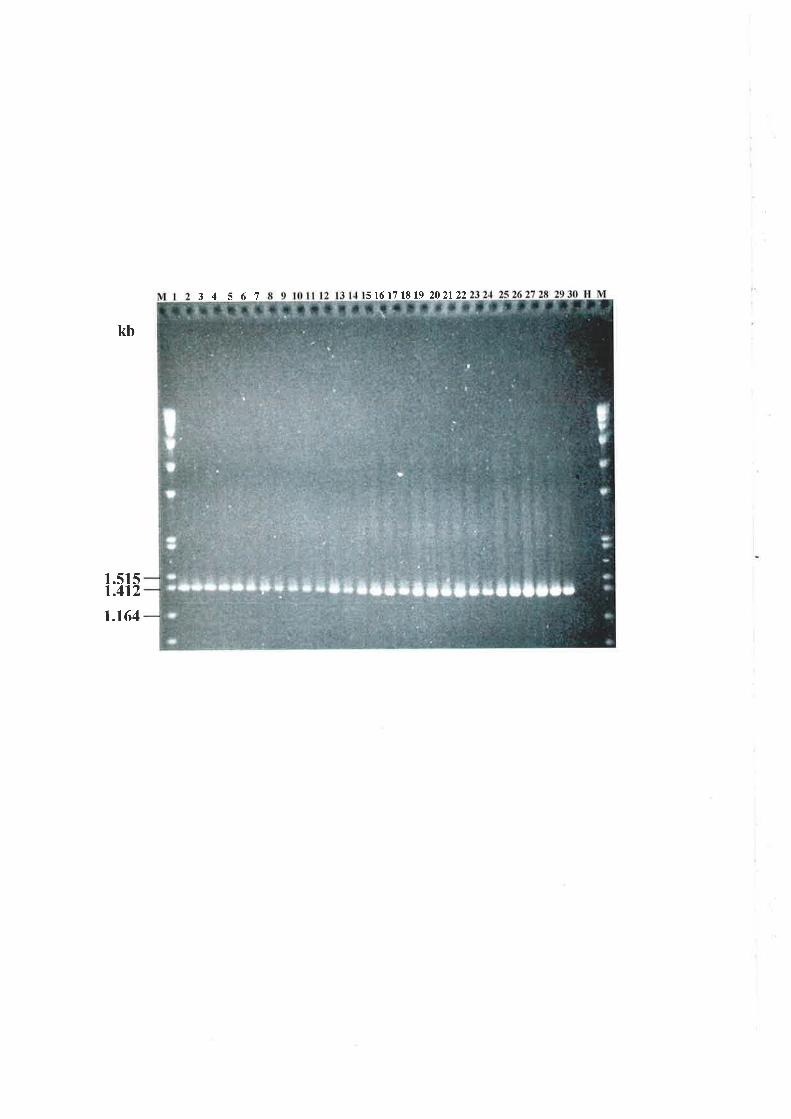
34 567 s 16 17 18 t9 202122
kb
.5
.4lI
5,,II
1.164
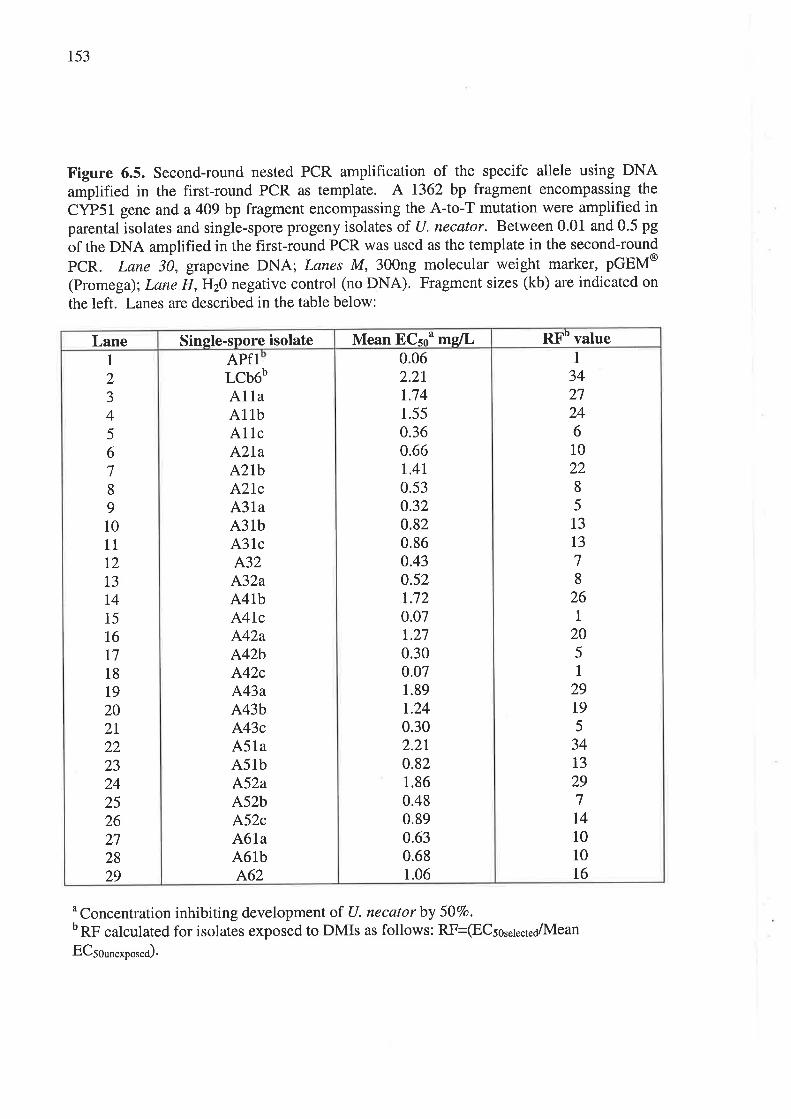
153
Figure 6.5. Second-round nested PCR amplification of the specifc allele using DNAamplified in the first-round PCR as template. A 1362 bp fragment encompassing the
CYP51 gene and a 409 bp fragment encompassing the A-to-T mutation were amplified inparental isolates and single-spore progeny isolates of U. necator. Between 0.01 and 0.5 pg
of the DNA amplified in the first-round PCR was used as the template in the second-round
PCR. Lane 30, grapevine DNA; Lanes M, 300ng molecular weight marker, pGEM@
(Promega); Lane H, H20 negative control (no DNA). Fragment sizes (kb) are indicated on
the left. Lanes are described in the table below:
u Concentration inhibiting development of U. necatorby 507o.b RF calculated for isolates exposed to DMIs as follows: [email protected].¿/IVIean
EC5ounr*po."¿)'
Lane Single-spore isolate Mean ECsou ms[L RFb value1
2J
45
6
7
8
9
1011
L2
t3L4
15
T6
t718
t9202T
2223242526272829
APflLCb6bA11aA11bA11cA2laA2lbA2IcA31aA3lbA3lcA32
A32aA4lbA4lcA42aA42bA42cA43aA43bA43cA51aA5lbA52aA52bA52cA61aA6lbA62
0.062.21r.741.55
0.360.66t.4r0.530.320.820.860.430.52r.720.071.27
0.300.071.89r.240.302.210.821.860.480.890.630.681.06
1
342724610
228
5
13
T3
7
8
261
205
1
29t95
3413
297
T4
10
10
t6
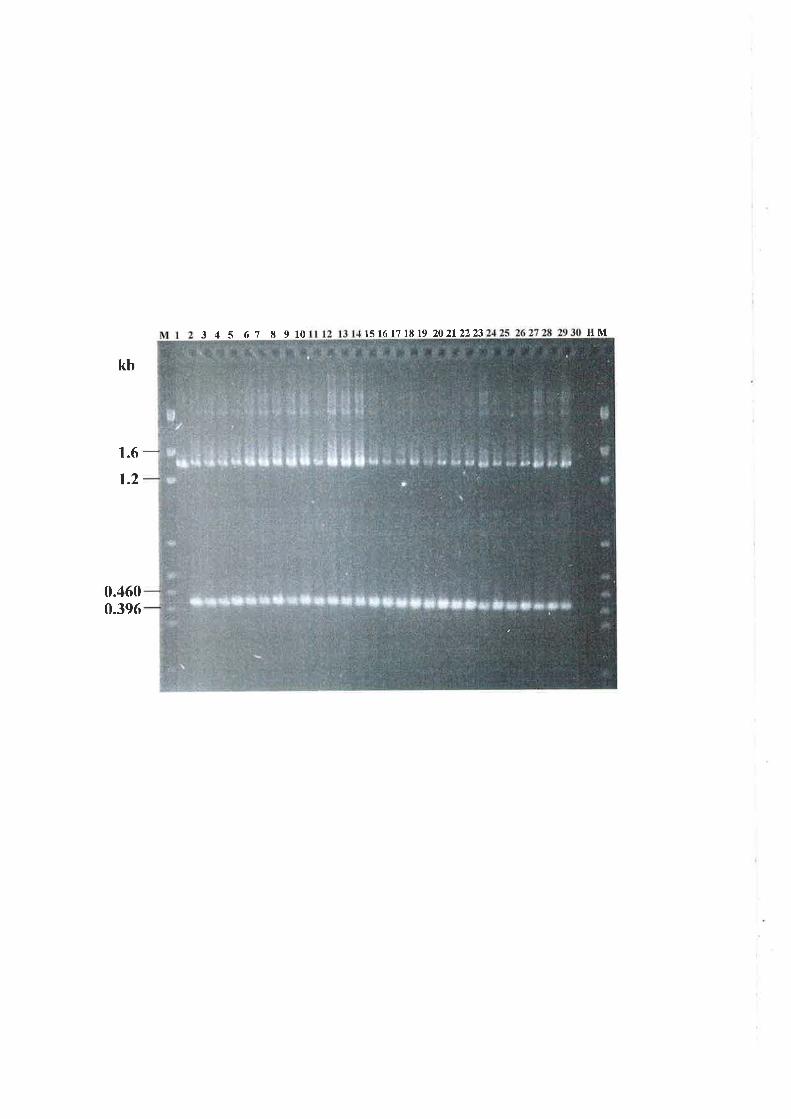
3 4 s 67 E 910 ls 16 17 t8t9 20212223 HM
kh
1.6
1.2
0.4600.396
r54
The observed segregation ratio for the A-to-T mutation was 27 (mutation present):O
(mutation not present). This segregation ratio was significantly different from 1: ! ()t = 27 ,
p<0.05 = 3.84).
6.3.5 Genetic analysis of parental and progeny isolates
The multi-copy DNA probe, pUN122-11, was used to detect RFLPs among the
parental isolates, APfl and LCb6, and the 27 progeny isolates. The probe hybridised to
EcoRI digested DNA from both parental and all progeny isolates. Figure 6.6 shows the
banding pattems generated using this probe. The differences in the observed intensity of
bands is due to the variation in the amount of U. necaror DNA present in the samples
loaded. Nevertheless, these banding patterns were useful in distinguishing the two parental
isolates. The probe hybridised to nine fragments in triadimenol-sensitive isolate, APfl, and
to eight in triadimenol-resistant isolate, LCb6. Three bands present in LCb6 are missing in
APfl and APfl has one band that is missing in LCb6. The banding patterns of all progeny
isolates were identical to triadimenol-resistant parent, LCb6, hence, no recombination was
detected. The observed segregation ratio for the DNA polymorphisms, therefore, was 27
(identical to resistant parent):O (identical to sensitive parent) and was significantly different
from 1:1 ()t =27,p<0.05 = 3.84).
155
Figure 6.6. Segregation of RFLPs in ascospore-derived progeny from a controlled cross
between triadimenol-sensitive isolate, APfl, and triadimenol-resistant isolate, LCb6, of U.
necator. Southern hybridisation of probe pUnI22-I1 to EcoRI digested DNA extracted
from micropropagated grapevine infected with 13 individual isolates of U. necator.
Polymorphic bands are indicated by an arrow. Lane I, parental isolate APfl; Lane 2,
parental isolate LCb6; Lane 3, A41b; Lane 4, A4Ic; Lane 5, A42a; Lane 6, A42b; Lane 7,
A42c; Lane 8, A43a; Lane 9, A43b; Lane 10, A43c; Lane ll, A2Ia; I'ane 12, AZIb; Lane
13, A2lc. Fragment sizes (kb) are indicated on the left.
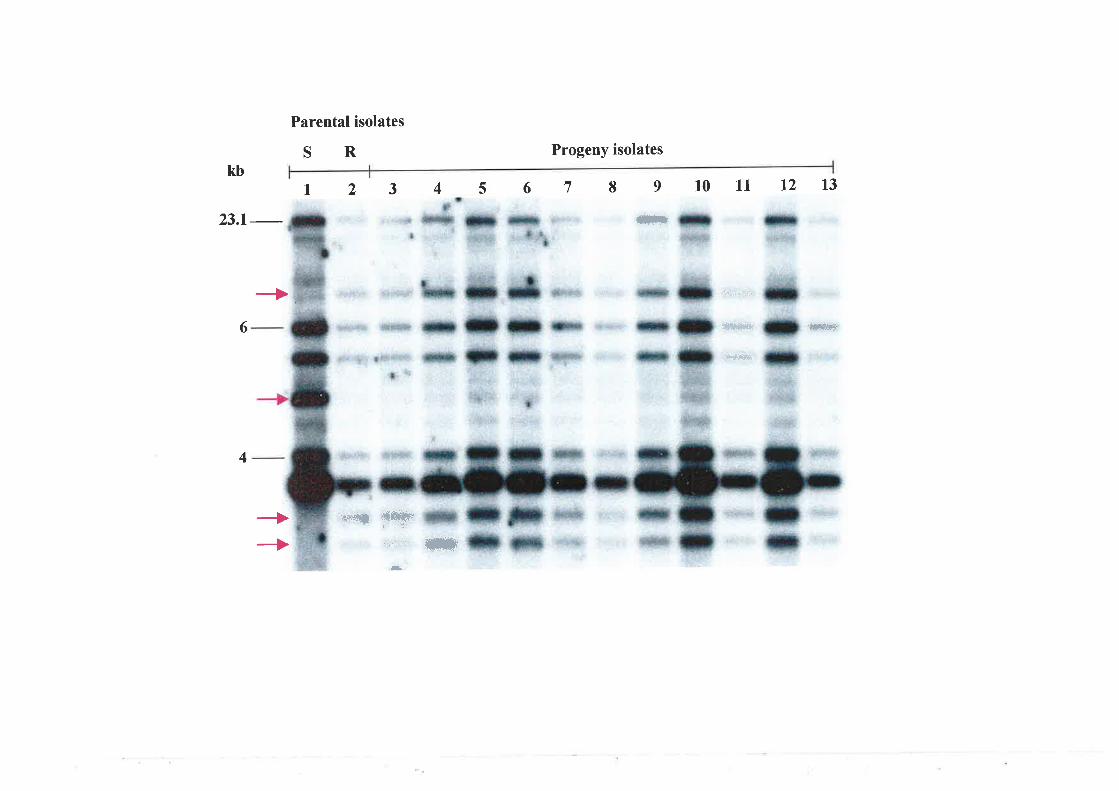
kb
23.1_
+6
4
++
rìr.r¡dü¡
.l
,í#qip {fsþ
Progeny isolates
ffi
Parental isolates
SR
t2 34567891011\213
ù1 ûiir:-r,
dñ*tË
,åd}'e,h
wffi¡¡ìì ri i:
'ri:,. , '
/.r,¡.r!
{rÐftFl
ri*t&d*'
.'ü, l,f 1;,'lr,'1" #*
r56
6.4 DrscussloN
Cleistothecia formed by crossing triadimenol-sensitive isolate APfl and
triadimenol-resistant isolate LCb6 reached maturity 90 after inoculation and yielded
infective ascospores. The number of ascospore-derived infections on detached leaves was
low, with only 11 discrete colonies formed and 27 single-spore progeny being established
in vitro. Gee et al. (2000) also reported low infection efficiency of U. necator ascospores
in crossing studies of (J. necator, both in vitro and in vivo. Furthermore, Pearson and
Gadoury (1937) found that ascospores from cleistothecia, collected from the field, also
showed low infection efficiencies. In addition, Miazzi et al. (1997) have also reported the
presence of immature or aborted ascospores in cleistothecia formed in vitro. It has been
suggested that ascospore infection efficiency may be governed by the genetic compatibility
of parental isolates rather than the environment in which the cleistothecia were formed
(Gee et a1.,2000). Further crosses between genotypically different isolates will need to be
conducted to elucidate this further.
All progeny isolates were of the 'minus' mating type, as was triadimenol-resistant
parent APfl, therefore, the segregation ratio for mating type was not 1:1. An Fr
segregation ratio of 1:l is expected for a single major gene in a haploid organism. Similar
results, where one mating type predominates, have been observed for progeny generated by
crossing different isolates of U. necator (8. Stummer; unpublished).
The segregation of triadimenol resistance among progeny isolates also differed
from 1:1. The ECso values obtained for the progeny isolates were continuously and
approximately normally distributed between the two parents. Of the 27 progeny, only five
were classed as being sensitive to triadimenol. The segregation ratio for triadimenol
resistance was 1:4. It is also interesting to note that there was variation in the EC5s values
157
among progeny isolated from the same ascospore-derived colony. These results suggest
that recombination has occurred. Resistance to two other DMI fungicides, flusilazole and
myclobutanil, in V. inaequalis was found to be controlled by many genes (Sholberg and
Haag, 1993) whereas earlier studies by Stanis and Jones (1985) had shown triadimenol
resistance in V. inaequalis to be controlled by a single gene. Similarly, the progeny from
five crosses between triadimenol sensitive and resistant isolates of P. teres were observed
to segregate into two discrete distributions in 1:1 ratios. However, when the progeny were
tested for resistance to propiconazole, the phenotypes were found to be continuously
distributed and no single major locus appeared to be segregating in the crosses (Peever and
Milgroom, 1992). Similar results were observed by Brown et aI. (1992) and Blatter et aI.
(1998) where E. graminis f. sp. hordei isolates were found to segregate into a 1:l ratio for
resistance to triadimenol. In contrast, earlier studies by Hollomon (1981) and Hollomon ¿l
al. (1984) had suggested that triadimenol resistance in E. graminis f. sp. hordei was
controlled by many genetic factors and this was the reason why the powdery mildew fungi
appear to have responded slowly to selection for decreased sensitivity to DMI fungicides.
Few studies have been conducted at the DNA level to elucidate the control of DMI
resistance in fungal pathogens, therefore, the contradictory results observed in the literature
may be due to the different methods used to assess the resistance status of isolates to the
various DMIs available. For example, Hollomon (1981) estimated triadimenol resistance
in Erisyphe graminis f. sp. hordel from EC56 values calculated by logistic regression of
germ-tube length on log (dose) of the test fungicide, whereas Brown et al. (1992) counted
the number of sporulating colonies and used principal components analysis to classify
isolates as sensitive or resistant. The use of these different methods makes it difficult to
compare results reported by different research groups. Therefore, there is a need to
158
encourage the use of a universal method of testing isolates for resistance to DMI
fungicides.
An aim of this work was to study the inheritance of the A-to-T mutation responsible
for resistance to triadimenol. Analysis of both parental isolates and progeny isolates using
nested PASA revealed the presence of the mutant T allele in all progeny isolates. The
presence of this mutation in progeny isolates displaying RF values less than six could be
explained by variation observed in the bioassay for fungicide resistance or the possibility of
a PCR artifact. In future studies, the DNA from suspicious progeny could be sequenced to
detect the presence/absence of the mutation, however, this was not done in this study due to
a lack of time. Thus far, the results suggest that recombination has not occurred, but rather,
self-fertilisation has occurred. To investigate these possibilities further, both parental and
progeny isolates were analysed using the pUn122-11 multi-copy fingerprinting DNA probe.
Polymorphisms were detected between the two parental isolates, however, none were
detected among the progeny isolates. All progeny were identical to one another and
appeared to be identical to the resistant parent. Given that only one parental genotype was
observed amongst the progeny, it is most likely that no recombination had occurred,
therefore, strengthening the likelihood that self-fertilisation had occurred. It may be that
the use of only one multi-copy fingerprinting probe was not sufficient enough to detect
novel genotypes in the progeny. However, research by B. Stummer (unpublished), using
this probe, detected both recombinants and non-recombinants among progeny from two
separate crosses between U. necator isolates of different genotype. These observations
made with the non-recombinants have been attributed to self-fertilisation due to a failure of
melosls.
In this study and that of B. Stummer (unpublished) it is very likely that the small
sample size of parental isolates and progeny used and the lack of single-ascospore-derived
t59
progeny from individual asci hindered genetic analyses. Due to time constraints, only one
cross was performed. In future studies, crossing isolates of (J. necator with different levels
of triadimenol resistance will be necessary to determine the inheritance of resistance to
triadimenol. In addition, crossing isolates characterised for resistance to fenarimol will
determine if fenarimol resistance segregates in the same way as triadimenol resistance.
'Work published by Peever and Milgroom (1992) indicated that a single model for the
inheritance of resistance to different DMIs may not be possible but, rather, that patterns of
inheritance may vary depending on the resistance phenotypes of the parents and the
pathogen/DMl combination tested.
In summary, the segregation pattern of various markers has been analysed as a
contribution towards determining the inheritance of triadimenol resistance in U. necator.
All markers showed a segregation ratio that was significantly different from 1:1. In
addition, no recombination was detected between the two parental strains used in the cross,
indicating the possibility of self-fertilisation. However, the continuous distribution in
sensitivity to triadimenol observed among the progeny suggests that recombination may
have occurred. In the future, an extensive analysis of progeny from a number of crosses
may provide additional information on the heritability of triadimenol resistance and
selection for fungicide resistant isolates in the field.
160
CHAPTER 7.0
Gn¡rpnar, DrscussroN
Reduced sensitivity to two DMI fungicides, triadimenol and to a lesser extent
fenarimol, was identified in Australian isolates of U. necator for the first time. A bioassay
for fungicide resistance, modified from that of Erickson and V/ilcox (1997), provided the
means of classifying isolates of U. necator as resistant to DMI fungicides. This technique
also provided the basis for determining the extent of cross-resistance among the isolates. A
diagnostic test using the PASA technique was developed to discriminate between
triadimenol-sensitive isolates of U. necator and triadimenol-resistant isolates with RF
values greater than 6. This allowed the amplification of an A-to-T mutation associated
with triadimenol resistance from diseased material collected directly from the field.
Using the bioassay for fungicide resistance, a total of 60 single-spore isolates,'
originating from vineyards with no previous exposure to DMI fungicides and from
vineyards with suspected practical resistance, were tested for sensitivity to triadimenol. Of
these 60 isolates, 34 isolates were tested for sensitivity to fenarimol. A continuous
distribution of sensitivities was observed for both triadimenol and fenarimol, and values for
classifying an isolate as resistant to either of the fungicides were established. Isolates were
resistant to triadimenol or fenarimol if their EC5¡ values exceeded 0.42 mglL (RF = 6) and
0.l2mgil- (RF = 1.5), respectively.
By combining the data obtained from the bioassay for both fungicides, the existence
of cross-resistance was determined. Cross-resistance appeared to be incomplete.
Although triadimenol and fenarimol belong to the same group of fungicides and appear to
have the same mode of action, it is possible that slight differences in their chemical
161
structure may lead to the development of different levels of resistance in particular isolates.
If this holds true, then DMIs belonging to different chemical groups could be used in
rotation, throughout the growing season, to control powdery mildew. However, as in the
development of any disease management strategy, the cost of integrating this into existing
vineyard management programs must be considered.
A major aim of this study was to develop a rapid diagnostic test for DMI resistance.
However, due to time constraints, the obligately biotrophic nature of this fungus and the
constant requirement of disease-free grapevine leaves and micropropagated grapevines ln
vitro, only a small number of U. necalor isolates were assayed for reduced sensitivity to
triadimenol and fenarimol. For future studies, and in order to gain a better understanding
of the baseline sensitivities and the extent of cross-resistance that exists in U. necator to
the various DMIs being used in Australian vineyards, additional isolates should be
collected and tested for response to triadimenol, fenarimol and other DMI fungicides.
DMIs have been used in Australian vineyards for over 10 years and the present study
indicates that the development of resistance to these fungicides has been a slow process.
To date, no major yield losses have been attributed to poor control of powdery mildew by
DMIs in Australian vineyards. This may be due to, in part, the awareness among growers
and industry personnel of well-documented experiences elsewhere, in which large-scale
losses caused by U.necator have been attributed to reduced sensitivity to DMIs (Gubler er
a1.,1994).
Research carried out in France suggested that resistance to triadimenol is controlled
by a single point mutation (Délye et aI., L997d), therefore, the presence of this mutation in
Australian isolates of (J. necator was investigated. Published primers, flanking the CYP5l
gene of (J. necator (Délye et aL, 1997c), were used to amplify this gene in triadimenol-
sensitive and triadimenol-resistant Australian isolates of U. necator. The resulting
t62
sequences were compared to one another and to those published previously @élye et al.,
1997c; Délye et aI.,1997d). The presence of an A-to-T mutation was confirmed in the one
triadimenol-resistant isolate of U. necator examined. Furthermore, no additional mutations
were observed in the CYP51 gene sequences of the one sensitive and one resistant isolate
examined. However, it is possible that further mutations may be present in the CYP51
gene of other DMI resistant U. necator isolates.
Due to time constraints, the CYP51 gene was sequenced from only one triadimenol-
resistant isolate of U. necator. Therefore, the primers developed by Délye et al. (1997d) to
flank the point mutation were tested for their ability to discriminate triadimenol-sensitive
and triadimenol-resistant isolates of U. necator collected from Australian vineyards.
However, these primers did not allow reproducible amplification, in spite of considerable
effort to optimise the PCR parameters. The primers were re-designed and a nested PASA
technique was adopted to amplify the point mutation reliably in triadimenol-resistant
isolates of U. necator with RF values greater than six. With satisfactory optimisation of
the PCR, specific alleles may be readily distinguished using this technique. As in research
conducted by Sommer et aI. (1992), the technique was found to be rapid, reproducible,
inexpensive and is considered to be amenable to automation.
In the future, the development of more sophisticated molecular detection
technologies such as "Real-time PCR molecular beacon analysis", which utilises hair-pin
shaped fluorescent hybridisation probes to monitor the accumulation of a specific product
in a closed-tube in real time PCR may be more feasible (Heaney and Hollomon, 1998).
This PCR can be performed within 2 hours, eliminates the need for gel electrophoresis and
reduces the risk of contamination involved with PCR analysis (Bao, 2000). Either this
technique or the nested PASA technique could be used to detect DMI resistant U. necator
in vineyard material. However, a suitable sampling strategy must first be determined.
r63
During the growing season, samples of leaves or berries could be collected at random from
30 different sampling points in the block of interest (T. Nair, School of Horticulture,
University of Western Sydney). Sprays often miss the end of rows, therefore, sampling
from these points should be avoided. Once in the laboratory, the samples would be tested
for the presence of the mutation correlated with resistance to DMIs. Information on the
degree of resistance and the distribution of resistance in the block would be relayed to
growers. Consequently, this would allow growers to make more informed decisions
regarding the control of grapevine powdery mildew. Any DMI resistance testing service
offered may be analogous to the Botrytis resistance testing service (T. Nair, School of
Horticulture, University of Western Sydney) whereby, starting from early in the growing
season, growers would be able to send in samples of powdery mildew affected grapevine
leaves or berries, and obtain information on the resistance status of U. necator in their
vineyards. In turn, the information obtained from this test may assist in monitoring the
development of resistance and in developing alternative spray programs for the effective
control of powdery mildew. However, this diagnostic testing service may not be capable of
predicting whether or not resistance will occur in the future.
A mutation in only one gene (CYP51) has been reported to confer resistance to
DMI fungicides in U. necator (Délye et al.,1997d), however, the continuous distribution in
EC5s values suggests that resistance may actually be under polygenic control. Therefore,
what is the effect of sexual recombination on the development of polygenic resistance?
V/ill sexual recombination facilitate the acquisition of quantitative resistance by combining
individual resistance polygenes, or will it slow it down by breeding synergistic
combinations? These are a few of the questions that are yet to be answered for many fungal
pathogens. An example in which the development of resistance may have been delayed
due to sexual recombination is in the response of E. graminis f.sp. tritici to DMI
r64
fungicides. Felsenstein (1994) compared DMI resistance levels for E. graminis f.sp. hordei
and E graminis f .sp. tritici in Europe and attributed the lower levels of resistance observed
in wheat powdery mildew to the more frequent occurrence of the sexual stage. Data
generated through recombination studies between U. necator isolates of different
sensitivities to DMI fungicides may be useful in developing strategies for fungicide use,
which minimise the spread of polygenically-controlled resistance.
Analysis of progeny from a cross between a triadimenol-sensitive and a
triadimenol-resistant isolate, using the bioassay for fungicide resistance, mating type assay,
nested PASA and the DNA probe, pUnl22-I1, provided conflicting results. The mating
type and DNA markers revealed the absence of recombination, and the possibility of self-
fertilisation, with the triadimenol-resistant genotype being predominant. However, the
different levels of sensitivity to triadimenol, detected among the progeny isolates using the
bioassay, suggest that recombination had occurred between the two parental isolates. The
conflicting results obtained from the bioassay and molecular markers may be due to
variations in ECso values observed in the bioassay for fungicide resistance. However, there
is also a remote possibility that the surface of cleistothecia were contaminated with conidia,
such that the single-ascospore derived colonies actually arose from conidia. It is also
possible that the progeny were clonal or that the triadimenol-resistant parent was a member
of a dominant clone. Using the DNA probe, E9, Brown et aI. (1990) also found, on
occasion, E. graminis f.sp. hordei progeny to be identical to the large, presumably clonal
fraction in all characters except for one virulence or fungicide resistance response. To
further elucidate the nature of the inheritance of DMI resistance in U. necator, further
crosses must be conducted between isolates with different levels of sensitivity to DMI
fungicides and larger numbers of progeny isolates analysed using a range of genetic
r65
markers. In addition, it will also be important to determine the implications of having
resistant strains of different mating types present in vineyards.
The mode of action of the DMI fungicides has been studied widely, however,
further study is required, with regard to understanding the secondary mechanisms of action
that could affect the development of resistance. The DMIs are known to interact with the
haem of chytochrome P450s, in particular CYP51, however, another P450, sterol C-22-
desaturase (CYP61), has also been shown to be involved in azole resistance among isolates
of Candida glabrata (Lamb et aL,1999). Due to the various modes of action of the DMIs,
the development of resistance is likely to involve a number of different mechanisms,
including increased energy-dependent efflux of the fungicide, as discussed below. Whether
or not this and other mechanisms are active in U. necator in the vineyard is yet to be
known. It is possible that further mutations occur at other sites in the genome of DMI
resistant U. necator isolates, however, these may be associated with loss of fitness in a
field situation. For example, 11 point mutations were identified in benzimidazole resistant
laboratory mutants of B. cinerea but only two of these mutations were ever found in
isolates collected from the field.
Research into other mechanisms of resistance to DMI fungicides is in progress in
the field of human medicine, due to resistance associated with the use of the azole
antifungals in immuno-compromised patients. One such mechanism is that involving the
ATP-Binding-Cassette (ABC) transporters. These are membrane bound proteins which
occur in all living organisms and which are involved in the transport of compounds over
membranes using ATP. In filamentous fungi, resistance to fungicides has been associated
with increased energy-dependent efflux activity, resulting in decreased accumulation of the
fungicide in the cell and, consequently, decreased effective concentration at the target site
(De Waard,1997; Del Sorbo et a1.,1997; Nakaune et a1.,1998; Schoonbeek et a1.,1998).
t66
The transcription of two single-copy genes, designated atrA and atrB, encoding ABC
transporters in A. nidulans, was found to be strongly enhanced by treatment with several
compounds, including azole fungicides. In addition, an atrB transgene rendered
Saccharomyces cerevisiae resistant to azole fungicides (Del Sorbo et al., 1997).
Preliminary studies were conducted in this project to isolate these genes from U. necator.
Clones of these two genes isolated from A. nidulans and the PDRÍ gene of S. cerevisiae
were kindly provided by G. Del Sorbo (Institute of Plant Pathology, University of Naples
'Federico tr', Italy). DNA fragments from these genes were radioactively labelled and used
to probe a range of membranes containing restriction enzyme digested genomic DNA from
U. necator. However, due to time constraints this aspect of the project was not continued.
It is important to note that functional analysis of putative ABC genes may be difficult in U.
necator due to the obligately biotrophic nature of this fungus. However, Del Sorbo ¿r ø/.
(L997) have shown that this can be overcome with complementation studies using ^S.
cerevisiae. It is hoped that information gained from this preliminary study will assist
future researchers to determine if there are other mechanisms of resistance operating in U.
necator and other powdery mildews, in particular, in isolates exhibiting cross-resistance to
various DMIs. This may help to explain the possible polygenic nature of resistance
exhibited by U. necalor isolates toward DMI fungicides.
In summary, further development and commercialisation of the diagnostic test
developed in this study, to detect resistance of U. necator to DMIs in the vineyard, will
assist in developing different management strategies for this pathogen. It is important that
growers know that some strategies may reduce the risk of the development of practical
resistance in the vineyard including; the avoidance of repeated applications of the same
DMI fungicide, the use of integrated disease management, the use of non-chemical or

t61
biological control agents in rotation with DMIs and strict compliance with rates
recommended by the manufacturers.
168
CHAPTER 8.0
RnnnnBNCES
Adachi, Y., Watanabe, H. and Tsuge, T. (1996). Relationships between genetic
polymorphisms and fungicide resistance within Alternaria alternata. Phytopathology86:1248-1254.
Aloi, C., Gullino, M. L. and Garibaldi, A. (1991). Reduced sensitivity to fenarimol and
triadimefon in field populations of Uncinula necatrix. Pesticide Science 31: 114-116.
Altschul, S. F., Gish, W., Miller,'W., Myers, E. W. and Lipman, D. J. (1990). Basic localalignment search tool. Journal of Molecular Biology 215: 4O3-410.
Anderson, C. R. and'Wicks, T. J. (1993). Reduced control of powdery mildew (Uncinulanecator Schw.) when sterol demethylation inhibiting fungicides are mixed with cuprichydroxide. Australian Journal of Experimental Agriculture 33: 503-505.
Anderson, J. B. and Kohn, L. M. (1995). Clonality in soilborne, plant pathogenic fungiAnnual Review of Phytopathology 33 369-39I.
Andrade, A. C., Del Sorbo, G., van Nistelrooy, J. G. M. and De'Waard, M. A. (2000). TheABC transporter AtrB from Aspergillus nidulans mediates resistance to all majorclasses of fungicides and some natural toxic compounds. Microbiology 146: 1987-1997.
Anon. (1982). Recommended methods for the detection and measurement of resistance ofagricultural pests to pesticides. FAO Plant Protection Bulletin 30 36-7I,I4I-I43.
Anon. (1991). FRAC methods for monitoring fungicide resistance. EPPO Bulletin2l:29I-354.
Anon. (2000). Australian Bureau of Statistics, Catalogue No. 1329.0
Aoyama, Y., Noshiro, M., Gotoh, O., Imaoka, S., Funae, Y., Kurosawa, N., Horiuchi, T.and Yoshida, Y. (1996). Sterol l4-demethylase P450 (P450r¿ov) is one of the mostancient and conserved P450 species. Journal of Biochemistry Il9: 926-933.
Arnau, J., Housego, A. P. and Oliver, R. P. (1994). The use of RAPD markers in thegenetic analysis of the plant pathogenic fungus Cladosporium fulvum. CurrentGenetics 25:438-444.
Bao, F. (2000). Genotyping single nucleotide polymorphisms with molecular beacons.
Strategies Newsletter 13: 108-109.
r69
Barug, D. and Kerkenaar, A. (1979). Cross resistance of UV-induced mutants of Ustilagomaydis to various fungicides which interfere with ergosterol biosynthesis.
Mededelingen van Faculteit der Landbouwwetenschappen, Rijksuniversiteit Gent 4l:42r-427.
Blatter, R. H. E., Brown, J. K. M. and Wolfe, M. S. (1998). Genetic control of the
resistance of Erysiphe graminis f.sp. hordei to five tnazole fungicides. PlantPathology 47:570-579.
Bonnen, A. M. and Hopkins, C. (1997). Fungicide resistance and population variation inVerticillium fungicola, a pathogen of the button mushroom, Agaricus bisporus.
Mycolo gical Research l0l: 89-96.
Brent, K. J. (1986). Detection and monitoring of resistant forms: An overview. In:Pesticide resistance-strategies and tactics for management. NRC Board on Agriculture,National Academy Press, Washington DC. pp.298-312.
Brent, K. J. (1988). Monitoring for fungicide resistance. In: Fungicide resistance in NorthAmerica. Delp, C. J. (Ed.). APS Press, Minnesota. pp. 9-11.
Brent, K. J. (1995). Fungicide resistance in crop pathogens: how can it be managed. FRACMonograph No. 1.
Brent, K. J. and Hollomon, D. W. (1988). Risk of resistance against sterol biosynthesisinhibitors in plant protection. In: Sterol biosynthesis inhibitors: Pharmaceutical and
agrochemical aspects. Berg, D. and Plempel, M. (Eds.). Ellis Horwood Ltd,Chichester, England. pp. 332-346.
Brown, J. K. M. (1995). The choice of molecular marker methods for population genetic
studies of plant pathogens. New Phytologist 133: 183-195.
Brown, J. K. M., Jessop, A. C., Thomas, S. and Rezanoor, H. N. (1992). Genetic control ofthe response of Erysiphe graminis f. sp. hordei to ethirimol and triadimenol. PlantPathology 4l:126-135.
Brown, J. K. M., ODell, M., Simpson, C. G. and V/olfe, M. S. (1990). The use of DNApolymorphisms to test hypotheses about a population of Erysiphe gramims f. sp.
hordei. Plant Pathology 39: 39I-40I.
Buchenauer, H. (1987). Mechanisms of action of triazolyl fungicides and relatedcompounds. In: Modern selective fungicides. Lyr, H. (Ed.). VEB Gustav FischerVerlag, London. pp. 205-23I.
Bulit, J. and Laffon, R. (1978). Powdery mildew of the vine. In: The Powdery Mildews.Spencer, D. M. (Ed). Academic Press, New York.
Burden R. S., Cooke, D. T. and Carter, G. A. (1989). Inhibitors of sterol biosynthesis and
growth in plants and fungi. Phytochemistry 28: I79l-L804.
r70
Butter, J., Clark, J. and Hollomon, D. W. (1986). Recombination as a means of predictingfungicide resistance in barley powdery mildew. Proceedings of the 1986 British Crop
Protection Conference 2: 56I-565.
Cartolaro, P. and Steva, P. H. (1990).Control of powdery mildew infection in grapevine inthe laboratory: an essential step to study fungicide resistance. Phytoma 419:37-40.
Champe, S. W. andF,l-Zayat, A. A. E. (1989). Isolation of a sexual sporulation hormone
from Aspergillus nidulans. Journql of Bacteriology L7l: 3982-3988.
Chellemi, D. O. and Marois, J. J. (1991). Sporulation of Uncinula necator on grape leaves
as influenced by temperature and cultivar. Phytopathology 8I 197-20I.
Christiansen, S. K. and Giese, H. (1990). Genetic analysis of the obligate parasitic barleypowdery mildew fungus based on RFLP and virulence loci. Theoretical and AppliedGenetics 79:705-712.
Corio-Costet, M. F., Stievenard, C., Délye, C., Ronchi, V, and Douence, L. (1999). Whichmechanisms are involved in field resistance of grape powdery mildew to DMIfungicides? Proceedings of the First International Powdery Mildew Conference,Avignon, France. pp. 4L-42.
Cortesi, P., Gadoury, D. M., Seem, R. C. and Pearson, R. C. (1995). Distribution and
retention of cleistothecia of Uncinula necator on the bark of grapevines. PlantDisease 79: I5-I9.
Crisp, P., Scott, E. and Wicks, T. (2000). Towards the biological control of powderymildew of grapevines in cool climate viticulture in Australia. The AustralianGrapegrower and Winemaker 440: 27 -30.
Crute, I. R., Norwood, J. M. and Gordon, P. L. (1987). The occurrence, characteristics and
distribution in the United Kingdom of resistance to phenylamide in Bremia lactucae(lettuce downy mildew). Plant Pathology 36:297-3I5.
Curtis, H. and Barnes, S. N. (1989). The genetic basis of evolution. In: Biology, 5th Edn.
Worth Publishers, New York. pp.974-990.
De Waard, M. A. (1994). Resistance to fungicides which inhibit sterol l4cr-demethylation,an historical perspective. In: Fungicide resistance. Heaney, S., Slawson, D. 'W.,
Hollomon, D. 'W., Smith, M., Russell, P. E. and Parry, D. W. (Eds.). British CropProtection Council Monograph No. 60. Pp. 3-10.
De 'Waard, M. A. (1997). Significance of ABC transporters in fungicide sensitivity and
resistance. Pesticide Science 5l: 27 I-275.
De Waard, M. A. and Fuchs, A. (1982). Resistance to ergosterol biosynthesis inhibitors. II.Genetic and physiological aspects. In: Fungicide resistance in crop protection. Dekker,J. and Georgopoulos, S. G. (Eds.). PUDOC,'Wageningen, The Netherlands. pp. 87-100.
T7T
De Waard, M. A. and Gieskes, S. A. (1977). Charactenzation of fenarimol-resistantmutants of Aspergillus nidulqns. Netherlands Journal of Plant Pathology 83
supplement: I77-178.
De Waard, M. 4., Kipp, E. M. C., Horn, N. M. and van Nistelrooy, J. G. M. (1986).
Variation in sensitivity to fungicides which inhibit ergosterol biosynthesis in wheatpowdery mildew. Netherlands Journal of Plant Pathology 92: 2I-32.
De Waard, M. A. and van Nistelrooy, J. G. M. (1979). Mechanism of resistance tofenarimol in Aspergillus nidulans. Pesticide Biochemistry and Physiology l0: 2I9-229.
Dekker, J. (1982). Countermeasures for avoiding fungicide resistance. In: Fungicideresistance in crop protection. Dekker, J. and Georgopoulos, S. G. (Eds.). PUDOC,Wageningen, The Netherlands. pp. 177-186.
Del Sorbo, G., Andrade, A. C., van Nistelrooy, J. G. M., van Kan, J. A. L., Balzl, E. andDe Waard, M. A. (1997). Multidrug resistance in Aspergillus nidulans involves novelATP-binding cassette transporters. Molecular and General Genetics 254:417-426.
Delp, C. J. (1954). Effect of temperature and humidity on the grape powdery mildewfungus. Phytopathology 44 615-626.
Délye, C., Bousset, L. and Corio-Costet, M. (1998). PCR cloning and detection of pointmutations in the eburicol l4ø-demethylase (CYP51) gene from Erysiphe graminis f.sp. hordei, a "recalcitrant" fungus. Curuent Genetics 34 399-403.
Délye, C., Corio-Costet, M. and Laigret, F. (1995). A RAPD assay for strain typing of thebiotrophic grape powdery mildew fungus Uncinula necator using DNA extracted fromthe mycelium. Experimental Mycology 19: 234-237 .
Délye, C., Laigret, F. and Corio-Costet, M. (I997a). RAPD analysis provides insight intothe biology and epidemiology of Uncinula necator. Phytopathology 87:670-677.
Délye, C., Laigret, F. and Corio-Costet, M. (1997b). New tools for studying theepidemiology and resistance of grape powdery mildew to DMI fungicides. PesticideScience 5L:309-314.
Délye, C., Laigret, F. and Corio-Costet, M. (1997c). Cloning and sequence analysis of the
eburicol l4cr-demethylase gene of the obligate biotrophic grape powdery mildewfungus. Gene L95: 29-33.
Délye, C., Laigret F. and Corio-Costet, M. (1997d). A mutation in the l4cr-demethylasegene of Uncinula necator that correlates with resistance to a sterol biosynthesisinhibitor. Applied and Environmental Microbiology 63: 2966-2970.
r72
Délye, C., Ronchi, V., Laigret, F. and Corio-Costet, M. (1999). Nested allele-specific PCRprimers distinguish genetic groups of Uncinula necator. Applied and EnvironmentalMi crobiolo gy 65: 3950-3954.
Devereux, J., Haeberli, P., Smithies, O. (1984). A comprehensive set of sequence analysis
programs for VAX. Nucleic Acids Research 12:387-395
Diehl, H. J. and Heintz, C. (1987). Studies on the generative reproduction of grapevine
powdery mildew (Uncinula necator Berk.). Vitis 26: Il4-I22.
Doster, M. A. and Schnathorst, W. C. (1985). Comparative susceptibility of variousgrapevine cultivars to the powdery mildew fungus Uncinula necator. AmericanJournal of Enology and Viticulture 36: 101-104.
Doyle, J. J. and Doyle, J. L. (1980). Isolation of plant DNA from fresh tissue. Focus 12:
13-15.
Drenth, 4., Tas, I. C. Q. and Govers, F. (1994). DNA fingerprinting uncovers a new
sexually producing population of Phytophthora infestans in the Netherlands. European
Journal of Plant Pathology L00: 97-107.
Duncan, S., Barton, J. E. and O'Brien, P. A. (1993). Analysis of variation in isolates ofRhizoctonia solani by random amplified polymorphic DNA assay. MycologicalResearch 97 : 107 5-1082.
Dyer, P. S., Ingram, D. S. and Johnstone, K. (1993). Evidence for the involvement oflinoleic acid and other endogenous lipid factors in perithecial development of. Nectriahaemat o c o c c a mating population YI. My c ol o gi c aI Re s e arch 97 : 485 - 49 6.
Eckert, J. V/. (1987). Penicillium digitatum biotypes with reduced sensitivity to imazalilPhytopatholo gy 77 : 1728. (Abstract).
Elad, Y. (L992). Reduced sensitivity of Botrytis cinerea to two sterol biosynthesis-inhibiting fungicides: fenetrazole and fenethanll. Plant Pathology 4l:47-54.
Emmett, R. W., Clingeleffer, P. R.,'Wicks, T. J., Hall, D., Hart, K. M. and Clarke, K.(1994). Canopy management and disease control. The Australian Grapegrower and
Winemaker 369:22-24.
Emmett, R. 'W., Magarey, P. 4., Magarey, R. D., Biggins, L. and Clarke, K. (1992a).
Grapevine powdery mildew 1997-92. The Australian Grapegrower and Winemaker34:2I-23.
Emmett, R. W., Magarey, P. 4., Magarey, R. D., Biggins, L. and Wicks, T. J. (1992b).
Grape powdery mildew management - some key points to remember. The AustralianGrapegrower andWinemaker 345: 30.
173
Emmett, R. W., Wicks, T. J., Magarey, P. A. and Madge, D. G. (1990). Recent
developments in grapevine powdery mildew management. Australian and NewZealand Wine Industm Journal 5: 2I3-2I7 .
Emmett, R. W., Wicks, T.J. and McQuinn, D. (1984). Control of grapevine powderymildew in southeastern Australia: tr Evaluation of fungicides applied after infection.Agricultural Record 11: 16-18.
Erickson, E. O. and Wilcox, W. F. (1997). Distributions of sensitivities to three steroldemethylation inhibitor fungicides among populations of Uncinula necator sensitiveand resistant to triadim efon. Phytop atholo gy 87 : 7 84-7 9 l.
Evans, K. J. (1996). Characterization of Uncinula necator, the grapevine powdery mildewfungus. PhD Thesis, The University of Adelaide, South Australia.
Evans, K. J., Whisson, D. L. and Scott, E. S. (1996). An experimental system forcharactenzing isolates of Uncinula necator. Mycological Research I00:675-680.
Evans, K. J., Scott, E. S. and Whisson, D. L. (1997a). Heterothallism among South
Australian clonal lines of Uncinula necator. Australasian Plant Pathology 26: 10-20.
Evans, K. J., 'Whisson, D. L., Stummer, B. E. and Scott, E. S. (1997b). DNA markers
identify variation in Australian populations of Uncinula necator. MycologicalResearch l0l:923-932.
Falk, S. P., Gadoury, D. M., Cortesi, P., Pearson, R. C. and Seem, R. C. (1995b).
Parasitism of Uncinula necator cleistothecia by the mycoparasite Ampelomycesquisqualis. Phytopathology 85: 794-800.
Felsenstein, F. G. (1994). Sensitivity of Erysiphe graminis f.sp. tritici to demethylationinhibiting fungicides in Europe. In: Fungicide resistance. Heaney, S., Slawson, D. W.,Hollomon, D. W., Smith, M., Russell, P. E. and Parry, D. W. (Eds.). British CropProtection Council Monograph No. 60. Pp.35-42.
Fessler, C. and Kassemeyer, H. H. (1995). The influence of temperature during the
development of conidia on the germination of Uncinula necator. Vitis 34: 63-64.
Fletcher, J. S. and 'Wolfe, M. S. (1981). Insensitivity of Erysiphe graminis f.sp. hordei totriadimefon, triadimenol and other fungicides. Brighton Crop Protection Conference:Pests and Diseases 2:633-640.
Foster, L. M., Kozak, K. R., Loftus, M. G., Stevens, J. J. and Ross, I. K. (1993). Thepolymerase chain reaction and its application to filamentous fungi. MycologicalResearch 97:769-78I.
Fuchs, A. and Drandarevski, C. A. (1976). The likelihood of development of resistance tosystemic fungicides which inhibit ergosterol biosynthesis. Netherlands Journal ofPlant Pathology 82: 85-87.
174
Fuchs, 4., de Ruig, S. P., van Tuyl, J. M. and de Vries, F. W. (1977). Resistance to
triforine: a nonexistent problem? Netherlands Journal of Plant Pathology 83
supplement: 189-205.
Gadoury, D. M. and Pearson, R. C. (1988). Initiation, development, dispersal, and survivalof cleistothecia of Uncinula necator in New York vineyards. Phytopathology 78:
1413-1421.
Gadoury, D. M. and Pearson, R. C. (1990a). Germination of ascospores and infection ofVitis by Uncinula ne cator. Phytop atholo gy 80: 1 1 98- 1 203.
Gadoury, D. M. and Pearson, R. C. (1990b). Ascocarp dehiscence and ascospore discharge
in Uncinul a ne c at or. Phyt op athol o gy 80: 393 -401 .
Gadoury, D. M. and Pearson, R. C. (1991). Heterothallism and pathogenic specialization inUncinula ne cator. Phyt op atholo gy 8l 1287 -1293 .
Gadoury, D. M., Pearson, R. C., Riegel, D. G., Seem, R. C., Becker, C. M. and Pscheidt, J.
W. (1994). Reduction of powdery mildew and other diseases by over-the-trellisapplications of lime sulfur to dormant grapevines. Plant Disease 78: 83-87.
Gee, L. M., Stummer, B. E., Gadoury, D. M., Biggins, L. T. and Scott, E. S. (2000)
Maturation of cleistothecia of Uncinula necator (powdery mildew) and release ofascospores in southern Australia. Australian Journal of Grape and Wine Research 6:
13-20.
Georgopoulos, S. G. (I982a). Detection and measurement of fungicide resistance. In:
Fungicide resistance in crop protection. Dekker, J. and Georgopoulos, S. G. (Eds.).
PUDOC, Wageningen, The Netherlands. pp.24-3L
Georgopoulos, S. G. (1982b). Cross-resistance. In: Fungicide resistance in crop protection.
Dekker, J. and Georgopoulos, S. G. (Eds.). PUDOC, Wageningen, The Netherlands.pp.53-58.
Georgopoulos, S. G. (1987). The development of fungicide resistance. In: Populations ofplant pathogens-Their dynamics and Genetics. Wolfe, M. S. and Caten, C. E. (Eds.).
Blackwell, Oxford. pp. 239 -25I.
Georgopoulos, S. G. (1988). Genetics and population dynamics. In: Fungicide resistance inNorth America. Delp, C. J. (Ed.). APS Press, Minnesota. pp. I2-I3.
Gilpatrick, J. D. (1982). Case study 2: Venturia of pome fruits and Monilinia of stone
fruits. In: Fungicide resistance in crop protection. Dekker, J. and Georgopoulos, S. G.(Eds.). PUDOC, Wageningen, The Netherlands. pp. 195-206.
Gubler W. D., Ypema, H. L., Ouimette, D. G. and Bettiga, L. J. (1994). Resistance of(Jncinula necator to DMI fungicides in Californian vines. In: Fungicide Resistance.
Heaney, S., Slawson, D. 'W., Hollomon, D. W., Smith, M., Russell, P. E. and Parry, D.W. (Eds.). British Crop Protection Council Monograph No. 60. Pp. 19-25.

175
Gubler, W. D., Ypema, H. L., Ouimette, D. G. andBettiga,L.J. (1996). Occurrence ofresistance in Uncinula necator to triadimenol, myclobutanil, and fenarimol inCalifornian grapevines, Plant Disease 80: 902-909.
Hamamoto, H., Hasegawa, K., Nakaune.,Iæe, Y. J., Makizumi, Y., Akutsu, K. and Hibi, T.(2000). Tandem repeat of a transcriptional enhancer upstream of the sterol l4alpha-demethylase gene (CYP51) in Penicillium digitatum. Applied and EnvironmentalMicrobiology 8: 342I-3426.
Hargreaves, J. A. and Keon, J. P. R. (1996). Isolation of an Ustilago maydis ERGI I gene
and its expression in a mutant deficient in sterol l4cr-demethylase activity. FEMS
Microbiology Letters 139: 203-207 .
Heaney, S. P. and Hollomon, D. W. (1998). Molecular biology and resistance management.
Proceedings of the 7th International Congress of Plant Pathology, Edinburgh, Scotland.
9-16 August. Abstract 5.5.15.
Heller, A., Grossmann, F., Frenzel, B. and Hippe, S. (1990). A cytological study of the
development of Erysiphe graminis in its host barley, as influenced by the twofungicides ethirimol and propiconazole. Canadian Journal of Botany 68l.2618-2628.
Hermansen, A., Hannukkala, 4., Hafskjold Naerstad, R. and Brurberg, M.B. (2000).
Variation in populations of Phytophthora infestans in Finland and Norway: mating
type, metalaxyl resistance and virulence phenotypes. Plant Pathology 49: lI-22.
Hipp", S. (1987). Combined application of low temperature preparation and electronmicroscope autoradiography for the localization of systemic fungicides.Histochemistry 87 : 309-3 15.
Hollomon, D. W. (1981). Genetic control of ethirimol resistance in a natural population ofErysiphe graminis f . sp. hordei. Phytopathology 7I:536-540.
Hollomon, D. W. (1990). Molecular approaches to understanding the mechanisms offungicide resistance. Brighton Crop Protection Conference - Pests and Diseases, 1990.
pp. 881-888.
Hollomon, D. W. (1993). Resistance to azole fungicides in the field. Biochemical Society
Transactions 2l: 1047 -IO5l.
Hollomon, D. 'W., Butters, J. and Clark, J. (1984). Genetic control of triadimenol resistance
in barley powdery mildew. Proceedings of the L984 British Crop ProtectionConference 2:477-482.
Hollomon, D. W., Butters, J. and Hargreaves, J. A. (1990). Resistance to sterolbiosynthesis-inhibiting fungicides. In: Managing resistance to agrochemicals. Green,
M. B. and I-eBaron, H. M. and Moberg, W. K. (Eds.). American Chemical Society:
Washington. pp. 199-214.
r76
Hsiang, T., Yang, L. and Barton, W. (1997). Baseline sensitivities and cross-resistance todemethylation-inhibiting fungicides in Ontario isolates of Sclerotinia homeocarpa.European Journal of Plant Pathology 103: 409-416.
Hunter, T., Jordan, V. W. and Kendall, S. J. (1986). Fungicide sensitivity changes inRhynchosporium secalis in glasshouse experiments. British Crop ProtectionConference: Pests and Diseases 2: 523-536.
Iocco, P., Franks, T. and Thomas, M. R. (2001). Genetic transformation of major winegrape cultivars of Vitis viniþraL. Transgenic Research l0: 105-II2.
Kalamarakis, A. E., Demopoulos, V. P.,Ziogas, B. N. and Georgopoulos, S. G. (1989). Ahighly mutable major gene for triadimenol resistance in Nectria haematococca var.cucurbitae. Netherlands Journal of Plant Pathology 95: 109-120.
Kalamarakis, A. E., De Waard, M. A., V. P., Ziogas, B. N. and Georgopoulos, S. G.(1991). Resistance to fenarimol in Nectria haematococca var. cucurbitae. PesticideBiochemistry and Physiology 40: 212-220.
Kalb, V.F., Loper, J. C., Dey, C. R., Woods, C. W. and Sutter, T. R. (1986). Isolation of acytochrome P-450 structural gene from Saccharomyces cerevisiae. Gene 45l-237-245.
Karaoglanidis, G. S., Ioannidis, P. M. And Thanassoulopoulos, C. C. (2000). Reduced
sensitivity of Cercospora beticola isolates to sterol-demethylation-inhibitingfungicides. Plant Pathology 49 567 -572.
Kato, T. (1986). Sterol biosynthesis in fungi, a target for broad spectrum fungicides. In:Chemistry of plant protection, Vol. 1. Haug, H. and Hoffmann, H. (Eds.). Springer-Verlag, Berlin. pp. I-24.
Kendall, S. J., Hollomon, D. 'W., Cooke, L. R. and Jones, D. R. (1993). Changes insensitivity to DMI fungicides in Rhynchosporium secalis. Crop Protection 12:357-362.
Knudsen, I. M. B. and Skou, J. P. (1993). The effectivity of Tilletiopsis albescens inbiocontrol of powdery mildew. Annals of Applied Biology L23: 173-185.
Koenraadt, H. and Jones, A.L. (1992). The use of allele-specific oligonucleotide probes tocharacteize resistance to benomyl in field strains of Venturia inaequalis.Phytopathology 82: 1354-1358.
Köller, W. (1988). Sterol demethylation inhibitors: Mechanism of action and resistance. In:Fungicide resistance in North America. Delp, C. J. (Ed.). APS Press, Minnesota. pp.
79-88.
Köller, W. (1991). Fungicide resistance in plant pathogens. In: CRC handbook of pest
management in agriculture, Vol 2. 2"d ed. Pimentel, D. (Ed). CRC Press, Boca Raton,
Florida. pp.679-720.
t77
Köller, W., Parker, D. M. and Reynolds, K. L. (1991). Baseline sensitivities of Venturiainaequalis to sterol demethylation inhibitors. Plant Disease 75: 726-728.
Köller, W. and Scheinpflug, H. (1987). Fungal resistance to sterol biosynthesis inhibitors:A new challenge. Plant Disease 7l: 1066-1074.
Köller, W. and 'Wilcox, W. F. (1999). Evaluation of tactics for managing resistance ofVenturia inaequalis to sterol demethylation inhibitors. Plant Disease 83: 857-863.
Köller,'W., Wilcox,'W. F., Barnard, J., Jones, A. L. and Braun, P. G. (1997). Detection andquantification of resistance of Venturia inaequalis populations to sterol demethylationinhibitors. Phytopathology 87 : 184-190.
Lamb, D. C., Maspahys, S., Kelly, D. E., Manning, N. J., Geber, 4., Bennett, J. E. and
Kelly, S. E. (1999). Purification, reconstitution, and inhibition of cytochrome P-450sterol Delta(22)-desaturase from the pathogenic fungus Candida glabrata.Antimícrobial Agents and Chemotherapy 43:. 1725-t728.
I-einhos, G. M. E., Gold, R. E., Düggelin, M. and Guggenheim, R. (1997). Developmentand morphology of Uncinula necator following treatment with the fungicideskresoxim-methyl and penconazole. My colo gic aI Re s earch I0l: 1033 -1046.
kuy, L., Lee,I. and Hadidi, A. (1994). Simple and rapid preparation of infected planttissue extracts for PCR amplification of virus, viroid, and MLO nucleic acids. Journalof Virological Methods 49 295-304.
Löffler, J., Kelly, S. L., Hebart, H., Schumacher, U., Lass-Flörl, C. and Einsele, H. (1997).Molecular analysis of cyp5I from fluconazole-resistant Candída albicans strains.
FEMS Miuobíology Letters l5l: 263-268.
Luck, J. E. and Gillings, M. R. (1995). Rapid identification of benomyl resistant strains ofBotrytis cinerea using the polymerase chain reaction. Mycological Research 99:1483-1488.
Lyr, H. (1977). Mechanism of action of fungicides. In: Plant disease - An advancedtreatise, Vol 1. Horsfall, J. G. and Cowling, E. B. (Eds.). Academic Press, New York.pp.239-261.
Magarey, P. A. (1992). Softer strategies for diseases and pests of grapes. The AustralianGrapegrower and Winemaker 345: 37 -39.
Magarey, P. 4., Emmett, R. Vy'., Biggins, L. T., Clarke, K., Magarey, R. D., Wachtel, M.F., Masters, J. and Wilkins, B. J. (1992). sth Wine Industry Technical Conference,Melbourne, Victoria. 25 -29 October. Abstract.
Magarey, P. 4., Emmett, R.W., Gadoury, D.M., Biggins, L. T., Clarke, K., Magarey, R.D., Wachtel, M. F., Masters, J. and Wilkins, B. J. (1993). Cleistothecia as inoculumsources of grapevine powdery mildew (Uncinula necator) in Australia. Australian andNew Zealand Wine Industry Journal 8:239-241.
178
Marichal, P., Koymans, L., Willemsens, S., Bellens, D., Verhasselt, P., Luyten, W.,Borgers, M., Ramaekers, F. C. S., Odds, F. C. and Bossche, H. V. (1999). Contributionof mutations in the cytochrome P450 l4alpha-demethylase (Ergllp, Cyp5lp) to azole
resistance in C andida albic ans. Microbiolo gy I45: 27 0I -27 13.
McDermott, J. M., Brändle, U., Dutly, F., Haemmerli, U. A., Keller, S., Müller, K. E. and'Wolfe, M. S. (1994). Genetic variation in powdery mildew of barley: development ofRAPD, SCAR, and VNTR markers. Phytopathology 84: 1316-132I.
McDonald, B. A. and McDermott, J. M. (1993). Population genetics of plant pathogenic
fungi. BioScience 43: 311-319.
Mercer, E. L (1934). The biosynthesis of ergosterol. Pesticide Science L5: 133-155
Messing, J. (1983). New M13 vectors for cloning. Methods in Enzymology l0t: 20-78.
Miazzi, M., Natale, P., Pollastro, S. and Faretra, F. (1997). Handling of the biotrophic plantpathogen Uncinula necator (Sch.) Burr. under laboratory conditions and observations
on its mating system. Journal of Plant PathologyTS:71-77.
Michelmore, R. W. and Hulbert, S. H. (1987). Molecular markers for genetic analysis ofphytopathogenic fungi. Annual Review of Phytopathology 25:383-404.
Minafra, 4., Hadidi, A. and Martelli, G.P. (L992). Detection of grapevine closterovirus Ain infected grapevine tissue by reverse transcription-polymerase chain reaction. Vitis31.:221-227.
Mizubuti, E. S. G. and Fry, W. E. (1998). Temperature effects on developmental stages ofisolates from three clonal lineages of Phytophthora infestans. Phytopathology 88:
837-843.
Mohler, V. and Jahoor, A. (1996). Allele-specific amplification of polymorphic sites forthe detection of powdery mildew resistance loci in cereals. Theoretical and AppliedGenetics 93: 1078-1082.
Murashige, T. and Skoog, K. (1962). A revised medium for rapid growth and bioassays
with tobacco tissue cultures. Physiologia Plantarum 15:473-497.
Nakaune, R., Adachi, K., Nawat4, O., Tomiyama, M., Akutsu, K. and Hibi, T. (1998). Anovel ATP-binding cassette transporter involved in multidrug resistance in the
phytopathogenic fungus Penicillium digitatum. Applied and EnvironmentalMicrobiolo gy 64 3983-3988.
Nass, B. (1991). The determination of baseline sensitivities of Uncinula necator (Schw.)
Burr. to sterol demethylation inhibitors. Masters Thesis, Lincoln University, NewZealand.
179
Nelson, D. R., Kamataki, T., Waxman, D. J., Guengerich, F. P., Estabrook, R. W.,Feyereisen, R., Gonzalez,F. J., Coon, M. J., Gunsalus,I. C., Gotoh, O., Okuda, K. and
Nebert, D. \ry. (1993). The F450 superfamily: update on new sequences, gene
mapping, accession numbers, early trivial names of enzymes and nomenclature. DNACelI Biology t2: I-5I.
Northover, J. and Schneider, K. E. (1996). Physical modes of action of petroleum and plant
oils on powdery and downy mildew of grapevines. Plant Disease 80: 545-550.
ODell, M., Wolfe, M. S., Flavell, R. 8., Simpson, C. G. and Summers, R. W. (1989).
Molecular variation in populations of Erysiphe graminis on barley, oats and rye. PlantPathology 38:340-351.
Ogawa, J. M., Gubler, W. D. and Manji, B. T. (1988). Effect of sterol biosynthesisinhibitors on diseases of stone fruits and grapes in California. In: Sterol biosynthesisinhibitors: pharmaceutical and agrochemical aspects. Berg, D. and Plempel, M. (Eds.).
Ellis Horwood Ltd., Chichester, England. pp.262-287 .
Olmo, H. P. (1986). The potential role of (vinifera x rotundiþlia) hybnds in grape varietyimprovement. Experimentia 42: 92I.
Olsen, M., Hood, L., Cantor, C. and Botstein, D. (1989). A common language for physical
mapping of the human genome. Science 245: 1434-1435.
Oritz de Montellano, P. R. (1986). Oxygen activation and transfer. In: Cytochrome P-450-structure, mechanism and biochemistry. Oritz de Montellano, P. R. (Ed.). PlenumPress, New York. pp. 217 -27 I.
Pearson, R. C. and Gadoury, D. M. (1987). Cleistothecia, the primary inoculum for grape
powdery mildew in New York. Phytopathology 77:1509-1514.
Pearson, R. C. and Gadoury, D. M. (1992). Powdery mildew of grape. In: Plant diseases ofinternational importance. Kumar, J., Chaube, H.S., Singh, U.S., Mukhopodhyay, A.N.(Eds.). Prentice Hall, New Jersey. pp.129-146.
Pearson, R. C. and Glirtel, W. (1985). Occurrence of hyphae of Uncinula necator in buds
of grapevine. Plant Dísease 69: L49-151.
Pearson, R. C. and Goheen, A. C. (1988). Compendium of grape diseases. APS Press, St.
Paul, Minnesota.
Peever, T. L. and Milgroom, M. G. (1992). Inheritance of triadimenol resistance inPyrenophora tere s. Phyt opatholo gy 82: 82L -828.
Peever, T. L. and Milgroom, M. G. (1993). Genetic correlations in resistance to sterol
biosynthesis-inhibiting fungicides in Pyrenophora teres. Phytopathology 83: 1076-
1082.
180
Pontzen, R. and Scheinpflug, H. (1989). Effects of triazole fungicides on sterolbiosynthesis during spore germination of Botrytis cinerea, Venturia inaequalis and
Puccinia graminis f . sp. tritici. Netherlands Journal of Plant Pathology 95: 151-160.
Pool, R. M., Pearson, R. C., Welser, M. J., Lakso, A. N. and Seem, R. C. (1984). Influence
of powdery mildew on yield and growth of Rosette grapevines. Plant Disease 68:
590-593.
Poulos, T. K., Finzel, B. C., Gunsalus, I. C., Wagner, G. C. and Kraut, J. C. (1986). The
2.6-Å, crystal structure of Pseudomonas putida cytochrome P450. Journal ofBiological Chemistry 260 16122-16130.
Ragsdale, N. N. (1975). Specific effects of triarimol on sterol biosynthesis in Ustilagomaydis. Biochemistry and Biophysics Acta 380:81-96.
Redl, H. and Steinkellner, S. (1996). Nachweis einer sensitivitätsverminderung von oidiumgegenüber DMl-fungiziden in österreichischen weinbau. Mitteilungen Klosterneuburg46: 181-188.
Reuveni, M. and Reuveni, R. (1995). Efficacy of foliar application of phosphates incontrolling powdery mildew fungus on field-grown winegrapes: effects on cluster yieldand peroxidase activity in berries. Journal of Phytopathology 143: 2I-25.
Reynolds, A. G., Veto, L. J., Sholberg, P. L.,'Wandle, D. A. and Haag, P. (1996). Use ofpotassium silicate for the control of powdery mildew lUncinula necator (Schwein)
Burrilll on Vitis viniþra L cultivar Bacchus. American Journal of Enology andViticulture 47 : 421-428.
Rumbolz, J., Kassemeyer, H. H., Steinmetz,Y., Deising, H. B., Mendgen, K., Mathys, S.,
Wirtz, S. and Guggenheiffi, R. (2000). Differentiation of infection structures of the
powdery mildew fungus Uncinula necator and adhesion to the host cuticle. CanadianJournal of Botany 78: 409-421.
Sall, M. A. and Teviotdale, B. L. (1981). Powdery mildew. In: Grape pest management.
Flaherty, D.L., Jensen, F.L., Kasimatis, 4.N., Kido, H. and Moller, W.J. (Eds.).
University of California.
Sall, M. A. and Wrysinski, J. (1982). Perennation of powdery mildew in buds ofgrapevines . Plant Disease 66: 678-679.
Sambrook J, Fritsch, E. F. and Maniatis, T. (1989). Molecular cloning: A laboratorymanual. 2"d ed. Cold Spring Harbor Laboratory Press: Cold Spring Harbor, New York.
Sanglard, D., Ischer, F., Koymans, L. and Bille, J. (1998). Amino acid substitutions in the
cytochrome P450 lanosterol 14ø-demethylase (CYP51A1) from azole-resistantCandida albicans clinical isolates contribute to resistance to antifungal agents.
Antimicrobial Agents and Chemotherapy 42: 241-253.
181
Scheinpflug, H. (1988). Resistance management strategies for using DMI fungicides. In:Fungicide resistance in crop protection. Dekker, J. and Georgopoulos, S. G. (Eds.).
PUDOC, Wageningen, The Netherlands. pp. 93-94.
Schepers, H. T. A. M. (1983). Decreased sensitivity of Sphaerotheca fuliginea to
fungicides which inhibit ergosterol biosynthesis. Netherlands Journal of PlantPathology 89: 185-187.
Schepers, H. T. A. M. (1984). Resistance to inhibitors of sterol biosynthesis in cucumber
powdery mildew. Proceedings of the British Crop Protection Conference 2: 495-496.
Schnathorst, V/. C. (1965). Environmental relationships in the powdery mildews. AnnualReview of Phytopathology 3: 343-366.
Schoonbeek, H., Del Sorbo, G. and De Waard, M. A. (1998). The role of ABC transporters
in pathogenesis of Botrytis cinerea.In: Modern fungicides and antifungal compoundsn.-I2th International Reinhardsbrunn Symposium Mray 24'h-29th, 1988, Germany. Lyr,H., Russell, P.E., Dehne, H. W. and Sisler, H. D. (Eds.). pp.I43-I49.
Shaw, M. W. and Pijls, C. F. N. (1994). The effect of reduced dose on the evolution ofresistance in Septoria tritici.In: Fungicide resistance. Heaney, S., Slawson, D. W.,Hollomon, D. W., Smith, M., Russell, P. E. and Parry, D. W. (Eds.). British CropProtection Council Monograph No. 60. Pp.47-54.
Sheridan, J. E., Grbavac, N. and Sheridan, M. H. (1985). Triadimenol insensitivity inPyrenophora teres. Transactions of the British Mycological Society 85: 338-341.
Sholberg, P. L. and Haag, P. D. (1993). Sensitivity of Venturia inaequalis isolates fromBritish Columbia to flusilazole and myclobutanil. Canadian Journal of PlantPathology 15:102-IO6.
Siebels, C. and Mendgen, K. (1994). A microscopic evaluation of the sensitivity ofVenturia inaequalis populations to sterol demethylation inhibitors. MycologicalResearch 98:619-624.
Siegel, M. R., Kerkenaar, A. and Kaars Sijpesteijn, A. (1977). Antifungal activity of the
systemic fungicide imazalil. Netherlands Journal of Plant Pathology 835.1: I2l-133.
Sisler, H. D. and Ragsdale, N.N. (1984). Biochemical and cellular aspects of the antifungalaction of ergosterol biosynthesis inhibitors. Mode of action of antifungal agents.
Trinci, A. P. J. and Ryley, J. F. (Eds.). Cambridge University Press, Cambridge. pp.
257-282.
Sivapalan, A. (1993). Effects of water on germination of powdery mildew conidia.Mycological Research 97 : 7 I-76.
Smith, C. G. (1970). Production of powdery mildew cleistocarps in a controlledenvironment. Transactions of the British Mycological Society. 55: 355-365.
r82
Smith, F. D. and Köller, W. (1990). The expression of resistance of Ustílago avenae to the
sterol demethylation inhibitor triadimenol is an induced response. Phytopathology 80:584-590.
Smolka, S. and Wolf, J. (1986). Cytological studies on the mode of action of systemicfungicides on the host pathogen complex barley-powdery mildew (Erysiphe graminisf . sp. hordel Marchal). Pesticide Science 17:249-255.
Sommer, S. S., Groszbach, A. R. and Bottema, C. D. K. (1992). PCR amplification ofspecific alleles (PASA) is a general method for rapidly detecting known single-base
changes. BioTechniques 12: 82-87 .
Sommer, R. and Tautz, D. (1989). Minimal homology requirements for PCR primers.Nucleic Acids Research 17:6749.
Stanis, V. F. and Jones, A. L. (1985). Reduced sensitivity to sterol-inhibiting fungicides infield isolates of Venturia inaequalis. Phytopathology 75: 1098-1101.
Staub, T. and Sozzi, D. (1984). Fungicide resistance: a continuing challenge. Plant Disease
68: 1026-1031.
Steden, C., Forster, B. and Steva, H. (1994). Sensitivity of Uncinula necator topenconazole in European countries. In: Fungicide resistance. Heaney, S., Slawson, D.W., Hollomon, D. W., Smith, M., Russell, P. E. and Parry, D. W. (Eds.).British CropProtection Council Monograph No. 60. pp. 97-101.
Steva, H. (1994). Evaluating anti-resistance strategies for control of Uncinula necator.In:Fungicide resistance. Heaney, S., Slawson, D. W., Hollomon, D. W., Smith, M.,Russell, P. E. and Parry, D. W. (Eds.). British Crop Protection Council MonographNo. 60. Pp. 59-66.
Steva, H., Cartolaro, P., Clerjeau, M., Lafon, R. and Gomes da Silva, M. T. (1988). Unerésistance de l'oidium au Portugal? Phytoma 402:49-50.
Steva, H., Cartolaro, P., Clerjeau, M. and Lafon, R. (1989). Premier cas de résistance de
I'oidium à un traitement fongicide. Vitis 137: 124-125.
Steva, H., Cartolaro, P. and Gomes da Silva, M. T. (1990). Tolerance of powdery mildewof SBI fungicides: situation for 1989. Phytoma 419: 4l-44.
Stummer, B. E., Zanker, T., Scott, E. S. andWhisson, D. L. (2000). Genetic diversity inpopulations of Uncinula necator: comparison of RFLP- and PCR-based approaches.Mycological Research I04: 44-52.
Szkolnik, M. (1983). Unique vapour activity by GCA-64d25I (Vangard) in the control ofpowdery mildews roomwide in the greenhouse. Plant Disease 67:360-366.
183
Taylor, F. R., Rodriguez, R. J. and Parks, L. W. (1983). Requirement for a second sterolbiosynthetic mutation for viability of a sterol C-I4 demethylation defect inSaccharomyc e s c erevisiae. J ournal of B act eriolo gy 155 : 64-68.
van der Vlugt-Bergmans, C. J. 8., Brandwagt,8.F., Vant Klooster, J. W., Wagemakers, C.
A. M. and van Kan, J. A. L. (1993). Genetic variation and segregation of DNApolymorphisms in Botrytis cínerea. Mycological Research 97:- Il93-I200.
van Nistelrooy, J. G. M., van den Brink, J. M., van Kan, J. A. L., van Gorcoffi, R.F. M.and M. A. de Waard. (1996). Isolation and molecular characterisation of the gene
encoding eburicol l4c-demethylase (CYP51) from Penicillium italicum. Molecularand General Genetics 250:725-733.
van Tuyl, J.M. (1977). Pathogenicity of fungi resistant to systemic fungicides. In: Genetics
of fungal resistance to systemic fungicides. Veenman, H. and Zonen, B. V. (Eds.).
Wageningen, The Netherlands.
Vanden Bossche, H. (1985). Biochemical targets for antifungal azole derivativesHypothesis on the mode of action. Current Topics in Medical Mycology 1: 313-351.
Wade, M. (1988). Strategies for preventing or delaying the onset of resistance to fungicidesand for managing resistance occuffences. In: Fungicide resistance in North America.Delp, C. J. (Ed.). APS Press, Minnesota. pp. 14-15.
Walsh, R. C. and Sisler, H. D. (1982). A mutant of Ustilago maydis deficient in C-14demethylation: Characteristics and sensitivity to inhibitors of ergosterol biosynthesis.P e sticíde B io chemistry and Phy siolo gy 18: 122-13 L.
Wellmann, H., Schauz, K. and Tiemann, R. (1996). Resistance to sterol demethylationinhibitors in Ustilago maydis. fi. Cross-resistance patterns and sterol analyses.
Pesticide Science 48: 239-246.
'Welsh, J. and McClelland, M. (1990). Fingerprinting genomes using PCR with arbitraryprimers. Nucleic Acids Research 18: 7213-7218.
Wheeler, I., Kendall, S., Butters, J. and Hollomon, D. W. (1994). Rapid detection ofbenzimidazole resistance in Rhynchosporium secalis using allele-specificoligonucleotide probes. In: Fungicide resistance. Heaney, S., Slawson, D. W.,Hollomon, D. W., Smith, M., Russell, P. E, and Parry, D. W. (Eds.). British CropProtection Council Monograph No. 60. pp.259-264.
'Wicks, T. J., Emmett, R. W. and Anderson, C. A. (1997).Integration of DMI fungicidesand sulfur for the control of powdery mildew. Australian and New Zealand Wine
Industry Journal 12: 280-282.
'Wicks, T. J., Emmett, R. W., Magarey, P.A. and Fletcher, G. C. (1984). Control ofgrapevine powdery mildew in southeastern Australia: I. Evaluation of protectant spray
programmes. Agricultural Record ll: I2-I5.
184
'Wicks, T. and Hitch, C. (1998). The use of oils in the control of powdery mlldew. The
Aust ralian Grap e grow er and Wínemaker 419 : 23 -25 .
Wicks, T. J. and Magarey, P. (1985). First report of Uncinula necator cleistothecia on
grapevines in Australia. Plant Disease 69:727.
Williams, J. K. G., Kubelik, A. R., Livak, K. J., Rafalski, J. A. and Tingey, S. V. (1990).
DNA polymorphisms amplified by arbitrary primers are useful as genetic markers.
Nucleic Acids Research 18: 6531-6535.
Winter, E. and Anderson, C. (1998). A new approach to control grapevine powderymildew. The Australian Grape grow er and Winemaker 417 : 83-86.
'Wolfe, M. S. (1985). Dynamics of the response of barley powdery mildew to the use ofsterol synthesis inhibitors. EPPO Bulletin 15 45L-457.
Yamamoto, T., Iketani, H., Ieki, H., Nishizawa, Y., Notsuka, K., Hibi, T., Hayashi, T. andMatsuta. (2000). Transgenic grapevine plants expressing a rice chitinase withenhanced resistance to fungal pathogens. Plant CelI Reports 19 639-646.
Yarwood, C. E. (1978). History and taxonomy. In: The Powdery Mildews. D. M. Spencers(Ed.). Academic Press, London. pp.I-37.
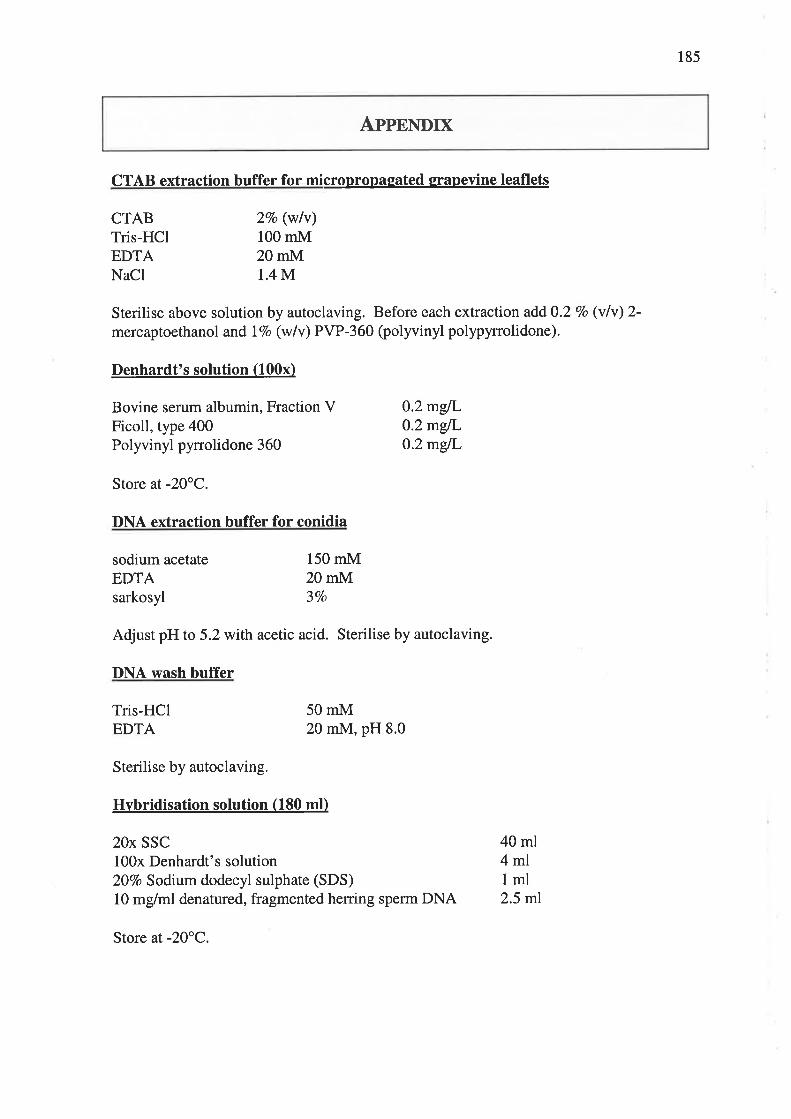
185
Appn¡rorx
CTAB extraction buffer for micropropagated qrapevine leaflets
Sterilise above solution by autoclaving. Before each extraction add O.2 7o (vlv) 2-
mercaptoethanol and I7o (w/v) PVP-360 (polyvinyl polypynolidone).
Denhardt's solution (100x)
CTABTris-HClEDTANaCl
sodium acetateEDTAsarkosyl
27o (wlv)100 mM20 mM1.4 M
Bovine serum albumin, Fraction VFicoll, type 400Polyvinyl pyrrolidone 360
Store at -20oC.
DNA extraction buffer for conidia
O.2 mgll,0.2mglL0.2 mglL
Adjust pH to 5.2 with acetic acid. Sterilise by autoclaving.
DNA wash buffer
150 mM20 mM37o
50 mM20 mM, pH 8.0
Tris-HClEDTA
Sterilise by autoclaving.
Hvbridisation solution (180 ml)
20x SSC100x Denhardt's solution207o Soditm dodecyl sulphate (SDS)
10 mg/ml denatured, fragmented herring spefln DNA
40 ml4ml1ml2.5 ml
Store at -20"C.
186
LB asar (1L)
Bacto@-TryptoneBacto@-Yeast ExtractBacto@-AgarNaCl
1og5g15g5g
Adjust pH to 7.0 with NaOH. Sterilise by autoclaving.
Losistic analvsis (Genstat 5, Lawes Agricultural Trust, Hertfordshire, England)
job'bioassayX'output [w=80;prin=*] 1
units [X]fileread [name='bioassayX.txt' ; skíp= 1 ] conc,n,X;fgr=nopointer [val=X] scorefor sc=scorecalc prop-sc/ncalc lnconc=log(conc+O.00 1 )graph [nr=20;nc=50] sc;lnconcprint sc,lnconc,conc,prop,nmodel prop;res=r;fit=fterms lnconc,concfitcurve [curve=logistic] lnconcgraph lnr20;nc=501 f,prop;lnconc;meth=l,pgraph [nr=20;nc=50] r;fprobitanalysis [trans=logit;ld= !(50)] sc; dose=lnconc; bin=nendforstop
Pre-hvbridisation solution (200 ml)
20x SSC100x Denhardts solution2OVo Sodium dodecyl sulphate (SDS)
10 mg/ml denatured, fragmented herring sperm DNA
Store at -20"C.
pUCL9 specific olieolabelline buffer
d(ATP, GTP, TTP)Tris-HCl, p}l7.6Sodium chlorideMagnesium chlorideAcetylated DNAase-free bovine serum albumin, Fraction V
40 ml10 ml1ml2.5 ml
20 pM50 mM50 mM10 mM100 pglml
Prepared as a2x solution and stored at -20"C
187
pUCL9 specific primers
primer 1 = 5'ACAGCTATGACCATG 3'primer 2 = S'TMCCAGTMACGACGT 3'
Coarse pine bark (4 to 6 mm)Sharp white sand (Golden Grove)Mt Compass sand, sterilised and cooled
Fertilisers for 100 L of soil mixOsmocote (long life + trace elements)DolomiteLimeGypsumIron sulphate
Tris-acetate-EDTA (TAE) buffer
4 ngl¡tl4 nglþl
Each primer prepared as a 0.1 ttdt;'J solution and stored at -20oC.
Pottine mix for erapevines (550 L)
367 L92L92L
2200 g550 g225 g))\ o
99e
Adjust pH to 7.8 with acetic acid. Store at 4"C.
Tris-EDTA (TE) buffer
Adjust pH to 8.0. Sterilise by autoclaving.
Tris-borate-EDTA (TBE) buffer
TrisSodium acetateEDTA
Tris-HClEDTA
Tris-borateEDTA
Bacto@-TryptoneBacto@-Yeast ExtractNaClKzHPO¿
10 mM1mM
45 mM1mM
40 mM20 mM1mM
L6e16e\o
2.5 e
Adjust pH to 8.0. Sterilise by autoclaving.
TYP broth (1 L)
GCGFASTA
Currently in Directory -wari07ss
sequence in GCG lormal tbr marked -... recoros Ìo
Create a list file as : when writing sequences.
Page I of2
-wari07ss
Thert-t-rrt-rrrrrrt-t-t-l-rrrrf-1-
rIrr
l¡est scores are
genpro : aac4 98 11
genpro:aac49g12
gerlpro : aeq 4-9_qU fqerrprc : êÊdl5 rl5genpro: aaf85933
genpro : _aag]9413
çenirro:aaq1B43¿
genpro : êqgl9 !11genpro : aasiû 4-3..5
g€nprc: aac{18 43 4
genilro: aagl!1!3 íg-errprL): aaq181il8
genpro: aaq1343Z
genpro: aaq44331
qpweek: aaql!!8 !qptreek: aag4433Ü
ç¡pr.;eek : aag44E32
genprc:aag44S30.--+10t.aal
9 ClrF'r,f . ddL L ) t t ,
g¡rwee k: aa f 18 4 6 9
genpro : aa144832
qrpweek: aaf 18 4 69
rJenpro : aBÉr3é 6¿
genpr o:bal¡O3659
gerLpro:þabC3658
..21 76
111^
. .21L-3
)1t',q
1 ) C)
1)q,
1 J O)
1 I O'
..L29L1 a tf-i
. .I2e"'7
i: ?:
".7287CAA
.. 91 4
q1 a
cìf /
91 4
),-4
a-l A
c)1 a
970
91 0
tl1 6
-1 ì1 rì
. .lJû3
431
A1'1
465
. - Ath
.. 465
A í,)
init-1
21 16
21 16
21 !3
2l û5
L991
7946
i946
Ì946
1945
t94r1936
7932
7641
16 4i
164,1
1641
1641
1 ,a li-
r641
7641
L63Z
r632
13 92
1 1.i)
1332
L252
7201
1202
i202
12AI
r199
Uncinula necator eburicol C14-alpha-derne.
Uncinula necator eburicol i4-alpha-ciemet.
Uncinuia rlecator eburicoi Ì4-aipha demet.
Urrcinufa necator GNE11 eburicoi 14-alpha.
Botryotinia fuckeliana eburicol 14 a1pha.
Botryotinia fuckeliana strain 715 eb'uric.
Bcl--ryc¡ti nj a fuc,r.-ef iana si-rain 61? el-rtrlic.
Bctryotinia fucketiana strain 619 eburic.
B¿tr-;o-rinia iuci,etiana strain 799 eburic.
eotriotinia t-ucl<eiiana strain f74 ebu.ric.
Botryctinia fuci<ellana strain 971 eburic.
Botryotiiria fr:ckeliana strai¡-r 637 el-ruric.
Botryotinia fuckeliana strain 1260 eburi.
MolLisia yallundae isofate 22-433 eburic.
Ta¡resi a yallunclae lsol ate 22-433 ehrrrrc¡.
Tapesia yalluncÌae isolate PRll eburicol
Tapesia yallur-rCae isolate Li-3-13 eburic.
ÞIol-lisia yallunclae isolate PRli eburiccÌ.i.IcÌlisia Taliun.lae eburícol l4 alpha-dein,
Tapesla y;rlÌundae eburicol 14 aÌpha-Ceme.
Mollisia yallundae isolate 7L-3-I8 eburi.
Tapesia acuformis eburicol 14 aÌpha-deme.
lulcll isia acufcrmis ehuli ccÌ 14 .ei¡:l'1,:r-,-leln.
Penicilrium dlgítatuÌn PDCYP5l gene for c.
Penicillium digitatun PDCYPSI gene for c.
AspergiÌlus fumígatus cytochrcne P45û st.Blui¡,eria graminis f . sp. hordei ei¡u¡ico.S.¡;cmbe chrcnoscme I ccsmiC c13411
Candida tropicalis (ATCC 750) cytochrome.
Candida afbicans ERG16 gene for cytochro.
CanCiCa aliricans si-rajn ATrIC 44353 cytoc.
CancÌicÌa albicans strain ATCí: 2e576 cVtoc.
CanctiCa albicans ger-re fcr CYP5l va::j-arLt1.
initr21 r6)a 1 â
21 û5
20 49
1936
i9g6
l-936
1985
1 q:l h
19.1 6
7965
1969
L9 ÕY
r9't 0
i9?0
197û
1964
1964
791 0
7954
1954
115S1
1681
1 Ácì I
i 413
7331
r304
i3() 4
1303
i3u. I
genpr ^. --ttaaaa
ro:Ìral¡03399
f n.np.o : aacg'l F (.;6
f qenpr-c:caa9O3O3
l- genpro: aaaS3234
f genpro:caa31658
genpro: aaf t10598
genpro: aaf00597
rt-r genp
http.//wwr,.angis.org.a.../BLAST FASTAu,ariO7ss98578589683 3312988281259758 html#SCOR 28/03/01
GCGFASTA
g enp
qenp
Page2 oï'2
rt-rt-rrrt-rt-ft-rrrt-rt-rt-rr
qenpro:aafO0600
genpro:aafC0599
qerLp ro : aaf00 602
genpro: aaf 0O tiQ3
genpro:bab03401_
gÐnLrr.i: aaf 00601
genpro:babû3400
Carrc.licla albicans strain 859630 cytoehrom.. .
Can':jiCa albi cans strai n ß5tt':l cycochrom. . .
Canclida ¡rÌbicans st-rain,l9130A4/I cytcch...
Candida albicans strain 64Og/g cytochrom...
Candlda albicans gene for CYP51 variant . ..
Can,lida ali¡icans strain i\TCPF 3363 cytcch. . .
Candida aLbicans gene for CYP51 variant .. .
Ttsper<¡illus nidulans cytochrone P450 ste. . .
Þfycosphaerella graminicola eburicol'I4-a. . .
UstilaEc rnaydis ergll gene for sterol 14...
cyiochrome F-450 f arrcsterol-al¡;ha-cìemei-h. . .
Venturia inaequalis strain Ent54 14-a de...
Venturia inaequalis strain EnL2l 14 alph...
Venturia inaequalls strain F445 -14-a clern. . .
P.ítalicum CYF5I gene fo:: cytcchrome P-451;
FiLobaslciielia neoforfrarìs vâr. neoforman. . .
Candida glabrata ERG11 gene, complete cds
Cunninghamella eleEans cytochroiûe P.i5û (. . .
Yeast (S.cere-.risiae) cytocLrrome P45ll ¡¡i+-.,.
Yeast (S.cerevisiae) cytochrome P450 wit...
Saccharomyces cerevislae chromosome VIII...
Saccha-ror,Lyces cerevislae lancs+,-eroi -i4-a, . .
Sus scrofa CYP5I gene for ianosterol 14 ...
Sus scrcfa rrRlJA for lanc'steroi i4-demeth...
cytcchrcne P-450 lanosterol-alpha-clemeth. . .
HirrrLdn Iancstei:rf i4-der.cthylase cytcchrc. . .
Human mRItrF, for lancsieroÌ 14-denethylase.,.
Human BAC clone RG161K23 lrom 7c42I¡ comp...
Homo sapiens fanosterol 14-alpha demethy...
Ra+- DNA f cr Ìanostercl 14-denethryJ-ase, c. . .
Rattus sp. mRL:lA for cytochi:ome E-450 I4,D.. -
Rattus norvegicus lanosterol 14-alpfia-cie...
Þfus rnusc,J.Ius lanosterol 14-alpha-demethlz. . .
l-{us musculus lanosrerol 14-alpha-deinethy. . .
Sus scrof a lanosterr:l i4-cìemei-hylase (CT. , .
Píchla anomala cytochrome P450 L1A1 deme...
Candlda parapsilosis cytochrome P450 L1Ä....
46C
460
4b2
451
451
4 55
715
501
420
9't 3
913
91 3
949
640
35b
tr1f,
51 5
EAE
51 5
561
242
242
242
242
253
/.4 -t
253
243
196
264
334
r79i1I91
71_96
4194
L194
1 I O?
L18 2
113 ¿
10 60
1034
994
913
91 3
91 3
9q9
941
196
tal)
160
160
l6a
633
CCr-)
669
651
651
651
646
640
640
€44
632
632
6i7q0)
556
7299
12 93
1 296
1296
7295
genpro:aaf74756. -. --ao^t a a
!jErrp!u.Lddúrl ¡ u
genpro ¿¿t) 1. oÕ\)
genpro : aaf1 7Q93
genpro : aafl 6464
genirr D : eaÍ_1_!291
genpro:caa89324
ro: aaî] 920 4
--,^^ç)l-')aa
ro: a.ia343?-o
-.^.^-çat1Ea^l
163r-l n )'-l
it291,1 43
r1 43
Li 43
L628
L¿Zq
1:r40
LL34
73 ¿12
1-3 47
1342
L342
t18114
119 4
'1 tr,)
152
152
143
i15
115
ilL
110
690
164
568
gênpro: aab0232 9_
genpro zaaf2O263
gerrl)r c: aaa34546
genpro :4aa3454'7
qenpro : aab68 433
l- genpro
|_ gerrpr:o
f genpro
l- genprro
f gerrpro
f senprol- genpro
f ge.prc
genpro
:baa96092
zhaa21I31. rril??ÁlO
:aab39951
:'naa09512
: aal:46356
:aac50951
:baa20354
:baa09529
genpr:o:èêeqZQ14
genplro: aat-7 3 98 6
t-rt-r gellp
f g-enpro:aaq28524
f genpro:aac235þO
f- genpro:aac23l49
http:l'wu,w- angis org.a . /BLAST FASTAu,ari07ss98578589683 3312988281259758 htÍil#SCOR 28/03/01
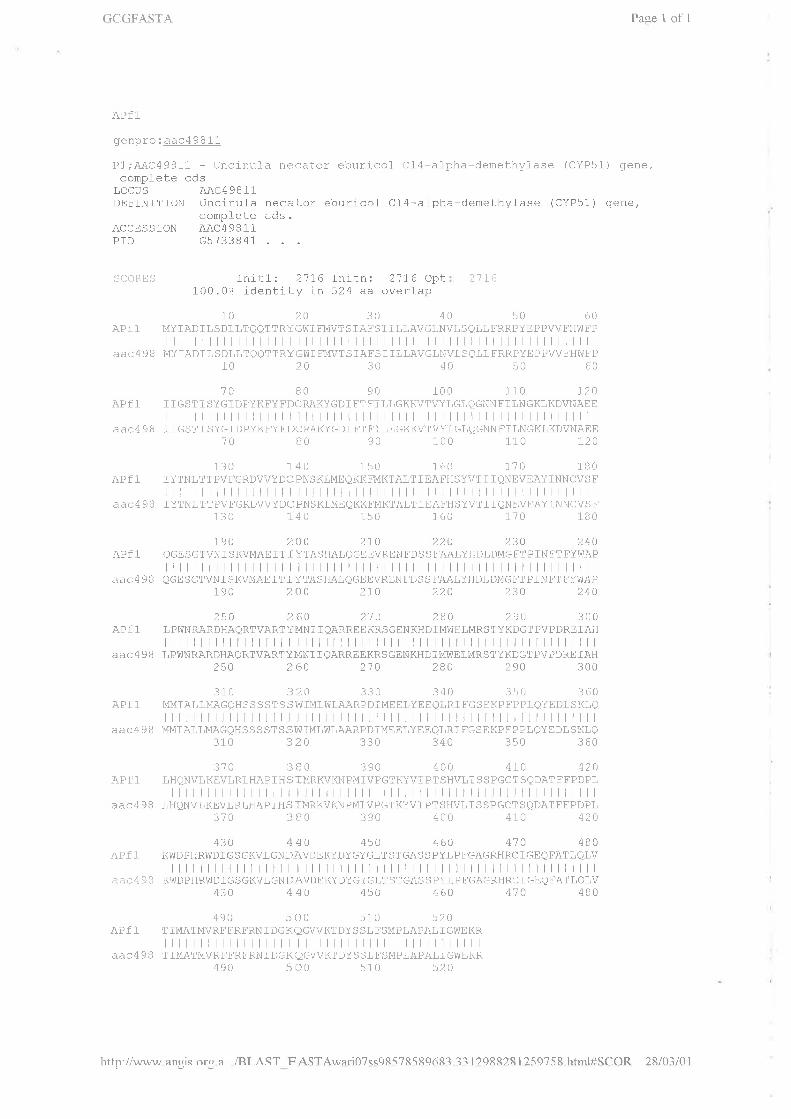
GCGFASTA
compfete cdsLOCUS AAC49811DEFINITIoN úncinula necator eburicol C14-alpha-ciemethylase (CYP51) qene,
complete cds.ACCESSION A-A,C4 9 311PrD G5733841
Page 1 of 1
APfl
genpro: aac49811
Pl,'4AC49811 - tlncinula necalor ebnricof C14-alpha-demethlzlase (CYP51) qene,
SCORES
APf 1
aac498
APfl
aac4 98
APfl
aac4 98
APfl
aac4 93
APfl
aac4 93
Tnitlz 2.'176 Tnit-n:. 2,1 16 Opl-100.0i identity in 524 aa overlap
190 200 270 220 230 240APf 1 OGESGTVI{I SKVMAEf TIYTASHAI,QGREVRENFDSS EAALYHDJ,DI"IGF'TFTNFT F'YWÀP
ttrlrrr|| t llttllttttrt||ll||ll|ll|||aac498 QGESGTVNISIf/i"îÄEITTYTASHALQGtrtrVRENFDSSFAÃLYHDI,DMGFTPTNETFYVüAP
190 200 2ro 220 230 240
250 2 60 21 A 28A 290 30 0
APf 1 LPWNR.CRDHAQRTVARTYMNI IQARREEKRSGENKHDTMWEI,MRSTYKDGTPVPDREIAH||||l||lIlt | | |l|1||||||||t jill||llIlIlI
aaC498 LPIdNRARDHI\QRTVARTYMNIIQARRTEKRSGENKHDIMWELMRSTYKDGTPVPDREfAH250 260 210 280 290 300
310 320 330 340 350 360APf 1 MMIALLMAGQHSS S STS SI^]IMLI/üLA-ARPDIMEELYtrEQI,RI FGSEKP FPPLQYEDLSKLQ
||||||||lr I ||l||lIitllrlll||llllf lllllllf llaac4 9 8 I'4MIALLI'4ÀGQHSSSSTSSWTMLWLA¡.RPDII\,IEELYEEQLRI FGSEKPFPPLQYEDLSKLQ
310 320 330 340 350 360
370 380 390 400 41,0 42,O
AP T 1 LHQNVLKEVLRLHAPIHS IMRKVKNPMIVPGTKYVf PT SHVLT S S PGCT SQDAT EFPDPL|ltlli|llltrt r I llll|||||i!tittlllitlr||||t
aac498 LHQNVLKEVLR],HAPIHSIIVIRKVKNPMIVPGTKYVTPTSHVLISSPGCTSQDATEFPDPL310 380 390 400 4rO 420
10 20 30 40 50 60MYIADI],SDLLTQQT T RYGVùI EI"iVT S IAFS T ILLAVGLNV'LSQLLFRRPYEPPWFHWFP|!tì!|tl||t I |||ti||||||rì||||||||||
I'{YIADILSDLLTQQTTRYG!ÙI FMVTSIAE SI ILLAVGLNVLSQLL FRRPYEPPWEHWFP10 20 30 40 50 60
10 80 90 100 110 120I I GST I SY GIDPY KEY EDCRÀKY GDI ET EILLGKKVTVYLGLQGNN FI],NGKLKDVNAEE||ll|||1|| t lll!|l|||||!l|llIttttl||tit|!tI IGS T I SYGI DPYKFY FDCRAKYGDI FT F'TLLGKKVTVYLGLQGNN FILNGKLKDVNAEE
'70 80 90 100 110 a20
130 440 1-50 160 71 0 i80IYTNLTTPVFGRDWYDCPNSKLMEQKKFMKTALTIEA!-HSYVT] IQNEVEAYINNCVS F
Il! |!!|ll1i MllIlltlIlItti!ttl|lItItt!tt!ltlI YTNLTT PVF'GRDVVY DC PNSKLMEQKKFMKTALT I EAEHS YVT I f QNEVEAY INNCVS F
130 440 150 160 170 180
430 440 4s0 460 410 480KWDPHRIT.DI G.S GKVLGNDAVDEKYDYGYGLT S T GAS S PYL P FGÀGR.HRCT GESFATLQLV|llìlltìllrttì I r Itìtrtìtìtìtt||t|||||!llllrKIÙDPHR!{DIGSGKVLGNDAVDEKYDYGYGI.T STGAS S PYL P FGAGRHRCI GtrQEATLQLV
430 440 450 460 410 480
490 5 00 510 520T IIVLATMV R F FR FRN I D GKQ GWKT DY S S L F SM P LAPAL I GW E KRtt||til|||r I I rlttIt||llttI
T II.4ATMVR E FR F.RNI DGKQGWKT DY S S L FSMPLAPAL I Gü/EKR490 5 00 510 520
http../rvr.vw anqis ors a ./Bf .AST FASTAwari07ss9857ß5R9683 3 ì12c)RR28l25c)7.58 html#SCOR 28/03/Cll
Related Documents