Detection Limits of Electron and Electron Capture Negative Ionization-Mass Spectrometry for Aldehydes Derivatized with o-(2,3,4,5,6-Pentafluorobenzyl)-Hydroxylamine Hydrochloride Josef Beránek, a Darrin A. Muggli, b and Alena Kubátová a a Department of Chemistry, University of North Dakota, Grand Forks, North Dakota, USA b Department of Chemical Engineering, University of North Dakota, Grand Forks, North Dakota, USA In contrast to common expectations, the differences in limits of detection (LODs) between electron capture negative ionization (ECNI) and electron ionization (EI) mass spectrometry (MS) were found to be insignificant for a wide range of aldehydes derivatized with o-(2,3,4,5,6- pentafluorobenzyl)-hydroxylamine hydrochloride. Comparison of the two ionization methods based on LOD confidence intervals revealed that a traditional presentation of the LOD or limit of quantitation (LOQ) as a single value may over/underestimate the significance of obtained results. LODs were between 20 and 150 pg injected for the majority of tested derivatized carbonyls using both ionization methods. ECNI-MS improved LODs by 10- to 20-fold only for two derivatized aldehydes, 4-hydroxybenzaldehyde and 5-(hydroxymethyl)furfural. Selectivity of ECNI did not appear to be beneficial when analyzing a wood smoke particulate matter (WS-PM) extract, possibly because the majority of interferences were removed during sample preparation (i.e., liquid–liquid extraction). The impact of four different data acquisition modes of transmission quadrupole (TQ)-MS on LODs and their precisions was also investigated. As expected, LODs in the selected ion monitoring (SIM) were two to four times lower than those obtained using total ion current (TIC) mode. More importantly, TQ-MS in the selected ion-total ion (SITI) mode (i.e., acquiring SIM and TIC data in a single analysis) provided signal-to-noise ratios and precisions, which were comparable to SIM alone. (J Am Soc Mass Spectrom 2010, 21, 592– 602) © 2010 American Society for Mass Spectrometry A ldehydes, as products of the lipid peroxidation reactions and various atmospheric processes, are often detected in biological and environ- mental matrices [1–15]. Derivatization of aldehydes is typically employed before the analysis to improve chro- matographic separation and detection limits [1–15]. One of the suitable derivatization agents for alde- hydes, recommended by the U.S. Environmental Pro- tection Agency (EPA), is o-(2,3,4,5,6-pentafluorobenzyl)- hydroxylamine hydrochloride (PFBHA) [11, 16]. Re- action of aldehydes with PFBHA provides thermally stable and volatile oximes amenable to gas chromato- graphic (GC) analysis [16, 17]. Mass spectrometry (MS), using either electron ionization (EI) or electron capture negative ionization (ECNI), is often employed for de- tection of PFBHA-aldehydes. Use of selective and sensitive ECNI is enabled due to the strong electron-withdrawing effect of five fluorine atoms in the molecule of derivatized aldehyde (PFBHA- aldehyde). In contrast to high-energy (i.e., hard ioniza- tion) EI-MS, soft ionization (e.g., ECNI) does not typi- cally induce extensive fragmentation of a molecular ion. A negative-charge molecular ion (i.e., [M] • ) may ap- pear with a high abundance in an ECNI spectrum facilitating the analyte identification as well as increas- ing sensitivity [18]. It was observed, however, that the fragmentation of PFBHA-aldehyde negative-charge molecular ions (namely C 6 –C 10 linear aldehydes, glyoxal, methylglyoxal, and benzaldehyde) in ECNI was as extensive as that of positive-charge molecular ions in EI, perhaps due to the dominating dissociative electron capture mechanism of ionization [1, 11]. As a consequence, the identification of unknown PFBHA- aldehydes is not facilitated using ECNI. The main ions observed in both EI and ECNI mass spectra originated from the derivatization agent. EI mode showed patterns with a base peak of m/z 181, which is [C 6 F 5 CH 2 ] [1]. Similarly, the base peaks observed in the derivatized aldehyde ECNI mass spectra represented the ions of [C 6 F 4 CH 2 O] (m/z 178), [C 6 F 5 CH 2 ] (m/z 181), and [C 6 F 5 CHO] (m/z 196) [1]. A significant [M 20] ion (perhaps [M HF] ) was observed in the mass spectra Address reprint requests to Dr. A. Kubátová, Department of Chemistry, University of North Dakota, 151 Cornell Street Stop 9024, Grand Forks, ND 58202, USA. E-mail: [email protected] Published online January 4, 2010 © 2010 American Society for Mass Spectrometry. Published by Elsevier Inc. Received June 18, 2009 1044-0305/10/$32.00 Revised December 17, 2009 doi:10.1016/j.jasms.2009.12.009 Accepted December 17, 2009

Welcome message from author
This document is posted to help you gain knowledge. Please leave a comment to let me know what you think about it! Share it to your friends and learn new things together.
Transcript

Detection Limits of Electron and ElectronCapture Negative Ionization-MassSpectrometry for Aldehydes Derivatized witho-(2,3,4,5,6-Pentafluorobenzyl)-HydroxylamineHydrochloride
Josef Beránek,a Darrin A. Muggli,b and Alena Kubátováa
a Department of Chemistry, University of North Dakota, Grand Forks, North Dakota, USAb Department of Chemical Engineering, University of North Dakota, Grand Forks, North Dakota, USA
In contrast to common expectations, the differences in limits of detection (LODs) between electroncapture negative ionization (ECNI) and electron ionization (EI) mass spectrometry (MS)were found to be insignificant for a wide range of aldehydes derivatized with o-(2,3,4,5,6-pentafluorobenzyl)-hydroxylamine hydrochloride. Comparison of the two ionization methodsbased on LOD confidence intervals revealed that a traditional presentation of the LOD or limit ofquantitation (LOQ) as a single value may over/underestimate the significance of obtained results.LODs were between 20 and 150 pg injected for the majority of tested derivatized carbonyls usingboth ionization methods. ECNI-MS improved LODs by �10- to 20-fold only for two derivatizedaldehydes, 4-hydroxybenzaldehyde and 5-(hydroxymethyl)furfural. Selectivity of ECNI did notappear to be beneficial when analyzing a wood smoke particulate matter (WS-PM) extract,possibly because the majority of interferences were removed during sample preparation (i.e.,liquid–liquid extraction). The impact of four different data acquisition modes of transmissionquadrupole (TQ)-MS on LODs and their precisions was also investigated. As expected, LODs inthe selected ion monitoring (SIM) were �two to four times lower than those obtained using totalion current (TIC) mode. More importantly, TQ-MS in the selected ion-total ion (SITI) mode (i.e.,acquiring SIM and TIC data in a single analysis) provided signal-to-noise ratios and precisions,which were comparable to SIM alone. (J Am Soc Mass Spectrom 2010, 21, 592–602) © 2010American Society for Mass Spectrometry
Aldehydes, as products of the lipid peroxidationreactions and various atmospheric processes,are often detected in biological and environ-
mental matrices [1–15]. Derivatization of aldehydes istypically employed before the analysis to improve chro-matographic separation and detection limits [1–15].
One of the suitable derivatization agents for alde-hydes, recommended by the U.S. Environmental Pro-tection Agency (EPA), is o-(2,3,4,5,6-pentafluorobenzyl)-hydroxylamine hydrochloride (PFBHA) [11, 16]. Re-action of aldehydes with PFBHA provides thermallystable and volatile oximes amenable to gas chromato-graphic (GC) analysis [16, 17]. Mass spectrometry (MS),using either electron ionization (EI) or electron capturenegative ionization (ECNI), is often employed for de-tection of PFBHA-aldehydes.
Use of selective and sensitive ECNI is enabled due tothe strong electron-withdrawing effect of five fluorineatoms in the molecule of derivatized aldehyde (PFBHA-
Address reprint requests to Dr. A. Kubátová, Department of Chemistry,
University of North Dakota, 151 Cornell Street Stop 9024, Grand Forks, ND58202, USA. E-mail: [email protected]© 2010 American Society for Mass Spectrometry. Published by Elsevie1044-0305/10/$32.00doi:10.1016/j.jasms.2009.12.009
aldehyde). In contrast to high-energy (i.e., hard ioniza-tion) EI-MS, soft ionization (e.g., ECNI) does not typi-cally induce extensive fragmentation of a molecular ion.A negative-charge molecular ion (i.e., [M]�•) may ap-pear with a high abundance in an ECNI spectrumfacilitating the analyte identification as well as increas-ing sensitivity [18]. It was observed, however, that thefragmentation of PFBHA-aldehyde negative-chargemolecular ions (namely C6–C10 linear aldehydes,glyoxal, methylglyoxal, and benzaldehyde) in ECNIwas as extensive as that of positive-charge molecularions in EI, perhaps due to the dominating dissociativeelectron capture mechanism of ionization [1, 11]. As aconsequence, the identification of unknown PFBHA-aldehydes is not facilitated using ECNI. The main ionsobserved in both EI and ECNI mass spectra originatedfrom the derivatization agent. EI mode showed patternswith a base peak of m/z 181, which is [C6F5CH2]� [1].Similarly, the base peaks observed in the derivatizedaldehyde ECNI mass spectra represented the ions of[C6F4CH2O]� (m/z 178), [C6F5CH2]� (m/z 181), and[C6F5CHO]� (m/z 196) [1]. A significant [M � 20] ion
(perhaps [M � HF]�) was observed in the mass spectraPublished online January 4, 2010r Inc. Received June 18, 2009
Revised December 17, 2009Accepted December 17, 2009
593J Am Soc Mass Spectrom 2010, 21, 592–602 EI AND NCI-MS OF PFBHA-DERIVATIZED ALDEHYDES
of C3–C12 saturated and unsaturated aliphatic alde-hydes and some aromatic aldehydes in ECNI spectra[1, 11].
Limits of detection (LODs) obtained using ECNI andEI have been previously compared for only a fewPFBHA-aldehydes (linear saturated and unsaturatedaldehydes, glyoxal, methylglyoxal, and benzaldehyde),which showed ECNI to provide slightly lower LODsthan EI [1, 19]. However, neither the method of preci-sion nor the description of LOD calculation were re-ported [1, 7, 10, 19–22]. EI and ECNI experiments wereperformed using different instrumentation [1, 19];therefore, it is not clear whether the ECNI signal-to-noise ratio (i.e., detectability) improved solely due to alower LODs of ECNI for PFBHA-aldehydes.
In this work, we have evaluated and compared theECNI and EI-MS based on LOD confidence intervals for33 aldehydes derivatized with PFBHA. The evaluationwas performed using two GC/MS instruments (3Dquadrupole ion trap and transmission quadrupole) eachequipped with interchangeable CI and EI sources. Wehave also investigated the performance of transmissionquadrupole (TQ)-MS in four data acquisition modes.
Experimental
Chemicals and Materials
Standards of aldehydes were of 95% and higher purity(unless stated otherwise). Acetaldehyde, propanal, bu-tanal, isobutanal, n-pentanal, n-hexanal, n-heptanal, n-octanal, n-nonanal, n-decanal, n-undecanal, n-dodecanal,acrolein, trans-2-pentenal, trans-2-hexenal, trans-2-nonenal, trans,trans-2,4-nonadienal (�85%), glyoxal(40% wt. in water), methylglyoxal (40% wt. in wa-ter), glutaraldehyde (50% wt. in water), benzalde-hyde, o-tolualdehyde, m-tolualdehyde, phenylace-taldehyde (�90%), hydrocinnamaldehyde (�90%),2,5-dimethylbenzaldehyde, 2-furaldehyde, and 5-(hydroxymethyl)furaldehyde were purchased fromSigma-Aldrich (Milwaukee, WI, USA). Formaldehyde(36.6% wt. in water), crotonal, 2-hydroxybenzaldehyde,4-hydroxybenzaldehyde, and p-anisaldehyde were pur-chased from Chem Service (West Chester, PA, USA).Benzaldehyde-d6 (99.6 atom % D) and butanal-2,2-d2
(99.4 atom % D) were purchased from CDN Isotopes(Pointe-Claire, QC, Canada). PFBHA (�99%) waspurchased from Alfa-Aesar (Ward Hill, MA, USA).Ultra high purity helium (99.9995%) and methane(99.999%) were purchased from Airgas (Grand Forks,ND, USA). Methanol (LC/MS optima grade) anddichloromethane (DCM) of GC/MS quality were pur-chased from Fisher Scientific (Pittsburg, PA, USA).Water was purified using a Direct-Q3 water purifica-tion system with an incorporated dual wavelengthUV lamp (Millipore, Billerica, MA, USA) for low totalorganic carbon content (the manufacturer’s claimed
purity is less than 5 ng g�1).PFBHA-Aldehydes Preparation
Individual standard stock solutions of aldehydes wereprepared in methanol at a concentration of �20 mgmL�1 and stored at �18 °C. The derivatization methodhas been described elsewhere and was adopted fromthe EPA 556 method [16, 23]. Triplicates of PFBHA-derivatized calibration standards (10–600 �g L�1) wereprepared by spiking the appropriate amounts of alde-hyde mixture into purified water. Two internal stan-dards (IS), butanal-d2 and benzaldehyde-d6, were addedto this solution in the final concentrations of 0.500 mgL�1. PFBHA solution (1.7 � 104 mg L�1) was preparedfresh in purified water before the derivatization. Aquantitative reaction of aldehydes was assured by add-ing PFBHA in excess (at least 10-fold based on molarratios). To adjust the pH to 3.5, a few drops of an acid(1 � 10�3 mol L�1 H2SO4) or base (1 � 10�3 mol L�1
NaOH) were added. The final volume of the aqueouscalibration standard solution was 5.0 mL.
Solutions were set at room temperature in the darkfor 12 h to complete the reaction [16]. To avoid potentialinterferences from the excess of PFBHA derivatizationagent during the GC analysis, a few drops of concen-trated sulfuric acid were added after the reaction. Anextraction of PFBHA-aldehydes into 1.0 mL of DCMwas then employed. The extraction was repeated threetimes [16]. The test-tube was hand-shaken for 1 minbefore withdrawing the DCM layer; the DCM fractionswere combined (total volume was 3 mL) and filteredthrough anhydrous Na2SO4 to remove residual water[16]. The resulting DCM solutions were concentratedunder a gentle stream of nitrogen to 0.4 mL andanalyzed using GC/MS.
Wood smoke particulate matter was extracted usinghot pressurized water, which is described in detailelsewhere [23–25]. Aqueous extracts with aldehydeswere prepared for GC/MS analysis as calibrationstandards.
GC with ECNI- and EI-TQ-MS
An Agilent 6890 GC coupled to Agilent 5975C inert XLEI/CI MSD (Agilent Technologies, Inc., Wilmington,DE, USA) and Gerstel MPS2 autosampler (Gerstel,Baltimore, MD, USA) were used. MSD ChemStationD.03.00.611 software was employed for the data acqui-sition and integration of chromatographic peak areas.The data obtained were further processed in MicrosoftOffice Excel.
The automated tune and m/z calibration using theinstrument’s Autotune file were performed after ev-ery change of a source or at least once a week. Nosignificant adjustments of EI or ECNI-MS parameterswere observed among individual tunes. Pentafluoro-benzylbutylamine (PFTBA) was used as a mass cali-brant for the EI mode and perfluoro-5,8-dimethyl-3,6,9-trioxydodecane (PFDTD) for the ECNI mode.
The MS instrument was equilibrated overnight after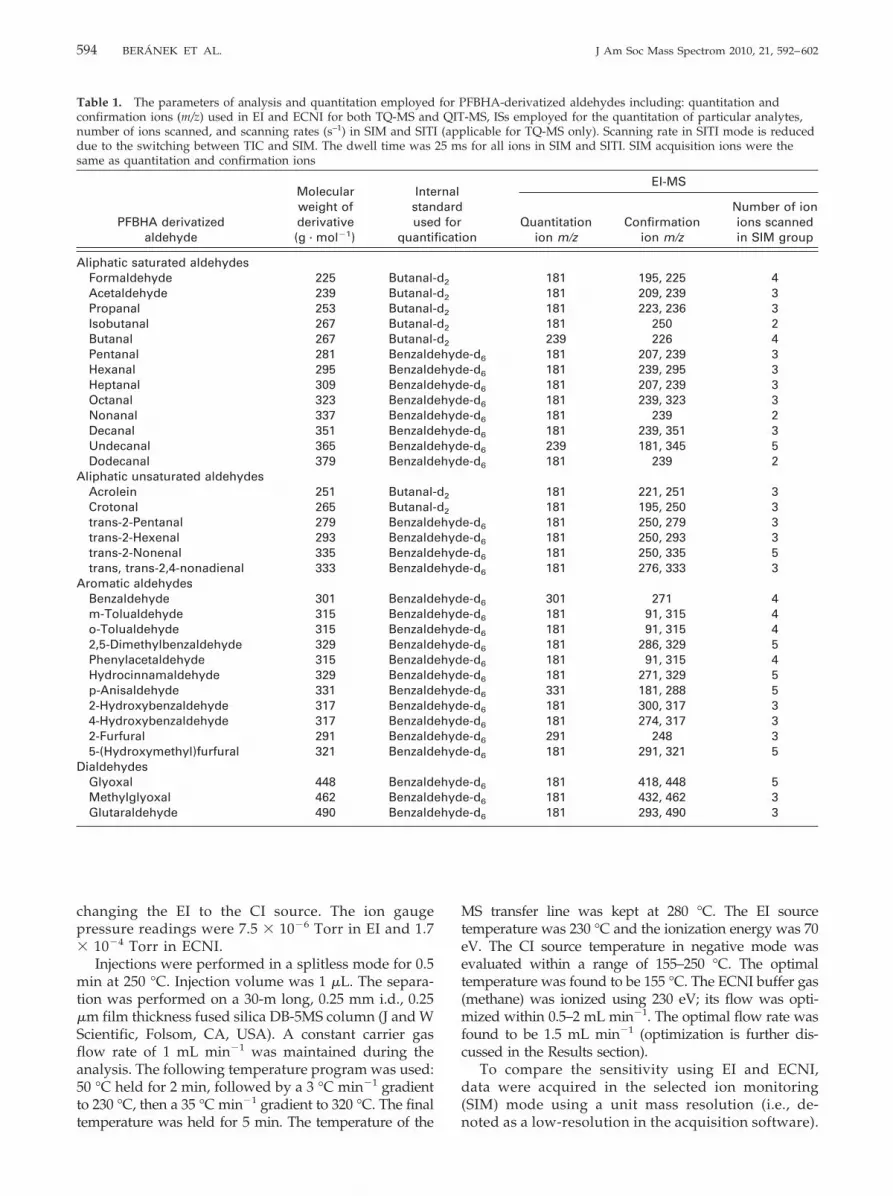
594 BERÁNEK ET AL. J Am Soc Mass Spectrom 2010, 21, 592–602
changing the EI to the CI source. The ion gaugepressure readings were 7.5 � 10�6 Torr in EI and 1.7� 10�4 Torr in ECNI.
Injections were performed in a splitless mode for 0.5min at 250 °C. Injection volume was 1 �L. The separa-tion was performed on a 30-m long, 0.25 mm i.d., 0.25�m film thickness fused silica DB-5MS column (J and WScientific, Folsom, CA, USA). A constant carrier gasflow rate of 1 mL min�1 was maintained during theanalysis. The following temperature program was used:50 °C held for 2 min, followed by a 3 °C min�1 gradientto 230 °C, then a 35 °C min�1 gradient to 320 °C. The final
Table 1. The parameters of analysis and quantitation employedconfirmation ions (m/z) used in EI and ECNI for both TQ-MS andnumber of ions scanned, and scanning rates (s–1) in SIM and SITIdue to the switching between TIC and SIM. The dwell time wassame as quantitation and confirmation ions
PFBHA derivatizedaldehyde
Molecularweight ofderivative(g · mol�1)
Intestanused
quanti
Aliphatic saturated aldehydesFormaldehyde 225 Butanal-Acetaldehyde 239 Butanal-Propanal 253 Butanal-Isobutanal 267 Butanal-Butanal 267 Butanal-Pentanal 281 BenzaldHexanal 295 BenzaldHeptanal 309 BenzaldOctanal 323 BenzaldNonanal 337 BenzaldDecanal 351 BenzaldUndecanal 365 BenzaldDodecanal 379 Benzald
Aliphatic unsaturated aldehydesAcrolein 251 Butanal-Crotonal 265 Butanal-trans-2-Pentanal 279 Benzaldtrans-2-Hexenal 293 Benzaldtrans-2-Nonenal 335 Benzaldtrans, trans-2,4-nonadienal 333 Benzald
Aromatic aldehydesBenzaldehyde 301 Benzaldm-Tolualdehyde 315 Benzaldo-Tolualdehyde 315 Benzald2,5-Dimethylbenzaldehyde 329 BenzaldPhenylacetaldehyde 315 BenzaldHydrocinnamaldehyde 329 Benzaldp-Anisaldehyde 331 Benzald2-Hydroxybenzaldehyde 317 Benzald4-Hydroxybenzaldehyde 317 Benzald2-Furfural 291 Benzald5-(Hydroxymethyl)furfural 321 Benzald
DialdehydesGlyoxal 448 BenzaldMethylglyoxal 462 BenzaldGlutaraldehyde 490 Benzald
temperature was held for 5 min. The temperature of the
MS transfer line was kept at 280 °C. The EI sourcetemperature was 230 °C and the ionization energy was 70eV. The CI source temperature in negative mode wasevaluated within a range of 155–250 °C. The optimaltemperature was found to be 155 °C. The ECNI buffer gas(methane) was ionized using 230 eV; its flow was opti-mized within 0.5–2 mL min�1. The optimal flow rate wasfound to be 1.5 mL min�1 (optimization is further dis-cussed in the Results section).
To compare the sensitivity using EI and ECNI,data were acquired in the selected ion monitoring(SIM) mode using a unit mass resolution (i.e., de-
FBHA-derivatized aldehydes including: quantitation and-MS, ISs employed for the quantitation of particular analytes,licable for TQ-MS only). Scanning rate in SITI mode is reduced
s for all ions in SIM and SITI. SIM acquisition ions were the
on
EI-MS
Quantitationion m/z
Confirmationion m/z
Number of ionions scannedin SIM group
181 195, 225 4181 209, 239 3181 223, 236 3181 250 2239 226 4
e-d6 181 207, 239 3e-d6 181 239, 295 3e-d6 181 207, 239 3e-d6 181 239, 323 3e-d6 181 239 2e-d6 181 239, 351 3e-d6 239 181, 345 5e-d6 181 239 2
181 221, 251 3181 195, 250 3
e-d6 181 250, 279 3e-d6 181 250, 293 3e-d6 181 250, 335 5e-d6 181 276, 333 3
e-d6 301 271 4e-d6 181 91, 315 4e-d6 181 91, 315 4e-d6 181 286, 329 5e-d6 181 91, 315 4e-d6 181 271, 329 5e-d6 331 181, 288 5e-d6 181 300, 317 3e-d6 181 274, 317 3e-d6 291 248 3e-d6 181 291, 321 5
e-d6 181 418, 448 5e-d6 181 432, 462 3e-d6 181 293, 490 3
for PQIT(app
25 m
rnaldard
forficati
d2
d2
d2
d2
d2
ehydehydehydehydehydehydehydehyd
d2
d2
ehydehydehydehyd
ehydehydehydehydehydehydehydehydehydehydehyd
ehydehydehyd
noted as a low-resolution in the acquisition software).

595J Am Soc Mass Spectrom 2010, 21, 592–602 EI AND NCI-MS OF PFBHA-DERIVATIZED ALDEHYDES
To evaluate the sensitivity in various TQ-MS modes,data acquisition was performed in a total ion current(TIC) in the m/z range of 50 – 600, SIM, and selectedion-total ion (SITI) mode (i.e., acquiring SIM and TICdata in a single analysis). Table 1 shows the acquisi-tion ions (i.e., quantitation and confirmation ions) aswell as data acquisition rates and a number ofscanned ions in each SIM group (in SIM alone and inSITI). Analytes eluting close to each other from theGC column were acquired in one SIM group. In-creased number of acquisition ions (e.g., five ionsscanned for p-anisaldehyde in EI versus four ions inECNI for the same compound) did not have a signif-icant effect on LOD or precision. The fragmentation
Table 1. Continued
EI-MS
Acquisitionrate in SIM
(s�1)
Acquisitionrate in SITI
(s�1)Quantitation
ion m/zConfir
ion
6.20 3.97 181 1788.10 4.78 181 1788.10 4.78 181 178
11.80 5.93 178 1816.20 4.02 247 2208.10 4.78 178 1818.10 4.78 178 1818.10 4.78 178 1818.10 4.74 178 276
11.80 5.93 178 3178.10 4.74 178 1964.90 3.40 345 3
11.80 5.93 178 196
8.10 4.78 231 1788.10 4.78 245 1788.10 4.78 259 1788.10 4.78 273 1784.90 3.40 178 38.10 4.74 196 283
6.20 4.02 281 26.20 3.97 295 1676.20 3.97 295 1674.90 3.40 309 1676.20 3.97 178 2044.90 3.40 178 2794.90 3.40 311 1788.10 4.74 136 1968.10 4.74 297 1788.10 4.78 241 1784.90 3.40 271 196
4.90 3.40 267 1678.10 4.74 281 1678.10 4.74 178 197
patterns of PFBHA-aldehydes obtained in both EI
and ECNI resembled those previously published [1].EI and ECNI spectra of selected analytes (to ourknowledge not previously reported) are provided inthe supplementary data, Figure S2, which can befound in the electronic version of this article.
In addition, TIC was performed using two scanningspeeds. In this paper, one is referred as normal TIC(n-TIC), with a spectral acquisition rate of �2.66 s�1 inthe m/z range of 50–600 (providing �20–24 data pointsacross chromatographic peaks with half-widths of�7–8 s), and the other is fast TIC (f-TIC), �13.24 s�1 inthe same mass range (providing �100 data pointsacross chromatographic peaks with half-widths of�6–8 s). The mass acquisition threshold was set to 50
NCI-MS
onNumber of ionions scannedin SIM group
Acquisitionrate in SIM
(s�1)
Acquisitionrate in SITI
(s�1)
3 8.10 4.873 8.10 4.873 8.10 4.873 8.10 4.876 4.20 3.073 8.10 4.873 8.10 4.873 8.10 4.873 8.10 4.873 8.10 4.873 8.10 4.874 6.20 4.083 8.10 4.87
4 6.20 4.083 8.10 4.873 8.10 4.873 8.10 4.875 4.90 3.453 8.10 4.87
4 6.20 4.083 8.10 4.873 8.10 4.873 8.10 4.873 8.10 4.875 4.90 3.454 6.20 4.083 8.10 4.873 8.10 4.873 8.10 4.873 8.10 4.87
3 8.10 4.873 8.10 4.873 8.10 4.87
matim/z
, 225, 197, 233, 247, 267, 261, 275, 289, 303, 337, 33118, 359
, 201, 215, 229, 24315, 313
51, 265, 265, 279, 268, 309, 281, 280, 267, 271, 255
, 196, 196, 450
counts for all methods (i.e., f-TIC, n-TIC, SIM, SITI).

596 BERÁNEK ET AL. J Am Soc Mass Spectrom 2010, 21, 592–602
GC with ECNI- and EI-QIT-MS
A Trace GC equipped with Polaris-Q 291 3D quadru-pole ion trap (QIT)-MS (further in the text referred asQIT-MS) with both EI and CI options and AS3000autosampler (Thermo Fisher Scientific, Inc., Waltham,MA, USA) was used to confirm the trends of ECNI/EI LODs for PFBHA-aldehydes observed using GC/TQ-MS. Xcalibur 1.3 software was used for the dataacquisition and integration of chromatographic peakareas. The data obtained were further processed inMicrosoft Office Excel.
The automated tune and m/z calibration using theinstrument’s Autotune file were performed after everychange of the source or at least once a week. Nosignificant adjustments of EI or ECNI-MS parameterswere observed among individual tunes. PFTBA wasused as a mass calibrant for both EI and ECNI modes.The CI ion volume was inserted into the MS ionizationsource for the ECNI experiment without breaking thevacuum. The instrument was equilibrated overnight.The ion gauge pressure readings were 2.0 � 10�5 Torrin EI and 1.7 � 10�4 Torr in ECNI.
Injection set-up, flow rate, column, oven tempera-ture program, and transfer line temperature were thesame as for GC/TQ-MS (see above). Ion sourcetemperature during the EI experiment was 230 °Cand the ionization energy was 70 eV. The ionizationsource temperature for ECNI was evaluated within arange of 155–250 °C. The optimal temperature was155 °C. The ECNI buffer gas (methane) was ionizedusing 230 eV; its flow was optimized within 0.5–3 mLmin�1. The optimal flow rate was 3 mL min�1 (opti-mization is further discussed in the Results andDiscussion section). Data were acquired in the TICmode (mass range from m/z 50 to 600) for both ECNIand EI (see Table 1 for quantitation and confirma-tion ions) experiments evaluating LODs of PFBHA-derivatized aldehydes. QIT-MS acquisition parame-ters were set for both EI and ECNI as follows: numberof microscans was 2, maximum ion time was 25 ms,and automatic gain control was turned on. The aver-age number of data points acquired across chromato-graphic peaks with half-widths of �6 – 8 s was �20 –24. The mass acquisition threshold was set to 50counts.
Statistical Data Evaluation
LODs in pg (a minimal mass injected enabling theanalyte detection) and their confidence intervals forindividual PFBHA-aldehydes were computed usingdata points from three calibration standard sets,which were within the linear range and one order ofmagnitude of suspected LOD [26]. A least-squareslinear regression analysis using Microsoft Office Ex-cel was performed to obtain calibration curve param-eters. Average mass LODs (mLOD) were calculated
using eq 1,mLOD �3.3 � sY
k(1)
where k is a slope of the calibration curve and sy is thestandard deviation of the linear regression residuals,which is obtained as a square root of residual meansquare (MSRES) representing the unbiased estimate of acalibration curve variance [27].
A confidence interval for MSRES was obtained usingeq 2 [27],
�(n � c)MSRES
�a ⁄ 2,n�c2 � MSRES �
(n � c)MSRES
�(1�a) ⁄ 2,n�c2 � (2)
where (n � c) represents a number of degrees offreedom (n is a number of data points, c is a number ofindependent variables), �2 is a chi-square distributioncoefficient at a decision level � � 0.05 and degrees offreedom (n � c), where c � 2. The square root of upperand lower MSRES gives the sy critical limits.
The confidence interval for k was obtained usingeq 3 [27],
�k � ta ⁄ 2,n�csk � k � k � ta ⁄ 2,n�csk� (3)
where t is a coefficient of Student’s t-distribution at adecision level � � 0.05 and degrees of freedom (n – c),where c � 2, sk is a standard error of k obtained from theregression analysis.
The uncertainty of mLOD was estimated by propaga-tion of errors eq 4 [assuming mLOD as a function of sy
and k (eq 1)].
dmLOD(sY, k) ���(3.3sY ⁄ k)
sY
dsY�2
��(3.3sY ⁄ k)
kdk�2
(4)
Solving and simplifying eq 4 assuming infinitesimalchanges of sy and k (i.e., dsy � �sy and dk ��k) provided the uncertainty of mLOD described ineq 5.
mLOD(sY, k) ���(3.3)
k �2
sY2 ���3.3sY
k2 �2
k2 (5)
Then the true value of mLOD lies within the 95%confidence interval (eq 6).
�mLOD � (mLOD ⁄ 2) � mLOD � mLOD � (mLOD ⁄ 2)� (6)
This confidence interval may be directly associated with
the LOD precision. Calculations are graphically depicted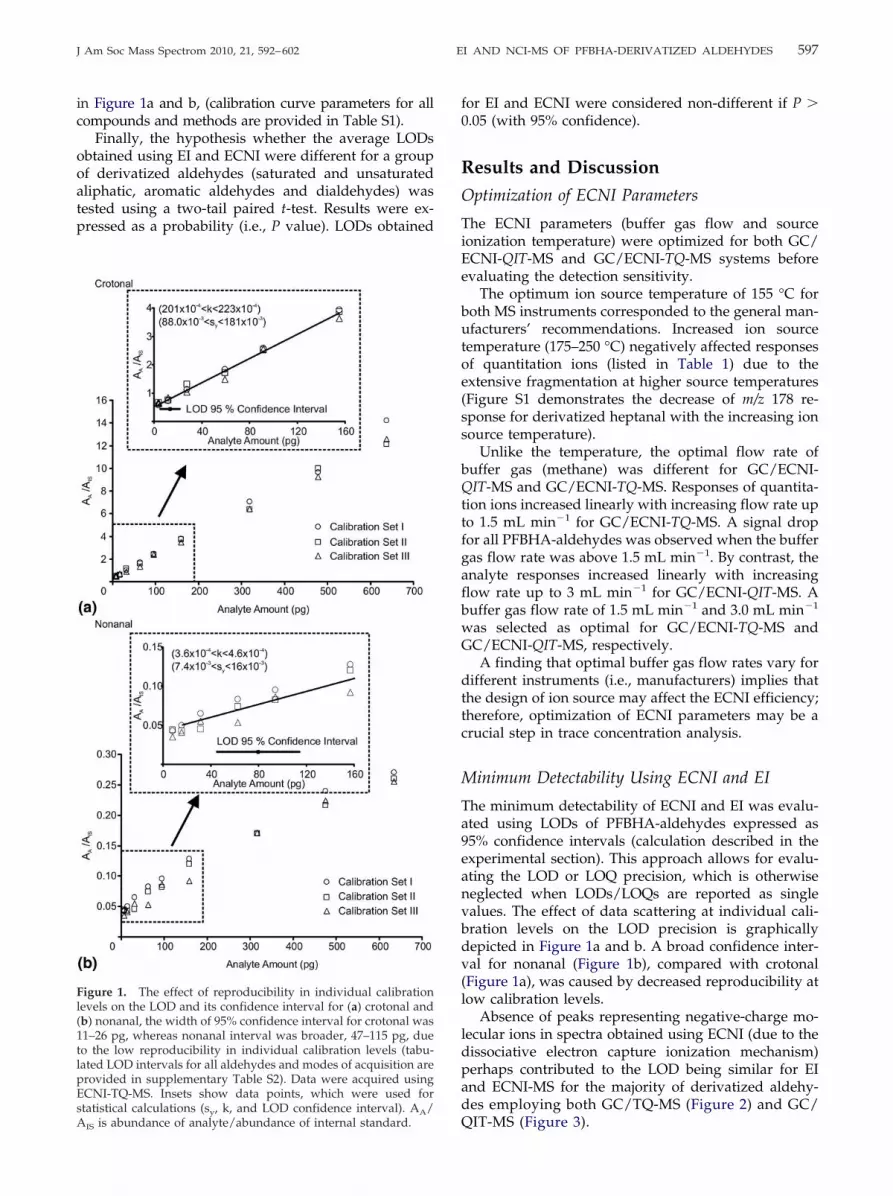
597J Am Soc Mass Spectrom 2010, 21, 592–602 EI AND NCI-MS OF PFBHA-DERIVATIZED ALDEHYDES
in Figure 1a and b, (calibration curve parameters for allcompounds and methods are provided in Table S1).
Finally, the hypothesis whether the average LODsobtained using EI and ECNI were different for a groupof derivatized aldehydes (saturated and unsaturatedaliphatic, aromatic aldehydes and dialdehydes) wastested using a two-tail paired t-test. Results were ex-pressed as a probability (i.e., P value). LODs obtained
Figure 1. The effect of reproducibility in individual calibrationlevels on the LOD and its confidence interval for (a) crotonal and(b) nonanal, the width of 95% confidence interval for crotonal was11–26 pg, whereas nonanal interval was broader, 47–115 pg, dueto the low reproducibility in individual calibration levels (tabu-lated LOD intervals for all aldehydes and modes of acquisition areprovided in supplementary Table S2). Data were acquired usingECNI-TQ-MS. Insets show data points, which were used forstatistical calculations (s , k, and LOD confidence interval). A /
y AAIS is abundance of analyte/abundance of internal standard.
for EI and ECNI were considered non-different if P �0.05 (with 95% confidence).
Results and Discussion
Optimization of ECNI Parameters
The ECNI parameters (buffer gas flow and sourceionization temperature) were optimized for both GC/ECNI-QIT-MS and GC/ECNI-TQ-MS systems beforeevaluating the detection sensitivity.
The optimum ion source temperature of 155 °C forboth MS instruments corresponded to the general man-ufacturers’ recommendations. Increased ion sourcetemperature (175–250 °C) negatively affected responsesof quantitation ions (listed in Table 1) due to theextensive fragmentation at higher source temperatures(Figure S1 demonstrates the decrease of m/z 178 re-sponse for derivatized heptanal with the increasing ionsource temperature).
Unlike the temperature, the optimal flow rate ofbuffer gas (methane) was different for GC/ECNI-QIT-MS and GC/ECNI-TQ-MS. Responses of quantita-tion ions increased linearly with increasing flow rate upto 1.5 mL min�1 for GC/ECNI-TQ-MS. A signal dropfor all PFBHA-aldehydes was observed when the buffergas flow rate was above 1.5 mL min�1. By contrast, theanalyte responses increased linearly with increasingflow rate up to 3 mL min�1 for GC/ECNI-QIT-MS. Abuffer gas flow rate of 1.5 mL min�1 and 3.0 mL min�1
was selected as optimal for GC/ECNI-TQ-MS andGC/ECNI-QIT-MS, respectively.
A finding that optimal buffer gas flow rates vary fordifferent instruments (i.e., manufacturers) implies thatthe design of ion source may affect the ECNI efficiency;therefore, optimization of ECNI parameters may be acrucial step in trace concentration analysis.
Minimum Detectability Using ECNI and EI
The minimum detectability of ECNI and EI was evalu-ated using LODs of PFBHA-aldehydes expressed as95% confidence intervals (calculation described in theexperimental section). This approach allows for evalu-ating the LOD or LOQ precision, which is otherwiseneglected when LODs/LOQs are reported as singlevalues. The effect of data scattering at individual cali-bration levels on the LOD precision is graphicallydepicted in Figure 1a and b. A broad confidence inter-val for nonanal (Figure 1b), compared with crotonal(Figure 1a), was caused by decreased reproducibility atlow calibration levels.
Absence of peaks representing negative-charge mo-lecular ions in spectra obtained using ECNI (due to thedissociative electron capture ionization mechanism)perhaps contributed to the LOD being similar for EIand ECNI-MS for the majority of derivatized aldehy-des employing both GC/TQ-MS (Figure 2) and GC/
QIT-MS (Figure 3).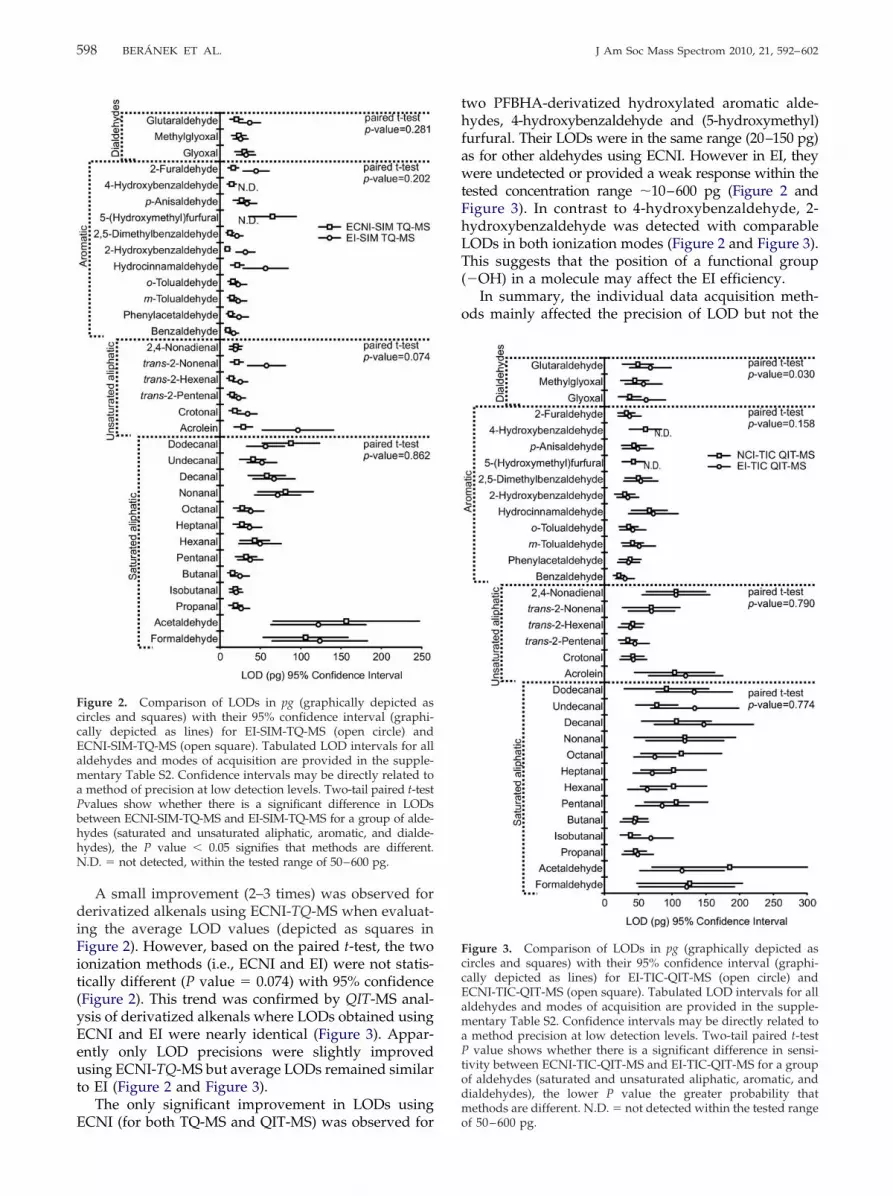
598 BERÁNEK ET AL. J Am Soc Mass Spectrom 2010, 21, 592–602
A small improvement (2–3 times) was observed forderivatized alkenals using ECNI-TQ-MS when evaluat-ing the average LOD values (depicted as squares inFigure 2). However, based on the paired t-test, the twoionization methods (i.e., ECNI and EI) were not statis-tically different (P value � 0.074) with 95% confidence(Figure 2). This trend was confirmed by QIT-MS anal-ysis of derivatized alkenals where LODs obtained usingECNI and EI were nearly identical (Figure 3). Appar-ently only LOD precisions were slightly improvedusing ECNI-TQ-MS but average LODs remained similarto EI (Figure 2 and Figure 3).
The only significant improvement in LODs using
Figure 2. Comparison of LODs in pg (graphically depicted ascircles and squares) with their 95% confidence interval (graphi-cally depicted as lines) for EI-SIM-TQ-MS (open circle) andECNI-SIM-TQ-MS (open square). Tabulated LOD intervals for allaldehydes and modes of acquisition are provided in the supple-mentary Table S2. Confidence intervals may be directly related toa method of precision at low detection levels. Two-tail paired t-testPvalues show whether there is a significant difference in LODsbetween ECNI-SIM-TQ-MS and EI-SIM-TQ-MS for a group of alde-hydes (saturated and unsaturated aliphatic, aromatic, and dialde-hydes), the P value � 0.05 signifies that methods are different.N.D. � not detected, within the tested range of 50–600 pg.
ECNI (for both TQ-MS and QIT-MS) was observed for
two PFBHA-derivatized hydroxylated aromatic alde-hydes, 4-hydroxybenzaldehyde and (5-hydroxymethyl)furfural. Their LODs were in the same range (20–150 pg)as for other aldehydes using ECNI. However in EI, theywere undetected or provided a weak response within thetested concentration range �10–600 pg (Figure 2 andFigure 3). In contrast to 4-hydroxybenzaldehyde, 2-hydroxybenzaldehyde was detected with comparableLODs in both ionization modes (Figure 2 and Figure 3).This suggests that the position of a functional group(�OH) in a molecule may affect the EI efficiency.
In summary, the individual data acquisition meth-ods mainly affected the precision of LOD but not the
Figure 3. Comparison of LODs in pg (graphically depicted ascircles and squares) with their 95% confidence interval (graphi-cally depicted as lines) for EI-TIC-QIT-MS (open circle) andECNI-TIC-QIT-MS (open square). Tabulated LOD intervals for allaldehydes and modes of acquisition are provided in the supple-mentary Table S2. Confidence intervals may be directly related toa method precision at low detection levels. Two-tail paired t-testP value shows whether there is a significant difference in sensi-tivity between ECNI-TIC-QIT-MS and EI-TIC-QIT-MS for a groupof aldehydes (saturated and unsaturated aliphatic, aromatic, anddialdehydes), the lower P value the greater probability thatmethods are different. N.D. � not detected within the tested range
of 50–600 pg.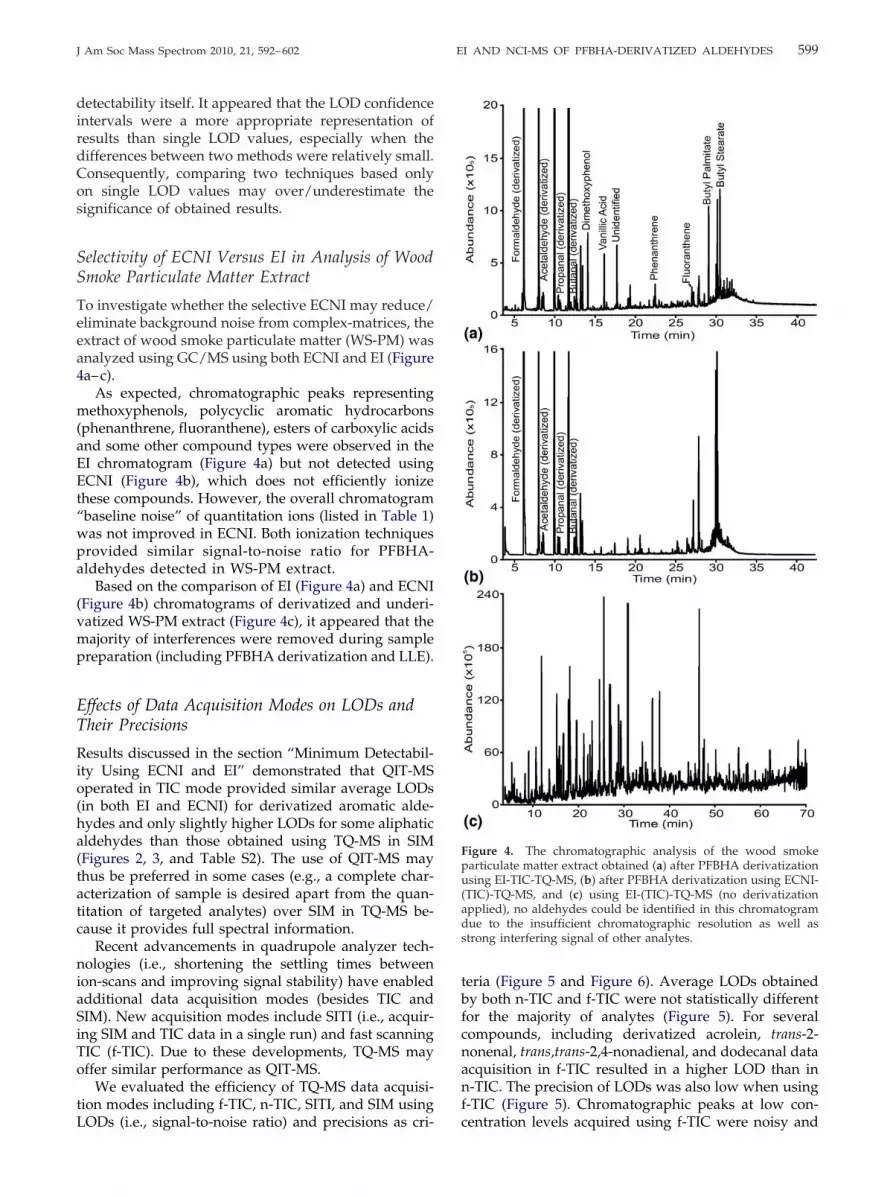
599J Am Soc Mass Spectrom 2010, 21, 592–602 EI AND NCI-MS OF PFBHA-DERIVATIZED ALDEHYDES
detectability itself. It appeared that the LOD confidenceintervals were a more appropriate representation ofresults than single LOD values, especially when thedifferences between two methods were relatively small.Consequently, comparing two techniques based onlyon single LOD values may over/underestimate thesignificance of obtained results.
Selectivity of ECNI Versus EI in Analysis of WoodSmoke Particulate Matter Extract
To investigate whether the selective ECNI may reduce/eliminate background noise from complex-matrices, theextract of wood smoke particulate matter (WS-PM) wasanalyzed using GC/MS using both ECNI and EI (Figure4a–c).
As expected, chromatographic peaks representingmethoxyphenols, polycyclic aromatic hydrocarbons(phenanthrene, fluoranthene), esters of carboxylic acidsand some other compound types were observed in theEI chromatogram (Figure 4a) but not detected usingECNI (Figure 4b), which does not efficiently ionizethese compounds. However, the overall chromatogram“baseline noise” of quantitation ions (listed in Table 1)was not improved in ECNI. Both ionization techniquesprovided similar signal-to-noise ratio for PFBHA-aldehydes detected in WS-PM extract.
Based on the comparison of EI (Figure 4a) and ECNI(Figure 4b) chromatograms of derivatized and underi-vatized WS-PM extract (Figure 4c), it appeared that themajority of interferences were removed during samplepreparation (including PFBHA derivatization and LLE).
Effects of Data Acquisition Modes on LODs andTheir Precisions
Results discussed in the section “Minimum Detectabil-ity Using ECNI and EI” demonstrated that QIT-MSoperated in TIC mode provided similar average LODs(in both EI and ECNI) for derivatized aromatic alde-hydes and only slightly higher LODs for some aliphaticaldehydes than those obtained using TQ-MS in SIM(Figures 2, 3, and Table S2). The use of QIT-MS maythus be preferred in some cases (e.g., a complete char-acterization of sample is desired apart from the quan-titation of targeted analytes) over SIM in TQ-MS be-cause it provides full spectral information.
Recent advancements in quadrupole analyzer tech-nologies (i.e., shortening the settling times betweenion-scans and improving signal stability) have enabledadditional data acquisition modes (besides TIC andSIM). New acquisition modes include SITI (i.e., acquir-ing SIM and TIC data in a single run) and fast scanningTIC (f-TIC). Due to these developments, TQ-MS mayoffer similar performance as QIT-MS.
We evaluated the efficiency of TQ-MS data acquisi-tion modes including f-TIC, n-TIC, SITI, and SIM using
LODs (i.e., signal-to-noise ratio) and precisions as cri-teria (Figure 5 and Figure 6). Average LODs obtainedby both n-TIC and f-TIC were not statistically differentfor the majority of analytes (Figure 5). For severalcompounds, including derivatized acrolein, trans-2-nonenal, trans,trans-2,4-nonadienal, and dodecanal dataacquisition in f-TIC resulted in a higher LOD than inn-TIC. The precision of LODs was also low when usingf-TIC (Figure 5). Chromatographic peaks at low con-
Figure 4. The chromatographic analysis of the wood smokeparticulate matter extract obtained (a) after PFBHA derivatizationusing EI-TIC-TQ-MS, (b) after PFBHA derivatization using ECNI-(TIC)-TQ-MS, and (c) using EI-(TIC)-TQ-MS (no derivatizationapplied), no aldehydes could be identified in this chromatogramdue to the insufficient chromatographic resolution as well asstrong interfering signal of other analytes.
centration levels acquired using f-TIC were noisy and

600 BERÁNEK ET AL. J Am Soc Mass Spectrom 2010, 21, 592–602
distorted when compared with n-TIC (Figure 6a and b).Even though data smoothing was applied, peak areaswere irreproducible resulting in a large data variabilityand lower f-TIC detectability for some compounds.
A large LOD variability was observed for low-molecular weight derivatized formaldehyde, acetalde-hyde, and acrolein using all TQ-MS acquisition modesas well as QIT-MS in TIC (Figures 2, 3, and 5). This was,however, attributed to their random evaporative lossesduring a controlled sample evaporation, which oftenmust be employed to re-concentrate trace amounts of
Figure 5. Comparison of LODs in pg (graphically depicted ascircles, squares, and triangles) with their 95% confidence interval(graphically depicted as lines) for EI-SIM-TQ-MS (open circle),EI-(n-TIC)-TQ-MS (open square), and EI-(f-TIC)-TQ-MS (invertedopen triangle). Tabulated LOD intervals for all aldehydes andmodes of acquisition are provided in the supplementary Table S2.Confidence intervals may be directly related to a method precisionat low detection levels. Two-tail paired t-test P value showswhether there is a significant difference in sensitivity betweenEI-(n-TIC)-TQ-MS and EI-(SIM)-TQ-MS for a group of aldehydes(saturated and unsaturated aliphatic, aromatic, and dialdehydes),the lower P value the greater probability that methods aredifferent. N.D. � not detected within the tested range of 50–600 pg.
aldehydes in environmental samples [23]. A suitable
Figure 6. The reconstructed ion chromatograms (RIC) of m/z of181 of heptanal (syn/anti stereoisomers) acquired using (a) EI-(f-TIC)-TQ-MS, (b) EI-(n-TIC)-TQ-MS, (c) EI-(SITI)-TQ-MS, whereSIM signal was used, and (d) EI-(SIM)-TQ-MS. The peak half-widths were �6 s; f-TIC (a) provided �100, n-TIC (b) �21, SITI (c)�40, and SIM (d) �70 data points across the chromatographicpeak. A low signal-to-noise ratio in (a) caused the decrease ofdetectability and reproducibility compared with (b). SITI (c) andSIM (d) had similar signal-to-noise ratio, thus the detectability andreproducibility (peak shape) of the two scanning methods werecomparable. The amount of analyte was 150 pg, which was near
LOD in TIC mode.
601J Am Soc Mass Spectrom 2010, 21, 592–602 EI AND NCI-MS OF PFBHA-DERIVATIZED ALDEHYDES
way to account for this discrepancy, and thus im-prove the precision, would be to use the correspond-ing isotopically-labeled internal standards [23].
LODs and peak shapes (i.e., precision) in SITI (basedon the SIM data) were not compromised compared witha simple SIM for all tested PFBHA-aldehydes (Figure 6cand d) despite the decreased number of data pointsacquired across the chromatographic peaks (e.g., from�70 data points in SIM to �40 in SITI for PFBHA-heptanal, Figure 6c and d). TQ-MS in SITI mode may beequally or more efficient than QIT-MS in TIC.
As expected, the lowest LODs were obtained usingSIM (or using SIM data from SITI mode). AverageLODs were �2 to 4 times lower than with n-TIC withsignificant improvement of the LOD precision as well(Figure 5 and Figure 6). The P values obtained from apaired t-test of SIM and n-TIC (Figure 5) show that thetwo methods were statistically different in sensitivitycomparing groups of derivatized aldehydes (satura-ted and unsaturated linear, aromatic aldehydes, anddialdehydes).
Conclusions
In contrast to general expectation, EI and ECNI-MSoffered similar LODs for 31 of 33 tested PFBHA-derivatized aldehydes. LODs were significantly de-creased (�10- to 20-fold) using ECNI only for two spe-cific polar analytes, derivatized 4-hydroxybenzaldehydeand (5-hydroxymethyl)furfural. Assuming comparableLODs, EI may be suggested as a more suitable tech-nique than ECNI due to the availability of EI-MSlibraries, and predictability of fragmentation patterns.This is an important consideration when, in addition tothe quantitation of targeted compounds, the identifica-tion of unknown peaks is required.
Comparing ECNI and EI based on their single-LODvalues, without any consideration for precision, mayover/underestimate the statistical significance of theobtained results. To overcome this problem, we derivedan approach allowing for calculation of LOD with itsconfidence interval from the calibration curve. Thestatistical calculation also has a large potential fordetermining the limit of quantitation (LOQ) confidenceintervals upon the proper modification of eqs 1, 4, and5. Obtaining the LOQ confidence intervals may becritical when establishing/employing methods forquality control of regulated substances in variousindustries.
Finally, it was confirmed that signal-to-noise ratiosand precisions for PFBHA-aldehydes in the SITI mode(acquisition of SIM and TIC data in a single analysis)were the same as in the SIM mode alone. TQ-MS in SITIwas thus demonstrated to be a good alternative toQIT-MS in TIC for a sensitive analysis of complex
samples.AcknowledgmentsThe authors thank Dr. E. Kozliak and D. Stahl for valuablecomments while writing and editing this manuscript. This workwas sponsored by the North Dakota EPSCoR through NSF grantsATM-0747349 and EPS-0814442, and through the DOE grantDE-FG02-06ER46292, and by the National Center for ResearchResources (NCRR), a component of the National Institutes ofHealth (NIH), through the grant P20RR17699-05; DSM gratefullyacknowledges support from NSF CBET 0651058. The contents ofthis article are solely the responsibility of the authors and do notnecessarily represent the official views of NSF, DOE, and NIH.
Appendix ASupplementary Material
Supplementary material associated with this articlemay be found in the online version at doi:10.1016/j.jasms.2009.12.009.
References1. Le Lacheur, R. M.; Sonnenberg, L. B.; Singer, P. C.; Christman, R. F.;
Charles, M. J. Identification of Carbonyl Compounds in EnvironmentalSamples. Environ. Sci. Technol. 1993, 27, 2745–2753.
2. Culleré, L.; Cacho, J.; Ferreira, V. Analysis for Wine C5-C8 AldehydesThrough the Determination of Their O-(2,3,4,5,6-Pentafluorobenzyl)Oximes Formed Directly in the Solid Phase Extraction Cartridge. Anal.Chim. Acta 2004, 524, 201–206.
3. Liggio, J.; McLaren, R. An Optimized Method for the Determination ofVolatile and Semivolatile Aldehydes and Ketones in Ambient Particu-late Matter. Int. J. Environ. Anal. Chem. 2003, 83, 819–835.
4. Pacolay, B. D.; Ham, J. E.; Wells, J. R. Use of Solid-Phase Microextractionto Detect and Quantify Gas-Phase Dicarbonyls in Indoor Environments.J. Chromatogr. A 2006, 1131, 275–280.
5. Frankel, E. N.; Hu, M. L.; Tappel, A. L. Rapid Headspace Gas Chroma-tography of Hexanal as a Measure of Lipid Peroxidation in BiologicalSamples. Lipids 1989, 24, 976–981.
6. Spiteller, P.; Kern, W.; Reiner, J.; Spiteller, G. Aldehydic Lipid Peroxi-dation Products Derived from Linoleic Acid. Biochim. Biophys. Acta Mol.Cell. Biol. Lipids 2001, 1531, 188–208.
7. Selley, M. L. Determination of the Lipid Peroxidation Product (E)-4-Hydroxy-2-Nonenal in Clinical Samples by Gas Chromatography-Negative-Ion Chemical Ionization Mass Spectrometry of the O-Pentafluorobenzyl Oxime. J. Chromatogr. B 1997, 691, 263–268.
8. Teixido, E.; Santos, F. J.; Puignou, L.; Galceran, M. T. Analysis of5-Hydroxymethylfurfural in Foods by Gas Chromatography-MassSpectrometry. J. Chromatogr. A 2006, 1135, 85–90.
9. Spiteller, G.; Kern, W.; Spiteller, P. Investigation of Aldehydic LipidPeroxidation Products by Gas Chromatography-Mass Spectrometry.J. Chromatogr. A 1999, 843, 29–98.
10. Luo, X. P.; Yazdanpanah, M.; Bhooi, N.; Lehotay, D. C. Determination ofAldehydes and Other Lipid Peroxidation Products in Biological Sam-ples by Gas Chromatography-Mass Spectrometry. Anal. Biochem. 1995,228, 294–298.
11. Hsu, F. F.; Hazen, S. L.; Giblin, D.; Turk, J.; Heinecke, J. W.; Gross, M. L.Mass Spectrometric Analysis of Pentafluorobenzyl Oxime Derivativesof Reactive Biological Aldehydes. Int. J. Mass Spectrom. 1999, 185/186/187, 795–812.
12. Müller, K.; Haferkorn, S.; Grabmer, W.; Wisthaler, A.; Hansel, A.;Kreuzwieser, J.; Cojocariu, C.; Rennenberg, H.; Herrmann, H. BiogenicCarbonyl Compounds Within and Above a Coniferous Forest in Ger-many. Atmos. Environ. 2006, 40, 81–91.
13. Rubio, M. A.; Zamorano, N.; Lissi, E.; Rojas, A.; Gutierrez, L.; Von Baer,D. Volatile Carbonylic Compounds in Downtown Santiago, Chile.Chemosphere 2006, 62, 1011–1020.
14. Jakober, C. A.; Charles, M. J.; Kleeman, M. J.; Green, P. G. LC-MSAnalysis of Carbonyl Compounds and Their Occurrence in DieselEmissions. Anal. Chem. 2006, 78, 5086–5093.
15. Nagy, K.; Pollreisz, F.; Takats, Z.; Vekey, K. Atmospheric PressureChemical Ionization Mass Spectrometry of Aldehydes in BiologicalMatrices. Rapid Commun. Mass Spectrom. 2004, 18, 2473–2478.
16. U.S. Environmental Protection Agency. Determination of CarbonylCompounds in Drinking Water by PentafluorobenzylhydroxylamineDerivatization and Capillary Gas Chromatography with Electron Cap-ture Detection. Method 556. Washington, DC.
17. Destaillats, H.; Charles, M. J. Henry’s Law Constants of Carbonyl-
Pentafluorobenzyl Hydroxylamine (PFHBA) Derivatives in AqueousSolution. J. Chem. Eng. Data 2002, 47, 1481–1487.
602 BERÁNEK ET AL. J Am Soc Mass Spectrom 2010, 21, 592–602
18. Bezabeh, D. Z.; Bamford, H. A.; Schantz, M. M.; Wise, S. A. Deter-mination of Nitrated Polycyclic Aromatic Hydrocarbons in DieselParticulate-Related Standard Reference Materials by Using Gas Chro-matography/Mass Spectrometry with Negative Ion Chemical Ioniza-tion. Anal. Bioanal. Chem. 2003, 375, 381–388.
19. Sugaya, N.; Sakurai, K.; Nakagawa, T.; Onda, N.; Onodera, S.; Morita,M.; Tezuka, M. Development of a Headspace GC/MS Analysis forCarbonyl Compounds (Aldehydes and Ketones) in Household ProductsAfter Derivatization with o-(2,3,4,5,6-Pentafluorobenzyl)-Hydroxylamine.Anal. Sci. 2004, 20, 865–870.
20. Sugaya, N.; Nakagawa, T.; Sakurai, K.; Morita, M.; Onodera, S. Analysis ofAldehydes in Water by Head Space-GC/MS. J. Health Sci. 2001, 47, 21–27.
21. Wichard, T.; Poulet, S. A.; Pohnert, G. Determination and Quantificationof a,b,g,d-Unsaturated Aldehydes as Pentafluorobenzyl-Oxime Deri-vates in Diatom Cultures and Natural Phytoplankton Populations:Application in Marine Field Studies. J. Chromatogr. B 2005, 814, 155–161.
22. Li, Z.; Jacobus, L. K.; Wuelfing, W. P.; Golden, M.; Martin, G. P.; Reed, R. A.Detection and Quantification of Low-Molecular-Weight Aldehydes in
Pharmaceutical Excipients by Headspace Gas Chromatography. J.Chromatogr. A 2006, 1104, 1–10.
23. Beránek, J.; Kubátová, A. Evaluation of Solid-Phase MicroextractionMethods for Determination of Trace Concentration Aldehydes in Aque-ous Solution. J. Chromatogr. A 2008, 1209, 44–54.
24. Kubatova, A.; Steckler, T. S.; Gallagher, J. R.; Hawthorne, S. B.; Picklo,M. J. Toxicity of Wide-Range Polarity Fractions from Wood Smoke andDiesel Exhaust Particulate Obtained Using Hot Pressurized Water.Environ. Toxicol. Chem. 2004, 23, 2243–2250.
25. Hawthorne, S. B.; Kubatova, A. Hot (Subcritical) Water Extraction. InComprehensive Analytical Chemistry, 1st ed.; Barcelo, D., Eds. Elsevier:New York, NY, 2002; pp 587–608.
26. Pawliszyn, J. Solid Phase Microextraction. In Comprehensive AnalyticalChemistry; Barcelo, D., Ed. Elsevier: New York, NY, 2002; pp 389–478.
27. Montgomery, D. C.; Peck, E. A.; Vinning, G. G. Introduction to Linear
Regression Analysis, 4th ed.; John Wiley and Sons: Hoboken, NJ, 2006; pp25–145.
Related Documents