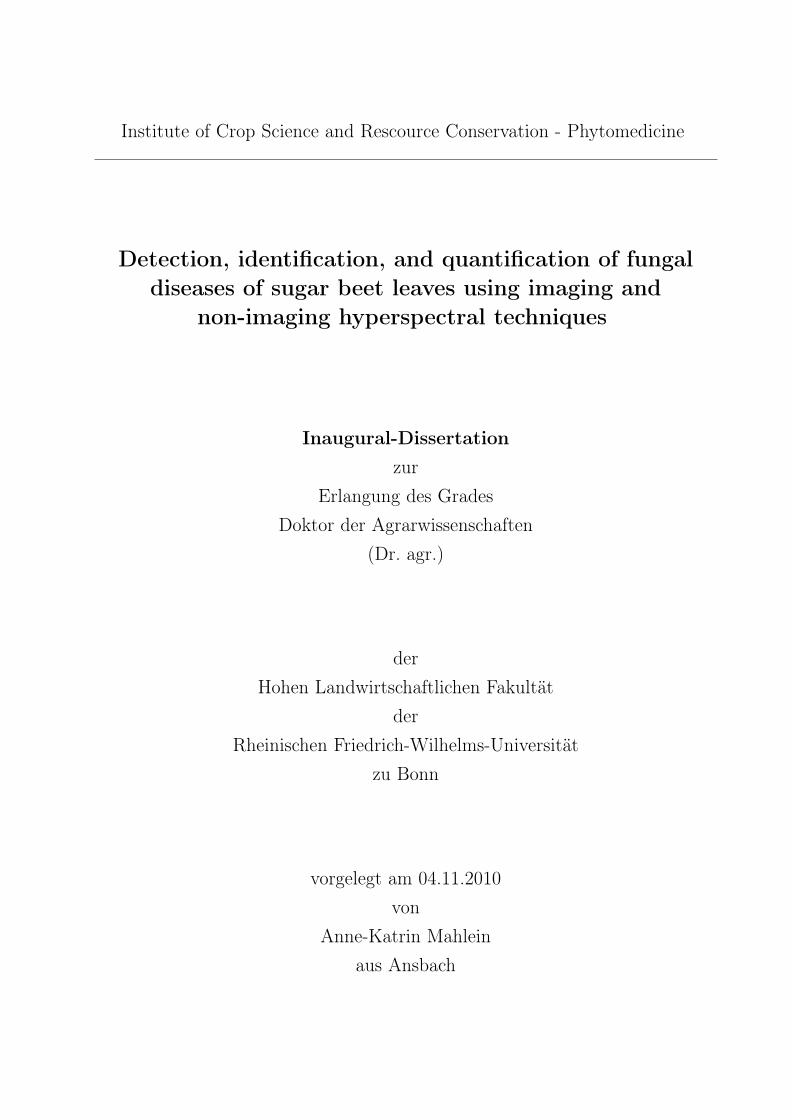
Institute of Crop Science and Rescource Conservation - Phytomedicine Detection, identification, and quantification of fungal diseases of sugar beet leaves using imaging and non-imaging hyperspectral techniques Inaugural-Dissertation zur Erlangung des Grades Doktor der Agrarwissenschaften (Dr. agr.) der Hohen Landwirtschaftlichen Fakultät der Rheinischen Friedrich-Wilhelms-Universität zu Bonn vorgelegt am 04.11.2010 von Anne-Katrin Mahlein aus Ansbach

Welcome message from author
This document is posted to help you gain knowledge. Please leave a comment to let me know what you think about it! Share it to your friends and learn new things together.
Transcript
Institute of Crop Science and Rescource Conservation - Phytomedicine
Detection, identification, and quantification of fungaldiseases of sugar beet leaves using imaging and
non-imaging hyperspectral techniques
Inaugural-Dissertationzur
Erlangung des GradesDoktor der Agrarwissenschaften
(Dr. agr.)
derHohen Landwirtschaftlichen Fakultät
derRheinischen Friedrich-Wilhelms-Universität
zu Bonn
vorgelegt am 04.11.2010von
Anne-Katrin Mahleinaus Ansbach

Referent: Prof. Dr. H.-W. DehneKoreferent: Prof. Dr. H. Goldbach
Tag der mündlichen Prüfung: 20.01.2011Erscheinungsjahr: 2011

In liebevoller Erinnerung an meine Großmutter Maria Eff

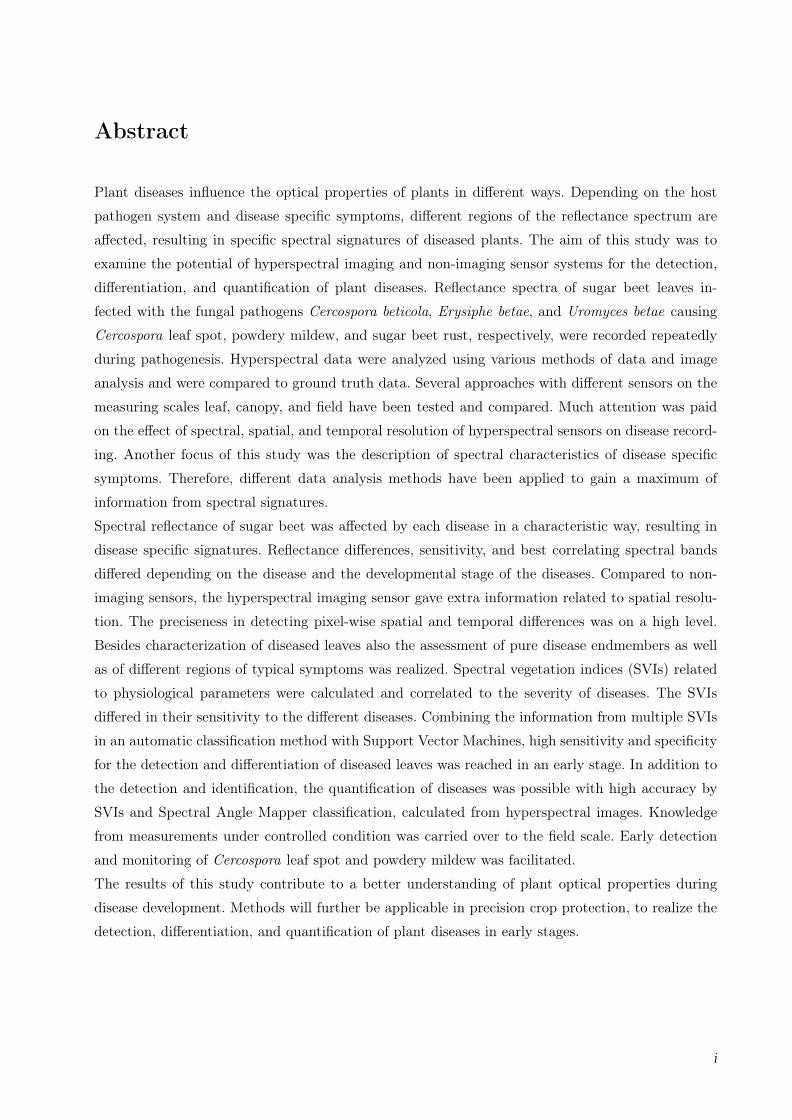
Abstract
Plant diseases influence the optical properties of plants in different ways. Depending on the host
pathogen system and disease specific symptoms, different regions of the reflectance spectrum are
affected, resulting in specific spectral signatures of diseased plants. The aim of this study was to
examine the potential of hyperspectral imaging and non-imaging sensor systems for the detection,
differentiation, and quantification of plant diseases. Reflectance spectra of sugar beet leaves in-
fected with the fungal pathogens Cercospora beticola, Erysiphe betae, and Uromyces betae causing
Cercospora leaf spot, powdery mildew, and sugar beet rust, respectively, were recorded repeatedly
during pathogenesis. Hyperspectral data were analyzed using various methods of data and image
analysis and were compared to ground truth data. Several approaches with different sensors on the
measuring scales leaf, canopy, and field have been tested and compared. Much attention was paid
on the effect of spectral, spatial, and temporal resolution of hyperspectral sensors on disease record-
ing. Another focus of this study was the description of spectral characteristics of disease specific
symptoms. Therefore, different data analysis methods have been applied to gain a maximum of
information from spectral signatures.
Spectral reflectance of sugar beet was affected by each disease in a characteristic way, resulting in
disease specific signatures. Reflectance differences, sensitivity, and best correlating spectral bands
differed depending on the disease and the developmental stage of the diseases. Compared to non-
imaging sensors, the hyperspectral imaging sensor gave extra information related to spatial resolu-
tion. The preciseness in detecting pixel-wise spatial and temporal differences was on a high level.
Besides characterization of diseased leaves also the assessment of pure disease endmembers as well
as of different regions of typical symptoms was realized. Spectral vegetation indices (SVIs) related
to physiological parameters were calculated and correlated to the severity of diseases. The SVIs
differed in their sensitivity to the different diseases. Combining the information from multiple SVIs
in an automatic classification method with Support Vector Machines, high sensitivity and specificity
for the detection and differentiation of diseased leaves was reached in an early stage. In addition to
the detection and identification, the quantification of diseases was possible with high accuracy by
SVIs and Spectral Angle Mapper classification, calculated from hyperspectral images. Knowledge
from measurements under controlled condition was carried over to the field scale. Early detection
and monitoring of Cercospora leaf spot and powdery mildew was facilitated.
The results of this study contribute to a better understanding of plant optical properties during
disease development. Methods will further be applicable in precision crop protection, to realize the
detection, differentiation, and quantification of plant diseases in early stages.
i

Kurzfassung
Pflanzenkrankheiten wirken sich auf die optischen Eigenschaften von Pflanzen in unterschiedli-
cher Weise aus. Verschiedene Bereiche des Reflektionsspektrums werden in Abhängigkeit von Wirt-
Pathogen System und krankheitsspezifischen Symptomen beeinflusst. Hyperspektrale, nicht-invasive
Sensoren bieten die Möglichkeit, optische Veränderungen zu einem frühen Zeitpunkt der Krankheits-
entwicklung zu detektieren. Ziel dieser Arbeit war es, das Potential hyperspektraler abbildender
und nicht abbildender Sensoren für die Erkennung, Identifizierung und Quantifizierung von Pflan-
zenkrankheiten zu beurteilen. Zuckerrübenblätter wurden mit den pilzlichen Erregern Cercospora
beticola, Erysiphe betae bzw. Uromyces betae inokuliert und die Auswirkungen der Entwicklung
von Cercospora Blattflecken, Echtem Mehltau bzw. Rübenrost auf die Reflektionseigenschaften
erfasst und mit optischen Bonituren verglichen. Auf den Skalenebenen Blatt, Bestand und Feld
wurden Messansätze mit unterschiedlichen Sensoren verglichen. Besonders berücksichtigt wurden
hierbei Anforderungen an die spektrale, räumliche und zeitliche Auflösung der Sensoren. Ein wei-
terer Schwerpunkt lag auf der Beschreibung der spektralen Eigenschaften von charakteristischen
Symptomen. Verschiedene Auswerteverfahren wurden mit dem Ziel angewendet, einen maximalen
Informationsgehalt aus spektralen Signaturen zu gewinnen.
Jede Krankheit beeinflusste die spektrale Reflektion von Zuckerrübenblättern auf charakteristische
Weise. Differenz der Reflektion, Sensitivität sowie Korrelation der spektralen Bänder zur Befallsstär-
ke variierten in Abhängigkeit von den Krankheiten. Eine höhere Präzision durch die pixelweise Er-
fassung räumlicher und zeitlicher Unterschiede von befallenem und gesundem Gewebe konnte durch
abbildende Sensoren erreicht werden. Spektrale Vegetationsindizes (SVIs), mit Bezug zu pflanzen-
physiologischen Parametern wurden aus den Hyperspektraldaten errechnet und mit der Befallsstärke
korreliert. Die SVIs unterschieden sich in ihrer Sensitivität gegenüber den drei Krankheiten. Durch
den Einsatz von maschinellem Lernen wurde die kombinierte Information der errechneten Vegeta-
tionsindizes für eine automatische Klassifizierung genutzt. Eine hohe Sensitivität sowie eine hohe
Spezifität bezüglich der Erkennung und Differenzierung von Krankheiten wurden erreicht. Eine
Quantifizierung der Krankheiten war neben der Detektion und Identifizierung mittels SVIs bzw.
Klassifizierung mit Spektral Angle Mapper an hyperspektralen Bilddaten möglich.
Die Ergebnisse dieser Arbeit tragen zu einem besseren Verständnis der optischen Eigenschaften von
Pflanzen unter Pathogeneinfluss bei. Die untersuchten Methoden bieten die Möglichkeit in Anwen-
dungen des Präzisionspflanzenschutzes implementiert zu werden, um eine frühzeitige Erkennung,
Differenzierung und Quantifizierung von Pflanzenkrankheiten zu ermöglichen.
ii
List of Abbreviations
ANN . . . . . . . . . . . . . . . . Artificial Neural NetworksARI . . . . . . . . . . . . . . . . . Anthocyanin Reflectance IndexATCOR4 . . . . . . . . . . . . Atmospheric/Topographic Correction Algorithms for Airborne
Sensors 4BGI2 . . . . . . . . . . . . . . . . Blue/Green Index 2BRDF . . . . . . . . . . . . . . . Bidirectional Reflectance Distribution FunctionCar . . . . . . . . . . . . . . . . . . CarotenoidsChla . . . . . . . . . . . . . . . . . Chlorophyll aChlb . . . . . . . . . . . . . . . . . Chlorophyll bChltotal . . . . . . . . . . . . . . total ChlorophyllCLS . . . . . . . . . . . . . . . . . Cercospora leaf spotDMSO . . . . . . . . . . . . . . DimethylsulfoxideECa . . . . . . . . . . . . . . . . . apparent Electrical ConductivityFWHM . . . . . . . . . . . . . Full Width at Half MaximumGIS . . . . . . . . . . . . . . . . . . Geographic Information SystemGPS . . . . . . . . . . . . . . . . . Global Positioning SystemGS . . . . . . . . . . . . . . . . . . . Growth StageHyMap . . . . . . . . . . . . . . Hyperspectral MapperIDW . . . . . . . . . . . . . . . . . Inverse Distance WeightingLAI . . . . . . . . . . . . . . . . . . Leaf Area IndexLIBSVM . . . . . . . . . . . . Library for SVMsmCAI . . . . . . . . . . . . . . . Modified Chlorophyll Absorption IntegralMCARI . . . . . . . . . . . . . Modified Chlorophyll Absorption Reflectance IndexmND . . . . . . . . . . . . . . . . Modified Normalized Difference IndexMNF . . . . . . . . . . . . . . . . Minimum Noise FractionmSR . . . . . . . . . . . . . . . . . Modified Simple RatioND . . . . . . . . . . . . . . . . . . Normalized Difference IndexNDVI . . . . . . . . . . . . . . . Normalized Difference Vegetation IndexNIR . . . . . . . . . . . . . . . . . Near Infrared ReflectanceOSAVI . . . . . . . . . . . . . . Optimized Soil Adjusted Vegetation IndexPA . . . . . . . . . . . . . . . . . . . Precision AgriculturePM . . . . . . . . . . . . . . . . . . Powdery mildewPRI . . . . . . . . . . . . . . . . . . Photochemical Reflectance IndexPSND . . . . . . . . . . . . . . . Pigment Specific Normalized DifferencePSRI . . . . . . . . . . . . . . . . Plant Senescence Reflectance Index
iii

PSSR . . . . . . . . . . . . . . . . Pigment Specific Simple RatioREP . . . . . . . . . . . . . . . . . Red Edge PositionRGB . . . . . . . . . . . . . . . . Red Green BlueROI . . . . . . . . . . . . . . . . . Region of InterestROSIS . . . . . . . . . . . . . . . Reflective Optics Systems Imaging SpectrometerRRE . . . . . . . . . . . . . . . . . . Reflectance at inflection pointSAM . . . . . . . . . . . . . . . . Spectral Angle MapperSBR . . . . . . . . . . . . . . . . . Sugar beet rustSG . . . . . . . . . . . . . . . . . . . Sum Green IndexSIPI . . . . . . . . . . . . . . . . . Structure Insensitive Pigment IndexSLU . . . . . . . . . . . . . . . . . Spectral Linear UnmixingSR . . . . . . . . . . . . . . . . . . . Simple RatioSV . . . . . . . . . . . . . . . . . . . Sum VIS IndexSVI . . . . . . . . . . . . . . . . . . Spectral Vegetation IndicesSVM . . . . . . . . . . . . . . . . Support Vector MachinesSWIR . . . . . . . . . . . . . . . Shortwave Infrared ReflectanceVIS . . . . . . . . . . . . . . . . . . Visible reflectionWI . . . . . . . . . . . . . . . . . . . Water Index
iv

Contents
Abstract i
Kurzfassung ii
List of Abbreviations iii
1 INTRODUCTION 1
2 LITERATURE REVIEW 5
2.1 Precision Agriculture . . . . . . . . . . . . . . . . . . . . . . . . 52.2 Precision crop protection and monitoring of plant diseases . . . . 72.3 Optical sensor systems . . . . . . . . . . . . . . . . . . . . . . . 82.4 Reflection of vegetation . . . . . . . . . . . . . . . . . . . . . . . 102.5 Hyperspectral sensors for disease detection . . . . . . . . . . . . 152.6 Analysis of hyperspectral data . . . . . . . . . . . . . . . . . . . 172.7 Host-pathogen model . . . . . . . . . . . . . . . . . . . . . . . . 202.8 Disease management of foliar sugar beet diseases . . . . . . . . . 22
3 MATERIAL AND METHODS 25
3.1 Organisms . . . . . . . . . . . . . . . . . . . . . . . . . . . . . . 253.1.1 Plants . . . . . . . . . . . . . . . . . . . . . . . . . . . . 253.1.2 Pathogens . . . . . . . . . . . . . . . . . . . . . . . . . . 25
3.2 Plant cultivation . . . . . . . . . . . . . . . . . . . . . . . . . . . 253.2.1 Controlled conditions . . . . . . . . . . . . . . . . . . . . 253.2.2 Field experiment . . . . . . . . . . . . . . . . . . . . . . . 26
v

Contents
3.3 Production and inoculation of pathogens . . . . . . . . . . . . . 27
3.3.1 Cercospora beticola . . . . . . . . . . . . . . . . . . . . . 27
3.3.2 Erysiphe betae . . . . . . . . . . . . . . . . . . . . . . . . 28
3.3.3 Uromyces betae . . . . . . . . . . . . . . . . . . . . . . . 28
3.4 Assessment of plant physiological and physiochemical parameters 29
3.4.1 Disease assessment . . . . . . . . . . . . . . . . . . . . . 29
3.4.2 Microscopic investigations . . . . . . . . . . . . . . . . . . 29
3.4.2.1 Stereo microscopy . . . . . . . . . . . . . . . . . 29
3.4.2.2 Scanning electron microscopy . . . . . . . . . . . 30
3.4.3 Pigment assessment . . . . . . . . . . . . . . . . . . . . . 30
3.4.3.1 SPAD-meter measurements . . . . . . . . . . . . 30
3.4.3.2 Extraction of leaf pigment . . . . . . . . . . . . 30
3.4.3.3 Measurement of pigment concentrations . . . . . 31
3.5 Sensor systems/Hyperspectral measurements . . . . . . . . . . . 31
3.5.1 ASD FieldSpecPro FR/ASD FieldSpecPro JR . . . . . . . 31
3.5.2 Hyperspectral camera system ImSpector V10E . . . . . . 33
3.5.2.1 Technical setup . . . . . . . . . . . . . . . . . . 34
3.5.2.2 Normalization and preprocessing of hyperspec-tral data . . . . . . . . . . . . . . . . . . . . . . 36
3.5.3 Airborne sensors . . . . . . . . . . . . . . . . . . . . . . . 36
3.6 EM 38 soil sensor . . . . . . . . . . . . . . . . . . . . . . . . . . 37
3.7 Data analysis . . . . . . . . . . . . . . . . . . . . . . . . . . . . 37
3.7.1 Development of spectral signatures . . . . . . . . . . . . . 37
3.7.2 Spectral vegetation indices . . . . . . . . . . . . . . . . . 38
3.7.3 Spectral Angle Mapping classification . . . . . . . . . . . 41
3.7.4 Machine learning . . . . . . . . . . . . . . . . . . . . . . 42
3.7.5 Geo-referenced maps . . . . . . . . . . . . . . . . . . . . 43
3.8 Statistical analysis . . . . . . . . . . . . . . . . . . . . . . . . . . 44
vi
Contents
4 RESULTS 45
4.1 Etiology of sugar beet diseases . . . . . . . . . . . . . . . . . . . 464.1.1 Disease progress on leaf scale . . . . . . . . . . . . . . . . 464.1.2 Disease progress on canopy scale . . . . . . . . . . . . . . 484.1.3 Temporal and spatial symptom development . . . . . . . 484.1.4 Modifications of leaf structure during pathogenesis . . . . 524.1.5 Effect of foliar diseases on leaf pigment content . . . . . . 53
4.2 Differentiation of foliar diseases based on spectral signatures ofinfected leaves . . . . . . . . . . . . . . . . . . . . . . . . . . . . 564.2.1 Impact of foliar diseases on the spectral reflectance of
sugar beet . . . . . . . . . . . . . . . . . . . . . . . . . . 564.2.2 Selection of disease-specific wavelengths . . . . . . . . . . 67
4.3 Spectral vegetation indices as indicators of plant status and theircorrelation to diseases . . . . . . . . . . . . . . . . . . . . . . . . 734.3.1 Effect of disease progression on spectral vegetation indices 734.3.2 Combination of spectral vegetation indices for disease
identification . . . . . . . . . . . . . . . . . . . . . . . . . 794.4 Detection and classification of plant diseases with Support Vector
Machines based on spectral vegetation indices . . . . . . . . . . . 834.4.1 Dichotomous classification between healthy and diseased
sugar beet leaves . . . . . . . . . . . . . . . . . . . . . . . 844.4.2 Multi-class classification among healthy leaves and leaves
with specific disease symptoms . . . . . . . . . . . . . . . 854.4.3 Classification of healthy leaves and leaves inoculated with
fungal pathogens at early stages of pathogenesis . . . . . . 854.5 Hyperspectral imaging for disease detection, identification, and
quantification . . . . . . . . . . . . . . . . . . . . . . . . . . . . 884.5.1 Pixel-wise attribution of spectral signatures during dis-
ease development . . . . . . . . . . . . . . . . . . . . . . 884.5.1.1 Spectral signatures of mature symptoms . . . . . 88
vii
Contents
4.5.1.2 Changes in spectral signatures during pathogenesis 894.5.2 Spatial illustration of vegetation indices during disease
development . . . . . . . . . . . . . . . . . . . . . . . . . 924.5.2.1 Binary classification of healthy and diseased leaf
tissue by spectral vegetation indices . . . . . . . 964.5.3 Spectral angle mapper classification for the assessment
of foliar leaf diseases from hyperspectral images and itsability to distinguish multiple disease symptoms . . . . . . 100
4.6 Monitoring of plant diseases on the field scale using remote sens-ing technologies . . . . . . . . . . . . . . . . . . . . . . . . . . . 1094.6.1 Spatial soil heterogeneity . . . . . . . . . . . . . . . . . . 1094.6.2 Progress of Cercospora leaf spot and powdery mildew . . 1104.6.3 Impact of plant diseases on sugar beet biomass . . . . . . 1124.6.4 Multi-temporal and multi-sensoral monitoring of diseases . 113
5 DISCUSSION 119
6 SUMMARY 143
REFERENCES 147
viii

1. INTRODUCTION
Von Witzke et al. (2008) recently demonstrated that the worldwide demandfor agricultural products exceeds the supply; hence there is a need to managethe worldwide production of agricultural commodities more efficiently. Thepotential yield of crops is affected by different stresses (e.g. pest, weed, nutritiondeficiencies or water stress), which can reduce the production capacity. Oerkeand Dehne (2004) indicated that the impact of diseases, insects, and weedsrepresents a potential annual loss of 40% of world food production.
Traditional agricultural management practices assume parameters in crop fieldsto be homogeneous, thus the output of pesticides and managing actions is notin relation to the demands (Steiner et al., 2008). Due to high control costsand the environmental impact of fungicides, a site-specific application accord-ing to precision agriculture techniques is of high interest. Precision agriculture– integrating different modern technologies like sensor, information, and man-agement systems – aims to match agricultural input and practices to the spatialand temporal variability within a field. Thus, a better use of resource and anavoidance of great differences in yield quality and quantity due to small-scalesite-specific differences can be attained.
Considering that the occurrence of diseases depends on specific environmentalfactors and that diseases often exhibit a patchy distribution in fields, remotesensing techniques could be useful in identifying primary disease foci and areasdiffering in disease severity in the field (Franke and Menz, 2007; Franke et al.,2009). Based on the information from remote sensing techniques or non invasive
1
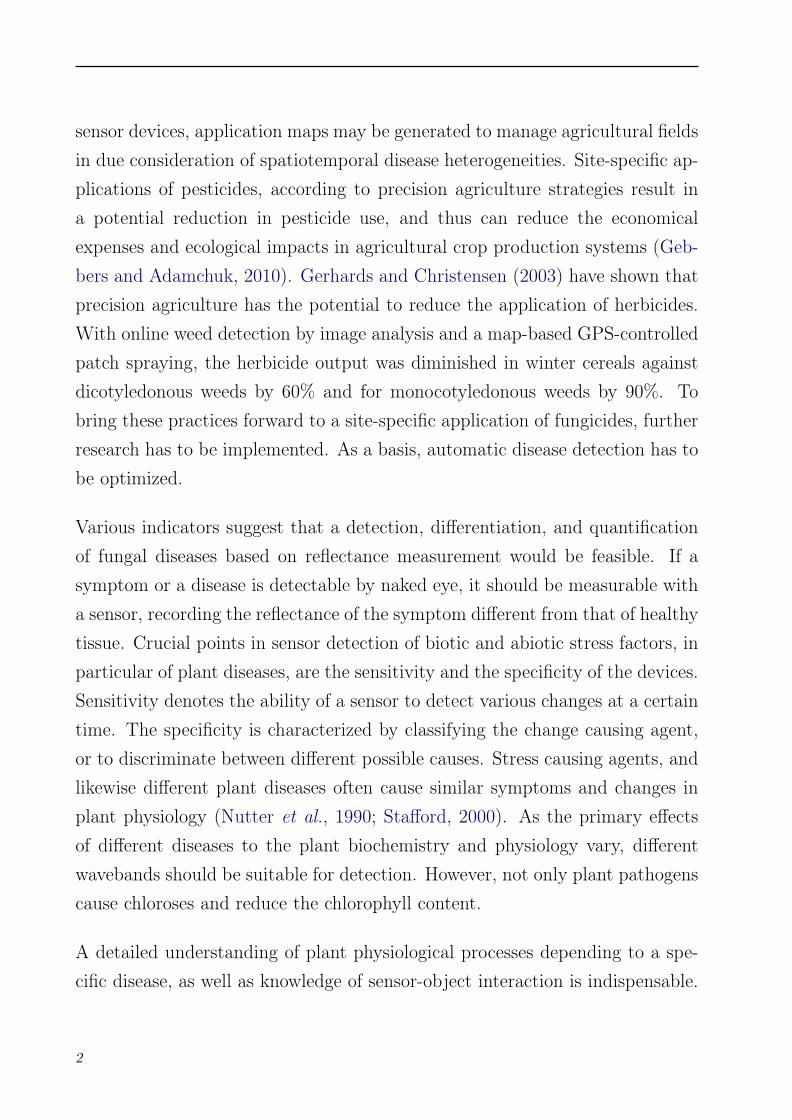
sensor devices, application maps may be generated to manage agricultural fieldsin due consideration of spatiotemporal disease heterogeneities. Site-specific ap-plications of pesticides, according to precision agriculture strategies result ina potential reduction in pesticide use, and thus can reduce the economicalexpenses and ecological impacts in agricultural crop production systems (Geb-bers and Adamchuk, 2010). Gerhards and Christensen (2003) have shown thatprecision agriculture has the potential to reduce the application of herbicides.With online weed detection by image analysis and a map-based GPS-controlledpatch spraying, the herbicide output was diminished in winter cereals againstdicotyledonous weeds by 60% and for monocotyledonous weeds by 90%. Tobring these practices forward to a site-specific application of fungicides, furtherresearch has to be implemented. As a basis, automatic disease detection has tobe optimized.
Various indicators suggest that a detection, differentiation, and quantificationof fungal diseases based on reflectance measurement would be feasible. If asymptom or a disease is detectable by naked eye, it should be measurable witha sensor, recording the reflectance of the symptom different from that of healthytissue. Crucial points in sensor detection of biotic and abiotic stress factors, inparticular of plant diseases, are the sensitivity and the specificity of the devices.Sensitivity denotes the ability of a sensor to detect various changes at a certaintime. The specificity is characterized by classifying the change causing agent,or to discriminate between different possible causes. Stress causing agents, andlikewise different plant diseases often cause similar symptoms and changes inplant physiology (Nutter et al., 1990; Stafford, 2000). As the primary effectsof different diseases to the plant biochemistry and physiology vary, differentwavebands should be suitable for detection. However, not only plant pathogenscause chloroses and reduce the chlorophyll content.
A detailed understanding of plant physiological processes depending to a spe-cific disease, as well as knowledge of sensor-object interaction is indispensable.
2

1. INTRODUCTION
To implement hyperspectral sensors in threshold-orientated decision makingsystems, the sensor system has to have the capability for disease quantifica-tion. Beside the differentiation of stress factors and plant diseases among eachothers, hyperspectral sensors have to allow a pre-symptomatic detection of dis-ease infection, to intervene with proper management strategies, like time- andsite-specific fungicide application.
This study aims at exploring the potential of non-invasive hyperspectral sen-sor systems from remote sensing science for the detection of plant diseases.Experiments were carried out on sugar beet plants and their foliar pathogensCercospora beticola, Erysiphe betae, and Uromyces betae to investigate the useof imaging and non-imaging hyperspectral sensors referring to the followingquestions: Do plant diseases have specific spectral signatures useful for diseaseidentification? Is an early detection of infection by pathogens possible? What isthe potential of sensors to differentiate among leaf diseases? Is a quantificationof plant diseases at different stages possible?
Specific spectral signatures of leaves, diseased with Cercospora leaf spot, pow-dery mildew, and sugar beet rust, caused by Cercospora beticola, Erysiphe betae,and Uromyces betae, respectively, have been evaluated and compared duringdisease development. The three disease causing pathogens differ in their wayof life and in their interaction with the host plant sugar beet. Thus, hyper-spectral data of three differing host-pathogen systems have been assessed andcomparatively analysed.
The sensitivity and specificity of hyperspectral sensing for disease detection isinfluenced by several factors. Hence, different approaches with different sensor-devices on different measuring scales have been tested and compared (Fig. 1.1).Observing the leaf and canopy level, much attention was paid on requirementson the spectral, spatial, and temporal resolution of hyperspectral sensors fordisease detection. Experiments with different sensor systems have been made onthe leaf and canopy level under controlled conditions and in the field. One focus
3

of this study was the comparison of non-imaging and imaging hyperspectralsensors for their suitability of disease detection and for a detailed description ofspectral characteristics of disease specific symptoms. Until now disease-specificspectral vegetation indices or the analysis of hyperspectral data for diseasedetection are not available. Therefore, different data analysis methods havebeen applied to gain a maximum of information from spectral signatures.
In an interdisciplinary approach with the Institute of Geodesy and Geoinfor-mation, University of Bonn, an optimization of data analysis methods and thedevelopment of disease specific spectral indices for an early detection and differ-entiation of fungal diseases have been realized. This PhD work was embeddedin the Research Training Group 722 ’Use of Information Techniques for Pre-cision Plant Protection’ funded by the German Research Foundation (DFG)from 2007 to 2010.
Figure 1.1: Concept of data assessment and data analysis on different scales with specific hyperspectralsensors.
4
2. LITERATURE REVIEW
2.1 Precision Agriculture
The use of innovative technologies collectively named ’Precision Agriculture’ isa promising approach to optimize agricultural production of crops. In field cropproduction precision agriculture methodologies are applied to site-specific ap-plication of fertilizer or pesticides, automatic guidance of agricultural vehicles,product traceability, on-farm research or management of production systems(Gebbers and Adamchuk, 2010). Recently precision agriculture also enhancesmanagement decisions in livestock production, pasture management, viticul-ture, and horticulture (Gebbers and Adamchuk, 2010; Schellberg et al., 2008).Precision crop production aims to match agricultural input and practices to thespatial and temporal variability within a field, instead of managing an entirefield based on a hypothetical average. Small-scale site-specific differences canlead to great differences in yield and quality, thus a better use of resourcesto preserve the quality and quantity of agricultural products with respect onenvironmental resources is essential (Gebbers and Adamchuk, 2010).
The philosophy behind precision agriculture is not only including a direct eco-nomical optimization of agricultural production, it also stands for a reductionof harmful outputs into environment and non-target organisms. In particular acontamination of water, soil, and food resources with pesticides has to be min-imized in crop production (Bongiovanni and Lowenberg-Deboer, 2004). With
5
2.1. Precision Agriculture
this aim, site-specific fertilizer application was the first successfully implementa-tion in 1988, soil sampling, yield mapping, and site specific herbicide applicationsucceeded (Adamchuk et al., 2004; Gerhards and Oebel, 2006; Stafford, 2000).
Against the background of food security and sustainable production, adequatetechnologies are fundamental for this agricultural practice (Zhang et al., 2002).The implementation of information-based management systems into crop pro-duction since the mid 1980s implies a huge potential to modernize the agricul-tural practice. Since then different techniques for the characterization of soilsand crops have been engineered and included into decision making systems. Toname the most important ones, precision agriculture integrates different tech-nologies like global positioning systems (GPS), geographic information systems(GIS), as well as different kind of sensors and therefore it demands a high levelof expertise (Kühbauch and Hawlitschka, 2003; Stafford, 2000).
For the future an information-driven crop production as a combination ofgeospatial and agricultural data management will encourage the actual utiliza-tion of precision agriculture applications (Nash et al., 2009; Reichardt et al.,2009). Current research on precision agriculture for crop production focuseson the development of sensors for remote detection of crops and soil in realtime. Relevant field parameters like soil properties, topography, water status,crop micro-climate, nutritional status, weeds, and pests and diseases as well asyield can be monitored and estimated. Integration of different remote sensingtechniques and image analysis in combination with a global positioning systemwill be an essential step towards online application.
Still one limiting factor of a successful use of precision agriculture is the in-terpretation of properties derived from sensor data, rather than the collectionof relevant data (Schellberg et al., 2008). The interpretation of informationand its implementation into robust decision support systems will improve theacceptance and implementation of precision agriculture techniques.
6

2. LITERATURE REVIEW
2.2 Precision crop protection and monitoring of plant
diseases
Precision crop protection is a demanding challenge within precision agricultureand offers high potential to reduce the costs and environmental impact of fungi-cide use. According to the characteristics of plant diseases, a site-specific cropmanagement requires a high density of spatial and temporal information withregard to the status of any crop growth-relevant parameter. The disease moni-toring and decision-making process is the fundamental origin for a site-specificmanaging of spatially and temporally variable diseased field sites (Steiner et al.,2008).
Currently two different approaches for site specific fungicide application are un-der examination; indirect decision-making by assessing canopy density or cropgrowth stage (Dammer et al., 2008; Scotford and Miller, 2005) or direct dis-ease detection (West et al., 2003). These modern methods in plant productionand crop protection are closely related to innovative technologies. Near-rangeand remote sensing, like hyper- and multispectral sensors or thermography inprecision pest management possess multiple opportunities to increase the pro-ductivity of agricultural production systems and to reduce the environmentalburden from pesticides. Real-time decision based on the information of thesensing system- ’spray or don’t spray’ can control cultural practices (Stafford,2000). Due to high control costs and the environmental impact of fungicides, asite-specific application according to precision farming techniques – i.e. monitorand manage spatially-variable fields site-specifically (Stafford, 2000) – is of highinterest. Therefore, a precise, reproducible, and time-saving disease monitoringmethod is essential (Bock et al., 2010; Hillnhuetter and Mahlein, 2008; Sted-dom et al., 2005). Remote sensing technologies are one basic tool of precisionagricultural practice which can provide an alternative to visual disease assess-ment (Nutter et al., 1990). West et al. (2003) have provided a detailed overview
7

2.3. Optical sensor systems
of the sensor-based detection of stress. The variety/nature of a to monitoredphenomenon and its environmental circumstances thereby defines the requiredsensor specifications (e.g. spatial and spectral resolution; temporal availability).
Many researchers have shown the potential of remote sensing techniques inthe area of agriculture (Combal et al., 2002; Doraiswamy et al., 2003; Galvaoet al., 2009; Kruse et al., 2006; Oppelt and Mauser, 2004; Thenkabail et al.,2000) and also in the field of plant disease detection. E.g. Franke and Menz(2007), Huang et al. (2007), Moshou et al. (2004), Steddom et al. (2005), andZhang et al. (2003) have proven the potential of spectral sensor systems forthe detection of fungal diseases. To implement these sensors into precisionplant protection technologies, they have to be robust, low-cost, and preferablyreal-time sensing (Zhang et al., 2002).
2.3 Optical sensor systems
Innovative sensor systems can provide detailed and highly resolved informationon crop systems and single plants. Different sensor types can assess differentcharacteristics/parameters of the targeted objects, depending on signal-objectinteractions. Chaerle and van der Straeten (2001) gave a detailed overview onvarious sensor types used for assessing plant physiological parameters. Encour-aging approaches are measurements based on thermal characteristics (Jonesand Schofield, 2008; Lenthe et al., 2007; Oerke et al., 2006), chlorophyll fluo-rescence (Buschmann and Lichtenthaler, 1998; Chaerle et al., 2007a; Rascheret al., 2000), and reflectance of plants (Oppelt and Mauser, 2004; Peñuelas andFilella, 1998; Ustin et al., 2009). As thermal response and modifications inphotosynthesis of plants largely lack diagnostic potential for the identificationof plant diseases, more sophisticated sensor systems have to be developed. Thepresent work focuses on the use of non-imaging and imaging hyperspectral sen-sors for the detection, identification, and quantification of plant diseases. Most
8

2. LITERATURE REVIEW
of the optical sensor systems originate from geographical or remote sensing sci-ence, but there are various approaches in literature to implement these sensorsinto plant science.
The sensor evolution in remote sensing started from multispectral sensors to hy-perspectral sensors and upcoming to ultraspectral sensors (Meigs et al., 2008).These technically complex devices provide a multiplicity of information over thecovered spectral range. But depending on the measured object and aim justfew regions of the spectral range are of interest. Narrow spectral bands of hy-perspectral sensors with a spectral resolution up to 1 nm are highly correlatedto each other, redundant information is being measured. Likewise, understand-ing of spectral characteristics of the object and of signal-object interaction iselementary for optimization of remote sensing sensors for disease detection.
Currently reflectance sensors are classified on their spatial scale, on their spec-tral resolution, and by their way of data assessed, i.e. imaging or non-imagingsensors (Melesse et al., 2007). Each sensor system covers a different scale, forexample airborne or spaceborne far-range systems with a smaller spatial resolu-tion, or near-range sensing systems with maximal spatial resolution. The maxi-mal spatial resolution is defined by the minimum size of one pixel and hence thesmallest identifiable symptom or structure. Technological advances in sensordevelopment, in particular progress from multispectral broadband sensors tohyperspectral narrowband sensors have drastically increased the quantity andquality of available information.
The way of data recording is essential for data interpretation and analysis. Non-imaging sensors measure the averaged reflectance over a defined area (dependingon the field of view of the sensor), a detailed inference of the reflectance sourceor pure object reflectance is not feasible (Mahlein et al., 2010; Steiner et al.,2008). Further to non-imaging spectroradiometers, hyperspectral cameras facil-itate the detection of both, spectral and spatial information of an object. Theinformation of a hyperspectral image is based on the spatial X- and Y-axes and
9
2.4. Reflection of vegetation
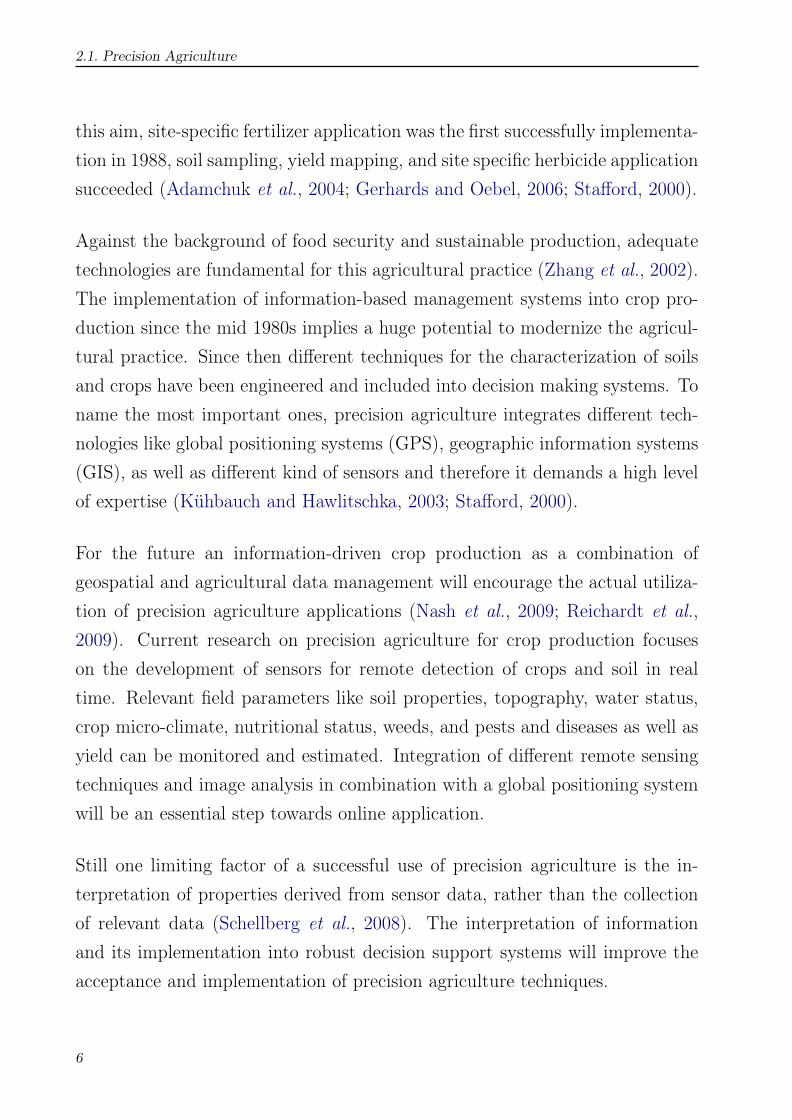
a spectral Z-axis, which allows a more detailed and allocated interpretation ofthe signal object interaction. Each spatially located pixel of an image containsthe information of several wavelengths (Fig. 2.1). The use of hyperspectralimaging systems in plant pathology or in disease severity assessment is still inthe state of research.
Figure 2.1: Structure of a hyperspectral image data cube of a sugar beet leaf with spatial dimensionsX and Y, and the continuous spectrum with 210 reflectance values for an image-pixel from the spectraldimension Z.
2.4 Reflection of vegetation
After various processes of absorption, reflection, and scattering in the atmo-sphere, approximately 40% of the solar flux impacts to earth surface (Brooksand Miller, 1963; Lacis and Hansen, 1973). This electromagnetic radiationinteracts with surfaces in different ways. The main interactions are I) absorp-tion, i.e. the process by which energy of a photon is taken up by matter; II)transmission, the process of light passing through matter; and III) reflectance,
10

2. LITERATURE REVIEW
the process by which incident illumination reacts with matter and returns backfrom its surface, converted to radiant energy (Baranoski and Rokne, 2001). Thereflectance is calculated by the ratio of radiant energy reflected from a surfaceto the radiant energy incident on the surface and is therefore independent ofillumination variation (Lillesand and Kiefer, 2000).
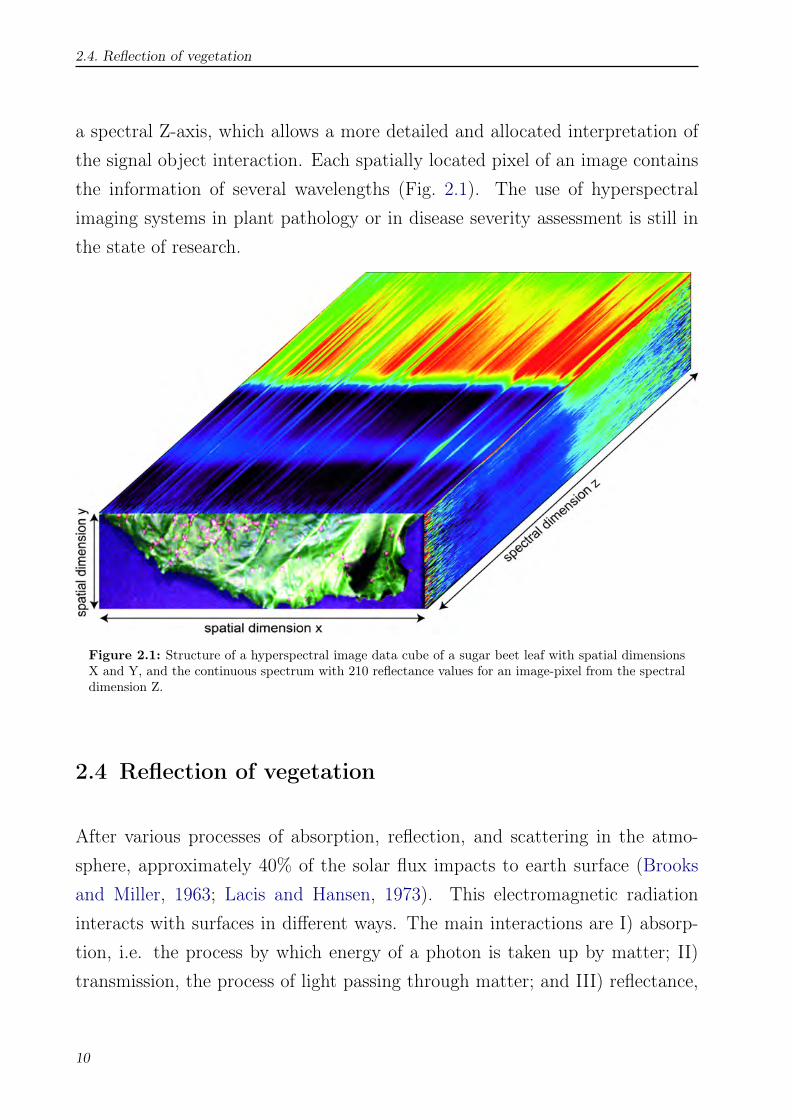
Plant - sunlight interactionIn the interaction between sunlight and plant tissue, solar radiation is the en-gine of photosynthetic processes and therewith the source of life on earth. Theattenuation of light insight plant leaves results from complex absorption andscattering processes, influenced by the biochemical composition and morpho-logical characteristics of the leaf tissue (Fig. 2.2; Govaerts et al., 1996). Leafreflectance of sunlight in the visible (VIS, 400 to 700 nm), near infrared (NIR,700 to 1100 nm) and short wave infrared (SWIR, 1100 to 2500 nm) are drivenby multiple interactions: radiant energy absorption induced by leaf chemistry,scattering of light as a result of leaf surface and internal cellular structures, andradiant energy absorption induced by leaf water content (Fig. 2.3; Carter andKnapp, 2001; Jacquemoud and Ustin, 2001).
The VIS range is characterized by low reflectance, due to absorption by photo-active plant pigments. The chlorophyll amount in the parenchyma and spongymesophyll controls the level of light absorption (Govaerts et al., 1996). Chloro-phyll a and chlorophyll b absorb blue (400 to 495 nm) and red light (620 to 700nm), and transfer the absorbed energy into the photosynthetic electron chain(Curran, 1989; Gamon and Surfus, 1999; Sims and Gamon, 2002). Carotenoidsabsorb blue light (400 to 495 nm) and contribute this energy to the photosyn-thetic system as well (Sims and Gamon, 2002). Furthermore carotenoids havea trapping function to diminish light-induced damages by absorbing light inthe UV-region (Merzylak et al., 2008). Anthocyanins which have functions inphotoprotection against UV light, osmotic regulation, and warming (Archettiet al., 2009; Gould et al., 1995; Lee et al., 2003) have an absorption maximum at
11
2.4. Reflection of vegetation
Figure 2.2: Reflection, absorption, and transmission processes in the interaction between sunlight andplant leaves.
550 nm. The transition from VIS to NIR is specified by the so called red-edge,the reflectance slope between 680 and 750 nm (Filella and Peñuelas, 1994).
The reflectance in the NIR is mainly dominated by leaf internal structure, leafanatomy, and by the characteristics of the epidermal surface (e.g. wax com-pounds, hairs, etc) (Jensen, 2002). High reflection in this region is influencedby direct reflection on the leaf surface and multiple internal scattering processeswithin the leaf tissue (Jacquemoud and Ustin, 2001). Govaerts et al. (1996) em-phasized that the epidermis plays an important role in determining the overallbidirectional reflectance of leaves. Leaf biochemical compounds like cellulose,lignin and carbohydrates causes minor absorption in this region (Fig. 2.3; As-ner, 1998; Curran, 1989). Two weak water absorption bands around 970 and1200 nm are also characteristic for the NIR (Curran, 1989).
12

2. LITERATURE REVIEW
Leaf reflectance in the SWIR region is mainly influenced by strong water ab-sorption bands at 1200, 1400, 1940, and 2400 nm. Likewise, absorption ofstructural compounds like cellulose, lignin, starch, and protein occurs in theSWIR (Fig. 2.3; Asner, 1998; Curran, 1989).
Measurements on the canopy scale are additionally effected by several envi-ronmental factors. As a consequence of the complexity of canopy structure,the leaf area, the leaf angle distribution (planophile or erectophile stands), andthe fraction of plant organs as green foliage, stems, florescence or reproductiveorgans impact reflectance patterns (Jackson and Pinter, 1986; Jacquemoud andBaret, 1990). Gitelson et al. (2002) emphasized that eminently reflectance inthe NIR depends on factors such as canopy architecture, cell structure and leafinclination and is thus more species-specific than reflectance in VIS, governedmainly by pigment content. Shadow, bidirectional effects, and soil backgroundmay interfere with the canopy reflectance as well (Biliouris et al., 2007; Gitelsonet al., 2002; Oppelt and Mauser, 2004; Pinty et al., 1998). Phenological stagesof plants may also have an impact on spectral reflectance as well, as Delalieuxet al. (2009) demonstrated in multi-temporal observations of apple plants.The function described by the ratio of the intensity of reflected light to theilluminated light for each wavelength forms the leaf/canopy spectral signature(Carter and Knapp, 2001; Jones et al., 2003; West et al., 2003). Consequently,biophysical and biochemical attributes of vegetation can be concluded fromreflectance spectra.
Optical methods like hyperspectral imaging and non-imaging sensors havebeen proved to be a useful tool to detect changes in plant vitality (Apan et al.,2005; Hatfield et al., 2008; Nilsson, 1995; Pinter et al., 2003; West et al., 2003).Hence, spectral reflectance measurements are applicable for non-destructiveassessment of the physiological status of vegetation (e.g. pigment content, leafarea), and in order to discriminate crop species or to detect the impact of stresslike plant diseases, drought stress or nutrition deficiencies (Blackburn, 1998b,a,
13

2.4. Reflection of vegetation
Figure 2.3: Vegetation reflectance spectrum with leaf reflectance influencing factors in the VIS, NIR,and SWIR and absorption characteristics of biochemical plant components (Curran, 1989; Jensen, 2002,both modified).
2007; Gitelson et al., 2002, 2003; Moran et al., 1997; Richardson et al., 2001).Nonetheless, an interpretation of spectral reflectance measurements withoutknowledge on spectral behaviour of leaves is impossible.
14

2. LITERATURE REVIEW
2.5 Hyperspectral sensors for disease detection
Several studies have shown a convincing ability of reflectance measurements indiscriminating between healthy and stressed plants. Disease symptoms oftenresult from physiological changes in plant metabolism brought about by thepathogen (Apan et al., 2005; Nilsson, 1995; Oerke et al., 2006). The impact ofplant diseases on the physiology and phenology of plants, however, varies withthe host-pathogen interaction and may cause modifications in pigments, watercontent, and tissue functionality of plants or in the appearance of pathogen-specific structures (Gamon and Surfus, 1999; Jing et al., 2007; Pinter et al.,2003). All these individual impacts may alter the spectral pattern of plants.Knowledge on the physiological effects of diseases on the metabolism and tissuestructure of plants is therefore essential for the hyperspectral discrimination ofhealthy and diseased leaf and canopy elements (Moran et al., 1997).
The best results for the detection of diseases were obtained in the VIS and NIRrange of the spectrum. Steddom et al. (2005) demonstrated that multispectraldisease evaluation can be used effectively to measure necrosis caused by Cer-cospora leaf spot in sugar beets. A detection of rhizomania in sugar beet fieldswas also feasible (Steddom et al., 2003). Using a quadratic discriminating modelbased on reflectance, Bravo et al. (2003) could classify yellow rust infestation onwinter wheat with a reliability of 96%. Yellow rust decreases the chlorophyll aconcentration, which leads to an increase in canopy reflectance in the VIS rangeand a decrease in the NIR (Jing et al., 2007). Larsolle and Muhammed (2007)computed disease-specific spectral signatures of Drechslera tritici-repentis in-fected spring wheat. Other researchers successfully used spectral data to detectMagnaporthe grisea on rice (Kobayashi et al., 2001), Phytophthora infestans ontomato (Zhang et al., 2002), Venturia inaequalis on apple trees (Delalieux et al.,2007), yellow rust in wheat (Huang et al., 2007), and Dothistroma septosporaon pine trees (Coops et al., 2003). Damages to crops caused by virus diseases(Naidu et al., 2009) or insects (Board et al., 2007; Carrol et al., 2008; Xu et al.,
15
2.5. Hyperspectral sensors for disease detection
2007; Yang et al., 2007) could also be detected using spectral sensors. However,most of these studies used airborne data for the discrimination between maturedisease symptoms and healthy leaves at an advanced level of infection.
The detection of a specific plant disease and the discrimination between healthyand diseased plants was the main focus of several research groups. To bringthis research forward into field, there are still some difficulties and open ques-tions. First, from the technical side it is still open, which spatial and spectralresolution is required and following which sensor systems harbours the opti-mal specifications for disease detection (Steiner et al., 2008). Second, an earlydetection, even before visible symptoms appear, was realized only by few work-ing groups using different technical and analytical approaches (Bravo, 2006;Chaerle et al., 2007b; Rumpf et al., 2010). Third, the assessment of the diseaseseverity or quantification of diseases has to be implemented in further studies.Larsolle and Muhammed (2007) classified disease severity from hyperspectralreflectance in wheat and barley, compared to visual assessments using a near-est neighbour classifier with an accuracy of 86.5%. Fourth, the sensor systemshould be able to differentiate between different kinds of stresses, especiallydifferent diseases. Most stress factors, such as diseases, nutrient deficiency orwater stress induce symptoms with little distinguishing spectral characteristics(Stafford, 2000). Recently Moshou et al. (2006) discriminated between yellowrust infection and nitrogen deficiency and Qin et al. (2009) – using hyperspec-tral near range imaging – differentiated citrus canker from different kinds ofcitrus diseases on grapefruit.
Since most of the published studies have used non-imaging hyperspectroscopy,the application of hyperspectral imaging focusing on spectral information ofdisease symptoms is limited. Bravo et al. (2003) used in-field spectral imagesfor an early detection of yellow rust infected wheat, Nansen et al. (2009) an-alyzed hyperspectral data cubes for the detection of insect-induced stress inwheat plants, and Polder et al. (2010) have combined different optical sen-
16

2. LITERATURE REVIEW
sors for the detection of tulip breaking virus. By now, hyperspectral imagingis more widespread in the field of monitoring fruit/food security and quality.Balasundaram et al. (2009) and Qin et al. (2009) developed a hyperspectralimaging approach to detect canker lesions on citrus fruits. In other studieshyperspectral imaging has been successfully applied for quality assessment ofpickling cucumbers, maize kernels, poultry carcasse or apples (Ariana et al.,2006; Nansen et al., 2008; Park et al., 2007; Xing et al., 2007). Though the useof reflectance measurements in plant pathology research started about 20 yearsago, this is still a new technology, not fully tested or adapted to the needs ofplant disease detection and severity assessment (Bock et al., 2010).
2.6 Analysis of hyperspectral data
Characteristic for the use of non-imaging hyperspectrometers and especially ofhyperspectral imaging systems is the recording of high amounts of informationon the object acquired at the same time. Since large amounts of data alsoimplies enormous file sizes and computing times, the analysis of hyperspectraldata is a complex domain, and different approaches can be used to obtain theresults.
Reflection of contiguous wavebands of electromagnetic radiation by an object re-sults in a spectral signature, the basis of hyperspectral data analyses. Anomaliesor differences between spectral signatures can be distinguished by calculatingdifference spectra, ratios or derivations (Carter and Knapp, 2001; Pietrzykowskiet al., 2006; Richardson et al., 2001; Smith et al., 2004; Xu et al., 2007). Dif-ferent parts of the spectral signatures can be correlated to biochemical or bio-physical characteristics (Blackburn, 1998b,a, 2007; Carter and Spiering, 2002;Delalieux et al., 2005; Fourty et al., 1996; Gitelson et al., 2001, 2002; Jacque-moud et al., 1995; Le Maire et al., 2004; Richardson et al., 2001; Ustin et al.,2009). Hosgood (1993) and Jacquemoud et al. (1995) established a detailed
17

2.6. Analysis of hyperspectral data
database called LOPEX, including spectral reflectance data of over 50 plantspecies and their corresponding biochemical constituents like lignin, proteins,cellulose, starch, chlorophyll, or water. Jacquemoud and Baret (1990) devel-oped the well established model PROSPECT describing leaf optical propertiesfrom 400 nm to 2500 nm. Le Maire et al. (2004) tested and established sev-eral leaf chlorophyll vegetation indices using this leaf-radiatic transfer model todetermine the chlorophyll content.
Spectral vegetation indicesBased on the understanding of these principles and by using further resultsof analytical investigations, spectral algorithms, based on specific wavelengthsof spectral signatures of vegetation, have been developed (Blackburn, 1998b;Carter and Miller, 1994; Gamon and Surfus, 1999; Haboudane et al., 2004;Laudien et al., 2003; Peñuelas et al., 1997). Spectral vegetation indices (SVIs)are widely used for monitoring, analyzing, and mapping temporal and spatialvariation in vegetation (Gitelson et al., 2002). By calculating ratios of severalbands at different ranges of the spectrum, SVIs result in a reduction of datadimension, which may be also useful in effective data analysis for disease dis-crimination. They are highly correlated to several biochemical and biophysicalplant parameters indicating plant health or vitality and form the basis for manyremote sensing applications in crop management. As pigment concentrationsprovide information on the physiological state of leaves, pigment-specific SVIsmay be useful in detecting stresses caused by fungal diseases.
Several approaches have shown that vegetation indices are related to character-istics of crops and in principal they have the potential to detect plant diseases(Hatfield et al., 2008; Thenkabail et al., 2000). E.g., Graeff et al. (2006) usedhyperspectral reflectance for the detection of powdery mildew (Blumeria grami-nis sp. tritici) and take-all disease (Gaeumannomyces graminis sp. tritici) ofwheat, Jing et al. (2007) correlated the severity of yellow rust to SVIs, Laudienet al. (2003) developed a modified chlorophyll absorption integral for Rhizocto-
18
2. LITERATURE REVIEW
nia late rot detection in sugar beet, and Delalieux et al. (2005) used vegetationindices for the assessment of apple scab due to Venturia inaequalis. Steddomet al. (2005) calculated SVIs from multispectral data from sugar beet fields andcompared these indices to disease severity, visually rated by plant pathologists.Since indices commonly used in remote sensing of vegetations are not disease-specific, the development of disease specific indices could improve the specificityand sensitivity of SVIs for disease detection.
Classification algorithmsIn remote sensing applications, many classification and change detection tech-niques have been developed to obtain maximal information from hyperspectraldata and images. Classification is a procedure of assigning a spectral signa-ture to a characteristic group or class, and confines these groups from eachother, respectively. The classes can be predefined (supervised classification) ornon-predefined (unsupervised classification). Change detection is the processof identifying differences in the state of a spectral signature by observationsat different times (Singh, 1989). Since disease epidemiology and symptom de-velopment is causing temporal and spatial changes in vegetation reflectance,most classification techniques from remote sensing applications are likely to beuseful for the detection of disease-induced spectral changes. Principal compo-nent analysis (PCA), spectral mixture analysis (SMA), spectral angle mapper(SAM), and machine learning methods like artificial neural networks (ANN)or support vector machines (SVM) are the most common methods used fordata analysis. Although all these algorithms have their own specifications andmerits, there is not a single approach which is optimal for all applications (Luet al., 2004).
The Spectral Angle Mapper is a supervised classification algorithm, comparingthe spectral similarity between image spectra to reference spectra (Kruse et al.,1993). This method calculates the spectral angle between image spectra andreference spectra in an n-dimensional space, whereas n is the number of hyper-
19

2.7. Host-pathogen model
spectral bands of the spectral range. Small spectral angles correspond to highsimilarity, large spectral angles to less similarity. Given spectra from a visuallyclassified pixel can be used as reference spectra from a spectral library. Basedon the number of reference spectra, classification of pixels can be processedsimultaneously. The accuracy of SAM algorithms is assessed by comparing theclassification result with actual disease data (ground truth). The SAM classifieris a common tool in geographical analyses of hyperspectral data for land coverclassification (Dennison et al., 2004), to study ecosystem processes (Ustin et al.,2004), and for the classification of urban surface cover (Segl et al., 2003).
2.7 Host-pathogen model
Sugar beet (Beta vulgaris L. var. altissima) is a member of the Chenopo-diaceae. The biannual plant forms a fleshy taproot accumulating assimilateslike polysaccharides or nitrogen compounds. Sugar beet was first cultivatedfor sugar production in Europe in the eighteenth century (Van Cleef, 1915).Sugar from sugar beet accounts for 30% of the world’s sugar production. Sugarextraction is a highly developed process and high performance varieties fromplant breeding may provide high sugar yields. But foliar fungal diseases are se-rious threats in worldwide sugar beet production. Cercospora beticola (Sacc.),Erysiphe betae (Vanha) Weltzien and Uromyces betae (Persoon) Lev., causingCercospora leaf spot (CLS), powdery mildew (PM), and sugar beet rust (SBR),respectively, are the most relevant fungal leaf pathogens causing losses in yieldquantity and quality (Wolf and Verreet, 2002). Disease-specific symptoms ofthe leaf pathogens cause destruction of the leaf tissue. The sugar beet pro-ductivity is highly influenced by solar radiation captured by the crop canopy(Jaggard et al., 2009). Losses are primarily attributed to a reduction in thephotosynthetically active leaf area, and secondly to a subsequent reversion ofassimilate allocation from the roots to form new foliage. A reduction in root
20

2. LITERATURE REVIEW
weight and in the sugar fraction of harvested roots is the consequence (Franc,2010). Infection process, leaf colonization and spread of each pathogen havespecific optima for environmental factors – temperature, relative humidity, leafwetness – and host-intrinsic factors like nutritional status or ontogenetic status.A heterogenic attribution of the pathogens in the growing area and even a spa-tial and temporal variability within a field may be monitored (Mahlein et al.,2009; Wolf and Verreet, 2002).
The three foliar diseases are associated with typical symptoms. Theperthotrophic pathogen C. beticola causes leaf spots with a reddish brown mar-gin of typically 2 to 5 mm diameter (Franc, 2010; Weiland and Koch, 2004;Wolf and Verreet, 2002). Under high temperature conditions and high relativehumidity the leaf spots coalesce to form large necrotic areas (Vereijsssen et al.,2006). Pathogenicity of C. beticola-isolates is associated with the synthesis ofthe pathotoxin cercosporin (Daub and Ehrenshaft, 2000). Causing yield lossesapproaching 40%, Cercospora leaf spot is the most important foliar disease insugar beet production (Lartey et al., 2010).
The biotroph pathogen E. betae relies on the functional metabolism of sugarbeet tissue as a nutrient source (Francis, 2002). Characteristic symptoms ofpowdery mildew are white, fluffy mycelia, which covers the upper and lower siteof the leaf. At mature infestation, leaf chlorosis and necrosis can be observed.An inhibition of photosynthetic CO2 assimilation and a decrease of quantumefficiency of light use is also reported (Gordon and Duniway, 1981; Magyarosyet al., 1976). Losses up to 30% can occur under dry and hot conditions duringsummer. Characteristic for powdery mildew is a fast spread by wind inside thecrop stand and across different growing regions (Wolf and Verreet, 2002).
The basidiomycete U. betae also is an obligate biotroph plant pathogen. Typ-ical symptoms of sugar beet rust are small pustules (0.5 to 1.5 mm), oftenencircled by a chlorotic ring, irregularly distributed over the leaves. Reddish-brown uredospores are released after rupturing the epidermal layer. Moderate
21
2.8. Disease management of foliar sugar beet diseases
climate with temperatures around 20 ◦C and relative humidity up to 100% aresupporting conditions for infection. Thus river and cost regions are imperiledareas (Wolf and Verreet, 2002).
2.8 Disease management of foliar sugar beet diseases
Yield quality and quantity are significantly influenced by crop stand manage-ment, in particular by disease control. Foliar diseases of sugar beet are com-monly controlled by planting resistant cultivars, crop rotation, or by multi-ple fungicide applications. Since nonchemical, preventive alternatives like hostplant resistance and crop rotation do not provide adequate disease control,fungicides are the most important tool for managing foliar diseases (Ioanni-dis and Karaoglanidis, 2010). Strategies of chemical control must be basedon alternation of fungicides with different modes of action, use of productswith mixtures of fungicides differing in the mode of action, and on a threshold-orientated management based on an accurate monitoring of the disease pressure(integrated disease management).
Detailed knowledge on the epidemiology of foliar pathogens and their impacton sugar yield has led to the development of several forecast and decision sup-port systems like the IPM-model Sugar Beet (Wolf, 2001), CERCBET (Raccaand Jörg, 2007), ProPlant (Frahm et al., 1996), or BEETCAST (Pitblado andNichols, 2005). The implementation of these systems has shifted fungicide ap-plications from ’calendar based’ spraying to a precise fungicide application con-sidering multiple factors. These factors include disease susceptibility of sugarbeet cultivar, planting date, weather data, micro-climate of the canopy, leaf wet-ness duration, inoculum level of pathogens, disease assessment and monitoringas well as characteristics of the fungicides (Windels, 2010; Wolf and Verreet,2010). The success of these programs, however, demands a high level of engage-ment and of awareness of the farmer. Automation of disease assessment using
22

2. LITERATURE REVIEW
optical sensor systems can be useful in order to improve existing forecast mod-els. Considerations of temporal and spatial heterogeneities of diseases in fieldwould be just two future trends according to precision agriculture. A precise,reproducible, objective, and time saving monitoring process is a further benefit.
23

3. MATERIAL AND METHODS
3.1 Organisms
3.1.1 Plants
Sugar beet plants (Beta vulgaris, L.), cultivar Pauletta (KWS GmbH, Einbeck,Germany), were used as experimental plants.
3.1.2 Pathogens
Cercospora beticola (Sacc.)Erysiphe betae (Vanha)Uromyces betae (Persoon) Lev.All pathogens originated from the pathogen collection of INRES - Phy-tomedicine and were collected from the experimental field site Bonn Poppels-dorf, Germany.
3.2 Plant cultivation
3.2.1 Controlled conditions
Sugar beet seeds, cultivar Pauletta were pre-grown in small pots and werepiqued when the primary leaves had fully developed. For different experimental
25

3.2. Plant cultivation
setups, sugar beet plants were cultivated in different pots. Seedlings were trans-ferred into a commercial substrate (Klasmann-Deilmann GmbH, Germany) inplastic pots (∅13 cm; ∅17 cm) for experiments on the leaf level. For exper-iments on canopy level, sugar plants were grown in plant boxes (80 x 120 x60 cm) in a soil mixture of 50% commercial substrate, 30% C-horizon and 20%sand, or in quadratic big pots (20 x 20 x 30 cm). Plants were cultivated ina controlled environment at 23/20 ◦C (day/night), 60 ± 10% relative humid-ity (RH) and a photo-period (> 300 µmol m−2 s−1) of 16 h per day. Plantswere watered as necessary and fertilized weekly with 100 ml of a 0.2% solutionof Poly Crescal (Aglukon GmbH, Düsseldorf, Germany). Plants were used forthe experiments after reaching growth stage (GS) 16 (BBCH scale; Meier et al.,1993). Control plants without fungal inoculation were kept healthy by applyingthe fungicide Vegas R©, (Spiess-Urania, Germany; cyflufenamid 51.3 g/l, appli-cation rate 650 µl/l) two days before inoculation of the other plants. In orderto avoid an unintentional infection of plants inoculated with C. beticola andU. betae, respectively, with powdery mildew, the selective fungicide Fortress R©
(Dow AgroScience Ltd., United Kingdom; quinoxyfen 250 g/l, application rate650 µl/l) was applied two days before inoculation.
3.2.2 Field experiment
A field experiment was conducted at the research station Klein-Altendorf(50◦ 36′ 55.3′′ N, 7◦ 0′ 0.10′′ E) of the University of Bonn in the growing season2008. Sugar beet plants, cultivar Pauletta were sown on the 24th of April with1 unit/ha. Three herbicide applications were undertaken to avoid the influ-ences of weeds on sugar beet plant growth and canopy reflectance (10th of May,Betanal Expert R©, Bayer CropScience, Mohnheim, Germany, phenmedipham75 g/l, desmedipham 25 g/l, ethofumesat 151 g/l, application rate 1 l/ha,beetix R©, Stähler GmbH & Co.KG, Stade, Germany, metamitron 696 g/l, ap-plication rate 1.5 l/ha; 20th of May, Betanal Expert R© + beetix R©, application
26
3. MATERIAL AND METHODS
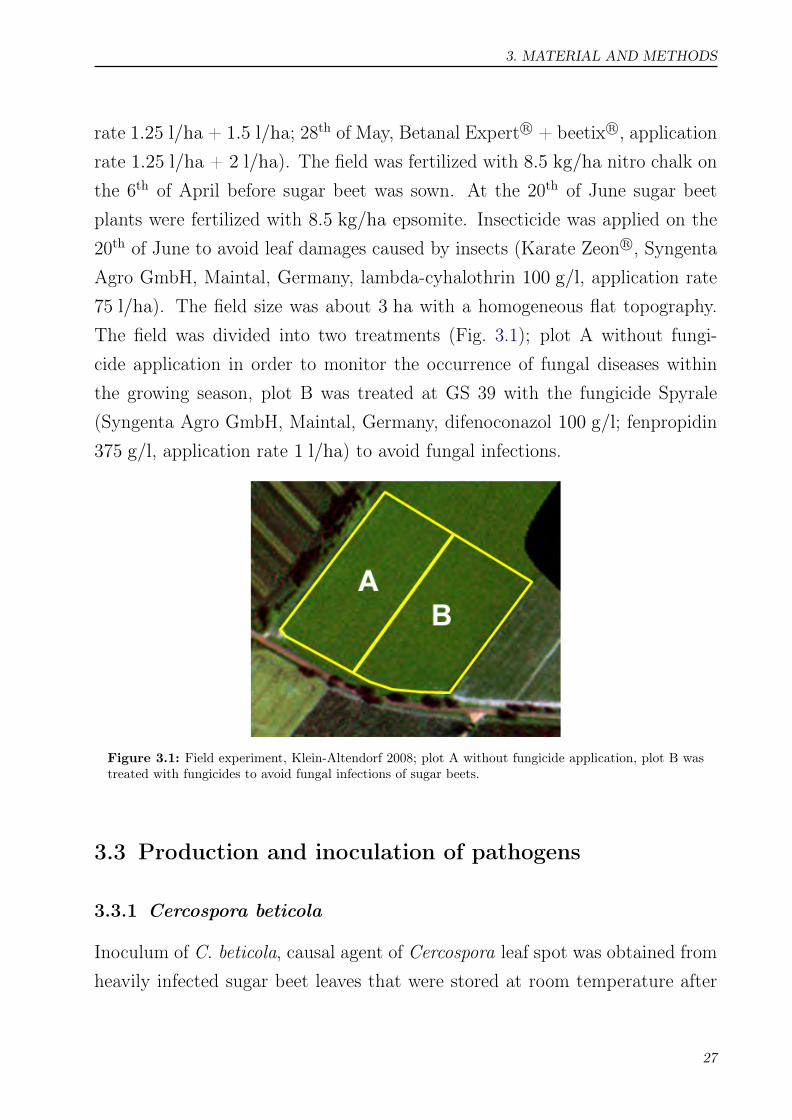
rate 1.25 l/ha + 1.5 l/ha; 28th of May, Betanal Expert R© + beetix R©, applicationrate 1.25 l/ha + 2 l/ha). The field was fertilized with 8.5 kg/ha nitro chalk onthe 6th of April before sugar beet was sown. At the 20th of June sugar beetplants were fertilized with 8.5 kg/ha epsomite. Insecticide was applied on the20th of June to avoid leaf damages caused by insects (Karate Zeon R©, SyngentaAgro GmbH, Maintal, Germany, lambda-cyhalothrin 100 g/l, application rate75 l/ha). The field size was about 3 ha with a homogeneous flat topography.The field was divided into two treatments (Fig. 3.1); plot A without fungi-cide application in order to monitor the occurrence of fungal diseases withinthe growing season, plot B was treated at GS 39 with the fungicide Spyrale(Syngenta Agro GmbH, Maintal, Germany, difenoconazol 100 g/l; fenpropidin375 g/l, application rate 1 l/ha) to avoid fungal infections.
Figure 3.1: Field experiment, Klein-Altendorf 2008; plot A without fungicide application, plot B wastreated with fungicides to avoid fungal infections of sugar beets.
3.3 Production and inoculation of pathogens
3.3.1 Cercospora beticola
Inoculum of C. beticola, causal agent of Cercospora leaf spot was obtained fromheavily infected sugar beet leaves that were stored at room temperature after
27

3.3. Production and inoculation of pathogens
slowly drying. For sporulation the leaves were wetted and incubated for 24 h
under 100% relative humidity (RH). The spores were washed off with tap waterwith one droplet of Tween 20 per l. The spore suspension was adjusted to40000 spores per ml and was sprayed onto the upper and lower side of theleaves. After inoculation, the plants were covered with plastic bags to create100% RH at 25/20 ◦C (14/10 hours day/night) for 48 h. For further incubation,plastic bags were removed and the plants were transferred to 23/20 ◦C (14/10hours day/night) and 60± 10% RH.
3.3.2 Erysiphe betae
E. betae, causing powdery mildew of sugar beet was preserved on vital sugarbeet plants in the greenhouse. For inoculation, heavily infested plants wereused as an inoculum source of E. betae. Before these plants were transferredinto an inoculation chamber, old conidia-spores were removed from the leavesby agitating. Young, virulent conidia were formed within 24 h and were used forinoculation. Healthy plants were placed under the infested plants in a chamberwhere a ventilator ran for 5 seconds in order to distribute E. betae conidiaevenly on the leaf surfaces. Plants were left overnight and were subsequentlytransferred to a greenhouse at 23/20 ◦C (14/10 hours day/night) and 60±10%
RH, separated from the other plants in order to avoid unintentional infectionsof healthy plants.
3.3.3 Uromyces betae
Spores of U. betae, the pathogen causing sugar beet rust, were harvested fromsporulating uredia and stored at 8 ◦C. For inoculation a suspension of U. betaeurediniospores in tap water (with one droplet of Tween 20 per l), with 40000
spores per ml, was prepared and sprayed onto the upper and lower side of sugarbeet leaves. The plants were covered with plastic bags for 48 h (100% RH)
28

3. MATERIAL AND METHODS
and were incubated in a climate chamber at 19/16 ◦C (14/10 hours day/night).After removing the plastic bags, the plants were transferred to 23/20 ◦C and60± 10% RH.
3.4 Assessment of plant physiological and physiochemical
parameters
3.4.1 Disease assessment
In greenhouse experiments, disease severity was assessed daily after inoculationaccording to Wolf and Verreet (2002). For measurements on the leaf scale,the percentage of diseased leaf area of the measured leaf in relation to healthyleaf tissue was estimated visually. For powdery mildew infected plants, thepercentage of leaf area covered with white fluffy mycelium in relation to totalleaf area was recorded. For canopy scale measurements, the diseased leaf areaof plant canopy was classified. Furthermore digital RGB images of the leaveswere taken. On the field scale, ground truth data, in particular incidence (=% plants/leaves infected) and severity (= % leaf area affected) of diseases werecollected at 50 sample points and geo-referenced.
3.4.2 Microscopic investigations
3.4.2.1 Stereo microscopy
A Leica MZ16 F stereomicroscope (Leica Microsystems, Wetzlar, Germany)was used for monitoring the symptom development of C.beticola, E. betae, andU. betae during pathogenesis. Images were taken daily after inoculation witha fitted digital camera. The images were saved using the programm ’Discus’(Technisches Büro Hilgers, Königswinter, Germany).
29

3.4. Assessment of plant physiological and physiochemical parameters
3.4.2.2 Scanning electron microscopy
Scanning electron microscopic observations were obtained using a Phenom scan-ning electron microscope (FEI Europe, Eindhoven, Netherlands) with a 5 kV
thermionic source and a backscattered electron detector1. Freshly harvestedleaves from inoculated sugar beet plants were sputter coated at 30 mA for 100seconds with platinum.
3.4.3 Pigment assessment
The concentration of sugar beet leaf pigments, which is related to plant vitalityand absorption of solar light, was assessed during the progress of diseases.
3.4.3.1 SPAD-meter measurements
A Minolta SPAD-502 meter (Minolta Camera Ltd., Osaka, Japan), was usedfor non-destructive assessment of leaf chlorophyll content. The instrument de-termines the relative amount of chlorophyll present, by measuring the trans-mittance of the leaf at two wave bands (600 to 700 nm and 400 to 500 nm).The dimensionless SPAD-units are proportional to the amount of chlorophyll.
3.4.3.2 Extraction of leaf pigment
Destructive chlorophyll a and b and carotenoid extraction was performed dailyafter inoculation of pathogens. Five leaf discs with a diameter of 1 cm werecollected from the centre of sugar beet leaves, beside the middle leaf vein foreach treatment. The content of chlorophyll a, chlorophyll b, total chlorophyllas well as of carotenoids was determined using the method of Hiscox and Is-raelstam (1979). Leaf disc were weighted and the pigments were extracted in99% dimethylsulfoxide (DMSO) for 24 h in the dark.1 Kindly supported by C. Pape, LOT and Dr. F. Fischer, FZ Jülich
30
3. MATERIAL AND METHODS
3.4.3.3 Measurement of pigment concentrations
Absorption of the extract was measured at 470 nm, 645 nm and 663 nm witha double beam UV/VIS spectrophotometer, Uvikon 933 (BioTek Instruments,USA). Pigment concentrations were calculated according to Hiscox and Israel-stam (1979):
1. Chla [µg Chl/g] = solvent [ml]
weighted sample [g] · (12.7 ·A663−2.79 ·A645)
2. Chlb [µg Chl/g] = solvent [ml]
weighted sample [g] · (20.7 ·A645−4.62 ·A663)
3. Chltotal [µg Chl/g] = solvent [ml]
weighted sample [g] · (17.9 ·A645+8.08 ·A663)
4. Car [µg Car/g] = solvent [ml]
weighted sample [g] ·(4.37 ·A470−0.0143 ·Chla−0.454 ·Chlb
)
3.5 Sensor systems/Hyperspectral measurements
For the acquisition of hyperspectral information from sugar beet leaves variousnon-imaging and imaging sensor systems were used.
3.5.1 ASD FieldSpecPro FR/ASD FieldSpecPro JR
Spectral reflectance was measured with two different handheld non-imagingspectro-radiometers, the ASD FieldSpecPro FR and the ASD FieldSpecPro JR(Analytic Spectral Devices (ASD), Boulder, USA). The spectral range of theASD FieldSpecPro is from 350 nm to 1100 nm. Because the reflectance spectradata were noisy at the extremes, only values between 400 to 1050 nm wereanalyzed. The spectral sampling interval was automatically interpolated from1.4 nm to 1 nm steps using a linear equation by the RS3 spectral acquisition
31
3.5. Sensor systems/Hyperspectral measurements
software (Analytic Spectral Devices (ASD), Boulder, USA). The spectral rangeof the ASD FieldSpecPro JR is from 350 to 2500 nm. The sampling inter-val is 1.4 nm from 350 to 1050 nm and 2 nm for the range 1050 to 2500 nm.Resultant reflectance values were afterwards interpolated by the RS3 softwareto 1 nm steps. Spectral jumps between the spectrometer’s detectors were re-moved using the ASD ViewSpecPro software (Analytic Spectral Devices (ASD),Boulder, USA). The instruments were warmed up for 90 min previous to mea-surement to increase the quality and homogeneity of spectral data. Instrumentoptimization and reflectance calibration were performed prior to sample ac-quisition. The average of 25 dark-current measurements was calibrated to theaverage of 25 barium sulphate white reference (Spectralon, Labsphere, NorthSutton, NH, USA) measurements. For measurements on the leaf scale, a plantprobe foreoptic with a leaf clip holder was used. The contact probe foreoptichas a 10 mm field of view and an integrated 100 W halogen reflector lamp. Theinternal light source enables constant and reproducible illumination conditions.Thus, the integration time was adjusted to 17 ms per scan constantly. Finally,reflectance spectra were obtained by determining the ratio of recorded sampledata to data acquired for the white reflectance standard. Each sample scanrepresented an average of 25 reflectance spectra. Because reflectance spectrawere assessed under constant light and temperature conditions with the plantprobe foreoptic, pre-processing to smooth the spectrum and to reduce signalnoise was not necessary.
In each treatment (inoculated and non-inoculated sugar beet leaves), spectrafrom 15 plants and 2 leaves per plant from the adaxial leaf surface were taken.To realize a multi-temporal measurement, the sugar beet leaves were signed andthe leaf clip was placed in the middle of the leaf beside the middle leave vein.Reflectance of leaves was measured with the ASD FieldSpecPro FR daily afterinoculation, with the ASD FieldSpecPro JR 0, 7, 14, and 21 days after inocula-tion (dai). Measurements on the canopy level were conducted in a dark room.A pistol grip foreoptic was used and mounted on a tripod, 50 cm above the
32
3. MATERIAL AND METHODS
target canopy. To realize constant and homogeneous illumination conditions,three ASD-Pro-Lamps (Analytic Spectral Devices (ASD), Boulder, USA) sur-rounded the target area. Sugar beet plants, grown in boxes were placed underthe optic and, using a field of view of 25◦, two areas of each plant box could bemeasured. For reflectance normalisation a barium sulphate white reference wascentred under the pistol grip optic on the same level with the sugar beet canopy.Reflectance spectra were obtained with an integration time of 134 ms per scan,25 averaged reflectance spectra resulted in one sample scan. Each sample scanwas repeated five times, the plant boxes were measured daily from day 0 to day21 after inoculation. The Savitzky-Golay filter (Savitzky and Golay, 1964), asimplified least square procedure was applied afterwards, in order to smooththe spectrum and to reduce the signal noise. A filtersize of 32 and polynomialdegree of 4 were used as parameters for the Savitzky-Golay filter.
3.5.2 Hyperspectral camera system ImSpector V10E
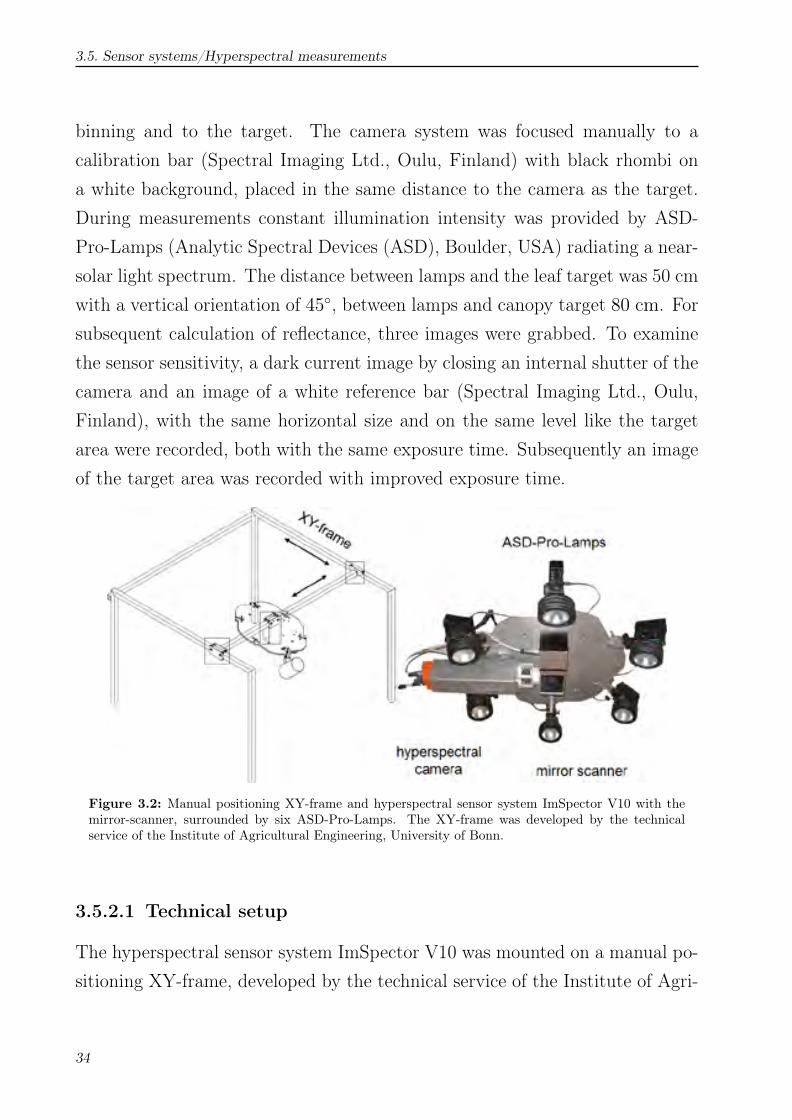
Hyperspectral images were taken in a dark chamber using the hyperspectralimaging system ImSpector V10E (Spectral Imaging Ltd., Oulu, Finland), witha spectral range from 400 to 1000 nm (Fig. 3.2). The ImSpector V10E systemis a line scanner with a spectral resolution up to 2.8 nm. The maximal imagesize of the sensor slot results in 1600 pixels per line with a sensor pixel sizeof 0.0074 mm. Limited by the distance between target and sensor system(0.60 m), a spatial resolution of 0.019 mm per pixel could be achieved. Toobtain images from the target, a mirror scanner was mounted in front of theobjective lens. The maximal field of view of the mirror scanner is 80◦. Usingthe software SpectralCube (Spectral Imaging Ltd., Oulu, Finland) the angleof the mirror scanner as well as the spectral and spatial resolution could beadapted manually to the target. Images on leaf level were taken with spectralbinning 4 and spatial binning 1, on canopy level with spectral binning 4 andspatial binning 2. Frame rate and exposure time was adjusted to the chosen
33
3.5. Sensor systems/Hyperspectral measurements
binning and to the target. The camera system was focused manually to acalibration bar (Spectral Imaging Ltd., Oulu, Finland) with black rhombi ona white background, placed in the same distance to the camera as the target.During measurements constant illumination intensity was provided by ASD-Pro-Lamps (Analytic Spectral Devices (ASD), Boulder, USA) radiating a near-solar light spectrum. The distance between lamps and the leaf target was 50 cmwith a vertical orientation of 45◦, between lamps and canopy target 80 cm. Forsubsequent calculation of reflectance, three images were grabbed. To examinethe sensor sensitivity, a dark current image by closing an internal shutter of thecamera and an image of a white reference bar (Spectral Imaging Ltd., Oulu,Finland), with the same horizontal size and on the same level like the targetarea were recorded, both with the same exposure time. Subsequently an imageof the target area was recorded with improved exposure time.
Figure 3.2: Manual positioning XY-frame and hyperspectral sensor system ImSpector V10 with themirror-scanner, surrounded by six ASD-Pro-Lamps. The XY-frame was developed by the technicalservice of the Institute of Agricultural Engineering, University of Bonn.
3.5.2.1 Technical setup
The hyperspectral sensor system ImSpector V10 was mounted on a manual po-sitioning XY-frame, developed by the technical service of the Institute of Agri-
34

3. MATERIAL AND METHODS
cultural Engineering, University of Bonn surrounded by six ASD-Pro-Lamps(Analytical Spectral Devices Inc., Boulder, USA), placed in a dark chamber(Fig. 3.2)2. In order to realize optimal and reproducible illumination and con-stant measurement conditions the plants were moved into the dark chamber.Starting two days after inoculation, hyperspectral images were taken daily until21 dai. All measurements were recorded between 8:00 and 12:00 AM in order toreduce the effect of diurnal physiological changes in plant processes. For imageacquisition on the leaf level, the pots with sugar beet plants were placed onmobile tables (0.8 m x 0.8 m, four plants per table) 2 dai. According to Chaerleet al. (2007a), the fifth fully developed leaf pair of each sugar beet plant wasfixed horizontally on a frame between a grid patterns made of two layers ofrubber laminated mesh wire (Fig. 3.3). The frame and the grid pattern werecoated with a black, matte colour to reduce the reflectance of the material.The mesh wire largely avoided movements of leaves which were subdivided intoequally-sized squares (2 x 2 cm) on the images.
Figure 3.3: Schematic diagram of sugar beet leaves fixed under a grid pattern. Two leaves per plantwere chosen for multi-temporal hyperspectral imaging and were measured consecutively.
2 Kindly supported by Dr. L. Damerow and A. Berg, Institute of Agricultural Engineering, University of Bonn
35

3.5. Sensor systems/Hyperspectral measurements
3.5.2.2 Normalization and preprocessing of hyperspectral data
Calculations of reflectance relative to a white reference bar and the dark currentmeasurement were performed using the ENVI 4.6 + IDL 7.0 software (ITTVisual Information Solutions, Boulder, USA). After this normalization processthe Savitzky-Golay filter (Savitzky and Golay, 1964) was applied to smooth thesignals from hyperspectral images. The parameters for the smoothing processwere 5 supporting points to the left and right, respectively, and a polynomialdegree of 5. The pre-processed images were used for further analysis using theENVI 4.6 + IDL 7.0 software.
3.5.3 Airborne sensors
On 1th July 2008 hyperspectral data from the high resolution airborne imagingsensor system ROSIS were acquired at GS 39 of sugar beets. The ReflectiveOptics Systems Imaging Spectrometer (ROSIS) was developed by the GermanAerospace Center (DLR), Cologne, Germany. The sensor provides 103 spectralbands in the range from 430 to 850 nm with a spectral resolution of 4 nm.The flight height of about 2880 meters resulted in a ground resolution of 2m for the ROSIS sensor. A HyMap flight campaign was conducted on 6th
August 2008 at GS 45. HyMap is an aircraft-mounted hyperspectral sensor(Integrated Spectronics, Sydney, Australia) which uses a whisk-broom scannerwith 512-pixel per line. It provides 126 spectral bands between 450 and 2500nm. The bandwidths depend on the full width at half maximum (FWHM) ofthe spectral bands, which is 15 nm in the VIS and NIR, 13nm in SWIR1, and17nm in SWIR2. A nominal spatial resolution of 4 m was achieved. Both flightcampaigns were realized by the DLR. The datasets were radiometric calibratedand an atmospheric correction was carried out using ATCOR4 to derive nadir-normalized ground reflectance by the DLR, Oberpfaffenhofen, Germany.
36

3. MATERIAL AND METHODS
3.6 EM 38 soil sensor
The apparent electrical conductivity (ECa) of the soil in Klein-Altendorf wasmeasured using an EM 38 (Geonics Ltd., Mississauga, Ontario, Canada) on15th of April 20083.
3.7 Data analysis
3.7.1 Development of spectral signatures
Characteristic spectral signatures were evaluated for each disease and diseasedleaves, respectively, depending on the day after inoculation and the diseasestage. Changes in spectral signature during pathogenesis as well as between thediseases have been analyzed. In order to extract the wavelength(s) suitable forthe differentiation among diseases and disease severities, difference spectra werecalculated by subtracting the mean reflectance µ of diseased sugar leaves fromthat of healthy sugar beets at each wavelength λ, where λ = 400− 1050 nm.
Diffλ = µdiseased − µhealthy
Reflectance sensitivity for each wavelength was calculated as the reflectance ofdiseased leaves divided by the mean reflectance of healthy leaves.
Sensitivityλ = µdiseased/µhealthy
Changes in the spectral signature for each disease were evaluated by simple lin-ear correlation analyses. Correlations between disease severity and reflectancedata were tested by computing Pearson’s coefficient of correlation (r) using theSuperior Performing System SPSS 17.0 (SPSS Inc., Chicago, USA). With cor-relation curves, the intensity and direction of the relationship of each narrowband of the spectrum was visualized and specific wavebands of the spectralsignature, closely related to disease infestation were selected.3 Kindly conducted by C. Hbirkou, INRES-soilscience, University Bonn
37

3.7. Data analysis
3.7.2 Spectral vegetation indices
Spectral vegetation indices (SVIs) are algorithms, calculated from hyperspec-tral data, which are closely correlated to specific plant parameters, e.g. plantvitality, biomass, pigment, or water content. An advantage of calculating SVIsis a reduction of data dimensionality from hyperspectral sensors. To evaluatethe suitability of SVIs widely applied in remote sensing sciences for the identifi-cation and discrimination between foliar diseases of sugar beet, SVIs related tovarious plant parameters were calculated. Tab. 3.1 lists the SVIs calculated andsummarizes information related to disease relevant biophysical and biochemicalparameters of plants from literature. Simple ratio (SR), modified simple ra-tio (mSR), normalized difference vegetation index (NDVI), red edge inflectionpoint (REP), and plant senescence reflectance index (PSRI) have been used asindicators for plant vitality and for the estimation of plant biomass. Normal-ized difference index (ND), modified normalized difference index (mND), pho-tochemical reflectance index (PRI), structure insensitive pigment index (SIPI),pigment-specific simple ratios for chlorophyll a and b (PSSRa /PSSRb) and forcarotinoids (PSSRc), pigment-specific normalized differences for chlorophyll aand b (PSNDa /PSNDb) and for carotinoids (PSNDc), the modified chlorophyllabsorbtion reflectance index (MCARI), and the modified chlorophyll absorptionintegral (mCAI) are indices related to leaf pigments involved in photosynthe-sis. The anthocyanin reflectance index (ARI) is specific for the anthocyanins.The blue/green index (BIG2) analyses the relation between blue and greenreflectance, the SumGREEN and SumVIS indices analyse absolute reflectancein the green region and in the VIS, respectively. Correlation and regressionanalyses between vegetation indices and disease severities for each disease wereconducted. In a next step, index combinations were tested to classify differentdisease situations more specifically. 2D-scatter matrixes for all index combina-tions were mapped, and the best differentiating combinations were examined.Eight SVIs were used as features for supervised classification and early detectionof plant diseases using support vector machines (see 3.7.4).
38
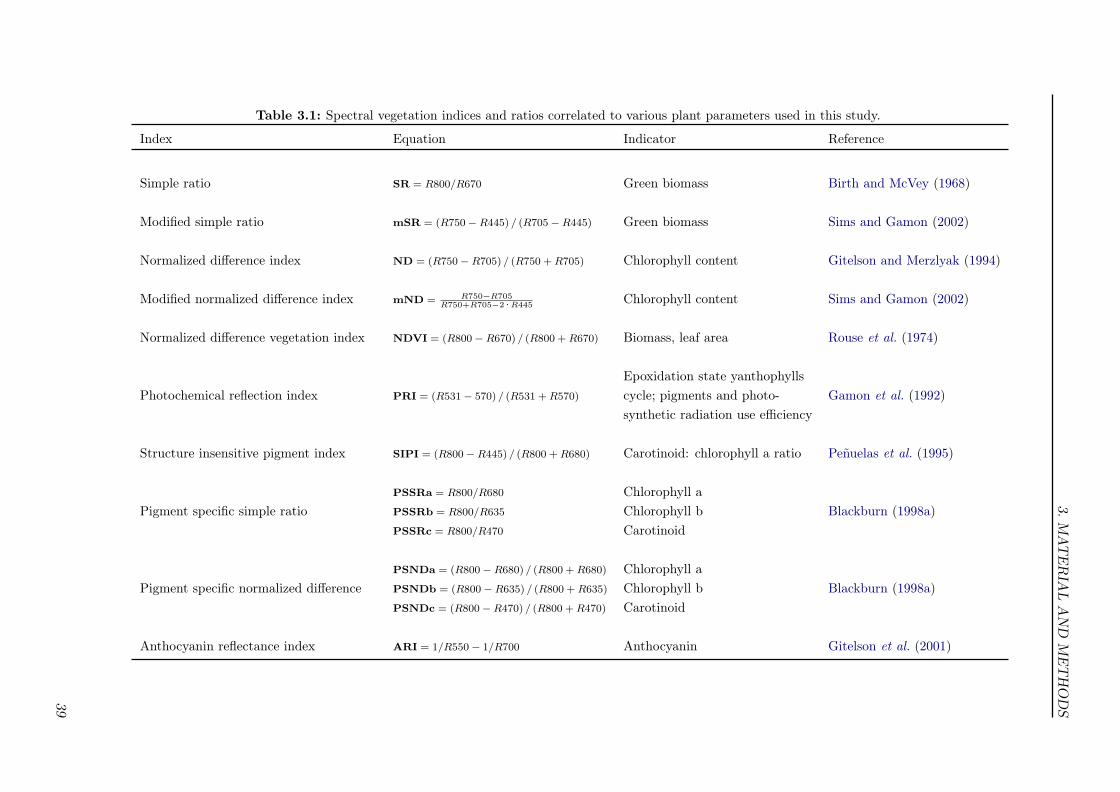
3.MATERIA
LAND
METHODS
Table 3.1: Spectral vegetation indices and ratios correlated to various plant parameters used in this study.
Index Equation Indicator Reference
Simple ratio SR = R800/R670 Green biomass Birth and McVey (1968)
Modified simple ratio mSR = (R750−R445) / (R705−R445) Green biomass Sims and Gamon (2002)
Normalized difference index ND = (R750−R705) / (R750 +R705) Chlorophyll content Gitelson and Merzlyak (1994)
Modified normalized difference index mND = R750−R705R750+R705−2 ·R445
Chlorophyll content Sims and Gamon (2002)
Normalized difference vegetation index NDVI = (R800−R670) / (R800 +R670) Biomass, leaf area Rouse et al. (1974)
Epoxidation state yanthophyllsPhotochemical reflection index PRI = (R531− 570) / (R531 +R570) cycle; pigments and photo- Gamon et al. (1992)
synthetic radiation use efficiency
Structure insensitive pigment index SIPI = (R800−R445) / (R800 +R680) Carotinoid: chlorophyll a ratio Peñuelas et al. (1995)
PSSRa = R800/R680 Chlorophyll aPigment specific simple ratio PSSRb = R800/R635 Chlorophyll b Blackburn (1998a)
PSSRc = R800/R470 Carotinoid
PSNDa = (R800−R680) / (R800 +R680) Chlorophyll aPigment specific normalized difference PSNDb = (R800−R635) / (R800 +R635) Chlorophyll b Blackburn (1998a)
PSNDc = (R800−R470) / (R800 +R470) Carotinoid
Anthocyanin reflectance index ARI = 1/R550− 1/R700 Anthocyanin Gitelson et al. (2001)
39

3.7.Data
analysis
Tab. 3.1 continued
Index Equation Indicator Reference
mCAI =(R545+R752)
2· (752− 545)
Modified chlorophyll absorption integral−(∑R752
R545R · 1.423
) Chlorophyll content Laudien et al. (2003)
Red edge position REP = 700 +40 · (RRE−R700)
(R740−R700)Inflection point red edge Guyot and Baret (1988)
Plant sensecence index PSRI = (R680−R500) /R750 Plant sensecence Merzlyak et al. (1999)
Water index WI = R900/R970 Water content Peñuelas et al. (1997)
Biomass with constantOptimized soil adjusted vegetation index OSAVI =
(1+0.169) · (R800−R670)R800+R670+0.16 soil adjustment factor
Rondeux et al. (1996)
Modified chlorophyll absorption MCARI = ((R701−R670)− 0.2
reflectance index · (R701−R550)) · R701R670
Chlorophyll content Daughtry et al. (2000)
SumGREEN index SG = Average of R500 : R600 Green reflectance Gamon and Surfus (1999)
SumVIS index SV = Average of R400 : R600 VIS reflectance unpublished
Blue/Green index BIG2 = R450/R550 Chlorophyll content Zarco-Tejada et al. (2005)
40

3. MATERIAL AND METHODS
3.7.3 Spectral Angle Mapping classification
Automatic classification known from remote sensing image analysis was appliedto hyperspectral images of diseased sugar beet leaves for the differentiation ofdiseases. The Spectral Angle Mapping method (SAM, Yuhas et al., 1992) wasperformed using the ENVI 4.6 + IDL 7.0 software. Spectral classification ap-proaches assign each image pixel to one out of several known categories orclasses (endmembers) through a statistical approach. Spectrally unique sig-natures of pure image components, i.e. endmembers, have to be defined, andspecific classification algorithms can be calculated to classify the image pixel.The data set was divided into a set of training data and a set of test data, totrain the classifiers. The classification decomposes the hyperspectral image intoa false colour image, containing thematic information of the previously selectedclasses.
SAM calculates the spectral similarity of spectra and reference spectra usingthe spectral angle between the two spectra in an n-dimensional space depen-dent on the number of spectral bands (Fig. 3.4). The output of SAM is anangular difference for each pixel which can be illustrated in a false colour im-age; small spectral angles correspond to high similarity, large spectral angles tolow similarity (Kruse et al., 1993; Van der Meer et al., 2001). Because the anal-ysed spectra are transferred as vectors, variable illuminations due to the surfacestructure and veins of sugar beet leaves were attenuated (darker pixel will plotalong the same vector, but closer to the origin). The method proceeds in var-ious steps. Since SAM is a supervised classification method, the first step wasthe identification of reference spectra which were transferred from the spectrallibrary (see paragraph: ’disease specific spectra’). Subsequently the spectralsimilarity of image spectra and reference spectra is calculated by the spectralangle between the two spectra in an n-dimensional space. For the validation 15-20 polygons per endmember-class with 15-200 pixel per polygon were selectedas ground reference. The polygons were defined with the ROI function using
41
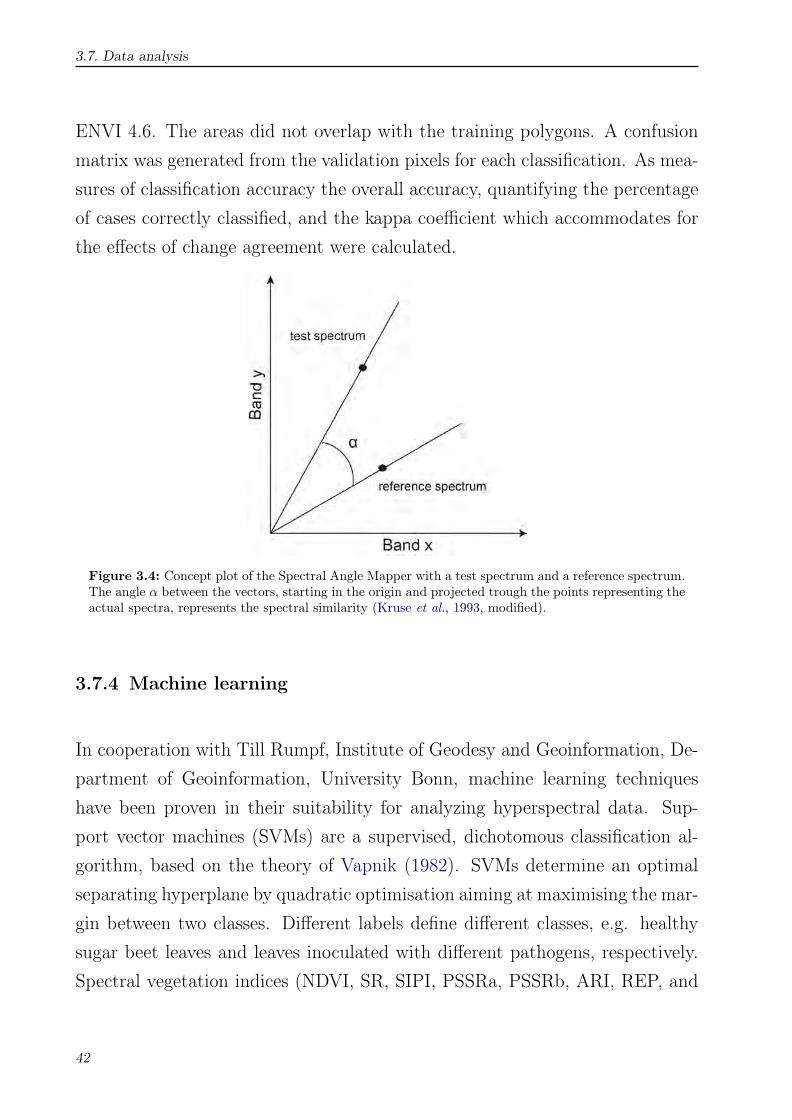
3.7. Data analysis
ENVI 4.6. The areas did not overlap with the training polygons. A confusionmatrix was generated from the validation pixels for each classification. As mea-sures of classification accuracy the overall accuracy, quantifying the percentageof cases correctly classified, and the kappa coefficient which accommodates forthe effects of change agreement were calculated.
Figure 3.4: Concept plot of the Spectral Angle Mapper with a test spectrum and a reference spectrum.The angle α between the vectors, starting in the origin and projected trough the points representing theactual spectra, represents the spectral similarity (Kruse et al., 1993, modified).
3.7.4 Machine learning
In cooperation with Till Rumpf, Institute of Geodesy and Geoinformation, De-partment of Geoinformation, University Bonn, machine learning techniqueshave been proven in their suitability for analyzing hyperspectral data. Sup-port vector machines (SVMs) are a supervised, dichotomous classification al-gorithm, based on the theory of Vapnik (1982). SVMs determine an optimalseparating hyperplane by quadratic optimisation aiming at maximising the mar-gin between two classes. Different labels define different classes, e.g. healthysugar beet leaves and leaves inoculated with different pathogens, respectively.Spectral vegetation indices (NDVI, SR, SIPI, PSSRa, PSSRb, ARI, REP, and
42
3. MATERIAL AND METHODS
mCAI) and the SPAD-value were used as features for automatic classification.A linear function which has a fixed number of parameters given by the numberof features is a simple case of separation between the two classes. In order todecide to which class a sample belongs, a measure of similarity to the functionis necessary. In SVMs, the dot product in the input space is used as similarityparameter which describes the distance. The basic idea behind SVMs is toseparate the two different classes through a hyperplane which is constructedby its normal vector and the bias. Using also a linear separation function fora non-linear separation between the classes, a transformation into a higher di-mensional space has been done. A linear separation is possible through themapping into a high-dimensional feature space, however, is computationallyexpensive. Furthermore, the description of the separating hyperplane in thelow-dimensional input space is rather complex. For this reason a kernel func-tion is introduced to increase the efficiency of computation (Boser, 1992). Inorder to extend the dichotomous SVMs classifiers for a multi-class classificationof healthy leaves and leaves diseased by Cercospora leaf spot, powdery mildew,and sugar beet rust effectively, a library for SVMs (LIBSVM) has been usedfor classification (Chang and Lin, 2001). Here the ’one against one’ approach(Knerr et al., 1990) was applied. The suitability of the model established byusing the training data set was evaluated by cross-validation. Specificity givesthe proportion of the correctly classified healthy leaves of all classified healthyleaves. Sensitivity gives the proportion of correctly classified inoculated sugarbeet leaves in relation to all classified inoculated leaves. Accuracy is given bythe average of sensitivity and specificity. For more details on computation, seeRumpf et al. (2010).
3.7.5 Geo-referenced maps
Values of SVIs, ECa as well as disease ratings from the field experiment weredisplayed as geo-referenced maps using the Inverse Distance Weighting (IDW)
43

3.8. Statistical analysis
function of ArcMap 9.2 (ArcGIS, ESRI Inc., Redlands, USA). NDVI valuesfrom airborne sensor images were displayed as geo referenced maps in ENVI4.6.1 (Research Systems Inc., Boulder, CO, USA).
3.8 Statistical analysis
Statistical analyses were performed using the Superior Performing System SPSS17.0 (SPSS Inc., Chicago, USA). Data from repeated measures was analysedusing a general linear model and the Bonferroni test to determine statisticallysignificant differences (p = 0.01; p = 0.05). Data were analysed by standardanalysis of variance (ANOVA) and homogeneous subgroups were built usingthe Tukey-test, with a significance level of p = 0.05. For pair wise compari-son, Students t -test with a level of significance of p = 0.05, was undertaken.Correlations between disease severity and reflectance data and spectral vegeta-tion index values, respectively, were tested by computing Pearson’s coefficientof correlation (r), and coefficients of determination
(R2
)were estimated by a
linear model. The experiments were repeated at least twice, except for the fieldexperiment.
44
4. RESULTS
The present work focuses on the potential of hyperspectral non-imaging andimaging sensors for the detection, differentiation and quantification of foliardiseases of sugar beet. The hypothesis was that the three diseases Cercosporaleaf spot, powdery mildew, and sugar beet rust influence the optical propertiesof a plant in different ways. Experiments under both, controlled and field condi-tions with different sensor systems on different scales have been undertaken andcompared, since the measuring method is the groundwork of disease detection.Thereby, different developing stages and different severities of the diseases havebeen taken into account. To gain a maximum on information from hyperspec-tral data, different data analysis methods have been applied. The pathogenesisof the three diseases Cercospora leaf spot, powdery mildew, and sugar beet rusthave been observed. In a first approach, disease specific spectral signatureshave been assessed with a non-imaging spectroradiometer. Multiple spectralvegetation indices from literature, related to biophysical and biochemical plantparameters have been applied on hyperspectral data, and their ability for adetection and discrimination has been proven. Building on that, a more de-tailed observation of the temporal and spatial symptom development has beenundertaken with a hyperspectral camera system. Additionally, image based au-tomatic classification methods have been applied on hyperspectral images. Ina last step the potential and negotiability of hyperspectral disease detection inthe field has been analysed.
45

4.1. Etiology of sugar beet diseases
4.1 Etiology of sugar beet diseases
4.1.1 Disease progress on leaf scale
The temporal development of the diseases on the leaf scale varied for the threepathogens (Fig. 4.1).
Cercospora leaf spotFirst symptoms of Cercospora leaf spot appeared 6 days after inoculation(Fig. 4.1 A). Disease severity increased slowly up to 10% diseased leaf areauntil 10 dai; 21 dai disease severity increased constantly up to 85%. Fifteendays after inoculation the mean disease severity reached 25%. Variation in dis-ease severity among the leaves inoculated with C. beticola decreased with timeand increasing mean disease severity. Minimum disease severity was 25% andmaximal assessed disease severity was 80%, whereas mean disease severity wasabout 55% 18 dai.
Powdery mildewInfestation of sugar beet leaves with powdery mildew exhibited faster develop-ment (Fig. 4.1 B). Symptoms could be monitored already 5 dai. Further spreadof the powdery mildew- characteristic mycelium on the leaf surfaces proceededfaster than symptoms of the other diseases. An average disease severity of17.5% was assessed 10 dai. Disease severities beyond 80% have been monitored15 dai with a mean disease severity of 70%. The whole leaf area was coveredwith white fluffy mycelia 17 dai. The density of mycelia coverage increasedwithin the next few days. The colonization progress of powdery mildew wasmore consistent compared to infestation progress by Cercospora leaf spot orsugar beet rust.
Sugar beet rustWith 8 days the latent period of U. betae was the longest among the pathogens(Fig. 4.1 C). Single chlorotic pustules could be detected on the leaf surface.
46

4. RESULTS
Figure 4.1: Progression of disease severity of (A) Cercospora leaf spot, (B) powdery mildew, and (C)sugar beet rust on sugar beet leaves.
47

4.1. Etiology of sugar beet diseases
They increased slowly in number and size by 14 dai. A mean disease severityof 35% was monitored 18 dai. At this time some leaves had a disease severitybelow 17.5%, whereas other leaves showed disease severities above 55%. Themaximal mean disease severity reached 50% 20 dai. Single leaves with a diseaseseverity up to 75% could be monitored in the end of the measuring period,while several leaves showed disease severities still below 30%.
4.1.2 Disease progress on canopy scale
Disease severity assessed on the canopy scale differed marginal from diseaseseverity assessed on the leaf scale (Fig. 4.2). First symptoms of Cercospora leafspot appeared 7 dai. 5% of the leaf area showed characteristic symptoms 10dai. Disease severity increased up to 17.5% leaf area 15 dai and to 60% 20 dai.First symptoms of powdery mildew occurred 5 dai and spread rapidly over thesugar beet canopy. Nearly 20% of the leaf area was covered by white mycelium10 dai; disease severity reached 80% 15 dai, and 17 dai the whole canopy wascovered by powdery mildew. The disease progress of sugar beet rust on thecanopy scale was comparative to the progress of Cercospora leaf spot. Firstrust pustules occurred 8 dai. Disease severity increased slowly, 17.5% of thecanopy was diseased 15 dai. The maximal disease severity of sugar beet rustmonitored on the canopy scale was 55% 20 dai.
4.1.3 Temporal and spatial symptom development
Depending on the biology of the pathogens, each foliar diseases of sugar beetwere characterized by disease-specific symptoms (Fig. 4.3). Inoculated plantswere first colonized without symptoms, after a latent period typical symptomsappeared.
Cercospora leaf spotSmall, nearly circular necroses appeared as the first symptoms of Cercospora leaf
48
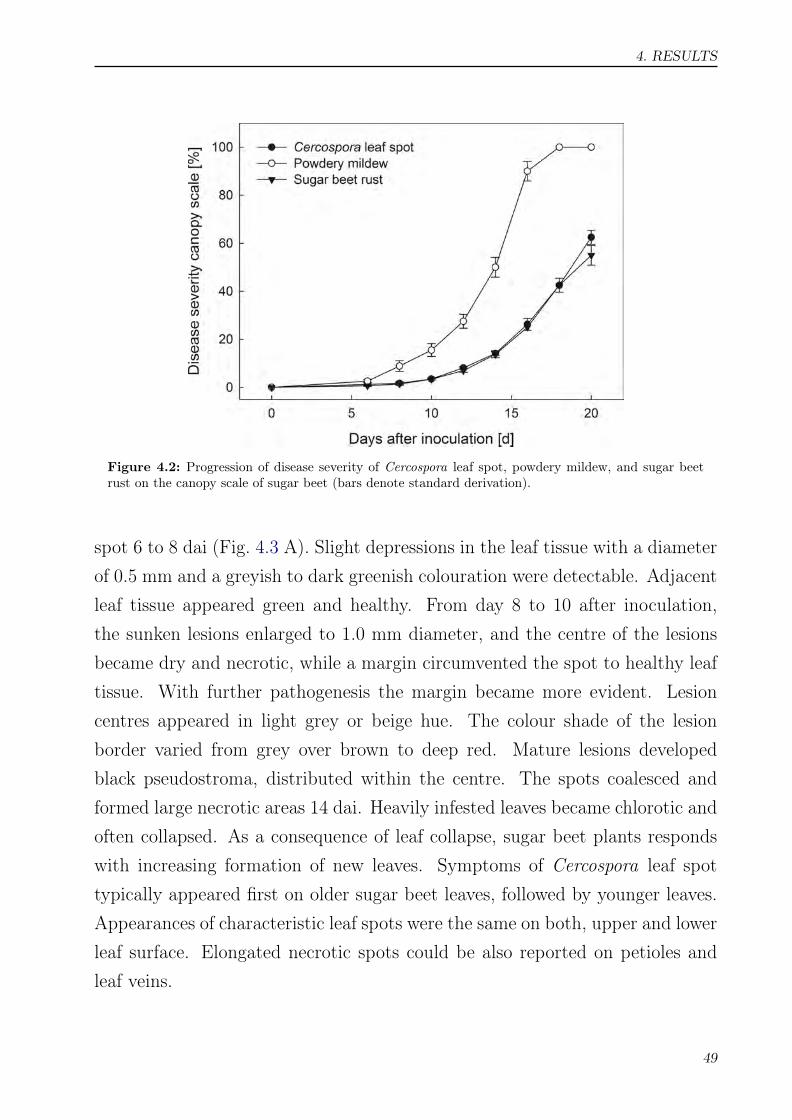
4. RESULTS
Figure 4.2: Progression of disease severity of Cercospora leaf spot, powdery mildew, and sugar beetrust on the canopy scale of sugar beet (bars denote standard derivation).
spot 6 to 8 dai (Fig. 4.3 A). Slight depressions in the leaf tissue with a diameterof 0.5 mm and a greyish to dark greenish colouration were detectable. Adjacentleaf tissue appeared green and healthy. From day 8 to 10 after inoculation,the sunken lesions enlarged to 1.0 mm diameter, and the centre of the lesionsbecame dry and necrotic, while a margin circumvented the spot to healthy leaftissue. With further pathogenesis the margin became more evident. Lesioncentres appeared in light grey or beige hue. The colour shade of the lesionborder varied from grey over brown to deep red. Mature lesions developedblack pseudostroma, distributed within the centre. The spots coalesced andformed large necrotic areas 14 dai. Heavily infested leaves became chlorotic andoften collapsed. As a consequence of leaf collapse, sugar beet plants respondswith increasing formation of new leaves. Symptoms of Cercospora leaf spottypically appeared first on older sugar beet leaves, followed by younger leaves.Appearances of characteristic leaf spots were the same on both, upper and lowerleaf surface. Elongated necrotic spots could be also reported on petioles andleaf veins.
49

4.1. Etiology of sugar beet diseases
Powdery mildewFirst symptoms caused by E. betae appeared 5 dai (Fig. 4.3 B). Slight, nearlycircular mycelium colonies with about 0.5 cm diameter appeared on the upperside of leaves. With further pathogenesis these colonies expanded rapidly andalso the lower leaf surface was colonized. The white mycelium covered both,the total upper and lower leaf surface and became more and more dense until14 dai. The colour of mycelial structures changed from white to grey. Athigh disease severity stages accelerated senescence and earlier degradation intoyellowing and necrotic parts of powdery mildew diseased leaves was noticed.Leaves became chlorotic 18 dai and finally necrotic 21 dai. Conidia productioncould be observed from the second day after symptom appearance. Conidiawere continuously released in dusty clouds, when sugar beet leaves were moved,resulting in new infections of non-diseased and younger leaves. Initial growthand accumulation of colonies around leaf veins could be observed. Symptomswere also observed on leaf petioles.
Sugar beet rustFirst symptoms due to U. betae became visible 9 dai (Fig. 4.3 C). Small chloroticspots, about 0.2 mm in size, appeared on the upper and lower side of the leafsurface. These circular lesions grew up to 0.5 - 1 mm in diameter, and theepidermis became scabby. The centre of the early rust symptoms appeared inlight brown 12 dai. With proceeding disease development, rust spores rupturedthe epidermis and amber uredinia became visible 14 dai. The rust pustuleswere encircled by a chlorotic halo. In some cases a second circle of rust sporesruptured the epidermis in a distance of 1 mm around the primary symptom 16to 21 dai. At high disease severity, the chlorotic ring around the rust pustulesexpanded and contiguous leaf tissue was affected. Pustules of sugar beet rustwere also observed on leaf petioles. In addition, an accumulation of rust sporesalong the leaf veins and the axilla of the rosulate ordered leaves near the beetroot was detectable. Symptoms of sugar beet rust appeared on young and olderleaves simultaneously.
50
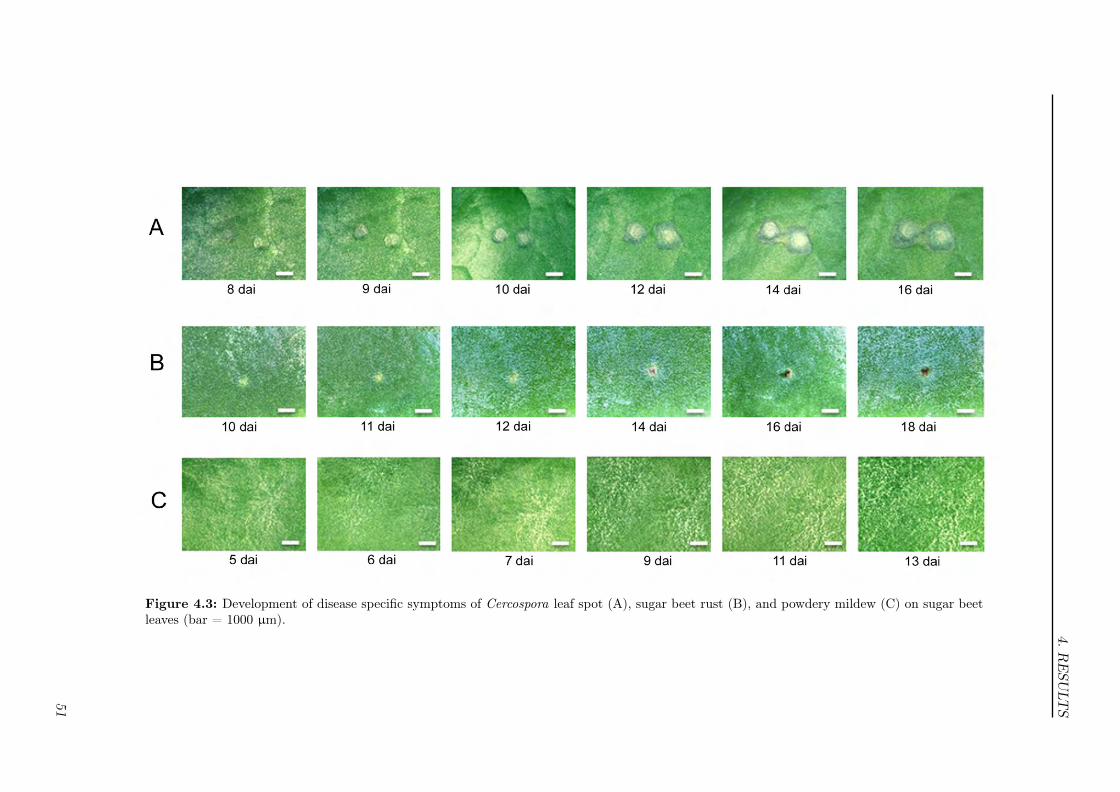
4.RESU
LTS
Figure 4.3: Development of disease specific symptoms of Cercospora leaf spot (A), sugar beet rust (B), and powdery mildew (C) on sugar beetleaves (bar = 1000 µm).
51

4.1. Etiology of sugar beet diseases
4.1.4 Modifications of leaf structure during pathogenesis
Scanning electron microscopic images visualize the typical infection structuresof the fungal pathogens Cercospora beticola, Erysiphe betae, and Uromyces betaeon the host plant (Fig. 4.4). Each pathogen influenced the sugar beet leaf tissuein a specific way.
Cercospora leaf spotC. beticola entered the leaf through closed or open stomata with a germ tube.Intercellular mycelia were formed and pseudostroma was developed in the sub-stomatal area. On the surface of one day old lesions, conidiophores emergedfrom pseudostroma through stoma aperture, with protruding conidia (Fig. 4.4A). Ample hyphal growth, visible as thin, filamentous strands, occurred withinsporulating, older lesions (Fig. 4.4 B). On the border between Cercospora leafspot lesions and healthy tissue, deep splits and sulcate leaf tissue occurred. Thearea of the lesions was obviously sunken.
Powdery mildewThe electron microscopic view of characteristic symptoms of powdery mildewshowed dense and multiple-branched mycelia structures covering the leaf surface(Fig. 4.4 C). Conidia chains protruded from the mycelia. E. betae penetratedthe host tissue directly, no mycelial growth through stomata could be observed.
Sugar beet rustA highly magnified pustule caused by U. betae is shown in Fig. 4.4 D. Swellingof leaf tissue, caused by spore accumulation under the epidermis, was observed.At advanced disease stages, accumulated uredina ruptured the epidermal layer.The roundish uredinia were released and spreaded onto the neighbouring leafarea.
52

4. RESULTS
Figure 4.4: Fungal structures on the leaf surface of sugar beet leaves 21 dai. (A, B) Emerging hyphalstructures and conidia of Cercospora beticola from stomatal openings of sugar beet lesions. (C) Densemycelia of Erysiphe betae with conidia growing on the leaf surface of sugar beet. (D) Ruptured epidermisof sugar beet by Uromyces betae uredinio-spores.
4.1.5 Effect of foliar diseases on leaf pigment content
The impact of the three foliar sugar beet diseases on biochemical parame-ters, particularly on the leaf pigment content, was assessed by non-destructive
53
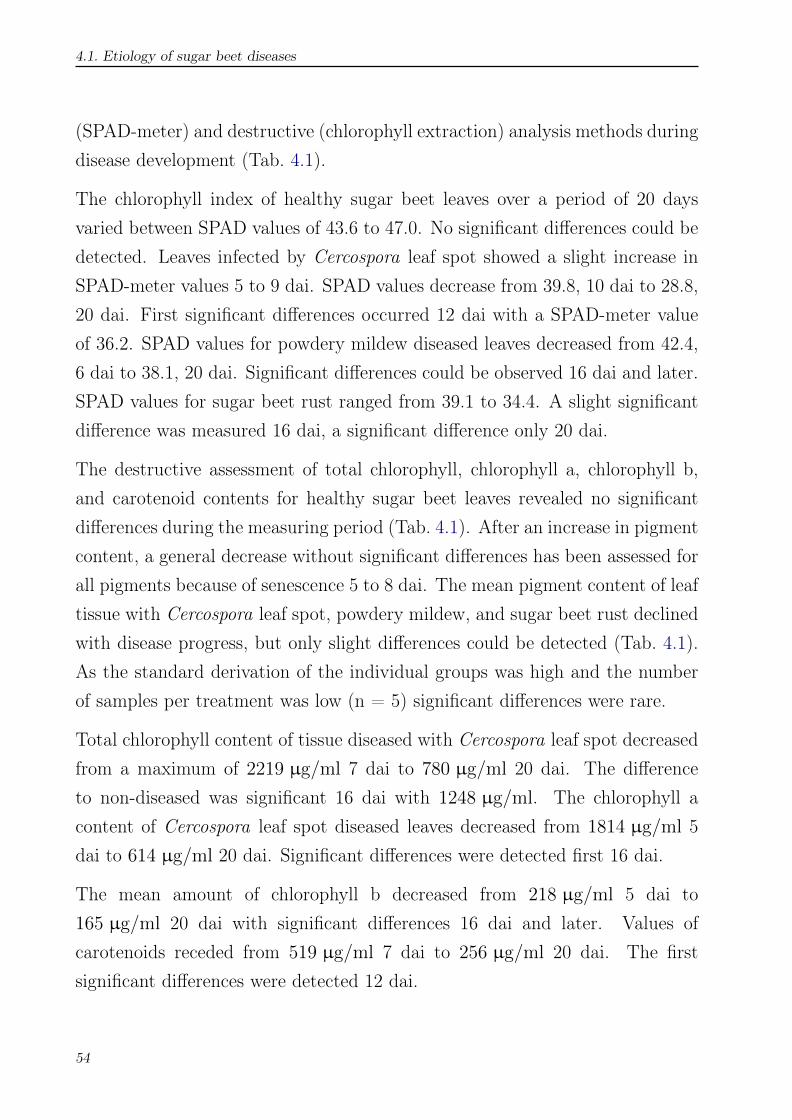
4.1. Etiology of sugar beet diseases
(SPAD-meter) and destructive (chlorophyll extraction) analysis methods duringdisease development (Tab. 4.1).
The chlorophyll index of healthy sugar beet leaves over a period of 20 daysvaried between SPAD values of 43.6 to 47.0. No significant differences could bedetected. Leaves infected by Cercospora leaf spot showed a slight increase inSPAD-meter values 5 to 9 dai. SPAD values decrease from 39.8, 10 dai to 28.8,20 dai. First significant differences occurred 12 dai with a SPAD-meter valueof 36.2. SPAD values for powdery mildew diseased leaves decreased from 42.4,6 dai to 38.1, 20 dai. Significant differences could be observed 16 dai and later.SPAD values for sugar beet rust ranged from 39.1 to 34.4. A slight significantdifference was measured 16 dai, a significant difference only 20 dai.
The destructive assessment of total chlorophyll, chlorophyll a, chlorophyll b,and carotenoid contents for healthy sugar beet leaves revealed no significantdifferences during the measuring period (Tab. 4.1). After an increase in pigmentcontent, a general decrease without significant differences has been assessed forall pigments because of senescence 5 to 8 dai. The mean pigment content of leaftissue with Cercospora leaf spot, powdery mildew, and sugar beet rust declinedwith disease progress, but only slight differences could be detected (Tab. 4.1).As the standard derivation of the individual groups was high and the numberof samples per treatment was low (n = 5) significant differences were rare.
Total chlorophyll content of tissue diseased with Cercospora leaf spot decreasedfrom a maximum of 2219 µg/ml 7 dai to 780 µg/ml 20 dai. The differenceto non-diseased was significant 16 dai with 1248 µg/ml. The chlorophyll acontent of Cercospora leaf spot diseased leaves decreased from 1814 µg/ml 5dai to 614 µg/ml 20 dai. Significant differences were detected first 16 dai.
The mean amount of chlorophyll b decreased from 218 µg/ml 5 dai to165 µg/ml 20 dai with significant differences 16 dai and later. Values ofcarotenoids receded from 519 µg/ml 7 dai to 256 µg/ml 20 dai. The firstsignificant differences were detected 12 dai.
54
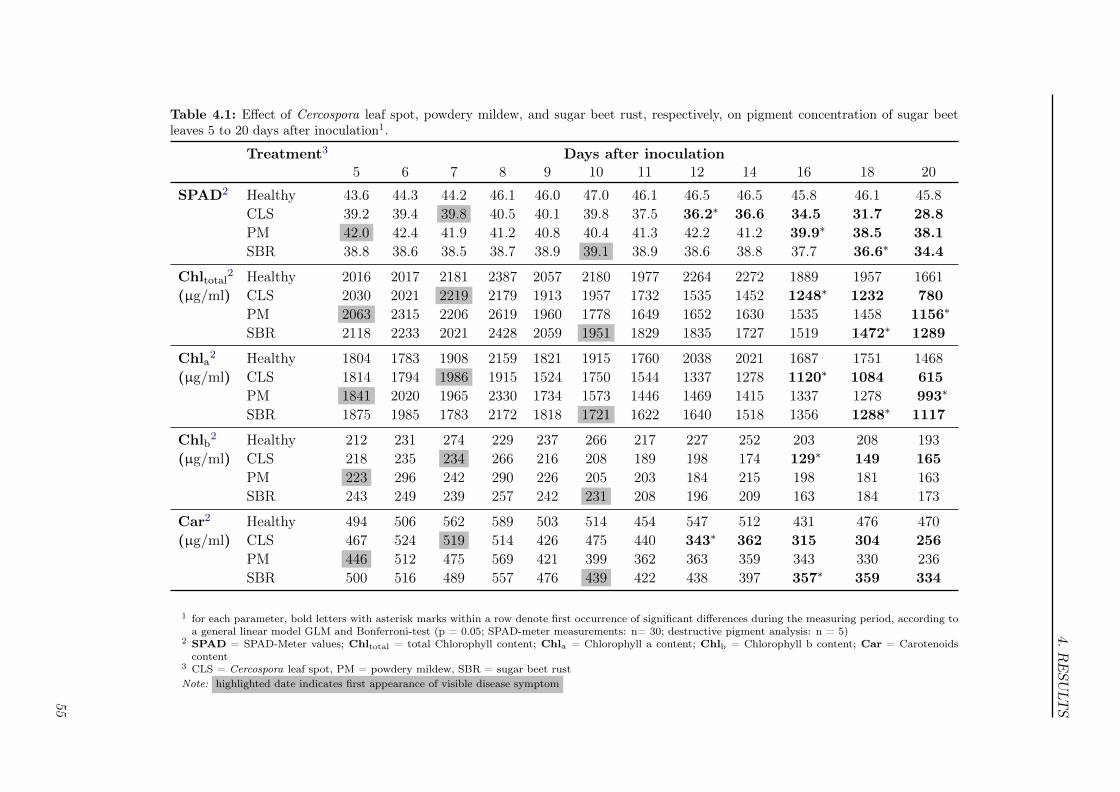
4.RESU
LTS
Table 4.1: Effect of Cercospora leaf spot, powdery mildew, and sugar beet rust, respectively, on pigment concentration of sugar beetleaves 5 to 20 days after inoculation1.
Treatment3 Days after inoculation5 6 7 8 9 10 11 12 14 16 18 20
SPAD2 Healthy 43.6 44.3 44.2 46.1 46.0 47.0 46.1 46.5 46.5 45.8 46.1 45.8CLS 39.2 39.4 39.8 40.5 40.1 39.8 37.5 36.2∗ 36.6 34.5 31.7 28.8PM 42.0 42.4 41.9 41.2 40.8 40.4 41.3 42.2 41.2 39.9∗ 38.5 38.1SBR 38.8 38.6 38.5 38.7 38.9 39.1 38.9 38.6 38.8 37.7 36.6∗ 34.4
Chltotal2 Healthy 2016 2017 2181 2387 2057 2180 1977 2264 2272 1889 1957 1661(µg/ml) CLS 2030 2021 2219 2179 1913 1957 1732 1535 1452 1248∗ 1232 780
PM 2063 2315 2206 2619 1960 1778 1649 1652 1630 1535 1458 1156∗
SBR 2118 2233 2021 2428 2059 1951 1829 1835 1727 1519 1472∗ 1289
Chla2 Healthy 1804 1783 1908 2159 1821 1915 1760 2038 2021 1687 1751 1468(µg/ml) CLS 1814 1794 1986 1915 1524 1750 1544 1337 1278 1120∗ 1084 615
PM 1841 2020 1965 2330 1734 1573 1446 1469 1415 1337 1278 993∗
SBR 1875 1985 1783 2172 1818 1721 1622 1640 1518 1356 1288∗ 1117
Chlb2 Healthy 212 231 274 229 237 266 217 227 252 203 208 193(µg/ml) CLS 218 235 234 266 216 208 189 198 174 129∗ 149 165
PM 223 296 242 290 226 205 203 184 215 198 181 163SBR 243 249 239 257 242 231 208 196 209 163 184 173
Car2 Healthy 494 506 562 589 503 514 454 547 512 431 476 470(µg/ml) CLS 467 524 519 514 426 475 440 343∗ 362 315 304 256
PM 446 512 475 569 421 399 362 363 359 343 330 236SBR 500 516 489 557 476 439 422 438 397 357∗ 359 334
1 for each parameter, bold letters with asterisk marks within a row denote first occurrence of significant differences during the measuring period, according toa general linear model GLM and Bonferroni-test (p = 0.05; SPAD-meter measurements: n= 30; destructive pigment analysis: n = 5)
2 SPAD = SPAD-Meter values; Chltotal = total Chlorophyll content; Chla = Chlorophyll a content; Chlb = Chlorophyll b content; Car = Carotenoidscontent
3 CLS = Cercospora leaf spot, PM = powdery mildew, SBR = sugar beet rustNote: highlighted date indicates first appearance of visible disease symptom
55
4.2. Differentiation of foliar diseases based on spectral signatures of infected leaves
The total chlorophyll content of powdery mildew diseased leaf tissue decreasedfrom 2233 µg/ml 6 dai to 1156 µg/ml 20 dai (Tab. 4.1). Significant differencescould be found for total chlorophyll and chlorophylla only 20 dai. Concen-trations of chlorophyll b and carotenoids showed similar tendencies, however,without statistically significant differences.
The total chlorophyll content of leaves diseased with sugar beet rust decreasedfrom 2428 µg/ml 8 dai to 1289 µg/ml 20 dai (Tab. 4.1). Significant differ-ences were measured 18 dai. Decreasing pigment contents were also observedfor chlorophyll a, chlorophyll b and carotenoids. Significant differences weredetected for chlorophyll a content 18 dai and for carotenoids content 16 dai;changes in chlorophyll b content were not significant.
4.2 Differentiation of foliar diseases based on spectral
signatures of infected leaves
During pathogenesis spectral reflectance of diseased sugar beet leaves was mea-sured with hyperspectral non-imaging sensors in the VIS, NIR, and SWIR (ASDFieldSpec FR and ASD FieldSpecPro JR). Measurements were undertaken atcontrolled conditions. Reflectance spectra on the leaf scale were assessed with aplant probe foreoptic with an integrated light source, on the canopy scale witha pistol grip foreoptic and ASD-Pro-Lamps as light source.
4.2.1 Impact of foliar diseases on the spectral reflectance of sugarbeet
Reflectance of non-inoculated leaves and leaves inoculated with the foliarpathogens was recorded for 21 days after inoculation. In this period, re-flectance spectra of non-inoculated sugar beet leaves were characteristic for
56

4. RESULTS
healthy leaves and remained largely constant (Fig. 4.5 A): strong absorptionof light by photosynthetic pigments in the VIS, high reflectance plateau in theNIR. For the differentiation of leaf diseases based on reflectance measurement,specific spectral signatures at different disease severities have been measuredand compared. Standard derivations were assessed to validate the disease-specific changes in spectral signature compared to the reflectance of healthysugar beet leaves. Fig. 4.5 summarizes the averaged spectral signatures ofsugar beet leaves with Cercospora leaf spot, powdery mildew, and sugar beetrust at 0%, 10%, 20%, 50%, and 80% disease severity, respectively. Comparedto the spectra of healthy leaves, each disease had a divergent, characteristicreflectance curve. The changes in reflectance were strongly correlated to theoccurrence of disease-specific symptoms.
Cercospora leaf spotSpectral signatures of leaves, inoculated with C. beticola, changed evidentlyin reflectance values with first disease symptoms. Reflectance between 550to 700 nm and between 700 to 900 nm increased 12 dai and later accordingto increasing disease severity (Fig. 4.5 B). Reflectance of C. beticola-infectedleaves (Fig. 4.6 A) increased in the VIS mostly in the green and red rangesof the spectrum between 500 to 700 nm and decreased from 700 to 900 nm.With disease severity > 10%, reflectance values in the VIS increased. Thisincrement was less pronounced between 450 to 530 nm and most pronouncedbetween 550 to 700 nm. In the NIR, decreasing reflectance between 700 to 900nm, and slightly increasing reflectance from 900 to 1050 nm could be noticed.With disease severities of 20% to 50% this effect on leaf reflectance intensity inthese regions became more pronounced. In addition, the slope at the red edgeposition between VIS and NIR became less steeply. A blue shift of the red edgeposition depending on Cercospora leaf spot disease severity was obvious. At adisease severity of 80%, reflectance increased over the whole spectrum and atypical spectral signature of vegetation was no longer detectable.
57
4.2. Differentiation of foliar diseases based on spectral signatures of infected leaves
Depending on disease severity, standard derivation of specific bands of the spec-tra changed (Fig. 4.7). Standard derivation of reflectance of healthy sugar beetleaves ranged between 0.008 to 0.02 and was most pronounced next to the greenpeak at 550 nm and in the NIR between 700 to 900 nm. For Cercospora leafspot diseased leaves, standard derivation varied depending on disease severity(Fig. 4.7 A). At 10%, 20%, and 50% disease severity of highest derivations werenoticed between 550 to 700 nm and 700 to 900 nm. These high values werein the spectral bands, affected by Cercospora leaf spot, and ranged from 0.01to 0.04. At 80% disease severity standard derivation was high between 600 to850 nm, with a peak at 670 nm. Maximal derivation was comparatively lowerthan at 20% to 50% disease severities. The results suggested that bands withhigh reflectance differences among the Cercospora leaf spot disease severitiesfeatured highest standard derivation due to variability among the leaves.
Powdery mildewReflectance of leaves colonized by the ectoparasite E. betae rose consecutivelywithin the measuring period and with increase in disease severity, starting 9 dai(Fig. 4.5 C, Fig. 4.6 B). This steady increment was most distinctive in the VISand less pronounced in the NIR. Powdery mildew rather affected the overall levelof reflectance than the profile of spectra. The overall standard derivation rangedfrom 0.005 to 0.025. At 10% and 20% disease severity standard derivation in theVIS was similar to healthy plants, and lower in the NIR compared to healthyplants (Fig. 4.7 B). At higher disease severities standard derivation in the VISraised to 0.015 to 0.025. A higher standard derivation compared to healthyleaves was also noticed in the NIR.
Sugar beet rustDue to the small symptoms of the biotroph U. betae scattered on the leaf area,changes in reflectance spectra were comparatively low for leaf rust (Fig. 4.6C). First changes in reflectance were measurable 15 dai (Fig. 4.5 D). At 10%disease severity, changes were not significant compared to healthy leaves. In
58
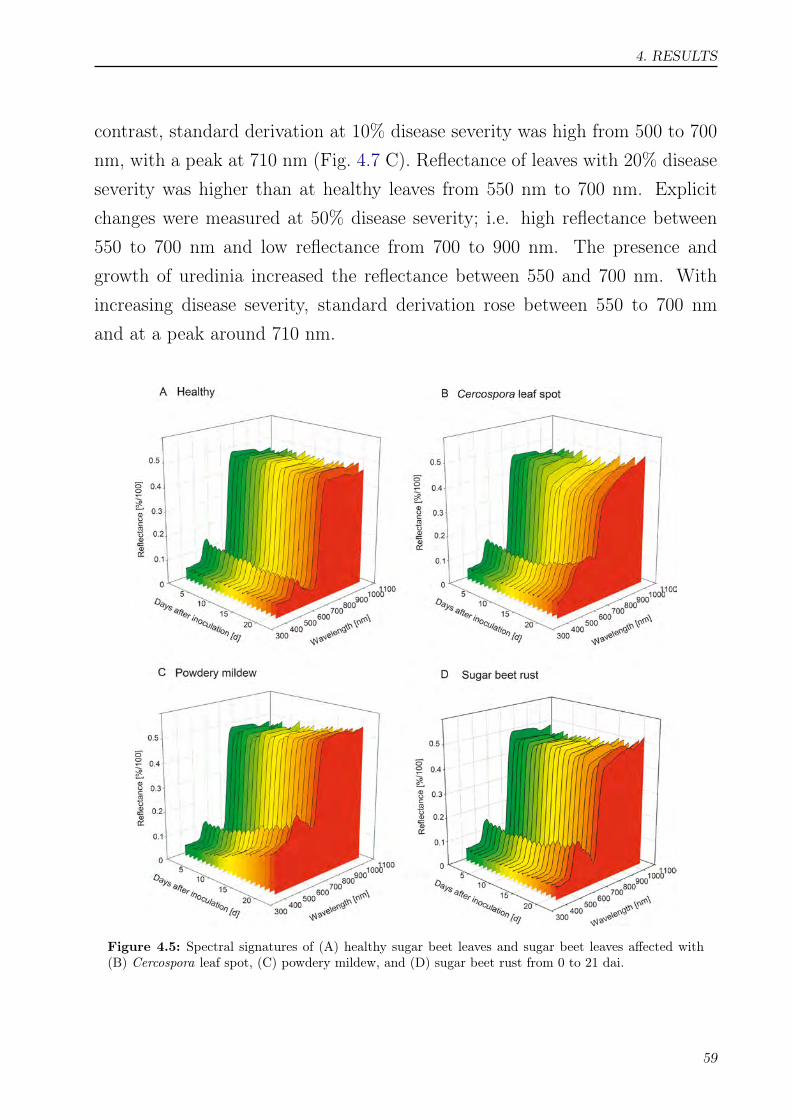
4. RESULTS
contrast, standard derivation at 10% disease severity was high from 500 to 700nm, with a peak at 710 nm (Fig. 4.7 C). Reflectance of leaves with 20% diseaseseverity was higher than at healthy leaves from 550 nm to 700 nm. Explicitchanges were measured at 50% disease severity; i.e. high reflectance between550 to 700 nm and low reflectance from 700 to 900 nm. The presence andgrowth of uredinia increased the reflectance between 550 and 700 nm. Withincreasing disease severity, standard derivation rose between 550 to 700 nmand at a peak around 710 nm.
Figure 4.5: Spectral signatures of (A) healthy sugar beet leaves and sugar beet leaves affected with(B) Cercospora leaf spot, (C) powdery mildew, and (D) sugar beet rust from 0 to 21 dai.
59

4.2. Differentiation of foliar diseases based on spectral signatures of infected leaves
Figure 4.6: Spectral signatures of sugar beet leaves affected by (A) Cercospora leaf spot, (B) powderymildew, and (C) sugar beet rust at different disease severities. Reflectance was measured under controlledconditions using an ASD FieldSpec FR.
60

4. RESULTS
Figure 4.7: Standard derivation of spectral reflectance of sugar beet leaves affected by (A) Cercosporaleaf spot, (B) powdery mildew, and (C) sugar beet rust at different disease severities. Reflectance wasmeasured under controlled conditions using an ASD FieldSpec FR.
61
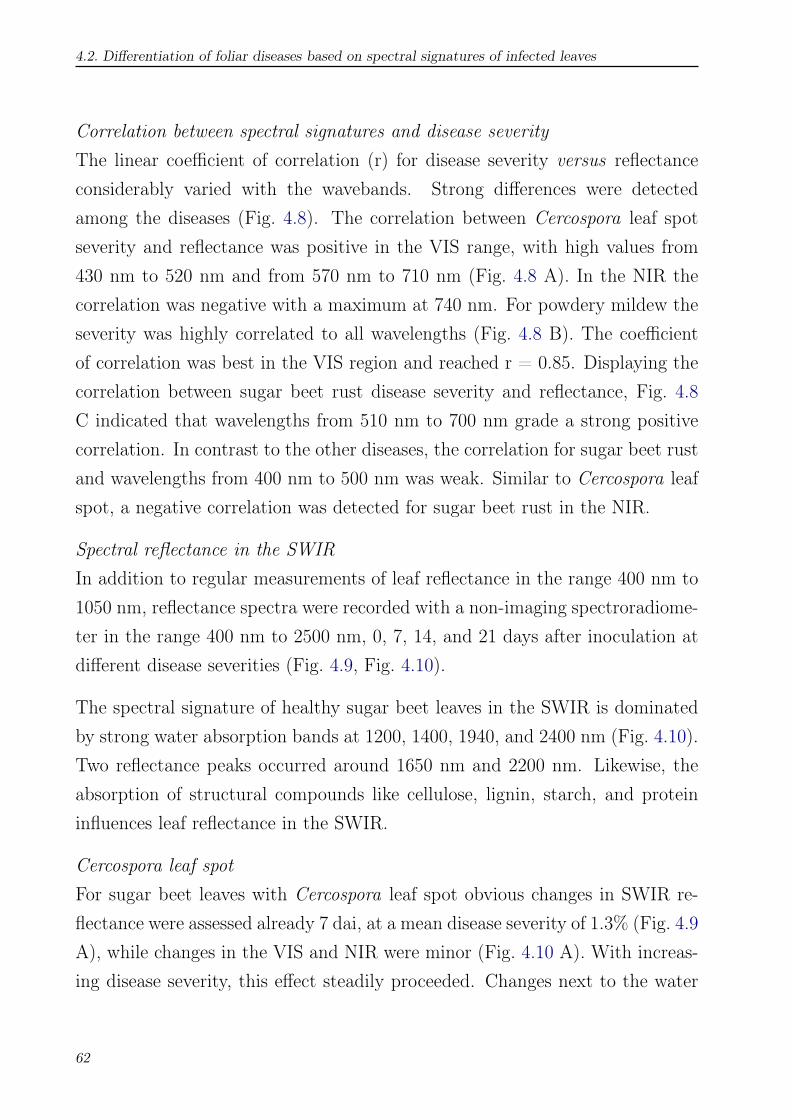
4.2. Differentiation of foliar diseases based on spectral signatures of infected leaves
Correlation between spectral signatures and disease severityThe linear coefficient of correlation (r) for disease severity versus reflectanceconsiderably varied with the wavebands. Strong differences were detectedamong the diseases (Fig. 4.8). The correlation between Cercospora leaf spotseverity and reflectance was positive in the VIS range, with high values from430 nm to 520 nm and from 570 nm to 710 nm (Fig. 4.8 A). In the NIR thecorrelation was negative with a maximum at 740 nm. For powdery mildew theseverity was highly correlated to all wavelengths (Fig. 4.8 B). The coefficientof correlation was best in the VIS region and reached r = 0.85. Displaying thecorrelation between sugar beet rust disease severity and reflectance, Fig. 4.8C indicated that wavelengths from 510 nm to 700 nm grade a strong positivecorrelation. In contrast to the other diseases, the correlation for sugar beet rustand wavelengths from 400 nm to 500 nm was weak. Similar to Cercospora leafspot, a negative correlation was detected for sugar beet rust in the NIR.
Spectral reflectance in the SWIRIn addition to regular measurements of leaf reflectance in the range 400 nm to1050 nm, reflectance spectra were recorded with a non-imaging spectroradiome-ter in the range 400 nm to 2500 nm, 0, 7, 14, and 21 days after inoculation atdifferent disease severities (Fig. 4.9, Fig. 4.10).
The spectral signature of healthy sugar beet leaves in the SWIR is dominatedby strong water absorption bands at 1200, 1400, 1940, and 2400 nm (Fig. 4.10).Two reflectance peaks occurred around 1650 nm and 2200 nm. Likewise, theabsorption of structural compounds like cellulose, lignin, starch, and proteininfluences leaf reflectance in the SWIR.
Cercospora leaf spotFor sugar beet leaves with Cercospora leaf spot obvious changes in SWIR re-flectance were assessed already 7 dai, at a mean disease severity of 1.3% (Fig. 4.9A), while changes in the VIS and NIR were minor (Fig. 4.10 A). With increas-ing disease severity, this effect steadily proceeded. Changes next to the water
62

4. RESULTS
Figure 4.8: Diagram of coefficient of correlation (r) for the linear correlation between spectral re-flectance of sugar beet leaves and disease severity in relation to wavelength for (A) Cercospora leaf spot,(B) powdery mildew, and (C) sugar beet rust.
absorption bands at 1400 nm and 1940 nm were most obvious 14 and 21 dai(disease severity: 14.7% and 57.9%, respectively). Changes in the SWIR weregreater than those in the VIS and NIR.
Powdery mildewPowdery mildew caused distinctive changes in the SWIR from 14 dai and lateron (Fig. 4.10 B). With 2.5% disease severity 7 dai, reflectance curve of pow-
63

4.2. Differentiation of foliar diseases based on spectral signatures of infected leaves
Figure 4.9: Disease severity of (A) Cercospora leaf spot, (B) powdery mildew and (C) sugar beet ruston sugar beet leaves at times of full range hyperspectral measurements in the VIS, NIR, and SWIR,0,7, 14, and 21 days after inoculation (dai).
64

4. RESULTS
dery mildew interfered with reflectance of non diseased leaves. With increasingdisease severity, reflectance in the SWIR rose slightly 14 and 21 dai (36.2%and 100%, respectively; Fig. 4.9 B). Similar to changes in the VIS and NIR,powdery mildew influenced more the absolute SWIR reflectance values than theshape of the spectrum.
Sugar beet rustContrary to the other two foliar diseases, increasing disease severity of sugarbeet rust caused a decline of reflectance in the SWIR (Fig. 4.10 C). This effectwas already detectable 7 dai, before visible symptoms occurred, and remainedstable during the measurements until 14 dai with a disease severity of 4.9% and21 dai with a disease severity of 42.5% (Fig. 4.9 C, Fig. 4.10 C).
Canopy reflectanceCanopy reflectance is influenced by several factors as leaf geometry, leaf an-gle and shadow effects. Thus, disease-specific effects may be covered. Highvariation in NIR reflectance during the measuring period was caused by thegrowth of sugar beet plants and leaves, and thus by changes in the sugar beetcanopy. Plant growth influenced the canopy density, plant height, and soilcover as well as the relation between leaf area, petioles, and vegetative plantorgans. Reflectance measurements on the canopy scale during disease progressgave similar effects with minor peculiarity (Fig. 4.11). Reflectance in the VISof healthy leaves remained constant during the measuring period (Fig. 4.11A). Reflectance of canopies of Cercospora leaf spot diseased sugar beet plantsrevealed a steady increase in reflectance between 550 and 700 nm, similar tomeasurements on the leaf scale (Fig. 4.11 B).
An impact of diseased leaves on canopy reflectance in the NIR was not de-tected. Canopy reflectance of powdery mildew diseased plants rose in the VIS.Variation in NIR reflectance was higher than in healthy leaves (Fig. 4.11 C).Significant changes in canopy reflectance due to sugar beet rust symptoms werenot recorded (Fig. 4.11 D). Minimal reflectance deviation around the green peak
65
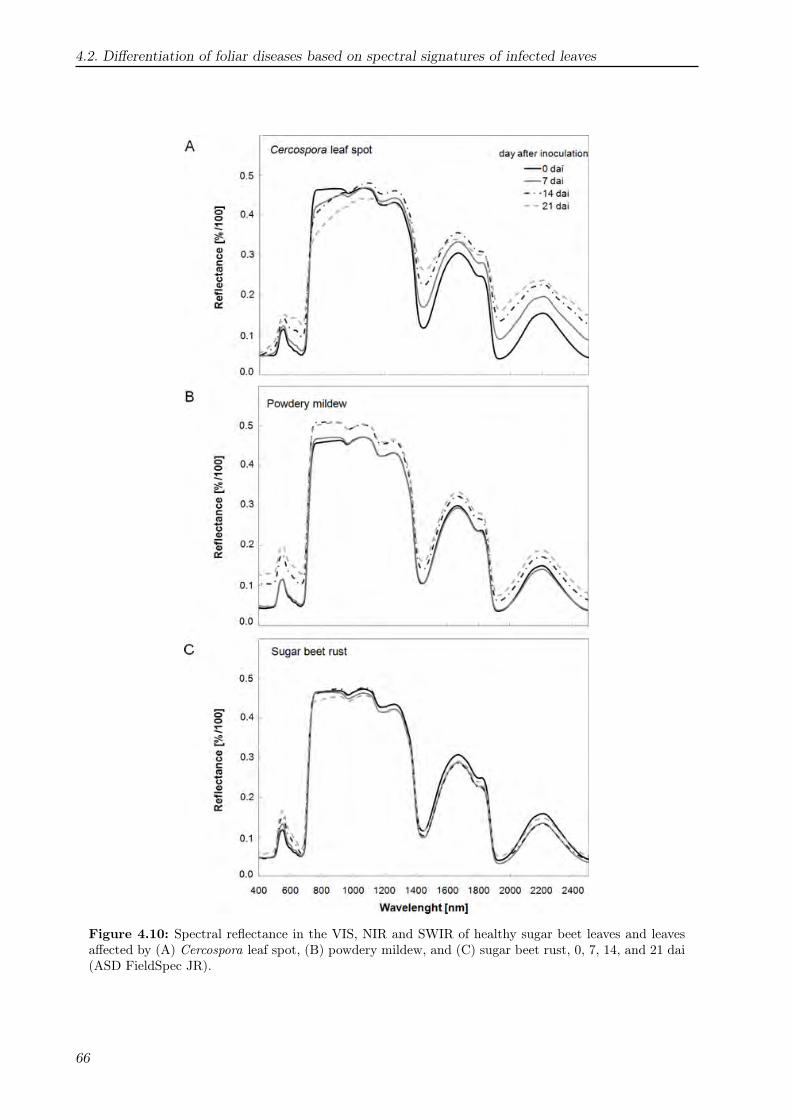
4.2. Differentiation of foliar diseases based on spectral signatures of infected leaves
Figure 4.10: Spectral reflectance in the VIS, NIR and SWIR of healthy sugar beet leaves and leavesaffected by (A) Cercospora leaf spot, (B) powdery mildew, and (C) sugar beet rust, 0, 7, 14, and 21 dai(ASD FieldSpec JR).
66

4. RESULTS
Figure 4.11: Spectral signature of (A) healthy sugar beet canopy and affected by (B) Cercospora leafspot, (C) powdery mildew, and (D) sugar beet rust, measured on the canopy level in the VIS and NIRat different days after inoculation.
and between 550 to 700 nm occurred during the measuring period. In fact ofthe small symptom size and the leaf area to symptom relation, it was not fea-sible to assure a sugar beet rust infestation using a hyperspectral non-imagingspectroradiometer on canopy scale.
4.2.2 Selection of disease-specific wavelengths
An appropriate way to enhance differences between spectral signatures and todetermine sensitive and significant wavelengths for a disease is the calculationof difference and ratio spectra.
67

4.2. Differentiation of foliar diseases based on spectral signatures of infected leaves
Cercospora leaf spotMaximal differences between healthy and Cercospora leaf spot diseased leavesover all disease severity levels were in the VIS at 510 nm and 690 nm. A maximalnegative value was in the NIR at 740 nm (Fig. 4.12 A). High differences couldbe generally denoted between 600 to 700 nm. The wavelengths of maximumreflectance sensitivity to Cercospora leaf spot were predominant in the VISbetween 450 to 500 nm and 600 to 700 nm, with maximal values at 480 nm and665 nm (Fig. 4.13 A). In contrast to reflectance differences, sensitivities werelow in the NIR.
Powdery mildewFor powdery mildew diseased leaves, reflectance differences were on a constantlevel between 400 to 700 nm, with a small peak at 700 nm and minor distinctivevalues between 720 to 1050 nm (Fig. 4.12 B). Maximal reflectance sensitivitywas between 400 to 530 nm and 570 to 700 nm (Fig. 4.13 B). Sensitivity had alocal minimum in the range from 530 to 570 nm.
Sugar beet rustComparatively minor differences and sensitivity values were estimated for spec-tral reflectance characteristic for sugar beet rust. Maximum differences occurredin the wavelengths of from 500 to 670 nm with an additional peak at 700 nm(Fig. 4.12 C). In the NIR, differences from 720 nm to 800 nm were negative.Sensitivity curve analysis indicated that wavelength most sensitive were from500 to 670 nm and near 700 nm (Fig. 4.13 C).
The information from spectral reflectance measurement and their related pa-rameters were combined in a table, summarising the principal impact of eachdisease on sugar beet reflectance (Tab. 4.2). Similarities and differences be-tween the different diseases became obvious. Cercospora leaf spot increasedreflectance in the blue, green, and red region and decreased reflectance in theNIR. Reflectance in the SWIR increased significantly, reflectance in the SWIRwas decreasing with increasing disease severity.
68

4. RESULTS
Figure 4.12: Difference spectra of sugar beet leaves affected by (A) Cercospora leaf spot, (B) pow-dery mildew, and (C) sugar beet rust at different disease severities. Non-dimensional differences werecomputed by subtracting reflectance of healthy leaves from that of diseased leaves.
69
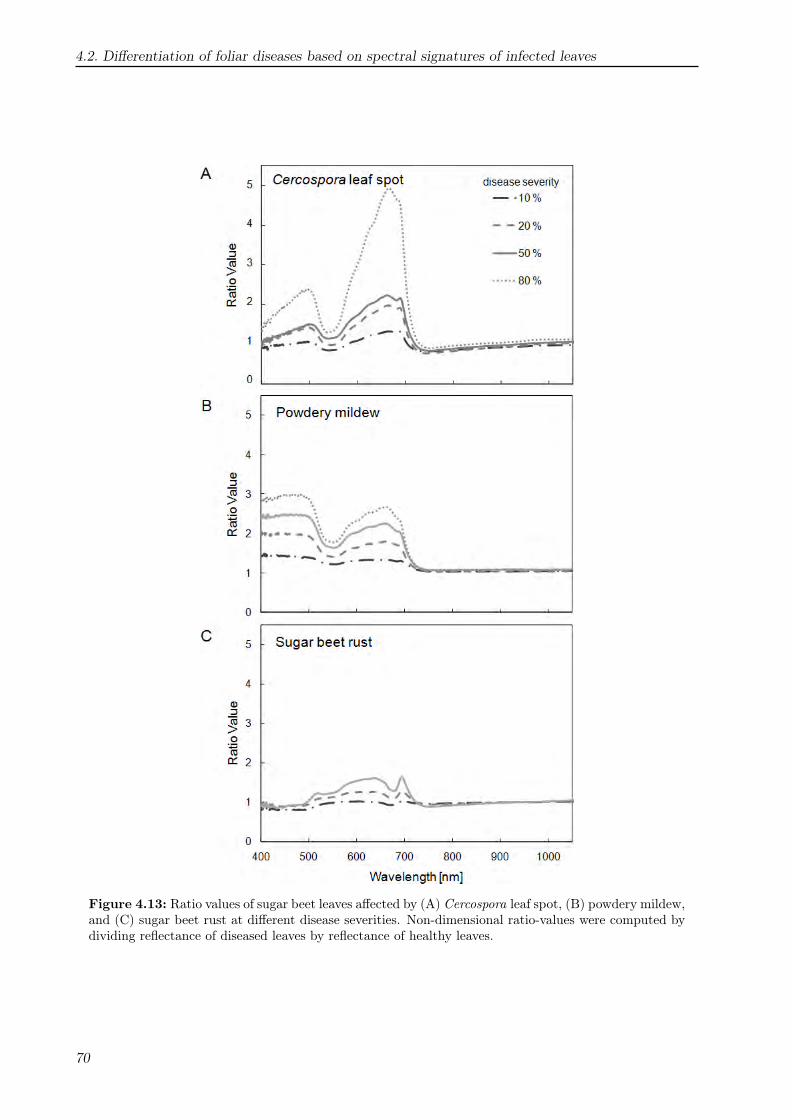
4.2. Differentiation of foliar diseases based on spectral signatures of infected leaves
Figure 4.13: Ratio values of sugar beet leaves affected by (A) Cercospora leaf spot, (B) powdery mildew,and (C) sugar beet rust at different disease severities. Non-dimensional ratio-values were computed bydividing reflectance of diseased leaves by reflectance of healthy leaves.
70
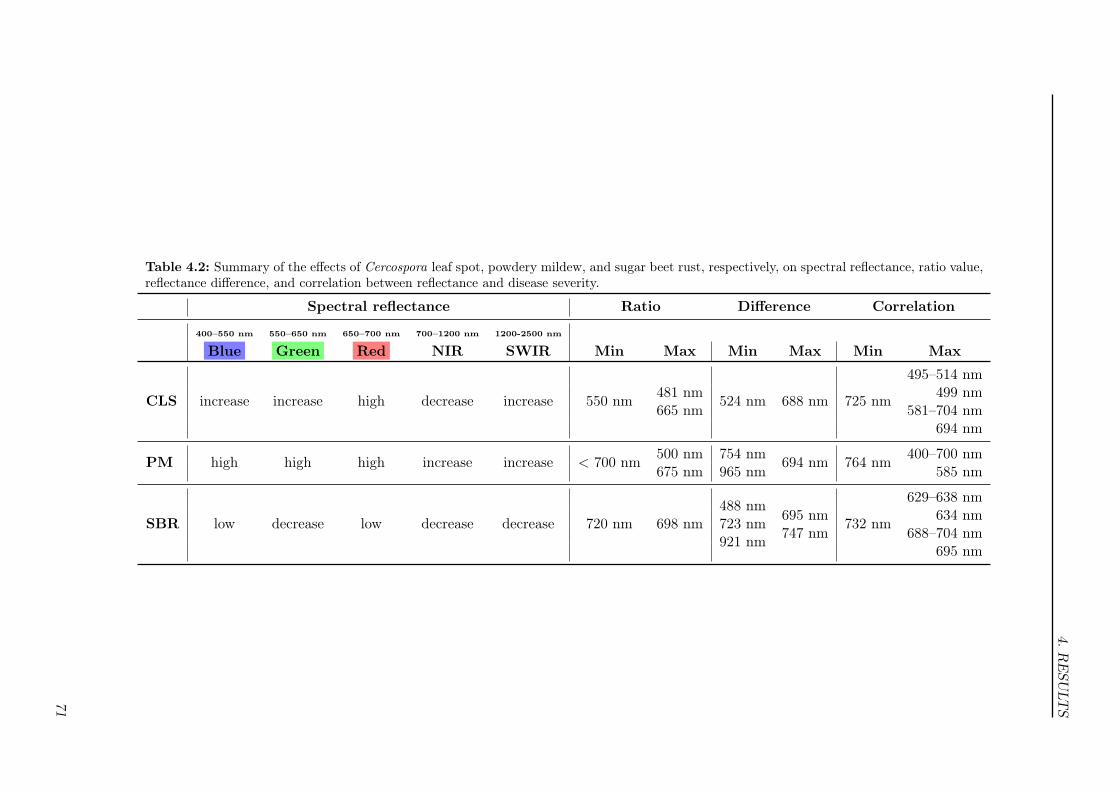
4.RESU
LTS
Table 4.2: Summary of the effects of Cercospora leaf spot, powdery mildew, and sugar beet rust, respectively, on spectral reflectance, ratio value,reflectance difference, and correlation between reflectance and disease severity.
Spectral reflectance Ratio Difference Correlation
400–550 nm 550–650 nm 650–700 nm 700–1200 nm 1200-2500 nm
Blue Green Red NIR SWIR Min Max Min Max Min Max
495–514 nm481 nm 499 nmCLS increase increase high decrease increase 550 nm665 nm
524 nm 688 nm 725 nm581–704 nm
694 nm
500 nm 754 nm 400–700 nmPM high high high increase increase < 700 nm675 nm 965 nm
694 nm 764 nm585 nm
629–638 nm488 nm695 nm 634 nmSBR low decrease low decrease decrease 720 nm 698 nm 723 nm747 nm
732 nm688–704 nm921 nm
695 nm
71
4.2. Differentiation of foliar diseases based on spectral signatures of infected leaves
Wavelengths around the green peak region, next to 690 nm as well as the slopeat the red edge position were highly correlated to disease severity. Higher re-flectance over the whole spectrum was characteristic for powdery mildew infes-tations. In general, wavelengths in the VIS were stronger correlated to powderymildew disease severities than reflectance in the NIR and SWIR. The influenceof sugar beet rust on reflectance parameters was minor; no change of spectralreflectance in the blue region, slight increase at the green peak region, anddecrease in the NIR were characteristic. In contrast to the other pathogens,reflectance in the SWIR was decreasing with increasing disease severity.
72

4. RESULTS
4.3 Spectral vegetation indices as indicators of plant
status and their correlation to diseases
Twenty-one SVIs related to physiological plant parameters were calculated foreach treatment and every day. Their suitability to distinguish between healthyand diseased sugar beets was proven. Regarding the biochemical modificationsof diseased plants, some SVIs were more sensitive to detect changes in planthealth than others (Tab. 4.3, Tab. 4.4).
4.3.1 Effect of disease progression on spectral vegetation indices
The correlation between SVIs and disease severity varied among the differ-ent diseases (Tab. 4.3). Disease severity of Cercospora leaf spot was stronglycorrelated to vitality and leaf area related SVIs ND and NDVI (r = -0.89;r = -0.89), to the chlorophyll related spectral vegetation indices PSNDa andPSNDb (r = -0.89, r = - 0.90), as well as to PRI (r = -0.88) as an indica-tor for photosynthetic radiation use efficiency. Spectral vegetation indiceshighly correlated to powdery mildew were the pigment specific indices SIPI(r = -0.88), PSNDa, PSNDb, and PSNDc (r = -0.88, r = -0.89, r = -0.88), theNDVI (r = -0.88), and the SumGREEN index (r = -0.86), which is related toreflectance between 500 to 600 nm. Correlations between sugar beet rust diseaseseverity and the SVIs was generally minor. Good correlations were found forthe PRI (r = -0.82) and for the anthocyanin specific ARI (r = 0.79). The mCAI(r = -0.74) as an indicator for chlorophyll content and the ND (r = - 0.75) werealso correlated to sugar beet rust infestation.
Cercospora leaf spotThe PSRI was most sensitive to increases in disease severity of Cercospora leafspot (Tab. 4.4). Significant differences during the measuring period could bedetected 7 dai and later, according to the occurrence of first symptoms. Signifi-cant changes were found for the BGI2, the ARI and the WI 8 dai, however, the
73

4.3. Spectral vegetation indices as indicators of plant status and their correlation to diseases
correlation to these indices was lower. The WI was significantly affected onlyby Cercospora leaf spot pathogenesis, while the impact of powdery mildew andsugar beet rust was not significant. Chlorophyll related spectral vegetation in-dices like SR, ND, NDVI, PRI, PSSRa, and PSSRb were able to detect changeswithin the pathogenesis of C. beticola 9 dai. The mSR was not suitable forthe detection of physiological changes from Cercospora leaf spot. Significantdifferences occurred only from 14 dai to 18 dai. Likewise, REP, SumGREEN,and SumVIS were not appropriate to detect early changes caused by Cercosporaleaf spot (significant differences were measured only after 16 dai).
Table 4.3: Coefficients of correlation between disease severity and spectral vegetationindices for the three leaf diseases of sugar beet.
Index Cercospora leaf spot Powdery mildew sugar beet rust
SR -0.85∗1 -0.85∗ -0.71∗
mSR -0.85∗ -0.60∗ -0.70∗
ND -0.89∗ -0.86∗ -0.75∗
NDVI -0.89∗ -0.88∗ -0.70∗
PRI -0.88∗ -0.77∗ -0.82∗
SIPI -0.86∗ -0.88∗ -0.51∗
PSSRa -0.81∗ -0.85∗ -0.64∗
PSSRb -0.81∗ -0.85∗ -0.61∗
PSSRc -0.74∗ -0.83∗ -0.23∗
PSNDa -0.89∗ -0.88∗ -0.64∗
PSNDb -0.90∗ -0.89∗ -0.72∗
PSNDc -0.81∗ -0.88∗ -0.22∗
ARI 0.73∗ 0.51∗ 0.79∗
mCAI -0.84∗ -0.78∗ -0.74∗
REP -0.76∗ -0.55∗ -0.62∗
PSRI 0.86∗ -0.27∗ 0.64∗
WI -0.68∗ -0.01 -0.59∗
MCARI -0.30∗ -0.39∗ 0.61∗
SumGREEN 0.80∗ 0.86∗ 0.60∗
SumVIS 0.87∗ 0.86∗ 0.59∗
BGI2 0.42∗ 0.82∗ -0.44∗
1 correlation was calculated as Pearsons coefficient of correlation (r); asterisks denote significantcorrelation with p = 0.01, n = 630
Note: highlighted SVIs indicate high correlation to disease severity
74
4. RESULTS
Powdery mildewAlthough first symptoms appeared 5 dai, significant changes in SVIs from pow-dery mildew were detected 8 dai (Tab. 4.4), the SumVIS index changed sig-nificantly to the initial value of the measuring period. The sensitivity of theSumVIS index, similar to the SumGREEN index differed strongly to the dis-eases, significant differences occurred 9 dai. An impact of Cercospora leaf spotand sugar beet rust were detectable by these indices only 16 dai and later.The SVIs - mSR, NDVI, PSSRa, PSSRb, PSNDa, and PSNDb – assessingthe chlorophyll content, were sensitive to powdery mildew 10 dai, whereas themCAI index was significant already 9 dai. Other pigment-specific SVIs like thecarotenoid specific SIPI, PSSRc, and PSNDc and the anthocyanin-indicatingARI showed significant differences 10 dai and later. The REP seems as wellappropriate to detect powdery mildew diseased sugar beet leaves. Significantdifferences in the red edge position were detected 10 dai for powdery mildewand only 16 dai for Cercospora leaf spot and sugar beet rust. The WI and theMCARI were less qualified to detect powdery mildew.
Sugar beet rustChanges between rust-infected and healthy plants were recorded for thePRI linked to photosynthetic radiation use efficiency and for the senescence-indicating PSRI 10 dai (Tab. 4.4). These results coincided with the first oc-currence of rust-specific symptoms on sugar beet leaves. All other vegeta-tion indices were less suitable to distinguish between healthy and rust-diseasedsugar beet leaves; significant differences occurred not earlier than 16 dai. Nosignificant differences among SVIs were found for the carotenoid specific in-dices PSSRc and PSNDc. Although the non-inoculated plant remained healthyduring the measuring period, statistically significant differences were measuredwithin this treatment by SR, MCARI, BGI2, PSSRa, PSSRb, and PSNDa. Inmost of the cases these significances were recorded 14 to 20 dai, when senescenceeffects the healthy sugar beet leaves.
75

4.3.Spectralvegetationindices
asindicators
ofplant
statusand
theircorrelation
todiseases
Table 4.4: Coefficients of correlation between disease severity and different spectral vegetation indices for the three leaf diseases of sugar beet1.
Index2 Treatment Days after inoculation0 5 6 7 8 9 10 11 12 14 16 18 20
SR Healthy 2.49 2.82 2.89 2.97 2.96 2.99 2.99 2.99 3.08 3.12∗ 3.07 3.07 3.02CLS 2.48 2.72 2.78 2.76 2.61 2.42 2.22 2.16∗ 2.24 1.97 1.69 1.61 1.50PM 2.98 2.90 2.87 2.91 2.77 2.66∗ 2.50 2.44 2.34 2.19 2.10 2.01 1.88SBR 2.48 2.65 2.75 2.73 2.73 2.73 2.62 2.70 2.72 2.60 2.17∗ 2.04 1.83
mSR Healthy 3.03 3.51 3.63 3.77 3.65 3.79 3.81 3.81 3.98 4.03∗ 4.01 4.04 3.98CLS 3.00 3.43 3.55 3.38 3.25 2.99 2.75 2.63 2.72 2.35∗ 1.95 1.83 1.69PM 3.73 3.65 3.57 3.73 3.52 3.44 3.16∗ 3.31 3.21 3.23 3.18 3.03 2.94SBR 3.07 3.22 3.34 3.34 3.36 3.35 3.22 3.32 3.30 3.16 2.49∗ 2.31 2.03
ND Healthy 0.43 0.48 0.49 0.50 0.50 0.50 0.50 0.50 0.51 0.51 0.51 0.51 0.50CLS 0.43 0.46 0.47 0.47 0.45 0.42 0.38 0.37 0.38∗ 0.33 0.26 0.23 0.20PM 0.50 0.49 0.48 0.49 0.47 0.45∗ 0.43 0.42 0.40 0.37 0.36 0.33 0.30SBR 0.42 0.45 0.47 0.46 0.46 0.46 0.45 0.46 0.46 0.44 0.37∗ 0.34 0.29
NDVI Healthy 0.78 0.80 0.80 0.81 0.81 0.80 0.80 0.80 0.80 0.81 0.81 0.81 0.81CLS 0.79 0.79 0.79 0.80 0.77 0.75∗ 0.71 0.70 0.70 0.64 0.58 0.56 0.51PM 0.81 0.81 0.81 0.80 0.80 0.78 0.77∗ 0.73 0.70 0.64 0.62 0.59 0.54SBR 0.78 0.80 0.80 0.80 0.80 0.80 0.79 0.79 0.80 0.79 0.76 0.75∗ 0.72
PRI Healthy 0.02 0.03 0.03 0.02 0.02 0.03 0.03 0.03 0.02 0.02 0.03 0.03 0.03CLS 0.02 0.02 0.02 0.02 0.02 0.01∗ -0.01 -0.01 -0.01 -0.02 -0.03 -0.04 -0.05PM 0.03 0.02 0.03 0.02 0.03 0.03 0.02 0.02 0.01∗ 0.01 0.01 0.01 -0.01SBR 0.03 0.03 0.02 0.02 0.02 0.03 0.02∗ 0.01 0.01 0.01 -0.01 -0.01 -0.03
SIPI Healthy 0.79 0.81 0.81 0.81 0.82 0.81 0.81 0.81 0.81 0.81 0.81 0.81 0.81CLS 0.79 0.80 0.80 0.81 0.78 0.77 0.74∗ 0.74 0.74 0.70 0.67 0.65 0.62PM 0.82 0.81 0.82 0.80 0.80 0.78 0.77∗ 0.73 0.70 0.64 0.62 0.59 0.54SBR 0.78 0.81 0.81 0.81 0.80 0.81 0.79 0.80 0.81 0.80 0.79 0.78 0.76∗
BGI2 Healthy 0.36 0.37 0.37 0.38 0.36 0.39 0.39 0.39 0.42∗ 0.41 0.43 0.44 0.43CLS 0.34 0.39 0.40 0.36 0.40∗ 0.41 0.45 0.44 0.43 0.44 0.42 0.43 0.45PM 0.38 0.39 0.38 0.42 0.40 0.42 0.43 0.50∗ 0.53 0.59 0.62 0.64 0.67SBR 0.37 0.34 0.35 0.36 0.35 0.35 0.36 0.36 0.34 0.35 0.29∗ 0.30 0.29
76

4.RESU
LTS
Tab. 4.4 continued
Index2 Treatment Days after inoculation0 5 6 7 8 9 10 11 12 14 16 18 20
PSSRa Healthy 7.47 8.22 8.51 8.82 8.59 8.24 8.25 8.25 8.52 8.56 8.56 8.98∗ 8.91CLS 7.65 7.99 8.03 8.03 7.15 6.47∗ 5.52 5.33 5.37 4.36 3.59 3.39 2.95PM 8.72 8.49 8.95 8.23 8.03 7.48 7.12∗ 6.00 5.41 4.35 4.12 3.72 3.25SBR 7.50 8.16 8.40 8.23 8.21 8.20 7.63 7.97 8.49 7.77 6.77 6.55∗ 5.63
PSSRb Healthy 6.54 7.42 7.61 7.82 8.18 7.94 7.94 7.94 8.01 8.39∗ 8.10 8.26 8.19CLS 6.55 6.99 7.12 7.32 6.44 5.73∗ 4.93 4.77 5.02 4.06 3.31 3.10 2.70PM 8.05 7.98 7.87 7.64 7.32 6.80 6.39∗ 5.50 4.98 4.10 3.81 3.48 3.03SBR 6.45 7.21 7.54 7.25 7.19 7.18 6.71 6.94 7.23 6.60 5.46∗ 4.99 4.24
PSSRc Healthy 8.86 9.94 10.14 10.35 11.29 10.47 10.12 10.12 10.20 10.64 10.07 9.74 9.57CLS 9.01 9.16 9.28 10.29 9.07 8.20 7.24∗ 7.40 7.75 6.73 6.08 5.86 5.25PM 10.76 10.45 10.39 9.74 9.48 8.41 8.25∗ 6.53 5.91 4.61 4.27 3.94 3.42SBR 8.46 9.90 10.36 10.15 9.98 9.81 9.33 9.78 10.65 9.66 9.82 9.35 8.88
PSNDa Healthy 0.76 0.78 0.79 0.80 0.79 0.78 0.78 0.78 0.79 0.79 0.79 0.80∗ 0.80CLS 0.77 0.78 0.78 0.78 0.75 0.73 0.69∗ 0.68 0.69 0.63 0.56 0.54 0.49PM 0.79 0.79 0.80 0.78 0.78 0.76 0.75∗ 0.71 0.69 0.63 0.61 0.58 0.53SBR 0.76 0.78 0.79 0.78 0.78 0.78 0.77 0.78 0.79 0.77 0.74 0.74 0.70∗
PSNDb Healthy 0.73 0.76 0.77 0.77 0.78 0.78 0.78 0.78 0.78 0.79 0.78 0.78 0.78CLS 0.74 0.75 0.75 0.76 0.73 0.70 0.66∗ 0.65 0.67 0.60 0.54 0.51 0.46PM 0.78 0.78 0.77 0.77 0.76 0.74 0.73∗ 0.69 0.67 0.61 0.58 0.55 0.50SBR 0.73 0.76 0.77 0.76 0.76 0.76 0.74 0.75 0.76 0.74 0.69 0.67∗ 0.62
PSNDc Healthy 0.80 0.82 0.82 0.82 0.84 0.83 0.82 0.82 0.82 0.83 0.82 0.81 0.81CLS 0.80 0.80 0.81 0.82 0.80 0.78 0.76∗ 0.76 0.77 0.74 0.72 0.71 0.68PM 0.83 0.83 0.82 0.81 0.81 0.79 0.78∗ 0.73 0.71 0.64 0.62 0.60 0.55SBR 0.79 0.82 0.82 0.82 0.82 0.82 0.81 0.81 0.83 0.81 0.82 0.81 0.80
mCAI Healthy -33.9 -31.2 -30.6 -29.9 -29.0 -30.5 -30.4 -30.4 -28.6 -28.2 -28.8 -28.0 -30.2CLS -33.1 -31.6 -31.0 -29.8 -31.0 -30.7 -30.4 -30.1 -31.8 -33.1 -38.5∗ -39.0 -42.2PM -30.1 -29.7 -29.2 -29.9 -32.5 -33.3∗ -33.8 -36.4 -37.3 -43.6 -44.2 -47.4 -51.6SBR -31.6 -31.1 -29.8 -30.7 -31.6 -32.0 -32.4 -31.6 -31.8 -31.8 -35.8∗ -35.6 -37.8
ARI Healthy -0.35 -0.53 -0.62 -0.73 -0.46 -0.45 -0.49 -0.49 -0.34 -0.25 -0.34 -0.42 -0.48CLS -0.47 -0.55 -0.52 -0.30 0.07∗ 0.39 0.92 1.15 1.04 1.47 1.48 1.57 1.69PM -0.39 0.04 -0.32 -0.14 -0.14 -0.24 0.13∗ 0.05 0.15 0.03 0.09 0.18 0.1577

4.3.Spectralvegetationindices
asindicators
ofplant
statusand
theircorrelation
todiseases
Tab. 4.4 continued
Index2 Treatment Days after inoculation0 5 6 7 8 9 10 11 12 14 16 18 20
SBR -0.48 -0.56 -0.57 -0.55 -0.74 -0.77 -0.49 -0.50 -0.55 -0.43 0.02∗ 0.26 0.67REP Healthy 716.3 717.9 718.2 718.5 717.9 718.2 718.2 718.2 718.8 718.6 718.6 718.6 718.4
CLS 716.2 717.7 718.1 717.5 717.7 717.4 717.1 717.0 716.9 716.2 714.1∗ 713.1 712.1PM 718.3 718.0 717.9 718.2 717.5 717.3 716.8∗ 717.0 716.7 716.3 716.5 716.1 716.1SBR 716.5 717.0 717.4 717.5 717.3 717.2 717.0 717.3 717.3 717.1 714.7∗ 713.9 711.9
PSRI Healthy 0.011 0.014 0.012 0.009 0.020 0.018 0.015 0.015 0.015 0.019 0.013 0.009 0.011CLS 0.009 0.008 0.008 0.017∗ 0.017 0.017 0.031 0.038 0.042 0.064 0.089 0.099 0.124PM 0.013 0.017 0.010 0.014 0.011 0.008 0.012 0.008∗ 0.009 0.004 0.003 0.008 0.006SBR 0.004 0.014 0.016 0.014 0.011 0.009 0.017∗ 0.015 0.014 0.016 0.030 0.030 0.045
WI Healthy 1.04 1.04 1.04 1.04 1.04 1.03 1.04 1.04 1.03 1.04 1.03 1.03 1.03CLS 1.04 1.03 1.04 1.03 1.02∗ 1.01 1.00 0.99 1.00 0.99 0.98 0.98 0.98PM 1.04 1.04 1.03 1.03 1.03 1.04 1.03 1.04 1.03 1.04 1.03 1.03 1.04SBR 1.04 1.04 1.04 1.04 1.04 1.04 1.04 1.04 1.04 1.03 1.03 1.03 1.02∗
MCARI Healthy 0.24 0.18 0.17∗ 0.16 0.17 0.17 0.16 0.16 0.14 0.15 0.15 0.16 0.17CLS 0.24 0.19 0.17∗ 0.18 0.17 0.16 0.14 0.14 0.15 0.14 0.15 0.16 0.14PM 0.17 0.18 0.19 0.17 0.20 0.20 0.21 0.17 0.16 0.15 0.14∗ 0.14 0.13SBR 0.24 0.22 0.20 0.20 0.21 0.21 0.21 0.20 0.22 0.21 0.30∗ 0.31 0.33
SumGREEN Healthy 0.11 0.10 0.09 0.09 0.09 0.09 0.09 0.09 0.08 0.08 0.09 0.08 0.09CLS 0.11 0.10 0.10 0.09 0.10 0.10 0.10 0.10 0.10 0.11 0.13∗ 0.13 0.14PM 0.09 0.09 0.09 0.09 0.10 0.11∗ 0.11 0.12 0.13 0.16 0.16 0.18 0.20SBR 0.12 0.10 0.09 0.10 0.10 0.10 0.11 0.10 0.10 0.10 0.12 0.12 0.13∗
SumVIS Healthy 0.08 0.07 0.07 0.07 0.06 0.07 0.07 0.07 0.06 0.06 0.06 0.06 0.07CLS 0.08 0.07 0.07 0.07 0.08 0.08 0.08 0.08 0.08 0.09 0.11∗ 0.11 0.12PM 0.07 0.07 0.07 0.07 0.09∗ 0.09 0.09 0.10 0.10 0.13 0.14 0.15 0.18SBR 0.08 0.07 0.07 0.07 0.07 0.07 0.08 0.07 0.07 0.08 0.09∗ 0.09 0.10
1 for each index within a row, bold letters indicate significant differences to the initial value and asterisk marks denote first occurrence of significant differences during themeasuring period, according to general linear model GLM and Bonferroni-test (p = 0.01; n= 60)
2 CLS = Cercospora leaf spot, PM = powdery mildew, SBR = sugar beet rustNote: From day 1 to day 6 there were no significant differences between healthy and diseased treatments;
highlighted date indicates first appearance of visible disease symptom
78

4. RESULTS
4.3.2 Combination of spectral vegetation indices for disease identifi-cation
The results presented above allow only a classification between healthy anddiseased plants. In a second approach, index combinations were tested to dif-ferentiate the diseases. Pair-wise correlation coefficients between the SVIs werecalculated in a correlation matrix (Tab. 4.5). Low correlation coefficients indi-cated high dissimilarity of scatter-plots and thus a suitable index combinationfor disease detection and discrimination. Indices based on similar wavelengthor similar regions of the spectrum like NDVI and PSNDa, ND and SR, or mCAIand SumGREEN, were not suitable for discrimination of healthy and diseasedplants or among the diseases, as indicated by their high correlation coefficient(NDVI vs. PSNDa r= 0.99; ND vs. SR r = 0.98; mCAI vs. SumGREENr = - 0.99). Combinations of SVIs like ARI and SIPI (r = -0.60), MCARIand SR (r= -0.21), BGI2 and PRI (r= -0.09), or WI and MCAI (r= -0.03)were weakly correlated or not correlated, which indicated suitable combina-tions for disease separation. Scatter matrixes for all index combinations weremapped and the best differentiating combinations were examined (Fig. 4.14,Fig. 4.15). Divergent scatter plots denoted robust index combinations to dis-tinguish between the different diseases.
Plots of SIPI, PSSRa, PSSRb and NDVI, SumGREEN and SumVIS as well asREP, PSRI, PRI versus each other resulted in stacked scatter plots (Fig. 4.14).The discriminative potential of these combinations was low; the classes inter-fered with each other. Combinations including the ARI, except those with PSRIand PRI, respectively, showed obvious divergent scatter plots for diseased andhealthy leaves, as well as among the diseases. Most pronounced differences wereobserved for the combination ARI vs. SIPI, ARI vs. NDVI, BGI2 vs. PRI. Inparticular similar results could be noticed for ARI vs. mCAI.
79
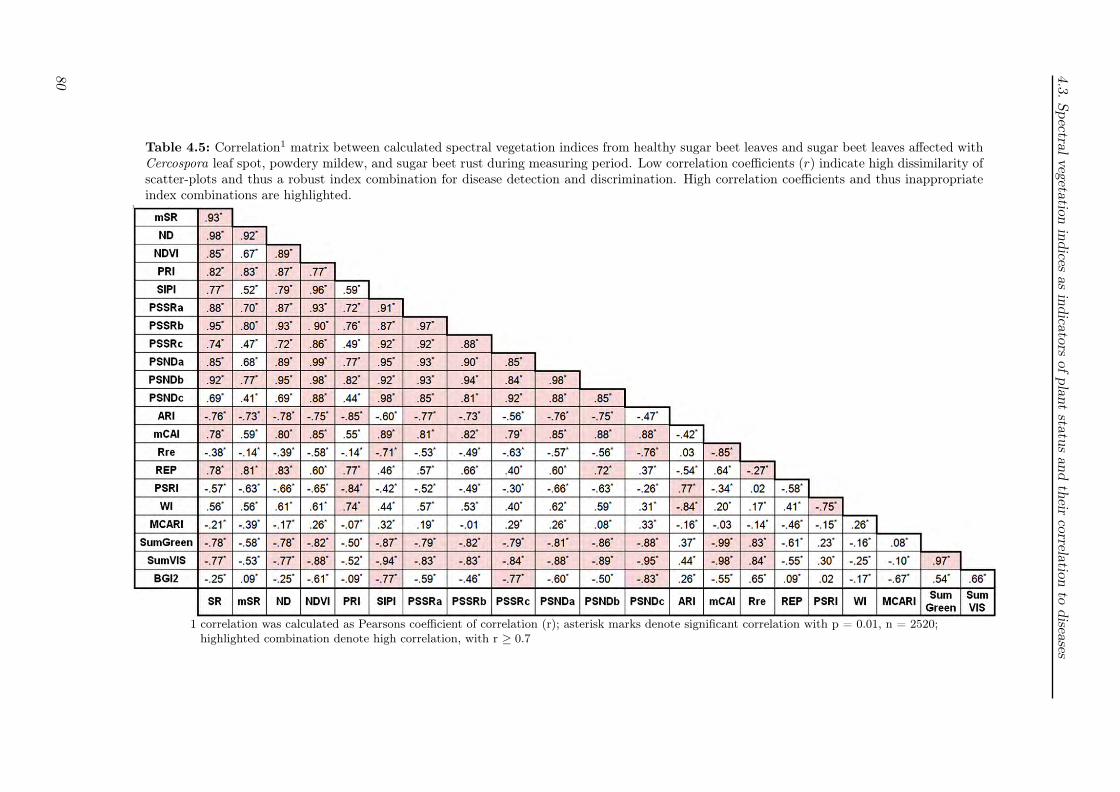
4.3.Spectralvegetationindices
asindicators
ofplant
statusand
theircorrelation
todiseases
Table 4.5: Correlation1 matrix between calculated spectral vegetation indices from healthy sugar beet leaves and sugar beet leaves affected withCercospora leaf spot, powdery mildew, and sugar beet rust during measuring period. Low correlation coefficients (r) indicate high dissimilarity ofscatter-plots and thus a robust index combination for disease detection and discrimination. High correlation coefficients and thus inappropriateindex combinations are highlighted.
1 correlation was calculated as Pearsons coefficient of correlation (r); asterisk marks denote significant correlation with p = 0.01, n = 2520;highlighted combination denote high correlation, with r ≥ 0.7
80
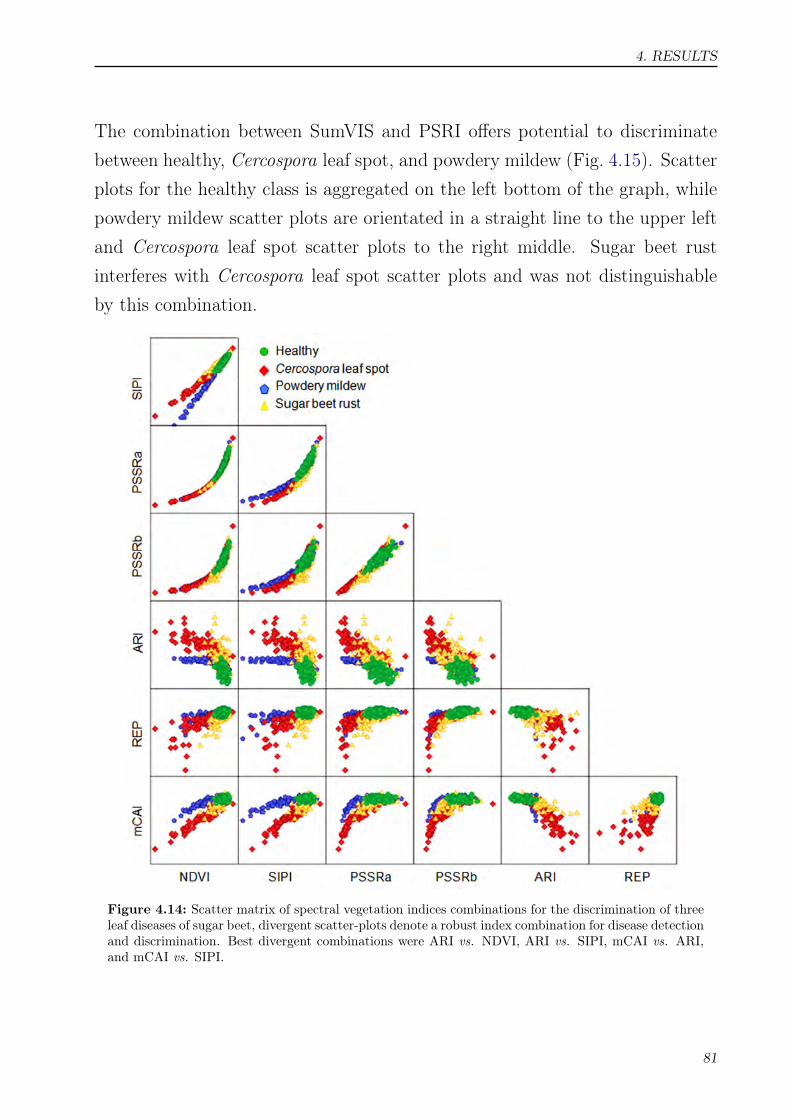
4. RESULTS
The combination between SumVIS and PSRI offers potential to discriminatebetween healthy, Cercospora leaf spot, and powdery mildew (Fig. 4.15). Scatterplots for the healthy class is aggregated on the left bottom of the graph, whilepowdery mildew scatter plots are orientated in a straight line to the upper leftand Cercospora leaf spot scatter plots to the right middle. Sugar beet rustinterferes with Cercospora leaf spot scatter plots and was not distinguishableby this combination.
Figure 4.14: Scatter matrix of spectral vegetation indices combinations for the discrimination of threeleaf diseases of sugar beet, divergent scatter-plots denote a robust index combination for disease detectionand discrimination. Best divergent combinations were ARI vs. NDVI, ARI vs. SIPI, mCAI vs. ARI,and mCAI vs. SIPI.
81

4.3. Spectral vegetation indices as indicators of plant status and their correlation to diseases
Figure 4.15: Scatter matrix continued. Best divergent combinations were SumVIS vs. ARI, BGI2 vs.PRI, and in particular to discriminate Cercospora leaf spot diseased plants from sugar beet rust diseasedplants MCARI vs. ARI and MCARI vs. PSRI.
Studying the combination ARI vs. SIPI in more detail showed that the severityof diseases biased the scatter plots (Fig. 4.16). Values from leaves with lowdisease severity were placed in the same region of the plot, irrespective of thedisease. With increasing disease severity, Cercospora leaf spot values changedto lower SIPI values and increasing ARI values. For higher sugar beet rust
82
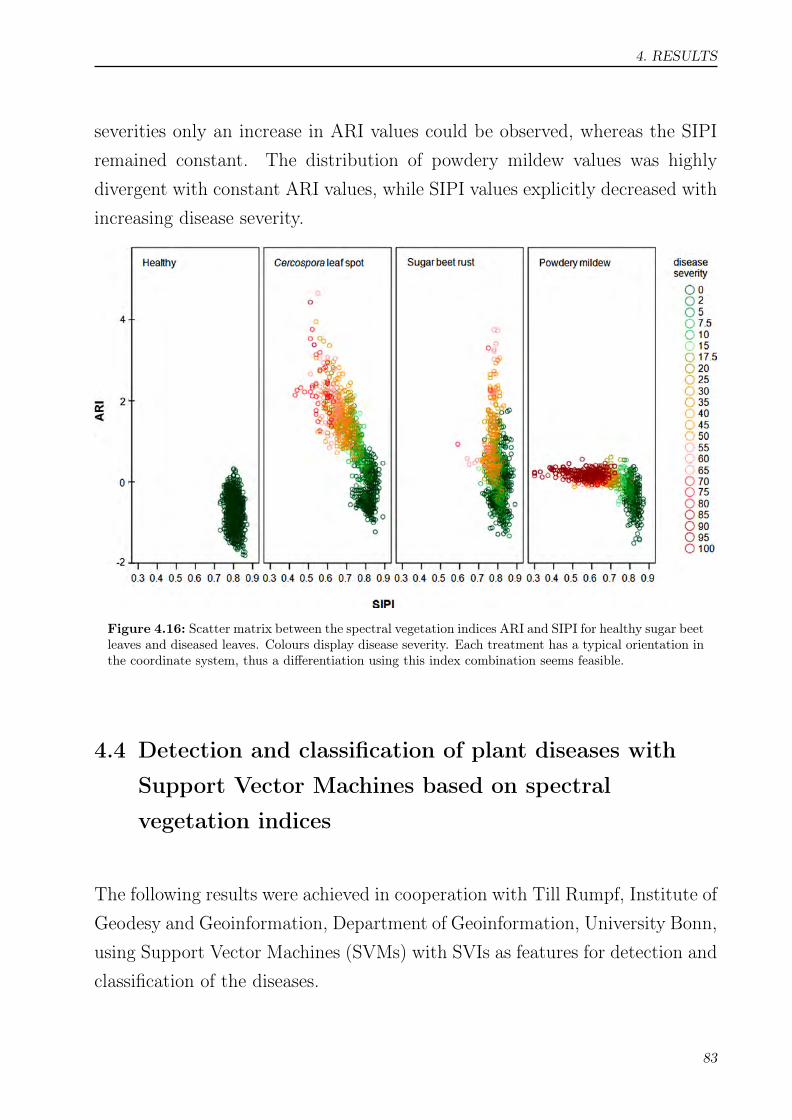
4. RESULTS
severities only an increase in ARI values could be observed, whereas the SIPIremained constant. The distribution of powdery mildew values was highlydivergent with constant ARI values, while SIPI values explicitly decreased withincreasing disease severity.
Figure 4.16: Scatter matrix between the spectral vegetation indices ARI and SIPI for healthy sugar beetleaves and diseased leaves. Colours display disease severity. Each treatment has a typical orientation inthe coordinate system, thus a differentiation using this index combination seems feasible.
4.4 Detection and classification of plant diseases with
Support Vector Machines based on spectral
vegetation indices
The following results were achieved in cooperation with Till Rumpf, Institute ofGeodesy and Geoinformation, Department of Geoinformation, University Bonn,using Support Vector Machines (SVMs) with SVIs as features for detection andclassification of the diseases.
83

4.4. Detection and classification of plant diseases with Support Vector Machines based on spectralvegetation indices
4.4.1 Dichotomous classification between healthy and diseased sugarbeet leaves
In a first dichotomous approach Support Vector Machines were used for thedifferentiation between two classes, non-inoculated, healthy leaves and leaves,inoculated with one of the three leaf pathogens, respectively. Eight SVIs (NDVI,SR, SIPI, PSSRa, PSSRb, ARI, REP, mCAI) and SPAD-values were used asfeatures for classification. The results showed that the specificity of classifica-tion was always above its sensitivity. Accuracy ranged from 93% to almost 97%(Tab. 4.6).
The classification accuracy increased with increasing disease severity (Fig. 4.17).Differences in the number of leaves per disease give additional information onthe reliability of classification results. With only 1% to 2% diseased leaf area,the classification accuracy was about 65% for all diseases. The accuracy of dif-ferentiating between healthy leaves and leaves with Cercospora leaf spot symp-toms rapidly increased with 3% to 5% disease severity. When more than 10%of the leaf area was covered by leaf spots, the classification accuracy reached100% (Fig. 4.17). The accuracy of detecting symptoms of sugar beet rust andpowdery mildew was lower at low disease severities. For sugar beet rust classifi-cation accuracy reached 95% when disease severity was above 6%. Leaves withpowdery mildew could be differentiated from healthy leaves with an accuracyof about 95% when 10% to 15% of the leaf area was diseased (Fig. 4.17).
Table 4.6: Classification result of the dichotomous classification between healthy and diseased sugarbeet leaves based on spectral vegetation indices using Support Vector Machines.
Leaf disease Accuracy [%] Specificity [%] Sensitivity [%]
Cercospora leaf spot 96.68 97.84 95.45Sugar beet rust 96.20 97.14 95.14Powdery mildew 93.18 94.80 91.40
84

4. RESULTS
Figure 4.17: Classification result of non-inoculated sugar beet leaves and sugar beet leaves with threediseases depending on disease severity (numbers within bars denote class size).
4.4.2 Multi-class classification among healthy leaves and leaves withspecific disease symptoms
Tab. 4.7 summarises the results of the model learned which classified healthysugar beet leaves and leaves diseased with Cercospora leaf spot, sugar beetrust, and powdery mildew, respectively (multi-class classification). The overallclassification accuracy was better than 88%, differences between the classeswere low. The class recall of each class ranged between 84% and > 92%. Theclass of healthy leaves was classified best. Classification difficulties occurred inseparating between sugar beet rust and Cercospora leaf spot and also in theclassification between powdery mildew and healthy sugar beet leaves.
4.4.3 Classification of healthy leaves and leaves inoculated with fun-gal pathogens at early stages of pathogenesis
For the differentiation between healthy sugar beet leaves and leaves inoculatedwith one of the pathogens before specific disease symptoms became visible,SVI data were used starting 3 dai. First symptoms of Cercospora leaf spot
85
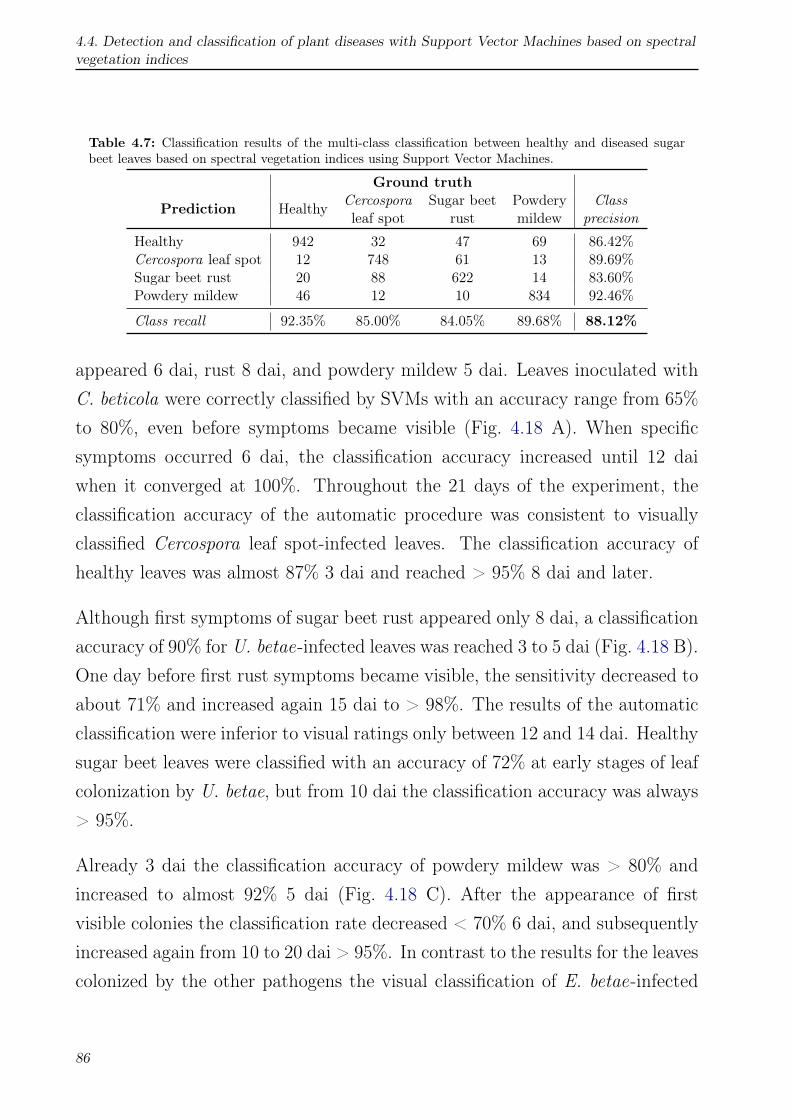
4.4. Detection and classification of plant diseases with Support Vector Machines based on spectralvegetation indices
Table 4.7: Classification results of the multi-class classification between healthy and diseased sugarbeet leaves based on spectral vegetation indices using Support Vector Machines.
Ground truthCercospora Sugar beet Powdery ClassPrediction Healthyleaf spot rust mildew precision
Healthy 942 32 47 69 86.42%Cercospora leaf spot 12 748 61 13 89.69%Sugar beet rust 20 88 622 14 83.60%Powdery mildew 46 12 10 834 92.46%
Class recall 92.35% 85.00% 84.05% 89.68% 88.12%
appeared 6 dai, rust 8 dai, and powdery mildew 5 dai. Leaves inoculated withC. beticola were correctly classified by SVMs with an accuracy range from 65%to 80%, even before symptoms became visible (Fig. 4.18 A). When specificsymptoms occurred 6 dai, the classification accuracy increased until 12 daiwhen it converged at 100%. Throughout the 21 days of the experiment, theclassification accuracy of the automatic procedure was consistent to visuallyclassified Cercospora leaf spot-infected leaves. The classification accuracy ofhealthy leaves was almost 87% 3 dai and reached > 95% 8 dai and later.
Although first symptoms of sugar beet rust appeared only 8 dai, a classificationaccuracy of 90% for U. betae-infected leaves was reached 3 to 5 dai (Fig. 4.18 B).One day before first rust symptoms became visible, the sensitivity decreased toabout 71% and increased again 15 dai to > 98%. The results of the automaticclassification were inferior to visual ratings only between 12 and 14 dai. Healthysugar beet leaves were classified with an accuracy of 72% at early stages of leafcolonization by U. betae, but from 10 dai the classification accuracy was always> 95%.
Already 3 dai the classification accuracy of powdery mildew was > 80% andincreased to almost 92% 5 dai (Fig. 4.18 C). After the appearance of firstvisible colonies the classification rate decreased < 70% 6 dai, and subsequentlyincreased again from 10 to 20 dai > 95%. In contrast to the results for the leavescolonized by the other pathogens the visual classification of E. betae-infected
86

4. RESULTS
leaves was superior (13% to 23%) to the automatic classification procedure from6 to 9 dai. In the beginning of the experiment, the classification rate of healthyleaves was > 91%; in the third week, however, it decreased to 77% 20 dai.
Figure 4.18: Effect of incubation time on the Support Vector Machines classification based on SVIsbetween healthy sugar beet leaves inoculated with Cercospora beticola (A), Uromyces betae (B), andErysiphe betae (C), respectively.
87
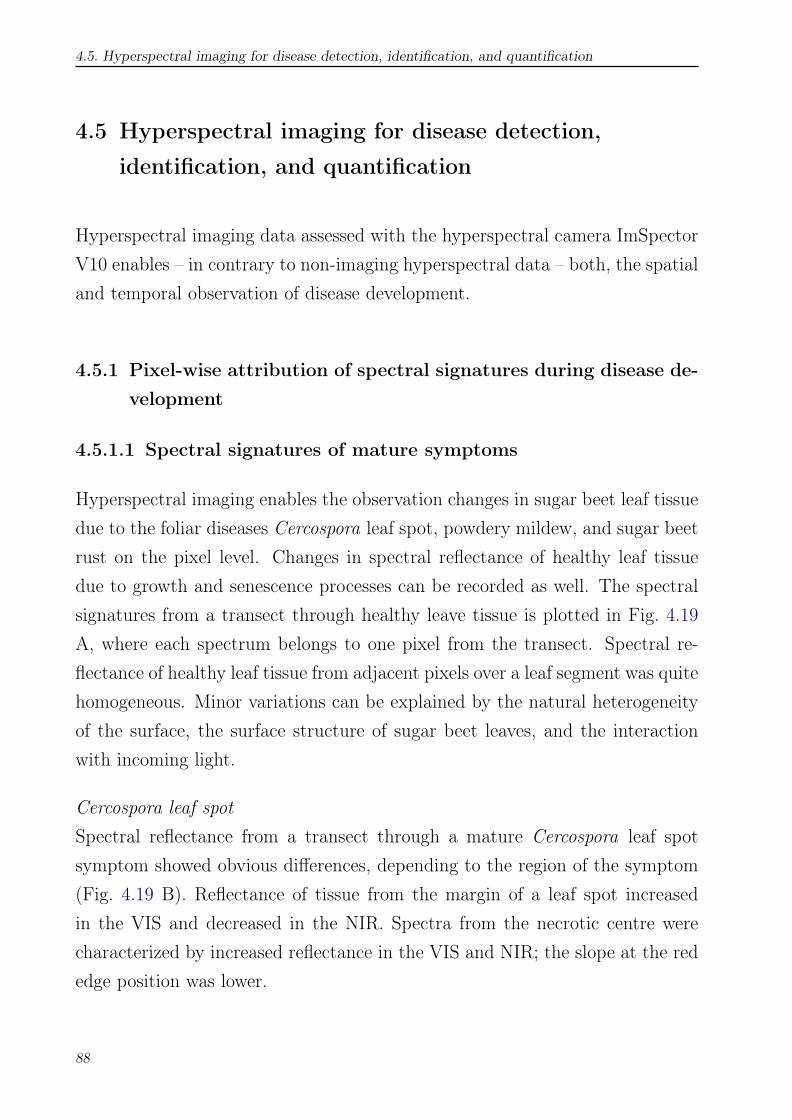
4.5. Hyperspectral imaging for disease detection, identification, and quantification
4.5 Hyperspectral imaging for disease detection,
identification, and quantification
Hyperspectral imaging data assessed with the hyperspectral camera ImSpectorV10 enables – in contrary to non-imaging hyperspectral data – both, the spatialand temporal observation of disease development.
4.5.1 Pixel-wise attribution of spectral signatures during disease de-velopment
4.5.1.1 Spectral signatures of mature symptoms
Hyperspectral imaging enables the observation changes in sugar beet leaf tissuedue to the foliar diseases Cercospora leaf spot, powdery mildew, and sugar beetrust on the pixel level. Changes in spectral reflectance of healthy leaf tissuedue to growth and senescence processes can be recorded as well. The spectralsignatures from a transect through healthy leave tissue is plotted in Fig. 4.19A, where each spectrum belongs to one pixel from the transect. Spectral re-flectance of healthy leaf tissue from adjacent pixels over a leaf segment was quitehomogeneous. Minor variations can be explained by the natural heterogeneityof the surface, the surface structure of sugar beet leaves, and the interactionwith incoming light.
Cercospora leaf spotSpectral reflectance from a transect through a mature Cercospora leaf spotsymptom showed obvious differences, depending to the region of the symptom(Fig. 4.19 B). Reflectance of tissue from the margin of a leaf spot increasedin the VIS and decreased in the NIR. Spectra from the necrotic centre werecharacterized by increased reflectance in the VIS and NIR; the slope at the rededge position was lower.
88

4. RESULTS
Powdery mildewReflectance of leaf tissue diseased with powdery mildew was increasing, depend-ing on the density of the mycelial cover of the leaf surface (Fig. 4.19 C). Spectralreflectance of the margin of a powdery mildew colony was characterized by anobvious increase of reflectance in the VIS and a minor increase in the NIR.With higher mycelia density in the centre of a colony, reflectance increase inthe VIS and NIR became more pronounced.
Sugar beet rustChanges in spectral signatures caused by sugar beet rust were less obvious, infact of the small symptom size and the less destructive interaction with thehost plant (Fig. 4.19 D). The margin from healthy tissue to a rust pustule wascharacterized by a general decrease in reflectance. The centre of rust pustulesrevealed inferior reflectance values around the green peak.
4.5.1.2 Changes in spectral signatures during pathogenesis
In addition to characteristic spectral signatures of distinctive regions of a symp-tom, the developmental stages had an effect on spectral reflectance (Fig. 4.20).Spectral signature of a one day-old Cercospora leaf spot symptom showedmarginal differences to healthy leaf tissue (Fig. 4.20 A). With further symp-tom development, reflectance in the VIS increased most explicit between 580to 700 nm. Reflectance in the NIR declined consistent with advanced age ofsymptoms and the slope at the red edge position became less steep.
For pixels representing powdery mildew, reflectance in the VIS and NIR in-creased with time. Reflectance of a three day-old symptom in the VIS was al-ready 0.05%/100 higher than reflectance of an one day-old symptom (Fig. 4.20B). Reflectance further increased with the maturation of powdery mildewcolonies.
89
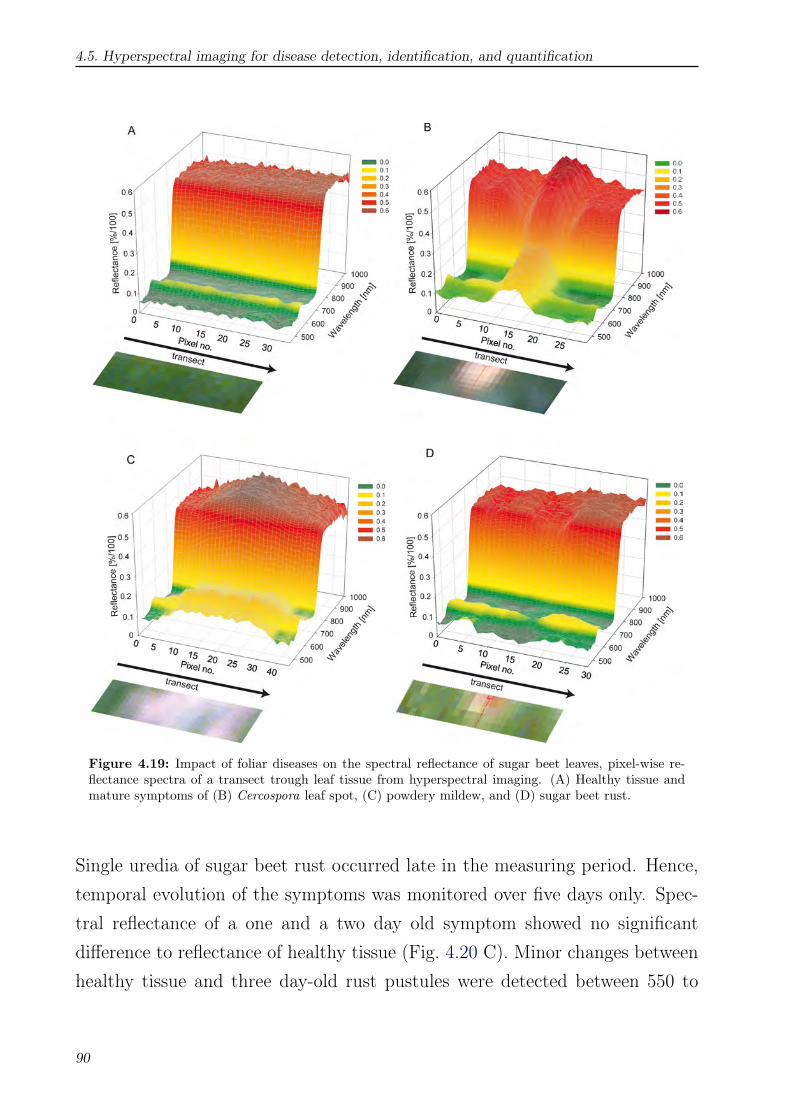
4.5. Hyperspectral imaging for disease detection, identification, and quantification
Figure 4.19: Impact of foliar diseases on the spectral reflectance of sugar beet leaves, pixel-wise re-flectance spectra of a transect trough leaf tissue from hyperspectral imaging. (A) Healthy tissue andmature symptoms of (B) Cercospora leaf spot, (C) powdery mildew, and (D) sugar beet rust.
Single uredia of sugar beet rust occurred late in the measuring period. Hence,temporal evolution of the symptoms was monitored over five days only. Spec-tral reflectance of a one and a two day old symptom showed no significantdifference to reflectance of healthy tissue (Fig. 4.20 C). Minor changes betweenhealthy tissue and three day-old rust pustules were detected between 550 to
90

4. RESULTS
700 nm. Reflectance decrease of little account at 750 nm was observable foralmost mature uredina.
Figure 4.20: Changes in spectral signatures of sugar beet disease during maturation of symptoms,starting from the first appearance of symptoms. Reflectance spectra were obtained from imaging databy pixel-wise extraction from regions of interest. (A) Cercospora leaf spot, (B) powdery mildew, and(C) sugar beet rust.
91

4.5. Hyperspectral imaging for disease detection, identification, and quantification
4.5.2 Spatial illustration of vegetation indices during diseasedevelopment
Spectral vegetation indices, calculated from hyperspectral imaging data,facilitate to highlight diseased leaf tissue and to discriminate among healthyand diseased leaf area on the spatial scale. The correlation of a SVI to a spe-cific disease differs depending on the biochemical and biophysical parametersaffected and described by SVIs.
Cercospora leaf spotFig. 4.21 visualizes eight spectral vegetation indices calculated from hyperspec-tral imaging data of a sugar beet leaf diseased by Cercospora leaf spot. Thevisual disease severity on the RGB image (R: 639 nm, G: 551 nm, B: 458 nm)of the sugar beet leaf was 20% 14 dai (Fig. 4.21 A). NDVI values enabled aclear separation of healthy leaf areas and area with Cercospora leaf spots bybright and dark pixels, respectively (Fig. 4.21 B). Similar results were obtainedfor SR and SIPI, but these SVIs were more sensitive to differences in leaf to-pography and different illumination conditions (Fig. 4.21 C, G). The use ofSumGREEN, mCAI, and REP revealed a lower discriminating potential of theSVIs (Fig. 4.21 D, E, F). Values of REP from diseased leaf tissue appear as dif-fuse spots, not clearly distinguishable from healthy tissue (Fig. 4.21 F). Explicitvisual differentiation of healthy and diseased leaf tissue by these SVIs seems notpossible. As already proven on non-imaging hyperspectral data, the ARI wascorrelated positively to disease severity of Cercospora leaf spot. Hence, brightpixels in the false-colour image denote symptoms of Cercospora leaf spot anddarker pixels denote healthy leaf tissue (Fig. 4.21 H). False-colour image of WIvalues highlighted a distinctive detection of the Cercospora leaf spot symptoms(Fig. 4.21 I). The WI was largely insensitive to differences in leaf topographyand illumination conditions. The leaf was displayed as a homogenous, greycoloured plane with disease symptoms highlighted in black. Another advantage
92

4. RESULTS
of this index was the clear separation of healthy and diseased leaf tissue fromleaf veins, which were coloured in white.
Powdery mildewThe same spectral vegetation indices calculated from hyperspectral imag-ing data revealed differences in their suitability to detect powdery mildew(Fig. 4.22). Fig. 4.22 A is a RGB image of a sugar beet leaf, with powderymildew at 30% disease severity. Powdery mildew mycelium covered the middlepart of the leaf and tissue around the leaf veins. A distinctive separation ofhealthy and diseased leaf parts was feasible calculating the NDVI (Fig. 4.22 B),SR (Fig. 4.22 C), and SIPI (Fig. 4.22 G). The SumGREEN index accentuatedhealthy, green parts by low values, displayed by dark pixels in the SVI false-colour image (Fig. 4.22 D). This SVI was therefore highly suitable to detectpowdery mildew diseased areas of sugar beet leaves. The mCAI, REP, ARI,and WI were not convenient for the detection of powdery mildew (Fig. 4.22 E,F, H, I).
Sugar beet rustThe detection of sugar beet rust by the use of SVIs calculated from hyper-spectral imaging data was most demanding. Due to the small symptom size,and thus the high amount of mixed pixel in hyperspectral data, only few SVIshighlighted symptoms caused by U. betae (Fig. 4.23). A magnified sub-squareof a sugar beet rust diseased leaf and the use of different SVIs is illustrated inFig. 4.23. The small, 0.5 to 1 mm sized rust pustule in the upper middle ofthe leaf segment was only detectable by the MCARI, PSRI, and ARI. However,a separation from heterogenic leaf tissue like leaf veins or leaf concavity wasdifficult.
93

4.5. Hyperspectral imaging for disease detection, identification, and quantification
Figure 4.21: Use of spectral vegetation indices calculated from hyperspectral imaging data of a sugarbeet leaf with Cercospora leaf spot, for the separation of healthy and diseased plant tissue 17 dai. (A)RGB image, (B) NDVI, (C) SR, (D) sumGREEN, (E) mCAI, (F) REP, (G) SIPI, (H) ARI, (I) WI.Spectral vegetation indices were visualized by a grey-scale false-colour image, black pixel denote lowerSVI-values and white pixel higher SVI-values.
94

4. RESULTS
Figure 4.22: Use of spectral vegetation indices calculated from hyperspectral imaging data of a sugarbeet leaf with powdery mildew. Separation of healthy and diseased plant tissue 14 dai. (A) RGBimage, (B) NDVI, (C) SR, (D) sumGREEN, (E) mCAI, (F) REP, (G) SIPI, (H) ARI, (I) WI. Spectralvegetation indices are visualized by a grey-scale false-colour image, black pixel denote lower SVI-valuesand white pixel higher SVI-values.
95

4.5. Hyperspectral imaging for disease detection, identification, and quantification
Figure 4.23: Use of spectral vegetation indices calculated from hyperspectral imaging data of a sugarbeet leaf segment with sugar beet rust. Separation of healthy and diseased plant tissue 17 dai. (RGBimage, SVIs calculated: NDVI, REP, sumGREEN, mCAI, MCARI, PSRI, ARI. SVIs are visualized bya grey-scale false-colour image, black pixel denote lower SVI-values and white pixel higher SVI-values).
4.5.2.1 Binary classification of healthy and diseased leaf tissue byspectral vegetation indices
Based on SVIs from hyperspectral imaging data, a binary classification modelfor each sugar beet disease was developed in coorporation with Thorsten Mewes,Centre for Remote Sensing and Land Surfaces, University of Bonn. Twenty-eight SVIs were calculated from hyperspectral imaging data. Values of SVIswere visualized in false-colour images (Fig. 4.24; Fig. 4.25). In a next stepdisease responsive SVIs were determined manually and threshold-values of SVIswere defined for each disease and each spectral vegetation index, respectively(Tab. 4.8). SVIs values greater or lower than threshold-values were displayedin a binary disease image with black (non-diseased) and white (diseased) pixels(Fig. 4.24; Fig. 4.25).
96

4.RESU
LTS
Figure 4.24: Differentiation of healthy and diseased sugar beet leaf tissue by calculating spectral vegetation indices and creating binary images,0, 8, 11, 14, 17, and 20 days after inoculation. Pixels representing Cercospora leaf spot were assessed using the NDVI with a threshold of < 0.6.For the binary images, white pixel denote diseased leaf tissue, black pixel denote healthy leaf tissue.
97

4.5.Hyperspectralim
agingfor
diseasedetection,identification,and
quantification
Figure 4.25: Differentiation of healthy and diseased sugar beet leaf tissue by calculating spectral vegetation indices and creating binary images,0, 8, 11, 14, 17, and 20 days after inoculation. Pixels representing powdery mildew were assessed using the PSSRb with a threshold of < 5. Forthe binary images, white pixel denote diseased leaf tissue, black pixel denote healthy leaf tissue.
98

4. RESULTS
Table 4.8: Threshold values to distinguish healthy and diseased tissue of sugar beet leaf to createbinary images of diseased leaf tissue and coefficient of determination of visually assessed disease severityand automatically classified disease severities by different vegetation indices.
Disease2
Index Threshold1 CLS PM SBR
SumGreen > 0.2 0.44 0.57 0.01NDVI < 0.6 0.98 0.69 0.06SR < 2 0.96 0.36 0.31SIPI < 0.6 0.37 0.68 0.19PSSRa < 0.5 0.89 0.87 0.14PSSRb < 0.5 0.77 0.93 0.07PSSRc < 0.5 0.46 0.86 0.11PSNDa < 0.6 0.98 0.68 0.06PSNDb < 0.55 0.97 0.64 0.06PSNDc < 0.55 0.75 0.50 0.17ARI < 0.1 0.95 0.45 0.671 pixels with spectral vegetation indices values greater/or lowerthan threshold values were classified as diseased
2 correlation was calculated as Pearsons coefficient of correlation(r), asterisk marks denote significant correlation with ** p =0.01, and * p = 0.05, n=50; bold numbers indicate high corre-lation
Conformance of visible symptoms in the RGB image with parts of the leavesclassified as Cercospora leaf spot or powdery mildew diseased was obvious(Fig. 4.24; Fig. 4.25). Because of low correlation, images for sugar beet rust arenot shown.
Quantification of diseased and healthy leaf area from binary disease images waspossible in a next step. High coefficients of determination could be obtainedfor the relationship between SVIs-based automatically classified disease severityand visually assessed disease severity (Fig. 4.26). For Cercospora leaf spot de-tection, the NDVI
(R2 = 0.98
), PSNDa/b
(R2 = 0.98
), and SR
(R2 = 0.96
)showed best correlation (Tab. 4.8). The PSSRa, b, and c fitted best for pow-dery mildew
(R2 = 0.87, R2 = 0.93, R2 = 0.86, respectively
). The quantifica-
tion of sugar beet rust by the ARI gave lower correlation to visual assessment(R2 = 0.67
). All other SVIs were not significantly correlated to the results of
automatic disease severity classification of sugar beet rust.
99

4.5. Hyperspectral imaging for disease detection, identification, and quantification
Figure 4.26: Correlation between spectral vegetation index based versus visually disease assessment.
4.5.3 Spectral angle mapper classification for the assessment of fo-liar leaf diseases from hyperspectral images and its ability todistinguish multiple disease symptoms
Based on hyperspectral imaging data the SAM was used to distinguish healthyand diseased sugar beet tissue and to detect disease specific symptoms of dif-ferent peculiarities. Characteristic endmember spectra from healthy tissue anddisease symptoms were extracted from hyperspectral imaging data and storedin a spectral library. Each endmember represents a to distinguish class. Back-ground, grid wire, and leaf veins were masked out and coloured in black.
Cercospora leaf spotFor Cercospora leaf spot classification, the three classes ’healthy’ sugar beettissue, ’margin’ of Cercospora leaf spots, and their necrotic ’centre’ were chosen.The SAM classification resulted in false-colour class images (Fig. 4.27), wheregreen colour denote ’healthy’ leaf tissue, red pixels belong to the class ’margin’,and yellow pixels denote ’necrotic’ centre of Cercospora leaf spots. The firstrow of Fig. 4.27 shows RGB images of the classified hyperspectral data cube.No visible symptoms of Cercospora leaf spot occurred 0 dai and 8 dai. Theresult of the SAM, shown in the second row, was similar; the whole leaf areawas classified as healthy leaf tissue. Eleven days after inoculation first sporadic
100

4. RESULTS
symptoms became visible as sunken necrotic leaf tissue. Early symptoms ofCercospora leaf spot were classified as margin of Cercospora leaf spot with highreliability. However, non-diseased leaf tissue next to the grid wire and leafveins was inaccurately classified as margin of Cercospora leaf spot. Symptomsof different development stages were found on the RGB images 14 dai. Fullydeveloped Cercospora leaf spots next to emerging spots were assessed. False-colour SAM classification gave similar images to the ground truth RGB image.Healthy leaf tissue appeared as green pixels, the margin was correctly classifiedin red, and scattered necrotic centres were displayed as yellow pixels. Minormisclassified pixels around the grid wire and leaf border were visual. Healthyand diseased leaf tissue was reliably detected by the SAM classifier also 17 dai,when larger, coalescing necrotic areas due to Cercospora leaf spot appeared.
Classification results of the SAM algorithm were validated using a confusionmatrix (Tab. 4.9). On the first day of the measuring period, 99.89% of thetotal leaf area was classified as healthy leaf tissue (overall accuracy of 99.88%).Only 0.11% of the healthy leaf tissue remained unclassified. The very highkappa coefficient of 0.99 underlines the agreement between ground truth dataand classification result. Similar results were obtained 8 dai. Only 1.1% ofthe healthy leaf tissue was unclassified with an overall classification accuracyof 98.9% and a kappa coefficient of 0.99. Classification accuracy decreasedto 89.58% with a kappa coefficient of 0.52, 11dai; 11.2% of healthy area wasclassified as margin of a Cercospora leaf spot, whereas 9% of the margin wasunclassified or classified as healthy tissue. With higher disease severity andmature symptoms, classification accuracy increased to 96.58% and a kappacoefficient of 0.92, 14 dai. Differentiation between healthy leaf tissue and themargin of Cercospora leaf spots and between the margin of a Cercospora leafspot and the necrotic centre was demanding. At this time of disease progressthe diseased leaf area was classified as 7.61%. Seventeen days after inoculationthe SAM classification resulted in 20.95% leaf area diseased by Cercospora leafspot (overall accuracy = 99.73, kappa coefficient = 0.98).
101

4.5.Hyperspectralim
agingfor
diseasedetection,identification,and
quantification
Figure 4.27: Automatic classification of Cercospora leaf spot using spectral angle mapper (SAM) algorithm. The three classes ’healthy’ (green),’margin’ of Cercospora leaf spots (red), and ’necrotic centre’ of Cercospora leaf spot (yellow) were separated at different disease severity stageswith a maximum angle threshold of 0.1◦.
102

4. RESULTS
Table 4.9: Classification accuracy of spectral angle mapper classification of Cercospora leaf spot diseasedleaves during disease progress.
Days after inoculation 0
Ground truth
Class Healthy Margin Centre Total
unclassified 0.11 0 0 0.11Healthy 99.89 0 0 99.89Margin 0 0 0 0Centre 0 0 0 0
Overall = 99.88, Kappa = 0.99
Days after inoculation 8
Ground truth
Class Healthy Margin Centre Total
unclassified 1.1 0 0 1.1Healthy 98.9 0 0 98.9Margin 0 0 0 0Centre 0 0 0 0
Overall = 98.90, Kappa = 0.99
Days after inoculation 11
Ground truth
Class Healthy Margin Centre Total
unclassified 0 6.67 0 0.53Healthy 88.82 2.22 0 92.91Margin 11.18 91.11 0 6.56Centre 0 0 0 0
Overall = 89.01, Kappa = 0.53
Days after inoculation 14
Ground truth
Class Healthy Margin Centre Total
unclassified 0 0 0.1 0Healthy 100 4.78 0 92.39Margin 0 93.53 16.07 6.18Centre 0 1.79 83.82 1.43
Overall = 96.58, Kappa = 0.92
Days after inoculation 17
Ground truth
Class Healthy Margin Centre Total
unclassified 0 0 0 0Healthy 87.5 1.08 0 79.05Margin 12.5 98.92 0 15.01Centre 0 0 100 5.94
Overall = 98.73, Kappa = 0.98
103
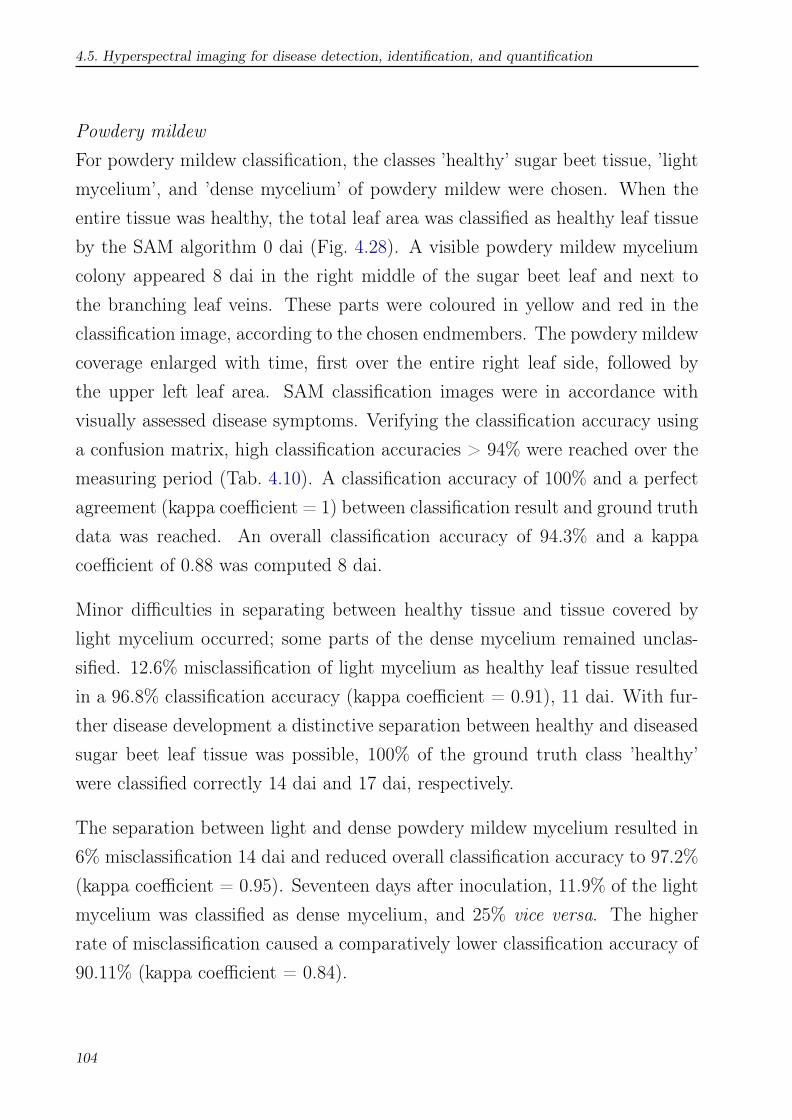
4.5. Hyperspectral imaging for disease detection, identification, and quantification
Powdery mildewFor powdery mildew classification, the classes ’healthy’ sugar beet tissue, ’lightmycelium’, and ’dense mycelium’ of powdery mildew were chosen. When theentire tissue was healthy, the total leaf area was classified as healthy leaf tissueby the SAM algorithm 0 dai (Fig. 4.28). A visible powdery mildew myceliumcolony appeared 8 dai in the right middle of the sugar beet leaf and next tothe branching leaf veins. These parts were coloured in yellow and red in theclassification image, according to the chosen endmembers. The powdery mildewcoverage enlarged with time, first over the entire right leaf side, followed bythe upper left leaf area. SAM classification images were in accordance withvisually assessed disease symptoms. Verifying the classification accuracy usinga confusion matrix, high classification accuracies > 94% were reached over themeasuring period (Tab. 4.10). A classification accuracy of 100% and a perfectagreement (kappa coefficient = 1) between classification result and ground truthdata was reached. An overall classification accuracy of 94.3% and a kappacoefficient of 0.88 was computed 8 dai.
Minor difficulties in separating between healthy tissue and tissue covered bylight mycelium occurred; some parts of the dense mycelium remained unclas-sified. 12.6% misclassification of light mycelium as healthy leaf tissue resultedin a 96.8% classification accuracy (kappa coefficient = 0.91), 11 dai. With fur-ther disease development a distinctive separation between healthy and diseasedsugar beet leaf tissue was possible, 100% of the ground truth class ’healthy’were classified correctly 14 dai and 17 dai, respectively.
The separation between light and dense powdery mildew mycelium resulted in6% misclassification 14 dai and reduced overall classification accuracy to 97.2%(kappa coefficient = 0.95). Seventeen days after inoculation, 11.9% of the lightmycelium was classified as dense mycelium, and 25% vice versa. The higherrate of misclassification caused a comparatively lower classification accuracy of90.11% (kappa coefficient = 0.84).
104
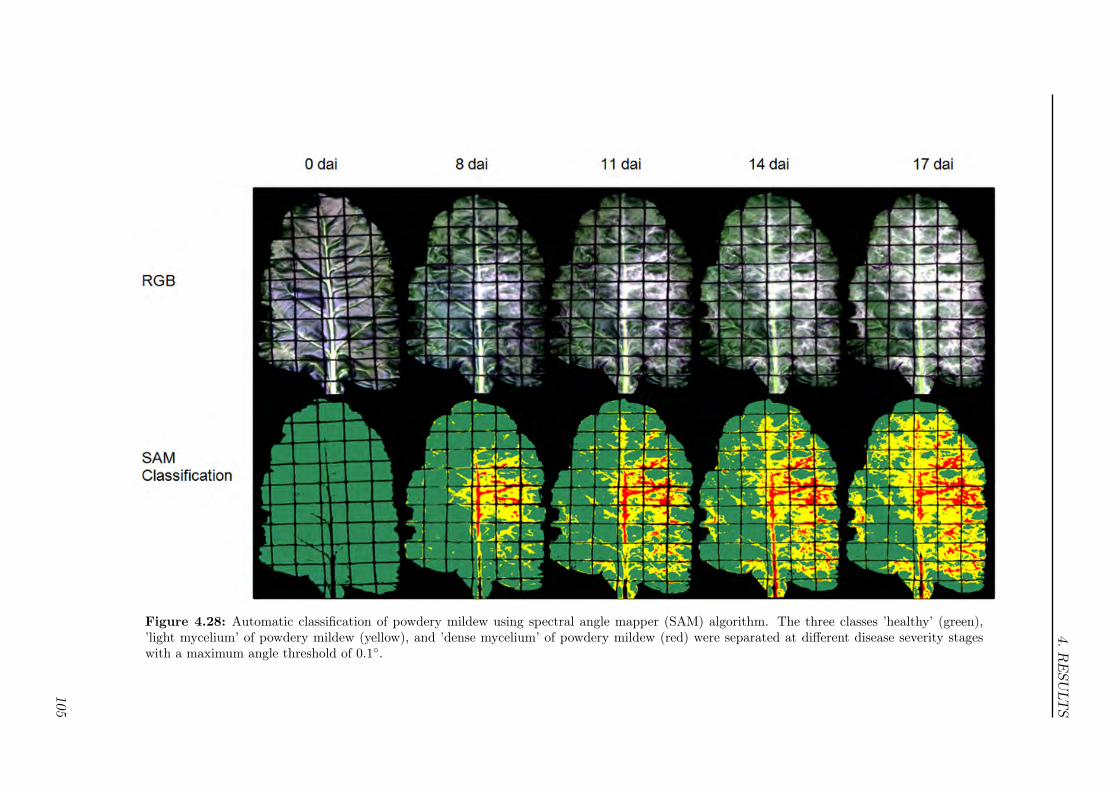
4.RESU
LTS
Figure 4.28: Automatic classification of powdery mildew using spectral angle mapper (SAM) algorithm. The three classes ’healthy’ (green),’light mycelium’ of powdery mildew (yellow), and ’dense mycelium’ of powdery mildew (red) were separated at different disease severity stageswith a maximum angle threshold of 0.1◦.
105

4.5. Hyperspectral imaging for disease detection, identification, and quantification
Table 4.10: Classification accuracy of spectral angle mapper classification of powdery mildew diseasedleaves during disease progress.
Days after inoculation 0
Ground truth
Class Healthy Light mycelium Dense mycelium Total
unclassified 0 0 0 0Healthy 100 0 0 100Light mycelium 0 0 0 0Dense mycelium 0 0 0 0
Overall = 100, Kappa = 1
Days after inoculation 8
Ground truth
Class Healthy Light mycelium Dense mycelium Total
unclassified 0 0 3.49 0.41Healthy 94.04 4.44 0 85.16Light mycelium 5.96 94.07 0 9.69Dense mycelium 0 1.48 96.51 4.74
Overall = 94.34, Kappa = 0.88
Days after inoculation 11
Ground truth
Class Healthy Light mycelium Dense mycelium Total
unclassified 0 0 0 0Healthy 99.92 12.62 0 80.63Light mycelium 0.08 77.1 0 10.65Dense mycelium 0 10.28 100 8.72
Overall = 96.79, Kappa = 0.91
Days after inoculation 14
Ground truth
Class Healthy Light mycelium Dense mycelium Total
unclassified 0 0 0 0Healthy 100 0 0 58.06Light mycelium 0 93.63 6.82 20.38Dense mycelium 0 6.37 93.18 21.56
Overall = 97.23, Kappa = 0.95
Days after inoculation 17
Ground truth
Class Healthy Light mycelium Dense mycelium Total
unclassified 0 0 0.29 0.09Healthy 100 0 0 49.87Light mycelium 0 88.07 25 25.71Dense mycelium 0 11.93 74.71 24.33
Overall = 90.18, Kappa = 0.84
106

4. RESULTS
Sugar beet rustThe small size of U. betae uredia and the low disease severity complicated clas-sification of sugar beet rust by the SAM algorithm. Additionally, the spatialresolution of the camera system limited the detection of rust pustules and re-sulted in high amount of mixed pixels. First rust pustules became visible 20days after inoculation. Before this day, no classification of sugar beet rust in-oculated sugar beet leaves was possible. Fig. 4.29 illustrates the difficulties ofclassifying sugar beet rust pustules based on hyperspectral data.
Figure 4.29: Automatic classification of sugar beet rust using spectral angle mapper algorithm on leafscale and zoom into one sub-square. Mature symptoms (red) were separated from healthy leaf tissue(green), 20 days after inoculation. Black pixel denote unclassified pixel.
107
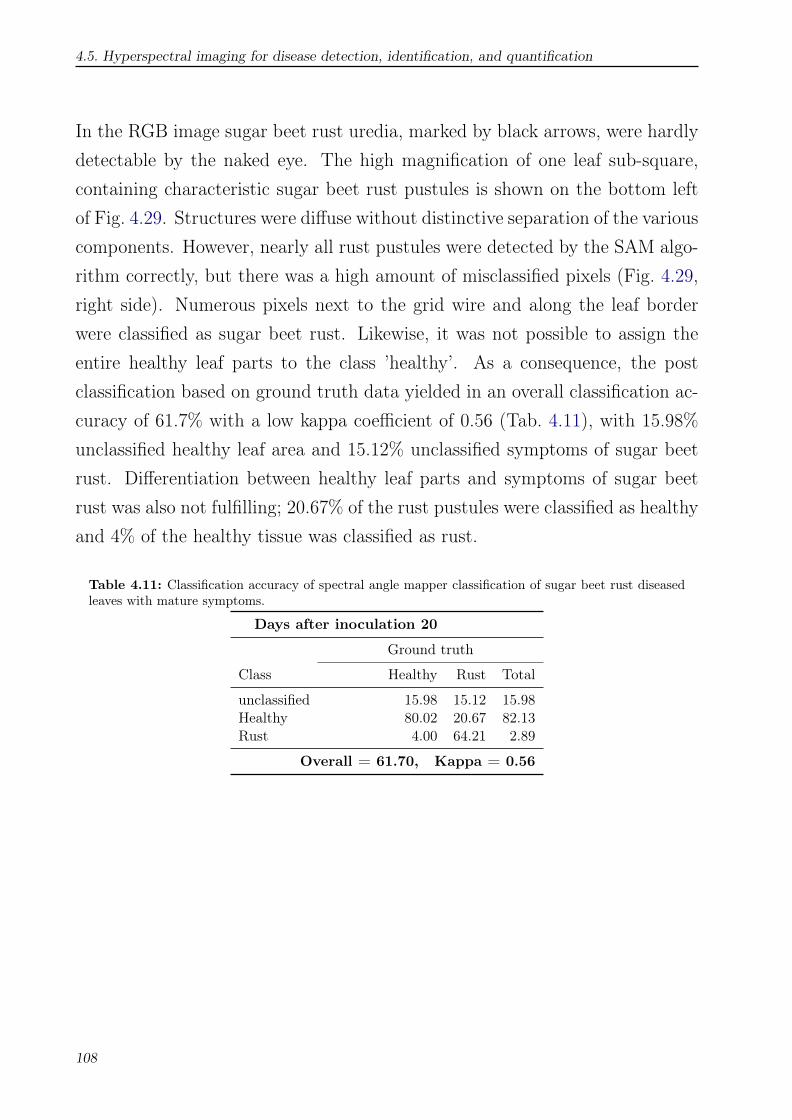
4.5. Hyperspectral imaging for disease detection, identification, and quantification
In the RGB image sugar beet rust uredia, marked by black arrows, were hardlydetectable by the naked eye. The high magnification of one leaf sub-square,containing characteristic sugar beet rust pustules is shown on the bottom leftof Fig. 4.29. Structures were diffuse without distinctive separation of the variouscomponents. However, nearly all rust pustules were detected by the SAM algo-rithm correctly, but there was a high amount of misclassified pixels (Fig. 4.29,right side). Numerous pixels next to the grid wire and along the leaf borderwere classified as sugar beet rust. Likewise, it was not possible to assign theentire healthy leaf parts to the class ’healthy’. As a consequence, the postclassification based on ground truth data yielded in an overall classification ac-curacy of 61.7% with a low kappa coefficient of 0.56 (Tab. 4.11), with 15.98%unclassified healthy leaf area and 15.12% unclassified symptoms of sugar beetrust. Differentiation between healthy leaf parts and symptoms of sugar beetrust was also not fulfilling; 20.67% of the rust pustules were classified as healthyand 4% of the healthy tissue was classified as rust.
Table 4.11: Classification accuracy of spectral angle mapper classification of sugar beet rust diseasedleaves with mature symptoms.
Days after inoculation 20
Ground truth
Class Healthy Rust Total
unclassified 15.98 15.12 15.98Healthy 80.02 20.67 82.13Rust 4.00 64.21 2.89
Overall = 61.70, Kappa = 0.56
108

4. RESULTS
4.6 Monitoring of plant diseases on the field scale using
remote sensing technologies
The temporal and spatial disease development on the field scale was observed bydifferent hyperspectral airborne and handheld sensors at different times duringvegetation period, at the experimental station Klein-Altendorf 2008.
4.6.1 Spatial soil heterogeneity
The EM 38 measurements of the area showed only marginal variability of theapparent electrical conductivity (ECa, Fig. 4.30). With ECa values from 23.5to 46.5 mS m−1 the soil texture was quite heterogeneous, indicating loamy siltat high field moisture capacity. However, most parts of the field had ECa valuesfrom 23.5 to 30.2 mS m−1, indicating a rather homogeneous soil texture.
Figure 4.30: Variability of the apparent electrical conductivity (ECa) at the field site Klein-Altendorf,measured with EM38 soil sensor on 15th of April 2008.
109

4.6. Monitoring of plant diseases on the field scale using remote sensing technologies
4.6.2 Progress of Cercospora leaf spot and powdery mildew
At the field site Klein-Altendorf 2008, powdery mildew was the dominant fo-liar sugar beet disease (Fig. 4.31 B). In July sugar beet plants were healthythroughout the field, diseased sugar beet plants could not be monitored in thetwo plots. In early August, average disease severity of Cercospora leaf spot andpowdery mildew in the untreated plot were 0.3% and 5% diseased leaf area, re-spectively (Fig. 4.31 A, B). Only a few clusters of Cercospora leaf spot diseasedplants were detected in the untreated plot (Fig. 4.32 A). Two Cercospora leafspot patches with disease severity up to 7% were identified. Around these dis-ease centres, single plants infested with Cercospora leaf spot were monitored.Fungicide-treated sugar beet plants remained almost healthy, solitary plantswith single Cercospora leaf spot spots were detected in the southern part of thefungicide-sprayed plot. Plants with higher intensity of powdery mildew wereaggregated in the western part of the untreated plot (Fig. 4.32 C).
From this part of the field declining powdery mildew severity declined towardsthe fungicide-treated plot. In September, increasing disease severity of bothdiseases was visually assessed in both plots (Fig. 4.31 A, B). Cercospora leafspot appeared in patches with 12% disease severity in the untreated plot and2% diseased leaf area in the fungicide treated plot, respectively. In general,only few plants with Cercospora leaf spot ratings up to 35% diseased leaf areacould be monitored in the northern part of the non-treated plot (Fig. 4.32 B).
Sugar beet plants with high Cercospora leaf spot infection exhibited lower pow-dery mildew infection and vice versa (Fig. 4.32 B, D). Mean disease severityof powdery mildew increased to 67% over the area in the untreated plot, anduniformly to 22% diseased leaf area in the fungicide-treated plot (Fig. 4.31 B).In the untreated plot, higher powdery mildew disease severities were monitoredin the western and southern part (Fig. 4.32 D).
110

4. RESULTS
Figure 4.31: Disease progress of Cercospora leaf spot (A) and powdery mildew (B) on sugar beet,Klein-Altendorf 2008.
Figure 4.32: Spatial distribution of disease severity of Cercospora leaf spot (A, B) and powdery mildewon 6th of August (A,C) and 9th of September (B,D), Klein-Altendorf 2008.
111
4.6. Monitoring of plant diseases on the field scale using remote sensing technologies
4.6.3 Impact of plant diseases on sugar beet biomass
Significant differences in plant biomass, assessed as leaf dry matter were de-tected in the growth period (Fig. 4.33). In early July mean leaf biomass of20 sugar beets, from 5 sampling points in the plots, did not vary significantly.Overall biomass of sugar beet leaves increased from July to August. In August,dry matter of fungicide-treated sugar beet leaves was higher than that fromnon-treated plants, although without statistically significances. Leaf biomassin September was lower than in August, with a significantly lower dry matter ofuntreated sugar beets compared to sugar beet leaves from the fungicide-treatedplot.
Figure 4.33: Impact of fungicide treatment on plant biomass from sugar beet canopy, sampled atdifferent measuring dates during growth period of sugar beet, Klein-Altendorf 2008 (bars denote standardderivation, dry matter values within one sampling date with different letters are significantly differentaccording to Students t-test, p = 0.5).
112

4. RESULTS
4.6.4 Multi-temporal and multi-sensoral monitoring of diseases
The NDVI is the most common vegetation index in remote sensing and givesinformation on crop biomass and plant vitality. Therefore, NDVI values werecalculated pixel-wise for the classification of the ROSIS and HyMap images(Fig. 4.34). In July, NDVI values were distributed homogeneously over theexperimental field; no significant differences could be detected at this earlystage of the growth period (Fig. 4.34 A). By this time no fungicide treatmenthad been applied and no fungal infection of sugar beet plants could be assessedvisually.
In early August, however, NDVI values showed a general spatial trend. NDVIvalues in the untreated plot were obviously lower than in the fungicide-treatedplot. Because the NDVI is negatively correlated to disease severity, this sensorbased information coincided with early infection patterns in the field (Fig. 4.31B; Fig. 4.35). A cluster of lower NDVI values appeared in the south westernpart of the field (Fig. 4.34 B). A coefficient of determination of R2 = 0.69was calculated for the NDVI with incidence of powdery mildew symptoms andpowdery mildew disease severity. NDVI values of the sprayed plot were around0.9, while NDVI values of the untreated plot declined to 0.88. Due to lowCercospora leaf spot disease severity, Cercospora leaf spot and NDVI were notcorrelated.
From non-imaging hyperspectral data, measured with the ASD FieldSpec inSeptember, various spectral vegetation indices were calculated. All SVIs weresignificantly correlated to disease severity of Cercospora leaf spot and powderymildew, respectively (Tab. 4.12). The NDVI showed a strong negative correla-tion to powdery mildew severity (r = -0.71). Due to the overall low incidence,the correlation to Cercospora leaf spot was lower (r= -0.48). The mCAI, relatedto leaf chlorophyll content, was highly correlated to the disease severity of pow-dery mildew (r = -0.72) and also showed a correlation to Cercospora leaf spot(r = -0.60). In this field study, the ARI, an indicator of pigment modifications,
113

4.6. Monitoring of plant diseases on the field scale using remote sensing technologies
Figure 4.34: Classified NDVI images calculated from airborne hyperspectral ROSIS data from 1th July,and HyMap image from 6th August, Klein-Altendorf 2008.
Figure 4.35: Relationship between disease severity of powdery mildew and NDVI calculated fromHyMap scene on 6th August, Klein-Altendorf 2008.
114
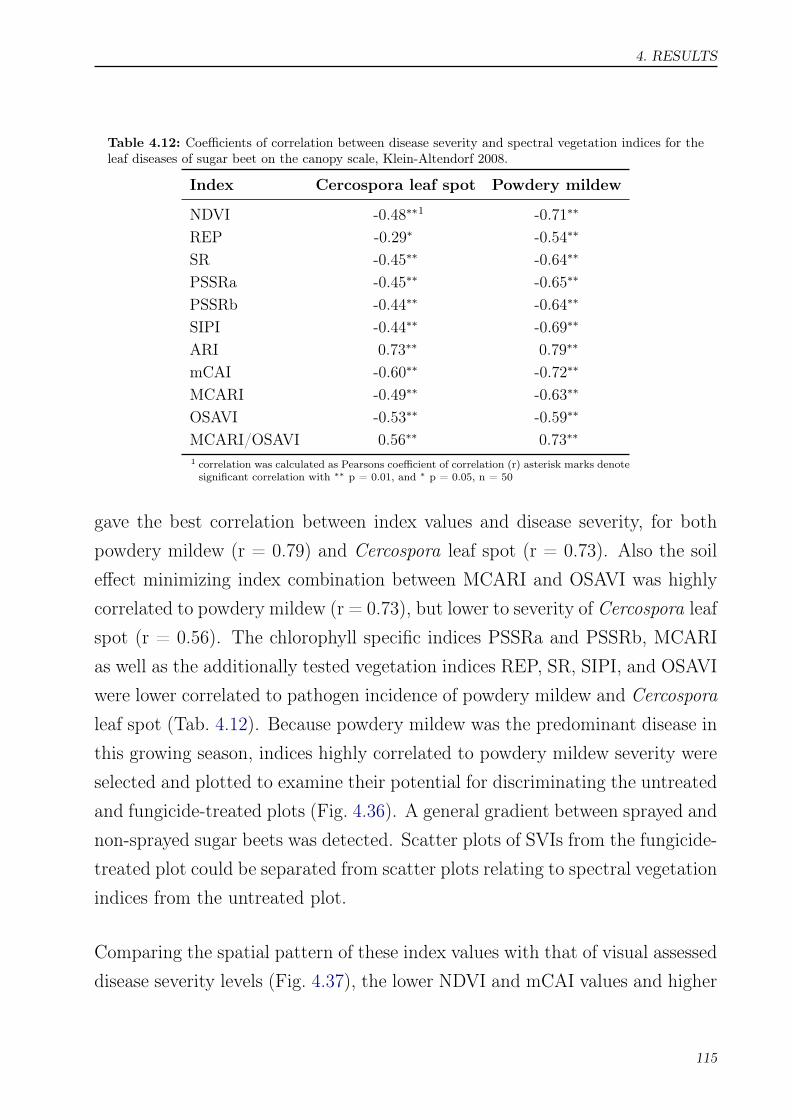
4. RESULTS
Table 4.12: Coefficients of correlation between disease severity and spectral vegetation indices for theleaf diseases of sugar beet on the canopy scale, Klein-Altendorf 2008.
Index Cercospora leaf spot Powdery mildew
NDVI -0.48∗∗1 -0.71∗∗
REP -0.29∗ -0.54∗∗
SR -0.45∗∗ -0.64∗∗
PSSRa -0.45∗∗ -0.65∗∗
PSSRb -0.44∗∗ -0.64∗∗
SIPI -0.44∗∗ -0.69∗∗
ARI 0.73∗∗ 0.79∗∗
mCAI -0.60∗∗ -0.72∗∗
MCARI -0.49∗∗ -0.63∗∗
OSAVI -0.53∗∗ -0.59∗∗
MCARI/OSAVI 0.56∗∗ 0.73∗∗1 correlation was calculated as Pearsons coefficient of correlation (r) asterisk marks denotesignificant correlation with ∗∗ p = 0.01, and ∗ p = 0.05, n = 50
gave the best correlation between index values and disease severity, for bothpowdery mildew (r = 0.79) and Cercospora leaf spot (r = 0.73). Also the soileffect minimizing index combination between MCARI and OSAVI was highlycorrelated to powdery mildew (r = 0.73), but lower to severity of Cercospora leafspot (r = 0.56). The chlorophyll specific indices PSSRa and PSSRb, MCARIas well as the additionally tested vegetation indices REP, SR, SIPI, and OSAVIwere lower correlated to pathogen incidence of powdery mildew and Cercosporaleaf spot (Tab. 4.12). Because powdery mildew was the predominant disease inthis growing season, indices highly correlated to powdery mildew severity wereselected and plotted to examine their potential for discriminating the untreatedand fungicide-treated plots (Fig. 4.36). A general gradient between sprayed andnon-sprayed sugar beets was detected. Scatter plots of SVIs from the fungicide-treated plot could be separated from scatter plots relating to spectral vegetationindices from the untreated plot.
Comparing the spatial pattern of these index values with that of visual assesseddisease severity levels (Fig. 4.37), the lower NDVI and mCAI values and higher
115
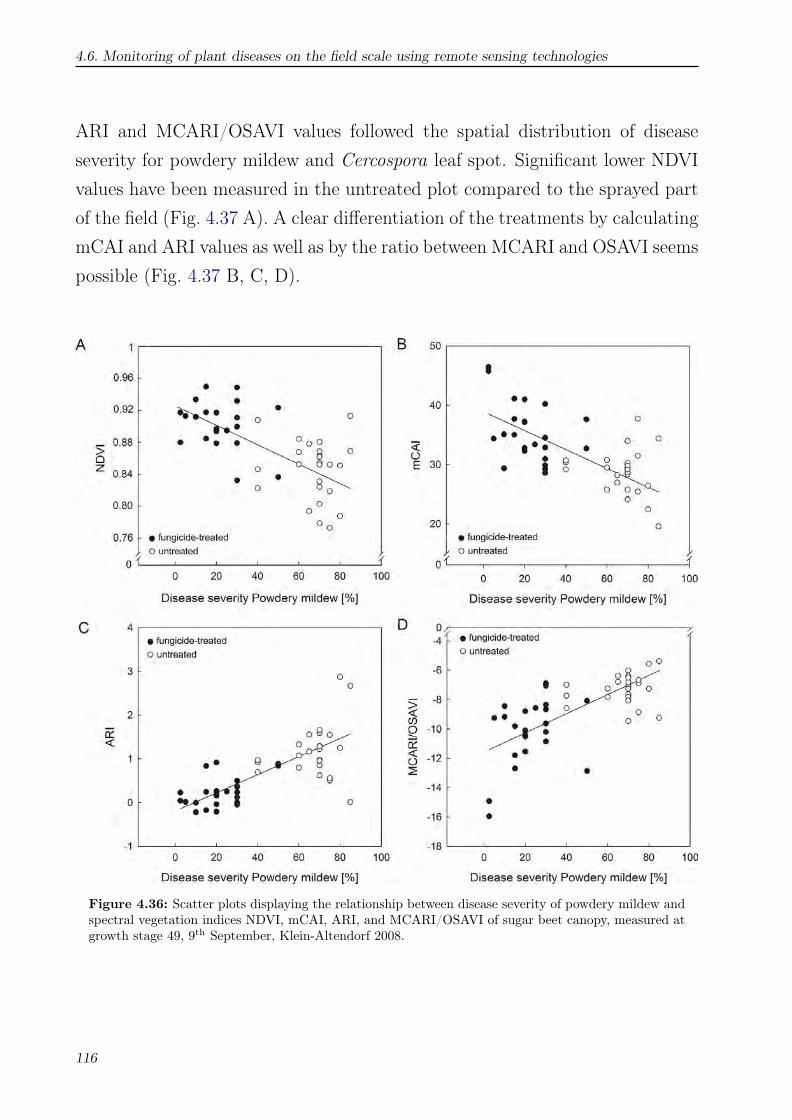
4.6. Monitoring of plant diseases on the field scale using remote sensing technologies
ARI and MCARI/OSAVI values followed the spatial distribution of diseaseseverity for powdery mildew and Cercospora leaf spot. Significant lower NDVIvalues have been measured in the untreated plot compared to the sprayed partof the field (Fig. 4.37 A). A clear differentiation of the treatments by calculatingmCAI and ARI values as well as by the ratio between MCARI and OSAVI seemspossible (Fig. 4.37 B, C, D).
Figure 4.36: Scatter plots displaying the relationship between disease severity of powdery mildew andspectral vegetation indices NDVI, mCAI, ARI, and MCARI/OSAVI of sugar beet canopy, measured atgrowth stage 49, 9th September, Klein-Altendorf 2008.
116

4. RESULTS
Figure 4.37: Classified maps of spectral vegetation indices of sugar beet canopy reflectance, measuredby ASD-FieldSpec at growth stage 49, 9th September, Klein-Altendorf 2008 (n = 50).
117


5. DISCUSSION
The main emphasis of this work was to investigate the potential of hyperspectralsensors for applications in plant pathology and precision crop protection. Reli-able detection and identification of plant diseases and precise and reproduciblequantification of disease severity are important for predicting yield loss, moni-toring and forecasting of epidemics, phenotyping for disease resistance breeding,and for the understanding of fundamental biological processes during diseaseprogress. In this work high attention has given to the three key points, whetherthe detection, identification, and quantification of fungal diseases can be imple-mented by hyperspectral sensors. Knowledge of how solar radiation interactswith vegetation is necessary to interpret and process reflectance data (Kni-pling, 1970). The interactions between the host plant sugar beet and the fungalpathogens Cercospora beticola, Erysiphe betae, and Uromyces betae influencethe reflectance of solar radiation of the plant during disease development indifferent ways. Resulting spectral signatures, unique for the diseases may beuseful for detection and identification of the plant diseases. The quality andquantity of information of spectral signals depend on several factors like thesensor system (spectroradiometer, hyperspectral camera, or airborne sensor),the measuring scale (leaf, plant, canopy, or field), and on data analysis andinterpretation. Limitations and difficulties in the detection of foliar diseasesdue to different scales and measuring conditions – controlled conditions in alaboratory, under greenhouse conditions, and in the field – should be revealed.
119

Effect of diseases on reflectanceThe investigations were based on the hypothesis that reflectance of diseasedplants differs from that of healthy leaf tissue. An optical differentiation ofhealthy and diseased plants may be based on spectral measurements of dif-ferent wavebands or on a combination of wavebands (West et al., 2003). Theidentification of a specific disease or stress using remote sensing techniquesis still a significant challenge in vegetation monitoring. Wavelengths in theVIS range are largely absorbed by pigments. The reflectance of NIR radiationdepends on leaf structure and multiple scattering within the leaf related tothe fraction of air spaces. Reflectance in the SWIR is highly influenced bythe absorption of water, proteins, and other carbon constituents (Asner, 1998;Ceccato et al., 2001; Curran, 1989; Jacquemoud and Ustin, 2001; Jensen, 2002).To classify various fungal diseases, multi-temporal approaches on different scaleswere chosen under controlled conditions and in the field to collect and comparespectral signatures of foliar sugar beet diseases.
Changes in reflectance result from modifications of biophysical and biochemicalcharacteristics of plant tissue. The recording of changes caused by the deve-lopment of fungal diseases may allow disease discrimination by hyperspectralsensing. Diseases may cause changes in tissue colour and leaf shape, transpi-ration rate, crop canopy morphology and density as well as variation in theinteraction of solar radiation with plants (West et al., 2010). This results inmodified optical properties of leaf tissue. Reflectance of leaves has been shownto be sensitive to plant stress due to changes in pigmentation, hypersensitivereaction and cell wall degradation (Blackburn, 2007; Carter and Knapp, 2001;Chaerle et al., 2004; Lenk et al., 2006). Disease-specific symptoms like chloroses,necroses or fungal structures may be also detectable (Bravo, 2006; West et al.,2003).
Physiological interactions between diseases and crops depend on the pathogenand its host plant (Glazebrook, 2005; Jones and Dangl, 2006; Knogge, 1996;
120

5. DISCUSSION
Mendgen and Hahn, 2002; Van Kan, 2006). Primary symptoms of leaf di-seases often are associated with the formation of chlorotic or necrotic tissue.The pattern of responses and the degree of up- and down-regulation of phy-siological processes are related to the type of the host-pathogen relationship.Perthotrophs like C. beticola rapidly kill plant cells to feed subsequently on thenutrients released from the dead tissue, biotroph pathogens like E. betae, andU. betae form haustoria to take up nutrients from living cells. As characteristicsymptoms differ as well, different wavebands are suitable for the detection ofdifferent diseases (Nutter and Littrell, 1996).
Composition and content of leaf pigments change when plants are exposed topathogens that induce chlorotic and necrotic symptoms (Carter and Knapp,2001; Coops et al., 2003; Jing et al., 2007; Pietrzykowski et al., 2006). Pigmentcontent of sugar beet leaves inoculated with C. beticola, E. betae or U. betae wasslightly decreasing during disease progress. However, the development of diseasespecific symptoms had only a small effect on leaf total chlorophyll content. Thiseffect was only significant to a decrease in pigment content at high infection rateswith mature symptoms. Trends were also evident in accessory pigment content;chlorophyll a and b, and carotenoids decreased. Levall and Bornmann (2000)came to comparative results. Due to high variation between sampled leavesinfected with C. beticola, no significant differences in pigment content werereported in their study. However, according to Malthus and Madeira (1993), aslight increase in pigment content has been observed at early infection stages.This effect was most evident for the biotroph diseases powdery mildew andsugar beet rust from 5 to 8 days after inoculation.
Symptoms of infections by C. beticola are a consequence of the biological ac-tivity of cercosporin in the host cells and the intracellular growth of the fungalmycelia (Daub and Ehrenshaft, 2000; Feindt et al., 1981). The fungal toxincauses membrane damage and cell death after the fungus has penetrated theleaf through stomata (Daub and Ehrenshaft, 2000; Knogge, 1996; Weiland et al.,
121

2010). The toxin is produced during vegetative growth of the fungus in the light,relevant for virulence and pathogenicity of C. beticola. Intracellular growth andcolonization of leaf tissue by the pathogen is facilitated by leakage of nutrientsinto the intercellular spaces where fungal colonization occurs (Daub et al., 2010;Goodwin and Dunkle, 2010). Electron microscopic observations visualized thecell collapse and the sharp discrimination between symptomatic and healthytissue. Differences in symptom expression, particularly colouration of the mar-gin of Cercospora leaf spots were observed under different cultivation and lightconditions. The characteristic reddish brown border was formed under natu-ral sunlight illumination in the field, whereas it appeared pale brown underartificial illumination in the greenhouse. The link between light exposure anddevelopment of the necrotic spot and red margin typical of Cercospora leaf spotis consistent with cercosporin’s mode of action as a photosensitizer (Daub andEhrenshaft, 2000).
Changes in spectral signature of Cercospora leaf spot resulted from necroticareas that enlarged with time. These localized, in early infection stage non-uniform patches of necrotic tissue, are surrounded by healthy tissue. Due totissue degradation and the accumulation of brown and reddish brown pigments,reflectance spectra of Cercospora leaf spot significantly increase in the com-plete VIS, especially between 600 and 700 nm. Decreasing reflectance in theNIR and increasing reflectance in the SWIR is due to the effect of the inva-sive growth of C. beticola on the tissue structure of sugar beet leaves. Withfurther symptom development the colonized tissue degrades more and more;collapse of parenchyma and epidermal cells, decrease of cell water content, andincreased lignifications are the consequences (Feindt et al., 1981; Steinkampet al., 1979). Changes in sugar beet leaf reflectance in the NIR and SWIR weremost pronounced for Cercospora leaf spot than for the other diseases.
In early disease stages the impact of powdery mildew on the chlorophyll contentis rather low, since the biotrophic fungus on the plant surface relies on the
122

5. DISCUSSION
photosynthetic activity of the host tissue (Francis, 2002; Glawe, 2008; Mendgenand Hahn, 2002). Significant changes in the chlorophyll absorption bands ofpowdery mildew diseased leaves could be detected neither early after inoculationnor at moderate disease severities. Coverage of the leaf surface by white myceliagenerally increased reflection, especially in the VIS and less marked, but stillobvious, in the NIR and SWIR. The increase in the NIR and SWIR may bedue to direct reflectance of fungal hyphae on the leaf surface and to changes inwater content of the host cell wall due to activities of the fungus.
Similar to E. betae, U. betae the causal agent of sugar beet rust is a biotrophicpathogen, colonising living plant cells and not apparently triggering any obviousadverse plant response (Heath, 1997). The very small uredinia surroundedby a chlorotic halo were scattered on the leaf surface and resulted only inminor reflectance changes between 550 and 700 nm. In contrast to the otherdiseases, sugar beet rust did not increase leaf reflectance in the violet-blueregion. Also the effect on NIR and SWIR was low, although sugar beet rustgenerally decreased reflectance in the SWIR.
Disease detection and its assessment by reflectance spectra are feasible for di-seases causing changes in pigments – VIS range – or cell structure – NIR range(Malthus and Madeira, 1993). The authors described a flattening of the re-flectance in the VIS and a decrease in the NIR reflectance shoulder at 800 nmfor leaves infected by the necrotrophic pathogen Botrytis fabae. These responsesmay correspond to the collapse of tissue structure due to pathogen spread.Reflectance of cucumber leaves infected by Colletotrichum orbiculare was af-fected in the violet-blue region and the NIR (Sasaki et al., 1998). Comparingdifferent disease assessment methods for downy mildew in quinoa, reflectancemeasurement in the red in the NIR provided highest correlation with yield loss(Danielsen and Munk, 2004).
In situ leaf reflectance measurements indicated specific spectral signatures forsugar beet leaves, respectively diseased with C. beticola, E. betae, and U. betae.
123

The intensity of physiological changes and the extent of the symptoms influ-enced changes in spectral reflection of sugar beet. Similar trends with minorexiguous impact on spectral reflectance have been observed on the canopy andfield scale. Specific effects of some diseases, specific effects of disease stages, andthe impact of disease severity on spectral characteristics of plants are sophisti-cated, but may be also used for the characterization of host-pathogen interac-tions. Hyperspectral measurements of diseased sugar beet leaves revealed thatspectral response of early symptoms or low disease severity differs from thatfrom mature symptoms or high disease severity. Furthermore specific regions ofthe spectrum seem to have higher potential for discrimination of diseases thanonly one or few wavelengths.
The spectral response of plants to different stress factors may be similar (Bocket al., 2010; Stafford, 2000). Plant stress begins with a constraint or highlyunpredictable fluctuations imposed on regular metabolic patterns, which causetissue injury, disease or aberrant physiology. According to Gaspar et al. (2002),plant stress is the altered physiological condition caused by factors that tendto alter an equilibrium. Plant growth, productivity, and reproductive capacitygenerally are influenced negatively (Rhodes and Nadolska-Orczyk, 2001). Mostabiotic stress factors like water deficiency, nutrient deficiency, solar radiation,and temperature as well as pathogens affect the photosynthetic apparatus andits functions (Carter and Miller, 1994; Chapin, 1991; Stafford, 2000). Associatedresponse to different kinds of stress in reflectance spectra by minor reflectancearound 700 nm and 550 to 575 nm have been measured by Carter and Knapp(2001).
Stress-induced physiological consequences are highly variable (Balachandranet al., 1997). Plant fungus interactions and the resulting disease symptomsare influenced by various external factors and thus are variable as well (Danglet al., 1996). The spatial and temporal distribution of stress symptoms causedby pathogens is different from those caused by abiotic factors (Vollenweider and
124
5. DISCUSSION
Günthard-Georg, 2005). Nutrient deficiencies, drought stress, or temperaturestress cause relative uniform patterns, whereas foliar diseases are associatedmostly with localized, discrete lesions. This has to be considered for diseasedetection.
Comparison of hyperspectral non-imaging and imaging sensingThe sensitivity of hyperspectral sensing systems to changes in plant reflectancelargely depends on sensor technology and the measuring scale. Spectroradiome-ters average the reflection in several narrow wavebands of light within the fieldof view of the sensor (West et al., 2003, 2010). Measurements with the non-imaging spectroradiometer gave a good correlation of reflectance to diseasesregardless to spatial information. But as the portion of diseased tissue in themixed signal decreases with disease severity, the sensitivity and specificity ofthe non-imaging spectroradiometer was limited at low disease severities. Re-flectance curves measured with non-imaging systems always represent the meanof the reflectance of healthy and diseased tissue. This results in a number ofproblems, typical for single point measurements (Scholten et al., 2005). Theeffect of small or a few disease symptoms, e.g. sugar beet rust on spectral re-flectance of the field-of-view was low. The spectra include a high percentageof reflectance from healthy tissue and only a low portion of reflectance fromsymptomatic tissue.
Hyperspectral imaging systems, in contrast, record leaf reflectance in severalnarrow wavebands for each pixel, forming a focussed image (Bock et al., 2010;West et al., 2010). Spatial and spectral information can be acquired simultane-ously (Fitzgerald, 2004). It is expected that hyperspectral imaging can improvedisease detection through a better examination of the host pathogen interac-tions (Bock et al., 2010; Chaerle and van der Straeten, 2001). Imaging sensorsystems allows a pixel-wise attribution of disease-specific symptoms and healthytissue (Steiner et al., 2008) and improves both, the specificity and sensitivityof hyperspectral disease detection. Some diseases and their symptoms can only
125
be distinguished from other diseases and stresses when hyperspectral imagingwith high spatial resolution is used (West et al., 2010). Using the example ofsugar beet uredinia, pure spectral signatures could be extracted pixel-wise fromhyperspectral imaging data. Nevertheless, the small size of uredinia and limitedspatial resolution of the sensor resulted in a strong influence of neighbouringpixels and a high amount of mixed pixels.
Hyperspectral imaging enabled the detailed description and comparison of leafreflectance during the development of the diseases. The three sugar beet di-seases differed in their temporal and spatial development. On the leaf scaleCercospora leaf spot formed fast growing leaf spots, finally resulting in necroticareas. On the canopy scale the disease often were accumulated in clusters.Sugar beet rust mainly appeared in singular uredinia over a leaf, and on singleplants on the field scale. The small size of rust colonies impeded the classi-fication in early stages or at low disease severity. Similarly, an unambiguousdetection of powdery mildew in early stages is challenging. First symptoms arefluffy white mycelia covering the leaf surface which affects the spectral signaturelike a dusty coat. But unique for powdery mildew is its plane colonization ofthe leaf tissue and the fast spread and infestation inside crop stands. Similardifferences were monitored for leaf rust and powdery mildew in wheat crops(Franke et al., 2009). Leaf rust appeared mainly in stable patches, whereaspowdery mildew exhibited a more dynamic distribution within the field andover time. The development of patterns in time and space may help to identifythe disease or stress influencing the crop canopy (Nutter et al., 2010).
Besides analysing the temporal development of the pathogenesis and disease-specific symptoms, also spatial patterns of discrete symptoms of sugar beetdiseases could be investigated. The results revealed parallels between tempo-ral and spatial disease characteristics. Modifications of spectral reflectanceat different developmental stages were reproduced in spectral signatures ofdifferent regions of the symptom. For instance, reflectance of the necrotic
126

5. DISCUSSION
centre of Cercospora leaf spot was consistent with overall reflectance of ma-ture symptoms, whereas reflectance of new, immature symptoms was similar tothat from the margin of fully developed lesions. Similar results were obtainedfor different developmental stages and different regions of mature symptomsof powdery mildew and sugar beet rust. These observations derived from hy-perspectral imaging clearly demonstrate the gradual transition from healthy todiseased tissue for all diseases in both, time and space. Based on hyperspectralimage data cubes, pure spectral signatures from healthy tissue and areas withCercospora leaf spot, powdery mildew, and sugar beet rust can be extracted.However, there is always a gradient in reflectance between symptomatic andsymptom-less/healthy leaf tissue and a clear classification between healthy anddiseased is difficult. This phenomenon has not been described in literature bynow and may be investigated even at smaller scales at the cellular level.
The potential of hyperspectral imaging for the detection of diseases in cropswas shown convincingly only in few studies. In most of these studies hyper-spectral imaging was used for the detection of one disease in a crop. Diseasequantification or the differentiation among several diseases or stress symptomshave been reported only in very few studies. In an early attempt, Coops et al.(2003) categorized the severity of needle blight in Australian Pine from air-borne hyperspectral imagery and reached a classification accuracy of > 70% forthe three classes low, medium, and high infection as compared to ground truthdata. Bravo et al. (2003) successfully implemented a hyperspectral line scan-ning system to detect yellow rust in wheat fields. The hyperspectral camerasystem was mounted on a hand pushed cart, 1 m above the ground. Detectionaccuracy of 96% was realized using four selected wavelengths from the range of460 to 900 nm. Polder et al. (2010) compared hyperspectral imaging to colourand fluorescence imaging for the detection of tulip breaking virus (TBV) intulips. Best results were obtained from the spectral camera system in the VISand gave results similar to that of visual assessment by experts. The authorsaim to develop an autonomous robot equipped with a hyperspectral camera
127

for the detection of diseased tulips. Insect-induced stress has been detected byhyperspectral data cubes in wheat plants. According to Nansen et al. (2009)the main advantages of hyperspectral detection systems are I) fast data col-lection, II) the potential of a real-time data analysis, and III) non-destructivedata collection enable repeated measurements on the same individuals.
Extraction and use of disease relevant parametersNext to the technical specifications of hyperspectral sensor systems for datarecording, data analysis is essential to extract suitable results without losingimportant information. According to Carter and Knapp (2001), who linkedspectral characteristics to stress and chlorophyll concentration, the subtractionof spectra from healthy leaves from those representing diseased leaves revealedthe responses of significant spectral regions. For sugar beet diseases, the corre-lation in the different ranges was tributary to disease specific symptoms, andthe sensitivity was regulated by disease severity. As wavelengths near 700 nmhave the strongest linear relationship to total chlorophyll content (Carter andKnapp, 2001; Gitelson et al., 2003), the response of leaves diseased with Cer-cospora leaf spot and sugar beet rust in this range was more pronounced thanthe response to powdery mildew. Reflectance in the VIS from 450 to 520 nmand from 570 to 710 nm was highly correlated to severity of these diseases. Thisis in contrast to results from Steddom et al. (2005), who measured Cercosporaleaf spot with a multispectral radiometer in the field. The deviation is likely toresult from differences in the sensor systems (hyperspectral with 1 nm resolu-tion vs. multispectral with 9 bands) and in measuring conditions (lab vs. field;constant light conditions vs. sunlight). Jing et al. (2007) estimated a stronglinear correlation between chlorophyll a concentration and yellow rust severityin wheat at around 700 nm. Similar results were obtained for spectral sensi-tivity of Eucalyptus globules foliage in response to Mycosphaerella leaf disease(Pietrzykowski et al., 2006). In further data analyses, wavelengths with highestcorrelations may be used for ratio development according to Carter and Knapp
128

5. DISCUSSION
(2001), Carter and Spiering (2002), Richardson et al. (2001), and Yang et al.(2007).
From the different methods for waveband selection used in this study it canbe concluded, that not a single wavelength can be used to detect or to iden-tify a disease. The combination of specific spectral regions or broad spectralbands improves the detection accuracy. Variability of reflectance among thethree sugar beet diseases exceeded intradisease variability. Nevertheless, thereare still some difficulties. E.g., it is still under examination in which way mixedinfections of plants with two or more diseases affect spectral reflectance signa-ture.
Many data analysis methods for hyperspectral application aim to reduce datadimensionality. Redundant information from narrow bands is removed and thecomputation time may be reduced. A common method is the calculation ofSVIs. For early detection and for site-specific plant protection, SVIs have to besensitive to changes in the reflection caused by diseases. Similarly, they haveto be specific for diseases/stress.
The potential of SVIs for early disease detection has been investigated in severalstudies (e.g. Delalieux et al., 2009; Graeff et al., 2006; Naidu et al., 2009; Sted-dom et al., 2003, 2005). Most of the developed indices are highly correlated tothe content of pigments, biomass, or leaf area (Le Maire et al., 2004; Thenkabailet al., 2000). Different changes in spectral reflectance not only denoted the oc-currence of a disease, but also provided information on the developmental stageand severity of the disease. Delalieux et al. (2009) demonstrated that the dis-criminatory performance of SVIs for apple scab depends on the infection stageand the phenological stage of apple leaves. Indices commonly used in remotesensing, however, lack disease specificity. Nevertheless, SVIs gave promising re-sults in studies assessing only one disease. A binary classification into healthyand diseased plants using single SVIs was feasible. The three diseases affected
129

leaf reflectance assessed with non-imaging and imaging sensors – and SVIs – ofsugar beet in different ways.
SVIs highly correlated to chlorophyll, anthocyanin, and water content showeda high sensitivity to different stages of Cercospora leaf spot (e.g. NDVI, ARI,WI). The anthocyanin specific ARI was developed by Gitelson et al. (2001) toretrieve anthocyanin content from reflectance. Anthocyanins are water-solublepigments with a absorption peak around 550 nm, responsible for red colorationof plant tissue. Depending on the sugar beet variety and illumination intensitythe boundary zone of Cercospora leaf spots is coloured from pale brown to deep-wine red as a result of betacyanin accumulation (Steinkamp et al., 1979). Beta-cyanins are highly water-soluble pigments, present in the cell vacuole. Similarto anthocyanins, the absorption maximum of betacyanins is from 538 nm to550 nm (Frank et al., 2005; Kobayashi et al., 2000; Piatelli and Minale, 1964).Although reddish brown symptoms of Cercospora leaf spot result from beta-cyanin accumulation, the ARI based on reflectance at 550 nm is useful for thedetection of disease symptoms not related to anthocyanins.
For powdery mildew detection, however, carotenoid-specific indices and SVIscombining the information from absolute reflectance over a spectral range (e.g.SIPI, PSSRc, SumGREEN, BGI2) were more suitable. In contrast to the otherdiseases, powdery mildew affected reflectance also in the violet-blue region ofthe spectrum where absorption of carotenoids is maximal. This effect may beexplained by the overall reflection increase due to powdery mildew as the diseasehad no significant effect on the level of carotenoids.
For sugar beet rust the photochemical reflection index (PRI) was most sensi-tive. The PRI was developed to estimate photosynthetic light use efficiency(Gamon et al., 1997; Rascher et al., 2010). The basic wavelength of PRI is531 nm correlated to the composition of xanthophylls, pigments involved innon-photochemical quenching (Gamon et al., 1992). An effect of rust infec-tion on non-photochemical quenching has been described for oat and beans.
130
5. DISCUSSION
Scholes and Rolfe (1996) investigated the efficiency of photosynthesis in lo-calised regions of oat leaves infected by crown rust (Puccinia coronata). Non-photochemical quenching was low within diseased regions, but much higher,compared to healthy leaves, in uninfected regions of diseased leaves. Similarresults have been obtained for Phaseolus vulgaris infected by Uromyces appen-diculatus (Peterson and Aylor, 1995).
SVIs, calculated on hyperspectral imaging data revealed the potential for dis-criminating among healthy and diseased tissue on the leaf scale. Besides thedetection of the three diseases, Cercospora leaf spot and powdery mildew couldbe quantified and the results were highly correlated to visual disease assessment.Due to the small symptom size and exiguous infestation severity, quantificationof sugar beet rust was not feasible. With Cercospora leaf spot and powderymildew diseased tissue of sugar beet leaves were accurately recognized and visu-alized in binary images. This simple, threshold-based analysis seems suitable foran automatic disease detection and quantification for many fields of application.Compared to the approach of Camargo and Smith (2009b), who developed analgorithm for automatically identification of visual symptoms on RGB images,hyperspectral images offers a surplus on information, which is required for highsensitivity. The origin and quality of the sensor data is essential for the successof any system for disease and pattern recognition. Shafri and Ezzat (2009) andShafri and Hamdan (2009) applied SVIs on airborne hyperspectral images tomap and quantify Ganoderma disease on oil palms. With and accuracy of 82.8%in their study, the NDVI fitted best for disease detection in forests, regardlessof disease specificity.
Analysis of non-imaging hyperspectral data showed that the use of more thanjust one SVI improves the sensitivity and specificity for disease detection andidentification. As the correlation between disease severity and SVIs differssignificantly among diseases, it can be concluded that combinations of SVIs havea high potential for hyperspectral disease detection and discrimination. First
131

analyses confirmed this idea and demonstrated that diseases may be detectedand identified in very early stages (Rumpf et al., 2010). Thereby it is crucialto combine SVIs based on different wavelength of the hyperspectral spectrum.SVIs related to different physiological parameters showed divergent scatter plotsfor healthy plants and mapped each disease separately. SVIs based on similarwavelengths of the spectrum are highly correlated to each other, and hence notfeasible for discrimination.
Powerful data processing methodology is required to utilize the full potentialof combined SVIs, given that sensor-based disease detection allows automaticclassification of diseases for precision crop protection applications. Data miningtechniques, the process of extracting important and useful information from alarge set of data (Mucherino et al., 2009; Wu et al., 2008b), and in particularSVMs seem to be able to solve this complex problem. Different techniques havebeen proposed for mining data in terms of disease detection. All solved a di-chotomous problem, i.e. the classification between healthy and plants with ma-ture disease symptoms. Bravo et al. (2003) investigated the difference in spec-tral reflectance between healthy and rust-diseased wheat. Using a quadraticdiscrimination model based on the reflectance of four wavebands, they cor-rectly differentiated spectra of diseased and healthy crops at a classificationaccuracy of 96%. In a next step they successfully applied the neural networkSelf-Organizing Maps (SOM) to discriminate between healthy plants, nitrogendeficiency, and diseased wheat plants in the field (Moshou et al., 2006). Wanget al. (2008) spectrally predicted late blight infections on tomatoes using arti-ficial neural networks (ANNs).
Wu et al. (2008a) recently showed that early detection of grey mould due toBotrytis cinerea on eggplant leaves is possible, even before first symptoms be-came visible. Owing to the complexity of the original spectral data, principalcomponent analysis was applied to reduce the numerous wavelengths to severalprincipal components in order to decrease the amount of calculation and im-
132

5. DISCUSSION
prove the accuracy. These principal components were set as input variablesof back-propagation neural networks. In contrast to Wu et al. (2008a), whoused hyperspectral reflectance for classification, a classification result above90% for discriminating the three sugar beet diseases by using SVIs as featuresfor SVMs was achieved. This approach included the combinations of individualwavelength from different SVIs. In order to further improve the detection ofplant diseases, disease-specific wavelengths and SVIs have to be identified.
For automatic classification of foliar sugar beet diseases SVMs are a powerfuldata mining tool. They may be even applied for classifying data that is notlinearly separable by using a kernel (Vapnik, 2000). Moreover, because of themaximummargin hyperplane founded by SVMs the generalization ability is best(Schölkopf and Smola, 2002). Not only the differentiation between healthy anddiseased leaves, but also the identification of diseases (multi-class approach) canbe realized. In a recent publication, Camargo and Smith (2009a) used SVMs forthe identification of visual symptoms of cotton diseases based on RGB imagesand reached a classification accuracy of 90%.
An advantage of SVMs is that models can be learned without long computationtime (Rumpf et al., 2010). It has been shown that combinations of SVIs aresuitable to discriminate among Cercospora leaf spot, sugar beet rust, powderymildew, and healthy leaves. Furthermore, infections could be assessed evenbefore the first symptoms became visible. Both the number of necessary SVIsas features and the feature combinations depend on the disease(s) of interest(Rumpf et al., 2009). Two SVIs are sufficient for the detection of Cercosporaleaf spot, whereas three and more are needed to identify leaf rust and powderymildew. The classification accuracy of diseases even before the appearanceof visible symptoms was highest when all nine SVIs were considered (Rumpfet al., 2009). Several modifications in cellular leaf structure may occur beforesymptom formation, e.g. changes in water content at infection sites, initiationof cell death by fungal toxins, or defence reactions of plant tissue (Daub and
133

Ehrenshaft, 2000; Jones and Dangl, 2006; Knogge, 1996). Likewise fungal sporeson the leaf surface after inoculation may influence reflectance in an early stage.These modifications are associated with changes in spectral reflectance whichmay be detectable by analysing hyperspectral data using SVMs.
Furthermore the classification accuracy differed between diseases. In order toimprove the early detection and identification of sugar beet diseases by datamining techniques, two future approaches are conceivable. Instead of SVIs, theinformation of the entire spectrum may be used as original data by machinelearning. This method enables the use of optimal scanning positions and mostrelevant wavelengths for each disease. In a next step, this information maybe reduced to the essential by the development of disease-specific SVIs. Theextraction of the most relevant wavelength for disease-specific indices requiresan appropriate methodology, which may be implemented by machine learningmethods. In a further step, cheap multispectral sensors tailored to the particulardiseases and based on the wavelength of the disease-specific indices may beproduced for precision crop protection. Key benefits from these disease-specificsensors are lower costs and lower technical complexity with simplified handling.
The analysis of hyperspectral images aims to detect and identify diseased partsof sugar beet leaves. A spectral matching algorithm was used for statisticalcomparison between reference spectra and unknown spectra. Given that thedifferent spectral patterns of healthy and diseased tissue are known, supervisedclassification was the choice to analyse the images. The SAM implemented thethree main objectives: detection, differentiation, and quantification of diseases.Since the SAM classification is based on defined endmember spectra, a detectionbefore visible symptoms occurs was not feasible by this methodology, but visiblesymptoms were classified with high accuracy. Similar to Zhang et al. (2003),who differentiated various levels of Phytophthora infestans infection of tomatoesfrom airborne hyperspectral images, disease severity could deduced by using the
134

5. DISCUSSION
SAM classification. In a recent approach, Bauriegel et al. (2009) could detectFusarium head blight by means of SAM analysis of hyperspectral images.
Insensitivity to heterogeneities of surface topography and illumination are bene-fits of the SAM algorithm for disease detection on sugar beet. Sugar beet leavesdo not have plane surfaces. Leaf veins and differences in growth rates causea characteristic undulated, grooved topography of sugar beet leaves dependingon the genotype. Heterogeneities in reflectance intensity occur, as radiation isnot reflected straightforward by these surfaces. Spectral similarity is calculatedas the angle between the two spectra, treating them as vectors in a space withdimensionality equal to the number of bands (Kruse et al., 1993). The directionof the vector is independent from the distance of a point to the origin (= effectof illumination). The measure of similarity by SAM is insensitive to gain fac-tors (like illumination and topographic illumination effects), because the anglebetween two vectors is invariant with respect to the length of the vectors (Kruseet al., 1993).
Although classification accuracy of SAM was satisfying, it should be mentionedthat this classification algorithm uses the average spectrum of each endmemberclass (e.g. healthy and different symptom peculiarities). The spectral vari-ability within each endmember class, denoted as intra-class variability is notretained. Luc et al. (2005) obtained a higher overall classification accuracy ofBelgian coastline regions by modifying the common SAM to an optimized SAMpreserving the intra-class variability. This approach may also resolve problemsin disease classification, e.g. lower accuracy for early disease stages when onlyimmature symptoms occur. Similarly, the detection of minor spectral changesdue to small sugar beet rust symptoms was less accurate. Zhang et al. (2003)also described problems in the differentiation between late blight categories ofhigh spectral similarity by SAM, and among healthy and tomato plants withlow disease levels.
135
Disease assessment on the canopy and field scaleAs mentioned above, the measuring scale influences spatial resolution and sen-sitivity of hyperspectral sensors. Reflectance from plant canopies depends notonly on reflectance properties of individual leaves and stems, but also on theirorientation and distribution in the 3D space (Gamon et al., 1995). Knipling(1970) has shown that absolute canopy reflectance is about 40% in the VIS and70% in the NIR of absolute reflectance from a single leaf. Leaf orientation influ-ences the amount of light reflected, as shown for field-grown rice (Murchie et al.,1999). Under stress conditions both factors are likely to change and differentfractions of vegetation and soil are exposed to the spectral sensor (Jackson andPinter, 1986). When lower leaves are exposed, canopy reflectance may be af-fected because reflectance properties of leaves grown in shade differ from thoseof leaves exposed to sunlight (Jackson and Pinter, 1986). Several fungal diseasespreferably affect older or lower leaves due to the presence of soil-borne primaryinoculum, favourable micro-climate and environmental conditions in lower leaflevels and may also influence canopy reflectance.
On the field scale an early detection of diseased sugar beet by hyperspectralimages from airborne sensors was possible by calculating SVIs. Already inearly disease stages, slight changes in reflectance due to primary symptoms ofpowdery mildew and Cercospora leaf spot could be classified using the NDVI. Inagricultural practice, fungicides are applied according to disease-specific actionthresholds. According to Wolf and Verreet (2002), an action threshold of 5%disease frequency is used for the control of powdery mildew and Cercospora leafspot. With a disease severity of almost 5% this action threshold was reachedfor powdery mildew in early August 2008. At higher infection rates later in thevegetation period, a classification based on near-range data was also feasible.The SVIs from different sensors differed in their correlation to disease severityof powdery mildew as described earlier for wheat diseases by Franke and Menz(2007).
136
5. DISCUSSION
Several field studies have tested the usefulness of SVIs for the discriminationbetween healthy and infected crops at varying disease levels. Steddom et al.(2005) demonstrated that necrosis caused by Cercospora leaf spot may be de-tected effectively by using SVIs in the field. Huang et al. (2007) used the photo-chemical reflectance index to quantify the level of yellow rust infection of wheatin the field from airborne and near-range hyperspectral data. The differentia-tion between abiotic stress and diseases and among diseases, however, is stilla challenge. Because the incidence of Cercospora leaf spot at Klein-Altendorfwas marginal in 2008, the discrimination between diseases from airborne datawas not feasible.
West et al. (2003) summarized the potential of optical remote sensing for diseasemonitoring and fungicide application mapping. Scotford and Miller (2005) usedindirect spectral information like leaf area index and tillering stage to createfungicide application maps. A high correlation between disease severity andreflectance data of wheat was obtained by using neural networks (Moshou et al.,2004). These authors were also able to differentiate between fungal infectionand nutrition deficiency.
Early detection of primary disease foci in the field is another challenge. Binaryinformation – whether plants are infected or not – may be derived from remotesensing data. For the extraction of quantitative information on disease levels,further research and data analysis is required. Integrating these different ap-proaches, hyperspectral sensor-based information such as SVIs are very likelyto be suitable for the generation of fungicide application maps. Online systemsrequire even more technological development.
The use of hyperspectral techniques in agricultural fields, however, is limited byseveral factors. Actually the availability of remote sensing data with high spec-tral and spatial resolution suitable for disease identification in crops is limited(Franke and Menz, 2007). Airborne sensor campaigns are expensive, complexin organization, and rely on good weather conditions. In contrast, disease de-
137
velopment in the field is influenced by various parameters like temperature,relative humidity, genetic disease resistance, crop growth stage, etc. The ac-quisition of spectral data appropriate in time and space for disease detection,therefore, is difficult – at least under the environmental conditions in WesternEurope. The three sensors used in this study are proved to be quite sensitive inorder to detect changes in canopy reflectance of arable crops. Because of limi-tations in sensor availability and costs it was not possible to use all sensors ateach monitoring for comparative studies. The ROSIS sensor with high spatialand spectral resolution recorded a homogeneous canopy reflectance of healthysugar beets. Although 4 m spatial resolution of the HyMap sensor is lower,early changes in canopy reflectance due to fungal infections could be detected.Advantages of the hand-held ASD sensor are flexibility and simple handlingassociated with high spectral sensitivity. Therefore, tractor mounted on-the-gosensors seem to be more practical for precision crop protection than airbornesensors.
Relevance of hyperspectral sensing for precision crop protectionThere is a huge potential of hyperspectral sensor systems for precision cropprotection and for various plant pathology applications (Delalieux et al., 2009;Hatfield et al., 2008; Nutter et al., 2010; Stafford, 2000; Voss et al., 2010; Westet al., 2010). Precision crop protection is a part of precision agriculture, a man-agement concept depending on information technologies related to within-fieldvariability (Hillnhuetter and Mahlein, 2008; Steiner et al., 2008). Monitoringof health and detection of diseases is crucial for sustainable plant production.Variability in environmental conditions, heterogeneous distribution of primaryinoculum, or variation in crop growth can lead to spatial and temporal vari-ability of diseases in the field (West et al., 2010). Hyperspectral methods ondifferent scales – from airborne to tractor mounted and handheld sensors – en-ables the detection and mapping of disease foci or pest infestations. Such areasmay be treated site-specifically, particularly in early stages, without sprayingthe entire field and thereby wasting money and increasing the environmental
138
5. DISCUSSION
burden from crop protection (Stafford, 2000; Steiner et al., 2008; West et al.,2010). Nutter et al. (2010) predict that in the short to mid-term future, imageryfrom remote-sensed data provides permanent records of disease intensity andwill be used to quantify the temporal and spatial dynamics of pathogens anddiseases.
The investigations on foliar sugar beet diseases at different scales have approvedthat detection, differentiation, and quantification of diseases can be realized bydifferent hyperspectral sensors. On the leaf scale, hyperspectral imaging wassuperior to the non-imaging sensor. The precision in detecting spatial andtemporal differences was high. Such imaging systems may be used to speedup screening assays in resistance breeding when plant-fungus interactions haveto be monitored in time series under rather controlled conditions. Plants areusually inoculated with a pathogen at a well-known spore concentration. Theseare optimal conditions for an automatic hyperspectral screening system withhigh sensitivity and specificity (Chaerle et al., 2007a; Delalieux et al., 2009).Disease detection and quantification may be based on SVIs or classificationalgorithms like the SAM.
For precision crop protection in the field, airborne and spaceborne sensors offerlarge-scale applications. The use of airborne and spaceborne sensors in prac-tice, however, is limited by their spatial resolution and temporal availability(Franke and Menz, 2007; Mahlein et al., 2009; Voss et al., 2010). The linkwith epidemiological knowledge about temporal and spatial dynamics of plantdiseases is essential to implement hyperspectral disease detection into practice(West et al., 2010). Depending on symptom size and disease severity, patchinessof primary disease and epidemic spread, higher resolutions may be necessary.Tractor-mounted, non-imaging sensor systems may realize on the go spray-decisions. An example for a commercialized, tractor-mounted sensor system isthe Yara N-sensor for N-fertilization (Agricon, Ostrau, Germany). Based onreflectance measurement and chlorophyll estimation analogue to the analysis
139

by SVIs, application rates are directly transferred to a manure distributor or asprayer. Similar technology may be suitable for disease control; however, thediscrimination between different kinds of stress is indispensable. This challengemay be met by machine learning techniques like SVMs which enable high speci-ficity and sensitivity as demonstrated by the early detection and differentiationof sugar beet diseases.
Hyperspectral data from airborne sensors resulted in good disease detectionin the field. Both spatial and temporal variability of powdery mildew andCercospora leaf spot could be monitored. Combining optical sensing methodsfrom different scales (airborne, tractor-mounted or even handheld) with newmodelling approaches or existing decision support systems, like the IPM-modelsugar beet (Wolf, 2001), CERCBET (Racca and Jörg, 2007), and BEETCAST(Pitblado and Nichols, 2005) may improve their validity and reliability, as wellas the economical and ecological benefits of these technologies. The automationof disease assessment using optical sensor systems can be useful in order toenhance existing forecast models.
Conclusions and future perspectivesHyperspectral non-imaging and imaging sensor systems originate from remotesensing sciences and have been introduced to plant pathology only recently.Remote sensing has been defined as ’obtaining information about an objectwithout having direct physiological contact with it’ (De Jong and Van derMeer, 2006). In classical disease detection, the human eye is a remote sensingdevice which, in combination with the brain, acts as an image analysis system(De Jong and Van der Meer, 2006; Nilsson, 1995). Since the response of vi-sual disease rating is not reproducible and depends on several factors, imagingand non-imaging hyperspectral sensing offers potentially reliable and accurateinformation (Nutter and Littrell, 1996; Steddom et al., 2005). What can beseen with the human eye should be also detectable by a hyperspectral sensorsystem and manifold data analysis methods may conform prospects for plant
140

5. DISCUSSION
disease detection (Bravo, 2006; Chaerle and van der Straeten, 2001). Hyper-spectral remote sensing and near-range sensing can provide a precise, objective,reproducible, and time-saving method for disease monitoring in various fieldsof applications in the near future. The effectiveness of crop protection actionsmay be optimized economically and ecologically by increased precision in both,space and time.
New insights from hyperspectral disease detection in sugar beet, like sensorspecificities and different analysis methods may be transferred to other plant-pathogen systems. Disease-specific characteristics and crop characteristics haveto be taken into account for sensor optimization in order to obtain the highestsensitivity and specificity. For practical applications sensor systems, as well asalgorithms for the analysis of hyperspectral data need to be simplified. Turn-keysolutions with an appropriate degree of automated calibration and processingto compensate for different plant parameters, suitable for use by specialists andnon-specialists are needed (Hatfield et al., 2008). The development of disease-specific SVIs or classification algorithms may increase the overall performanceof the system. The commonly used classification methods analyze hyperspectralimages without incorporating information from spatially adjacent data (Plazaet al., 2009). Simultaneous multi-dimensional data analyses of spatial and spec-tral patterns will be of high relevance in future, especially for the interpretationof hyperspectral images to detect and characterize plant diseases.
Hyperspectral recordings can improve monitoring systems for plant diseases andwill by this support farmers and breeders to achieve an improved assessmentand control of plant diseases in the future. This technology will contributeto optimize the use of natural resources, to maintain the quality and quantityof agricultural products at high standards, and to reduce the environmentalimpacts from crop protection.
141


6. SUMMARY
Fungal plant diseases often are distributed heterogeneously in the field. Preci-sion crop protection, as a part of precision agriculture, is a management conceptdepending on information technologies related to within-field variability. Mon-itoring of health and detection of diseases is critical for sustainable plant pro-duction. Hyperspectral imaging and non-imaging has the potential for precise,objective, reproducible, and time-saving disease monitoring in various fields ofapplications. This would make it possible to treat such areas site-specifically,particularly at early disease stages, without needing to spray an entire field.The present study, therefore, focused on the prospects of hyperspectral sensingto detect, differentiate, and to quantify plant diseases. Sugar beet infected bythe fungal pathogens Cercospora beticola, Erysiphe betae, and Uromyces betaecausing Cercospora leaf spot, powdery mildew, and sugar beet rust, respec-tively, were used as a model system. The effects of diseases on reflectance ofsugar beet leaves were recorded during their temporal and spatial developmenton various scales.
• The three diseases of sugar beet differed in their interaction with the hostplant. Spatial, temporal, and visual differences during pathogenesis wereobserved. The perthotroph pathogen C. beticola caused reddish brownnecrotic spots, which coalesced during pathogenesis, whereas the biotrophpathogen E. betae colonized the leaf surface with a white, fluffy pow-dery mycelia. Symptoms due to U. betae were singular small uredina,distributed over the leaf surface.
143

• Characteristic spectral signatures of diseased sugar beet leaves wererecorded with a non-imaging spectroradiometer during pathogenesis. Cer-cospora leaf spot increased reflectance in the VIS between 450 and 700nm. A shift of the red edge position was monitored. Reflectance in theNIR decreased with increasing disease severity, whereas an obvious increaseof reflectance in the SWIR was measured. Powdery mildew caused an in-crease of reflectance over the entire range. This effect was most pronouncedin the VIS, and minor in the NIR and SWIR. Sugar beet rust slightly in-creased reflectance from 550 to 700 nm, reflectance in the NIR and SWIRdecreased during pathogenesis. Reflectance spectra assessed on the leafscale were similar to those recorded on the canopy scale. However, changeson the canopy level were less pronounced due to several influencing factorslike leaf geometry, shadowing, and the relation of healthy to symptomaticleaf area.
• Spectral vegetation indices calculated from hyperspectral non-imaging datadiffered in their correlation and sensitivity to the three diseases. The NDVIand the chlorophyll related indices PSNDa and PSNDb were correlatedbest to Cercospora leaf spot. The carotenoid specific indices SIPI, PSNDcas well as the NDVI and the PSNDa were suitable for the detection ofpowdery mildew. The PRI and the ARI were most suitable to detectreflectance changes due to sugar beet rust.
• Combinations of two or more SVIs offered the potential for detection anddifferentiation among sugar beet diseases. In a further approach SVIs wereused as features for an automatic classification by Support Vector Ma-chines. Non-inoculated, healthy sugar beet leaves and sugar beet leavesinoculated with C. beticola, E. betae, and U. betae, respectively, were clas-sified with an accuracy of > 86%. Furthermore, plant diseases could bedetected pre-symptomatically. Depending on the type and stage of diseasethe classification accuracy ranged from 65% to 90%.
144
6. SUMMARY
• Hyperspectral imaging enabled the observation of changes in sugar beetleaves due to Cercospora leaf spot, powdery mildew, and sugar beet ruston the pixel level. The temporal and spatial development of disease symp-toms gave characteristic reflectance patterns on the leaf level. Spectralsignatures obtained from hyperspectral imaging coincided with spectralsignatures from non-imaging measurements.
• Several SVIs showed a potential to discriminate between healthy anddiseased tissue. The use of disease-responsive SVIs in combination withdisease-specific threshold levels resulted in the compilation of binaryimages, differentiating between diseased and healthy tissue. The automaticquantification of disease severity from these images gave high correlationsto visual disease assessments. The coefficients of correlation for the quan-tification of Cercospora leaf spot and powdery mildew were R2 = 0.98 and0.93, respectively. Difficulties remained for the very small rust uredinia(R2 = 0.67).
• Applying the Spectral Angle Mapper algorithm on hyperspectral imagingdata, high accuracies for the differentiation between healthy and diseasedleaf tissue were obtained. Besides the differentiation of symptomatic andhealthy parts of a leaf, also different regions of disease-specific symptoms,and different developing stages could be differentiated. For the detectionof Cercospora leaf spot the accuracy of classification ranged from 89% 11dai to 98% 17 dai. Similar high accuracies could be assessed for powderymildew classification (94% 8 dai, 97% 14 dai, and 90% 17 dai). Classifica-tion of sugar beet rust was less exact (accuracy 62% 20 dai).
• A multi-temporal and multi-sensoral approach on different scales was usedin an experiment on the field scale in 2008. The experimental field site in-cluded two treatments, one plot was sprayed with fungicides and one plotwas untreated. E. betae, causing powdery mildew was the most frequent
145

leaf pathogen during the growing season. The vitality of the sugar beetplots was characterized by calculating the NDVI from airborne hyperspec-tral data (ROSIS and HyMap campaign, respectively). At growth stage45 healthy and diseased parts of the field could be differentiated; the co-efficient of determination to ground truth data was 0.69. A classificationof healthy and diseased sugar beets was possible at growth stage 49 bycalculating SVIs from canopy reflectance.
New insights from hyperspectral disease detection on sugar beet make a con-tribution to a better understanding of plant optical properties during diseasepathogenesis. Different analysis methods and sensor specificities can be trans-ferred and generalized for other plant-pathogen systems. It has been shown thathyperspectral near-range and remote sensing has the potential for an implemen-tation in precision crop protection applications. Moreover, the technologies maybe also used in plant pathology for investigating the effect of pathogenesis onthe cellular level.
146

REFERENCES
Adamchuk, V.I., Hummel, J.W., Morgan, M.T. and Upadhyaya, S.S. (2004).On-the-go soil sensors for precision agriculture. Computers and Electronicsin Agriculture, 44, 71–91.
Apan, A., Datt, B. and Kelly, R. (2005). Detection of pests and diseases in veg-etable crops using hyperspectral sensing: a comparison of reflectance data fordifferent sets of symptoms. In: Proceedings of SSC 2005 Spatial Intelligence,Innovation and Praxis: The national biennial Conference of the Spatial Sci-ence Institute, Melbourne 2005. Melbourne, pp. 10–18.
Archetti, M., Döring, T.R., Hagen, S.B., Hughes, N.M., Leather, S.R., Lee,D.W., Lev-Yadun, S., Manetas, Y., Ougham, H.J., Schaberg, P.G. andThomas, H. (2009). Unravelling the evolution of autumn colours: an in-terdisciplinary approach. Trends in Ecology and Evolution, 24, 166–173.
Ariana, D.P., Lu, R. and Guyer, D.E. (2006). Near-infrared hyperspectralreflectance imaging for the detection of bruises on pickling cucumbers. Com-puters and Electronics in Agriculture, 53, 60–70.
Asner, G. (1998). Biophysical and biochemical sources of variability in canopyreflectance. Remote Sensing of Environment, 64, 234–253.
Balachandran, S., Hurry, V.M., Kelly, C.B., Osmond, C.B., Robinson, S. A.amd Rohozinski, J., Seaton, G.G.R. and Sims, D.A. (1997). Concepts ofplant biotic stress. Some insights into the stress physiology of virus-infectedplants, from the perspective of photosynthesis. Physiologia Plantarum, 100,203–213.
147

REFERENCES
Balasundaram, D., Burks, T.F., Bulanon, D.M., Schubert, T. and Lee, W.S.(2009). Spectral reflectance characteristics of citrus canker and other peelconditions of grapefruit. Postharvest Biology and Technology, 51, 220–226.
Baranoski, G.V.G. and Rokne, J.G. (2001). Efficiently simulating scattering oflight by leaves. The Visual Computer, 17, 491–505.
Bauriegel, E., Beuche, H., Dammer, K., Giebel, A., Herppich, W., Intress, J.and Rodemann, B. (2009). Determination of head blight on ears of winterwheat by means of hyperspectral and chlorophyll fluorescence image analy-sis. In: E. van Henten, ed., 7th JIAC Conference. Wageningen AcademicPublisher, pp. 239–246.
Biliouris, D., Verstaeten, W.W., Dutre, P., van Aardt, J.A.N., Mys, B. andCoppin, P. (2007). A compact labroratory spectro-goniometer (CLabSpeG) toassess the BRDF of materials. Presentation, calibration and implementationon Fagus sylvativa L. leaves. Sensors, 7, 1846–1870.
Birth, S.G. and McVey, R.G. (1968). Measuring the color of growing turf witha reflectance spectrophotometer. Agronomy Journal, 60, 640–643.
Blackburn, G.A. (1998a). Quantifying chlorophylls and carotenoids at leaf andcanopy scale: an evaluation of some hyperspectral approaches. Remote Sens-ing of Environment, 66, 273–285.
Blackburn, G.A. (1998b). Spectral indices for estimating photosynthetic pig-ment concentrations: a test using senescent tree leaves. International Journalof Remote Sensing, 19, 657–675.
Blackburn, G.A. (2007). Hyperspectral remote sensing of plant pigments. Jour-nal of Experimental Botany, 58, 844–867.
Board, J.E., Maka, V., Price, R., Knight, D. and Baur, M.E. (2007). Deve-lopment of vegetation indices for identifying insect infestations in soybean.Agronomy Journal, 99, 650–656.
148

REFERENCES
Bock, C.H., Poole, G.H., Parker, P.E. and Gottwald, T.R. (2010). Plant diseaseseverity estimated visually, by digital photography and image analysis, andby hyperspectral imaging. Critical Reviews in Plant Science, 29, 59–107.
Bongiovanni, R. and Lowenberg-Deboer, J. (2004). Precision agriculture andsustainability. Precision Agriculture, 5, 359–387.
Boser, E.B. (1992). A training algorithm for optimal margin classifiers. In:D. Haussler, ed., Proceedings of the 5th Annual ACM Workshop on Compu-tational Learning Theory (COLT’92). pp. 144–152.
Bravo, C. (2006). Automatic foliar disease detection in winter wheat. Ph.D.thesis, University of Leuven.
Bravo, C., Moshou, D., West, J., McCartney, A. and Ramon, H. (2003). Earlydisease detection in wheat fields using spectral reflectance. Biosystems Engi-neering, 84, 137–145.
Brooks, F. and Miller, W. (1963). Availability of solar energy. In: A. Zarem andD. Erway, eds., Introduction to the utilization of solar energy. McGraw-Hill,New York, NY, USA, pp. 30—58.
Buschmann, C. and Lichtenthaler, H.K. (1998). Principles and characteristicsof multi-colour fluorescence imaging of plants. Journal of Plant Physiology,152, 297–314.
Camargo, A. and Smith, J.S. (2009a). Image pattern classification for theidentification of disease causing agents in plants. Computers and Electronicsin Agriculture, 66, 121–125.
Camargo, A. and Smith, J.S. (2009b). An image-processing based algorithm toautomatically identify plant disease visual symptoms. Biosystems Engineer-ing, 102, 9–21.
Carrol, M.W., Glaser, J.A., Hellmich, R.L., Hunt, T.E., Sappington, T.W.,Calvin, D., Copenhaver, K. and Fridgen, J. (2008). Use of spectral vegetation
149

REFERENCES
indices derived from airborne hyperspectral imagery for detection of Europeancorn borer infestation in Iowa corn plots. Journal of Economic Entomology,101, 1614–1623.
Carter, G.A. and Knapp, A.K. (2001). Leaf optical properties in higherplants: linking spectral characteristics to stress and chlorophyll concentra-tion. American Journal of Botany, 88, 677–684.
Carter, G.A. and Miller, R.L. (1994). Early detection of plant stress by digitalimaging with narrow stress-sensitive wavebands. Remote Sensing of Environ-ment, 50, 295–302.
Carter, G.A. and Spiering, B.A. (2002). Optical properties of intact leaves forestimating chlorophyll concentration. Journal of Environmental Quality, 31,1424–1432.
Ceccato, P., Flasse, S., Tarantola, S., Jacquemoud, S. and Gregoire, J.M.(2001). Detecting vegetation leaf water content using reflectance in the opticaldomain. Remote Sensing of Environment, 77, 22–33.
Chaerle, L., Hagenbeek, D., De Bruyne, E. and Van Der Straeten, D. (2007a).Chlorophyll fluorescence imaging for disease-resistance screening of sugarbeet. Plant Cell Tissue and Organ Culture, 91, 97–106.
Chaerle, L., Hagenbeek, D., De Bruyne, E., Vlacke, R. and Van der Straeten,D. (2004). Thermal and chlorophyll-fluorescence imaging distinguish plant-pathogen interactions at an early stage. Plant Cell Physiology, 45, 887–869.
Chaerle, L., Hagenbeek, D., Vanrobaeys, X. and Van der Straeten, D. (2007b).Early detection of nutrient and biotic stress in Phaseolus vulgaris. Interna-tional Journal of Remote Sensing, 28, 3479–3492.
Chaerle, L. and van der Straeten, D. (2001). Seeing is believing: imagingtechniques to monitor plant health. Biochimica et Biophysica Acta (BBA) —Gene Structure and Expression, 1519, 153–166.
150
REFERENCES
Chang, C.C. and Lin, J.C. (2001). LIBSVM: a library for support vectormachines. (accessed 10/2009).
Chapin, F.S.I. (1991). Integrated response of plant stress. BioScience, 4, 29–36.
Combal, B., Baret, F. and Weiss, M. (2002). Improving canopy variables es-timation from remote sensing data by exploiting ancillary information casestudy on sugar beet canopies. Agronomie, 22, 205–215.
Coops, N., Stanford, M., Old, K., Dudzinski, M., Culvenor, D. and Stone,C. (2003). Assessment of Dothistroma needle blight of Pinus radiata usingairborne hyperspectral imagery. Phytopathology, 93, 1524–1532.
Curran, P.J. (1989). Remote sensing of foliar chemistry. Remote Sensing ofEnvironment, 30, 271–278.
Dammer, K.H., Wollny, J. and Giebel, A. (2008). Estimation of the leaf areaindex in cereal crops for variable rate fungicide spraying. European Journalof Agronomy, 28, 351–360.
Dangl, J.L., Dietrich, R.A. and Richberg, M.H. (1996). Death don’t have nomercy: cell death programs in plant-microbe interactions. The Plant Cell, 8,1793–1807.
Danielsen, S. and Munk, L. (2004). Evaluation of disease assessment methodsin quinoa for their ability to predict yield loss caused by downy mildew. CropProtection, 23, 219–228.
Daub, M.E. and Ehrenshaft, M. (2000). The photoactivated Cercospora toxincercosporin: Contributions to plant disease and fundamental biology. AnnualReview of Phytopathology, 38, 461–490.
Daub, M.E., Herrero, S. and Taylor, T.V. (2010). Strategies for the developmentof resistance to cercosporin, a toxin produced by Cercospora species. In: R.T.Lartey, W.J. J., L. Panella, P.W. Crous and C.E. Windels, eds., Cercospora
151
REFERENCES
Leaf Spot of Sugar Beet and Related Species. The American PhytopathologicalSociety, St. Paul, Minnesota, USA, pp. 157–172.
Daughtry, C.S.T., Walthall, C.L., Kim, M.S., Brown de Colstoun, E. andMc Murtrey, J.E. (2000). Estimating corn leaf chlorophyll concentration fromleaf and canopy reflectance. Remote Sensing of Environment, 74, 229–239.
De Jong, S. and Van der Meer, E. (2006). Remote Sensing image Analysis:Including the Spatial Domain. Bookseries on Remote Sensing Digital ImageProcessing Vol.5. ISBN 1-4020-2559-9, (S.M. De Jong and E.D. Van der Meer,eds.). Kluwer Academic Publishers, Dordrecht, Netherlands.
Delalieux, S., van Aardt, J., Keulemans, W. and Coppin, P. (2005). Detectionof biotic stress (Venturia inaequalis) in apple trees using hyperspectral anal-ysis. In: B. Zagajewski, M. Soczal and M. Wrzesien, eds., Proceedings of the4th EARSel Workshop on Imaging Spectroscopy. Warsaw University, Warsaw,Poland, pp. 677–689.
Delalieux, S., Somers, B., Verstraeten, W.W., van Aardt, A.N.J., Keulemans,W. and Coppin, P. (2009). Hyperspectral indices to diagnose leaf biotic stressof apple plants, considering leaf phenology. International Journal of RemoteSensing, 30, 1887–1912.
Delalieux, S., van Aardt, J., Keulemans, W., Schrevens, E. and Coppin, P.(2007). Detection of biotic stress (Venturia inaequalis) in apple trees usinghyperspectral data: non-parametric statistical approaches and physiologicalimplications. European Journal of Agronomy, 27, 130–143.
Dennison, P.E., Halligan, K.Q. and Roberts, D.A. (2004). Comparison of errormetrics and constraints for multiple endmember spectral mixture analysis andspectral angle mapper. Remote Sensing of Environment, 93, 359–367.
Doraiswamy, P.C., Moulin, S., Cook, P.W. and Stern, A. (2003). Crop yieldassessment for remote sensing. Photogrammetric Engineering & Remote Sens-ing, 69, 665–674.
152

REFERENCES
Feindt, F., Mendgen, K. and Heitefuss, R. (1981). Feinstruktur unter-schiedlicher Zellwandreaktionen im Blattparenchym anfälliger und resisten-ter Rüben (Beta vulgaris L.) nach Infektion durch Cercospora beticola Sacc.Phytopathologische Zeitschrift, 101, 248–264.
Filella, I. and Peñuelas, J. (1994). The red edge position and shape as indicatorsof plant chlorophyll content, biomass and hydric status. International Journalof Remote Sensing, 15, 1459–1470.
Fitzgerald, G.J. (2004). Portable hyperspectral tunable imaging system(PHyTIS) for precision agriculture. Agronomy Journal, 96, 311–315.
Fourty, T., Baret, F., Jacquemoud, S., Schnuck, G. and Verdebout, J. (1996).Leaf optical properties with explicit description of its biochemical compo-sition: direct and inverse problems. Remote Sensing of Environment, 56,104–117.
Frahm, J., Volk, T. and Johnen, A. (1996). Development of the ProPlantdecision-support system for plant protection in cereals, sugarbeet and rape.Bulletin OEPP/EPPO, 26, 609–622.
Franc, G. (2010). Ecology and epidemiology of Cercospora beticola. In: R.T.Lartey, W.J. J., L. Panella, P.W. Crous and C.E. Windels, eds., CercosporaLeaf Spot of Sugar Beet and Related Species. The American PhytopathologicalSociety, St. Paul, Minnesota, USA, pp. 7–19.
Francis, S. (2002). Sugar-beet powdery mildew (Erysiphe betae). MolecularPlant Pathology, 3, 119–124.
Frank, T., Stinzing, F.C., Carle, R., Bitsch, I., Quaas, D., Straß, G., Bitsch,R. and Netzel, M. (2005). Urinary pharmacokinetics of betalains followingconsumption of red beet juice in healthy humans. Pharmacological Research,52, 290–297.
153

REFERENCES
Franke, J., Gebhardt, S., Menz, G. and Helfrich, H.P. (2009). Geostatisticalanalysis of the spatiotemporal dynamics of powdery mildew and leaf rust inwheat. Phytopathology, 99, 974–984.
Franke, J. and Menz, G. (2007). Multi-temporal wheat disease detection bymulti-spectral remote sensing. Precision Agriculture, 8, 161–172.
Galvao, L.S., Roberts, D.A., Formaggio, A.R., Numata, I. and Breunig, F.M.(2009). View angle effects on the discrimination of soybean varieties and onthe relationships between vegetation indices and yield using off-nadir Hyper-ion data. Remote Sensing of Environment, 113, 846–856.
Gamon, J.A., Derrana, L. and Surfus, J.S. (1997). The photochemical re-flectance index: an optical indicator of photosynthetic radiation use efficiencyacross species, functional types, and nutrient levels. Oecologia, 112, 492–501.
Gamon, J.A., Field, C.B., Goulden, M., Griffin, K., Hartley, A. and Joel, G.(1995). Relationships between NDVI, canopy structure, and photosyntheticactivity in three Californian vegetation types. Ecological Applications, 5, 28–41.
Gamon, J.A., Peñeulas, J. and Field, C.B. (1992). A narrow-waveband spectralindex that tracks diurnal changes in photosynthetic efficiency. Remote Sensingof Environment, 41, 35–44.
Gamon, J.A. and Surfus, J.S. (1999). Assessing leaf pigment content and ac-tivity with a reflectometer. New Phytologist, 143, 105–117.
Gaspar, T., Franck, T., Bisbis, B., Kevers, C., Jouve, L., Hasumann, J. andDommes, J. (2002). Concept in plant stress physiology. Application to planttissue cultures. Plant Growth Regulation, 37, 263–285.
Gebbers, R. and Adamchuk, V.I. (2010). Precision agriculture and food security.Science, 327, 828–831.
154
REFERENCES
Gerhards, R. and Christensen, S. (2003). Real-time weed detection, decisionmaking and patch spraying in maize, sugarbeet, winter wheat and winterbarley. Weed Research, 43, 385–392.
Gerhards, R. and Oebel, H. (2006). Practical experiences with a system forsite specific weed control in arable crops using real-time image analysis andGPS-controlled patch spraying. Weed Research, 46, 185–193.
Gitelson, A.A., Gritz, Y. and Merzylak, M.N. (2003). Relationships betweenleaf chlorophyll content and spectral reflectance and algorithms for non-destructive chlorophyll assessment in higher plant leaves. Journal of PlantPhysiology, 160, 271–282.
Gitelson, A.A., Kaufman, Y.J., Stark, R. and Rundquist, D. (2002). Novelalgorithms for remote estimation of vegetation fraction. Remote Sensing ofEnvironment, 80, 76–87.
Gitelson, A.A. and Merzlyak, M.N. (1994). Spectral reflectance changes asso-ciate with autumn senescence of Aesculus hippocastanum L. and Acer pla-tanoides L. leaves. Spectral features and relation to chlorophyll estimation.Journal of Plant Physiology, 143, 286–292.
Gitelson, A.A., Merzlyak, N.M. and Chivkunova, B.O. (2001). Opticalproperties and nondestructive estimation of anthocyanin content in plantleaves. Photochemistry and Photobiology, 74, 38–45.
Glawe, D.A. (2008). The powdery mildews: A review of the world’s most famil-iar (yet poorly known) plant pathogens. Annual Review of Phytopathology,46, 27–51.
Glazebrook, J. (2005). Contrasting mechanisms of defense against biotrophicand necrotrophic pathogens. Annual Review of Phytopathology, 43, 205–227.
Goodwin, S.B. and Dunkle, L.D. (2010). Cercosporin production in Cercosporaand related anamorphs. In: R.T. Lartey, W.J. J., L. Panella, P.W. Crous and
155

REFERENCES
C.E. Windels, eds., Cercospora Leaf Spot of Sugar Beet and Related Species.The American Phytopathological Society, St. Paul, Minnesota, USA, pp. 97–108.
Gordon, T.R. and Duniway, J.M. (1981). Effects of powdery mildew on theefficiency of CO2 fixation and light utilization of sugar beet leaves. PlantPhysiology, 69, 139–142.
Gould, K.S., Kuhn, D.N., Lee, D.W. and Oberbauer, S.F. (1995). Why leavesare sometimes red. Nature, 378, 241–242.
Govaerts, Y.M., Jacquemoud, S., Verstraete, M. and Ustin, S.L. (1996). Three-dimensional radiation transfer modeling in a dicotyledon leaf. Applied Optics,35, 6585–6598.
Graeff, S., Link, J. and Claupein, W. (2006). Identification of powdery mildew(Erysiphe graminis sp. tritici) and take-all disease (Gaeumannomyces grami-nis sp. tritici) in wheat (Triticum aestivum L.) by means of leaf reflectancemeasurements. Central European Journal of Biology, 1, 275–288.
Guyot, G. and Baret, F. (1988). Utilisation de la haute résolution spectralepour suivre l’état des couverts végétaux. In: Proc. 4th Int. Coll. SpectralSignatures of Objects in Remote Sensing, Aussois, France, ESA SP-287. pp.279–286.
Haboudane, D., Miller, J.R., Pattey, E., Zarco-Tejada, P. and Strachan, I.(2004). Hyperspectral vegetation indices and novel algorithms for predictinggreen LAI of crop canopies: modeling and validation in the context of preci-sion agriculture. Remote Sensing of Environment, 90, 337–352.
Hatfield, L.J., Gitelson, A.A., Schepers, S.J. and Walthall, L.C. (2008). Ap-plication of Spectral Remote Sensing for Agronomic Decisions. AgronomyJournal, 100, 117–131.
156
REFERENCES
Heath, M.C. (1997). Signalling between pathogenic rust fungi and resistant orsusceptible host plants. Annals of Botany, 80, 713–720.
Hillnhuetter, C. and Mahlein, A.K. (2008). Early detection and localisation ofsugar beet diseases: new approaches. Gesunde Pflanzen, 60, 143–149.
Hiscox, J.D. and Israelstam, G.F. (1979). A method for the extraction of chloro-phyll from leaf tissue without maceration. Canadian Journal of Botany, 57,1332–1334.
Hosgood, B. (1993). Leaf optical properties experiment 93 (LOPEX93),database structure. URL http://ies.jrc.ec.europa.eu/uploads/
fileadmin/H03/LOPEX_db_structure_V3.pdf, (accessed 30.07.2010).
Huang, W., Lamb, D.W., Niu, Z., Zhang, Y., Liu, L. and Wang, J. (2007).Identification of yellow rust in wheat using in situ spectral reflectance mea-surements and airborne hyperspectral imaging. Precision Agriculture, 8, 187–197.
Ioannidis, P. and Karaoglanidis, G. (2010). Control of Cercospora leaf spot andpowdery mildew of sugar beet with fungicides and tolerant cultivars. In: R.T.Lartey, W.J. J., L. Panella, P.W. Crous and C.E. Windels, eds., CercosporaLeaf Spot of Sugar Beet and Related Species. The American PhytopathologicalSociety, St. Paul, Minnesota, USA, pp. 7–19.
Jackson, R.D. and Pinter, P.J.J. (1986). Spectral response of architecturallydifferent wheat canopies. Remote Sensing of Environment, 20, 43–56.
Jacquemoud, S. and Baret, F. (1990). PROSPECT: a model of leaf opticalproperties spectra. Remote Sensing of Environment, 34, 75–91.
Jacquemoud, S., Verdebout, J., Schmuck, G., Andreoli, G. and Hosgood, B.(1995). Investigation of leaf biochemistry by statistics. Remote Sensing ofEnvironment, 54, 180–188.
157

REFERENCES
Jacquemoud, S. and Ustin, L.S. (2001). Leaf optical properties: a state of theart. In: 8th International Symposium of Physical Measurements & Signaturesin Remote Sensing. CNES, Aussois, France, pp. 223–332.
Jaggard, K.W., Qi, A. and Ober, E.S. (2009). Capture and use of solar ra-diation, water, and nitrogen by sugar beet (Beta vulgaris L.). Journal ofExperimental Botany, 60, 1919–1925.
Jensen, J.R. (2002). Remote sensing of the environment – An earth resourceperspective. [reprint.] edition. The MIT Press and MIT Press, Upper SaddleRiver, NJ, USA.
Jing, L., Jinbao, J., Yunhao, C., Yuanyuan, W., Wei, S. and Wenjiang, H.(2007). Using hyperspectral indices to estimate foliar chlorophyll a concen-trations of winter wheat under yellow rust stress. New Zealand Journal ofAgricultural Research, 50, 1031–1036.
Jones, D.G.J. and Dangl, L.J. (2006). The plant immune system. Nature, 444,323–329.
Jones, H.G., Archer, N., Rotenburg, E. and Casa, R. (2003). Radiation measure-ment for plant ecophysiology. Journal of Experimental Botany, 54, 879–889.
Jones, H.G. and Schofield, P. (2008). Thermal and other remote sensing ofplant stress. General and Applied Plant Physiology, 34, 19–32.
Kühbauch, W. and Hawlitschka, S. (2003). Remote sensing – a futuretechnology in precision farming. In: H. Lacoste, ed., Conference Proceedingsof the Workshop on POLinSAR – Applications of SAR Polarimetry andPolarimetric Interferometry (ESA SP-529). Frascati, Italy, p. 25.1.
Knerr, S., Personnaz, L. and Dreyfus, G. (1990). Single-layer learning revisited:a stepwise procedure for building and training a neural network. In: Neuro-computing: Algorithms, Architectures and Applications, F68 of NATO ASISeries. pp. 41–50.
158

REFERENCES
Knipling, B.E. (1970). Physical and physiological basis for reflectance of visbleand near-infrared radiation from vegetation. Remote Sensing of Environment,1, 155–159.
Knogge, W. (1996). Fungal infection of plants. Plant Cell, 8, 1711–1722.
Kobayashi, N., Schmidt, J., Nimtz, M., Wray, V. and Schliemann, W. (2000).Betalains from christmas cactus. Phytochemistry, 54, 419–426.
Kobayashi, T., Kanda, E., Kitada, K., Ishiguro, K. and Torigoe, Y. (2001).Detection of rice panicle blast with multispectral radiometer and the potentialof using airborne multispectral scanners. Phytopathology, 91, 316–323.
Kruse, F.A., Lefkoff, A.B., Boardman, J.W., Heidebrecht, K.B., Shapiro, A.T.,Barloon, P.J. and Goetz, A.F.H. (1993). The spectral image-processing sys-tem (Sips) – interactive visualization and analysis of imaging spectrometerdata. Remote Sensing of Environment, 44, 145–163.
Kruse, J.K., Christians, N.E. and Chaplin, M.H. (2006). Remote sensing ofnitrogen stress in creeping bentgrass. Agronomy Journal, 98, 1640–1645.
Lacis, A.A. and Hansen, J.E. (1973). A parameterization for the absorption ofsolar radiaton in the earths atmosphere. Journal of the Atmospheric Science,31, 118–133.
Larsolle, A. and Muhammed, H.H. (2007). Measuring crop status using multi-variate analysis of hyperspectral field reflectance with application to diseaseseverity and plant density. Precision Agriculture, 8, 37–47.
Lartey, R.T., Weiland, J.J. and Panella, L. (2010). Brief history of Cercosporaleaf spot, of sugar beet. In: R.T. Lartey, W.J. J., L. Panella, P.W. Crous andC.E. Windels, eds., Cercospora Leaf Spot of Sugar Beet and Related Species.The American Phytopathological Society, St. Paul, Minnesota, USA, pp. 1–5.
159

REFERENCES
Laudien, R., Bareth, G. and Doluschitz, R. (2003). Analysis of hyperspectralfield data for detection of sugar beet diseases. In: Proceedings of the EFITAConference. Debrecen (Hungary), pp. 375–381.
Le Maire, G., Francois, C. and Dufrene, E. (2004). Towards universal broad leafchlorophyll indices using PROSPECT simulated database and hyperspectralreflectance measurements. Remote Sensing of Environment, 89, 1–28.
Lee, D.W., OKeefe, J., Holbrook, N.M. and Field, T.S. (2003). Pigment dynam-ics and autumn leaf senescence in a New England deciduous forest, EasternUSA. Ecological Research, 18, 677–694.
Lenk, S., Chaerle, L., Pfündel, E., Langsdorf, G., Hagenbeek, D., Lichtenthaler,H., Van Der Straeten, D. and Buschmann, C. (2006). Mulit-colour fluores-cence and reflectance imaging at the leaf level and its possible applications.Journal of Experimental Botany, 58, 807–814.
Lenthe, J.H., Oerke, E.C. and Dehne, H.W. (2007). Digital thermography formonitoring canopy health of wheat. Precision Agriculture, 8, 15–26.
Levall, M.W. and Bornmann, J.F. (2000). Differential response of a sensitiveand tolerant sugarbeet line to Cercospora beticola infection and UV-B radia-tion. Physiologia Plantarum, 109, 21–27.
Lillesand, T.M. and Kiefer, R.W. (2000). Remote sensing and image interpre-tation. John Wiley & Sons, Inc., New York, NY, USA.
Lu, D., Mausel, P., Brondizio, E. and Moran, E. (2004). Change detectiontechniques. International Journal of Remote Sensing, 25, 2365–2401.
Luc, B., Deronde, B., Kempeneers, P., Debruyn, W. and Provoost, S. (2005).Optimized spectral angle mapper classification of spatially heterogeneous dy-namic dune vegetation, a case study along the Belgian coastline. In: S. Liang,ed., 9th International Symposium on Physical Measurements and Signaturesin Remote Sensing (ISPMSRS), October 17-19, 2005. Beijing, China.
160

REFERENCES
Magyarosy, A.C., Schürmann, P. and Buchanan, B.B. (1976). Effect of powderymildew infection on photosynthesis by leaves and chloroplasts of sugar beets.Plant Physiology, 57, 486–489.
Mahlein, A.K., Hillnhütter, C., Mewes, T., Scholz, C., Steiner, U., Dehne,H.W. and Oerke, E.C. (2009). Disease detection in sugar beet fields: a multi-temporal and multi-sensoral approach on different scales. In: C.M. Nealeand A. Maltese, eds., Proceedings of the SPIE Europe Conference on RemoteSensing, volume 7472. pp. 747228–747238–10.
Mahlein, A.K., Steiner, U., Dehne, H.W. and Oerke, E.C. (2010). Spectralsignatures of sugar beet leaves for the detection and differentiation of diseases.Precision Agriculture, 11, 413–431.
Malthus, T.J. and Madeira, A.C. (1993). High resolution spectroradiometry:spectral reflectance of field bean leaves infected by Botrytis fabae. RemoteSensing of Environment, 45, 107–116.
Meier, U., Bachmann, L., Buhtz, H., Hack, H., Klose, R., Märländer, B.and Weber, E. (1993). Phänologische Entwicklungsstadien der Beta-Rüben(Beta vulgaris L. ssp.). Codierung und Beschreibung nach der erweit-erten BBCH-Skala (mit Abbildungen). [Phenological growth stages of sugarbeet (Beta vulgaris L. ssp.). Codification and description according tothe general BBCH scale (with figures).]. Nachrichtenblatt DeutscherPflanzenschutzdienst, 45, 37–41.
Meigs, A.D., Otten, L.J. and Cherezova, T.Y. (2008). Ultraspectral imaging: anew contribution to global virtual presence. IEEE Aerospace and ElectronicSystems Magazine, 23, 11–17.
Melesse, A.M., Weng, Q., Thenkabail, P.S. and Senay, G.B. (2007). Remotesensing sensors and applications in environmental resources mapping andmodeling. Sensors, 7, 3209–3241.
161

REFERENCES
Mendgen, K. and Hahn, M. (2002). Plant interaction and the establishment offungal biotrophy. Trends in Plant Science, 7, 352–356.
Merzlyak, M.N., Gitelson, A.A., Chivkunova, O.B. and Rakitin, V.Y. (1999).Non-destructive optical detection of pigment changes during leaf senescenceand fruit ripening. Physiologica Plantarum, 106, 135–141.
Merzylak, M.N., Melo, T.B. and Naqvi, K.R. (2008). Effect of anthocyanins,carotenoids and flavonols on chlorophyll fluorescence excitation spectra inapple fruit: signature analysis, assessment, modeling, and relevance to pho-toprotection. Journal of Experimental Botany, 59, 349–359.
Moran, M.S., Inoue, Y. and Barnes, E.M. (1997). Opportunities and limita-tions for image-based remote sensing in precision crop management. RemoteSensing of Environment, 61, 319–346.
Moshou, D., Bravo, C., Wahlen, S., West, J., McCartney, A., Baerdemaeker,J. and Ramon, H. (2006). Simultaneous identification of plant stresses anddiseases in arable crops using proximal optical sensing and self-organisingmaps. Precision Agriculture, 7, 149–164.
Moshou, D., Bravo, C., West, J., Wahlen, S., McCartney, A. and Ramon, H.(2004). Automatic detection of yellow rust in wheat using reflectance mea-surements and neural networks. Computers and Electronics in Agriculture,44, 173–188.
Mucherino, A., Papajorgji, P. and Paradalos, M.P. (2009). A survey of datamining techniques applied to agriculture. Operational Research, 9, 121–140.
Murchie, E., Chen, Y.Z., Hubbart, S., Peng, S. and Horton, P. (1999). Inter-actions between senescence and leaf orientation determine in situ patterns ofphotosynthesis and photoinhibition in field-grown rice. Plant Physiology, 119,553–563.
162

REFERENCES
Naidu, A.R., Perry, M.E., Pierce, J.F. and Mekuria, T. (2009). The poten-tial of spectral reflectance technique for the detection of Grapevine leafroll-associated virus-3 in two red-berried wine grape cultivars. Computers andElectronics in Agriculture, 66, 38–45.
Nansen, C., Kolomiets, M. and Gao, X. (2008). Considerations regarding the useof hyperspectral imaging data in classifications of food products, exemplifiedby analysis off maize kernels. Journal of Agricultural and Food Chemistry,56, 2993–2938.
Nansen, C., Tulio, M., Swanson, R. and Weaver, D.K. (2009). Use of spatialstructure analysis of hyperspectral data cubes for detection of insect-inducedstress in wheat plants. International Journal of Remote Sensing, 30, 2447–2464.
Nash, E., Dreger, F., Schwarz, J., Bill, R. and Werner, A. (2009). Develop-ment of a model of datt-flows for precision agriculture base on a collaborativeresearch project. Computers and Electronics in Agriculture, 66, 25–37.
Nilsson, H.E. (1995). Remote sensing and image analysis in plant pathology.Annual Review of Phytopathology, 15, 489–527.
Nutter, F.W. and Littrell, R.H. (1996). Relationship between defoliation,canopy reflectance and pod yield in the peanut-late leafspot pathosytem. CropProtection, 15, 135–142.
Nutter, F.W.J., Littrell, R.H. and Brennemann, T.B. (1990). Utilization ofa multispectral radiometer to evaluate fungicide efficacy to control late leafspot in peanut. Phytopathology, 80, 102–108.
Nutter, F., van Rij, N., Eggenberger, S.K. and Holah, N. (2010). Spatial andtemporal dynamics of plant pathogens. In: E.C. Oerke, R. Gerhards, G. Menzand R.A. Sikora, eds., Precision Crop Protection – the Challenge and Use ofHeterogeneity. Springer, Dordrecht, Netherlands, pp. 27–50.
163
REFERENCES
Oerke, E.C. and Dehne, H.W. (2004). Safeguarding production losses in majorcrops and the role of crop protection. Crop Protection, 23, 275–285.
Oerke, E.C., Steiner, U., Dehne, H.W. and Lindenthal, M. (2006). Thermalimaging of cucumber leaves affected by downy mildew and environmentalconditions. Journal of Experimental Botany, 57, 2121–2132.
Oppelt, N. and Mauser, W. (2004). Hyperspectral monitoring of physiologicalparameters of wheat during a vegetation period using AVIS data. Interna-tional Journal of Remote Sensing, 25, 145–159.
Park, B., Windham, W.R., Lawrence, K.C. and Smith, D.P. (2007). Conta-minant classification of poultry hyperspectral imagery using a Spectral AngleMapper algorithm. Biosystems Engineering, 96, 323–333.
Peterson, R.B. and Aylor, D.E. (1995). Chlorophyll fluorescence induction inleaves of Phaseolous vulgaris infected with bean rust (Uromyces appendicu-latus). Plant Physiology, 108, 163–171.
Peñuelas, J., Baret, F. and Filella, I. (1995). Semiempirical indices to assesscarotenoids/chlorophyll a ratio from leaf spectral reflectance. Photosynthetica,31, 221–230.
Peñuelas, J. and Filella, I. (1998). Visible and near-infrared reflectance tech-niques for diagnosing plant physiological status. Trends in Plant Science, 3,151–156.
Peñuelas, J., Pinol, R.O., Ogaya, R. and Filella, I. (1997). Estimation of plantwater concentration by the reflectance Water Index WI (R900/R970). Inter-national Journal of Remote Sensing, 18, 2869–2875.
Piatelli, M. and Minale, L. (1964). Pigments of Centrospermae-II. Distributionof betacyanins. Phytochemistry, 3, 547–557.
164
REFERENCES
Pietrzykowski, E., Stone, C., Pinkard, E. and Mohammed, C. (2006). Effects ofMycosphaerella leaf disease on the spectral reflectance properties of juvenileEucalyptus globules foliage. Forest Pathology, 36, 334–348.
Pinter, P.J., Hatfield, J.L., Schepers, J.S., Barnes, E.M., Moran, M.S.,Daugthry, C.S.T. and Upchurch, D.R. (2003). Remote sensing for cropmanagement. Photogrammetric Engineering and Remote Sensing, 69, 647–664.
Pinty, B., Verstraeten, M.M. and Gobron, N. (1998). The effect of soilanisotropy on the radiance field emerging from vegetation canopies. Geo-physical Research Letters, 25, 797–800.
Pitblado, R. and Nichols, I. (2005). The implementation of BEETCAST - aweather-timed fungicide spray program for the control of Cercospora leaf spotin Ontario and Michigan. Journal of Sugar Beet Research, 42, 53–54.
Plaza, A., Benediktsson, J.A., Boardman, J.W., Brazile, J., Bruzzone, L.,Camps-Valls, G., Chanussot, J., Fauvel, M., Gamba, P., Gualtieri, A., Ma-concini, M., Tilton, J. and Trianni, G. (2009). Recent advances in techniquesfor hyperspectral image processing. Remote Sensing of Environment, 113,110–122.
Polder, G., van der Heijden, G.W.A.M., van Doorn, J., Clevers, J.G.P.W.,van der Schoor, R. and Baltissen, A.H.M.C. (2010). Detection of the tulipbreaking virus (TBV) in tulips using optical sensors. Precision Agriculture,11, 397–412.
Qin, J., Burks, T.F., Ritenour, M.A. and Bonn, W.G. (2009). Detection ofcitrus canker using hyperspectral reflectance imaging with spectral informa-tion divergence. Journal of Food Engineering, 93, 183–191.
Racca, P. and Jörg, E. (2007). CERCBET 3 – a forecaster for epidemicdevelopment of Cercospora beticola. Bulletin OEPP/EPPO, 37, 344–349.
165

REFERENCES
Rascher, U., Damm, A., van der Linden, S., Okujeni, A., Pieruschka, R., Schick-ling, A. and Hostert, P. (2010). Sensing of photosynthetic activity of crops.In: E.C. Oerke, R. Gerhards, G. Menz and R.A. Sikora, eds., Precision CropProtection – the Challenge and Use of Heterogeneity. Springer, Dordrecht,Netherlands, pp. 87–100.
Rascher, U., Liebig, M. and Lüttge, U. (2000). Evaluation of instant light-response curves of chlorophyll fluorescence fluorometer on site in the field.Plant, Cell and Environment, 23, 1397–1405.
Reichardt, M., Jürgens, C., Klöble, U., Hüter, J. and Moser, K. (2009). Dis-semination of Precision farming in Germany: acceptance, adoption, obstacles,knowledge transfer and training activities. Precision Agriculture, 10, 525–545.
Rhodes, D. and Nadolska-Orczyk, A. (2001). Plant stress physiology. Encyclo-pedia of Life Science, DOI: 10.1038/npg.els.0001297 (accessed 13.10.2010).
Richardson, A.D., Duigan, S.P. and Berlyn, G.P. (2001). An evaluation ofnoninvasive methods to estimate foliar chlorophyll content. New Phytologist,153, 185–194.
Rondeux, G., Steven, M. and Baret, F. (1996). Optimising of soil-adjustedvegetation indices. Remote Sensing of Environment, 55, 95–107.
Rouse, J.W., Haas, R.H., Schell, J.A. and Deering, D.W. (1974). Monitoringvegetation systems in the Great Plains with ERTS. In: Proc. 3th EarthResources Technology Satellite-1 Symposium. Greenbelt, MD NASA, pp. 301–317.
Rumpf, T., Mahlein, A.K., Steiner, U., Oerke, E.C., Dehne, H.W. and Plümer,L. (2010). Early detection and classification of plant diseases with Sup-port Vector Machines based on hyperspectral reflectance. Computers andElectronics in Agriculture, 74, 91–99.
166
REFERENCES
Rumpf, T., Mahlein, A.K., Dörschlag, D. and Plümer, L. (2009). Identificationof combined vegetation indices for the early detection of plant diseases. In:Proceedings of the SPIE Conference on Sensing for Agriculture, Ecosystemsand Hydrology. pp. 747217–747227.
Sasaki, Y., Okamoto, T., Imou, K. and Torii, T. (1998). Automatic diagno-sis of plant disease: spectral reflectance of healthy and diseases leaves. In:Proceedings AgEng98 Conference, Oslo. p. 6.
Savitzky, A. and Golay, J.M.E. (1964). Smoothing and differentiation of databy simplified least squares procedures. Analytical Chemistry, 36, 1627–1639.
Schellberg, J., Hill, M., Gerhards, R., Rothmund, M. and Braun, M. (2008).Precision agriculture on grassland: applications, perspectives and constraints.European Journal of Agronomy, 29, 59–71.
Scholes, J.D. and Rolfe, S.A. (1996). Photosynthesis in localized regions of oatleaves infected with crown rust (Puccinia coronate): quantitative imaging ofchlorophyll fluorescence. Planta, 199, 537–582.
Schölkopf, B. and Smola, J.A. (2002). Learning with Kernels: Support VectorMachines, Regularization, Optimization, and Beyond: Support vector ma-chines, regularization, optimization, and beyond. [reprint.] edition. The MITPress and MIT Press, Cambridge, MA (USA). ISBN 0262194759.
Scholten, J., Klein, M., Steemers, A. and de Bruin, G. (2005). Hyperspec-tral imaging – a novel non-destructive analytical tool in paper and writingdurability research. In: C. Parisi, G. Buzzanca and A. Paradisi, eds., 8thInternational Conference on Non-Destructive Investigations and Microanal-ysis for the Diagnostics and Conservation of the Cultural and EnvironmentalHeritage.
Scotford, I. and Miller, P. (2005). Applications of spectral reflectance techniquesin northern European cereal production: a review. Biosystems Engineering,90, 235–250.
167

REFERENCES
Segl, K., Roessner, S., Heiden, U. and Kaufmann, H. (2003). Fusion of spectraland shape features for identification of urban surface cover types using reflec-tive and thermal hyperspectral data. ISPRS Journal of Photogrammetry andRemote Sensing, 58, 99–112.
Shafri, H.Z.M. and Ezzat, M.S. (2009). Quantitative performance of spectralindices in large scale plant health analysis. American Journal of AppliedScience, 4, 187–191.
Shafri, H.Z.M. and Hamdan, N. (2009). Hyperspectral imagery for mappingdisease infection in oil palm plantation using vegetation indices and red edgetechniques. American Journal of Applied Science, 6, 1031–1035.
Sims, D.A. and Gamon, J.A. (2002). Relationship between leaf pigment contentand spectral reflectance across a wide range of species, leaf structures anddevelopmental stages. Remote Sensing of Environment, 81, 337–354.
Singh, A. (1989). Digital change detection techniques using remotely-senseddata. International Journal of Remote Sensing, 10, 989–1003.
Smith, K.L., Steven, M.D. and Colls, J.J. (2004). Use of hyperspectral deriva-tive ratios in the red-edge region to identify plant stress response to gas leaks.Remote Sensing of Environment, 92, 207–217.
Stafford, J.V. (2000). Implementing precision agriculture in the 21st Century.Journal of Agricultural Engineering Research, 76, 267–275.
Steddom, K., Bredehoeft, W.M., Khan, M. and Rush, M.C. (2005). Comparisonof visual and multispectral radiometric disease evaluations of Cercospora leafspot of sugar beet. Plant Disease, 89, 153–158.
Steddom, K., Heidel, G., Jones, D. and Rush, C.M. (2003). Remote detectionof rhizomania in sugar beets. Phytopathology, 93, 720–726.
Steiner, U., Bürling, K. and Oerke, E.C. (2008). Sensor use in plant protection.Gesunde Pflanzen, 60, 131–141.
168

REFERENCES
Steinkamp, M.P., Martin, S.S., Hoefert, L.L. and Ruppel, E.G. (1979). Ultra-structure of lesions produced by Cercospora beticola in leaves of Beta vulgaris.Physiological Plant Pathology, 15, 13–16.
Thenkabail, P.S., Smith, R.B. and De Pauw, E. (2000). Hyperspectralvegetation indices and their relationship with agricultural crop characteris-tics. Remote Sensing of Environment, 71, 158–182.
Ustin, S.L., Gitelson, A.A., Jaquemoud, S., Schaepman, M., Asner, G.P., Ga-mon, J.A. and Zarco-Tejada, P. (2009). Retrieval of foliar information aboutplant pigment systems from high resolution spectroscopy. Remote Sensing ofEnvironment, 113, 67–77.
Ustin, S.L., Roberts, D.A., Gamon, J.A., Asner, G.P. and Green, R.O. (2004).Using imaging spectroscopy to study ecosystem processes and properties. BioScience, 54, 523–534.
Van Cleef, E. (1915). The sugar beet in Germany, with special attention toits relation to climate. Bulletin of the American Georgraphical Society, 47,241–258.
Van Kan, J.A.L. (2006). Licensed to kill: the lifestyle of a necrotrophic plantpathogen. Trends in Plant Science, 11, 247–253.
Van der Meer, F., de Jong, S. and Bakker, W. (2001). Imaging spectrom-etry: basic analytical techniques. In: F. Van der Meer and M. de Jong,eds., Imaging Spectrometry; Basic Principles and Prospective Applications.Springer, Dordrecht, Netherlands, pp. 17–60.
Vapnik, N.V. (1982). Estimation of dependences based on empirical data.Springer-Verlag, New York, NY. ISBN 3540907335.
Vapnik, N.V. (2000). The nature of statistical learning theory. 2nd edition.Statistics for engineering and information science, Springer-Verlag, New York.ISBN 0387987800.
169
REFERENCES
Vereijsssen, J., Schneider, J.H.M., Stein, A. and Jeger, M.J. (2006). Spatialpattern of Cercospora leaf spot of sugar beet in fields in long- and recently-established areas. European Journal of Plant Pathology, 116, 187–198.
Vollenweider, P. and Günthard-Georg, M.S. (2005). Diagnosis of abiotic andbiotic stress factors using the visible symptoms in foliage. EnvironmentalPollution, 137, 455–465.
Von Witzke, H., Noleppa, S. and Schwarz, G. (2008). Global agricultural mar-ket trends and their impacts on European agriculture. In: Working Paper84, Humboldt Universitity Berlin. URL http://www.agrar.hu-berlin.de/
struktur/institute/wisola/publ/wp, (accessed 13.06.2008).
Voss, K., Franke, J., Mewes, T., Menz, G. and Kühbauch, W. (2010). Remotesensing for precision crop protecion – a matter of scale. In: E.C. Oerke,R. Gerhards, G. Menz and R.A. Sikora, eds., Precision Crop Protection – theChallenge and Use of Heterogeneity. Springer, Dordrecht, Netherlands, pp.101–118.
Wang, X., Zhang, M., Zhu, J. and Geng, S. (2008). Spectral prediction ofPhytophthora infestans infection on tomatoes using artificial neural network(ANN). International Journal of Remote Sensing, 29, 1693–1706.
Weiland, J. and Koch, G. (2004). Sugarbeet leaf spot disease (Cercosporabeticola Sacc.). Molecular Plant Pathology, 5, 157–166.
Weiland, J.J., Chung, K.R. and Suttle, J.C. (2010). The role of cercosporinin the virulence of Cercospora spp. to plant hosts. In: R.T. Lartey, W.J. J.,L. Panella, P.W. Crous and C.E. Windels, eds., Cercospora Leaf Spot of SugarBeet and Related Species. The American Phytopathological Society, St. Paul,Minnesota, USA, pp. 109–118.
West, S.J., Bravo, C., Oberti, R., Lemaire, D., Moshou, D. and McCartney,H.A. (2003). The potential of optical canopy measurement for targeted controlof field crop diseases. Annual Review of Phytopathology, 41, 593–614.
170
REFERENCES
West, S.J., Bravo, C., Oberti, R., Moshou, D., Ramon, H. and McCartney,H.A. (2010). Detection of fungal diseases optically and pathogen inoculumby air sampling. In: E.C. Oerke, R. Gerhards, G. Menz and R.A. Sikora,eds., Precision Crop Protection – the Challenge and Use of Heterogeneity.Springer, Dordrecht, Netherlands, pp. 135–149.
Windels, C.E. (2010). Cercospora leaf spot prediction models in North America.In: R.T. Lartey, W.J. J., L. Panella, P.W. Crous and C.E. Windels, eds.,Cercospora Leaf Spot of Sugar Beet and Related Species. The American Phy-topathological Society, St. Paul, Minnesota, USA, pp. 235–250.
Wolf, P.F.J. (2001). Über die Integration von Bekämpfungsmaßnahmengegen pilzliche Blattkrankheiten der Zuckerrübe – IPS-Modell Zuckerrübe.Habilitationsschrift. Shaker Verlag.
Wolf, P.F.J. and Verreet, A.J. (2002). The IPM sugar beet model, an integratedpest management system in Germany for the control of fungal leaf diseasesin sugar beet. Plant Disease, 86, 336–344.
Wolf, P.F.J. and Verreet, J.A. (2010). Quaternary concept of integrated pestmanagement (IPM) developed for the control of Cercospora leaf spot in sugarbeet. In: R.T. Lartey, W.J. J., L. Panella, P.W. Crous and C.E. Windels,eds., Cercospora Leaf Spot of Sugar Beet and Related Species. The AmericanPhytopathological Society, St. Paul, Minnesota, USA, pp. 223–233.
Wu, D., Feng, L., Zhang, C. and He, Y. (2008a). Early detection of Botrytiscinerea on eggplant leaves based on visible and near-infrared spectroscopy.Transactions of the ASABE, 51, 113–1139.
Wu, X., Kumar, V., Quinlan, J.R., Ghosh, J., Yang, Q., Motoda, H., McLach-lan, G.J., Ng, A., Liu, B., Yu, P.S., Zhou, Z.H., Steinbach, M., Hand, D.J.and Steinberg, D. (2008b). Top 10 algorithms in data mining. Knowledge andInformation Systems, 14, 1–37.
171

REFERENCES
Xing, J., Saeys, W. and De Baerdemaeker, J. (2007). Combination of chemo-metric tools and image processing for bruise detection on apples. Computersand Electronics in Agriculture, 56, 1–13.
Xu, H.R., Xing, Y.B., Fu, X.P. and Zhu, S.P. (2007). Near-infrared spectroscopyin detecting leaf miner damage on tomato leaf. Biosystems Engeneering, 96,447–454.
Yang, C.M., Cheng, C.H. and Chen, R.K. (2007). Changes in spectral charac-teristics of rice canopy infested with brown planthopper and leaffolder. CropScience, 47, 329–335.
Yuhas, R.H., Goetz, A.F.H. and Boardman, J.W. (1992). Discrimination amongsemi-arid landscape endmembers using the spectral angle mapper (SAM) al-gorithm. In: Summaries of the 4th JPL Airborne Earth Science Workshop,JPL Publication 92-41. pp. 147–149.
Zarco-Tejada, P.J., Berjon, A., Lopez-Lozana, R., Miller, J.R., Martin, P.,Cachorro, V., Gonzalez, M.R. and de Frutos, A. (2005). Assessing vineyardconditions with hyperspectral indices: leaf canopy reflectance simulation ina row structured discontinuous canopy. Remote Sensing of Environment, 99,271–287.
Zhang, M., Qin, Z., Liu, X. and Ustin, S. (2003). Detection of stress in tomatoesinduced by late blight disease in California, USA, using hyperspectral remotesensing. Applied Earth Observation and Geoinformation, 4, 295–310.
Zhang, N., Wang, M. and Wang, N. (2002). Precision agriculture – a worldwideoverview. Computers and Electronics in Agriculture, 36, 113–32.
172
Danksagung
An dieser Stelle möchte ich mich bei all denjenigen bedanken, die mir währendder Erstellung meiner Dissertation in vielfältiger Weise zur Seite gestandenhaben.
Mein besonderer Dank gilt Herrn Prof. Dr. H.-W. Dehne vom INRES-Phytomedizin der Universität Bonn der mir die Möglichkeit gegeben hat andieser Thematik zu arbeiten. Besonders bedanke ich mich für das mir entge-gengebrachte große Vertrauen und die mir gewährte Selbstständigkeit.
An dieser Stelle möchte ich auch Herrn Prof. Dr. H. Goldbach vom INRES-Pflanzenernährung der Universität Bonn ganz herzlich für sein Interesse anmeiner Arbeit und für die Übernahme des Korreferates danken.
Sehr herzlich möchte ich mich bei Herrn PD Dr. E.-C. Oerke und Frau PDDr. U. Steiner bedanken, die durch ihre unermüdliche Bereitschaft zur Beant-wortung von Fragen, durch ihre vielfältigen Anregungen und mit konstrukti-ver Kritik das Entstehen dieser Arbeit maßgeblich beeinflusst haben. In vielenfreundschaftlichen Diskussionen haben sie mir engagiert und äußerst herzlichzur Seite gestanden.
Ich danke allen Mitarbeitern und Doktoranden des Instituts für die kollegia-le Zusammenarbeit und für die angenehme Arbeitsathmosphäre. Insbesondere
danke ich Kerstin, Stefan, Gisela, Inge, Carlos und Raffaello, sowie Frau I. Si-kora und Herrn PD. Dr. J. Hamacher für die vielfältige Unterstützung.
Ein großer Dank geht an die Mitglieder des DFG-Graduiertenkollegs 722 füreinen wertvollen Gedanken- und Erfahrungsaustausch sowie für die schöne Zeitauf gemeinsamen Reisen. Besonders möchte ich Thorsten Mewes danken, dermir die spannende Thematik ’hyperspektrale Sensoren’ näher gebracht hat.Hannes Feilhauer danke ich für die gemeinsamen ASD-Messungen. Till Rumpfdanke ich für das fachbereichübergreifende Arbeiten zur Optimierung der Aus-wertung hyperspektraler Daten und für die Unterstützung bei der Fertigstellungmeiner Dissertation.
Dieses Projekt wurde im Rahmen des DFG-Graduiertenkollegs 722 „Use of In-formation Technologies for Precision Crop Protection“ durchgeführt. Der DFGdanke ich für die finanzielle Unterstützung.
Ich danke meiner Familie und meinen Freunden dafür dass es sie gibt!
Vielen Dank Christine und Christian, dass ich das Abenteuer Doktorarbeit miteuch zusammen erleben durfte – unsere entspannten und amüsanten Mittags-pausen waren einmalig.
Dass jedes Abenteuer auch schöne Überraschungen mit sich führt hat mir dieM16 in den letzten Jahren eindrucksvoll gezeigt – Ella, Uli, Kati und Cayenne– die gemeinsame Zeit mit euch ist unersetzbar!
Anne danke für Alles.
Meinen Eltern und meinem Bruder Johannes werde ich immer ganz besondersdankbar sein für die bedingungslose Unterstützung und dafür, dass sie an michglauben.
Related Documents