1 Detection, characterization and inhibition of FGFR-TACC fusions in IDH wild type glioma Anna Luisa Di Stefano 1,2,3 , Alessandra Fucci 4 , Veronique Frattini 4 , Marianne Labussiere 1 , Karima Mokhtari 1,5,6 ,Pietro Zoppoli 4 , Yannick Marie 1,7 , Aurelie Bruno 1 , Blandine Boisselier 1 , Marine Giry 1 , Julien Savatovsky 8 , Mehdi Touat 9 , Hayat Belaid 10 , Aurelie Kamoun 11 , Ahmed Idbaih 2 , Caroline Houillier 2 , Feng R. Luo 12 , Jean-Charles Soria 9 , Josep Tabernero 13 , Marica Eoli 14 , Rosina Paterra 14 , Stephen Yip 15 , Kevin Petrecca 16 , Jennifer A. Chan 17 , Gaetano Finocchiaro 14 , Anna Lasorella 4,18 ,Marc Sanson 1,2,5 and Antonio Iavarone 4,19 . Authors Affiliation: ¹Sorbonne Universités UPMC Univ Paris 06, INSERM CNRS, U1127, UMR 7225, ICM, F-75013 Paris, France. ²AP-HP, Groupe Hospitalier Pitié-Salpêtrière, Service de Neurologie 2, Paris 75013, France. ³Department of Brain and Behavioral Sciences, University of Pavia, 27100, Pavia ⁴Institute for Cancer Genetics, Columbia University Medical Center, New York, NY. ⁵AP-HP, Groupe Hospitalier Pitié Salpêtrière, Laboratoire de Neuropathologie R Escourolle, Paris 75013, France. ⁶AP-HP Onconeurothèque, Groupe Hospitalier Pitié-Salpêtrière, Paris, France. ⁷Institut du Cerveau et de la Moelle épinière (ICM), Plateforme de Génotypage Séquençage, Paris 75013, France. ⁸Fondation Ophtalmologique A. de Rothschild, Paris, France. ⁹Drug Development Department, Gustave Roussy Cancer Center, Paris, France. ¹⁰AP-HP, Groupe Hospitalier Pitié Salpêtrière, Department of Neurosurgery, Paris 75013, France. ¹¹Programme Cartes d’Identité des Tumeurs (CIT), Ligue Nationale Contre Le Cancer, Paris, France. ¹²Janssen Pharmaceutical Companies of Johnson & Johnson, Titusville, NJ. ¹³Vall d'Hebron University Hospital and Vall d'Hebron Institute of Oncology (VHIO), Universitat Autònoma de Barcelona, Barcelona, Spain. ¹⁴Fondazione I.R.C.C.S Istituto Neurologico C. Besta, Milan, Italy. ¹⁵Department of Pathology & Laboratory Medicine, University of British Columbia, Vancouver, Canada. ¹⁶Montreal Neurological Institute and Hospital, McGill University, Montreal, Canada. ¹⁷University of Calgary, Calgary, Canada. ¹⁸Department of Pediatrics and Pathology, Columbia University Medical Center, New York, NY. 19 Department of Neurology and Pathology, Columbia University Medical Center, New York, NY. Both A.L. Di Stefano and A. Fucci contributed equally to this work. Running title: FGFR-TACC identification and inhibition in glioma patients Key words: glioma, FGFR3-TACC3 fusion, IDH wild type, target therapy.

Welcome message from author
This document is posted to help you gain knowledge. Please leave a comment to let me know what you think about it! Share it to your friends and learn new things together.
Transcript
1
Detection, characterization and inhibition of
FGFR-TACC fusions in IDH wild type glioma
Anna Luisa Di Stefano1,2,3, Alessandra Fucci4, Veronique Frattini4, Marianne Labussiere1, Karima
Mokhtari1,5,6 ,Pietro Zoppoli4, Yannick Marie1,7, Aurelie Bruno1, Blandine Boisselier1, Marine Giry1,
Julien Savatovsky8, Mehdi Touat9, Hayat Belaid10, Aurelie Kamoun11, Ahmed Idbaih2, Caroline
Houillier2, Feng R. Luo12, Jean-Charles Soria9, Josep Tabernero13, Marica Eoli14, Rosina Paterra14,
Stephen Yip15, Kevin Petrecca16, Jennifer A. Chan17, Gaetano Finocchiaro14, Anna Lasorella4,18,Marc
Sanson1,2,5 and Antonio Iavarone4,19.
Authors Affiliation: ¹Sorbonne Universités UPMC Univ Paris 06, INSERM CNRS, U1127, UMR 7225, ICM, F-75013 Paris, France.
²AP-HP, Groupe Hospitalier Pitié-Salpêtrière, Service de Neurologie 2, Paris 75013, France.
³Department of Brain and Behavioral Sciences, University of Pavia, 27100, Pavia
⁴Institute for Cancer Genetics, Columbia University Medical Center, New York, NY.
⁵AP-HP, Groupe Hospitalier Pitié Salpêtrière, Laboratoire de Neuropathologie R Escourolle, Paris 75013, France.
⁶AP-HP Onconeurothèque, Groupe Hospitalier Pitié-Salpêtrière, Paris, France.
⁷Institut du Cerveau et de la Moelle épinière (ICM), Plateforme de Génotypage Séquençage, Paris 75013, France.
⁸Fondation Ophtalmologique A. de Rothschild, Paris, France.
⁹Drug Development Department, Gustave Roussy Cancer Center, Paris, France.
¹⁰AP-HP, Groupe Hospitalier Pitié Salpêtrière, Department of Neurosurgery, Paris 75013, France.
¹¹Programme Cartes d’Identité des Tumeurs (CIT), Ligue Nationale Contre Le Cancer, Paris, France.
¹²Janssen Pharmaceutical Companies of Johnson & Johnson, Titusville, NJ.
¹³Vall d'Hebron University Hospital and Vall d'Hebron Institute of Oncology (VHIO), Universitat Autònoma de Barcelona,
Barcelona, Spain. ¹⁴Fondazione I.R.C.C.S Istituto Neurologico C. Besta, Milan, Italy.
¹⁵Department of Pathology & Laboratory Medicine, University of British Columbia, Vancouver, Canada.
¹⁶Montreal Neurological Institute and Hospital, McGill University, Montreal, Canada.
¹⁷University of Calgary, Calgary, Canada.
¹⁸Department of Pediatrics and Pathology, Columbia University Medical Center, New York, NY. 19
Department of Neurology and Pathology, Columbia University Medical Center, New York, NY.
Both A.L. Di Stefano and A. Fucci contributed equally to this work.
Running title: FGFR-TACC identification and inhibition in glioma patients
Key words: glioma, FGFR3-TACC3 fusion, IDH wild type, target therapy.
2
Financial Support: This work was supported by National Cancer Institute grants R01CA101644 and
R01CA131126 (to A. Lasorella), R01CA178546 (to A. Iavarone), National Institute of Neurological
Disorders and Stroke R01NS061776 (to A. Iavarone) and a grant from The Chemotherapy
Foundation (to A.Iavarone), the French national program Cartes d'Identité des Tumeurs (CIT)
(http://cit.ligue-cancer.net/) (to M.Sanson), the Association pour la Recherche sur les Tumeurs
cérébrales (ARTC) (to M.Sanson). The research leading to these results received funding from the
program “Investissements d’avenir” ANR-10-IAIHU-06. A.Fucci is supported by a fellowship from the
Italian Ministry of Welfare/Provincia di Benevento. V.Frattini is supported by a fellowship from the
American Brain Tumor Association (ABTA). A.L. Di Stefano was supported by the Fondation ICM
and PRIN 2010-2011, 2010ZESJWN_008. S.Yip is supported by the mentored scientist award from
the Vancouver Coastal Health Research Institute (VCHRI). Banking and distribution of brain tumor
samples from UBC is made possible by generous financial support of BrainCare BC.
Corresponding Authors: Marc Sanson, Groupe Hospitalier Pitié-Salpêtrière, 47 Boulevard de
l’Hôpital, cedex 13, 75651, Paris, France; e-mail: [email protected]; Tel. +33-142
160573/Fax +33-142-160375. Antonio Iavarone, Institute for Cancer Genetics-Columbia University
Medical Center, 1130 St.Nicholas Ave, 10032 New York (NY); e-mail: [email protected]; Tel +1
212 851 5245/Fax +1 212 851 5267.
Disclosure of Potential Conflict of Interest. Consultant or Advisory Role: Jean-Charles Soria,
Amgen, Lilly, Clovis, Servier, Novartis, Roche/Genentech, Sanofi, Celgene, Taiho Pharmaceutical;
Josep Tabernero, Amgen, ImClone Systems, Lilly, Merck KGaA, Millennium Takeda, Novartis,
Roche/Genentech, Sanofi, Celgene, Chugai Pharma, Taiho Pharmaceutical. Research Funding:
Antonio Iavarone, Astra Zeneca; Anna Lasorella, Astra Zeneca.
3
STATEMENT OF TRANSLATIONAL RELEVANCE
This manuscript reports an unbiased screening assay for FGFR-TACC fusions in glioma that
overcomes the great variability of variants that are generated by FGFR-TACC chromosomal
translocation in human cancer. FGFR-TACC fusions occur in grade II and III glioma harboring wild-
type IDH1 with frequency similar to glioblastoma (GBM), therefore providing a clue to the aggressive
clinical behavior of this glioma subtype. The molecular characterization of fusion-positive glioma
revealed that FGFR-TACC is mutually exclusive with EGFR amplification but co-occurs with CDK4
amplification. FGFR-TACC-positive glioma displays strikingly uniform and strong expression of the
fusion protein at the single cell level. Preclinical experiments with FGFR3-TACC3-positive glioma
cells treated with the FGFR inhibitor JNJ-42756493 showed strong antitumor effects and treatment
of two patients with recurrent GBM harboring FGFR3-TACC3 resulted in clinical improvement and
radiological tumor reduction. These findings validate the treatment with FGFR inhibitors of glioma
patients harboring FGFR-TACC chromosomal translocations.
4
ABSTRACT
Purpose
Oncogenic fusions consisting of FGFR and TACC are present in a subgroup of glioblastoma (GBM)
and other human cancers and have been proposed as new therapeutic targets. We analyzed
frequency, molecular features of FGFR-TACC fusions, and explored the therapeutic efficacy of
inhibiting FGFR kinase in GBM and grade-II-III glioma.
Experimental Design
Overall, 795 gliomas (584 GBM, 85 grade-II-III with wild-type and 126 with IDH1/2 mutation) were
screened for FGFR-TACC breakpoints and associated molecular profile. We also analyzed
expression of the FGFR3 and TACC3 components of the fusions. The effects of the specific FGFR
inhibitor JNJ-42756493 for FGFR3-TACC3-positive glioma were determined in preclinical
experiments. Two patients with advanced FGFR3-TACC3-positive GBM received JNJ-42756493
and were assessed for therapeutic response.
Results
Three of 85 IDH1/2 wild type (3.5%) but none of 126 IDH1/2 mutant grade-II-III glioma harbored
FGFR3-TACC3 fusions. FGFR-TACC rearrangements were present in 17 of 584 GBM (2.9%).
FGFR3-TACC3 fusions were associated with strong and homogeneous FGFR3 immunostaining.
They are mutually exclusive with IDH1/2 mutations and EGFR amplification whereas co-occur with
CDK4 amplification. JNJ-42756493 inhibited growth of glioma cells harboring FGFR3-TACC3 in
vitro and in vivo. The two patients with FGFR3-TACC3 rearrangements who received JNJ-
42756493 manifested clinical improvement with stable disease and minor response, respectively.
5
Conclusions
RT-PCR-sequencing is a sensitive and specific method to identify FGFR-TACC-positive patients.
FGFR3-TACC3 fusions are associated with uniform intra-tumor expression of the fusion protein. The
clinical response observed in the FGFR3-TACC3-positive patients treated with a FGFR inhibitor
supports clinical studies of FGFR inhibition in FGFR-TACC-positive patients.
6
INTRODUCTION
The history of successful targeted therapy of cancer largely coincides with the inactivation of
recurrent, oncogenic and addicting gene fusions in hematological malignancies and recently in
some types of epithelial cancer (1, 2). Glioblastoma multiforme (GBM) is among the most lethal
forms of human cancer and targeted therapies against common genetic alterations in GBM have
not changed the dismal outcome of the disease (3, 4). Underlying biological features including
infiltrative growth behavior, intratumoral heterogeneity, and adaptive resistance mechanisms
coupled with the unique challenges of intracranial location present significant problems in its
effective management. Despite surgery and chemo-radiotherapy, most patients rapidly recur and
no effective treatment options are available at that stage. Beside GBM, which features the highest
grade of malignancy among glioma (grade IV), lower grade glioma which include grade II and
grade III are a heterogeneous group of tumors in which specific molecular features are associated
with divergent clinical outcome. The majority of grade II-III glioma (but only a small subgroup of
GBM) harbor mutations in IDH genes (IDH1 or IDH2), which confer a more favorable clinical
outcome. Conversely, the absence of IDH mutations is associated with the worst prognosis (5).
We have recently identified FGFR-TACC gene fusions (mostly FGFR3-TACC3, and rarely FGFR1-
TACC1) as the first example of highly oncogenic and recurrent gene fusions in GBM. The FGFR-
TACC fusions that have been identified so far include the Tyrosine Kinase (TK) domain of FGFR
and the coiled-coil domain of TACC proteins, both necessary for the oncogenic function of FGFR-
TACC fusions. We also tested tumor dependency on FGFR-TACC fusions in preclinical mouse
models of FGFR-TACC glioma and observed marked anti-tumor effects by FGFR inhibition (6).
After our report, FGFR3-TACC3 fusions have been identified in pediatric and adult glioma, bladder
carcinoma, squamous lung carcinoma and head and neck carcinoma, thus establishing FGFR-
7
TACC fusions as one of the chromosomal translocation most frequently found across multiple
types of human cancers (6-15).
From a mechanistic standpoint, we discovered the unexpected capacity of FGFR-TACC fusions to
trigger aberrant chromosome segregation during mitosis, thus initiating chromosome instability
(CIN) and aneuploidy, two hallmarks of cancer. However, we still have an incomplete
understanding of the full repertoire of the structural variants of FGFR-TACC fusions occurring in
GBM and lower grade glioma Furthermore, it remains unknown whether FGFR-TACC fusions mark
distinct grades of glioma and GBM subtypes.
To date eight variants of the FGFR3-TACC3 fusion have been reported that mostly differ for the
breakpoint in the TACC3 gene (6-15). Because of the close proximity of FGFR3 and TACC3 (the
two genes map at a distance of 70 Kb on chromosome 4p16.3), detection of FGFR3-TACC3
rearrangements by FISH is not a feasible option with the currently available methods. Here we
report a screening method for FGFR-TACC fusions that includes a RT-PCR assay designed to
identify the known and novel FGFR3-TACC3 fusion transcripts, followed by confirmation of the in-
frame breakpoint by Sanger sequencing. Using this assay, we have analyzed a dataset of 584
GBM and 211 grade II and grade III gliomas.
A crucial question with fundamental clinical relevance for any novel candidate target mutation is
the frequency of the alteration in the cancer cell population, thus discriminating between a clonal or
sub-clonal origin of the mutation. In fact, GBM is characterized by a formidable degree of subclonal
heterogeneity, whereby neighboring cells display amplification and expression of different Receptor
Tyrosine Kinase (RTK)-coding genes (16-19). This notion poses major therapeutic challenges for
targeting any individual RTK will result, at best, in the eradication of a limited tumor sub-clone. In
this study, we determine that brain tumors harboring FGFR-TACC fusions manifest strong and
8
homogeneous intra-tumor expression of the FGFR3 and TACC3 component invariably included in
the fusion protein, when analyzed by immunostaining. We also report a significant clinical benefit
following treatment with a specific inhibitor of FGFR-TK in two GBM patients who harbored
FGFR3-TACC3 rearrangement.
9
MATERIALS AND METHODS
Patients and tissue samples
This study includes a cohort of 746 untreated patients with histologic diagnosis of glioma from 5
institutions. Forty-nine recurrent gliomas from Pitié-Salpêtrière Hospital and one recurrent glioma
from the University of Calgary were also included. A summary of the patient cohort is provided in
Table 1.
Tumor specimens, blood samples and clinico-pathological information were collected with informed
consent and relevant ethical board approval in accordance with the tenets of the Declaration of
Helsinki. For the samples from the Pitié-Salpêtrière Hospital, clinical data and follow-up are available
in the neuro-oncology database (Onconeurotek, GH Pitié-Salpêtrière, Paris).
Two recurrent GBM patients harboring FGFR3-TACC3 were enrolled in the dose escalation part of
JNJ-42756493 trial at the Gustave Roussy Institute.
Identification of fusion transcripts and analysis of genomic breakpoints
Total RNA was extracted from frozen tissues using Trizol (Invitrogen) according to manufacturer
instructions. Two to three hundred nanograms of total RNA were retro-transcribed with the Maxima
First Strand cDNA Synthesis Kit (Thermo Scientific) or SuperScript II (Invitrogen). RT-PCR was
performed using AccuPrime Taq DNA Polymerase (Invitrogen). Primer pairs used for the FGFR3-
TACC3 fusions screening were: FGFR3ex12-FW: 5’-CGTGAAGATGCTGAAAGACGATG-3 and
TACC3ex14-RV: 5’-AAACGCTTGAAGAGGTCGGAG; amplification conditions were 94°C-3min,
(94°C-30sec/61°C-30sec/68°C-1min40sec) for 35 cycles, 68°C-7min. FGFR1-TACC1 fusions were
amplified with FGFR1ex16-FW: 5’-TGCCTGTGGAGGAACTTTTCA-3’ and TACC1ex13-RV: 5’-
10
CCCAAACTCAGCAGCCTAAG-3’ primers (94°C-30sec/60°C-30sec/68°C-1min40sec for 35 cycles).
PCR products were subjected to Sanger sequencing.
FGFR3-TACC3 genomic breakpoints were analyzed in 6 FGFR3-TACC3 positive samples, 5 of
which from the Pitié-Salpêtrière Hospital and 1 from Montreal Neurological Institute. Three additional
samples (MB-22, TCGA 27-1835 and TCGA 06-6390) available from our previous study (6) were
also included in the analysis. Fifty nanograms of genomic DNA were used in the PCR reaction,
performed with Accuprime Taq Polymerase (Invitrogen) and PCR products were Sanger sequenced.
Primers used in genomic PCR were designed according to the breakpoint sequence in the mRNA;
the list of primers used are: FGFR3ex17-FW 5’- TGGACCGTGTCCTTACCGT-3’ (PCR Samples
3048, 4373, 4867, 4451, MB-22, OPK-14, 06-6390, 27-1835 and Sequencing samples 3048, 4373,
4867, 4451, MB-22, OPK14, 06-6390, 27-1835); FGFR3ex16-FW 5’- GGTCCTTTGGGGTCCTGCT-
3’ (PCR and Sequencing Sample 3808); TACC3ex6-RV 5’- CCTCTTTCAGCTCCAAGGCA-3’ (PCR
and Sequencing Samples PCR 4451 and OPK-14); TACC3ex8-RV 5’-
TCTACCAGGACTGTCCCTCAG-3’ (Sequencing Samples 3048 and 4373); TACC3ex9-RV 5’-
GGGAGTCTCATTTGCACCGT-3’ (PCR Samples 3048,4373,4867 and Sequencing Sample 4867);
TACC3ex10-RV 5’- CTGCATCCAGGTCCTTCTGG-3’ (PCR and Sequencing Samples MB-22 and
06-6390); TACC3ex11-RV 5’- CCAGTTCCAGGTTCTTCCCG-3’ (Sequencing Samples 27-1837 and
3808); TACC3ex12-RV 5’- CAACCTCTTCGAACCTGTCCA-3’ (PCR and Sequencing Samples 27-
1837 and 3808). PCR conditions were 94°C-30sec/60°C-30sec/68°C-2min30sec for 40 cycles. For
amplifications performed with the primer TACC3ex9-RV, the program was 94°C-30sec/56°C-
30sec/68°C-2min30sec) for 40 cycles.
Quantitation of FGFR3 and TACC3 transcripts in GBM
11
The relative expression of FGFR3 and TACC3 regions included in or excluded from the fusion
transcript was assessed by qRT-PCR. Primer pairs with comparable efficiency of amplification were
identified and efficiency was assessed using serial dilutions of cDNA (20) prepared from OAW28
ovarian carcinoma cells that contain wild type FGFR3 and TACC3 (21). Primers used are: N-terminal
region of FGFR3, FGFR3-N: Forward 5’-AAGACGATGCCACTGACAAG-3’, Reverse 5’-
CCCAGCAGGTTGATGATGTTTTTG-3’; C-terminal region of TACC3, TACC3-C: Forward 5’-
TCCTTCTCCGACCTCTTCAAGC-3’, Reverse 5’-TAATCCTCCACGCACTTCTTCAG-3’. To amplify
transcripts in regions excluded from FGFR3-TACC3 fusion, primers were designed in the C-terminal
region of FGFR3, FGFR3-C: Forward 5’-TACCTGGACCTGTCGGCG-3’, Reverse 5’-
TGGGCAAACACGGAGTCG-3’ and N-terminal domain of TACC3, TACC3-N: Forward 5’-
CCACAGACGCACAGGATTCTAAGTC-3’, Reverse 5’-TGAGTTTTCCAGTCCAAGGGTG-3’. All
reactions were performed in triplicate and the data are reported as Fold Change ± Standard
Deviation.
Immunofluorescence and immunohistochemistry
For immunofluorescence (IF) staining of FGFR3, 5m FFPE sections subjected to antigen retrieval
with citrate buffer for 8 min. Primary antibodies were: FGFR3-N (1:400, sc-13121, Santa Cruz
Biotechnology), FGFR3-C (1:2000, sc-123, Santa Cruz Biotechnology), TACC3-N (1:600, ab134153,
Abcam), and TACC3-C (1:300, NBP1-01032, Novus Biological). Secondary biotinylated antibodies
were used at 1:50,000 followed by streptavidin and TSA Cy3-conjugated. Nuclei were
counterstained with DAPI. For immunohistochemical analysis (IHC) of FGFR3 expression, antigen
retrieval was performed for 12 min and FGFR-3 antibody (sc-13121, Santa Cruz Biotechnology) was
12
diluted 1:500. Biotinylated anti-mouse antibody (1:30,000) and streptavidin were added before
incubation with the chromogen. Nuclei were counterstaining with hematoxylin.
Molecular characterization of tumor samples
Mutational status of IDH1, IDH2, TERT promoter, as well as the methylation status of the MGMT
promoter was analyzed in the Pitié-Salpêtrière cohort. Expression of IDH1-R132H mutant was
analyzed by IHC in 500 cases as previously described (22). IDH1 and IDH2 gene mutations were
identified by Sanger sequencing in 464 and 388 gliomas, respectively (5). IDH wild-type tumors are
defined according to the absence of IDH1-R132H immunopositivity and/or mutations in IDH1 and
IDH2 genes. TERT promoter status was determined by the same technique in 277 samples (23).
Hyper-methylation of the MGMT promoter was tested in 242 samples by bisulfite pyro-sequencing
(24). The presence of EGFRvIII was evaluated by RT-PCR in 118 samples using EGFR-FW 5′-
CTTCGGGGAGCAGCGATGCGAC-3′ and EGFR-RV 5′CTGTCCATCCAGAGG AGGAGTA-3′
primers (25).
Copy number variations analyses have been performed on 192 tissue samples using CGH arrays
using BAC arrays (N=187), Agilent 4x180K (N=2), Nimblegen 3x720K (N=2), Agilent 8x60K (N=1).
Results were normalized using control DNA from matched blood samples as previously described
(26). Additional analyses of 193 tumor specimens were performed by SNP array, using Illumina
Omni (N=110), Illumina HumCore (N=32), Illumina 370K (N=27), or Illumina 610K (N=24), as
previously described (27). Array processing was outsourced to Integragen. Raw copy numbers were
estimated at each of the SNP and copy-number markers. Biodiscovery property SNP-FASST2
algorithm was then used to segment copy number data. Segments were mapped to hg18 genome
assembly (28). Copy number alterations (CAN) magnitudes called log-R ratio (LRR) were classified
13
using simple thresholds: deletion (x ≤ -1), loss (-1< x ≤ -0.2), gain (0.2 ≤ x < 1) or amplification (x ≥ 1)
according to default Nexus 7.5 software. For additional 56 gliomas, 10q loss was assessed on tumor
and blood DNA by microsatellite analysis, while amplification of EGFR, MDM2 and CDK4, and
deletion of CDKN2A gene, were determined by qPCR, as previously reported (29, 30).
The molecular profiles obtained in Pitié-Salpêtrière dataset were combined with those available in
the TCGA dataportal. TCGA GBM segmented copy number variation profile was downloaded from
The UCSC Cancer Genomics Browser (31). Copy Number Variations (CNVs) were measured
experimentally using the Affymetrix Genome-Wide Human SNP Array 6.0 platform at the Broad
TCGA genome characterization center (32). Raw copy numbers were estimated at each of the SNP
and copy-number markers. Circular binary segmentation was then used to segment the copy
number data (28). Segments are mapped to hg18 genome assembly at Broad.
For CNV analysis of the regions across FGFR3 and TACC3 genes, we considered samples for
which RNAseq and CNV data were available or samples for which only CNV data were available and
RT-PCR-sequencing of FGFR3-TACC3 fusion had been performed. Overall, 158 GBM (all with a
wild type IDH1 gene) satisfied these criteria. Among them, 5 harbored an FGFR3-TACC3 fusion
whereas 153 were FGFR-TACC-negative. The CNV magnitudes, called log-R ratio (LRR), were
classified using the following thresholds: deletion (x < -1), loss (-1 ≤ x ≤ -0.2), gain (0.2 ≤ x ≤ 1) or
amplification (x > 1), according to the Atlas-TCGA (32). The analysis of the genomic regions
encompassing EGFR, MDM2, CDK4, CDKN2A, 7p, 10q, according to hg18 genome assembly, was
performed to evaluate their CNV. EGFRvIII mutation status was inferred according to Brennan et al.
(32). The frequencies of the aberrations of these genes in FGFR3-TACC3 positive and negative
samples were calculated and the obtained data were then combined with the Pitié-Salpêtrière
Hospital dataset.
14
Statistical Analysis
Differences in the distribution on categorical variables were analyzed using Fisher Exact test. The p-
values were adjusted for multiple testing according to Benjamini and Hochberg false discovery rate
(FDR). A q-value ≤ 0.05 (two-sided) was considered to be statistically significant.
Overall survival (OS) was defined as the time between the diagnosis and death or last follow-up.
Patients who were still alive at the last follow-up were considered as censored events in the analysis.
Progression-free survival (PFS) was defined as the time between the diagnosis and recurrence or
last follow-up. Patients who were recurrence-free at the last follow-up were considered as censored
events in the analysis. Survival curves were calculated by the Kaplan-Meier method and differences
between curves assessed using the Log-Rank test. A Log-Rank test p-value ≤ 0.05 (two-sided) was
considered to be statistically significant.
Cell culture and cell growth assay
GIC-1123 gliomaspheres were cultured in neurobasal medium (Invitrogen) supplemented with B27,
N2 (Invitrogen), EGF and FGF2 (20 ng/ml, PeproTech). Mouse astrocytes Ink4A-Arf-/- were cultured
in DMEM supplemented with 10% Fetal Bovine Serum. Cells were seeded at 1,000 cells/well in a
96-well plate and treated with JNJ-42756493. After 72 hours cell viability was assessed using the 3-
(4,5- dimethythiazol-2-yl)-2,5-diphenyl tetrazolium bromide (MTT) assay. Data are mean ± SEM of
six replicates. Experiments were performed three times.
Subcutaneous xenografts and drug treatment
GIC-1123 cells (5x10⁵) were injected subcutaneously in the flank of athymic nude (Nu/Nu) mice
(Charles River Laboratories). Mice carrying ~200 mm3 subcutaneous tumors were randomized to
15
receive 12 mg/kg JNJ-42756493 or DMSO in 1% Tween 80 by oral gavage. Tumor diameters were
measured with caliper and tumor volumes estimated using the formula: 0.5 x length x width2. Data
are mean ± SD of nine mice in each group. Mice were sacrificed when tumors in the control group
reached the maximal size allowed by the IACUC Committee at Columbia University.
MRI imaging and evaluation of clinical response to JNJ-42756493
Baseline and follow-up imaging assessments were performed on 1.5 Tesla MR imaging systems,
including at least axial T1 weighted images before gadolinium injection, Axial or 3D FLAIR (Fluid-
Attenuated Inversion-Recovery), dynamic susceptibility contrast MR perfusion (0.1 mmol/kg of
gadobutrol), axial and 3D T1 weighted images after gadolinium injection. Tumor response was
assessed according to the RANO criteria (33). Contrast-enhancing lesion volume was assessed with
the help of a semi-automated volumetry tool (SegmentiX), based on shape-detection and
thresholding, with control and manual correction of edges when necessary. Since exclusion of cystic
or necrotic portions of the lesion may be affected by operator subjectivity, we included them both for
volumetric and axial measurements.
DSC (dynamic susceptibility contrast) perfusion datasets were processed with vendor’s software
suite (Neuroperfusion, Philips), including coregistration and rCBV (relative cerebral blood volume)
parametric maps generation with 3 different algorithms (Gamma-variate fitting, Arterial Input
Function based deconvolution and Model Free).
RESULTS
16
Detection of FGFR1-TACC1 and FGFR3-TACC3 fusions in GBM and grade II-III glioma
To determine the frequency and molecular features of FGFR-TACC fusions in human glioma
patients, we screened a cohort of 584 GBM and 211 grade II-III glioma treated at five Neuro-
oncology centers (Table 1). 108 were grade III (49 IDH wild type, 52 IDH1 mutant and 7 IDH2
mutant) and 103 were grade II (36 IDH wild type, 63 IDH1 mutant and 4 IDH2 mutant). We also
established the IDH mutational status of 333 GBM and determined that 303 harbored wild type
IDH1/2 and 30 were mutated at codon 132 of IDH1. We designed a RT-PCR assay for the
detection of all known and possibly new variants of FGFR1-TACC1 and FGFR3-TACC3 fusions
that retain the mRNA sequences coding for the key FGFR-TK and TACC domains required for the
oncogenic activity of the fusion protein (Fig. 1 and Fig. 2A-D). Overall, we found 20 tumors with an
FGFR3-TACC3 fusion, of which 17 were GBM (2.9% positives) and 3 lower grade glioma
harboring wild type IDH1/2 genes (3.5% positives). The size of the FGFR3-TACC3 RT-PCR
amplicons ranged from 928 bp (for FGFR3ex18-TACC3ex13) to 1706 bp (for FGFR3ex18-
TACC3ex4). The FGFR1-TACC1 fusion was detected in one grade II IDH wild type glioma (Fig. 1).
Conversely, we did not find any IDH1/2 mutant glioma harboring FGFR-TACC fusions (p<0.02).
Sanger sequencing of the fusion amplicons revealed that each FGFR-TACC cDNA joined in-frame
the sequence coding for the entire TK domain upstream of TACC-coding sequences that invariably
include the coiled-coil TACC domain (Fig. 1). However, we detected a notable variability among
FGFR3-TACC3 fusion isoforms, whereby 5 of the identified variants occurred only in individual
cases (Fig. 1). Furthermore, 6 fusion transcripts emerged as new variants that have not been
reported before in human cancer (marked in red in Fig. 1).
Next, we designed suitable PCR primers to map the genomic breakpoint coordinates for 9 FGFR3-
TACC3-positive samples for which genomic DNA was available (Supplementary Figs 1 and 2). We
17
successfully reconstructed the genomic breakpoints by Sanger sequencing and found that they
differ for each of the 9 positive cases. Interestingly, even cases harboring the same FGFR3-
TACC3 transcript splice variants (#4451 and #OPK-14 joining exon 17 of FGFR3 to exon 6 of
TACC3; #3048 and #4373 joining exon 17 of FGFR3 to exon 8 of TACC3; #3808 and #27-1835
joining exon 17 of FGFR3 to exon 11 of TACC3) had different genomic breakpoints
(Supplementary Fig. 2). Taken together, the above findings indicate that the noticeable variability
among FGFR3-TACC3 fusion transcripts and genomic breakpoints is efficiently resolved by the
RT-PCR screening assay.
Immunostaining analysis of FGFR3-TACC3-positive tumors
We analyzed the expression of the FGFR3 fusion protein by IHC or IF using an antibody that
recognizes the N-terminal region of FGFR3 (FGFR3-N) in 12 GBM and 3 lower grade glioma
harboring FGFR3-TACC3 fusions for which sufficient tissue was available. Remarkably, each of
the 15 positive tumors but none of those that had scored negative in the RT-PCR assay, displayed
strong positivity for FGFR3 in the vast majority of tumor cells but not endothelial cells throughout
the analyzed tumor section (Fig. 2A-H). Notably, IF using an antibody that recognizes an epitope at
the C-terminus of TACC3, which is invariably retained within FGFR3-TACC3 variants (TACC3-C),
reproduced the staining pattern of the FGFR3-N antibody in FGFR3-TACC3 positive tumors.
Conversely, negative or very weak staining was obtained in FGFR3-TACC3-positive tumors with
antibodies recognizing the regions of FGFR3 (FGFR3 C-terminal region, FGFR3-C) and TACC3
(TACC3 N-terminal region, TACC3-N) constantly excluded from FGFR3-TACC3 fusion proteins
(Supplementary Fig. 3A). Consistently, quantitative RT-PCR of GBM harboring FGFR3-TACC3
fusions showed that the expression of the N-terminal coding region of FGFR3 and the C-terminal
18
coding region of TACC3 (which are included in the fusion genes) is markedly higher than the
expression of the C-terminal coding region of FGFR3 and the N-terminal coding region of TACC3,
which are excluded from the fusion transcripts (Supplementary Fig. 3B). We also analyzed one
recurrent GBM from a patient whose tumor had been found positive for FGFR3-TACC3 at the initial
diagnosis and who had recurred after concurrent radiotherapy and temozolomide treatment. The
recurrent tumor retained the same FGFR3-TACC3 fusion gene and protein that was present in the
untreated GBM as determined by RT-PCR-sequencing and FGFR3 IF, respectively
(Supplementary Fig. 4). Although this requires additional evaluation, the retained uniform positivity
for FGFR3 in this recurrent GBM suggests that targeting the FGFR3-TACC3 fusion protein at
relapse is a valid therapeutic strategy.
Clinical and molecular characteristics of glioma patients with FGFR3-TACC3 fusions
Clinical and molecular profiling data were available for 591 patients including 380 GBM (9 with
FGFR3-TACC3 fusions) and all 211 lower grade glioma (3 with FGFR3-TACC3 fusions). Of these
12 patients 5 are males and 7 females, aged 48y to 82y (median= 61y). We sought to determine
the molecular profile of FGFR3-TACC3-positive glioma. To do so, we combined the analysis of
CNVs and somatic mutations of key GBM genes in our dataset with the SNP6.0 high-density
genomic array analysis of 158 TCGA-derived GBM samples fully annotated for FGFR3-TACC3
fusion genes (the RNA-seq and/or RT-PCR analysis of these samples had revealed that 5 of them
harbor FGFR3-TACC3 fusions) (6). Patients with FGFR3-TACC3 fusions displayed unique
characteristics (Table 2). FGFR3-TACC3 fusions were mutually exclusive with EGFR amplification
(0/16 vs. 166/411; p=0.0004, FDR q-value corrected for multiple comparisons=0.0012) and
showed a clear trend against the presence of the EGFRvIII transcript variant (0/16 vs. 37/219;
19
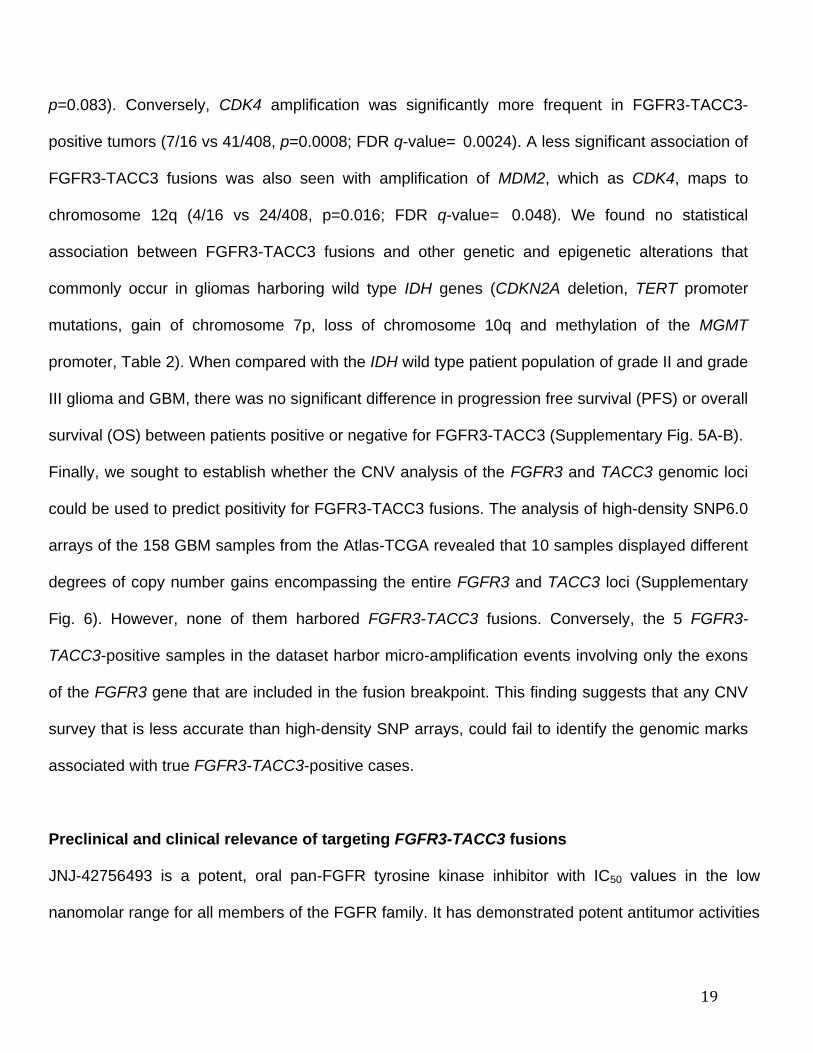
p=0.083). Conversely, CDK4 amplification was significantly more frequent in FGFR3-TACC3-
positive tumors (7/16 vs 41/408, p=0.0008; FDR q-value= 0.0024). A less significant association of
FGFR3-TACC3 fusions was also seen with amplification of MDM2, which as CDK4, maps to
chromosome 12q (4/16 vs 24/408, p=0.016; FDR q-value= 0.048). We found no statistical
association between FGFR3-TACC3 fusions and other genetic and epigenetic alterations that
commonly occur in gliomas harboring wild type IDH genes (CDKN2A deletion, TERT promoter
mutations, gain of chromosome 7p, loss of chromosome 10q and methylation of the MGMT
promoter, Table 2). When compared with the IDH wild type patient population of grade II and grade
III glioma and GBM, there was no significant difference in progression free survival (PFS) or overall
survival (OS) between patients positive or negative for FGFR3-TACC3 (Supplementary Fig. 5A-B).
Finally, we sought to establish whether the CNV analysis of the FGFR3 and TACC3 genomic loci
could be used to predict positivity for FGFR3-TACC3 fusions. The analysis of high-density SNP6.0
arrays of the 158 GBM samples from the Atlas-TCGA revealed that 10 samples displayed different
degrees of copy number gains encompassing the entire FGFR3 and TACC3 loci (Supplementary
Fig. 6). However, none of them harbored FGFR3-TACC3 fusions. Conversely, the 5 FGFR3-
TACC3-positive samples in the dataset harbor micro-amplification events involving only the exons
of the FGFR3 gene that are included in the fusion breakpoint. This finding suggests that any CNV
survey that is less accurate than high-density SNP arrays, could fail to identify the genomic marks
associated with true FGFR3-TACC3-positive cases.
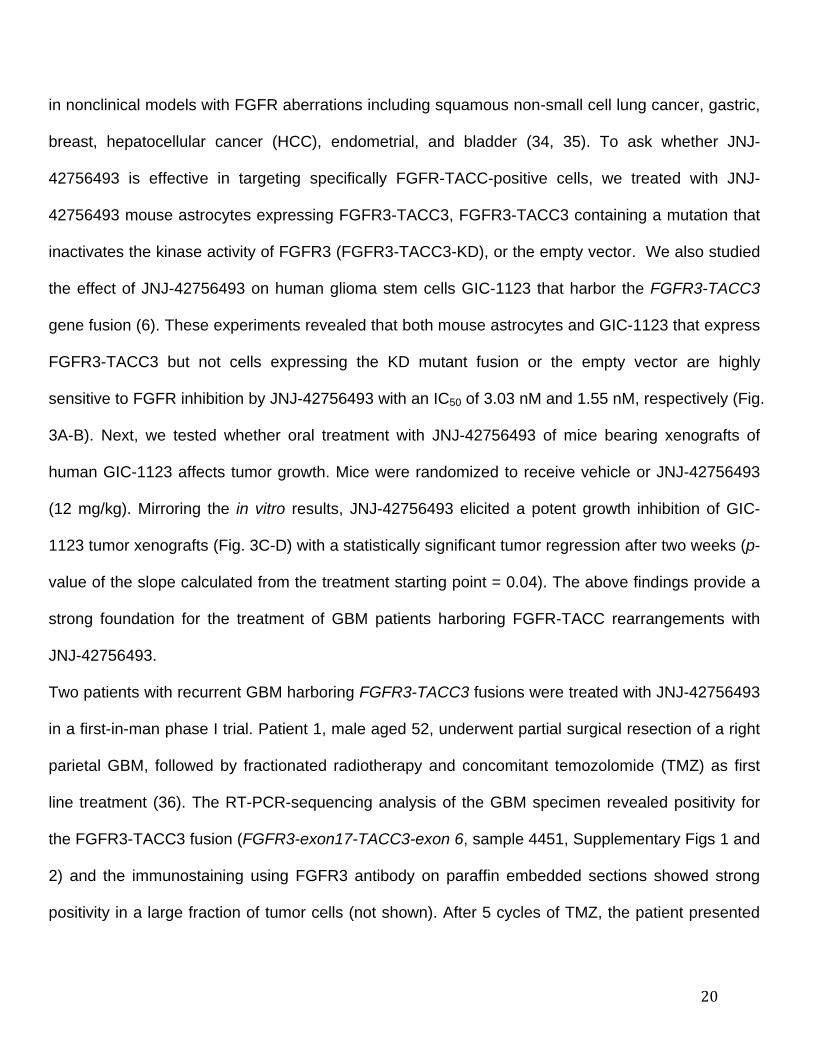
Preclinical and clinical relevance of targeting FGFR3-TACC3 fusions
JNJ-42756493 is a potent, oral pan-FGFR tyrosine kinase inhibitor with IC50 values in the low
nanomolar range for all members of the FGFR family. It has demonstrated potent antitumor activities
20
in nonclinical models with FGFR aberrations including squamous non-small cell lung cancer, gastric,
breast, hepatocellular cancer (HCC), endometrial, and bladder (34, 35). To ask whether JNJ-
42756493 is effective in targeting specifically FGFR-TACC-positive cells, we treated with JNJ-
42756493 mouse astrocytes expressing FGFR3-TACC3, FGFR3-TACC3 containing a mutation that
inactivates the kinase activity of FGFR3 (FGFR3-TACC3-KD), or the empty vector. We also studied
the effect of JNJ-42756493 on human glioma stem cells GIC-1123 that harbor the FGFR3-TACC3
gene fusion (6). These experiments revealed that both mouse astrocytes and GIC-1123 that express
FGFR3-TACC3 but not cells expressing the KD mutant fusion or the empty vector are highly
sensitive to FGFR inhibition by JNJ-42756493 with an IC50 of 3.03 nM and 1.55 nM, respectively (Fig.
3A-B). Next, we tested whether oral treatment with JNJ-42756493 of mice bearing xenografts of
human GIC-1123 affects tumor growth. Mice were randomized to receive vehicle or JNJ-42756493
(12 mg/kg). Mirroring the in vitro results, JNJ-42756493 elicited a potent growth inhibition of GIC-
1123 tumor xenografts (Fig. 3C-D) with a statistically significant tumor regression after two weeks (p-
value of the slope calculated from the treatment starting point = 0.04). The above findings provide a
strong foundation for the treatment of GBM patients harboring FGFR-TACC rearrangements with
JNJ-42756493.
Two patients with recurrent GBM harboring FGFR3-TACC3 fusions were treated with JNJ-42756493
in a first-in-man phase I trial. Patient 1, male aged 52, underwent partial surgical resection of a right
parietal GBM, followed by fractionated radiotherapy and concomitant temozolomide (TMZ) as first
line treatment (36). The RT-PCR-sequencing analysis of the GBM specimen revealed positivity for
the FGFR3-TACC3 fusion (FGFR3-exon17-TACC3-exon 6, sample 4451, Supplementary Figs 1 and
2) and the immunostaining using FGFR3 antibody on paraffin embedded sections showed strong
positivity in a large fraction of tumor cells (not shown). After 5 cycles of TMZ, the patient presented
21
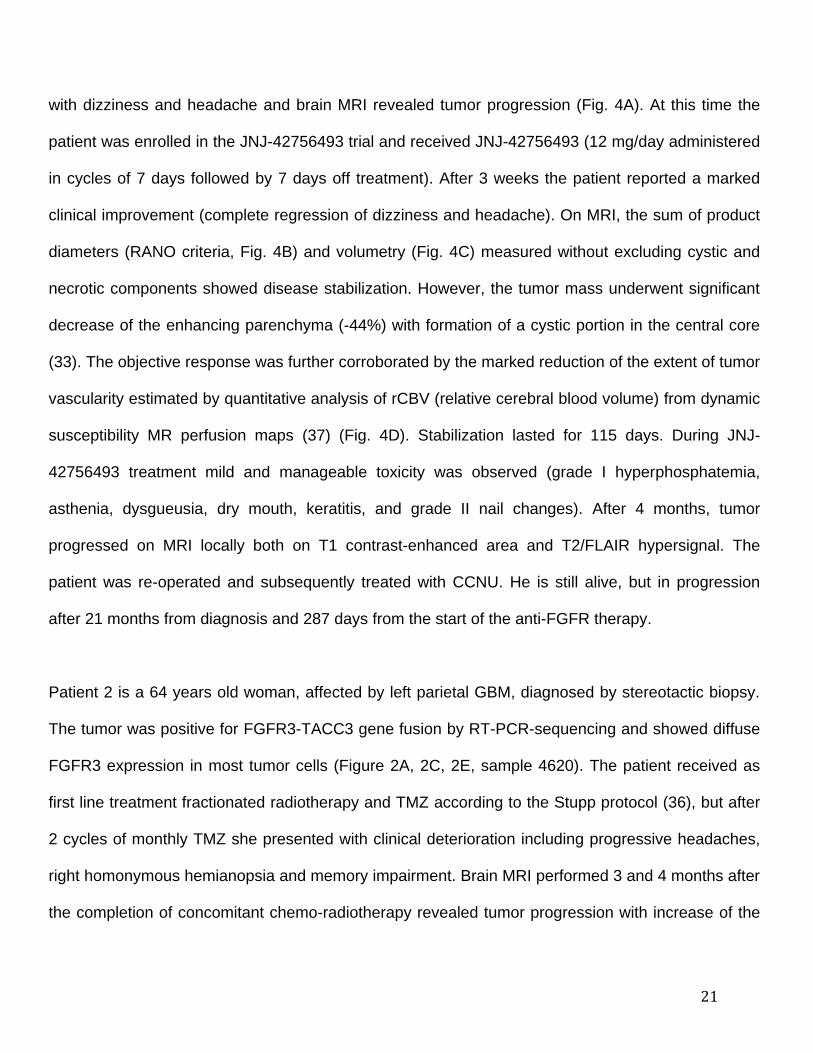
with dizziness and headache and brain MRI revealed tumor progression (Fig. 4A). At this time the
patient was enrolled in the JNJ-42756493 trial and received JNJ-42756493 (12 mg/day administered
in cycles of 7 days followed by 7 days off treatment). After 3 weeks the patient reported a marked
clinical improvement (complete regression of dizziness and headache). On MRI, the sum of product
diameters (RANO criteria, Fig. 4B) and volumetry (Fig. 4C) measured without excluding cystic and
necrotic components showed disease stabilization. However, the tumor mass underwent significant
decrease of the enhancing parenchyma (-44%) with formation of a cystic portion in the central core
(33). The objective response was further corroborated by the marked reduction of the extent of tumor
vascularity estimated by quantitative analysis of rCBV (relative cerebral blood volume) from dynamic
susceptibility MR perfusion maps (37) (Fig. 4D). Stabilization lasted for 115 days. During JNJ-
42756493 treatment mild and manageable toxicity was observed (grade I hyperphosphatemia,
asthenia, dysgueusia, dry mouth, keratitis, and grade II nail changes). After 4 months, tumor
progressed on MRI locally both on T1 contrast-enhanced area and T2/FLAIR hypersignal. The
patient was re-operated and subsequently treated with CCNU. He is still alive, but in progression
after 21 months from diagnosis and 287 days from the start of the anti-FGFR therapy.
Patient 2 is a 64 years old woman, affected by left parietal GBM, diagnosed by stereotactic biopsy.
The tumor was positive for FGFR3-TACC3 gene fusion by RT-PCR-sequencing and showed diffuse
FGFR3 expression in most tumor cells (Figure 2A, 2C, 2E, sample 4620). The patient received as
first line treatment fractionated radiotherapy and TMZ according to the Stupp protocol (36), but after
2 cycles of monthly TMZ she presented with clinical deterioration including progressive headaches,
right homonymous hemianopsia and memory impairment. Brain MRI performed 3 and 4 months after
the completion of concomitant chemo-radiotherapy revealed tumor progression with increase of the
22
left parietal mass and the appearance of a small contralateral lesion (Fig. 4E). The patient was thus
enrolled in the JNJ-42756493 trial (12 mg/day administered in cycles of 7 days followed by 7 days
off treatment) and showed clinical improvement after 4 weeks (regression of headaches, visual field
defect and memory impairment). Best response was observed after 104 days of treatment with a
22% reduction of tumor size according to the RANO criteria (Fig. 4F) and 28% according to
volumetry (Fig. 4G). Grade I hyperphosphatemia, nail changes, and mucositis were observed.
Clinical status remained stable until disease progression occurring 134 days after the start of the
anti-FGFR. The patient is still alive and is receiving a third-line chemotherapy with nitrosoureas and
bevacizumab.
23
DISCUSSION
FGFR-TACC fusions are potent oncogenic events that when present in brain tumor cells confer
sensitivity to FGFR inhibitors (6). Since our original identification of recurrent FGFR-TACC fusions
in GBM, small subgroups of patients harboring FGFR-TACC translocations have been identified in
several other tumor types (7-15). Here, we report an unbiased RT-PCR-sequencing analysis for
the identification of all possible functional FGFR-TACC fusion transcripts. The screening of a large
glioma dataset from multiple Institutions not only confirmed that FGFR-TACC rearrangements
occur in ~3% of human GBM but also revealed that FGFR-TACC fusions are present in the
subgroup of IDH wild type lower grade glioma (grade II-III) with prevalence similar to that of GBM.
IDH wild type grade II and III glioma have a significantly worse clinical outcome than the IDH
mutant glioma and manifests molecular and clinical features that resemble GBM (5). Our finding
that FGFR-TACC fusions occur in IDH wild type but not IDH mutant glioma provides an important
clue for the molecular characterization of this glioma subtype. Furthermore, the clustering of such
potent oncogenic events in IDH wild type glioma underscores the particularly aggressive nature of
this group of glioma. While we showed that FGFR-TACC fusions cluster within the poor clinical
outcome subgroup of IDH wild type glioma, these translocations do not seem to carry prognostic
value within the IDH wild type subgroup of glioma patients. However, the sample size of patients
harboring FGFR-TACC fusions is too small to draw definitive conclusions with respect to the
impact on survival and larger studies will be necessary to clarify the prognostic role of FGFR-TACC
fusions in IDH wild type glioma.
Beside mutual exclusivity between IDH1 mutations and FGFR-TACC fusions, our results showed
that patients with FGFR3-TACC3 rearrangements lack EGFR amplification and EGFRvIII but are
significantly enriched for amplification of CDK4 (and MDM2 to a lesser extent). Knowledge of these
24
molecular characteristics will help select those patients who most likely harbor FGFR-TACC
rearrangements and design combinatorial targeted therapies that might be more effective in the
FGFR-TACC-positive glioma subgroup.
The molecular screen uncovered 6 new FGFR3-TACC3 fusion events. Together with the
previously identified variants, others and we have reported 12 distinct isoforms of FGFR3-TACC3,
thus revealing a remarkable variability of FGFR3-TACC3 transcripts in human cancer (see
Supplementary Table 1 summarizing the structure of all the FGFR-TACC variants identified to
date). The structural heterogeneity of FGFR3-TACC3 fusions is yet more pronounced at the
genomic level, whereby each fusion event harbors distinct genomic breakpoints, even for identical
fusion transcripts. This finding underscores the notion that targeted genomic analyses are unlikely
to be suitable approaches for the molecular diagnosis of FGFR3-TACC3 positivity. Conversely, the
unbiased identification of FGFR3-TACC3-positive tumors with the RT-PCR-sequencing assay
reported here overcomes the limitations of screening only for previously identified FGFR3-TACC3
fusions and provides a simple molecular diagnostic assay.
Rather than displaying uniform amplifications of the FGFR3 and TACC3 genomic loci, FGFR3-
TACC3-positive samples harbor small, intragenic micro-amplification events typically encompassing
only the exons of the FGFR3 and TACC3 genes included in the breakpoint (6). This finding is
consistent with the notion that a “fusion breakpoint principle” sustains the CNVs of driver gene
fusions such as FGFR3-TACC3 in which local CNVs target exclusively the breakpoint region (38).
We note that such small and irregular CNVs may easily go undetected from CNV analyses
performed using platforms less sensitive than the high-density SNP6.0 genomic arrays. Furthermore,
the notion that FGFR3-TACC3-negative GBM may harbor uniform amplifications across the FGFR3
25
and TACC3 loci argues against the standard analysis of FGFR3 and/or TACC3 CNVs as a method
for the selection of FGFR3-TACC3-positive tumors.
There is a growing body of evidence supporting the notion that GBM is a markedly heterogeneous
tumor. The formidable degree of intra-tumor heterogeneity of GBM is a potential cause of failure of
targeted therapies in these tumors. In particular, the intra-tumor heterogeneity of GBM has
previously been recognized in light of the mosaic expression of the RTK genes EGFR, PDGFRA and
MET by neighboring cells (16-19). Thus, in the majority of GBM, amplification or overexpression of
individual RTK genes are present in a sub-clonal fraction of tumor cells and co-exist with
amplification/expression of other RTK-coding genes within the tumor mass. Therefore, it was
essential to determine whether such heterogeneity was also present in gliomas harboring FGFR-
TACC translocations. The immunostaining of FGFR3-TACC3-positive tumors revealed that positive
specimens manifest strong and uniform expression of the fusion protein, which is also retained after
recurrence. This behavior is reminiscent of other driver chromosome translocations (BCR-ABL,
EML4-ALK) and is compatible with the glioma-initiating functions of FGFR-TACC fusions (6). It is
also the scenario expected for a driver oncogene whose activity remains essential for tumor
maintenance regardless of secondary genetic alterations that occur during tumor progression.
The strong antitumor effects obtained with JNJ-42756493 in glioma cells harboring FGFR3-TACC3
fusions have built a compelling rationale for the treatment of glioma patients positive for FGFR-
TACC rearrangements. JNJ-42756493 is an oral ATP-competitive pan-FGFR selective inhibitor that
inhibits tyrosine phosphorylation of activated FGFR at nanomolar concentrations (34, 35). The
enrollment of two patients with recurrent FGFR3-TACC3-positive GBM in a phase I trial with JNJ-
42756493 showed that this treatment has tolerable toxicity and clear anti-tumor activity, thus
validating FGFR-TACC as a therapeutic target. Therefore, targeted inhibition of FGFR-TK in
26
preselected IDH wild type FGFR-TACC-positive glioma may provide clinical benefits for patients with
recurrent glioma who currently lack valuable therapeutic options. In conclusion, we have shown the
importance and feasibility of prospective genotyping for FGFR-TACC fusions in glioma patients and
provided a preliminary evidence of clinical response that warrants the investigation of the sensitivity
of gliomas harboring FGFR-TACC rearrangements to FGFR kinase inhibition in clinical trials.
27
Figure Legends
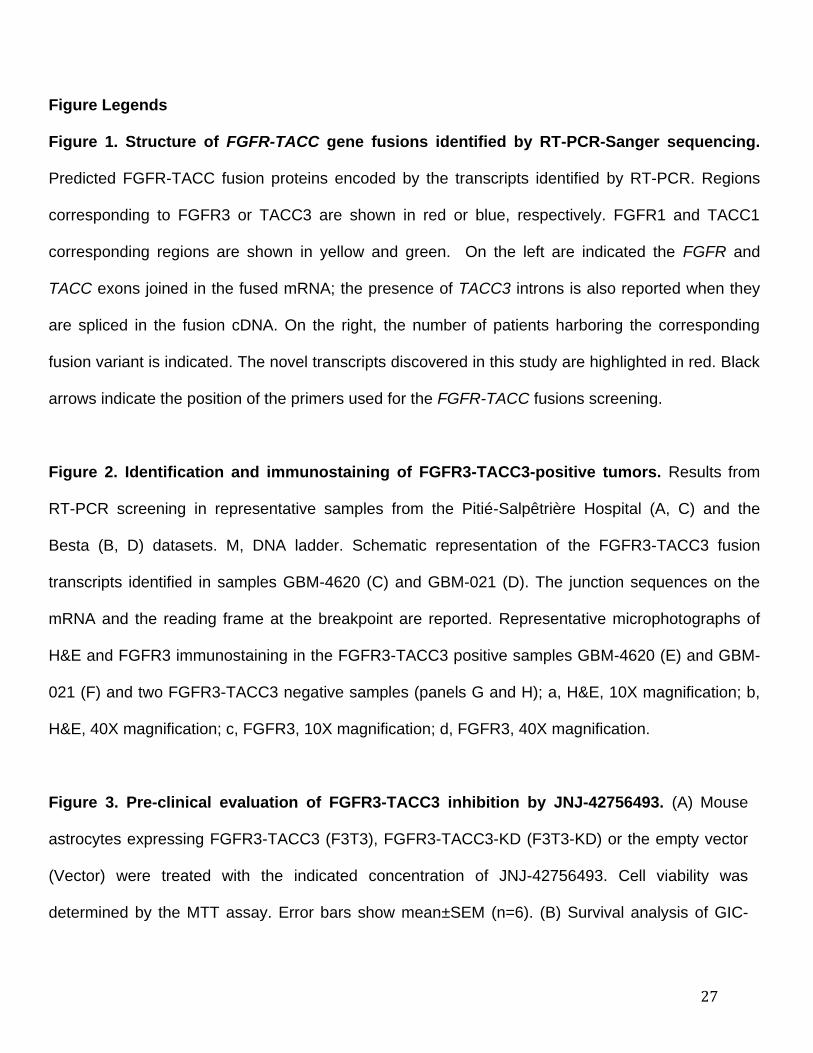
Figure 1. Structure of FGFR-TACC gene fusions identified by RT-PCR-Sanger sequencing.
Predicted FGFR-TACC fusion proteins encoded by the transcripts identified by RT-PCR. Regions
corresponding to FGFR3 or TACC3 are shown in red or blue, respectively. FGFR1 and TACC1
corresponding regions are shown in yellow and green. On the left are indicated the FGFR and
TACC exons joined in the fused mRNA; the presence of TACC3 introns is also reported when they
are spliced in the fusion cDNA. On the right, the number of patients harboring the corresponding
fusion variant is indicated. The novel transcripts discovered in this study are highlighted in red. Black
arrows indicate the position of the primers used for the FGFR-TACC fusions screening.
Figure 2. Identification and immunostaining of FGFR3-TACC3-positive tumors. Results from
RT-PCR screening in representative samples from the Pitié-Salpêtrière Hospital (A, C) and the
Besta (B, D) datasets. M, DNA ladder. Schematic representation of the FGFR3-TACC3 fusion
transcripts identified in samples GBM-4620 (C) and GBM-021 (D). The junction sequences on the
mRNA and the reading frame at the breakpoint are reported. Representative microphotographs of
H&E and FGFR3 immunostaining in the FGFR3-TACC3 positive samples GBM-4620 (E) and GBM-
021 (F) and two FGFR3-TACC3 negative samples (panels G and H); a, H&E, 10X magnification; b,
H&E, 40X magnification; c, FGFR3, 10X magnification; d, FGFR3, 40X magnification.
Figure 3. Pre-clinical evaluation of FGFR3-TACC3 inhibition by JNJ-42756493. (A) Mouse
astrocytes expressing FGFR3-TACC3 (F3T3), FGFR3-TACC3-KD (F3T3-KD) or the empty vector
(Vector) were treated with the indicated concentration of JNJ-42756493. Cell viability was
determined by the MTT assay. Error bars show mean±SEM (n=6). (B) Survival analysis of GIC-
28
1123 treated with JNJ-42756493. (C) The FGFR-TK inhibitor JNJ-42756493 suppresses tumor
growth of subcutaneous tumors generated by GIC-1123. After tumor establishment (arrow) mice
were treated with vehicle or JNJ-42756493 (12 mg/kg) for 14 days. Values are mean tumor
volumes±SD, (n=9 mice per group). P-value of the slope calculated from the treatment starting
point (arrow) is 0.04. (D) Photograph showing the tumors dissected from vehicle or JNJ-42756493
treated mice after two weeks of treatment.
Figure 4. Baseline and post-treatment Magnetic Resonance Imaging (MRI) of patients treated
with JNJ-42756493.. Patient 1 (Panels A-D). (A) Post-gadolinium T1 weighted images show the
target lesion on the right parietal lobe. The interval (days) from the beginning of follow-up is indicated
above each MRI. (B) Analysis of sum of product diameters (SPD) before and during the anti-FGFR
treatment (RANO criteria). (C) Analysis of tumor volume (cm3) before and during the anti-FGFR
treatment. During anti-FGFR treatment a stabilization of the tumor was observed according to RANO
criteria and volumetry. (D) Perfusion images at baseline and after 20 days of anti-FGFR treatment.
rCBV (relative cerebral blood volume). Post-gadolinium T1 weighted images with color overlay of
rCBV are shown. Patient 2 (Panels E-G). (E) Two different MRI slice levels of superior and middle
part of the lesion are presented. (F) Analysis of sum of product diameters (SPD) before and during
the anti-FGFR treatment. During the anti-FGFR treatment a reduction of 22% of tumor size was
observed. (G) Volumetric evaluation showed a 28% tumor reduction. Vertical red arrow indicates the
start of anti-FGFR treatment (baseline).
Table Legends
29
Table 1. Frequency of FGFR3-TACC3 Fusions in GBM and Grade II-III glioma. Distribution of the
FGFR3-TACC3 fusions in GBM (upper panel) and lower grade glioma (lower panel) samples
stratified according to the Institution of origin. The table reports number of cases analyzed, number
of tumors harboring FGFR3-TACC3 fusion transcripts, and results of FGFR3 immunostaining. Lower
grade glioma samples are further classified according to IDH status (IDH1 and IDH2). The respective
frequency of FGFR3-TACC3 in GBM, Glioma grade II-III IDH wild type (wt), and IDH mutant (Mut)
glioma is reported in parentheses. R§ ,Recurrent GBM. £, Recurrent GBM from the University of
Calgary Dataset is not included in the total count of GBM. *, 25 cases out of 85 are unknown for
IDH2 status.
Table 2. Molecular alterations in IDH wild type glioma harboring FGFR3-TACC3 fusions. The
table reports the absolute number and frequency (percentage) of individual glioma-specific
molecular alterations in tumors scoring positive or negative for FGFR3-TACC3 fusions. The analysis
is done on the Union dataset (TCGA and “Pitié-Salpêtrière Hospital” datasets, see methods for
details). Statistically significant associations are indicated in bold (Fisher Exact test, q-values
adjusted with FDR).
30
REFERENCES
1. Medves S, Demoulin JB. Tyrosine kinase gene fusions in cancer: translating mechanisms into
targeted therapies. J Cell Mol Med 2012;16:237-48.
2. Mitelman F, Johansson B, Mertens F. The impact of translocations and gene fusions on cancer
causation. Nat Rev Cancer 2007;7:233-45.
3. Weathers SP, Gilbert MR. Advances in treating glioblastoma. F1000Prime Rep. 2014;6:46.
4. Omuro A, DeAngelis LM. Glioblastoma and other malignant gliomas: a clinical review. JAMA
2013;310:1842-50.
5. Sanson M, Marie Y, Paris S, Idbaih A, Laffaire J, Ducray F, et al. Isocitrate dehydrogenase 1
codon 132 mutation is an important prognostic biomarker in gliomas. J Clin Oncol
2009;27:4150-4.
6. Singh D, Chan JM, Zoppoli P, Niola F, Sullivan R, Castano A, et al. Transforming fusions of
FGFR and TACC genes in human glioblastoma. Science 2012;337:1231-5.
7. Cancer Genome Atlas Research N. Comprehensive molecular characterization of urothelial
bladder carcinoma. Nature 2014;507:315-22.
8. Majewski IJ, Mittempergher L, Davidson NM, Bosma A, Willems SM, Horlings HM, et al.
Identification of recurrent FGFR3 fusion genes in lung cancer through kinome-centred RNA
sequencing. J Pathol 2013;230:270-6.
9. Parker BC, Annala MJ, Cogdell DE, Granberg KJ, Sun Y, Ji P, et al. The tumorigenic FGFR3-
TACC3 gene fusion escapes miR-99a regulation in glioblastoma. J Clin Invest 2013;123:855-65.
10. Wang R, Wang L, Li Y, Hu H, Shen L, Shen X, et al. FGFR1/3 Tyrosine Kinase Fusions Define
a Unique Molecular Subtype of Non-Small Cell Lung Cancer. Clin Cancer Res 2014; 20:4107-
14.
11. Williams SV, Hurst CD, Knowles MA. Oncogenic FGFR3 gene fusions in bladder cancer. Hum
Mol Genet 2013;22:795-803.
12. Wu YM, Su F, Kalyana-Sundaram S, Khazanov N, Ateeq B, Cao X, et al. Identification of
targetable FGFR gene fusions in diverse cancers. Cancer Discov 2013;3:636-47.
13. Zhang J, Wu G, Miller CP, Tatevossian RG, Dalton JD, Tang B, et al. Whole-genome
sequencing identifies genetic alterations in pediatric low-grade gliomas. Nat Genet 2013;45:602-
12.
14. Capelletti M, Dodge ME, Ercan D, Hammerman PS, Park SI, Kim J, et al. Identification of
Recurrent FGFR3-TACC3 Fusion Oncogenes from Lung Adenocarcinoma. Clin Cancer Res
2014, DOI: 10.1158/1078-0432.CCR-14-1337; in press.
31
15. Stransky N, Cerami E, Schalm S, Kim JL, Lengauer C. The landscape of kinase fusions in
cancer. Nat Commun 2014;5:4846.
16. Inda MM, Bonavia R, Mukasa A, Narita Y, Sah DW, Vandenberg S, et al. Tumor heterogeneity
is an active process maintained by a mutant EGFR-induced cytokine circuit in glioblastoma.
Genes Dev 2010;24:1731-45.
17. Snuderl M, Fazlollahi L, Le LP, Nitta M, Zhelyazkova BH, Davidson CJ, et al. Mosaic
amplification of multiple receptor tyrosine kinase genes in glioblastoma. Cancer Cell
2011;20:810-7.
18. Ene CI, Fine HA. Many tumors in one: a daunting therapeutic prospect. Cancer Cell
2011;20:695-7.
19. Sottoriva A, Spiteri I, Piccirillo SG, Touloumis A, Collins VP, Marioni JC, et al. Intratumor
heterogeneity in human glioblastoma reflects cancer evolutionary dynamics. Proc Natl Acad Sci
U S A 2013;110:4009-14.
20. Kindich R, Florl AR, Jung V, Engers R, Muller M, Schulz WA, et al. Application of a modified
real-time PCR technique for relative gene copy number quantification to the determination of the
relationship between NKX3.1 loss and MYC gain in prostate cancer. Clin Chem 2005;51:649-
52.
21. Bulusu KC, Tym JE, Coker EA, Schierz AC, Al-Lazikani B. canSAR: updated cancer research
and drug discovery knowledgebase. Nucleic Acids Res 2014;42:D1040-7.
22. Reyes-Botero G, Giry M, Mokhtari K, Labussiere M, Idbaih A, Delattre JY, et al. Molecular
analysis of diffuse intrinsic brainstem gliomas in adults. J Neurooncol 2014;116:405-11.
23. Labussière M BB, Mokhtari K, Di Stefano AL, Rahimian A, Rossetto M, Ciccarino P, Saulnier O,
Paterra R, Marie Y, Finocchiaro G, Sanson M. Combined analysis of TERT, EGFR and IDH
status define distinct prognostic glioblastoma classes. Neurology 2014; 83:1200-6.
24. Quillien V, Lavenu A, Karayan-Tapon L, Carpentier C, Labussiere M, Lesimple T, et al.
Comparative assessment of 5 methods (methylation-specific polymerase chain reaction,
MethyLight, pyrosequencing, methylation-sensitive high-resolution melting, and
immunohistochemistry) to analyze O6-methylguanine-DNA-methyltranferase in a series of 100
glioblastoma patients. Cancer 2012;118:4201-11.
25. Idbaih A, Aimard J, Boisselier B, Marie Y, Paris S, Criniere E, et al. Epidermal growth factor
receptor extracellular domain mutations in primary glioblastoma. Neuropathol Appl Neurobiol
2009;35:208-13.
32
26. Idbaih A, Marie Y, Lucchesi C, Pierron G, Manie E, Raynal V, et al. BAC array CGH
distinguishes mutually exclusive alterations that define clinicogenetic subtypes of gliomas. Int J
Cancer 2008;122:1778-86.
27. Gonzalez-Aguilar A, Idbaih A, Boisselier B, Habbita N, Rossetto M, Laurenge A, et al. Recurrent
mutations of MYD88 and TBL1XR1 in primary central nervous system lymphomas. Clin Cancer
Res 2012;18:5203-11.
28. Olshen AB, Venkatraman ES, Lucito R, Wigler M. Circular binary segmentation for the analysis
of array-based DNA copy number data. Biostatistics 2004;5:557-72.
29. Hoang-Xuan K, He J, Huguet S, Mokhtari K, Marie Y, Kujas M, et al. Molecular heterogeneity of
oligodendrogliomas suggests alternative pathways in tumor progression. Neurology
2001;57:1278-81.
30. Houillier C, Lejeune J, Benouaich-Amiel A, Laigle-Donadey F, Criniere E, Mokhtari K, et al.
Prognostic impact of molecular markers in a series of 220 primary glioblastomas. Cancer
2006;106:2218-23.
31. Goldman M, Craft B, Swatloski T, Ellrott K, Cline M, Diekhans M, et al. The UCSC Cancer
Genomics Browser: update 2013. Nucleic Acids Res 2013;41:D949-54.
32. Brennan CW, Verhaak RG, McKenna A, Campos B, Noushmehr H, Salama SR, et al. The
somatic genomic landscape of glioblastoma. Cell 2013;155:462-77.
33. Wen PY, Macdonald DR, Reardon DA, Cloughesy TF, Sorensen AG, Galanis E, et al. Updated
response assessment criteria for high-grade gliomas: response assessment in neuro-oncology
working group. J Clin Oncol 2010;28:1963-72.
34. Bahleda R, Dienstmann R, Adamo B, Gazzah A, Infante JR, Zhong B, et al. Phase 1 study of
JNJ-42756493, a pan-fibroblast growth factor receptor (FGFR) inhibitor, in patients with
advanced solid tumors. J Clin Oncol 2014;32:suppl; abstr 2501.
35. Squires M, Ward G, Saxty G, Berdini V, Cleasby A, King P, et al. Potent, selective inhibitors of
fibroblast growth factor receptor define fibroblast growth factor dependence in preclinical cancer
models. Mol Cancer Ther 2011;10:1542-52.
36. Stupp R, Mason WP, van den Bent MJ, Weller M, Fisher B, Taphoorn MJ, et al. Radiotherapy
plus concomitant and adjuvant temozolomide for glioblastoma. N Engl J Med 2005;352:987-96.
37. Law M, Yang S, Babb JS, Knopp EA, Golfinos JG, Zagzag D, et al. Comparison of cerebral
blood volume and vascular permeability from dynamic susceptibility contrast-enhanced
perfusion MR imaging with glioma grade. AJNR Am J Neuroradiol 2004;25:746-55.

33
38. Wang XS, Prensner JR, Chen G, Cao Q, Han B, Dhanasekaran SM, et al. An integrative
approach to reveal driver gene fusions from paired-end sequencing data in cancer. Nat
Biotechnol 2009;27:1005-11.
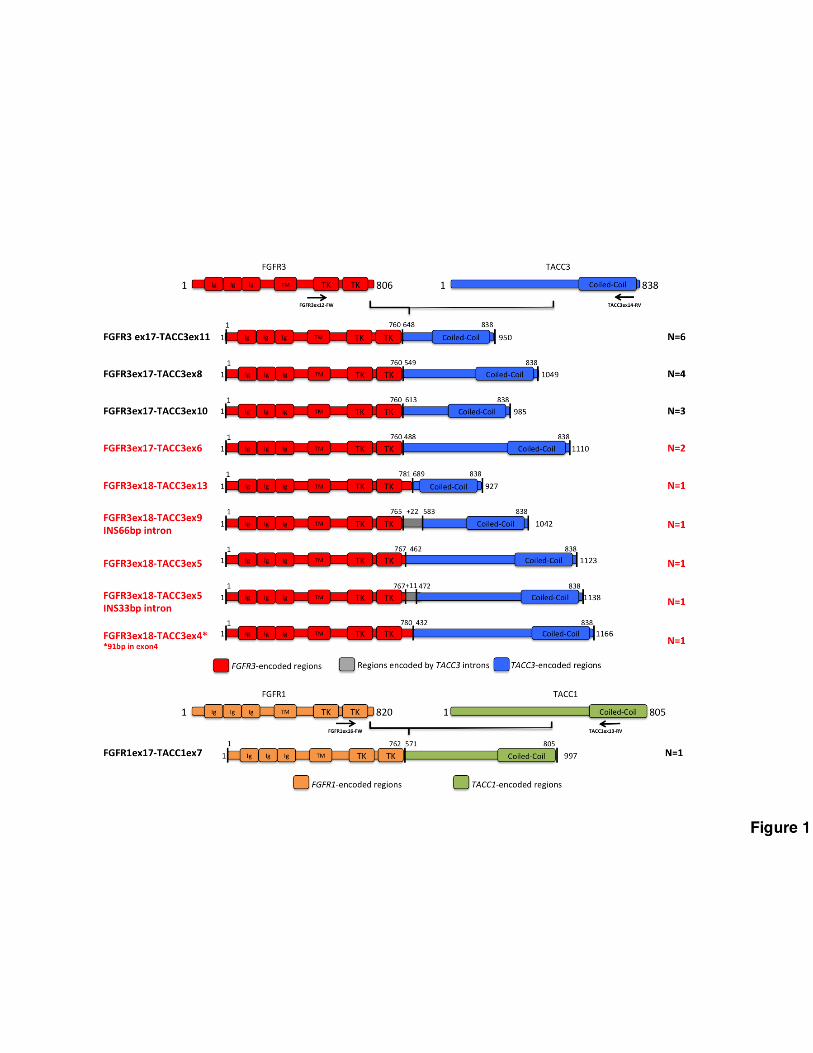
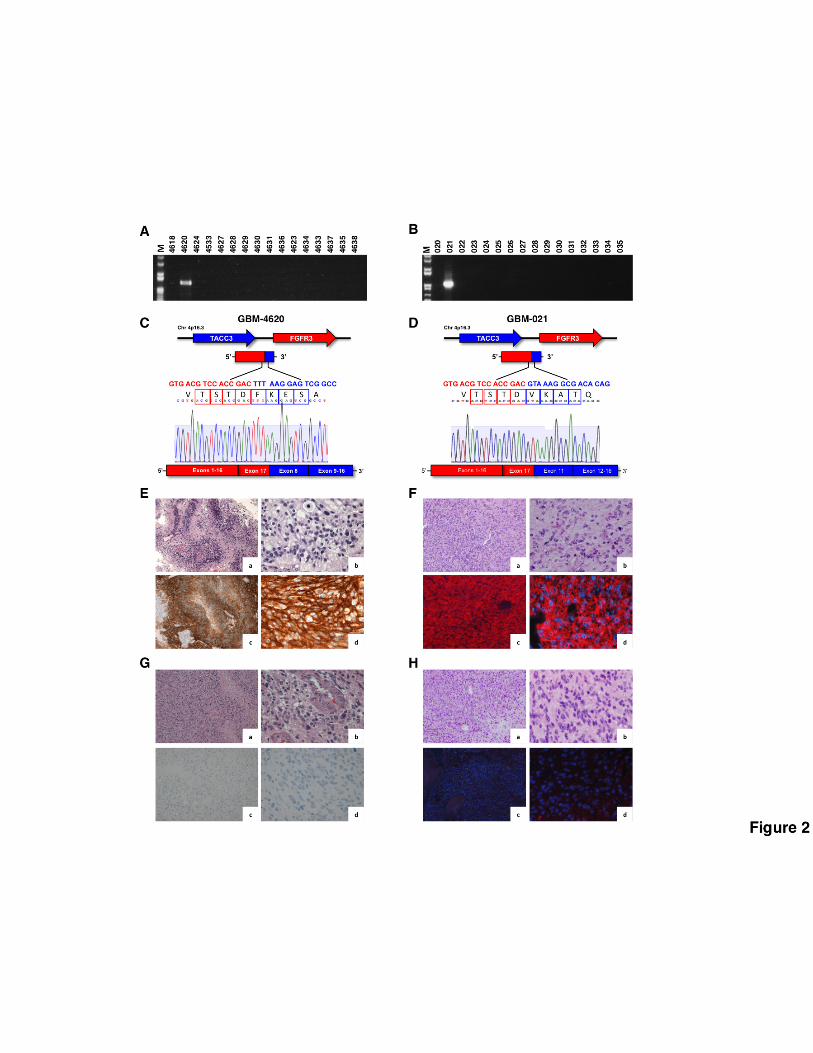
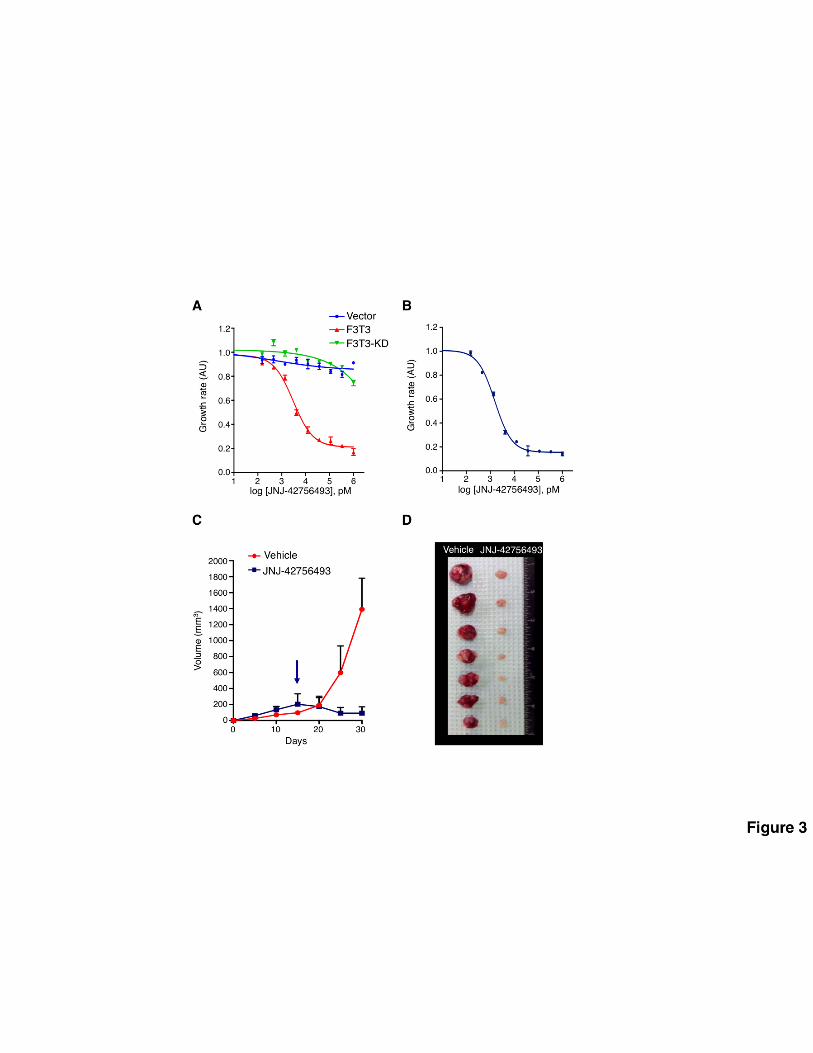
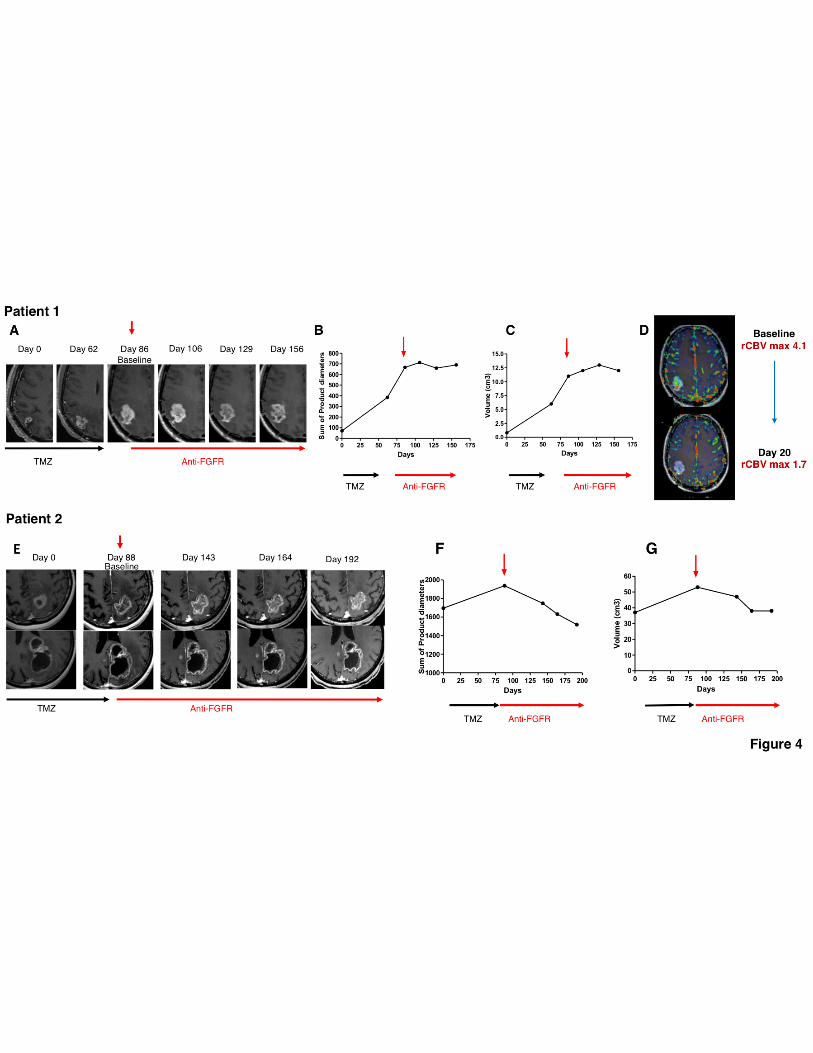
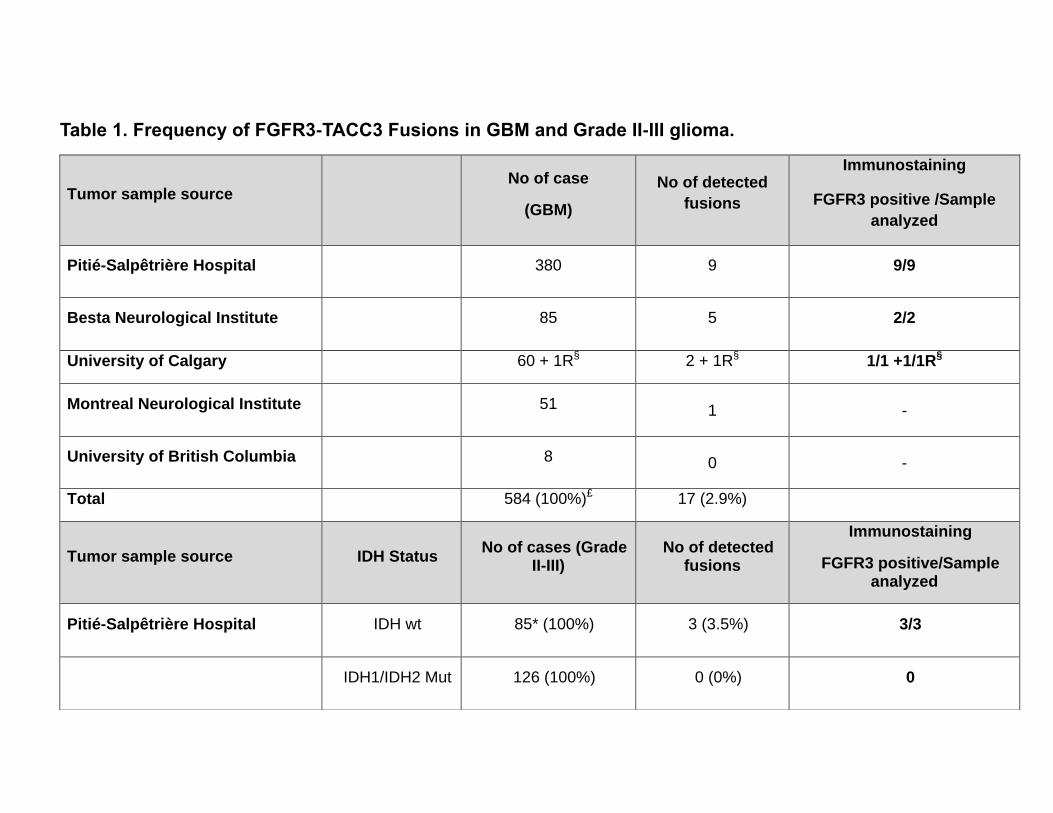
Table 1. Frequency of FGFR3-TACC3 Fusions in GBM and Grade II-III glioma.
Tumor sample source No of case
(GBM)
No of detected
fusions
Immunostaining
FGFR3 positive /Sample
analyzed
Pitié-Salpêtrière Hospital 380 9 9/9
Besta Neurological Institute 85 5 2/2
University of Calgary 60 + 1R§ 2 + 1R§ 1/1 +1/1R§
Montreal Neurological Institute 51 1 -
University of British Columbia 8 0 -
Total 584 (100%)£ 17 (2.9%)
Tumor sample source IDH Status No of cases (Grade
II-III) No of detected
fusions
Immunostaining
FGFR3 positive/Sample analyzed
Pitié-Salpêtrière Hospital IDH wt 85* (100%) 3 (3.5%) 3/3
IDH1/IDH2 Mut 126 (100%) 0 (0%) 0
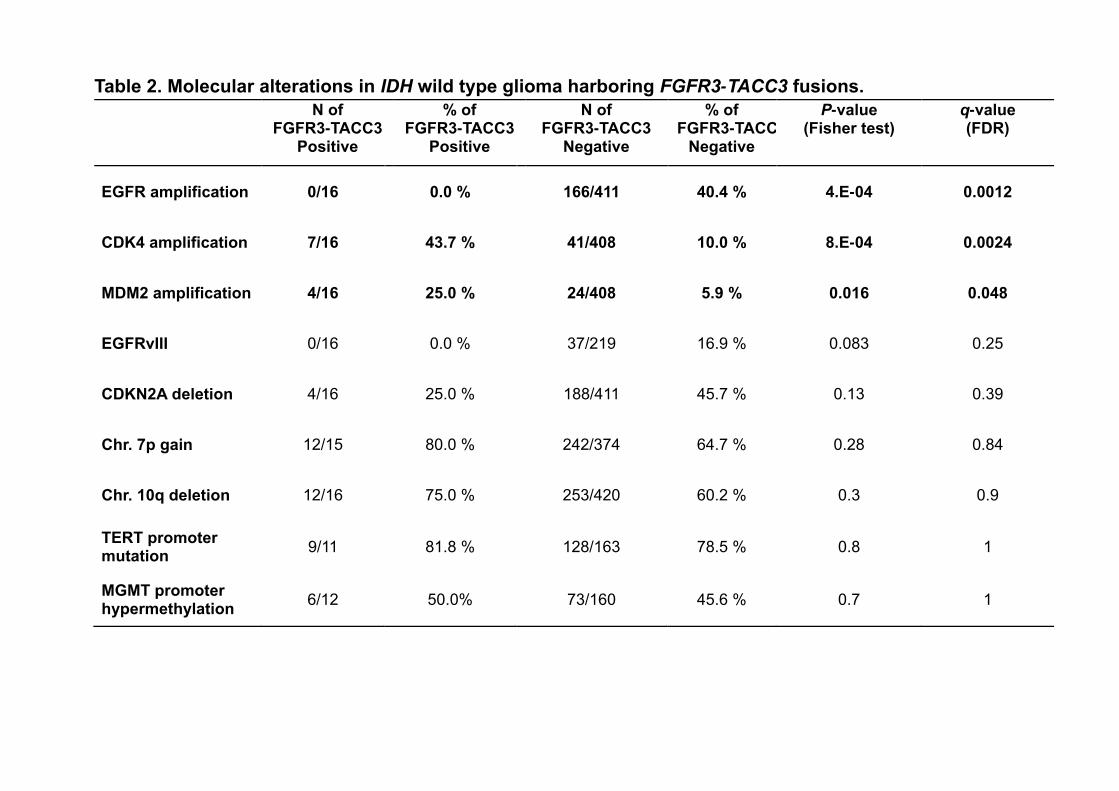
Table 2. Molecular alterations in IDH wild type glioma harboring FGFR3-TACC3 fusions.
N of FGFR3-TACC3
Positive
% of FGFR3-TACC3
Positive
N of FGFR3-TACC3
Negative
% of FGFR3-TACC3
Negative
P-value (Fisher test)
q-value (FDR)
EGFR amplification 0/16 0.0 % 166/411 40.4 % 4.E-04 0.0012
CDK4 amplification 7/16 43.7 % 41/408 10.0 % 8.E-04 0.0024
MDM2 amplification 4/16 25.0 % 24/408 5.9 % 0.016 0.048
EGFRvIII 0/16 0.0 % 37/219 16.9 % 0.083 0.25
CDKN2A deletion 4/16 25.0 % 188/411 45.7 % 0.13 0.39
Chr. 7p gain 12/15 80.0 % 242/374 64.7 % 0.28 0.84
Chr. 10q deletion 12/16 75.0 % 253/420 60.2 % 0.3 0.9
TERT promoter mutation
9/11 81.8 % 128/163 78.5 % 0.8 1
MGMT promoter hypermethylation
6/12 50.0% 73/160 45.6 % 0.7 1
Related Documents