Professor Mike Gleeson School of Sport, Exercise & Health Sciences Loughborough University Detection and Prevention of Overtraining in Athletes Hellenic Society of Biochemistry and Physiology of Exercise, Athens, 12-13 October 2012

Welcome message from author
This document is posted to help you gain knowledge. Please leave a comment to let me know what you think about it! Share it to your friends and learn new things together.
Transcript
Professor Mike Gleeson
School of Sport, Exercise & Health Sciences
Loughborough University
Detection and Prevention
of Overtraining in Athletes
Hellenic Society of Biochemistry and Physiology of Exercise, Athens, 12-13 October 2012

Overtraining lecture summary
Definition of overtraining
Symptoms & causes of overtraining
Diagnosis of overtraining
Evaluation of markers
Prevention of overtraining

Overtraining – ECSS-ACSM Consensus
Meeusen et al (2006) Eur J Sport Sci 6(1): 1-14
Meeusen et al (2012) Eur J Sport Sci & Med Sci Sports Exerc
Prevention, diagnosis and treatment of the Overtraining Syndrome (2012)
Joint consensus statement of the European College of Sport Science
(ECSS) and the American College of Sports Medicine (ACSM)
Romain Meeusen, Belgium (chair)
Martine Duclos, France
Carl Foster, USA
Andrew Fry, USA
Michael Gleeson, UK
David Nieman, USA
John Raglin, USA
Gerard Rietjens, The Netherlands
Jürgen Steinacker, Germany
Axel Urhausen, Luxembourg

What is overtraining syndrome?
Burnout
Overwork
Staleness
Chronic fatigue
Unexplained under-performance

Definition of overtraining
Overtraining: An accumulation of
training-related stress resulting in
persisting decrement in performance
capacity lasting weeks or months
Overreaching: An accumulation of
training-related stress resulting in
temporary decrement in performance
capacity lasting less than 2 weeks

6
Relationship between Training
Load and Performance
85
90
95
100
105
0 1000 2000 3000 4000 5000 6000 7000 8000
Training Load
Pe
rfo
rma
nc
e (
% P
ers
on
al B
es
t)
Undertraining
Overreaching
Overtraining Syndrome
Peaking after taper

Overtrained or fatigued?
Acute fatigue after exercise
Glycogen depletion (24-48 hrs to recover)
Delayed onset muscle soreness (2-3 days)
Illness (e.g. viral infection)
Allergy
Anaemia
Vitamin D deficiency?
Possible causes of under-performance:

Alternative definition (2000)
Unexplained Under-performance
Syndrome (UPS):
A persistent unexplained performance
deficit (recognised and agreed by
coach and athlete) despite two weeks
of relative rest
Budgett et al (2000) Br J Sports Med 34: 67-68
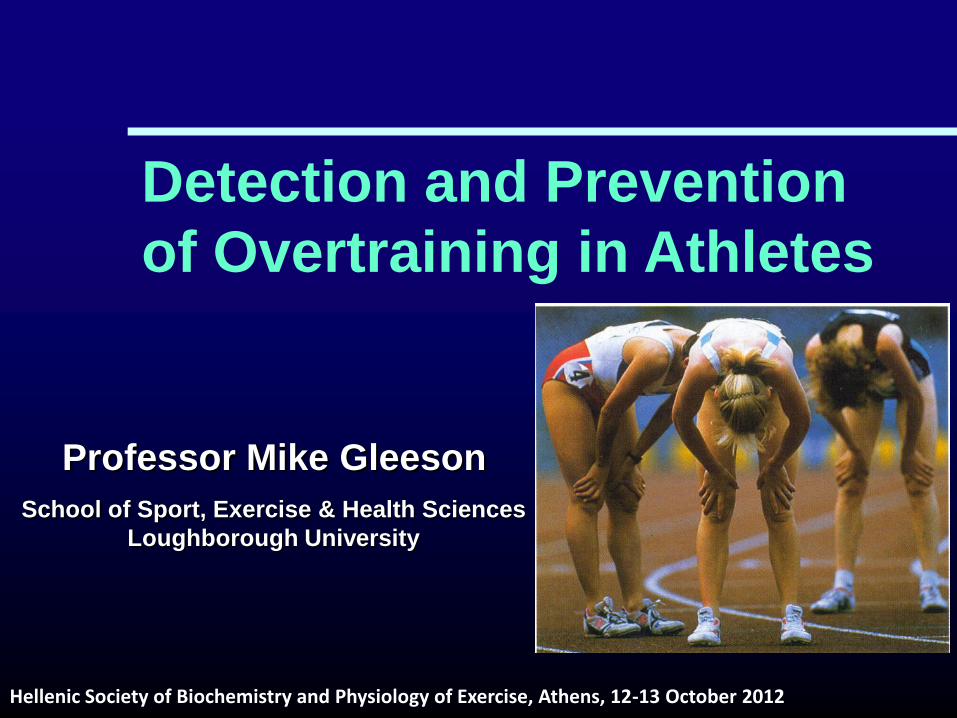
Symptoms of Overtraining
ALSO:
History of heavy training and competition
Frequent minor infections
Heavy/stiff/sore muscles
Mood disturbance: irritability, depression
Disturbed sleep
Loss of energy/drive/appetite
ALWAYS:
Fatigue and unexpected sense of effort during
training and under-performance in competition
No.1 marker of overtraining in male athletes
Loss of sexual appetite
Sorry love,
I’m too tired
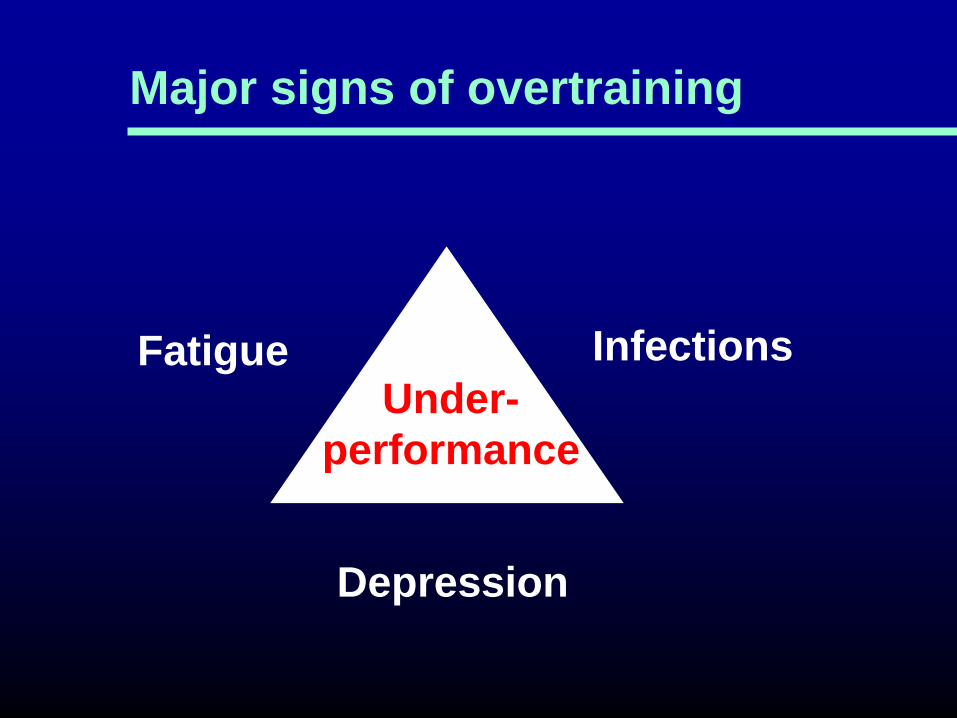
Major signs of overtraining
Fatigue Infections
Depression
Under-
performance
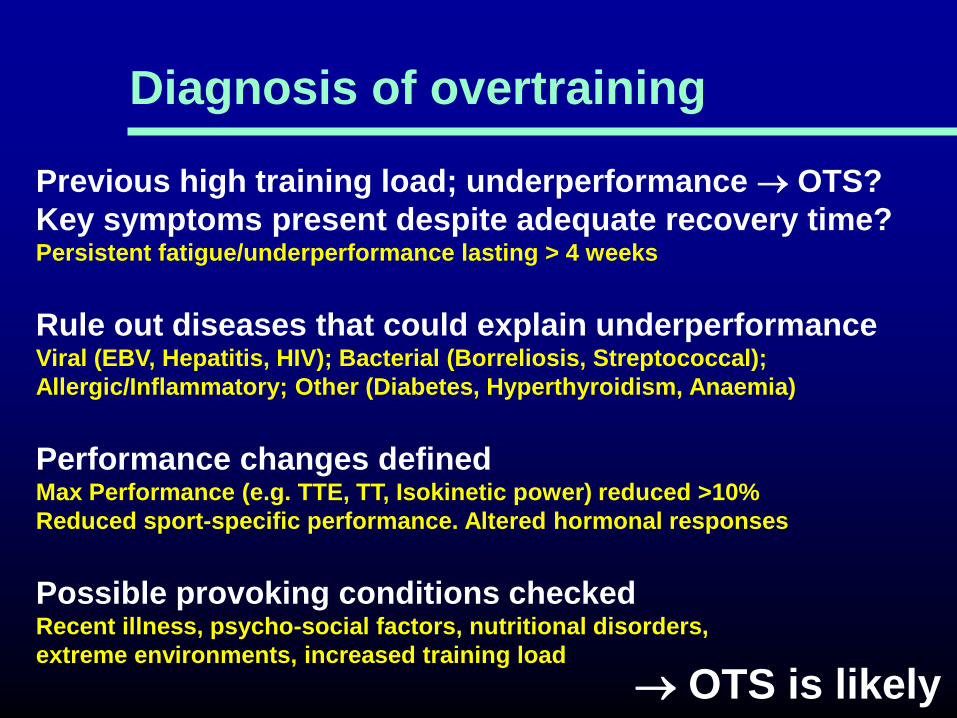
Diagnosis of overtraining
Previous high training load; underperformance OTS?
Key symptoms present despite adequate recovery time? Persistent fatigue/underperformance lasting > 4 weeks
Rule out diseases that could explain underperformance Viral (EBV, Hepatitis, HIV); Bacterial (Borreliosis, Streptococcal);
Allergic/Inflammatory; Other (Diabetes, Hyperthyroidism, Anaemia)
Performance changes defined Max Performance (e.g. TTE, TT, Isokinetic power) reduced >10%
Reduced sport-specific performance. Altered hormonal responses
Possible provoking conditions checked Recent illness, psycho-social factors, nutritional disorders,
extreme environments, increased training load
OTS is likely
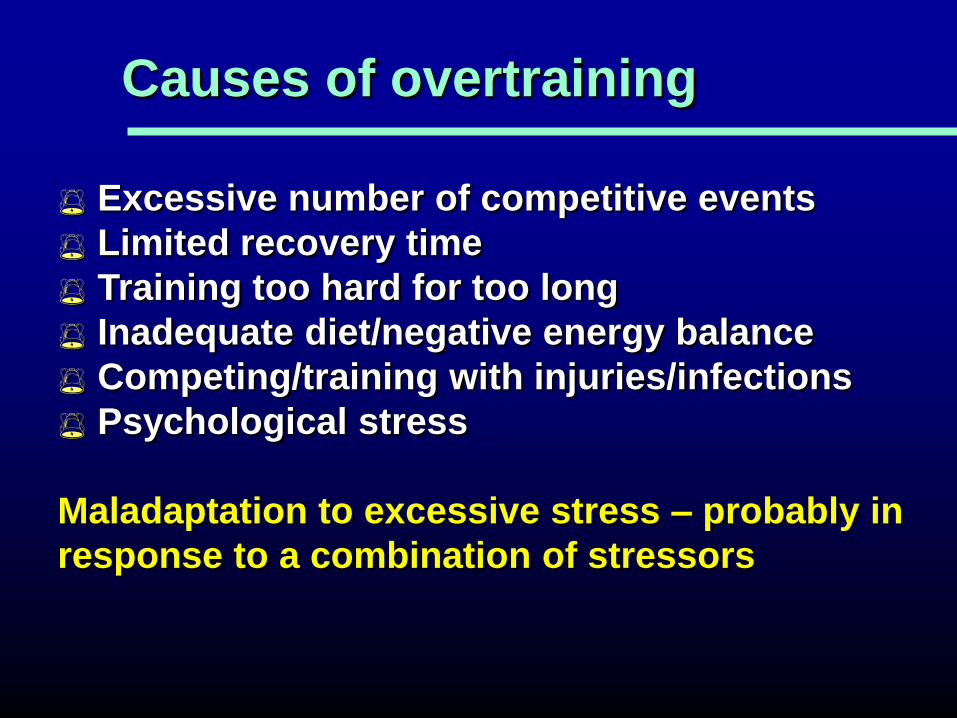
Causes of overtraining
Excessive number of competitive events
Limited recovery time
Training too hard for too long
Inadequate diet/negative energy balance
Competing/training with injuries/infections
Psychological stress
Maladaptation to excessive stress – probably in
response to a combination of stressors

Training and hormones
Acute bouts of exercise and stress elevate
stress hormone secretion
Excessive training (stress) may lead to a
hormonal imbalance:
Reduced adrenal
hormone responses
to exercise and
tissue insensitivity to
catecholamines
Disturbance of
pituitary hormone
secretion
Causing “parasympathetic”
type of overtraining syndrome
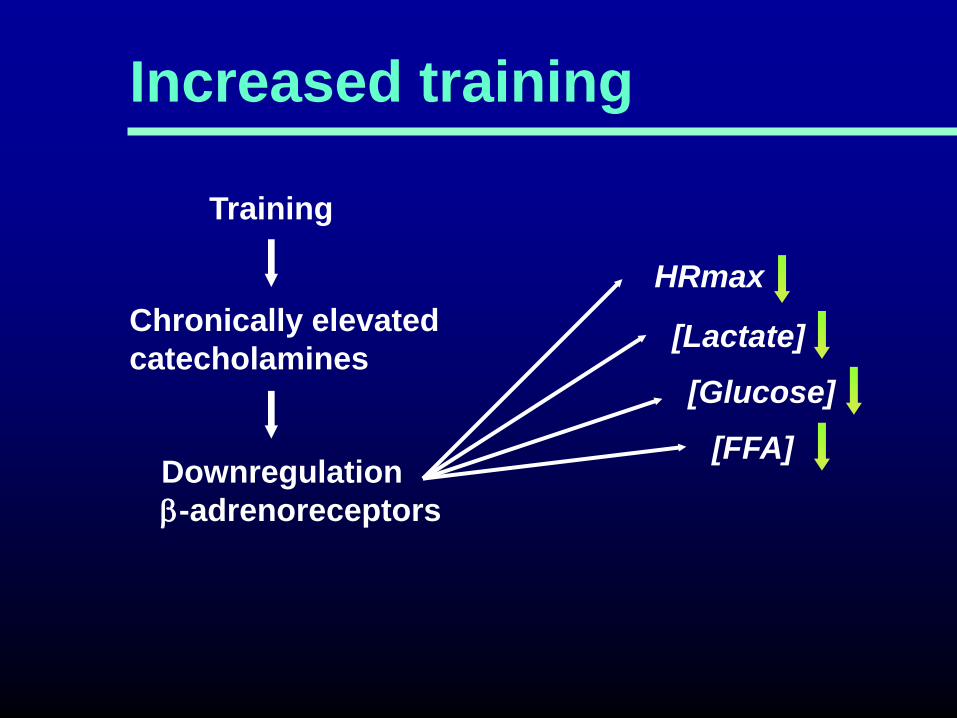
Increased training
Training
Chronically elevated
catecholamines
Downregulation
b-adrenoreceptors
HRmax
[Lactate]
[Glucose]
[FFA]
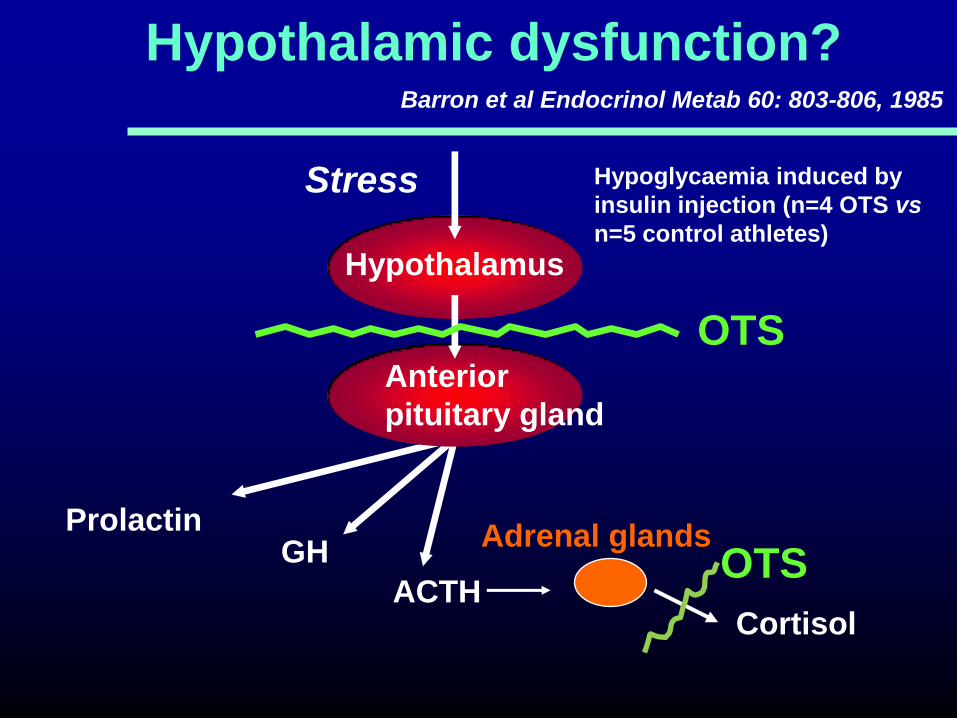
Hypothalamic dysfunction?
Hypothalamus
GH
ACTH
Prolactin
Cortisol
Stress
Anterior
pituitary gland
Adrenal glands
Barron et al Endocrinol Metab 60: 803-806, 1985
Hypoglycaemia induced by
insulin injection (n=4 OTS vs
n=5 control athletes)
OTS
OTS

Conclusions
Overtraining may result in lower submaximal and
maximal lactate concentrations during exercise
This may be due to decreased intrinsic activity of the
sympathetic nervous system rather than muscle
glycogen depletion
Overtraining is associated with reduced pituitary
hormone and cortisol responses to stress
Other hormonal and neurotransmitter changes may
be responsible for some of the symptoms of UPS
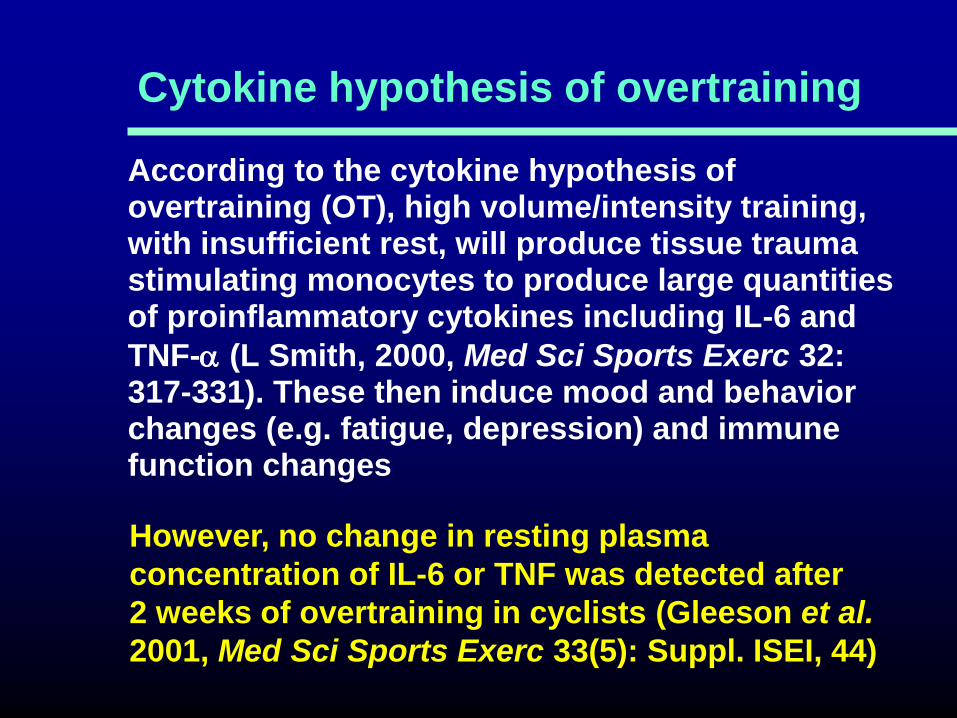
According to the cytokine hypothesis of overtraining (OT), high volume/intensity training, with insufficient rest, will produce tissue trauma stimulating monocytes to produce large quantities of proinflammatory cytokines including IL-6 and
TNF- (L Smith, 2000, Med Sci Sports Exerc 32: 317-331). These then induce mood and behavior changes (e.g. fatigue, depression) and immune function changes
Cytokine hypothesis of overtraining
However, no change in resting plasma
concentration of IL-6 or TNF was detected after
2 weeks of overtraining in cyclists (Gleeson et al.
2001, Med Sci Sports Exerc 33(5): Suppl. ISEI, 44)

**
Robson-Ansley et al 2007 Elevated plasma IL-6 levels in
trained male triathletes following an acute period of intense
interval running training. Eur J Appl Physiol 99: 353-360
0
1
2
3
4
5
6
7
Week 1 Week 2 Week 3 Week 4
Pla
sm
a IL
-6 (
pg
/ml)
* **
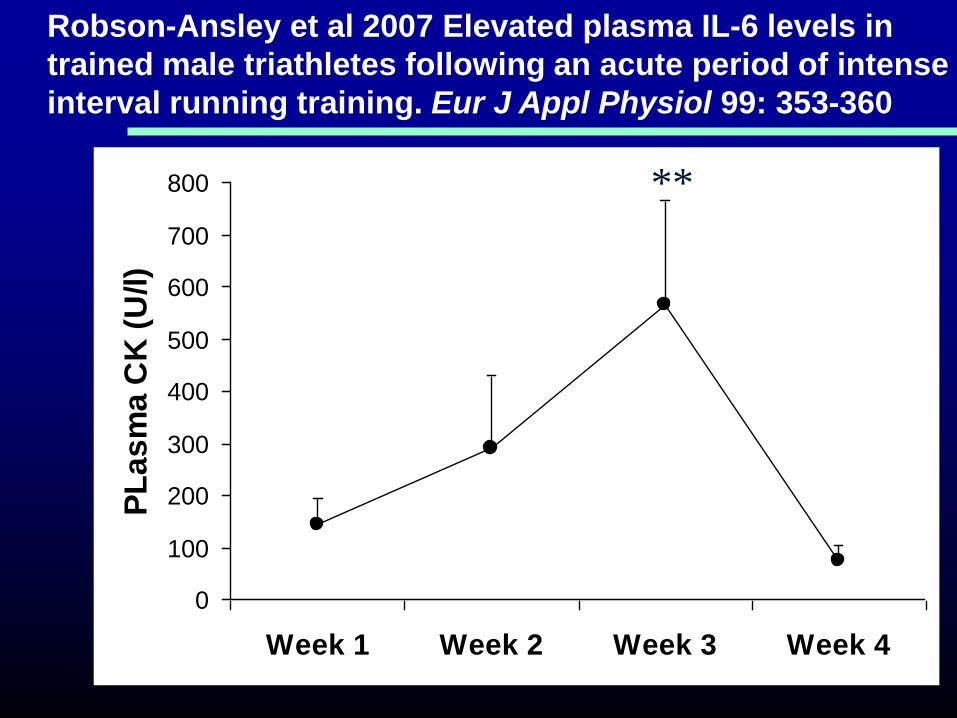
0
100
200
300
400
500
600
700
800
Week 1 Week 2 Week 3 Week 4
PL
as
ma
CK
(U
/l)
**
Robson-Ansley et al 2007 Elevated plasma IL-6 levels in
trained male triathletes following an acute period of intense
interval running training. Eur J Appl Physiol 99: 353-360
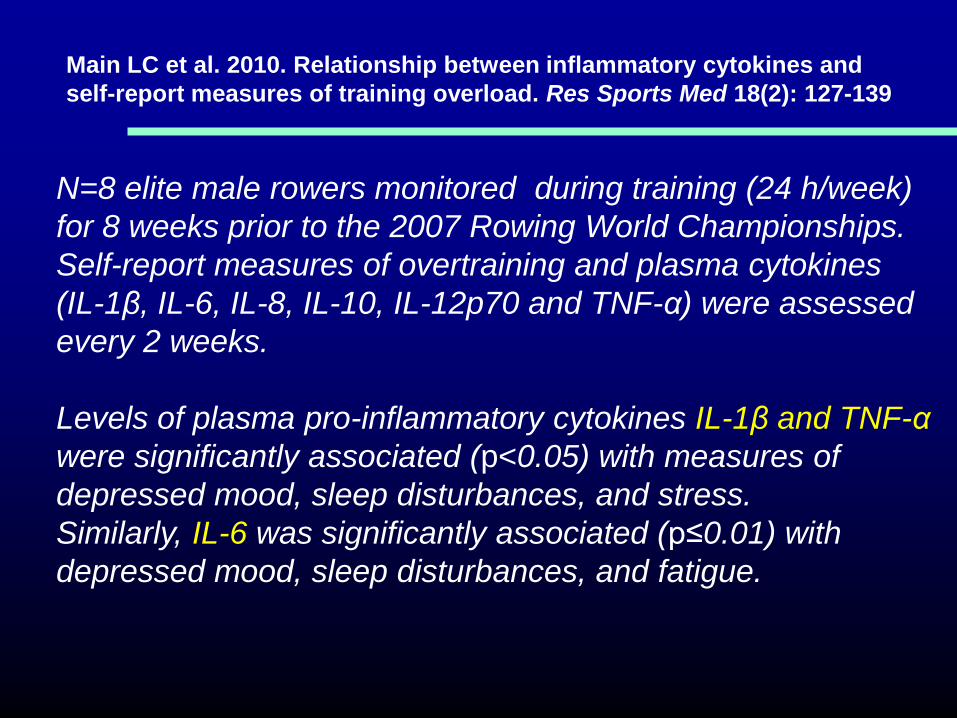
Main LC et al. 2010. Relationship between inflammatory cytokines and
self-report measures of training overload. Res Sports Med 18(2): 127-139
N=8 elite male rowers monitored during training (24 h/week)
for 8 weeks prior to the 2007 Rowing World Championships.
Self-report measures of overtraining and plasma cytokines
(IL-1β, IL-6, IL-8, IL-10, IL-12p70 and TNF-α) were assessed
every 2 weeks.
Levels of plasma pro-inflammatory cytokines IL-1β and TNF-α
were significantly associated (p<0.05) with measures of
depressed mood, sleep disturbances, and stress.
Similarly, IL-6 was significantly associated (p≤0.01) with
depressed mood, sleep disturbances, and fatigue.
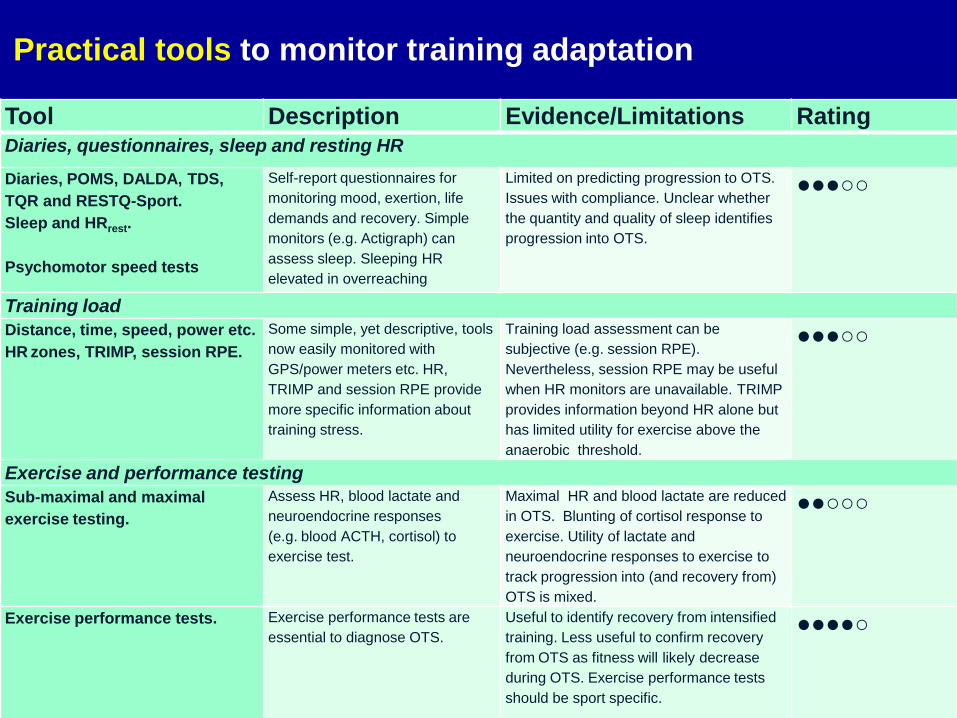
Practical tools to monitor training adaptation
Tool Description Evidence/Limitations Rating Diaries, questionnaires, sleep and resting HR
Diaries, POMS, DALDA, TDS,
TQR and RESTQ-Sport.
Sleep and HRrest.
Psychomotor speed tests
Self-report questionnaires for
monitoring mood, exertion, life
demands and recovery. Simple
monitors (e.g. Actigraph) can
assess sleep. Sleeping HR
elevated in overreaching
Limited on predicting progression to OTS.
Issues with compliance. Unclear whether
the quantity and quality of sleep identifies
progression into OTS.
●●●○○
Training load Distance, time, speed, power etc.
HR zones, TRIMP, session RPE.
Some simple, yet descriptive, tools
now easily monitored with
GPS/power meters etc. HR,
TRIMP and session RPE provide
more specific information about
training stress.
Training load assessment can be
subjective (e.g. session RPE).
Nevertheless, session RPE may be useful
when HR monitors are unavailable. TRIMP
provides information beyond HR alone but
has limited utility for exercise above the
anaerobic threshold.
●●●○○
Exercise and performance testing Sub-maximal and maximal
exercise testing.
Assess HR, blood lactate and
neuroendocrine responses
(e.g. blood ACTH, cortisol) to
exercise test.
Maximal HR and blood lactate are reduced
in OTS. Blunting of cortisol response to
exercise. Utility of lactate and
neuroendocrine responses to exercise to
track progression into (and recovery from)
OTS is mixed.
●●○○○
Exercise performance tests. Exercise performance tests are
essential to diagnose OTS.
Useful to identify recovery from intensified
training. Less useful to confirm recovery
from OTS as fitness will likely decrease
during OTS. Exercise performance tests
should be sport specific.
●●●●○

HR during sleep
48
50
52
54
56
58
1 2 3 4 5
Normal training Overtraining Tapering
Jeukendrup et al IJSM 13: 534-541, 1992
Week
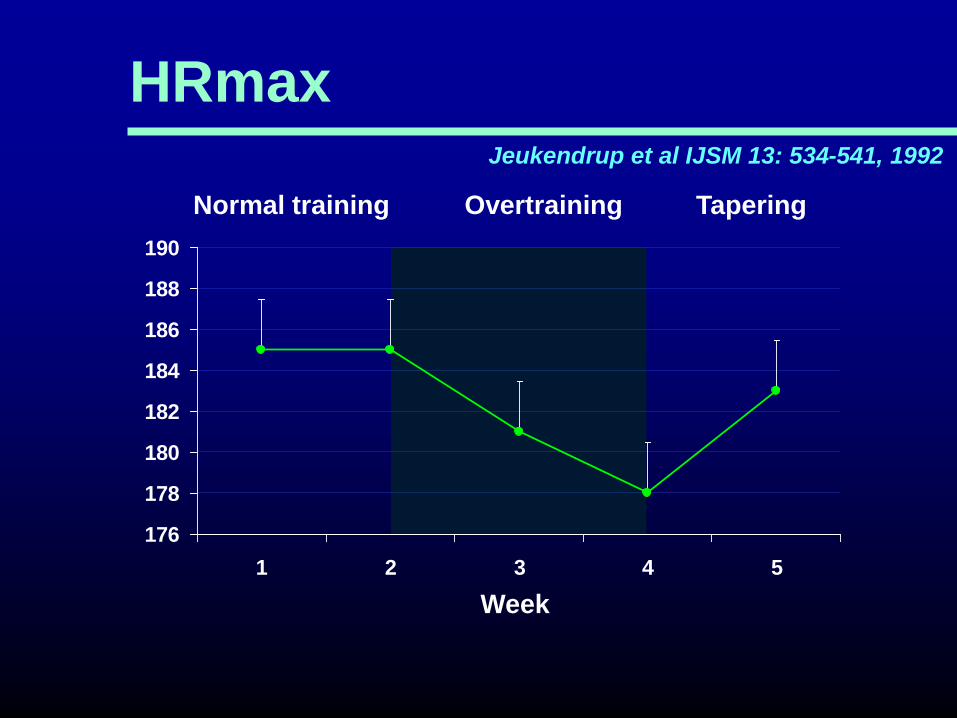
HRmax
176
178
180
182
184
186
188
190
1 2 3 4 5
Normal training Overtraining Tapering
Jeukendrup et al IJSM 13: 534-541, 1992
Week
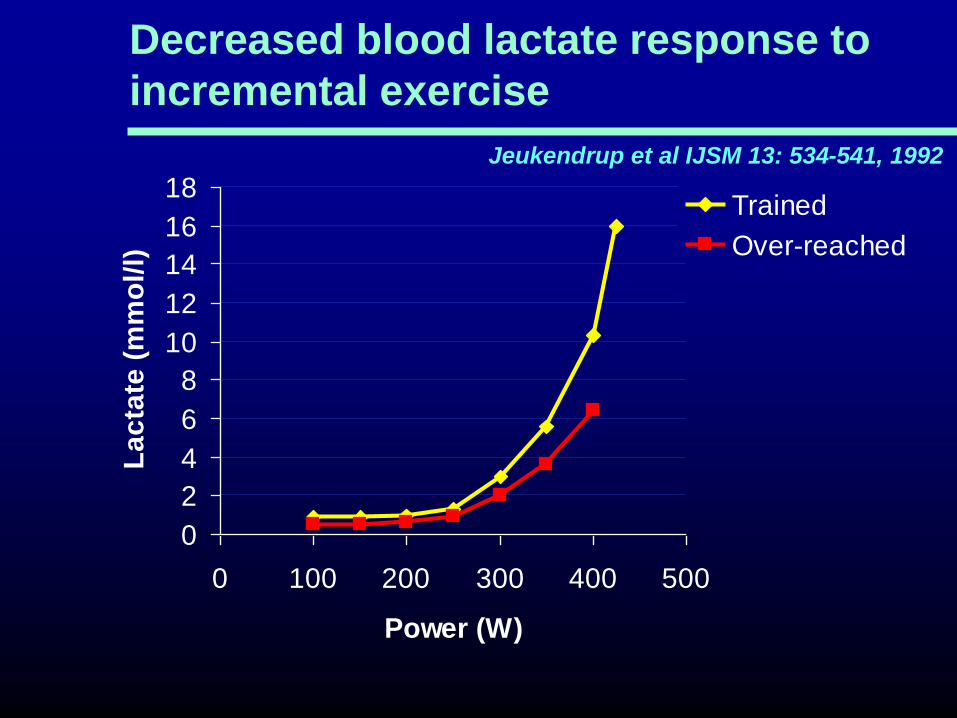
Decreased blood lactate response to
incremental exercise
0
2
4
6
8
10
12
14
16
18
0 100 200 300 400 500
Power (W)
La
cta
te (
mm
ol/
l)
Trained
Over-reached
Jeukendrup et al IJSM 13: 534-541, 1992

Biochemical and haematological tools to monitor training adaptation
Tool Description Evidence/Limitations Rating Biochemical Free testosterone: cortisol
ratio
Indicator of anabolic/catabolic
balance. Can be assessed in
both blood and saliva.
May indicate response to training but cannot identify
OTS. A low free T:C ratio (<30%) indicates over-
reaching. Unclear how these changes relate to
performance. Costly and time consuming.
●●○○○
Plasma glutamine Non-essential amino acid.
Important fuel for immune cells.
Ratio to glutamate may indicate
training stress.
Plasma glutamine decreases in response to
intensified training, over-reaching and OTS.
Ratio to glutamate has been shown to indicate
training intolerance. Requires blood sample. Costly
and time consuming.
●●●○○
Blood CK and CRP Indicators of muscle damage
and inflammation.
Not suitable to indicate training adaptation, over-
reaching or OTS. Some utility to exclude other
explanations for underperformance. Requires blood
sample. Costly and time consuming.
●○○○○
Serum iron, ferritin and
transferrin
Indicators of inflammation and
chronic recovery. Iron deficiency
can lead to anaemia.
May be reduced in chronically exercising individuals,
particularly during high intensity training. Decrease
may negatively affect performance. Requires blood
sample. Costly and time consuming.
●●○○○
Haematological Red blood cell count,
haemoglobin and
haematocrit. Differential
white blood cell count
Standard clinical laboratory
tests.
Normal clinical ranges established. Cannot detect
over-reaching or OTS. Useful for determining overall
health status. Can be performed on finger prick rather
than venous blood sample.
●●○○○
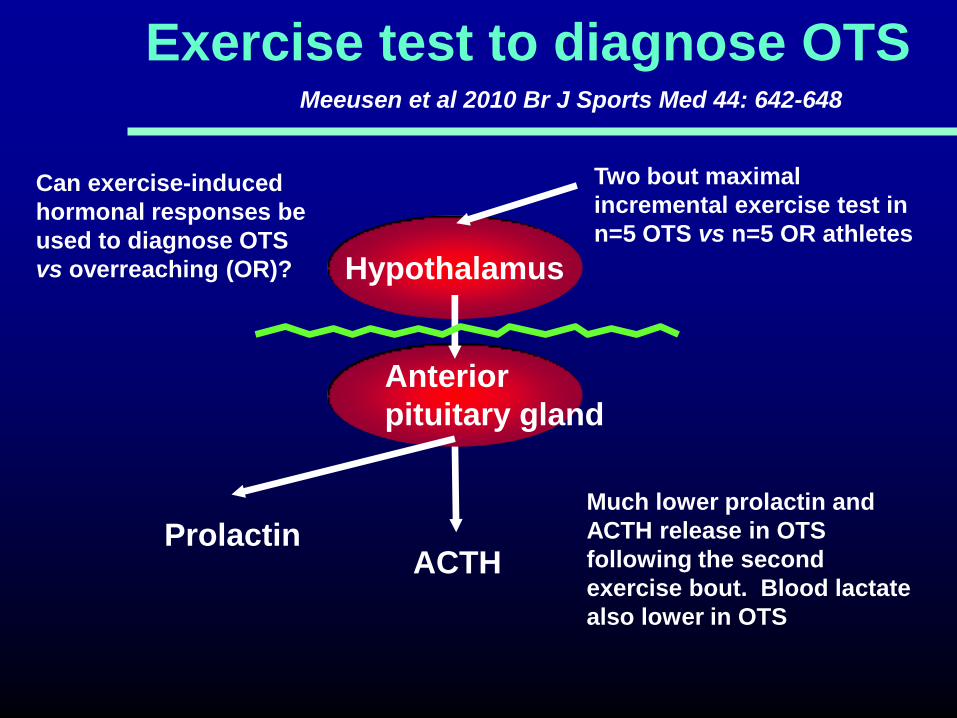
Exercise test to diagnose OTS
Hypothalamus
Prolactin
Anterior
pituitary gland
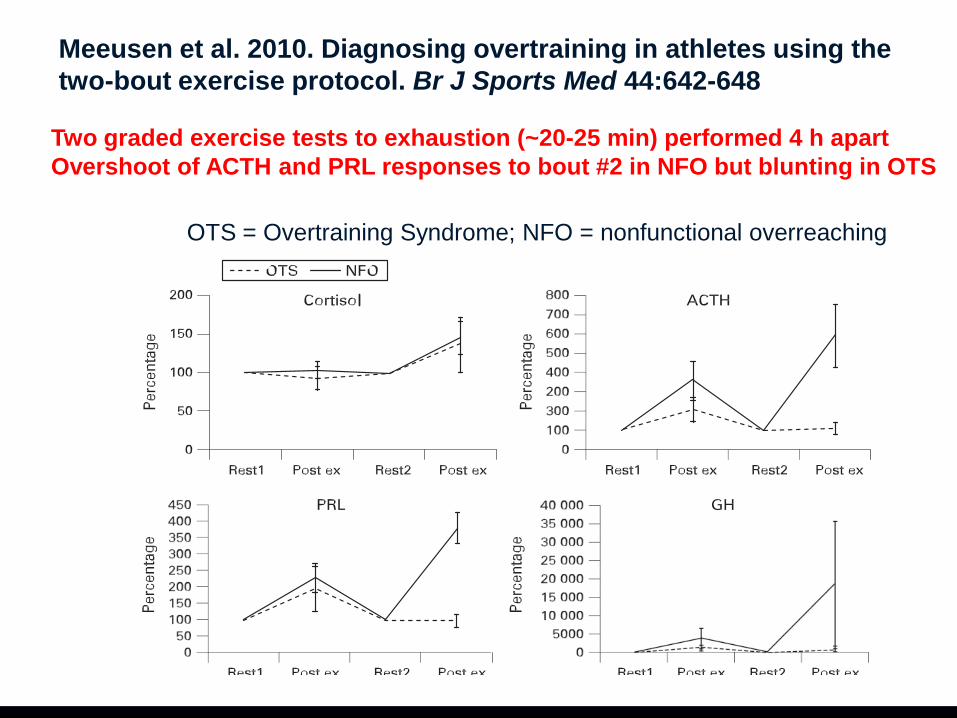
Meeusen et al 2010 Br J Sports Med 44: 642-648
Two bout maximal
incremental exercise test in
n=5 OTS vs n=5 OR athletes
Much lower prolactin and
ACTH release in OTS
following the second
exercise bout. Blood lactate
also lower in OTS
Can exercise-induced
hormonal responses be
used to diagnose OTS
vs overreaching (OR)?
ACTH
28
Meeusen et al. 2010. Diagnosing overtraining in athletes using the
two-bout exercise protocol. Br J Sports Med 44:642-648
OTS = Overtraining Syndrome; NFO = nonfunctional overreaching
Two graded exercise tests to exhaustion (~20-25 min) performed 4 h apart
Overshoot of ACTH and PRL responses to bout #2 in NFO but blunting in OTS

29
DETECTION OF OVER-REACHING: Salivary cortisol
and testosterone responses to a two-bout exercise
protocol are blunted after 11 days of intensified
training (John Hough PhD thesis 2012)
Bout 1: 30 min intermittent 55%Wmax[1min]/80%Wmax [4min]
Bout 2: 70%Wmax for 30 min or to fatigue (if sooner)
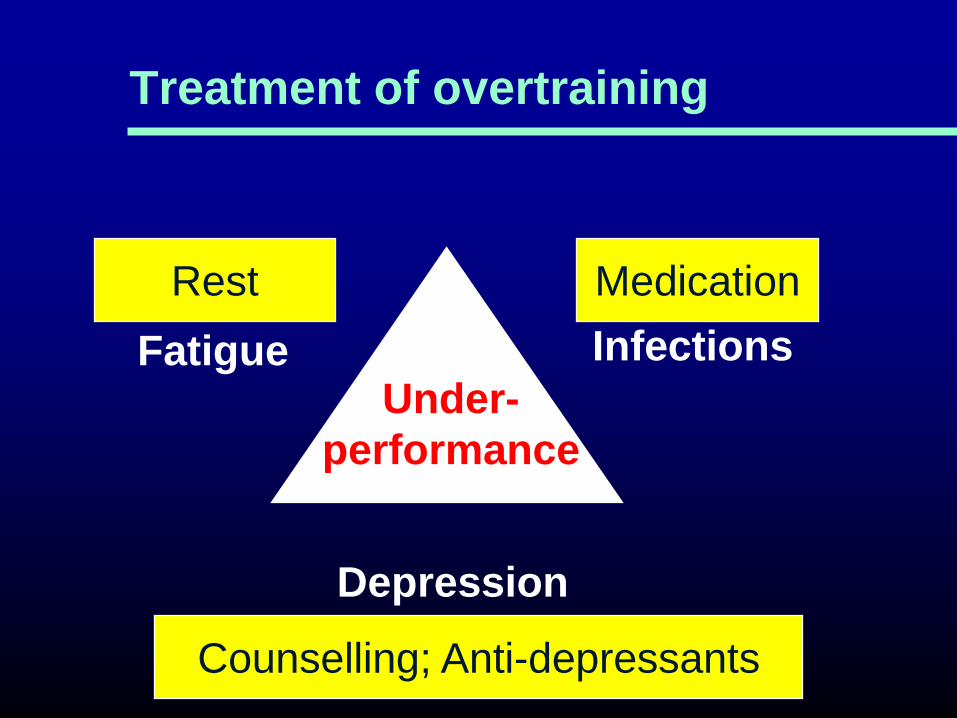
Treatment of overtraining
Fatigue Infections
Depression
Under-
performance
Rest
Counselling; Anti-depressants
Medication
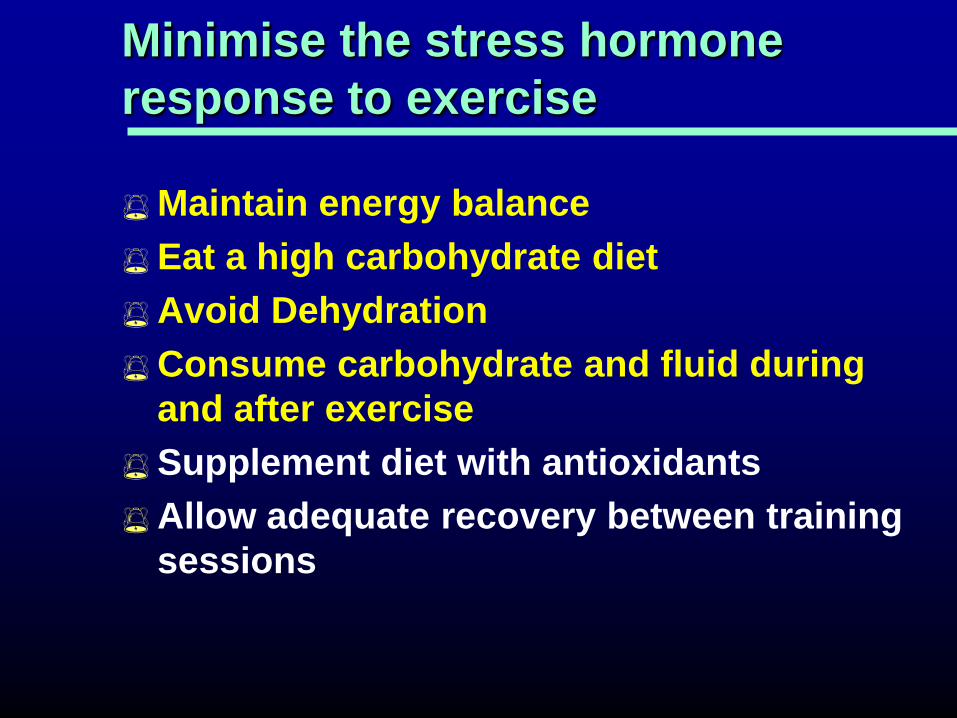
Minimise the stress hormone
response to exercise
Maintain energy balance
Eat a high carbohydrate diet
Avoid Dehydration
Consume carbohydrate and fluid during
and after exercise
Supplement diet with antioxidants
Allow adequate recovery between training
sessions
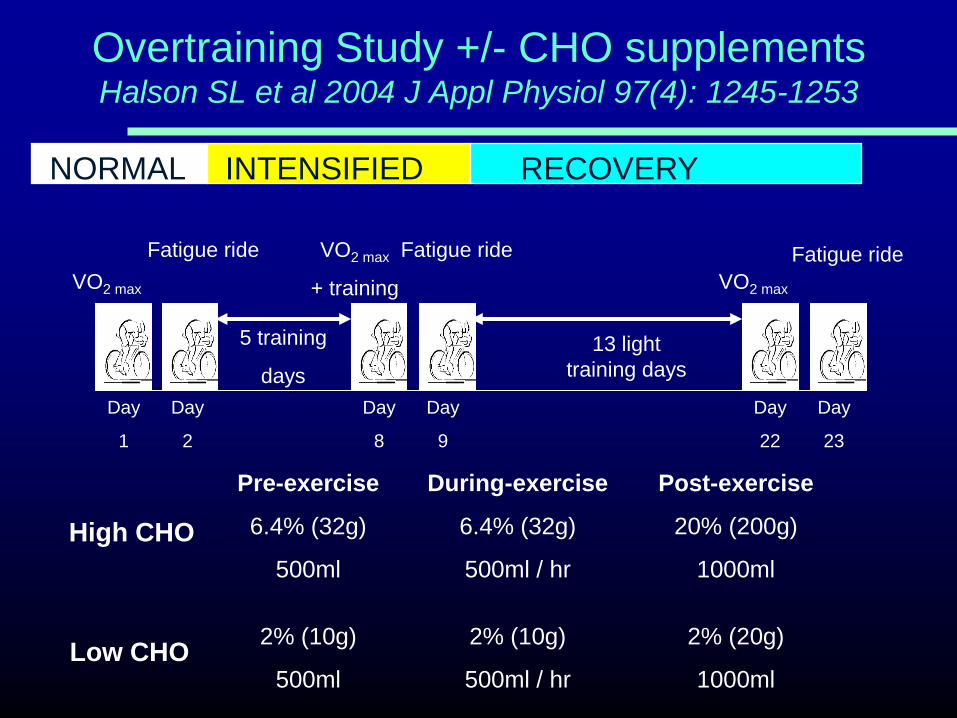
VO2 max
VO2 max
+ training VO2 max
Fatigue ride Fatigue ride Fatigue ride
13 light
training days
Day
1
Day
8
Day
9
Day
2
Day
23
Day
22
5 training
days
Overtraining Study +/- CHO supplements Halson SL et al 2004 J Appl Physiol 97(4): 1245-1253
Pre-exercise
6.4% (32g)
500ml
2% (10g)
500ml
During-exercise
6.4% (32g)
500ml / hr
2% (10g)
500ml / hr
Post-exercise
20% (200g)
1000ml
2% (20g)
1000ml
High CHO
Low CHO
NORMAL INTENSIFIED RECOVERY
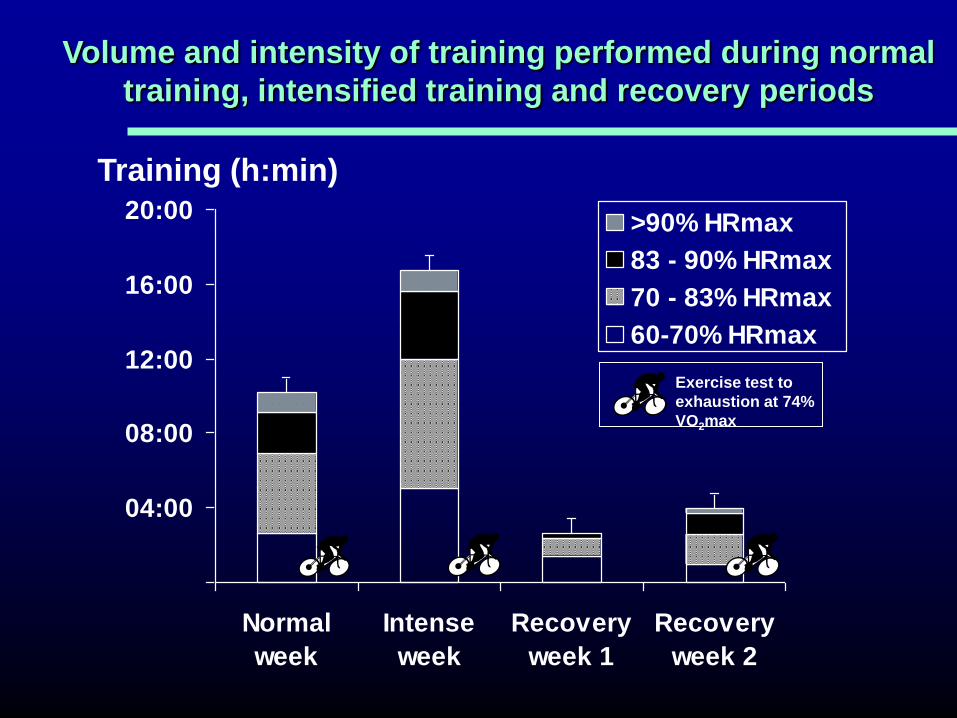
04:00
08:00
12:00
16:00
20:00
Normal
week
Intense
week
Recovery
week 1
Recovery
week 2
>90% HRmax
83 - 90% HRmax
70 - 83% HRmax
60-70% HRmax
Volume and intensity of training performed during normal
training, intensified training and recovery periods
Training (h:min)
Exercise test to
exhaustion at 74%
VO2max
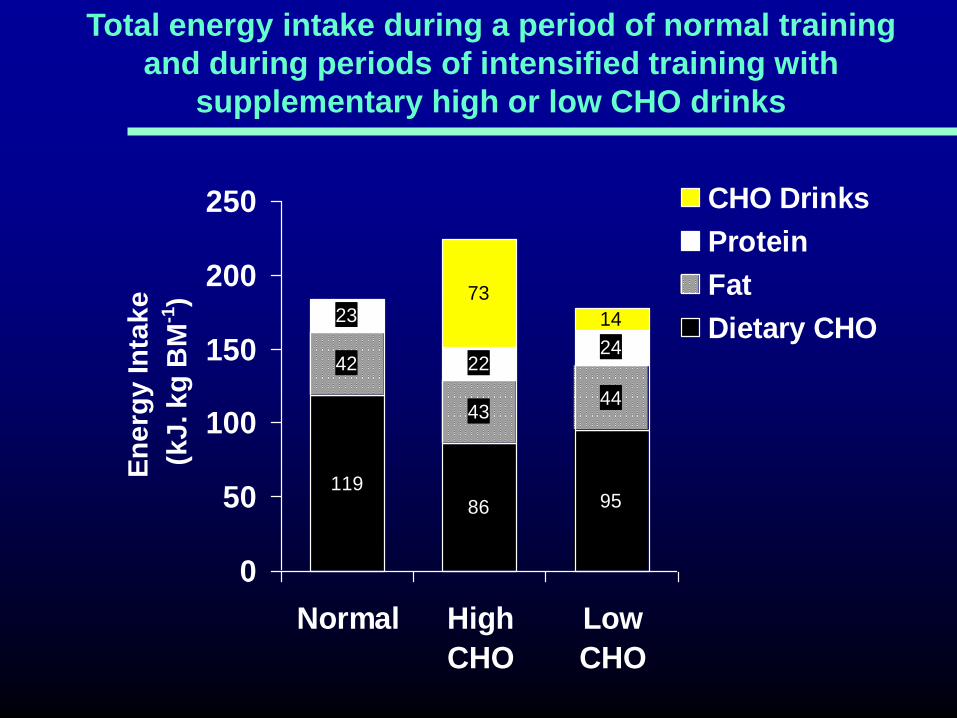
119
86 95
42
4344
23
2224
14
73
0
50
100
150
200
250
Normal High
CHO
Low
CHO
En
erg
y In
tak
e
(k
J. k
g B
M-1
)CHO Drinks
Protein
Fat
Dietary CHO
Total energy intake during a period of normal training
and during periods of intensified training with
supplementary high or low CHO drinks
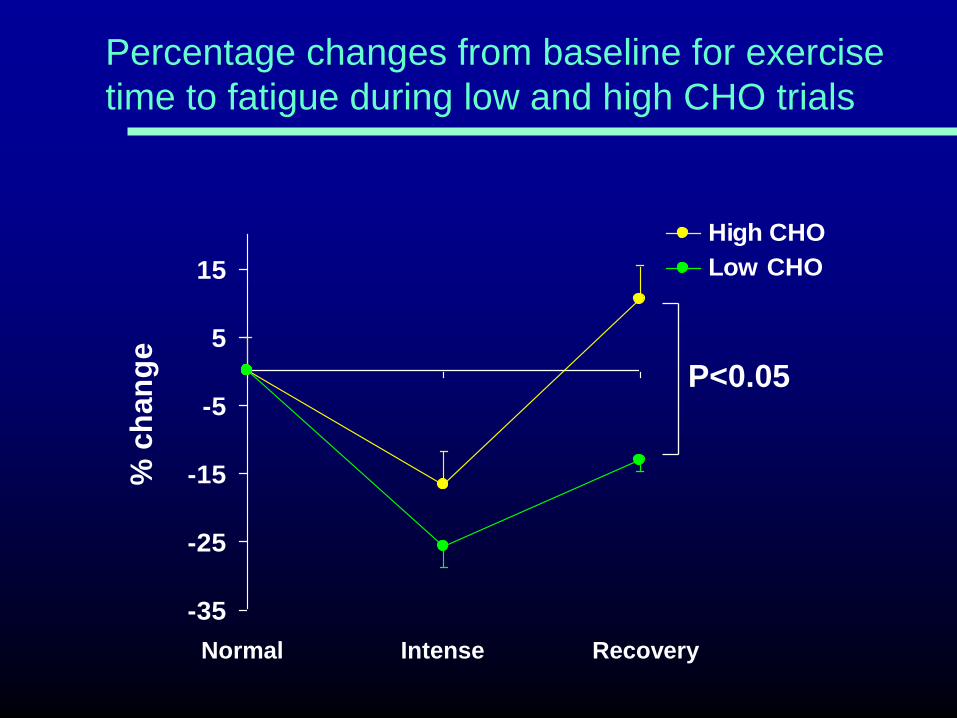
-35
-25
-15
-5
5
15
% c
ha
ng
e
High CHO
Low CHO
Normal Intense Recovery
Percentage changes from baseline for exercise
time to fatigue during low and high CHO trials
P<0.05
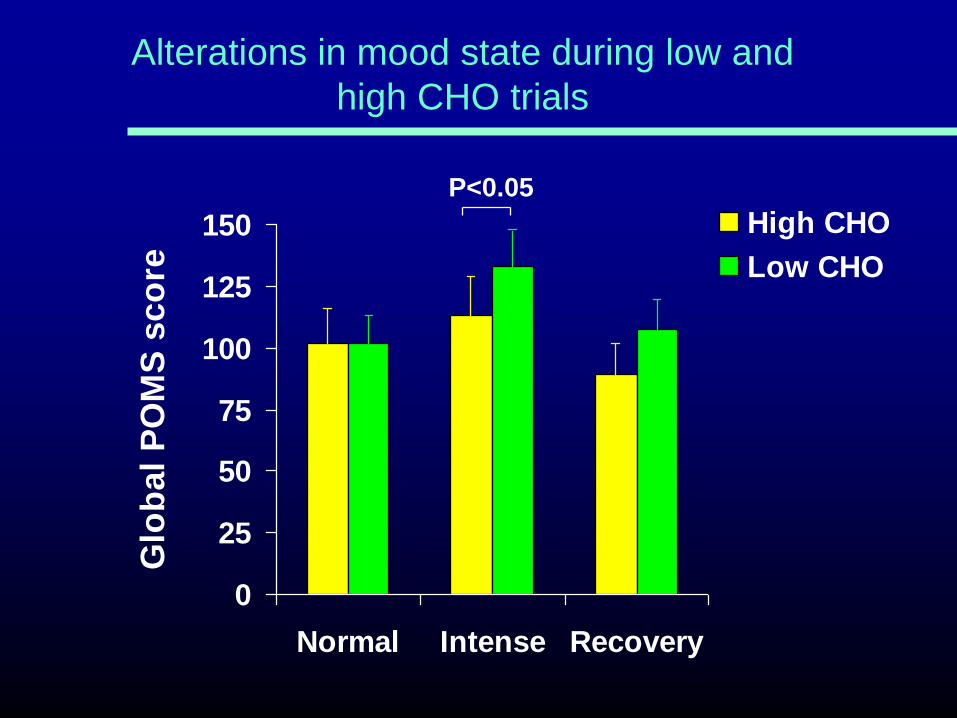
0
25
50
75
100
125
150
Normal Intense Recovery
Glo
bal
PO
MS
sco
re
High CHO
Low CHO
Alterations in mood state during low and
high CHO trials
P<0.05

250
300
350
400
450
500
550
Rest 60 Post 1h Post
Time (min)
Pla
sm
a C
ort
iso
l (n
mo
l.l-1
)
Plasma cortisol response to exercise during
Normal Training (NT) and Intensified Training (IT)
NT
IT Hi-CHO
IT Lo-CHO
* P<0.05 vs NT
* *

Achten J et al (2004)
Higher dietary carbohydrate content during
intensified running training results in better
maintenance of performance and mood
state. J Appl Physiol 96(4): 1331-1340
Isoenergetic diets
5.4 g CHO/kg (41%) vs 8.5 g CHO/kg (65%)
Similar results in a run training study

Minimise the stress hormone
response to exercise
Maintain energy balance
Eat a high carbohydrate diet
Avoid Dehydration
Consume carbohydrate and fluid during
and after exercise
Supplement diet with antioxidants
Allow adequate recovery between training
sessions

0
2
4
6
8
10
Pre Post Pre Post 1 h 2 h 3 h 4 h
0
200
400
600
800
Pre Post Pre Post 1 h 2 h 3 h 4 h
TWO
ONE
REST
Increased stress hormone response to a repeated bout
of endurance exercise (65 min cycling at 75%VO2max)
Cortisol (nmol/L) Adrenaline (nmol/L)
3 h
Rest 3 h
Rest
Ronsen et al (2001) MSSE 33: 568-575
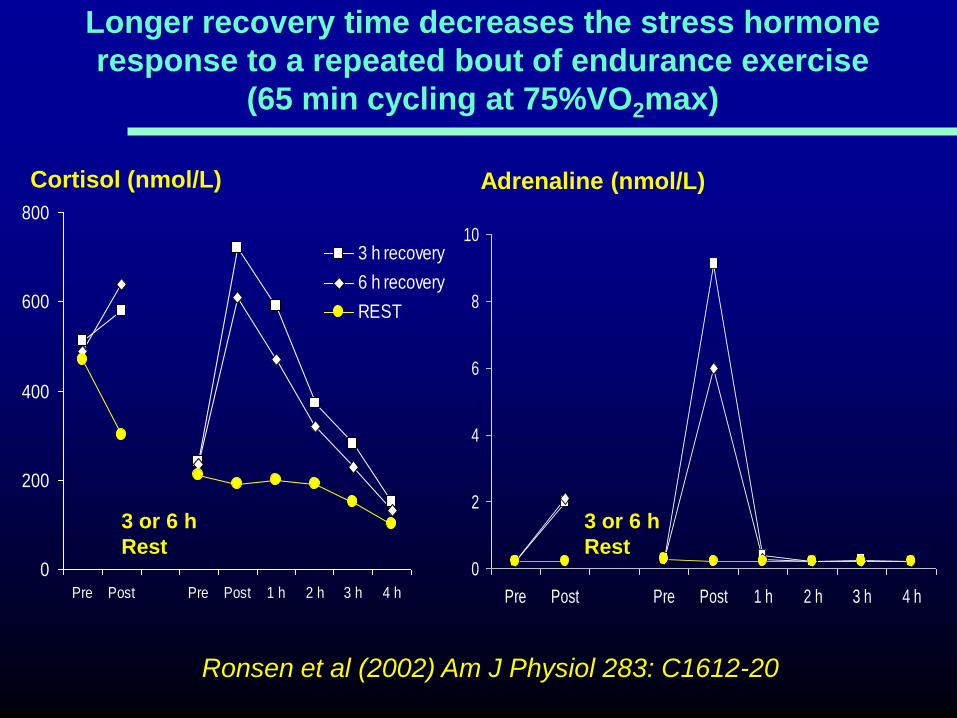
Longer recovery time decreases the stress hormone
response to a repeated bout of endurance exercise
(65 min cycling at 75%VO2max)
Ronsen et al (2002) Am J Physiol 283: C1612-20
0
200
400
600
800
Pre Post Pre Post 1 h 2 h 3 h 4 h
3 h recovery
6 h recovery
REST
0
2
4
6
8
10
Pre Post Pre Post 1 h 2 h 3 h 4 h
Cortisol (nmol/L) Adrenaline (nmol/L)
3 or 6 h
Rest
3 or 6 h
Rest
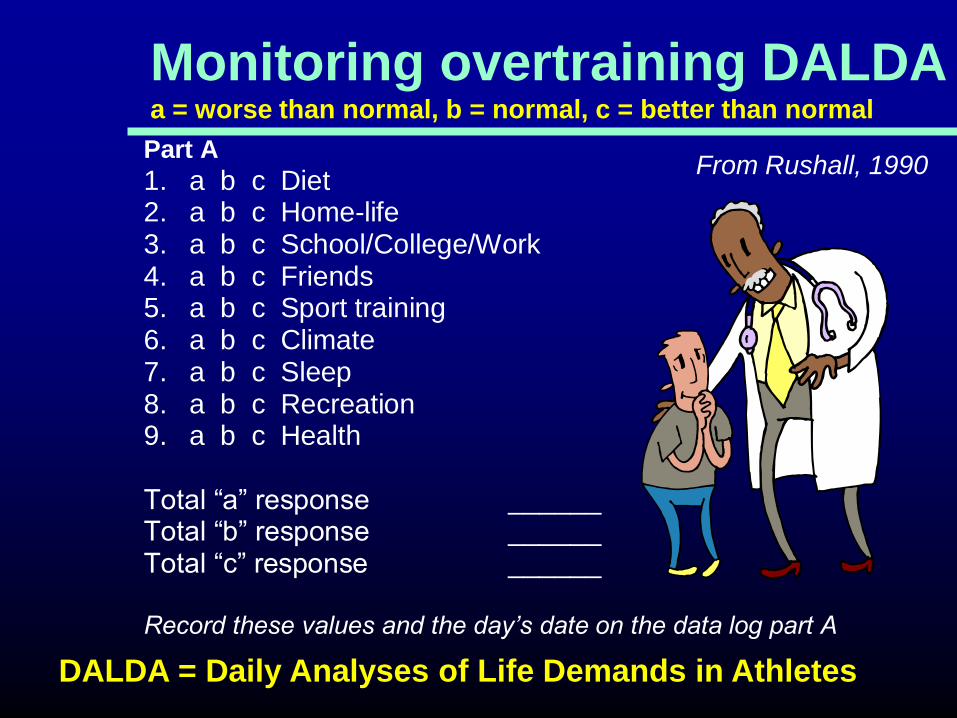
Part A
1. a b c Diet2. a b c Home-life3. a b c School/College/Work4. a b c Friends5. a b c Sport training6. a b c Climate7. a b c Sleep8. a b c Recreation9. a b c Health
Total “a” response ______Total “b” response ______Total “c” response ______
Record these values and the day’s date on the data log part A
Monitoring overtraining DALDA a = worse than normal, b = normal, c = better than normal
From Rushall, 1990
DALDA = Daily Analyses of Life Demands in Athletes
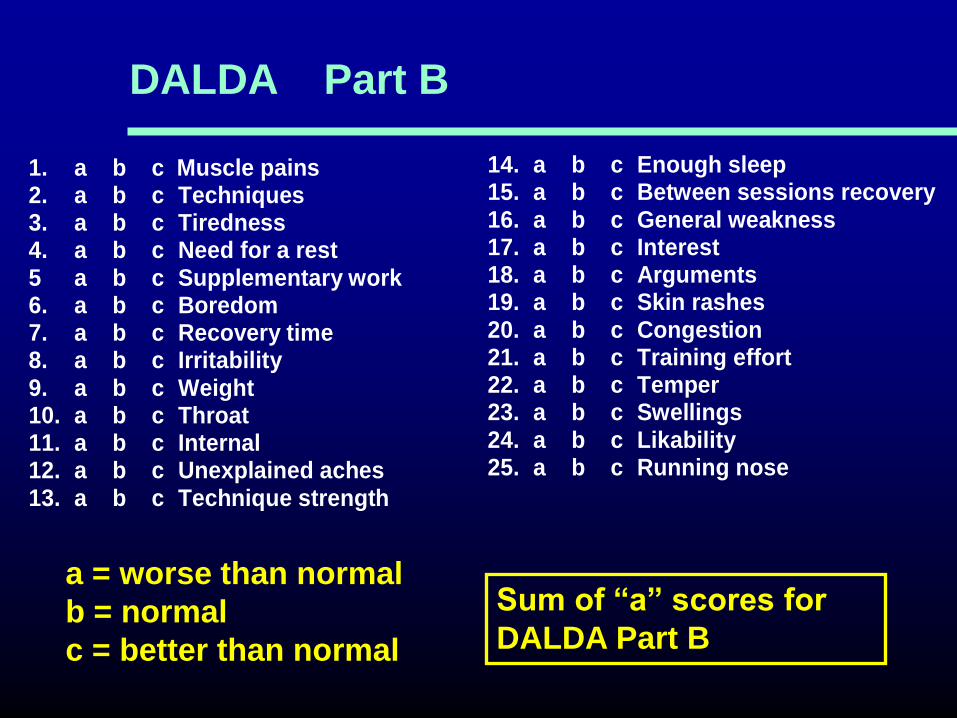
1. a b c Muscle pains2. a b c Techniques3. a b c Tiredness4. a b c Need for a rest5 a b c Supplementary work6. a b c Boredom7. a b c Recovery time8. a b c Irritability9. a b c Weight10. a b c Throat11. a b c Internal12. a b c Unexplained aches13. a b c Technique strength
14. a b c Enough sleep15. a b c Between sessions recovery16. a b c General weakness17. a b c Interest18. a b c Arguments19. a b c Skin rashes20. a b c Congestion21. a b c Training effort22. a b c Temper23. a b c Swellings24. a b c Likability25. a b c Running nose
DALDA Part B
a = worse than normal
b = normal
c = better than normal
Sum of “a” scores for
DALDA Part B

Monitoring overtraining using DALDA
0
1
2
3
4
5
6
7
8
9
10
0 5 10 15 20 25 30 35
Days
"a
" S
co
re
* “a” score >5 for >4 consecutive days
*

Monitoring overtraining in runners PJ Robson, PhD thesis, University of Birmingham, 1999
0
1
2
3
4
5
6
7
8
0 2 4 6 8 10 12 14 16 18 20 22 24 26 28
Day
Additional interval training “a” score
Mean values for 8 runners
Normal training Normal training
+1 +2

Essentials to avoid overtraining
Control rate of progression of training
Reduce risks of infection
Avoid monotonous training
Maintain good nutrition
Ensure adequacy of carbohydrate and energy
intake during intensified training periods
Monitor the training load and the athlete
Thank you for listening!
Related Documents