436 Ecology, 83(2), 2002, pp. 436–451 q 2002 by the Ecological Society of America DETECTING REGIONAL VARIATION USING META-ANALYSIS AND LARGE-SCALE SAMPLING: LATITUDINAL PATTERNS IN RECRUITMENT T. P. HUGHES, 1,6 A. H. BAIRD, 2 E. A. DINSDALE, 2 V. J. HARRIOTT, 3 N. A. MOLTSCHANIWSKYJ, 2,4 M. S. PRATCHETT, 2 J. E. TANNER, 2,5 AND B. L. WILLIS 2 1 Centre for Coral Reef Biodiversity, Department of Marine Biology, James Cook University, Townsville, Queensland 4811, Australia 2 Department of Marine Biology, James Cook University, Townsville, Queensland 4811, Australia 3 CRC Reef Research Center, James Cook University, Townsville, Queensland 4811, Australia 4 School of Aquaculture, University of Tasmania, Launceston, P.O. Box 1214, Tasmania 7250, Australia 5 SARDI Aquatic Sciences, P.O. Box 120 Henley Beach, South Australia 5022 Australia Abstract. Regional-scale variation of recruitment by marine organisms may reflect geographic patterns in adult stock sizes or fecundities, large-scale hydrodynamic features that influence the transport of larvae (e.g., currents, upwelling), and patterns of early mor- tality. In turn, recruitment may play a vital role in determining patterns of adult abundance and community structure, from local to biogeographic scales. We examined spatial variation in recruitment by corals at a regional scale, along 3300 km of the tropical and subtropical coast of eastern Australia (108–318 S). We used two complementary approaches: (1) a meta- analysis of 21 different studies undertaken over a 16-yr period, each of which was generally conducted at a single reef, and (2) a large-scale sampling effort in which recruitment was measured in two years on 33 reefs arrayed along the length of the Great Barrier Reef (GBR). Our goal is to compare the emergent large-scale picture derived from many small-scale studies with patterns revealed by shorter-term regional sampling. The two approaches show very similar large-scale patterns. Recruitment by spawning corals (mainly acroporids) was highest in the central GBR and declined steadily with increasing latitude by up to more than 20-fold. A smaller decline occurred on the northern GBR between Australian and Papua New Guinea. Recruitment by brooding corals (mostly pocilloporids) was greatest in the northern GBR and also declined to the south. The lati- tudinal decline in brooders was three- to fivefold, i.e., not as great as for spawners. Con- sequently, the proportion of brooded recruits increased to the south, and they generally exceeded spawners on the southern GBR and on isolated subtropical reefs at higher latitudes. Our meta-analysis shows that fully half of the variation in the ratio of spawners to brooders is attributable to one of 11 variables that we extracted from the published studies: the month when the recruitment panels were deployed. This result suggests that the intensity and timing of spawning have a crucial impact on large-scale patterns of recruitment. Else- where, we tested this hypothesis in the field, and confirmed that regional variation in recruitment by spawning acroporid corals was driven by spatial and temporal variation in the extent of mass spawning. Together, large-scale sampling and meta-analyses provide a powerful, combined approach for investigating large-scale patterns and the mechanisms underlying them. Key words: coral reefs; Great Barrier Reef; larvae; meta-analysis; population dynamics; re- cruitment; spatial scale. INTRODUCTION The ability to compare and synthesize across studies is crucial for revealing general patterns and for scaling up from small-scale investigations to unveil regional or global phenomena. Meta-analysis (defined as the quantitative analysis of data that originated from sev- eral independent studies) provides major advantages over more traditional narrative syntheses and reviews (e.g., Hedges and Olkin 1985, Gurevitch and Hedges Manuscript received 10 January 2000; revised 2 February 2001; accepted 18 February 2001; final version received 9 April 2001. 6 E-mail: [email protected] 1993). Following the lead from the social sciences (e.g., Glass et al. 1981) and medicine (e.g., Sachs et al. 1987), applications of meta-analysis to ecological data are becoming increasingly common (see recent overviews by Arnqvist and Wooster 1990, Osenberg et al. 1999). Regardless of whether the primary studies under investigation are descriptive or experimental, the underlying approach and objectives are the same: to quantify emergent patterns by applying statistical pro- cedures, and to test for effects of ecological factors or methodology by analyzing subgroups of the overall data. A growing awareness of scale dependency, advances in technology (e.g., satellite imagery, supercomputers)

Welcome message from author
This document is posted to help you gain knowledge. Please leave a comment to let me know what you think about it! Share it to your friends and learn new things together.
Transcript
436
Ecology, 83(2), 2002, pp. 436–451q 2002 by the Ecological Society of America
DETECTING REGIONAL VARIATION USING META-ANALYSIS ANDLARGE-SCALE SAMPLING: LATITUDINAL PATTERNS IN RECRUITMENT
T. P. HUGHES,1,6 A. H. BAIRD,2 E. A. DINSDALE,2 V. J. HARRIOTT,3 N. A. MOLTSCHANIWSKYJ,2,4
M. S. PRATCHETT,2 J. E. TANNER,2,5 AND B. L. WILLIS2
1Centre for Coral Reef Biodiversity, Department of Marine Biology, James Cook University,Townsville, Queensland 4811, Australia
2Department of Marine Biology, James Cook University, Townsville, Queensland 4811, Australia3CRC Reef Research Center, James Cook University, Townsville, Queensland 4811, Australia
4School of Aquaculture, University of Tasmania, Launceston, P.O. Box 1214, Tasmania 7250, Australia5SARDI Aquatic Sciences, P.O. Box 120 Henley Beach, South Australia 5022 Australia
Abstract. Regional-scale variation of recruitment by marine organisms may reflectgeographic patterns in adult stock sizes or fecundities, large-scale hydrodynamic featuresthat influence the transport of larvae (e.g., currents, upwelling), and patterns of early mor-tality. In turn, recruitment may play a vital role in determining patterns of adult abundanceand community structure, from local to biogeographic scales. We examined spatial variationin recruitment by corals at a regional scale, along 3300 km of the tropical and subtropicalcoast of eastern Australia (108–318 S). We used two complementary approaches: (1) a meta-analysis of 21 different studies undertaken over a 16-yr period, each of which was generallyconducted at a single reef, and (2) a large-scale sampling effort in which recruitment wasmeasured in two years on 33 reefs arrayed along the length of the Great Barrier Reef (GBR).Our goal is to compare the emergent large-scale picture derived from many small-scalestudies with patterns revealed by shorter-term regional sampling.
The two approaches show very similar large-scale patterns. Recruitment by spawningcorals (mainly acroporids) was highest in the central GBR and declined steadily withincreasing latitude by up to more than 20-fold. A smaller decline occurred on the northernGBR between Australian and Papua New Guinea. Recruitment by brooding corals (mostlypocilloporids) was greatest in the northern GBR and also declined to the south. The lati-tudinal decline in brooders was three- to fivefold, i.e., not as great as for spawners. Con-sequently, the proportion of brooded recruits increased to the south, and they generallyexceeded spawners on the southern GBR and on isolated subtropical reefs at higher latitudes.Our meta-analysis shows that fully half of the variation in the ratio of spawners to broodersis attributable to one of 11 variables that we extracted from the published studies: themonth when the recruitment panels were deployed. This result suggests that the intensityand timing of spawning have a crucial impact on large-scale patterns of recruitment. Else-where, we tested this hypothesis in the field, and confirmed that regional variation inrecruitment by spawning acroporid corals was driven by spatial and temporal variation inthe extent of mass spawning. Together, large-scale sampling and meta-analyses provide apowerful, combined approach for investigating large-scale patterns and the mechanismsunderlying them.
Key words: coral reefs; Great Barrier Reef; larvae; meta-analysis; population dynamics; re-cruitment; spatial scale.
INTRODUCTION
The ability to compare and synthesize across studiesis crucial for revealing general patterns and for scalingup from small-scale investigations to unveil regionalor global phenomena. Meta-analysis (defined as thequantitative analysis of data that originated from sev-eral independent studies) provides major advantagesover more traditional narrative syntheses and reviews(e.g., Hedges and Olkin 1985, Gurevitch and Hedges
Manuscript received 10 January 2000; revised 2 February2001; accepted 18 February 2001; final version received 9 April2001.
6 E-mail: [email protected]
1993). Following the lead from the social sciences(e.g., Glass et al. 1981) and medicine (e.g., Sachs etal. 1987), applications of meta-analysis to ecologicaldata are becoming increasingly common (see recentoverviews by Arnqvist and Wooster 1990, Osenberg etal. 1999). Regardless of whether the primary studiesunder investigation are descriptive or experimental, theunderlying approach and objectives are the same: toquantify emergent patterns by applying statistical pro-cedures, and to test for effects of ecological factors ormethodology by analyzing subgroups of the overalldata.
A growing awareness of scale dependency, advancesin technology (e.g., satellite imagery, supercomputers)

February 2002 437LARGE-SCALE PATTERNS OF RECRUITMENT
and increasing concern for environmental issues (e.g.,habitat fragmentation, global warming) are encourag-ing ecologists to focus more on larger scale phenomena(e.g., Dayton and Tegner 1984, Edwards et al. 1994,Rosenzweig 1995). However, most ecological experi-ments and measurements are undertaken at relativelysmall scales of space and time, using relatively smallsampling units (Schneider 1994). Ecologists often im-plicitly extrapolate their results across scales, typicallyinferring large-scale patterns from smaller scale inves-tigations that are logistically easier to conduct. Unfor-tunately, these extrapolations are invalid because nu-merous processes (e.g., dispersal, evolution) prevail atlarger scales which cannot be explored locally in spaceor time (see, e.g., commentaries by Wiens 1989, Ro-senzweig 1995, Thrush et al. 1997). Schneider et al.(1997) suggested several solutions: undertaking larger-scale experiments (e.g., Carpenter 1990), combining orreplacing small-scale experiments with large-scale sur-veys (e.g., Eberhardt and Thomas 1991), and iterativecycling between observation, small-scale experimentson components of a larger system, and refinement oftheories on how the larger system works (e.g., Rastetteret al. 1992, Wiens et al. 1993). As yet, there is no clearconsensus on how best to relate patterns and processesacross multiple scales.
Meta-analysis is likely to be a useful tool for de-tecting large-scale patterns that extend beyond the res-olution or capability of conventional experimental anddescriptive studies. Thus, the limited scale of focus ofmost ecological investigations does not preclude thedetection of large-scale phenomena if results can beintegrated across many studies. A classic example isthe long-term dynamics of the birds of Great Britain,revealed by censuses conducted since the 1930s bythousands of members of the British Trust for Orni-thology (O’Connor 1985, Taylor 1987). Similarly, bio-geographers can ascertain even global-scale spatial pat-terns based on many localized censuses or surveys,each conducted at one or a few locations, often fordifferent purposes and by many different individuals(e.g., Stehli and Wells 1969). In some cases, it may befeasible to examine large-scale processes or patterns ina single intensive study (e.g., Hughes et al. 1999,2000). Whether the results emerging from a meta-anal-ysis and a large-scale study would actually be similaris an interesting question. We are unaware of any suchcomparison in the ecological literature.
In this paper, we set out to compare a meta-analysisof small-scale investigations with a single large-scalestudy. Comparing published studies would have beeneasy if they had all been done and reported in the sameway. However, for reasons of logistics or personalchoice, each one varied, often in ways that almost cer-tainly affected the results. Our task therefore is to iden-tify extraneous sources of variation in the data (e.g.,due to methodology), account for them with statisticalmodels, and explore the remaining variance that is at-
tributable to the variables of interest. The large-scalepattern we investigated is the density and taxonomiccomposition of coral recruits along a 3300 km tropical–subtropical latitudinal gradient. Recruitment has a ma-jor influence on the size and composition of adult pop-ulations at all spatial scales (e.g., Gaines and Rough-garden 1985, Hughes 1990, Karlson and Levitan 1990,Caley et al. 1996, Connell et al. 1997, Hughes andTanner 2000). Biogeographic patterns in the compo-sition of coral assemblages (e.g., Stehli and Wells1969) and their latitudinal limits (e.g., Crossland 1988)are likely to be strongly influenced by patterns of dis-persal and recruitment. We focussed on the Great Bar-rier Reef and on isolated reefs to its south, where therehave been 21 published reports on early recruitment bycorals (on 18 separate reefs). In addition to these, weconducted a large-scale investigation of coral recruit-ment on 33 reefs from 108 S to 238 S, along the lengthof the Great Barrier Reef (Hughes et al. 1999, 2000).For convenience, we refer here to these two data setsas the small- and large-scale studies, respectively.
Harriott and coworkers were the first to compareseveral small-scale studies to examine latitudinal pat-terns in the density and composition of coral recruitsalong the east coast of Australia (Harriott and Simpson1996). Based on data from seven studies conductedbetween 168 S and 318 S (see Table 2 in Harriott andSimpson 1996), she concluded that ‘‘there is an ap-parent decline in the rate of recruitment of broadcasting(spawning) coral species with increasing latitude, withbrooding corals being the dominant recruits at high-latitude sites’’ (quote from Banks and Harriott 1996).Similarly, Dunstan and Johnson (1998) stated that ‘‘theemerging picture (from the literature) is a transitionfrom dominance of recruitment on settlement plates by(spawning) acroporids in central and northern regionsof the GBR to dominance by (brooding) pocilloporidsat the southern extremities of the GBR and on sub-tropical reefs to the south.’’ However, neither of theseconclusions was based on a formal meta-analysis ofthe literature. These patterns, if they occur, raise im-portant issues concerning the mechanisms involved,and their ecological, biogeographical, and evolutionaryconsequences. Similar large-scale gradients in recruit-ment of benthic organisms occur on coastlines else-where. For example, changes in the abundance and pop-ulation structure of echinoids along the west coast ofNorth America (Ebert and Russell 1988), and of bar-nacles, mussels, and starfish on the east and west ofNew Zealand (Menge et al. 1999) are due in part topatterns of upwelling and the delivery of larvae. Recentmodeling studies by Connolly and Roughgarden (1998,1999) indicate the potential effects of regional-scalevariation in recruitment on latitudinal patterns of adultabundances and community structure.
STUDY SYSTEM
The Great Barrier Reef (GBR) is a continuous chainof nearly 3000 discrete reefs that stretches in a south-
438 T. P. HUGHES ET AL. Ecology, Vol. 83, No. 2
easterly direction from 108 S to 238 S, along the coastof Queensland, Australia. Most of the reefs are 35–150km offshore, depending in part on the width of thecontinental shelf. Isolated reefs and coral assemblagesalso occur south of the GBR, as far as Lord Howe Island(318 S), the southernmost coral reef in the world. Thespecies richness of reef-building corals falls by ;25%between the middle and southern end of the GBR (to245 species; Veron 1993). Eighty-seven of these extend1100 km further south to Lord Howe Island (Veron andDone 1979, Harriott et al. 1995; T. P. Hughes, unpub-lished data). Patterns of water flow on the GBR arecomplex, largely because of the many gyres and eddiescreated by nearly 3000 reefs, and the effects of tidesand variable winds. The main large-scale current flowswestward towards Australia from the Coral Sea at 148–188 S before bifurcating into a long-shore flow to thenorth and south (the Coral Sea Coastal Current and theEast Australian Current, respectively; see Wolanski1994).
Corals can be classified into two reproductivegroups, brooders and spawners. Brooders releasesperm, but not their eggs, which are fertilized internallyto form relatively large planulae. After their release,brooded planulae have a short precompetency period(when they are not yet capable of settling) ranging fromminutes to 2 d, depending on the species (Harrison andWallace 1990). However, planulae may remain com-petent for weeks if they are deprived of a suitable set-tlement surface (under laboratory conditions, see, e.g.,Richmond 1987). The release of planulae in broodersusually follows a lunar cycle, for up to 12 mo/yr de-pending on species and location (see review by Tanner1996). The most abundant brooders on the GBR arespecies of Pocilloporidae (Pocillopora, Stylophora,Seriatopora), members of the Acropora subgenus Is-opora, and some species of Poritidae (Harrison andWallace 1990).
In contrast to brooders, broadcast spawners releaseboth eggs and sperm, and fertilization is external. Mostspecies of spawners on the GBR release their gametesin a multispecies spawning event which occurs over aperiod of a few days, in one or two months during theearly austral summer (see Harrison et al. 1984, Babcocket al. 1986). Consequently, recruitment by most spawn-ers is much more seasonal than brooders, with a majorpeak of settlement following closely after spawning(e.g., Wallace and Bull 1981, Wallace 1985a, Dunstanand Johnson 1998). The precompetency period ofspawners is typically 3–7 d, more than twice as longas brooders. However, like brooders, broadcast-spawned larvae can remain viable for weeks (e.g., Wil-son and Harrison 1998). Over 85% of coral species onthe GBR are spawners. Levels of gene-flow in coralsalong the GBR range from modest to low (particularlyfor brooders; Ayre and Hughes 2000), with minimalgenetic exchange occurring between the GBR and Lord
Howe Island (D. J. Ayre and T. P. Hughes, unpublisheddata).
In this paper we conducted a meta-analysis of theexisting literature to (1) quantify large-scale (latitu-dinal) patterns in recruitment by corals along the eastcoast of Australia, (2) measure regional changes in theproportion of recruit taxa, specifically brooders vs.spawners, and (3) compare patterns that emerge usingthe meta-analysis of small-scale investigations to thoserevealed by a single large-scale study. Our analysespoints to the valuable role of meta-analysis in synthe-sizing results from many studies, but also highlightssome limitations compared to large-scale investigationsthat are explicitly designed to examine regional phe-nomena.
METHODS
The small- and large-scale studies share a basic char-acteristic: they all involved the deployment of replicateartificial substrata (recruitment panels), which weresubsequently retrieved and censused. To avoid bias inour selection of cases for the meta-analysis, we in-cluded any publications from the study region (eastAustralia) that examined recruitment by corals ontoartificial panels attached to hard substratum. There are21 such primary studies, published from 1985 to 1999.The universal metric reported in these studies (and inthe large-scale study) is the density of coral recruitsper panel. In most cases, recruits were also classifiedinto taxonomic categories, which allows us to examinespatial variation in both their total abundance and com-position. We first plotted regressions of recruitment vs.latitude, to compare the two data sets. Then we con-ducted a detailed meta-analysis of the small-scale stud-ies to further explore sources of variation in recruitment(e.g., due to methodological differences).
Meta-analysis of small-scale studies
Our task was to account for variation among pre-viously published studies due to differences in meth-odology and latitude, using multiple regression models.We examined four dependent variables separately inthe meta-analysis: total recruits per panel (all coral taxacombined), number of spawners, number of brooders,and the proportion of spawners to brooders. Analyseswere done on both the mean number of recruits perpanel, and the standardized number per 286 cm2 (thesurface area of all panels in the large-scale study). Theresults were very similar, so we report here only onthe latter. We recorded the following 11 independentvariables for each small-scale study: the size and com-position of panels; the method of deployment; themonth, year, and duration of deployment; whether thedeployment period included the month when massspawning occurred; depth and habitat; distance off-shore; and latitude. Many of these variables are cor-related (see Results). We chose the following variables

February 2002 439LARGE-SCALE PATTERNS OF RECRUITMENT
because they are very likely to have affected theamount of recruitment:
1) Panel size: Large panels should have a greaternumber of recruits, but they may have a lower overalldensity (due to ‘‘edge effects’’ which occur when newrecruits are clustered close to the edge, presumably inresponse to gradients of light and water flow).
2) Panel composition: The chemical composition ofrecruitment panels and their rugosity or texture mayaffect patterns of settlement and early mortality (e.g.,Harriott and Fisk 1987). The small-scale studies usedsix types of panels that were made of ceramic, firedclay, cement, PVC, and flat slices of dead corals.
3) Method of deployment: The published studiesused three methodologies for the deployment of set-tlement surfaces (individual deployment of panels;panels bolted to racks side by side; panels attached toracks in vertical pairs, forming a ‘‘sandwich’’).
4) Duration: In any recruitment study, the longerpanels are submerged the greater the opportunity forreceiving multiple cohorts of larvae. However, lossesof recruits due to post-settlement mortality will also begreater the longer panels are exposed. We recorded theduration of each study in weeks.
5) Month, year, and the timing of spawning: Tem-poral patterns of recruitment often reflect variation inthe availability of competent larvae, e.g., in responseto seasonal breeding cycles, or changes in hydrody-namic conditions (e.g., Babcock 1988, Milicich 1994,Hughes et al. 2000). We recorded the year and themonth of initiation (when the panels were deployed)for each study. Whether or not the deployment includedthe month when mass spawning occurred (for that yearand location) was recorded as a discrete variable, her-after called ‘‘spawning.’’
6) Latitude, distance from shore, habitat, depth: Thelatitude and distance from shore were recorded for eachof the 21 small-scale studies. We categorized the hab-itat of each study into three types (lagoon, reef crest,reef slope). Finally, we recorded depth as a continuousvariable in meters.
We used generalized additive regression models(GAM, see Hastie and Tibishirani 1990) to determinethe best combination of these 11 factors that explainedvariation in total recruitment and recruitment byspawners and brooders separately. We first examinedthe correlations among the independent variables andthe proportion of the variation in recruitment that wasexplained by each one on its own. Subsequently, weused a forward-backwards stepwise method to selectthe best subset and best sequence of predictors amongthe independent variables. At each step, we added tothe model the next variable with the highest F valueand lowest P value (provided P , 0.05). After theaddition of each new variable, all existing variables inthe model were rechecked to ensure that they still con-tributed appreciably to the fit, and variables with P ,0.05 were deleted. This process continued iteratively
until no other variable remained which added signifi-cantly to the model. We constructed alternative modelsif at any stage it was unclear which variable to add ordelete from the model (e.g., because of similar F andP values), and the completed models were comparedusing an analysis of deviance (F test). To examine var-iation in the proportion of spawners and brooders, wefollowed a similar procedure, except a binomial dis-tribution (rather than a normal one) was used, and al-ternative models were compared using the x2 distri-bution. Five of the independent variables were contin-uous (size of panel, duration of deployment, depth,latitude, and distance from the shore), while four otherswere categorical (composition of panels, method of de-ployment, whether or not the deployment overlappedwith the annual mass spawning, and habitat). The re-maining two independent variables of the 11 we ex-amined, the month and year of deployment, were en-tered as both continuous and categorical variables, andthe one with the best fit was retained. Continuous var-iables were entered into the model as linear variableswith one degree of freedom, or as nonlinear variablesusing spline functions with four degrees of freedom (ifthe GAM indicated that the nonlinear component wassignificant with P , 0.05). One degree of freedom fitsa straight line whereas n degrees joins all points. Fourproduces ‘‘modest’’ smoothing (Hastie and Tibshirani1990).
Independence of data
The definition of an independent result is important,especially for selecting multiple observations arisingfrom a single primary study. Data collected by the sameperson, on the same reef, and repeatedly over time, areunlikely to be statistically independent. However, iden-tifying which data are spatially or temporally indepen-dent from the published literature is usually impossible,or at best very subjective and a potential source of bias(e.g., Downing et al. 1999, Englund et al. 1999). Op-erationally, meta-analysis of published results pre-cludes rigorous testing for spatial and temporal auto-correlations, since the original raw data are usuallyunavailable. Because our aim is to explore the pub-lished data as much as possible, we used multiple re-sults from each publication wherever we could, i.e.,whenever different sets of panels were deployed as partof a single study at different sites, depths, or times.This approach to meta-analysis is not unusual as a de-scriptive tool, e.g., Goldberg et al. (1999) examinedthe relationship between competition and productivityin plants using a database of 296 cases from only 14primary studies. Similarly, our meta-analysis is basedon up to 253 cases from the 21 published studies.
The large-scale study
The large-scale study examined variation in recruit-ment by corals at multiple scales, from meters to thelength of the Great Barrier Reef (from 108 S to 238 S;

440 T. P. HUGHES ET AL. Ecology, Vol. 83, No. 2
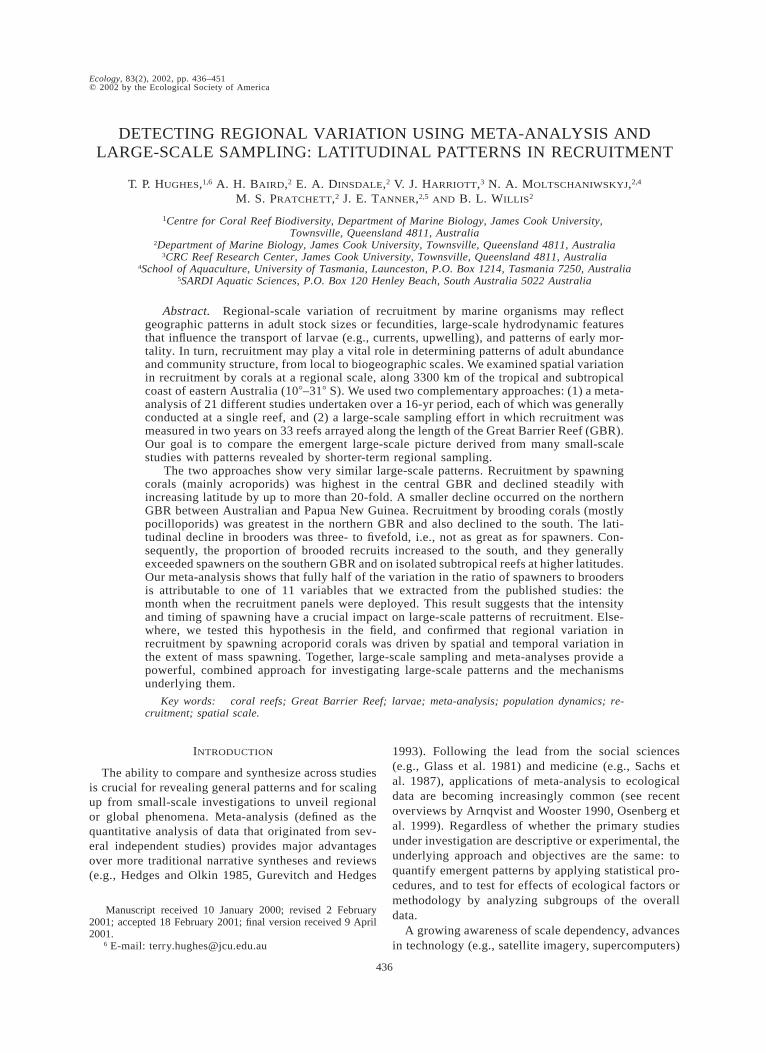
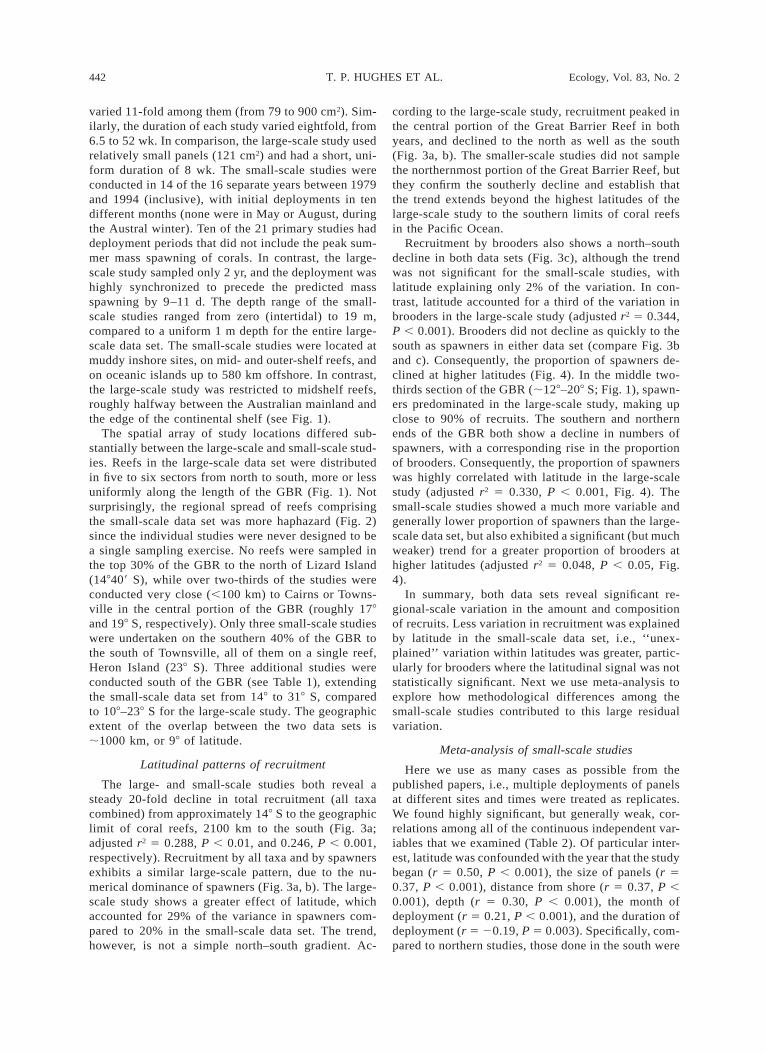
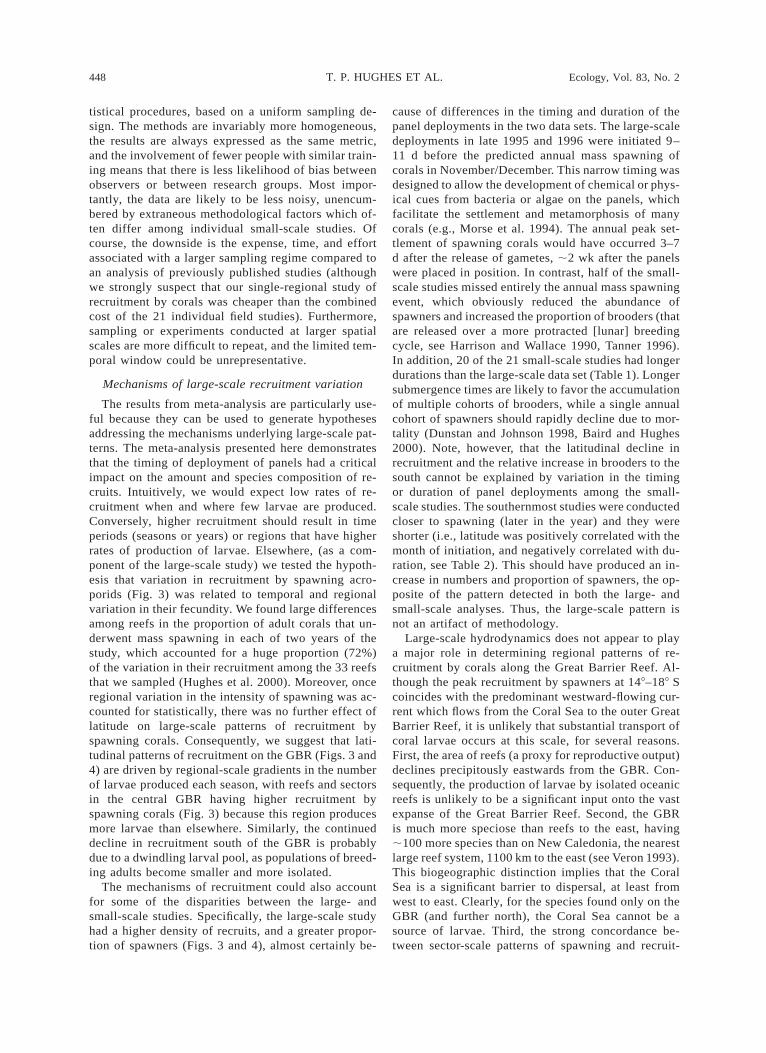
FIG. 1. Map of the Great Barrier Reef (GBR), indicating the location of reefs where recruitment of corals has beenmeasured by the large-scale study. Note the hierarchical design, with 18 reefs in five sectors sampled during 1995-1996 (1),and a further 15 reefs during 1996–1997 (2). Sectors of the GBR are each 250–500 km apart, numbered 1–5 from north tosouth. The Coral Sea extends eastward, offshore from the GBR.
Fig. 1). We used a hierarchical sampling design whichallowed us to partition variation (using nested ANO-VAs) among four spatial scales: i.e., among five ad-jacent sectors from north to south along the GBR,among three to six neighboring reefs nested within eachsector, among four replicate sites on each reef, andamong 10 recruitment panels deployed at each site (seeHughes et al. [1999, 2000] for these analyses). De-ployments were done in two consecutive years, 1995/6 and 1996/7 (year one and two, respectively). In yearone, we targeted 18 reefs. In year two, panels were
placed on 15 additional reefs. Thus, 40 panels wereplaced on each of the 33 reefs. Note that the panelswere deployed on different reefs in separate years sinceour objective was to measure the effects of spatial scalerather than the predictability of recruitment at any par-ticular site or reef (which would take many years toestablish). To facilitate comparison with the small-scalestudies, we report here on reef-scale patterns using themean amount of recruitment (averaged for the 40 pan-els) on each reef plotted as a data point against latitude.
In contrast to the small-scale studies, the method-
February 2002 441LARGE-SCALE PATTERNS OF RECRUITMENT
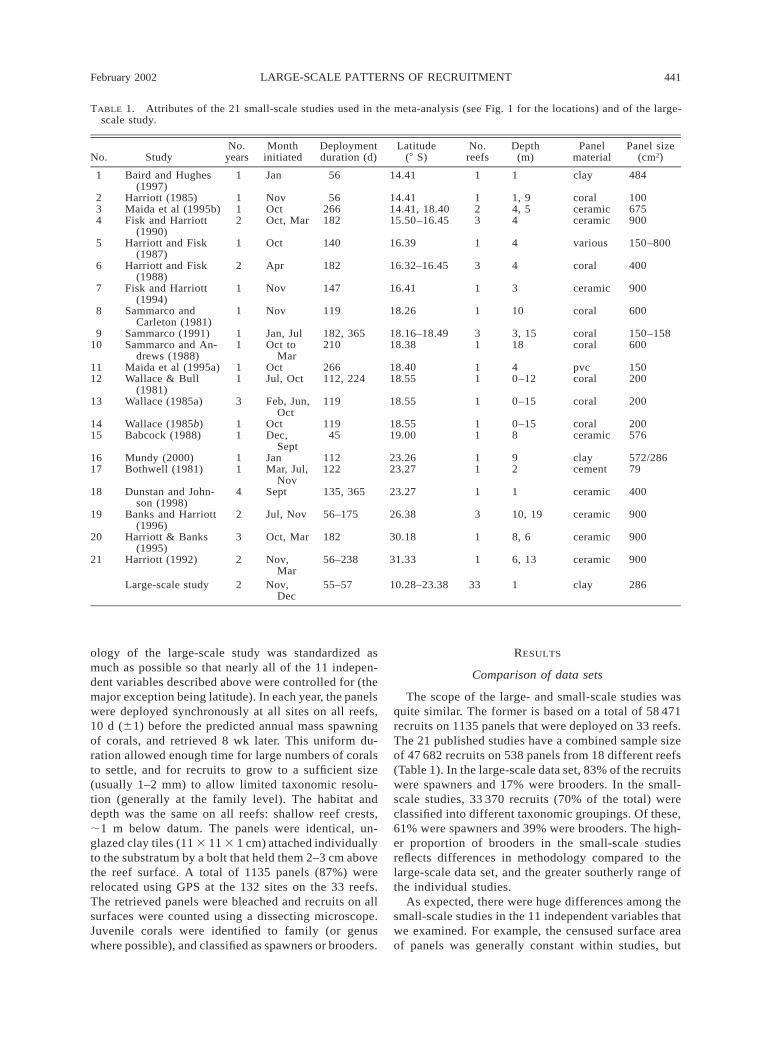
TABLE 1. Attributes of the 21 small-scale studies used in the meta-analysis (see Fig. 1 for the locations) and of the large-scale study.
No. StudyNo.
yearsMonth
initiatedDeploymentduration (d)
Latitude(8 S)
No.reefs
Depth(m)
Panelmaterial
Panel size(cm2)
1 Baird and Hughes(1997)
1 Jan 56 14.41 1 1 clay 484
2 Harriott (1985) 1 Nov 56 14.41 1 1, 9 coral 1003 Maida et al (1995b) 1 Oct 266 14.41, 18.40 2 4, 5 ceramic 6754 Fisk and Harriott
(1990)2 Oct, Mar 182 15.50–16.45 3 4 ceramic 900
5 Harriott and Fisk(1987)
1 Oct 140 16.39 1 4 various 150–800
6 Harriott and Fisk(1988)
2 Apr 182 16.32–16.45 3 4 coral 400
7 Fisk and Harriott(1994)
1 Nov 147 16.41 1 3 ceramic 900
8 Sammarco andCarleton (1981)
1 Nov 119 18.26 1 10 coral 600
9 Sammarco (1991) 1 Jan, Jul 182, 365 18.16–18.49 3 3, 15 coral 150–15810 Sammarco and An-
drews (1988)1 Oct to
Mar210 18.38 1 18 coral 600
11 Maida et al (1995a) 1 Oct 266 18.40 1 4 pvc 15012 Wallace & Bull
(1981)1 Jul, Oct 112, 224 18.55 1 0–12 coral 200
13 Wallace (1985a) 3 Feb, Jun,Oct
119 18.55 1 0–15 coral 200
14 Wallace (1985b) 1 Oct 119 18.55 1 0–15 coral 20015 Babcock (1988) 1 Dec,
Sept45 19.00 1 8 ceramic 576
16 Mundy (2000) 1 Jan 112 23.26 1 9 clay 572/28617 Bothwell (1981) 1 Mar, Jul,
Nov122 23.27 1 2 cement 79
18 Dunstan and John-son (1998)
4 Sept 135, 365 23.27 1 1 ceramic 400
19 Banks and Harriott(1996)
2 Jul, Nov 56–175 26.38 3 10, 19 ceramic 900
20 Harriott & Banks(1995)
3 Oct, Mar 182 30.18 1 8, 6 ceramic 900
21 Harriott (1992) 2 Nov,Mar
56–238 31.33 1 6, 13 ceramic 900
Large-scale study 2 Nov,Dec
55–57 10.28–23.38 33 1 clay 286
ology of the large-scale study was standardized asmuch as possible so that nearly all of the 11 indepen-dent variables described above were controlled for (themajor exception being latitude). In each year, the panelswere deployed synchronously at all sites on all reefs,10 d (61) before the predicted annual mass spawningof corals, and retrieved 8 wk later. This uniform du-ration allowed enough time for large numbers of coralsto settle, and for recruits to grow to a sufficient size(usually 1–2 mm) to allow limited taxonomic resolu-tion (generally at the family level). The habitat anddepth was the same on all reefs: shallow reef crests,;1 m below datum. The panels were identical, un-glazed clay tiles (11 3 11 3 1 cm) attached individuallyto the substratum by a bolt that held them 2–3 cm abovethe reef surface. A total of 1135 panels (87%) wererelocated using GPS at the 132 sites on the 33 reefs.The retrieved panels were bleached and recruits on allsurfaces were counted using a dissecting microscope.Juvenile corals were identified to family (or genuswhere possible), and classified as spawners or brooders.
RESULTS
Comparison of data sets
The scope of the large- and small-scale studies wasquite similar. The former is based on a total of 58 471recruits on 1135 panels that were deployed on 33 reefs.The 21 published studies have a combined sample sizeof 47 682 recruits on 538 panels from 18 different reefs(Table 1). In the large-scale data set, 83% of the recruitswere spawners and 17% were brooders. In the small-scale studies, 33 370 recruits (70% of the total) wereclassified into different taxonomic groupings. Of these,61% were spawners and 39% were brooders. The high-er proportion of brooders in the small-scale studiesreflects differences in methodology compared to thelarge-scale data set, and the greater southerly range ofthe individual studies.
As expected, there were huge differences among thesmall-scale studies in the 11 independent variables thatwe examined. For example, the censused surface areaof panels was generally constant within studies, but
442 T. P. HUGHES ET AL. Ecology, Vol. 83, No. 2
varied 11-fold among them (from 79 to 900 cm2). Sim-ilarly, the duration of each study varied eightfold, from6.5 to 52 wk. In comparison, the large-scale study usedrelatively small panels (121 cm2) and had a short, uni-form duration of 8 wk. The small-scale studies wereconducted in 14 of the 16 separate years between 1979and 1994 (inclusive), with initial deployments in tendifferent months (none were in May or August, duringthe Austral winter). Ten of the 21 primary studies haddeployment periods that did not include the peak sum-mer mass spawning of corals. In contrast, the large-scale study sampled only 2 yr, and the deployment washighly synchronized to precede the predicted massspawning by 9–11 d. The depth range of the small-scale studies ranged from zero (intertidal) to 19 m,compared to a uniform 1 m depth for the entire large-scale data set. The small-scale studies were located atmuddy inshore sites, on mid- and outer-shelf reefs, andon oceanic islands up to 580 km offshore. In contrast,the large-scale study was restricted to midshelf reefs,roughly halfway between the Australian mainland andthe edge of the continental shelf (see Fig. 1).
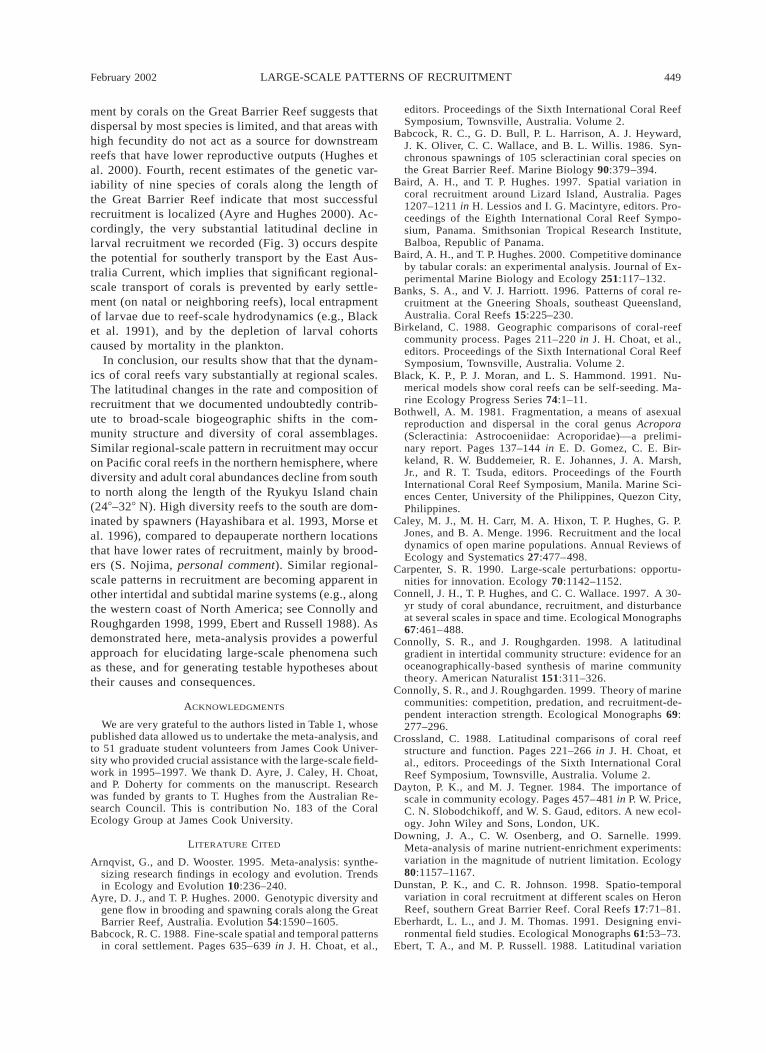
The spatial array of study locations differed sub-stantially between the large-scale and small-scale stud-ies. Reefs in the large-scale data set were distributedin five to six sectors from north to south, more or lessuniformly along the length of the GBR (Fig. 1). Notsurprisingly, the regional spread of reefs comprisingthe small-scale data set was more haphazard (Fig. 2)since the individual studies were never designed to bea single sampling exercise. No reefs were sampled inthe top 30% of the GBR to the north of Lizard Island(148409 S), while over two-thirds of the studies wereconducted very close (,100 km) to Cairns or Towns-ville in the central portion of the GBR (roughly 178and 198 S, respectively). Only three small-scale studieswere undertaken on the southern 40% of the GBR tothe south of Townsville, all of them on a single reef,Heron Island (238 S). Three additional studies wereconducted south of the GBR (see Table 1), extendingthe small-scale data set from 148 to 318 S, comparedto 108–238 S for the large-scale study. The geographicextent of the overlap between the two data sets is;1000 km, or 98 of latitude.
Latitudinal patterns of recruitment
The large- and small-scale studies both reveal asteady 20-fold decline in total recruitment (all taxacombined) from approximately 148 S to the geographiclimit of coral reefs, 2100 km to the south (Fig. 3a;adjusted r2 5 0.288, P , 0.01, and 0.246, P , 0.001,respectively). Recruitment by all taxa and by spawnersexhibits a similar large-scale pattern, due to the nu-merical dominance of spawners (Fig. 3a, b). The large-scale study shows a greater effect of latitude, whichaccounted for 29% of the variance in spawners com-pared to 20% in the small-scale data set. The trend,however, is not a simple north–south gradient. Ac-
cording to the large-scale study, recruitment peaked inthe central portion of the Great Barrier Reef in bothyears, and declined to the north as well as the south(Fig. 3a, b). The smaller-scale studies did not samplethe northernmost portion of the Great Barrier Reef, butthey confirm the southerly decline and establish thatthe trend extends beyond the highest latitudes of thelarge-scale study to the southern limits of coral reefsin the Pacific Ocean.
Recruitment by brooders also shows a north–southdecline in both data sets (Fig. 3c), although the trendwas not significant for the small-scale studies, withlatitude explaining only 2% of the variation. In con-trast, latitude accounted for a third of the variation inbrooders in the large-scale study (adjusted r2 5 0.344,P , 0.001). Brooders did not decline as quickly to thesouth as spawners in either data set (compare Fig. 3band c). Consequently, the proportion of spawners de-clined at higher latitudes (Fig. 4). In the middle two-thirds section of the GBR (;128–208 S; Fig. 1), spawn-ers predominated in the large-scale study, making upclose to 90% of recruits. The southern and northernends of the GBR both show a decline in numbers ofspawners, with a corresponding rise in the proportionof brooders. Consequently, the proportion of spawnerswas highly correlated with latitude in the large-scalestudy (adjusted r2 5 0.330, P , 0.001, Fig. 4). Thesmall-scale studies showed a much more variable andgenerally lower proportion of spawners than the large-scale data set, but also exhibited a significant (but muchweaker) trend for a greater proportion of brooders athigher latitudes (adjusted r2 5 0.048, P , 0.05, Fig.4).
In summary, both data sets reveal significant re-gional-scale variation in the amount and compositionof recruits. Less variation in recruitment was explainedby latitude in the small-scale data set, i.e., ‘‘unex-plained’’ variation within latitudes was greater, partic-ularly for brooders where the latitudinal signal was notstatistically significant. Next we use meta-analysis toexplore how methodological differences among thesmall-scale studies contributed to this large residualvariation.
Meta-analysis of small-scale studies
Here we use as many cases as possible from thepublished papers, i.e., multiple deployments of panelsat different sites and times were treated as replicates.We found highly significant, but generally weak, cor-relations among all of the continuous independent var-iables that we examined (Table 2). Of particular inter-est, latitude was confounded with the year that the studybegan (r 5 0.50, P , 0.001), the size of panels (r 50.37, P , 0.001), distance from shore (r 5 0.37, P ,0.001), depth (r 5 0.30, P , 0.001), the month ofdeployment (r 5 0.21, P , 0.001), and the duration ofdeployment (r 5 20.19, P 5 0.003). Specifically, com-pared to northern studies, those done in the south were

February 2002 443LARGE-SCALE PATTERNS OF RECRUITMENT
FIG. 2. Map of the Great Barrier Reef (GBR), indicating the location of reefs where recruitment of corals has beenmeasured in 18 independent studies. A further three studies (not shown) conducted on islands to the south of the GBR at268–318 S were also included in the meta-analysis (see Table 1 for details of the 21 studies).
generally undertaken in more recent years, using largerpanels that were deployed further offshore and in deep-er water, with deployments beginning later in the yearand lasting on average for a shorter period. We firstexamined the effects of each of the 11 independentvariables separately, and then entered them sequen-tially into multiple regression models.
In the meta-analysis, latitude on its own explainedless variation than the reef-scale regressions presentedearlier (Fig. 3) because of the considerable within-reefscatter in the data. Consequently, only 5.7% of thevariation in total recruitment (i.e., all taxa combined,
F1, 248 5 15.02, P , 0.001) and 7.3% of the variationin spawners (F4, 164 5 3.22, P 5 0.014) was explainedby latitude. Moreover, there was no effect of latitudeon the density of brooders (F4, 155 5 1.50, P 5 0.20).Therefore, a significant effect of latitude on the pro-portion of spawners to brooders (accounting for 11.9%of the variation, P 5 0.027) is attributable to a declinein spawners at southern sites rather than an increase inbrooders. Recruitment was often related more stronglyto individual variables other than latitude, particularlyto those that measure temporal aspects of the deploy-ment of panels. In contrast, three of the independent

444 T. P. HUGHES ET AL. Ecology, Vol. 83, No. 2
FIG. 3. Recruitment of corals vs. latitude along the east Australian coastline. Data from the large-scale study (left) andfrom 21 published studies (right, see Table 1). Recruitment (A) by all coral taxa; (B) by spawning corals; and (C) by brooders.Each point represents the mean number of recruits per panel on a single reef (all sites combined).
** P , 0.01, *** P , 0.001.
FIG. 4. The proportion of recruitment dueto spawners vs. latitude, in the large-scale study(left) and in the 21 published studies (right).Zero on the y-axis represents 100% recruitmentby brooders.
* P , 0.05, *** P , 0.001.
February 2002 445LARGE-SCALE PATTERNS OF RECRUITMENT
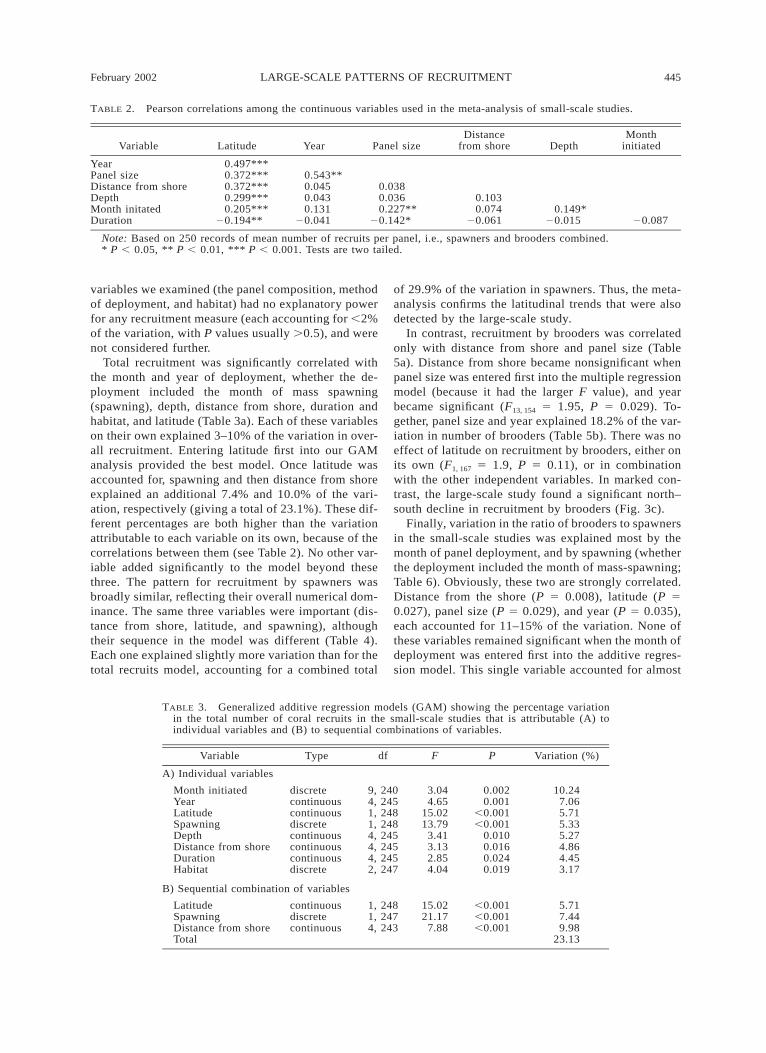
TABLE 2. Pearson correlations among the continuous variables used in the meta-analysis of small-scale studies.
Variable Latitude Year Panel sizeDistance
from shore DepthMonth
initiated
YearPanel sizeDistance from shoreDepthMonth initatedDuration
0.497***0.372***0.372***0.299***0.205***
20.194**
0.543**0.0450.0430.131
20.041
0.0380.0360.227**
20.142*
0.1030.074
20.0610.149*
20.015 20.087
Note: Based on 250 records of mean number of recruits per panel, i.e., spawners and brooders combined.* P , 0.05, ** P , 0.01, *** P , 0.001. Tests are two tailed.
TABLE 3. Generalized additive regression models (GAM) showing the percentage variationin the total number of coral recruits in the small-scale studies that is attributable (A) toindividual variables and (B) to sequential combinations of variables.
Variable Type df F P Variation (%)
A) Individual variables
Month initiatedYearLatitudeSpawningDepthDistance from shoreDurationHabitat
discretecontinuouscontinuousdiscretecontinuouscontinuouscontinuousdiscrete
9, 2404, 2451, 2481, 2484, 2454, 2454, 2452, 247
3.044.65
15.0213.79
3.413.132.854.04
0.0020.001
,0.001,0.001
0.0100.0160.0240.019
10.247.065.715.335.274.864.453.17
B) Sequential combination of variables
LatitudeSpawningDistance from shoreTotal
continuousdiscretecontinuous
1, 2481, 2474, 243
15.0221.17
7.88
,0.001,0.001,0.001
5.717.449.98
23.13
variables we examined (the panel composition, methodof deployment, and habitat) had no explanatory powerfor any recruitment measure (each accounting for ,2%of the variation, with P values usually .0.5), and werenot considered further.
Total recruitment was significantly correlated withthe month and year of deployment, whether the de-ployment included the month of mass spawning(spawning), depth, distance from shore, duration andhabitat, and latitude (Table 3a). Each of these variableson their own explained 3–10% of the variation in over-all recruitment. Entering latitude first into our GAManalysis provided the best model. Once latitude wasaccounted for, spawning and then distance from shoreexplained an additional 7.4% and 10.0% of the vari-ation, respectively (giving a total of 23.1%). These dif-ferent percentages are both higher than the variationattributable to each variable on its own, because of thecorrelations between them (see Table 2). No other var-iable added significantly to the model beyond thesethree. The pattern for recruitment by spawners wasbroadly similar, reflecting their overall numerical dom-inance. The same three variables were important (dis-tance from shore, latitude, and spawning), althoughtheir sequence in the model was different (Table 4).Each one explained slightly more variation than for thetotal recruits model, accounting for a combined total
of 29.9% of the variation in spawners. Thus, the meta-analysis confirms the latitudinal trends that were alsodetected by the large-scale study.
In contrast, recruitment by brooders was correlatedonly with distance from shore and panel size (Table5a). Distance from shore became nonsignificant whenpanel size was entered first into the multiple regressionmodel (because it had the larger F value), and yearbecame significant (F13, 154 5 1.95, P 5 0.029). To-gether, panel size and year explained 18.2% of the var-iation in number of brooders (Table 5b). There was noeffect of latitude on recruitment by brooders, either onits own (F1, 167 5 1.9, P 5 0.11), or in combinationwith the other independent variables. In marked con-trast, the large-scale study found a significant north–south decline in recruitment by brooders (Fig. 3c).
Finally, variation in the ratio of brooders to spawnersin the small-scale studies was explained most by themonth of panel deployment, and by spawning (whetherthe deployment included the month of mass-spawning;Table 6). Obviously, these two are strongly correlated.Distance from the shore (P 5 0.008), latitude (P 50.027), panel size (P 5 0.029), and year (P 5 0.035),each accounted for 11–15% of the variation. None ofthese variables remained significant when the month ofdeployment was entered first into the additive regres-sion model. This single variable accounted for almost
446 T. P. HUGHES ET AL. Ecology, Vol. 83, No. 2
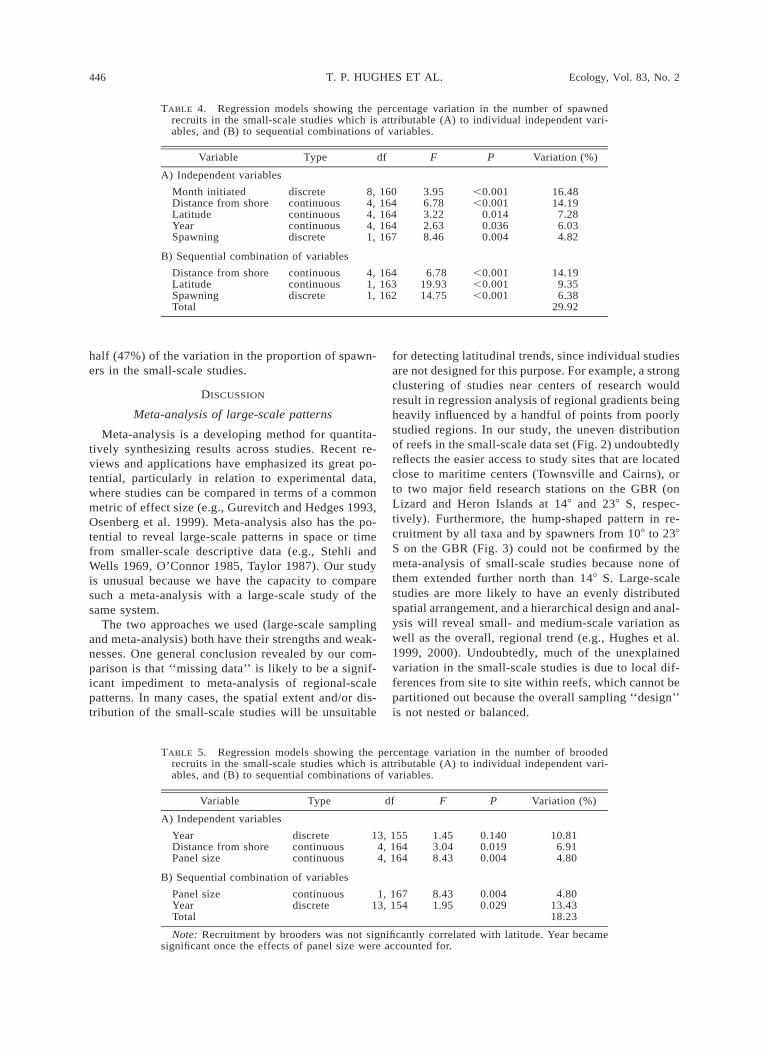
TABLE 4. Regression models showing the percentage variation in the number of spawnedrecruits in the small-scale studies which is attributable (A) to individual independent vari-ables, and (B) to sequential combinations of variables.
Variable Type df F P Variation (%)
A) Independent variables
Month initiatedDistance from shoreLatitudeYearSpawning
discretecontinuouscontinuouscontinuousdiscrete
8, 1604, 1644, 1644, 1641, 167
3.956.783.222.638.46
,0.001,0.001
0.0140.0360.004
16.4814.19
7.286.034.82
B) Sequential combination of variables
Distance from shoreLatitudeSpawningTotal
continuouscontinuousdiscrete
4, 1641, 1631, 162
6.7819.9314.75
,0.001,0.001,0.001
14.199.356.38
29.92
TABLE 5. Regression models showing the percentage variation in the number of broodedrecruits in the small-scale studies which is attributable (A) to individual independent vari-ables, and (B) to sequential combinations of variables.
Variable Type df F P Variation (%)
A) Independent variables
YearDistance from shorePanel size
discretecontinuouscontinuous
13, 1554, 1644, 164
1.453.048.43
0.1400.0190.004
10.816.914.80
B) Sequential combination of variables
Panel sizeYearTotal
continuousdiscrete
1, 16713, 154
8.431.95
0.0040.029
4.8013.4318.23
Note: Recruitment by brooders was not significantly correlated with latitude. Year becamesignificant once the effects of panel size were accounted for.
half (47%) of the variation in the proportion of spawn-ers in the small-scale studies.
DISCUSSION
Meta-analysis of large-scale patterns
Meta-analysis is a developing method for quantita-tively synthesizing results across studies. Recent re-views and applications have emphasized its great po-tential, particularly in relation to experimental data,where studies can be compared in terms of a commonmetric of effect size (e.g., Gurevitch and Hedges 1993,Osenberg et al. 1999). Meta-analysis also has the po-tential to reveal large-scale patterns in space or timefrom smaller-scale descriptive data (e.g., Stehli andWells 1969, O’Connor 1985, Taylor 1987). Our studyis unusual because we have the capacity to comparesuch a meta-analysis with a large-scale study of thesame system.
The two approaches we used (large-scale samplingand meta-analysis) both have their strengths and weak-nesses. One general conclusion revealed by our com-parison is that ‘‘missing data’’ is likely to be a signif-icant impediment to meta-analysis of regional-scalepatterns. In many cases, the spatial extent and/or dis-tribution of the small-scale studies will be unsuitable
for detecting latitudinal trends, since individual studiesare not designed for this purpose. For example, a strongclustering of studies near centers of research wouldresult in regression analysis of regional gradients beingheavily influenced by a handful of points from poorlystudied regions. In our study, the uneven distributionof reefs in the small-scale data set (Fig. 2) undoubtedlyreflects the easier access to study sites that are locatedclose to maritime centers (Townsville and Cairns), orto two major field research stations on the GBR (onLizard and Heron Islands at 148 and 238 S, respec-tively). Furthermore, the hump-shaped pattern in re-cruitment by all taxa and by spawners from 108 to 238S on the GBR (Fig. 3) could not be confirmed by themeta-analysis of small-scale studies because none ofthem extended further north than 148 S. Large-scalestudies are more likely to have an evenly distributedspatial arrangement, and a hierarchical design and anal-ysis will reveal small- and medium-scale variation aswell as the overall, regional trend (e.g., Hughes et al.1999, 2000). Undoubtedly, much of the unexplainedvariation in the small-scale studies is due to local dif-ferences from site to site within reefs, which cannot bepartitioned out because the overall sampling ‘‘design’’is not nested or balanced.

February 2002 447LARGE-SCALE PATTERNS OF RECRUITMENT
TABLE 6. Regression models showing the percentage variation in the ratio of spawners tobrooders in the small-scale studies that is attributable to individual variables.
Variable Type df P Variation (%)
Month initiatedSpawningDistance from shoreLatitudePanel sizeYear
discretediscretecontinuouscontinuouscontinuouscontinuous
8, 1511, 1584, 1554, 1554, 1554, 155
,0.001,0.001
0.0080.0270.0290.035
47.0223.2615.0211.8611.7511.17
Note: Once the effects of month initiated was accounted for in multiple regression modelsno other variable remained significant.
The choice of which studies to include in a meta-analysis often has a critical effect on the patterns thatemerge (e.g., Englund et al. 1999). Selection of studiesis often subjective (e.g., based on a perception of thequality of the data, the amount of replication, experi-ence of the authors, etc.), and there is an unfortunatetendency for bias towards choosing a subset of theavailable information which support a preconceivedoutcome (Mahoney 1977). Accordingly, we chose ev-ery available study of coral recruitment from the geo-graphic region of interest. Another source of error inmeta-analyses is the tendency for authors not to publishnegative results (e.g., a nonsignificant experimentaloutcome), the so-called ‘‘file drawer effect.’’ Thiscould also happen with descriptive data, e.g., if esti-mates of abundance that were zero or very low werenot reported. We canvassed our colleagues working onrecruitment of corals in Australia to rule out this pos-sibility. It is no accident, however, that much of theliterature on coral recruitment comes from the GreatBarrier Reef, because rates of recruitment reportedfrom elsewhere (e.g., in the Caribbean) are often muchlower (e.g., Birkeland 1988, Richmond and Hunter1990, Hughes et al. 1999, and references therein). Con-sequently, a paucity of published data from locationswith very low recruitment would make a global meta-analysis problematical. In general, meta-analysis is un-likely to be fruitful where the range of the whole dataset is small or where mean data values are close tozero. In our study, for example, meta-analysis detectedthe 20-fold latitudinal decline in the density of spawnedrecruits, but failed to resolve the more subtle regional-scale variation in brooders.
The inclusion of multiple years (14 separate yearsover a 16-yr period) in the small-scale data set poten-tially provides a major advantage over the large-scalestudy, because a longer time-scale can reveal spatialpatterns that are not wholly consistent among years.Furthermore, a multi-year meta-analysis can explicitlyexamine longer term temporal variation. In our anal-ysis, the year of each study had no significant effecton total recruitment, recruitment by spawners, or theratio of brooders to spawners (Tables 3a, 3b, 5), in-dicting that the regional-scale patterns are consistentover time. However, recruitment by brooders did varysignificantly from year to year (Table 3b), which may
account for the failure of the meta-analysis to detect aconsistent regional pattern. In contrast to the meta-analysis, the large-scale study was conducted onlytwice, in two consecutive years, one or both of whichconceivably could have been unrepresentative. How-ever, the patterns of recruitment in both years of thelarge-scale study were very similar (see Hughes et al.1999, 2000), although this may well have been sheergood luck. Generally, the cost of large-scale samplingis substantial, which makes it difficult to repeat. Meta-analysis, on the other hand, by definition involves nonew field costs since multi-year data can be derivedfrom the literature.
The main drawback of using small-scale investiga-tions to detect regional patterns is the noise in the datadue to differences in methods among published studies.In our analysis, these methodological differences (e.g.,distance from shore, panel size, depth, etc.) had sur-prisingly modest effects (Tables 3–5), but this is un-likely to be generally true, especially where regional-scale trends are more subtle than the order of magnitudevariation in recruitment that we examined. Further-more, latitude was positively or negatively correlatedwith most of these variables (Table 2). This is likelyto be a general (and undesirable) property of meta-analysis: a nonrandom spatial distribution of method-ologies arising from different research teams in dif-ferent locations. These correlations raise the possibilitythat any large-scale pattern detectable in small-scalestudies could simply be due to regional variation inmethodology rather than biology. Alternatively, re-gional patterns could be partially obscured by con-founding methodologies. In our study, we explicitlyaccounted for differences in methodologies, and theconcordance between the small- and large-scale datasets gives us some confidence in concluding that thelatitudinal patterns in recruitment are indeed real.Moreover, we are beginning to understand some of theprocesses that are responsible for the regional trends(see Discussion: Mechanisms of large-scale recruit-ment variation).
In summary, a large-scale study has numerous ad-vantages over meta-analysis in terms of the compara-bility of data from different locations or census inter-vals. A single regional-scale study is also more likelyto be developed in conjunction with predetermined sta-
448 T. P. HUGHES ET AL. Ecology, Vol. 83, No. 2
tistical procedures, based on a uniform sampling de-sign. The methods are invariably more homogeneous,the results are always expressed as the same metric,and the involvement of fewer people with similar train-ing means that there is less likelihood of bias betweenobservers or between research groups. Most impor-tantly, the data are likely to be less noisy, unencum-bered by extraneous methodological factors which of-ten differ among individual small-scale studies. Ofcourse, the downside is the expense, time, and effortassociated with a larger sampling regime compared toan analysis of previously published studies (althoughwe strongly suspect that our single-regional study ofrecruitment by corals was cheaper than the combinedcost of the 21 individual field studies). Furthermore,sampling or experiments conducted at larger spatialscales are more difficult to repeat, and the limited tem-poral window could be unrepresentative.
Mechanisms of large-scale recruitment variation
The results from meta-analysis are particularly use-ful because they can be used to generate hypothesesaddressing the mechanisms underlying large-scale pat-terns. The meta-analysis presented here demonstratesthat the timing of deployment of panels had a criticalimpact on the amount and species composition of re-cruits. Intuitively, we would expect low rates of re-cruitment when and where few larvae are produced.Conversely, higher recruitment should result in timeperiods (seasons or years) or regions that have higherrates of production of larvae. Elsewhere, (as a com-ponent of the large-scale study) we tested the hypoth-esis that variation in recruitment by spawning acro-porids (Fig. 3) was related to temporal and regionalvariation in their fecundity. We found large differencesamong reefs in the proportion of adult corals that un-derwent mass spawning in each of two years of thestudy, which accounted for a huge proportion (72%)of the variation in their recruitment among the 33 reefsthat we sampled (Hughes et al. 2000). Moreover, onceregional variation in the intensity of spawning was ac-counted for statistically, there was no further effect oflatitude on large-scale patterns of recruitment byspawning corals. Consequently, we suggest that lati-tudinal patterns of recruitment on the GBR (Figs. 3 and4) are driven by regional-scale gradients in the numberof larvae produced each season, with reefs and sectorsin the central GBR having higher recruitment byspawning corals (Fig. 3) because this region producesmore larvae than elsewhere. Similarly, the continueddecline in recruitment south of the GBR is probablydue to a dwindling larval pool, as populations of breed-ing adults become smaller and more isolated.
The mechanisms of recruitment could also accountfor some of the disparities between the large- andsmall-scale studies. Specifically, the large-scale studyhad a higher density of recruits, and a greater propor-tion of spawners (Figs. 3 and 4), almost certainly be-
cause of differences in the timing and duration of thepanel deployments in the two data sets. The large-scaledeployments in late 1995 and 1996 were initiated 9–11 d before the predicted annual mass spawning ofcorals in November/December. This narrow timing wasdesigned to allow the development of chemical or phys-ical cues from bacteria or algae on the panels, whichfacilitate the settlement and metamorphosis of manycorals (e.g., Morse et al. 1994). The annual peak set-tlement of spawning corals would have occurred 3–7d after the release of gametes, ;2 wk after the panelswere placed in position. In contrast, half of the small-scale studies missed entirely the annual mass spawningevent, which obviously reduced the abundance ofspawners and increased the proportion of brooders (thatare released over a more protracted [lunar] breedingcycle, see Harrison and Wallace 1990, Tanner 1996).In addition, 20 of the 21 small-scale studies had longerdurations than the large-scale data set (Table 1). Longersubmergence times are likely to favor the accumulationof multiple cohorts of brooders, while a single annualcohort of spawners should rapidly decline due to mor-tality (Dunstan and Johnson 1998, Baird and Hughes2000). Note, however, that the latitudinal decline inrecruitment and the relative increase in brooders to thesouth cannot be explained by variation in the timingor duration of panel deployments among the small-scale studies. The southernmost studies were conductedcloser to spawning (later in the year) and they wereshorter (i.e., latitude was positively correlated with themonth of initiation, and negatively correlated with du-ration, see Table 2). This should have produced an in-crease in numbers and proportion of spawners, the op-posite of the pattern detected in both the large- andsmall-scale analyses. Thus, the large-scale pattern isnot an artifact of methodology.
Large-scale hydrodynamics does not appear to playa major role in determining regional patterns of re-cruitment by corals along the Great Barrier Reef. Al-though the peak recruitment by spawners at 148–188 Scoincides with the predominant westward-flowing cur-rent which flows from the Coral Sea to the outer GreatBarrier Reef, it is unlikely that substantial transport ofcoral larvae occurs at this scale, for several reasons.First, the area of reefs (a proxy for reproductive output)declines precipitously eastwards from the GBR. Con-sequently, the production of larvae by isolated oceanicreefs is unlikely to be a significant input onto the vastexpanse of the Great Barrier Reef. Second, the GBRis much more speciose than reefs to the east, having;100 more species than on New Caledonia, the nearestlarge reef system, 1100 km to the east (see Veron 1993).This biogeographic distinction implies that the CoralSea is a significant barrier to dispersal, at least fromwest to east. Clearly, for the species found only on theGBR (and further north), the Coral Sea cannot be asource of larvae. Third, the strong concordance be-tween sector-scale patterns of spawning and recruit-
February 2002 449LARGE-SCALE PATTERNS OF RECRUITMENT
ment by corals on the Great Barrier Reef suggests thatdispersal by most species is limited, and that areas withhigh fecundity do not act as a source for downstreamreefs that have lower reproductive outputs (Hughes etal. 2000). Fourth, recent estimates of the genetic var-iability of nine species of corals along the length ofthe Great Barrier Reef indicate that most successfulrecruitment is localized (Ayre and Hughes 2000). Ac-cordingly, the very substantial latitudinal decline inlarval recruitment we recorded (Fig. 3) occurs despitethe potential for southerly transport by the East Aus-tralia Current, which implies that significant regional-scale transport of corals is prevented by early settle-ment (on natal or neighboring reefs), local entrapmentof larvae due to reef-scale hydrodynamics (e.g., Blacket al. 1991), and by the depletion of larval cohortscaused by mortality in the plankton.
In conclusion, our results show that that the dynam-ics of coral reefs vary substantially at regional scales.The latitudinal changes in the rate and composition ofrecruitment that we documented undoubtedly contrib-ute to broad-scale biogeographic shifts in the com-munity structure and diversity of coral assemblages.Similar regional-scale pattern in recruitment may occuron Pacific coral reefs in the northern hemisphere, wherediversity and adult coral abundances decline from southto north along the length of the Ryukyu Island chain(248–328 N). High diversity reefs to the south are dom-inated by spawners (Hayashibara et al. 1993, Morse etal. 1996), compared to depauperate northern locationsthat have lower rates of recruitment, mainly by brood-ers (S. Nojima, personal comment). Similar regional-scale patterns in recruitment are becoming apparent inother intertidal and subtidal marine systems (e.g., alongthe western coast of North America; see Connolly andRoughgarden 1998, 1999, Ebert and Russell 1988). Asdemonstrated here, meta-analysis provides a powerfulapproach for elucidating large-scale phenomena suchas these, and for generating testable hypotheses abouttheir causes and consequences.
ACKNOWLEDGMENTS
We are very grateful to the authors listed in Table 1, whosepublished data allowed us to undertake the meta-analysis, andto 51 graduate student volunteers from James Cook Univer-sity who provided crucial assistance with the large-scale field-work in 1995–1997. We thank D. Ayre, J. Caley, H. Choat,and P. Doherty for comments on the manuscript. Researchwas funded by grants to T. Hughes from the Australian Re-search Council. This is contribution No. 183 of the CoralEcology Group at James Cook University.
LITERATURE CITED
Arnqvist, G., and D. Wooster. 1995. Meta-analysis: synthe-sizing research findings in ecology and evolution. Trendsin Ecology and Evolution 10:236–240.
Ayre, D. J., and T. P. Hughes. 2000. Genotypic diversity andgene flow in brooding and spawning corals along the GreatBarrier Reef, Australia. Evolution 54:1590–1605.
Babcock, R. C. 1988. Fine-scale spatial and temporal patternsin coral settlement. Pages 635–639 in J. H. Choat, et al.,
editors. Proceedings of the Sixth International Coral ReefSymposium, Townsville, Australia. Volume 2.
Babcock, R. C., G. D. Bull, P. L. Harrison, A. J. Heyward,J. K. Oliver, C. C. Wallace, and B. L. Willis. 1986. Syn-chronous spawnings of 105 scleractinian coral species onthe Great Barrier Reef. Marine Biology 90:379–394.
Baird, A. H., and T. P. Hughes. 1997. Spatial variation incoral recruitment around Lizard Island, Australia. Pages1207–1211 in H. Lessios and I. G. Macintyre, editors. Pro-ceedings of the Eighth International Coral Reef Sympo-sium, Panama. Smithsonian Tropical Research Institute,Balboa, Republic of Panama.
Baird, A. H., and T. P. Hughes. 2000. Competitive dominanceby tabular corals: an experimental analysis. Journal of Ex-perimental Marine Biology and Ecology 251:117–132.
Banks, S. A., and V. J. Harriott. 1996. Patterns of coral re-cruitment at the Gneering Shoals, southeast Queensland,Australia. Coral Reefs 15:225–230.
Birkeland, C. 1988. Geographic comparisons of coral-reefcommunity process. Pages 211–220 in J. H. Choat, et al.,editors. Proceedings of the Sixth International Coral ReefSymposium, Townsville, Australia. Volume 2.
Black, K. P., P. J. Moran, and L. S. Hammond. 1991. Nu-merical models show coral reefs can be self-seeding. Ma-rine Ecology Progress Series 74:1–11.
Bothwell, A. M. 1981. Fragmentation, a means of asexualreproduction and dispersal in the coral genus Acropora(Scleractinia: Astrocoeniidae: Acroporidae)—a prelimi-nary report. Pages 137–144 in E. D. Gomez, C. E. Bir-keland, R. W. Buddemeier, R. E. Johannes, J. A. Marsh,Jr., and R. T. Tsuda, editors. Proceedings of the FourthInternational Coral Reef Symposium, Manila. Marine Sci-ences Center, University of the Philippines, Quezon City,Philippines.
Caley, M. J., M. H. Carr, M. A. Hixon, T. P. Hughes, G. P.Jones, and B. A. Menge. 1996. Recruitment and the localdynamics of open marine populations. Annual Reviews ofEcology and Systematics 27:477–498.
Carpenter, S. R. 1990. Large-scale perturbations: opportu-nities for innovation. Ecology 70:1142–1152.
Connell, J. H., T. P. Hughes, and C. C. Wallace. 1997. A 30-yr study of coral abundance, recruitment, and disturbanceat several scales in space and time. Ecological Monographs67:461–488.
Connolly, S. R., and J. Roughgarden. 1998. A latitudinalgradient in intertidal community structure: evidence for anoceanographically-based synthesis of marine communitytheory. American Naturalist 151:311–326.
Connolly, S. R., and J. Roughgarden. 1999. Theory of marinecommunities: competition, predation, and recruitment-de-pendent interaction strength. Ecological Monographs 69:277–296.
Crossland, C. 1988. Latitudinal comparisons of coral reefstructure and function. Pages 221–266 in J. H. Choat, etal., editors. Proceedings of the Sixth International CoralReef Symposium, Townsville, Australia. Volume 2.
Dayton, P. K., and M. J. Tegner. 1984. The importance ofscale in community ecology. Pages 457–481 in P. W. Price,C. N. Slobodchikoff, and W. S. Gaud, editors. A new ecol-ogy. John Wiley and Sons, London, UK.
Downing, J. A., C. W. Osenberg, and O. Sarnelle. 1999.Meta-analysis of marine nutrient-enrichment experiments:variation in the magnitude of nutrient limitation. Ecology80:1157–1167.
Dunstan, P. K., and C. R. Johnson. 1998. Spatio-temporalvariation in coral recruitment at different scales on HeronReef, southern Great Barrier Reef. Coral Reefs 17:71–81.
Eberhardt, L. L., and J. M. Thomas. 1991. Designing envi-ronmental field studies. Ecological Monographs 61:53–73.
Ebert, T. A., and M. P. Russell. 1988. Latitudinal variation
450 T. P. HUGHES ET AL. Ecology, Vol. 83, No. 2
in size structure of the west coast purple sea urchin: acorrelation with headlands. Limnology and Oceanography33:286–354.
Edwards, P. J., R. M. May, and N. R. Webb, editors. 1994.Large-scale ecology and conservation biology. BlackwellScience, Oxford, UK.
Englund, G., O. Sarnelle, and S. D. Cooper. 1999. The im-portance of data-selection criteria: meta-analysis of streampredation experiments. Ecology 80:1132–1142.
Fisk, D. A., and V. J. Harriott. 1990. Spatial and temporalvariation in coral recruitment on the Great Barrier Reef:implications for dispersal hypotheses. Marine Biology 107:485–490.
Fisk, D., and V. J. Harriott. 1993. Are understorey coralsrecruitment limited? Pages 513–516 in Proceedings of theSeventh International Coral Reef Symposium. Volume 1.University of Guam Press, Mangilao, Guam.
Gaines, S. D., and J. Roughgarden. 1985. Larval settlementrates: a leading determinant of structure in an ecologicalcommunity of the marine intertidal zone. Proceedings ofthe National Academy of Science, USA 82:3707–3701.
Glass, G. V., B. McGraw, and M. L. Smith. 1981. Meta-analysis in social research. Sage Publications, BeverlyHills, California, USA.
Goldberg, D. E., T. Rajaneimi, J. Gurevitch, and A. Stewart-Oaten. 1999. Empirical approaches to quantifying inter-action intensity: competition and facilitation along pro-ductivity gradients. Ecology 80:1118–1132.
Gurevitch, J., and L. V. Hedges. 1993. Meta-analysis: com-bining the results of independent experiments. Pages 378–398 in S. M. Scheiner and J. Gurevitch, editors. Designand analysis of ecological experiments. Chapman and Hall,New York, New York, USA.
Harriott, V. J. 1985. Recruitment patterns of scleractiniancorals at Lizard Island, Great Barrier Reef. Pages 367–372in C. Gabrie and M. Harmelin Vivien, editors. Proceedingsof the Fifth International Coral Reef Congress, Tahiti. An-tenne Museum-Ephe, Moorea, French Polynesia.
Harriott, V. J. 1992. Recruitment patterns of scleractiniancorals in an isolated sub-tropical reef system. Coral Reefs11:215–219.
Harriott, V. J., and S. A. Banks. 1995. Recruitment of scler-actinian corals in the Solitary Islands Marine Reserve, ahigh latitude coral-dominated community in eastern Aus-tralia. Marine Ecology Progress Series 123:155–161.
Harriott, V. J., and D. A. Fisk. 1987. A comparison of set-tlement plate types for experiments on the recruitment ofscleractinian corals. Marine Ecology Progress Series 37:201–208.
Harriott, V. J., and D. A. Fisk. 1988. Recruitment patternsof scleractinian corals: a study of three reefs. AustralianJournal of Marine and Freshwater Research 39:409–416.
Harriott, V. J., P. L. Harrison, and S. A. Banks. 1995. Thecoral comunities of Lord Howe Island. Australian Journalof Marine and Freshwater Research 46:457–465.
Harriott, V. J., and C. J. Simpson. 1996. Coral recruitmenton tropical and subtropical reefs in Western Australia. Pag-es 1191–1196 in H. Lessios and I. G. Macintyre, editors.Proceedings of the Eighth International Coral Reef Sym-posium, Panama. Volume 2. Smithsonian Tropical ResearchInstitute, Balboa, Republic of Panama.
Harrison, P. L., R. C. Babcock, G. D. Bull, J. K. Oliver, C.C. Wallace, and B. L. Willis. 1984. Mass-spawning in trop-ical reef corals. Science 223:1186–1189.
Harrison, P. L., and C. C. Wallace. 1990. Reproduction, dis-persal and recruitment of scleractinian corals. Pages 133–207 in Z. Dubinsky, editor. Ecosystems of the world. Vol-ume 25. Elsevier, New York, New York, USA.
Hastie, T. J., and R. Tibshirani. 1990. Generalized additivemodels. Chapman and Hall, London, UK.
Hayashibara, T., K. Shimoike, T. Kimura, S. Hosaka, A. Hey-ward, P. Harrison, K. Kudo, and M. Omori. 1993. Patternsof coral spawning at Akajima Island, Okinawa, Japan. Ma-rine Ecology Progress Series 101:253–262.
Hedges, L. V., and I. Olkin. 1985. Statistical methods formeta-analysis. Academic Press, New York, New York,USA.
Hughes, T. P. 1990. Recruitment limitation, mortality andpopulation regulation in a sessile invertebrate, Celleporapumicosa (Bryozoa, Anasca). Ecology 71:12–20.
Hughes, T. P., A. H. Baird, E. A. Dinsdale, N. A. Molchan-iwskyj, M. S. Pratchett, J. E. Tanner, and B. L. Willis. 1999.Patterns of recruitment and abundance of corals along theGreat Barrier Reef. Nature 397:59–63.
Hughes, T. P., A. H. Baird, E. A. Dinsdale, N. A. Molchan-iwskyj, M. S. Pratchett, J. E. Tanner, and B. L. Willis. 2000.Supply-side ecology works both ways: the link betweenbenthic adults, fecundity, and larval recruits. Ecology 81:2241–2249.
Hughes, T. P., and J. E. Tanner. 2000. Recruitment failure,life histories, and long-term decline of Caribbean corals.Ecology 81:2250–2263.
Karlson, R. H., and D. R. Levitan. 1990. Recruitment limi-tation in open populations of Diadema antillarum: an eval-uation. Oecologia 82:40–44.
Mahoney, M. J. 1977. Publication prejudices: an experimen-tal study of confirmatory bias in the peer review systems.Cognitive Therapy and Research 1:161–175.
Maida, M., P. W. Sammarco, and J. C. Coll. 1995a. Effectsof soft corals on scleractinian coral recruitment. 1: direc-tional allelopathy and inhibition of settlement. MarineEcology Progress Series 121:191–202.
Maida, M., P. W. Sammarco, and J. C. Coll. 1995b. Prelim-inary evidence for directional allelopathic effects of thesoft coral Sinularia flexibilis (Alcyonacea: Octocorallia) onscleractinian coral recruitment. Bulletin of Marine Science56:303–311.
Menge, B. A., B. A. Daley, J. Lubchenko, E. Sanford, E.Dahlhoff, P. M. Halpin, G. Hudson, and J. L. Burnaford.1999. Top-down and bottom-up regulation of New Zealandrocky intertidal communities. Ecological Monographs 69:297–330.
Milicich, M. J. 1994. Dynamic coupling of reef fish replen-ishment and oceanographic processes. Marine Ecology Pro-gress Series 110:135–144.
Morse, A. N. C., K. Iwao, M. Baba, K. Shiroike, T. Hayash-ibara, and M. Omori. 1994. An ancient chemosensorymechanism brings new life to coral reefs. Biological Bul-letin 191:149–154.
Mundy, C. N. 2000. An appraisal of methods used in coralrecruitment studies. Coral Reefs 19:124–131.
O’Connor, R. J. 1985. Long-term monitoring of British birdpopulations. Ornis Fennica 62:73–79.
Osenberg, C. W., O. Sarnelle, S. D. Cooper, and R. D. Holt.1999. Resolving ecological questions through meta-anal-ysis: goals, metrics, and models. Ecology 80:1105–1117.
Rastetter, E. B., A. W. King, B. J. Cosby, G. M. Hornberger,R. V. O’Neill, and J. E. Hobbie. 1992. Aggregating finescale ecological knowledge to model coarse-scale attributesof ecosystems. Ecological Applications 2:55–70.
Richmond, R. H. 1987. Energetics, competency and long-distance dispersal of planula larvae of the coral Pocilloporadamicornis. Marine Biology 93:527–533.
Richmond, R. H., and C. L. Hunter. 1990. Reproduction andrecruitment of corals: comparisons among the Caribbean,the tropical Pacific, and the Red Sea. Marine Ecology Pro-gress Series 60:185–203.
Rosenzweig, M. L. 1995. Species diversity in space and time.Cambridge University Press, Cambridge, UK.
Sachs, H. S., J. Berrier, D. Reitman, V. A. Ancona-Berk, and

February 2002 451LARGE-SCALE PATTERNS OF RECRUITMENT
T. C. Chalmer. 1987. Meta-analysis of randomized con-trolled trials. New England Journal of Medicine 316:450–455.
Sammarco, P. W. 1991. Geographically specific recruitmentand post settlement mortality as influences on coral com-munities: the cross continental shelf transplant experi-ments. Limnology and Oceanography. 36:496–514.
Sammarco, P. W., and J. C. Andrews. 1988. Localized dis-persal and recruitment patterns in Great Barrier Reef corals.Limnology and Oceanography 34:896–912.
Sammarco, P. W., and J. H. Carleton. 1981. Damselfish ter-ritoriality and coral community structure: reduced grazing,coral recruitment, and effects on coral spat. Pages 525–535in E. D. Gomez, C. E. Birkeland, R. W. Buddemeier, R. E.Johannes, J. A. Marsh, Jr., and R. T. Tsuda, editors. Pro-ceedings of the Fourth International Coral Reef Sympo-sium, Manila. Marine Sciences Center, University of thePhilippines, Quezon City, Philippines.
Schneider, D. C. 1994. Quantitative ecology: spatial and tem-poral scaling. Academic Press, San Diego, California,USA.
Schneider, D. C., R. Walters, S. Thrush, and P. Dayton. 1997.Scale-up of ecological experiments: density variation in themobile bivalve Macomona liliana. Journal of ExperimentalMarine Biology and Ecology 216:129–152.
Stehli, F. G., and J. W. Wells. 1969. Diversity and age patternsin hermatypic corals. Systematic Zoology 20:115–126.
Tanner, J. E. 1996. Seasonal and lunar periodicity in thereproduction of pocilloporid corals. Coral Reefs 15:59–66.
Taylor, L. R. 1987. Objective and experiment in long-termresearch. Pages 20–70 in G. E. Likens, editor. Long-termstudies in ecology: approaches and alternatives. Springer-Verlag, New York, New York, USA.
Thrush, S. F., et al. 1997. Scaling-up from experiments tocomplex ecological systems: Where to next? Journal ofExperimental Marine Biology and Ecology 216:243–254.
Veron, J. E. N. 1993. A biogeographic database of hermatypiccorals. Australian Institute of Marine Science MonographSeries. Volume 10. University of Hawaii Press, Honolulu.
Veron, J. E. N., and T. J. Done. 1979. Corals and coral com-munities of Lord Howe Island. Australian Journal of Ma-rine and Freshwater Research 30:203–236.
Wallace, C. C. 1985a. Seasonal peaks and annual fluctuationsin recruitment of juvenile scleractinian corals. Marine Ecol-ogy Progress Series 21:289–298.
Wallace, C. C. 1985b. Reproduction, recruitment and frag-mentation in nine sympatric species of the coral genus Ac-ropora. Marine Biology 88:217–233.
Wallace, C. C., and G. D. Bull. 1981. Patterns of juvenilecoral recruitment on a reef front during a spring-summerspawning period. Pages 345–350 in E. D. Gomez, C. E.Birkeland, R. W. Buddemeier, R. E. Johannes, J. A. Marsh,Jr., and R. T. Tsuda, editors. Proceedings of the Fourthinternational coral reef symposium, Manila. Volume 2. Ma-rine Sciences Center, University of the Philippines, QuezonCity, Philippines.
Wiens, J. A. 1989. Spatial scaling in ecology. FunctionalEcology 3:385–397.
Wiens, J. A., N. C. Stenseth, B. Van Horne, and R. A. Ims.1993. Ecological mechanisms and landscape ecology. Oi-kos 66:369–380.
Wilson, J. R., and P. L. Harrison. 1998. Settlement-compe-tency periods of larvae of three species of scleractiniancorals. Marine Biology 131:339–345.
Wolanski, E. 1994. Physical oceanographic processes of theGreat Barrier Reef. CRC Press, Boca Raton, Florida, USA.
Related Documents