Detecting false financial statements using published data: some evidence from Greece Charalambos T. Spathis Aristotle University of Thessaloniki, Department of Economics, Division of Business Administration, Thessaloniki, Greece Introduction References to false financial statement (FFS) are increasingly frequent over the last few years. Falsifying financial statements primarily consists of manipulating elements by overstating assets, sales and profit, or understating liabilities, expenses, or losses. When a financial statement contains falsifications so that its elements no longer represent the true picture, we speak of fraud. Management fraud can be defined as ``deliberate fraud committed by management that injures investors and creditors through misleading financial statements’’ (Eliott and Willingham, 1980). For Wallace (1995), fraud is ``a scheme designed to deceive; it can be accomplished with fictitious documents and representations that support fraudulent financial statements’’. The International Federation of Accountants issued in 1982 the International Statement of Auditing (ISA) No. 11: Fraud and Error and explains that the characteristic which differentiates error from fraud is intent. Errors result from unintentional actions (Colbert, 2000). The American Institute of Certified Public Accountants (AICPA) (1983) in Statement on Auditing Standards (SAS) No. 47 notes that ``error refers to unintentional misstatements or omissions of amounts or disclosures in the financial statements’’. SAS No. 82 (AICPA, 1997) reiterates the idea that fraud is an intentional act, and fraud frequently includes the perpetrator(s) feeling pressure or having an incentive to commit fraud and also perceiving an opportunity to do so. Fraud and white-collar crime has reached epidemic proportions in the USA. Some estimates suggest that fraud costs US business more than $400 billion annually (Wells, 1997). In Greece, the issue of false financial statements has lately been brought more into the limelight in connection primarily with: the increase in the number of companies listed on the Athens Stock Exchange and the raising of capital through public offering; and attempts to reduce the level of taxation on profits. The year 2000 has been very difficult for the Greek stock market, which has suffered from stagnation both in terms of share prices and liquidity. This fact, along with the recent pervasive record of false financial statements, increased the interest of the authorities, stock market, Ministry of the Economy and the banking sector in early- warning systems. In this context, the absence of a Greek study on the subject is striking. This paper intends to address this need in the existing literature. For this purpose, univariate and multivariate statistical tools were employed to investigate the usefulness of publicly available variables for detecting FFS. A total of ten variables were found to be possible indicators of FFS. These include the ratios: debt to equity, sales to total assets, net profit to sales, accounts receivable to sales, net profit to total assets, working capital to total assets, gross profit to total assets, inventory to sales, total debt to total assets, and financial distress (Z-score). Using stepwise logistic regression, two models were developed with a high probability of detecting FFS in a sample. The models include the variables: the inventories to sales ratio, the ratio of total debt to total assets, the working capital to total assets ratio, the net profit to total assets ratio, and financial distress (Z-score). The paper is organised as follows: the second section reviews research on false financial statements carried out up to now. The third section underlines the methodologies employed, the variables, the method and the sample data used in the present study. The fourth section describes The current issue and full text archive of this journal is available at http://www.emeraldinsight.com/0268-6902.htm [179] Managerial Auditing Journal 17/4 [2002 ] 179±191 # MCB UP Limited [ISSN 0268-6902] [DOI 10.1108/0268690021042432 1] Keywords Financial statements, Fraud, Regression analysis, Greece Abstract This paper examines published data to develop a model for detecting factors associated with false financial statements (FFS). Most false financial statements in Greece can be identified on the basis of the quantity and content of the qualifications in the reports filed by the auditors on the accounts. A sample of a total of 76 firms includes 38 with FFS and 38 non-FFS. Ten financial variables are selected for examination as potential predictors of FFS. Univariate and multivariate statistica l techniques such as logistic regression are used to develop a model to identify factors associated with FFS. The model is accurate in classifying the total sample correctly with accuracy rates exceeding 84 per cent. The results therefore demonstrate that the models function effectively in detecting FFS and could be of assistance to auditors, both internal and external, to taxation and other state authorities and to the banking system.

Welcome message from author
This document is posted to help you gain knowledge. Please leave a comment to let me know what you think about it! Share it to your friends and learn new things together.
Transcript
Detecting false financial statements using publisheddata: some evidence from Greece
Charalambos T. SpathisAristotle University of Thessaloniki, Department of Economics,Division of Business Administration, Thessaloniki, Greece
Introduction
References to false financial statement (FFS)
are increasingly frequent over the last few
years. Falsifying financial statements
primarily consists of manipulating elements
by overstating assets, sales and profit, or
understating liabilities, expenses, or losses.
When a financial statement contains
falsifications so that its elements no longer
represent the true picture, we speak of fraud.
Management fraud can be defined as
`̀ deliberate fraud committed by management
that injures investors and creditors through
misleading financial statements’’ (Eliott and
Willingham, 1980). For Wallace (1995), fraud
is `̀ a scheme designed to deceive; it can be
accomplished with fictitious documents and
representations that support fraudulent
financial statements’’.
The International Federation of
Accountants issued in 1982 the International
Statement of Auditing (ISA) No. 11: Fraud
and Error and explains that the
characteristic which differentiates error
from fraud is intent. Errors result from
unintentional actions (Colbert, 2000). The
American Institute of Certified Public
Accountants (AICPA) (1983) in Statement on
Auditing Standards (SAS) No. 47 notes that
`̀ error refers to unintentional misstatements
or omissions of amounts or disclosures in the
financial statements’’. SAS No. 82 (AICPA,
1997) reiterates the idea that fraud is an
intentional act, and fraud frequently includes
the perpetrator(s) feeling pressure or having
an incentive to commit fraud and also
perceiving an opportunity to do so. Fraud
and white-collar crime has reached epidemic
proportions in the USA. Some estimates
suggest that fraud costs US business more
than $400 billion annually (Wells, 1997).
In Greece, the issue of false financial
statements has lately been brought more into
the limelight in connection primarily with:
the increase in the number of companies
listed on the Athens Stock Exchange and
the raising of capital through public
offering; and
attempts to reduce the level of taxation on
profits.
The year 2000 has been very difficult for the
Greek stock market, which has suffered from
stagnation both in terms of share prices and
liquidity. This fact, along with the recent
pervasive record of false financial
statements, increased the interest of the
authorities, stock market, Ministry of the
Economy and the banking sector in early-
warning systems. In this context, the absence
of a Greek study on the subject is striking.
This paper intends to address this need in the
existing literature. For this purpose,
univariate and multivariate statistical tools
were employed to investigate the usefulness
of publicly available variables for detecting
FFS. A total of ten variables were found to be
possible indicators of FFS. These include the
ratios: debt to equity, sales to total assets, net
profit to sales, accounts receivable to sales,
net profit to total assets, working capital to
total assets, gross profit to total assets,
inventory to sales, total debt to total assets,
and financial distress (Z-score). Using
stepwise logistic regression, two models were
developed with a high probability of
detecting FFS in a sample. The models
include the variables: the inventories to sales
ratio, the ratio of total debt to total assets, the
working capital to total assets ratio, the net
profit to total assets ratio, and financial
distress (Z-score).
The paper is organised as follows: the
second section reviews research on false
financial statements carried out up to now.
The third section underlines the
methodologies employed, the variables, the
method and the sample data used in the
present study. The fourth section describes
The current issue and full text archive of this journal is available at
http://www.emeraldinsight.com/0268-6902.htm
[ 179 ]
Managerial Auditing Journal17/4 [2002] 179±191
# MCB UP Limited[ISSN 0268-6902][DOI 10.1108/0268690021042432 1]
KeywordsFinancia l statements, Fraud,Regression analysis, Greece
AbstractThis paper examines publisheddata to develop a model for
detecting factors associated withfalse financia l statements (FFS).Most false financial statements in
Greece can be identified on thebasis of the quantity and contentof the qualification s in the reports
filed by the auditors on theaccounts. A sample of a total of76 firms includes 38 with FFS and
38 non-FFS. Ten financialvariables are selected forexamination as potential
predictors of FFS. Univariate andmultivariate statistica l techniques
such as logistic regression areused to develop a model to identifyfactors associated with FFS. The
model is accurate in classifyingthe total sample correctly with
accuracy rates exceeding 84 percent. The results thereforedemonstrate that the modelsfunction effectively in detecting
FFS and could be of assistance toauditors, both internal andexternal, to taxation and other
state authorities and to thebanking system.
the empirical results and discussion obtained
using univariate tests and multivariate
logistic regression analysis. Finally, in the
fifth section come the concluding remarks.
Previews research
Characteristics of FFSNo one knows how many business failures
are actually caused by fraud, but undeniably
lots of businesses, especially small firms, go
bankrupt each year due to fraud losses. In the
USA incidences of fraud cut across all
industries with greatest losses apparent
(fraud losses by industry) in real estate
financing, manufacturing, banking, oil and
gas, construction, and in health care (Wells,
1997). Losses can occur in almost any area,
certainly not just in cash areas. Losses in
cash actually represent the lowest level of
fraud. Accounts receivable, expenditures for
services, and inventory losses are each three
times higher than those in cash. Fraud is not
just a problem in large firms. Small
businesses with 1-100 employees are also
susceptible. This is a serious problem
because fraud in a small firm has a greater
impact, as the firm does not have the
resources to absorb the loss (Wells, 1997). In a
global economy and multinational trade, the
trend of international fraud affects all
countries (Vanasco, 1998).
A report by the Committee of Sponsoring
Organizations of the Treadway Commission
(COSO) compiled by Beasley et al. (1999)
examined fraudulent financial reporting
from 1987-1997 by US public companies. Some
of the most critical insights of the study are:
The companies committing fraud
generally were small, and most (78 per
cent of the sample) were not listed in the
New York or American Stock Exchanges.
Incidences of fraud went to the very top of
the organisations concerned. In 72 per
cent of the cases, the CEO appeared to be
associated with the fraud, and in 43 per
cent the CEO was associated with the
financial statement fraud.
The audit committees and boards of the
respective companies appeared to be
weak. Most audit committees rarely met,
and the companies’ boards of directors
were dominated by insiders and others
outsiders `̀ grey’’ directors, with
significant equity ownership and
apparently little experience of serving as
directors of other companies. A total of 25
per cent of the companies did not have an
audit committee.
The founders and board members owned a
significant portion of the companies. In
nearly 40 per cent of the companies,
authorizations for votes by proxy
provided evidence of family relationships
among the directors and/or officers. The
founder and current CEO were the same
person or the original CEO/President was
still in place in nearly half of the
companies.
Severe consequences resulted when
companies commit fraud, including
bankruptcy, significant changes in
ownership, and suspension from trading
in national exchanges.
Most techniques for manipulating profits can
be grouped into three broad categories ±
changing accounting methods, fiddling with
managerial estimates of costs, and shifting
the period when expenses and revenues are
included in results (Worthy, 1984). Other
false statements include manipulating
documents, altering test documents, and
producing false work reports (Comer, 1998).
For example, recording revenue on
shipments after year-end by backdating
shipment documents. Asset
misappropriation schemes include the theft
of company assets e.g. cash and inventory.
The study of Vanasco (1998) examines the
role of professional associations,
governmental agencies, and international
accounting and auditing bodies in
promulgating standards to prevent fraud in
financial statements and other white-collar
crimes. It also examines several fraud cases.
The cases examined show that the cash,
inventory, and related party transactions are
prone to fraud. Auditors assign a high-risk
index to the potential misappropriation of
inventory, cash defalcation, and conflict of
interest. Typical financial statement fraud
techniques involved the overstatement of
revenues and assets (Beasley et al., 1999).
Over half the frauds involved overstating
revenues by recording revenues prematurely
or fictitiously. Many of those revenue frauds
only affected transactions recorded right at
the end of significant financial reporting
periods (i.e. quarter-end or year-end). About
half the frauds also involved overstating
assets by understating allowances for
receivables, overstating the value of
inventory, property, plant and equipment
and other tangible assets, and recording
assets that did not exist.
Fraudulent statements are the most costly
schemes per case. In spite of being the most
common and the smallest loss per case, asset
misappropriation presents in total the largest
losses of the categories. Fraudulent
statements, on the other hand, have the
lowest total losses. Corporate falsification
[ 180]
Charalambos T. SpathisDetecting false financialstatements using publisheddata: some evidence fromGreece
Managerial Auditing Journal17/4 [2002] 179±191
can also be classified as the committed by
insiders for the company (violation of
government regulations, i.e. tax, securities,
safety and environmental laws). Senior
managers might perpetrate financial
statement falsifications to deceive investors
and lenders or to inflate profits and thereby
gain higher salaries and bonuses. Higson
(1999) analysed the results of 13 interviews
with senior auditors/forensic accountants on
whether their clients report suspected fraud
to an external authority. Although some
companies do report it, quite a number seem
reticent about reporting. There appear to be
three contributing factors:
1 the imprecision of the word `̀ fraud’’;
2 the vagueness of directors’
responsibilities; and
3 the confusion over the reason for the
reporting of suspected fraud.
In 1997, the Auditing Standards Board issued
Statement on Auditing Standards (SAS)
No. 82: Consideration of Fraud in a Financial
Statement Audit (AICPA, 1997). This Standard
requires auditors to assess the risk of fraud
on each audit and encourages auditors to
consider both the internal control system and
management’s attitude toward controls,
when making this assessment (Caplan, 1999).
This SAS No. 82, which supersedes SAS
No. 53, clarifies but does not increase
auditors’ responsibilities to detect fraud
(Mancino, 1997). Risk factors `̀ red flags’’ that
relate to fraudulent financial reporting may
be grouped in the following three categories
(SAS No. 82):
1 Management’s characteristics and
influence over the control environment.
These pertain to management’s abilities,
pressures, style, and attitude relating to
internal control and the financial
reporting process. For example, strained
relationships between management and
the current or previous auditor.
2 Industry conditions. These involve the
economic environment in which the
entity operates. For example, a declining
industry with increasing business
failures.
3 Operating characteristics and financial
stability. These pertain to the nature and
complexity of the entity and its
transactions, the entity’s financial
condition, and its profitability. For
example, significant related-party
transactions not in the ordinary course of
business or with related entities not
audited or audited by another firm.
Moreover, similarly to the well-examined
area of bankruptcy prediction, research on
FFS has been minimal. In an important
study, Matsumura and Tucker (1992) discuss
an extensive theoretical foundation of
auditor/manager strategic interaction. This
study investigates the effects of the following
variables:
auditor’s penalty;
auditing standard requirements;
the quality of the internal control
structure; and
audit fee.
The interaction between manager and
auditor is examined with fraud as the focus.
The model encompasses all irregularities,
which it categorises into two types: fraud
(misrepresentation of fact) and defalcations
(misappropriation of assets). For a strategy
with reference to auditing and fraud, Morton
(1993) notes that auditors often use sampling
methods to audit probabilistically and the
probability of auditing is usually contingent
on information about that item. His model
for optional audit policy yields an exact
solution that can generate some useful
comparative statistics. As the audit cost
decreases, the audit region (or extent of the
sample) expands and the amount of
misreporting declines.
Bloomfield (1997) uses behavioural
laboratory experiments, which indicated
amongst other conclusions that auditors
have more trouble assessing fraud risk when
they face high legal liability for audit failure
and the firm they are auditing has strong
internal controls in place. Another study
examines how reliance on a mechanical
decision aid is effected by decision
consequences (Boatsman et al., 1997).
Experimental participants made planning
choices based on available input from actual
management fraud cases before and after
receiving the decision aid’s predictions of
fraud probability. The experiment
documents two types of nonreliance:
1 intentionally shifting the final planning
judgement away from the aid’s prediction
even through this prediction supports the
initial planning judgement; and
2 ignoring the aid when its prediction does
not support the initial planning
judgement.
The study of Bonner et al. (1998) examines
whether certain types of financial reporting
fraud result in a higher likelihood of
litigation against independent auditors and
develops a new taxonomy to document types
of fraud that includes 12 general categories.
They find that auditors are more likely to be
sued when the financial statement frauds are
of types that most commonly occur or when
the frauds arise from fictitious transactions.
Auditors’ sensitivity with respect to clients’
[ 181 ]
Charalambos T. SpathisDetecting false financialstatements using publisheddata: some evidence fromGreece
Managerial Auditing Journal17/4 [2002] 179±191
ethical status and their assessment of the
likelihood of fraud is examined by
Abdolmohammadi and Owhoso (2000). The
results indicate that senior auditors were
sensitive to ethical information, e.g.
regarding clients’ service to the community,
in making their assessment of the likelihood
of fraud, deeming such clients less likely to
have committed fraud.
Detecting FFSStatement of Auditing Standards (SAS) No. 82
(AICPA, 1997) requires auditing firms to
detect management fraud. This increases the
need to detect management fraud effectively.
Detecting management fraud is a difficult
task using normal audit procedures (Porter
and Cameron, 1987; Coderre, 1999). First,
there is a shortage of knowledge concerning
the characteristics of management fraud.
Second, given its infrequency, most auditors
lack the experience necessary to detect it.
Finally, managers are deliberately trying to
deceive the auditors (Fanning and Cogger,
1998). For such managers, who understand
the limitations of an audit, standard auditing
procedures may be insufficient. These
limitations suggest the need for additional
analytical procedures for the effective
detection of management fraud.
` ... Auditors using the expert system exhibited the ability todiscriminate better among situations with varying levels ofmanagement fraud risk and made more consistent decisionsregarding appropriate audit actions.... ’
Recent work has attempted to build models to
predict the presence of management fraud.
Results from logit regression analysis of 75
fraud and 75 no-fraud firms indicate that
no-fraud firms have boards with significantly
higher percentages of outside members than
fraud firms (Beasley, 1996). Hansen et al.
(1996) use a powerful generalized qualitative-
response model to predict management fraud
based on a set of data developed by an
international public accounting firm. The
model includes the probit and logit
techniques. An experiment was conducted to
examine the use of an expert system
developed to enhance the performance of
auditors (Eining et al., 1997). Auditors using
the expert system exhibited the ability to
discriminate better among situations with
varying levels of management fraud risk and
made more consistent decisions regarding
appropriate audit actions. Green and Choi
(1997) presented the development of a neural
network fraud classification model
employing endogenous financial data. A
classification model created from the learned
behaviour pattern is then applied to a test
sample. During the preliminary stage of an
audit, a financial statement classified as
fraudulent signals the auditor to increase
substantive testing during fieldwork.
Fanning and Cogger (1998) use an artificial
neural network (ANN) to develop a model for
detecting management fraud. Using publicly
available predictors of fraudulent financial
statements, they find a model of eight
variables with a high probability of
detection.
Summers and Sweeney (1998) investigate
the relationship between insider trading and
fraud. They find, with the use of a cascaded
logit model, that in the presence of fraud,
insiders reduce their holdings of company
stock through high levels of selling activity
as measured by either the number of
transactions, the number of shares sold, or
the dollar amount of shares sold. Beneish
(1999) investigates the incentives and the
penalties related to earnings overstatements
primarily in firms that are subject to
accounting enforcement actions by the
Securities and Exchange Commission (SEC).
He finds that the managers are likely to sell
their holdings and exercise stock
appreciation rights in the period when
earnings are overstated, and that the sales
occur at inflated prices. The evidence
suggests that the monitoring of managers’
trading behaviour can be informative about
the likelihood of earnings overstatement.
Eilifsen et al. (1999) and Hellman (1999)
analyse the link between the calculation of
taxable income and accounting income
influences on the incentive to manipulate
earnings, as well as the demand for
regulation and verification of both financial
statements and tax accounts. Abbot et al.
(2000) examine and measure the audit
committee independence and activity in
mitigating the likelihood of fraud. Using the
logistic regression analysis they find that
firms with audit committees which are
composed of independent directors and
which meet at least twice per year are less
likely to be sanctioned for fraudulent or
misleading reporting.
Prior work in this field has examined
several variables related to data from audit
work papers and from financial statements,
with various techniques, for their usefulness
in detecting management fraud (Fanning
et al., 1995). In this study, we examine in-
depth publicly available data from firms’
financial statements for detecting FFS.
Greece has entered the new millennium
with a very positive economic picture despite
some underlying structural inflation, and a
[ 182]
Charalambos T. SpathisDetecting false financialstatements using publisheddata: some evidence fromGreece
Managerial Auditing Journal17/4 [2002] 179±191
stable social and political environment. In
June 2000, the leaders of the member states of
the European Union agreed to accept Greece
as a member of the Economic and Currency
Union. Greek enterprises continue to make
progress in profitability and efficiency. The
improvement in capital ratios, the increase
in investment, the significant increase in
profits and the return on capital are just
some of the indicators which make those
involved in Greek industries feel much more
optimistic than they did a few years ago. The
year 2000 has been very difficult for the
Greek Stock Market, which has suffered from
stagnation both in terms of share prices and
liquidity. This fact, along with the recent
pervasive record of false financial
statements, increased the interest of the
authorities, stock market, Ministry of the
Economy and the banking sector in early
warning systems.
In Greece, the issue of falsification of FS
has become of particular significance lately,
and this is due to the following:
Attempts to reduce the level of tax on
profits.
The increase in numbers of firms listed on
the Athens Stock Exchange, the large
increases in capital obtained by listed
companies, the extensive cooperation
achieved through takeovers and mergers
and the attempt by management to meet
the expectations of shareholders.
There is currently a backlog of companies
who are entering the Stock Exchange or
parallel market for the first time. The new
stock market (NEHA) for small and `̀ new
economy’’ enterprises will begin its operation
in 2001, and there is a strong interest in
listing. To avoid instances of false financial
statements being submitted by candidates
and other companies, examination by an
auditor is obligatory. Control by auditors is
also obligatory regarding the use of capital
raised through public floatation. The goal of
this research is to identify financial factors to
be used by auditors in assessing the
likelihood of FFS. The following section
discusses the methodology proposed to detect
FFS.
Methodology
SampleMost FFS in Greece can be identified on the
basis of the quantity and content of the
qualifications in the reports filed by the
auditors on accounts for: depreciation,
forecast payment defaults, forecast staff
severance pay, participation in other
companies, and fiddling of accounts for tax
purposes and other qualifications. The
classification of a financial statement as false
was based on:
the inclusion in the auditors’ reports of
opinions of serious doubt as to the
correctness of accounts;
the observations by the tax authorities
regarding serious taxation
intransigencies which seriously alter the
company’s annual balance sheet and
income statement;
the application of Greek legislation
regarding negative net worth;
inclusion of the company in the Athens
Stock Exchange categories of `̀ under
observation’’ and `̀ negotiation suspended’’
for reasons associated with falsification of
the company’s financial data; and
the existence of court proceedings
pending with respect to FFS or serious
taxation contraventions.
The sample of a total of 76 manufacturing
firms includes 38 with FFS and 38 with non-
FFS (the sample did not include financial
companies). For the non-FFS firms of the
sample, no published indication of FFS
behaviour was uncovered in a search of
databases and the relevant auditors’ reports.
It has to be noted that while the process of
ensuring that none of the considered non-FFS
firms had issued FFS was extensive, it cannot
guarantee that the financial statements in
this group of firms were not falsified. It only
guarantees that there was no publicly
available FFS information in the auditors’
reports and other sources, such as the Stock
Exchange and the Ministry of Finance. Since
this only covers information known to this
date, there is no guarantee that future
information will not prove that members of
the control group issue FFS.
Auditors check all the companies included
in the sample. All public limited companies
(socieÂteÂs anonymes) and limited liability
companies are obliged to submit to an
auditor’s control when they fulfil two of the
three following criteria:
1 total revenues are over 1 billion Greek
Drachmas (GRD) ($2,717 million, £1,852
million);
2 total assets are over 500 million GRD
($1.359 million, £926,000); and
3 the average number of employees is over
50 (Ballas, 1994; Caramanis, 1997).
Some of the characteristics of the full sample
companies are presented in Table I.
There is a statistically significant
difference between average profits of FFS
firms, with losses averaging at 368 million
GRD ($1 million, £680,000), and non-FFS
companies averaging a profit of 895 million
[ 183 ]
Charalambos T. SpathisDetecting false financialstatements using publisheddata: some evidence fromGreece
Managerial Auditing Journal17/4 [2002] 179±191
GRD ($2.432 million, £1.657 million) (t ˆ 2:547,
p < 0:000). Similarly a significant difference
can be observed in average working capital
between FFS firms with 369 million GRD
($1.003 million, £683,000), and non-FFS firms
with 2,281 million GRD ($6.198 million, £4.224
million) (t ˆ 2:457, p < 0:05). Mean equity also
gives a statistically significant difference
between FFS firms and non-FFS firms with
2,474 million GRD ($6.723 million, £4.581
million), and 6,206 million GRD respectively
($16.864 million, £11.492 million) (t ˆ 1:686,
p < 0:010). With regard to inventories,
although mean value for FFS firms is 1,036
million GRD ($2.815 million, £1.918 million),
and 1,859 million GRD ($5.051 million, £3.442
million) for non-FFS firms, the difference is
not statistically significant (t ˆ 1:420,
p < 0:160).
VariablesThe variables in this study come from many
sources. To find variables, prior work on the
topic of FFS was carefully considered. Such
work as that of Green and Choi (1997),
Hoffman (1997), Hollman and Patton (1997),
Zimbelman (1997), Beasley (1996), Bologna et
al. (1996), Arens and Loebbecke (1994), Bell et
al. (1993), Schilit (1993), Davia et al. (1992),
Green (1991), Stice (1991), Loebbecke et al.
(1989), Palmrose (1987), and Albrecht and
Romney (1986) contained suggested
indicators of FFS. Initially, a set of 17
financial ratios was formed. However, to
avoid ratios providing the same information
due to high correlations, it was decided to
exclude highly correlated ratios, while
retaining ratios describing all aspects of
financial performance, including
profitability, solvency/liquidity and
managerial performance (Courtis, 1978).
Except for the correlation analysis, the
statistical significance of the financial ratios
was also considered through t-tests. This
combination of correlation analysis and t-
tests led to the selection of a limited set of ten
financial ratios, which provide meaningful
and non-overlapping information (as much
as possible). The selected ratios for FFS
detection are discussed below.
There is a relationship between a
company’s choice of accounting valuation
methods and type of depreciation with FFS.
Managers involved in fraudulent activities
may attempt to disguise their actions
through accounting choices. By selecting
different valuation methods, management
can increase or decrease stated values for
various variables (Dhaliwal et al., 1982). It is
an open question whether a high debt
structure is associated with FFS (Persons,
1995). A high debt structure may increase the
likelihood of FFS since it shifts the risk from
equity owners and managers to debt owners.
Research suggests that the potential for
wealth transfer from debt holders to
managers increases as leverage increases
(Chow and Rice, 1982). Management may
manipulate financial statements, given the
need to meet certain debt covenants. This
suggests that higher levels of debt may
increase the probability of FFS. This is
measured through the difference in the ratio
of debt to equity (DEBT/EQ) and total debt to
total assets (TD/TA).
There are certain financial statements that
are more likely to be manipulated by
management. These variables include sales,
accounts receivable, allowance for doubtful
accounts and inventory (Shilit, 1993; Green,
1991; Loebbecke et al., 1989; Wright and
Ashton, 1989). The subjective nature of the
judgements involved with these accounts
makes them more difficult to audit. Persons
(1995), Schilit (1993), Stice (1991), Green (1991)
and Feroz et al. (1991) suggest that
management may manipulate accounts
receivable. The fraudulent activity of
recording sales before they are earned may
show as additional account receivable. We
tested this by considering the ratio of account
receivable to sales (REC/SAL) (Fanning and
Cogger, 1998; Green, 1991; Daroca and Holder,
1985). Accounts receivable and inventory
depend on the subjective judgement involved
in estimating uncollected accounts and
obsolete inventory. Because subjective
judgement is involved in determining the
value of these accounts, management may
use these accounts as tools for financial
statement manipulation (Summers and
Sweeney, 1998). Loebbecke et al. (1989) found
that the inventory account and accounts
receivable were involved in 22 per cent and
14 per cent, respectively, of frauds in their
sample.
Table ICharacteristics (means) of firms’ means andt-tests
Characteristics Non-false False t-test
Total assets 10,551 7,315 1.063Inventories 1,859 1,036 1.420Working capital 2,281 369 2.457**Equity 6,206 2,474 1.686*Sales 9,195 3,966 2.059**Net profit 895 ±368 2.547***
Notes:The amounts are reporting in million GRDt-test: df = 74, (two-tailed)* Significance at 10% level** Significance at 5% level,*** Significance at 1% level
[ 184]
Charalambos T. SpathisDetecting false financialstatements using publisheddata: some evidence fromGreece
Managerial Auditing Journal17/4 [2002] 179±191
Many researchers such as Vanasco (1998),
Persons (1995), Schilit (1993) and Stice (1991)
also suggest that management may
manipulate inventories. The company may
not match sales with the corresponding cost
of goods sold, thus increasing gross margin,
net income and strengthening the balance
sheet. Another type of manipulation
involves reporting inventory at lower than
cost or market value. The company may
choose not to record the right amount of
obsolete inventory. Consequently, the ratio
of inventory to sales is considered (INV/
SAL). Another issue examined in this
research is whether higher or lower gross
margins are related to the issuing of FFS.
For this purpose, the ratio of gross profit to
total assets is used (GP/TA).
The profitability orientation is tempered
by the manager’s own utility maximization,
defined (partially) by job security.
Following this definition, the achievement
of stable or increasing earnings streams
maximizes the manager’s utility. This
approach is based on the expectation that
management will be able to maintain or
improve past levels of profitability,
regardless of what those levels were
(Summers and Sweeney, 1998). If this
expectation is not met by actual
performance, then it provides a
motivation for financial statement
falsification.
Loebbecke et al. (1989) found that profit
relative to industry was inadequate for 35 per
cent of companies with fraud in their sample.
In this research some other financial
statement red flag variables are examined,
such as the sales to total assets ratio (SAL/
TA), net profit to sales (NP/SAL), net profit to
total assets (NP/TA), working capital to total
assets (WC/TA), for their ability to predict
FFS. The sales to total assets ratio was a
significant predictor in prior research
(Persons, 1995).
Financial distress may be a motivation
for FFS (Bell et al., 1993; Stice, 1991;
Loebbecke et al., 1989; Kreutzfeldt and
Wallace, 1986). When the company is doing
poorly there is greater motivation to engage
in FFS. The results in Hamer (1983) suggest
that most models predict bankruptcy with
similar ability. Poor financial condition
(Bell et al., 1993; Loebbecke et al., 1989) may
motivate unethical insiders to take actions
intended to improve the appearance of the
company’s financial position, perhaps to
reduce the threat of loss of employment, or
to garner as many resources as possible
before termination. In addition to
motivating the commission of fraud, poor
financial condition may indicate a weak
control environment, a condition that
allows the perpetration of a fraud (AICPA,
1997). Loebbecke et al. (1989) found that 19
per cent of the fraud companies in their
sample were experiencing solvency
problems.
Therefore, we use the Altman (1968, 1983) Z-
score as a control variable to investigate the
association of FFS and financial distress. The
use of the Z-score is accompanied by some
limitations, as was its use 30 years ago to
develop a corporate failure prediction model
for the US manufacturing sector. It is
nevertheless still used today in many studies
(Summers and Sweeney, 1998). With regards
to Greek companies, despite the fact that a
number of researchers have looked at
bankruptcy, a generally accepted model has
not been established (Theodosiou, 1991;
Vranas, 1992; Negakis, 1995; Dimitras et al.,
1995). We measure this variable through the
difference in the Z-score in model (2) outlined
below as a control variable for differences in
financial condition between FFS and non-
FFS firms.
MethodThe statistical method selected was logistic
regression analysis (DeMaris, 1992;
Mendenhall and Sincish, 1993; Menard,
1995). The following logit model was
estimated using financial ratios from the
firms to see which of the ratios were related
to FFS. By including the data set of FFS and
non-FFS we may find out what factors
significantly influence the firms with FFS.
We therefore formulated the following
equation:
E…y† ˆ exp…bo ‡ b1x1 ‡ b2x2 ‡ . . . ‡ bkxk†1 ‡ exp…bo ‡ b1x1 ‡ b2x2 ‡ . . . ‡ bkxk†
Where
y ˆ 1 if FFS firm occurs
y ˆ 0 if non-FFS firm occurs
E…y† ˆ p (FFS firms occurs) ˆQ
Qˆ denotes the probability that
y ˆ 1
bo ˆ the intercept term
b1; b2; . . . ; bk ˆ the regression coefficients of
independent variables
x1; x2; . . . ; xk ˆ the independent variables
The models are presented as:
FFS ˆbo ‡ b1…DET=EQ† ‡ b2…SAL=TA†‡ b3…NP=SAL† ‡ b4…REC=SAL†‡ b5…NP=TA† ‡ b6…WC=TA†‡ b7…GP=TA† ‡ b8…INV=SAL†‡ b9…TD=TA† ‡ e
…1†
Where FFS ˆ 1 if FFS discovered group, 0
otherwise.
[ 185 ]
Charalambos T. SpathisDetecting false financialstatements using publisheddata: some evidence fromGreece
Managerial Auditing Journal17/4 [2002] 179±191
FFS ˆbo ‡ b1…DEBT=EQ† ‡ b2…SAL=TA†‡ b3…NP=SAL† ‡ b4…REC=SAL†‡ b5…NP=TA† ‡ b6…WC=TA†‡ b7…GP=TA† ‡ b8…INV=SAL†‡ b9…TD=TA† ‡ b10…Z† ‡ e
…2†
For model (2) the variable Z was added into
the above model (1).
The Z-score (Altman, 1968, 1983) was used
to investigate the association of FFS and
financial distress:
Z ˆ1:2 …working capital=total assets†‡ 1:4 …retained earnings=total assets†‡ 3:3 …earnings before interest and taxes=
total assets†‡ 0:06 …market value of equity=
book value of total debt†‡ 1:0 …sales=total assets†:
The models will classify firms into FFS and
non-FFS categories based upon financial
statement ratios that have been documented
as diagnostic in prior studies.
Results and discussion
Table II reports the mean values, standard
deviation and t-tests of ratios for non-FFS and
FFS firms. The univariate tests suggest
several variables may by helpful in detecting
FFS. The large differences in average values
of ratios between FFS and non-FFS firms and
the high statistical significance (p < 0:000)
indicate that the above ratios may indeed be
related to FFS. The ratios NP/TA, WC/TA,
GP/TA, TD/TA and Z score are statistically
significant. The very low values for NP/TA
and NP/SAL for the FFS firms compared to
the corresponding ones for non-FFS indicate
that the companies facing difficulties of low
returns in relation to assets and sales try to
manipulate the financial statements either
by increasing revenue or by reducing
expenditure so as to improve the profit and
loss account. The same holds for the GP/TA
ratio where FFS companies show on average
half the gross profit of that of non-FFS firms
with respect to total assets. The ratio WC/TA
shows that FFS firms have a very low WC
and present liquidity problems such that
they cannot meet their obligations. Low WC
is associated with financial distress
according to the bibliography (Bonner et al.,
1998).
FFS firms seem to have on average both a
higher TD/TA and DEBT/EQ. The higher
debt to equity, the lower sales to total assets
and the Z-score values for the FFS firms may
indicate that many firms issuing FFS were in
financial distress (Fanning and Cogger, 1998;
Summers and Sweeney, 1998). This could
provide the motivation for management
fraud. The ability to manipulate the values in
accounts receivable (REC/SAL) was clearly
reflected in the results (t ˆ ¡1:356, p < 0:179).
This is a very difficult area due to the
subjective nature of estimating accounts
receivable. These results suggest that
additional time is necessary for auditing
accounts receivable. The INV/SAL indicated
that those firms with FFS keep high
inventories and cost of goods sold.
The univariate tests provide valuable
information regarding a large number of
variables over a sample. While some of the
suggested variables were not statistically
significant in this study, the results should
be viewed cautiously. This study examined
these variables at the aggregate level on one
sample and generalizations to specific cases
should be made with care. Every instance of
falsification of financial statements is an
individual case and the variables not
significant in the aggregate may still be
useful indicators for a particular case.
Consequently the aim was to develop a model
with variables which auditors can find
useful. While several of these were good
predictors in this study, they lacked the
ability to transfer to other samples. Ratios
allow better generalization and are easily
derived from published financial statements,
Table IITests for the differences in the means of each group
Mean Std dev. Sig.(two-tailed)Variables Non-false False Non-false False t-test
DEBT/EQ 1.075 2.705 0.937 3.351 ±2.750 0.007SAL/TA 1.055 0.699 0.576 0.416 3.087 0.003NP/SAL 0.067 ±0.459 0.159 2.434 1.329 0.188REC/SAL 0.456 1.755 0.349 5.897 ±1.356 0.179NP/TA 0.074 ±0.021 0.064 0.095 5.110 0.000WC/TA 0.252 0.054 0.205 0.238 3.892 0.000GP/TA 0.274 0.144 0.140 0.121 4.333 0.000INV/SAL 0.179 0.359 0.158 0.656 ±1.643 0.105TD/TA 0.437 0.629 0.196 0.242 ±3.783 0.000Z 1.990 0.778 0.730 0.936 6.292 0.000
Notes:DEBT/EQ: debt/equitySAL/TA: sales/total assetsNP/SAL: net profit/salesREC/SAL: receivable/salesNP/TA: net profit/total assetsWC/TA: working capital/total assetsGP/TA gross profit/total assetsINV/TA: inventories/total assetsTD/TA: total debt/total assetsZ: Z-score
[ 186]
Charalambos T. SpathisDetecting false financialstatements using publisheddata: some evidence fromGreece
Managerial Auditing Journal17/4 [2002] 179±191
and they have been used in the model
development.
There were ten possible variables in this
study with the results of the univariate tests.
The next step in securing a model was the
application of multivariate testing with
stepwise logistic regression. The univariate
results were informative but there was the
question of whether the association was a
direct association or whether there was a
joint correlation with a third variable. A
univariate test does not allow detection of
interaction effects which multivariate tests
may find. This study used model (1) with nine
variables (without Z scores) and model (2)
with ten variables, Z score included.
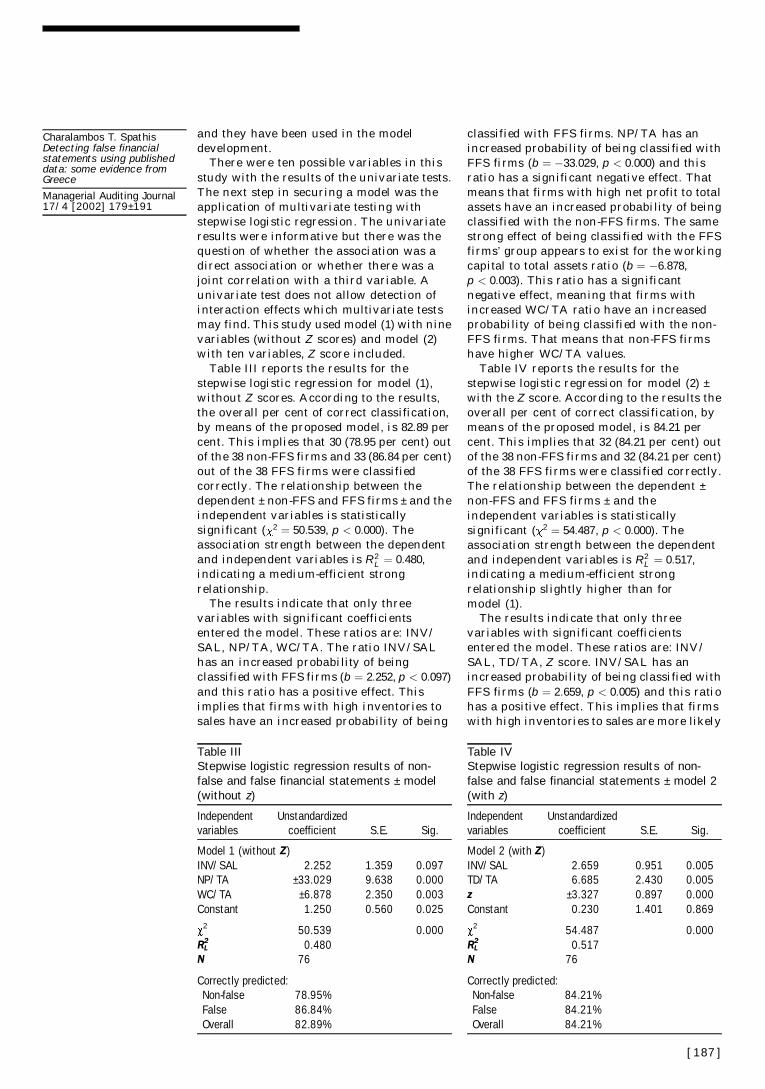
Table III reports the results for the
stepwise logistic regression for model (1),
without Z scores. According to the results,
the overall per cent of correct classification,
by means of the proposed model, is 82.89 per
cent. This implies that 30 (78.95 per cent) out
of the 38 non-FFS firms and 33 (86.84 per cent)
out of the 38 FFS firms were classified
correctly. The relationship between the
dependent ± non-FFS and FFS firms ± and the
independent variables is statistically
significant ( 2 ˆ 50:539, p < 0:000). The
association strength between the dependent
and independent variables is R2L ˆ 0:480,
indicating a medium-efficient strong
relationship.
The results indicate that only three
variables with significant coefficients
entered the model. These ratios are: INV/
SAL, NP/TA, WC/TA. The ratio INV/SAL
has an increased probability of being
classified with FFS firms (b ˆ 2:252, p < 0:097)
and this ratio has a positive effect. This
implies that firms with high inventories to
sales have an increased probability of being
classified with FFS firms. NP/TA has an
increased probability of being classified with
FFS firms (b ˆ ¡33:029, p < 0:000) and this
ratio has a significant negative effect. That
means that firms with high net profit to total
assets have an increased probability of being
classified with the non-FFS firms. The same
strong effect of being classified with the FFS
firms’ group appears to exist for the working
capital to total assets ratio (b ˆ ¡6:878,
p < 0:003). This ratio has a significant
negative effect, meaning that firms with
increased WC/TA ratio have an increased
probability of being classified with the non-
FFS firms. That means that non-FFS firms
have higher WC/TA values.
Table IV reports the results for the
stepwise logistic regression for model (2) ±
with the Z score. According to the results the
overall per cent of correct classification, by
means of the proposed model, is 84.21 per
cent. This implies that 32 (84.21 per cent) out
of the 38 non-FFS firms and 32 (84.21 per cent)
of the 38 FFS firms were classified correctly.
The relationship between the dependent ±
non-FFS and FFS firms ± and the
independent variables is statistically
significant ( 2 ˆ 54:487, p < 0:000). The
association strength between the dependent
and independent variables is R2L ˆ 0:517,
indicating a medium-efficient strong
relationship slightly higher than for
model (1).
The results indicate that only three
variables with significant coefficients
entered the model. These ratios are: INV/
SAL, TD/TA, Z score. INV/SAL has an
increased probability of being classified with
FFS firms (b ˆ 2:659, p < 0:005) and this ratio
has a positive effect. This implies that firms
with high inventories to sales are more likely
Table IIIStepwise logistic regression results of non-false and false financial statements ± model(without z)
Independentvariables
Unstandardizedcoefficient S.E. Sig.
Model 1 (without Z)INV/SAL 2.252 1.359 0.097NP/TA ±33.029 9.638 0.000WC/TA ±6.878 2.350 0.003Constant 1.250 0.560 0.025
2 50.539 0.000RL
2 0.480N 76
Correctly predicted:Non-false 78.95%False 86.84%Overall 82.89%
Table IVStepwise logistic regression results of non-false and false financial statements ± model 2(with z)
Independentvariables
Unstandardizedcoefficient S.E. Sig.
Model 2 (with Z)INV/SAL 2.659 0.951 0.005TD/TA 6.685 2.430 0.005z ±3.327 0.897 0.000Constant 0.230 1.401 0.869
2 54.487 0.000RL
2 0.517N 76
Correctly predicted:Non-false 84.21%False 84.21%Overall 84.21%
[ 187 ]
Charalambos T. SpathisDetecting false financialstatements using publisheddata: some evidence fromGreece
Managerial Auditing Journal17/4 [2002] 179±191
to be classified as FFS. The ratio TD/TA has
an increased probability of being classified
with FFS firms (b ˆ 6:685, p < 0:005) and this
ratio has a significant positive effect. That
means that firms with high total debt to total
assets values have an increased probability
of being classified with the FFS group. The
same strong effect of being classified with
FFS firms appears to be attributed to the Z
score (b ˆ ¡3:327, p < 0:000). This ratio has a
significant negative effect, meaning that
firms with increased Z score values have
increased probability of being classified with
the non-FFS firms. That means that non-FFS
firms have higher Z scores.
In both models, the ratio indicated as an
important variable is INV/SAL,
demonstrating that FFS firms keep higher
stocks, indicating a lower stock turnover
with respect to sales. The coefficients of
WC/TA, NP/TA, and Z score have negative
signs. This is consistent with the hypothesis
that an improvement in the liquidity
position of a firm, an improvement in the
profitability of the firm, or an improvement
in the Z score of the firm will have a negative
effect on the probability of FFS.
` ... The analysis shows that higher TD/TA may indicate that manyfirms issuing FFS were in financial distress . . . This could providethe motivation for management fraud ... ’
The coefficient of the debt ratio TD/TA and
INV/SAL ratio has a positive sign, which
conforms to the hypothesis that more
leverage and large inventories make the firm
more vulnerable to FFS. The analysis shows
that higher TD/TA may indicate that many
firms issuing FFS were in financial distress
(Persons, 1995; Fanning and Cogger, 1998;
Summers and Sweeney, 1998). This could
provide the motivation for management
fraud. On the other hand, the identification of
INV/SAL as a crucial factor agrees with the
results of previous studies in this field. The
inventory is likely to be manipulated by
management (Loebbecke et al., 1989; Schilit,
1993; Summers and Sweeney, 1998). SAS
No. 47, Audit Risk and Materiality in
Conducting and Audit (AICPA, 1983) states
that any account that requires subjective
judgement in determining its value increases
audit risk. Inventory is noted as such an
account due to the subjective judgement
involved in estimating obsolete inventory. A
further examination indicates that firms
with FFS were less profitable (lower NP/TA)
since they get less profit for the same total
assets. This result agrees with the existing
research (Loebbecke et al., 1989; Summers
and Sweeney, 1998; Beasley et al., 1999).
Concluding remarks
The primary objective of this study has been
the development of a reliable false financial
statement detection model for Greek firms. In
order to achieve this goal we used a sample of
FFS and non-FFS firms. We used univariate
and multivariate statistical techniques such
as logistic regression to develop a model to
identify factors associated with FFS. A total
of ten financial ratios are selected for
examination as potential predictors of FFS.
These variables appeared to be important in
prior research and constitute ratios derived
from published financial statements. The
variables selected by the above techniques as
possible indicators of FFS are: the
inventories to sales ratio, the ratio of total
debt to total assets, the working capital to
total assets ratio, the net profit to total assets
ratio, and financial distress (Z-score). Both
models are accurate in classifying the total
sample correctly with accuracy rates
exceeding 84 per cent. The results of these
models suggest there is potential in detecting
FFS through analysis of publicly available
financial statements. In general the
indicators selected are associated with FFS
firms. Companies with high inventories with
respect to sales, high debt to total assets, low
net profit to total assets, low working capital
to total assets and low Z scores are more
likely to falsify financial statements
according to the results of the stepwise
logistic regression.
Alternative methods for FFS detection can
be used, such as discriminant analysis,
adaptive logit networks, neural networks and
multicriteria analysis. There were several
publicly available variables that remain for
future study. These variables include
standing within industries and long-term
trends. Industry standing probably would
provide additional valuable information in
the growth and financial distress variables. A
further possibility would be to examine
variables other than those in financial
statements, such as the number of members
of the board of directors, the rate of turnover
of the financial manager, the type of auditor
used and the frequency with which they are
changed, auditors’ opinions, the size of the
company, the existence of company
branches, inventory evaluation methods,
depreciation methods. This study did not use
a holdout sample to validate the model that is
presented. Further research with larger
[ 188]
Charalambos T. SpathisDetecting false financialstatements using publisheddata: some evidence fromGreece
Managerial Auditing Journal17/4 [2002] 179±191
samples will be necessary to validate these
results.
The results are encouraging in that we
have developed a reliable model for assessing
the likelihood of false financial statements of
businesses in Greece. The use of the proposed
methodological framework could be of
assistance to auditors, both internal and
external, to taxation and other state
authorities, individual and institutional
investors, stock exchanges, law firms,
economic analysts, credit scoring agencies
and to the banking system. For the auditing
profession, moving to address its
responsibility to detect FFS, the results of
this study should be beneficial. The auditors
can provide this model as effective expert
witness testimony and computer litigation
support regarding FFS at a low cost to
auditor and client. The auditors with suitable
software will be able to apply it to scan
financial statements posted on Internet Web
sites and analyse the differences between
trends of the company’s reports. It also
identifies `̀ red flags’’ that substantially differ
from the norms of the industry. Therefore,
the present study contributes to auditing and
accounting research by examining the
suggested variables to identify those that can
best discriminate cases of FFS. This study
suggests certain variables from publicly
available information to which auditors
should be allocating additional audit time.
With more improved statistical techniques
and a greater number of variables it is
possible to develop a more powerful
analytical tool for the detection of FFS.
ReferencesAbbot, J.L., Park, Y. and Parker, S. (2000), `̀ The
effects of audit committee activity and
independence on corporate fraud’’,
Managerial Finance, Vol. 26 No. 11, pp. 55-67.
Abdolmohammadi, J.M. and Owhoso, D.V. (2000),
`̀ Auditors’ ethical sensitivity and the
assessment of the likelihood of fraud’’,
Managerial Finance, Vol. 26 No. 11, pp. 21-32.
Albrecht, S. and Romney, M. (1986), `̀ Red-flagging
management: a validation’’, Advances in
Accounting, Vol. 3, pp. 323-33.
Altman, E. (1968), `̀ Financial ratios, discriminant
analysis, and the prediction of corporate
bankruptcy’’, Journal of Finance, September,
pp. 589-609.
Altman, E. (1983), Corporate Financial Distress: A
Complete Guide to Predicting, Avoiding, and
Dealing with Bankruptcy, John Wiley,
New York, NY.
AICPA (1983), Auditing Risk and Materiality in
Conducting an Audit, Statement on Auditing
Standards No. 47, American Institute of
Certified Public Accountants, New York, NY.
AICPA (1997), Consideration of Fraud in a
Financial Statement Audit, Statement on
Auditing Standards No. 82, American
Institute of Certified Public Accountants,
New York, NY.
Arens, A. and Loebbecke, J. (1994), Auditing: An
Integrated Approach, 6th ed., Prentice-Hall,
Englewood Cliffs, NJ.
Ballas, A. (1994), `̀ Accounting in Greece’’, The
European Accounting Review, Vol. 3 No. 1,
pp. 107-21.
Beasley, M. (1996), `̀ An empirical analysis of the
relation between board of director
composition and financial statement fraud’’,
The Accounting Review, Vol. 71 No. 4,
pp. 443-66.
Beasley, S.M., Carcello, J.V. and Hermanson, D.R.
(1999), Fraudulent Financial Reporting: 1987-
1997: An Analysis of US Public Companies,
Research Report, COSO.
Bell, T., Szykowny, S. and Willingham, J. (1993),
`̀ Assessing the likelihood of fraudulent
financial reporting: a cascaded logic
approach’’, Working Paper, KPMG Peat
Marwick, Montvale, NJ.
Beneish, M.D. (1999), `̀ Incentives and penalties
related to earnings overstatements that
violate GAAP’’, The Accounting Review,
Vol. 74 No. 4, pp. 425-57.
Bloomfield, R.I. (1997), `̀ Strategic dependence and
the assessment of fraud risk: a laboratory
study’’, The Accounting Review, Vol. 72 No. 4,
pp. 517-38.
Boatsman, J.R., Moeckel, C. and Pei, B.K.W.
(1997), `̀ The effects of decision consequences
on auditors’ reliance on decision aids in audit
planning’’, Organizational Behavior and
Human Decision Processes, Vol. 71 No. 2,
pp. 211-47.
Bologna, G., Lindquist, R. and Wells, J. (1996), The
Accountant’s Handbook of Fraud and
Commercial Crime, John Wiley,
New York, NY.
Bonner, S.E., Palmrose, Z.V. and Young, S.M.
(1998), `̀ Fraud type and auditor litigation. An
analysis of SEC accounting and auditing
enforcement releases’’, The Accounting
Review, Vol. 73 No. 4, pp. 503-32.
Caplan, D. (1999), `̀ Internal controls and the
detection of management fraud’’, Journal of
Accounting Research, Vol. 37 No. 1, pp. 101-17.
Caramanis, V.C. (1997), `̀ The enigma of the Greek
auditing profession: some preliminary results
concerning the impact of liberalization on
auditor behavior’’, The European Accounting
Review, Vol. 6 No. 1, pp. 85-108.
Chow, C. and Rice, S. (1982), `̀ Qualified audit
opinions and share prices: an investigation’’,
Auditing: A Journal of Practice and Theory,
Vol. 1, pp. 35-53.
Coderre, G.D. (1999), Fraud Detection. Using Data
Analysis Techniques to Detect Fraud, Global
Audit Publications, Vancover.
[ 189 ]
Charalambos T. SpathisDetecting false financialstatements using publisheddata: some evidence fromGreece
Managerial Auditing Journal17/4 [2002] 179±191
Colbert, L.J. (2000), `̀ International and US
standards: error and fraud’’, Managerial
Auditing Journal, Vol. 15 No. 3, pp. 97-107.
Comer, J.M. (1998), Corporate Fraud, 3rd ed.,
Gower Publishing, Aldershot.
Courtis, J.K. (1978), `̀ Modelling a financial ratios
categoric framework’’, Journal of Business
Finance and Accounting, Vol. 5 No. 4,
pp. 371-86.
Daroca, F. and Holder, W. (1985), `̀ The use of
analytical procedures in renew and audit
engagements’’, Auditing: A Journal of Practice
and Theory, Vol. 4, pp. 80-92.
Davia, H., Coggins, P., Wideman, J. and
Kastantin, J. (1992), Management
Accountant’s Guide to Fraud Discovery and
Control, John Wiley, New York, NY.
DeMaris, A. (1992), Logit Modeling, Sage
University Paper Series on Quantitative
Applications in the Social Sciences, CA.
Dhaliwal, D., Salamon, G. and Smith, E. (1982),
`̀ The effect of owner versus management
control on the choice of accounting methods’’,
Journal of Accounting and Economics, Vol. 4,
pp. 41-53.
Dimitras, A.I., Zopounidis, C. and Hurson, Ch.
(1995), `̀ A multicriteria decision aid method
for the assessment of business failure risk’’,
Foundations of Computing and Decision
Sciences, Vol. 20 No. 2, pp. 99-112.
Eilifsen, A., Knivsfla, K.H. and Soettem, F. (1999),
`̀ Earnings manipulation: cost of capital
versus tax’’, The European Accounting
Review, Vol. 8 No. 3, pp. 481-91.
Eining, M.M., Jones, D.R. and Loebbecke, J.K.
(1997), `̀ Reliance on decision aids: an
examination of auditors’ assessment of
management fraud’’, Auditing: A Journal of
Practice and Theory, Vol. 16 No. 2, pp. 1-19.
Elliot, R. and Willingham, J. (1980), Management
Fraud: Detection and Deterrence, Petrocelli,
New York, NY.
Fanning, M.K. and Cogger, K.O. (1998), `̀ Neural
detection of management fraud using
published financial data’’, International
Journal of Intelligent Systems in Accounting,
Finance and Management, Vol. 7 No. 1,
pp. 21-41.
Fanning, K., Cogger, K. and Srivastava, R. (1995),
`̀ Detection of management fraud: a neural
network approach’’, International Journal of
Intelligent Systems in Accounting, Finance
and Management, Vol. 4 No. 2, pp. 113-26.
Feroz, E., Park, K. and Pastens, V. (1991), `̀ The
financial and market effects of the SEC’s
accounting and auditing enforcement’s
releases’’, Journal of Accounting Research,
Vol. 29, pp. 107-42.
Green, B. (1991), `̀ Identifying management
irregularities through preliminary analytical
procedures’’, unpublished doctoral
dissertation, Kent State University, Kent, OH.
Green, B.P. and Choi, J.H. (1997), `̀ Assessing the
risk of management fraud through neural-
network technology’’, Auditing: A Journal of
Practice and Theory, Vol. 16 No. 1, pp. 14-28.
Hamer, M. (1983), `̀ Failure prediction: sensitivity
of classification accuracy to alternative
statistical methods and variable sets’’,
Journal of Accounting and Public Policy,
Vol. 2 No. 4, pp. 289-307.
Hansen, J.V., McDonald, J.B., Messier, W.F. and
Bell, T.B. (1996), `̀ A generalized qualitative-
response model and the analysis of
management fraud’’, Management Science,
Vol. 42 No. 7, pp. 1022-32.
Hellman, N. (1999), ``Earnings manipulation: cost
of capital versus tax. A commentary’’, The
European Accounting Review, Vol. 8 No. 3,
pp. 493-7.
Higson, A. (1999), `̀ Why is management reticent to
report fraud? An exploratory study’’, 22nd
Annual Congress of European Accounting
Association, Bordeaux.
Hoffman, V.B. (1997), `̀ Discussion of the effects of
SAS No. 82 on auditors attention to fraud risk-
factors and audit planning decisions’’,
Journal of Accounting Research, Vol. 35 No. 5,
pp. 99-104.
Hollman, V.P. and Patton, J.M. (1997),
`̀ Accountability, the dilution effect and
conservatism in auditors fraud judgments’’,
Journal of Accounting Research, Vol. 35 No. 2,
pp. 227-37.
International Federation of Accountants (1982),
Fraud and Error, International Statements on
Auditing (ISA) No. 11.
Kreutzfeldt, R. and Wallace, W. (1986), `̀ Error
characteristics in audit populations: their
profile and relationship to environment
factors’’, Auditing: A Journal of Practice and
Theory, Vol. 6, pp. 20-43.
Loebbecke, J., Eining, M. and Willingham, J.
(1989), `̀ Auditor’s experience with material
irregularities: frequency, nature, and
detectability’’, Auditing: A Journal of Practice
and Theory, Vol. 9, pp. 1-28.
Mancino, J. (1997), `̀ The auditor and fraud’’,
Journal of Accountancy, April, pp. 32-6.
Matsumura, E. and Tucker, R.R. (1992), `̀ Fraud
detection ± a theoretical foundation’’, The
Accounting Review, Vol. 67 No. 4, pp. 753-82.
Menard, S. (1995), Applied Logistic Regression
Analysis, Sage University Papers, Series on
Quantitative Applications in the Social
Sciences, Thousand Oaks, CA.
Mendenhall, W. and Sincish, T. (1993), A Second
Course in Business Statistics: Regression
Analysis, 4th ed., Macmillan, New York, NY.
Morton, S. (1993), `̀ Strategic auditing for fraud’’,
The Accounting Review, Vol. 68 No. 4,
pp. 825-39.
Negakis, C. (1995), `̀ Robustness of Greece
business failure prediction models’’,
International Review of Economics and
Business, Vol. 42 No. 3, pp. 203-15.
Palmrose, Z. (1987), `̀ Litigation and independent
auditors: the role of business failures and
[ 190]
Charalambos T. SpathisDetecting false financialstatements using publisheddata: some evidence fromGreece
Managerial Auditing Journal17/4 [2002] 179±191
management fraud’’, Auditing: A Journal of
Practice and Theory, Vol. 6 No. 2, pp. 90-102.
Persons, O. (1995), `̀ Using financial statement
data to identify factors associated with
fraudulent financing reporting’’, Journal of
Applied Business Research, Vol. 11 No. 3,
pp. 38-46.
Porter, B. and Cameron, A. (1987), `̀ Company
fraud ± what price the auditor?’’, Accountant’s
Journal, December, pp. 44-7.
Schilit, H. (1993), Financial Shenanigans: How to
Detect Accounting Gimmicks and Fraud in
Financial Reports, McGraw-Hill,
New York, NY.
Stice, J. (1991), `̀ Using financial and market
information to identify pre-engagement
market factors associated with lawsuits
against auditors’’, The Accounting Review,
Vol. 66 No. 3, pp. 516-33.
Summers, S.L. and Sweeney, J.T. (1998),
`̀ Fraudulently misstated financial statements
and insider trading: an empirical analysis’’,
The Accounting Review, Vol. 73 No. 1,
pp. 131-46.
Theodosiou, P. (1991), `̀ Alternative models for
assessing the financial condition of business
in Greece’’, Journal of Business Finance and
Accounting, Vol. 18 No. 5, pp. 697-720.
Vanasco, R. R. (1998), `̀ Fraud auditing’’,
Managerial Auditing Journal, Vol. 13 No. 1,
pp. 4-71.
Vranas, A.S. (1992), `̀ The significance of financial
characteristics in predicting business failure:
an analysis in the Greek context’’,
Foundations of Computing and Decision
Sciences, Vol. 17 No. 4, pp. 257-75.
Wallace, W.A. (1995), Auditing, South-Western
College Publishing, Cincinnati, OH.
Wells, J.T. (1997), Occupational Fraud and Abuse,
Obsidian Publishing, Austin, TX.
Worthy, F.S. (1984), `̀ Manipulating profits: how
it’s done?’’, Fortune, Vol. 25, pp. 50-4.
Wright, A. and Ashton, R. (1989), `̀ Identifying
audit adjustments with attention-direction
procedures’’, The Accounting Review, Vol. 64
No. 4, pp. 79-83.
Zimbelman, M.F. (1997), `̀ The effects of SAS No. 82
on auditors attention to fraud risk-factors and
audit planning decisions’’, Journal of
Accounting Research, Vol. 35 No. 5, pp. 75-9.
Early versions of this paperwere presented at the 23rdCongress of the EuropeanAccounting Association heldin Munich, Germany 29-31March, 2000) and at the9th Annual Meeting of theEuropean FinancialManagement Associationheld in Athens, Greece28 June1 July, 2000). The
author wishes to thank theparticipants for constructivecomments and criticismsthat resulted in significantimprovements in thepresent version.
[ 191 ]
Charalambos T. SpathisDetecting false financialstatements using publisheddata: some evidence fromGreece
Managerial Auditing Journal17/4 [2002] 179±191
Related Documents


![v P ] v X } u [Digital Electronics for IBPS IT-Officer 2014] Input Output A B C False False False False True False True False False True True True Symbol for And gate: Also C= A.B](https://static.cupdf.com/doc/110x72/5aad019c7f8b9aa9488db79d/v-p-v-x-u-digital-electronics-for-ibps-it-officer-2014-input-output-a-b-c.jpg)


![Detecting Carbon Monoxide Poisoning Detecting Carbon ...2].pdf · Detecting Carbon Monoxide Poisoning Detecting Carbon Monoxide Poisoning. Detecting Carbon Monoxide Poisoning C arbon](https://static.cupdf.com/doc/110x72/5f551747b859172cd56bb119/detecting-carbon-monoxide-poisoning-detecting-carbon-2pdf-detecting-carbon.jpg)