Detecting Drug Effects in the Brain Heather Turner, Phil Brain and Foteini Strimenopoulou Nonclinical Statistics Pfizer, UK 18 August 2011

Detecting Drug Effects in the Brain
Jul 14, 2015
Welcome message from author
This document is posted to help you gain knowledge. Please leave a comment to let me know what you think about it! Share it to your friends and learn new things together.
Transcript

Detecting Drug Effects in the Brain
Heather Turner, Phil Brain and Foteini Strimenopoulou
Nonclinical StatisticsPfizer, UK
18 August 2011

Background
Aim: identify and characterise effect of drug on the brain
• Drug effect over timeI PK/PD model
• EEG experimentsI electrical activity in the brain
• Generalised Semi-linear Canonical Correlation Analysis(GSLCCA)

EEG
• Electrodes placed on scalp
• Monitor difference in voltage between baseline electrodeand others
• Produces virtually continuous signal

EEG Data
• EEG signal converted via FFT to power spectraI ”amount” of each frequency for each time sliceI multivariate response over time
FFT−−→
0 5 10 15 20 25 30 35
0.00
000
0.00
010
0.00
020
0.00
030
Examples of frequency periodograms
Frequency (Hz)
Pow
er (
µV2 )
●
● ● ●
●
●
●
●
● ● ●●
●
●
●●
●● ● ● ● ● ● ● ● ● ● ● ● ● ● ● ● ● ● ●
●
●
●
● ●
●●
●●
●
●● ● ● ● ● ● ● ● ● ● ● ● ● ● ● ● ● ● ● ● ● ● ● ● ●
0−5 minutes120−125 minutes

PK/PD
• AssumptionsI drug level in brain follows pharmacokinetics model (PK)I brain response proportional to dose level (PD)
• Expected response over time follows PK model, e.g.
Double Exponential
β(exp(−k1t)− exp(−k2t))
Critical Exponentialβtexp(−k1t)

PK Models
0 10000 20000 30000 40000
−0.
20.
00.
10.
20.
30.
4
Time
Res
pons
e
Double ExponentialCritical Exponential

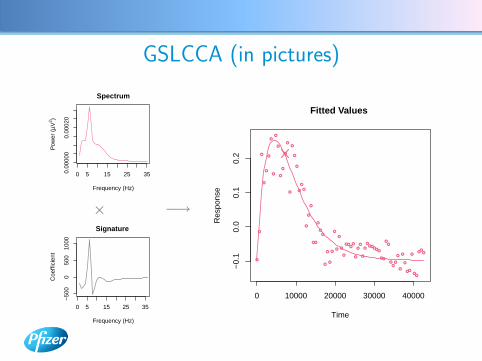
GSLCCA (in pictures)
0 5 15 25 350.00
000
0.00
020
Spectrum
Frequency (Hz)
Pow
er (
µV2 )
×
0 5 15 25 35
−50
00
500
1000
Frequency (Hz)
Coe
ffici
ent
Signature
−→
0 10000 20000 30000 40000
−0.
10.
00.
10.
2
Time
Res
pons
e
"Observed" Value
GSLCCA (in pictures)
0 5 15 25 350.00
000
0.00
020
Spectrum
Frequency (Hz)
Pow
er (
µV2 )
×
0 5 15 25 35
−50
00
500
1000
Frequency (Hz)
Coe
ffici
ent
Signature
−→
●
●
●
●
●
●
●
●
●
●
●
●
●
●
●
●
●
●
●
●
●
●
●
●
●●
●
●
●
●
●
●
●
●
●
●
●
●
●●●
●
●
●
●
●
●
●●●
●●●
●●
●●
●●
●
●
●
●
●
●●
●
●●
●●
●
0 10000 20000 30000 40000
−0.
10.
00.
10.
2
Time
Res
pons
e
Fitted Values

GSLCCA Method
• Canonical Correlation Analysis (CCA)I For matrices Y and X, finds loadings a and b to
maximisecor(Y a,Xb)
• Semi-linearI Y is the matrix of power spectraI X = X(t, θ) defined by PK model
• GeneralisedI linear coefficients b or nonlinear parameters θ may
depend on treatment factor

gslcca Package
• gslcca functionI specify PK model by name/formulaI specify which parameters vary by treatmentI control over data smoothingI partial CCA option
• plot, print, summary

Clonidine Experiment
• 4 treatmentsI ControlI Low doseI Medium doseI High dose
• 8 rats in 4-period cross-over design
• EEG data recorded for 12 hours post-dose

GSLCCA Analysis
Call:
gslcca(Y = spectra, formula = "Critical Exponential", time = Time,
subject = Rat, treatment = Treatment, separate = TRUE, ref = 1,
data = design, subject.smooth = 4)
GSLCCA based on 8 subjects
Data smoothed at subject level using 4 roots
Nonlinear parameters:
subject 35 subject 36 subject 37 subject 38
K1 Low Dose 7.5576 8.4252 7.8778 9.9125
K1 Middle Dose 7.8786 8.5137 8.0901 8.8885
K1 High Dose 8.9017 9.3213 9.0159 9.1980
subject 39 subject 40 subject 41 subject 42
K1 Low Dose 8.7217 8.0102 8.7103 8.1199
K1 Middle Dose 8.8546 8.5952 9.1854 8.3800
K1 High Dose 9.0439 9.1611 9.3047 8.9933

Fitted Modelplot(result, "fitted")

Observed + Fittedplot(result, "scores")

Signaturesplot(result, "signatures")
0 5 10 15 20 25 30 35
−50
00
500
Frequency (Hz)
Coe
ffici
ent
Signatures Corresponding to Different Subjects
Subject 35Subject 36Subject 37Subject 38Subject 39Subject 40Subject 41Subject 42

Normalised Signatures
0 5 10 15 20 25 30 35
−0.
4−
0.2
0.0
0.2
0.4
0.6
Frequency (Hz)
Coe
ffici
ent
Signatures Corresponding to Different Subjects
Subject 35Subject 36Subject 37Subject 38Subject 39Subject 40Subject 41Subject 42

Mean Signature
0 5 10 15 20 25 30 35
−0.
20.
00.
20.
40.
6
Frequency (Hz)
Coe
ffici
ent
Mean Signature
• contribution of powerat each frequency toPK curve over time
• assumed to be specificto the target drug isaimed at

Control/Inactive Signature
0 5 10 15 20 25 30 35
−0.
20.
00.
20.
40.
6
Frequency
Coe
ffici
ent
• if drug inactive, anydose ≡ control
• inactive drug has samesignature as control

Control/Inactive Signature
0 5 10 15 20 25 30 35
−0.
20.
00.
20.
40.
6
Frequency
Coe
ffici
ent
clonidinevehicle
• In this case drug clearlydifferent from control
• Drug is active - asexpected!

Comparing Active Drugs
0 20 40 60 80
−10
0−
500
5010
015
020
0
Frequency
Coe
ffici
ent
Drug ADrug B
• Two drugs targetingsame ion channel,different receptors
• Run t-tests to compareloadings at eachfrequency

Snapshot Analysis
0 20 40 60 80
0.0
0.5
1.0
1.5
2.0
2.5
3.0
Frequency
−lo
g 10(p
)
deltathetaalphabetagamma • P-values adjusted using
FDR
• Frequencies split intoconventional bands

Summary
gslcca package is in development on R-Forgehttps://r-forge.r-project.org/projects/gslcca/
Further work needed before release to CRAN, e.g.
• fitting PK/PD model to all rats simultaneously
• adjusting for control response
Related Documents