Abstract—This paper proposes a new semi-supervised defect detection scheme for solving the problem of automated defect detection for textile fabrics. In the development of the scheme, Gabor wavelet network (GWN) is deployed as the major technique to extract texture features from textile fabrics. An optimal Gabor filter is then designed on the basis of the features extracted. The proposed defect detection scheme consists of one real-valued optimal Gabor filter and one smoothing filter. The performance of the scheme is evaluated by using an offline test database with 78 homogeneous fabric images. The test results exhibit accurate defect detection with low false alarm, thus showing the effectiveness and robustness of the proposed scheme. The performance of the proposed scheme is further evaluated by conducting real time tests using a prototyped automated defect detection system. The experimental results obtained clearly demonstrate that the proposed scheme is indeed an effective and efficient means for detecting defects in textile fabrics. Keywords—Defect detection, filtering, Gabor function, Gabor wavelet networks, textile fabrics. I. INTRODUCTION N the textile industry, inspection is needed to assure the fabric quality before any shipments are sent to customers, because defects in fabrics can reduce the price of a product by 45% to 65% [1]. Currently, the quality assurance of web processing is mainly carried out by manual inspection. However, the reliability of manual inspection is limited by ensuing fatigue and inattentiveness. Indeed, only about 70% of defects can be detected by the most highly trained inspectors [2]. Furthermore, textile industries are facing increasing pressure to be more efficient and competitive by reducing costs. Therefore, automated detection of defects in textile fabrics, which results in high-quality products and high-speed production is definitely needed. Inspection is the process of determining whether a product (also referred to as a part, object, or item) has deviated from a given set of specifications [3-7]. In the past 30 years, attempts have been made to apply different techniques of machine vision to solve automated inspection problems [8]. The application of such techniques to inspect textured materials, including textile Manuscript received July 13, 2006. This work was supported by the Research Grants Council of the Hong Kong Special Administrative Region under Grant HKU7382/02E. Prof. K.L. Mak and Mr. P. Peng are with the Department of Industrial and Manufacturing Systems Engineering, The University of Hong Kong, Hong Kong. (phone: +852-2859-2582; fax: +852-2858-6535; e-mails: [email protected]). fabrics, paper, wood, steel slabs etc., is challenging and has received wide attention because of the following reasons [3, 9, 10]: (1) 100% inspection can be conducted; (2) automated inspection is a more consistent process when compared with manual inspection; (3) automated inspection is a non-contact inspection, thus avoiding problems that arise as a result of using some contact inspection devices [11]; (4) automated inspection can usually result in lower labor costs, improved quality, faster inspection and increased reliability; (5) information such as defect samples and defect types can be obtained easily and instantly for off-line training or statistical analysis. Automated inspection of plain fabrics has attracted a lot of attention in recent years. Wang et al. [12] reported that 90% of the defects in a plain fabric could be detected simply by thresholding. Researchers had also begun to study the automated inspection of more complicated fabrics, including twill and denim fabrics [13-15]. Numerous approaches were proposed to address the problem of detecting defects in woven fabrics, including statistical, spectral and model based approaches. Spectral approaches were the most successful detection approaches for woven fabrics, which included Fourier transform, wavelet transform, Gabor analysis, etc. In view of the high degree of periodicity for textile fabrics, Fourier transform based approaches were developed for defect detection by some researchers [16-19]. However, since the kernel function of Fourier transform is of infinite length, the contribution from each of the spectral components is difficult to quantify. Therefore, Fourier analysis is not suitable for detecting local fabric defects. In order to overcome this problem, the wavelet transform was used instead [2, 20-23]. Sim et al. [20] transformed the 2-D image into two 1-D data to reduce the amount of data that need processing, thus increasing the inspection speed significantly. Since a Gabor filter has an optimal localization in both the spatial domain and the spatial-frequency domain, it has been widely used in the field of defect detection. Escofet et al. [13] applied a set of multi-scale and multi-orientation Gabor filters to inspect fabric defects. Kumar and Pang [14] used a set of filters, which were derived from the real parts of Gabor functions from sixteen different channels in four orientations, to detected fabric defects. They also studied supervised and unsupervised fabric Detecting Defects in Textile Fabrics with Optimal Gabor Filters K. L. Mak, and P. Peng I International Journal of Computer Science Volume 1 Number 4 274

Welcome message from author
This document is posted to help you gain knowledge. Please leave a comment to let me know what you think about it! Share it to your friends and learn new things together.
Transcript
Abstract—This paper proposes a new semi-supervised defect
detection scheme for solving the problem of automated defect detection for textile fabrics. In the development of the scheme, Gabor wavelet network (GWN) is deployed as the major technique to extract texture features from textile fabrics. An optimal Gabor filter is then designed on the basis of the features extracted. The proposed defect detection scheme consists of one real-valued optimal Gabor filter and one smoothing filter. The performance of the scheme is evaluated by using an offline test database with 78 homogeneous fabric images. The test results exhibit accurate defect detection with low false alarm, thus showing the effectiveness and robustness of the proposed scheme. The performance of the proposed scheme is further evaluated by conducting real time tests using a prototyped automated defect detection system. The experimental results obtained clearly demonstrate that the proposed scheme is indeed an effective and efficient means for detecting defects in textile fabrics.
Keywords—Defect detection, filtering, Gabor function, Gabor
wavelet networks, textile fabrics.
I. INTRODUCTION N the textile industry, inspection is needed to assure the fabric quality before any shipments are sent to customers,
because defects in fabrics can reduce the price of a product by 45% to 65% [1]. Currently, the quality assurance of web processing is mainly carried out by manual inspection. However, the reliability of manual inspection is limited by ensuing fatigue and inattentiveness. Indeed, only about 70% of defects can be detected by the most highly trained inspectors [2]. Furthermore, textile industries are facing increasing pressure to be more efficient and competitive by reducing costs. Therefore, automated detection of defects in textile fabrics, which results in high-quality products and high-speed production is definitely needed.
Inspection is the process of determining whether a product (also referred to as a part, object, or item) has deviated from a given set of specifications [3-7]. In the past 30 years, attempts have been made to apply different techniques of machine vision to solve automated inspection problems [8]. The application of such techniques to inspect textured materials, including textile
Manuscript received July 13, 2006. This work was supported by the
Research Grants Council of the Hong Kong Special Administrative Region under Grant HKU7382/02E.
Prof. K.L. Mak and Mr. P. Peng are with the Department of Industrial and Manufacturing Systems Engineering, The University of Hong Kong, Hong Kong. (phone: +852-2859-2582; fax: +852-2858-6535; e-mails: [email protected]).
fabrics, paper, wood, steel slabs etc., is challenging and has received wide attention because of the following reasons [3, 9, 10]:
(1) 100% inspection can be conducted; (2) automated inspection is a more consistent process when
compared with manual inspection; (3) automated inspection is a non-contact inspection, thus
avoiding problems that arise as a result of using some contact inspection devices [11];
(4) automated inspection can usually result in lower labor costs, improved quality, faster inspection and increased reliability;
(5) information such as defect samples and defect types can be obtained easily and instantly for off-line training or statistical analysis.
Automated inspection of plain fabrics has attracted a lot of
attention in recent years. Wang et al. [12] reported that 90% of the defects in a plain fabric could be detected simply by thresholding. Researchers had also begun to study the automated inspection of more complicated fabrics, including twill and denim fabrics [13-15]. Numerous approaches were proposed to address the problem of detecting defects in woven fabrics, including statistical, spectral and model based approaches. Spectral approaches were the most successful detection approaches for woven fabrics, which included Fourier transform, wavelet transform, Gabor analysis, etc.
In view of the high degree of periodicity for textile fabrics, Fourier transform based approaches were developed for defect detection by some researchers [16-19]. However, since the kernel function of Fourier transform is of infinite length, the contribution from each of the spectral components is difficult to quantify. Therefore, Fourier analysis is not suitable for detecting local fabric defects. In order to overcome this problem, the wavelet transform was used instead [2, 20-23]. Sim et al. [20] transformed the 2-D image into two 1-D data to reduce the amount of data that need processing, thus increasing the inspection speed significantly. Since a Gabor filter has an optimal localization in both the spatial domain and the spatial-frequency domain, it has been widely used in the field of defect detection. Escofet et al. [13] applied a set of multi-scale and multi-orientation Gabor filters to inspect fabric defects. Kumar and Pang [14] used a set of filters, which were derived from the real parts of Gabor functions from sixteen different channels in four orientations, to detected fabric defects. They also studied supervised and unsupervised fabric
Detecting Defects in Textile Fabrics with Optimal Gabor Filters
K. L. Mak, and P. Peng
I
International Journal of Computer Science Volume 1 Number 4
274
detection algorithms based on Gabor functions [15]. Bodnarova et al. [24] proposed a set of optimal 2-D Gabor filters, which were designed on the basis of the Fisher cost function, to discriminate defective texture pixels from non-defective texture pixels. In general, detection methods using Gabor functions can be classified into two categories. One category is to use a filter bank [13, 14, 15] and the other category is to use optimal filters [15, 24]. Filtering with a filter bank can generate excessive data for processing although a set of filters usually enhances the performance of the segmentation process. The quality of classification and recognition can be affected significantly [25] and the amount of computation time needed is usually large. However, optimal filters which are usually problem specific can ameliorate the effects of such disadvantages [26]. In an optimal filter, the filter parameters are tuned to match a particular texture background. Therefore, fewer filters are needed and less computational time is required for filtering.
Although optimal filters have some obvious advantages over other methods, the selection of their parameters is crucial and difficult. This paper presents an effective method to solve the filter parameter selection problem in the case of fabric defects detection. In this method, a Gabor wavelet network (GWN) is used to extract texture features, which can provide some priori knowledge for the design of an optimal 2-D Gabor filter. It can be shown that the optimal Gabor filter constructed in this way forms the major component of an effective scheme to solve the problem of real-time automated defect detection for textile fabrics.
The remaining sections of the paper are organized as follows: Section 2 gives a brief description about Gabor functions. In section 3, Gabor wavelet network is introduced. In section 4, a Gabor filter based detection scheme is described in detail. Section 5 tests and evaluates the performance of the proposed scheme both offline and online. Finally, the conclusions from this work are summarized in section 6.
II. GABOR FUNCTIONS A 2-D Gabor function is a non-orthogonal complex-valued
wavelet. In general, it can be represented as a Gaussian function modulated by a complex sinusoidal signal, and a number of Gabor functions can constitute a complete basis set, i.e., a frame, if appropriate values are assigned to their parameters. The general impulse response of a Gabor function can be defined as follows:
( )
( )
22' '1
2
,
1 exp 2 '2
x y
x y
xx y
g x y
j xeσ σ
πωπσ σ
⎡ ⎤⎛ ⎞⎛ ⎞⎢ ⎥⎜ ⎟+⎜ ⎟⎜ ⎟ ⎜ ⎟⎢ ⎥⎝ ⎠ ⎝ ⎠⎢ ⎥⎣ ⎦
−
= (1)
and
' cos sin' sin cos
x xy y
θ θθ θ
−⎡ ⎤ ⎡ ⎤ ⎡ ⎤=⎢ ⎥ ⎢ ⎥ ⎢ ⎥
⎣ ⎦ ⎣ ⎦ ⎣ ⎦ (2)
where ( , )x yσ σ refers to the radial frequency bandwidths, θ
denotes the orientation, xω refers to the central frequency and ( ', ')x y are the rotated ( , )x y coordinates. The corresponding Fourier transform of (1) is given by
2 2
1( , ) exp2
x
u v
u vG u vω
σ σ
⎧ ⎫⎡ ⎤⎛ ⎞ ⎛ ⎞−⎪ ⎪⎢ ⎥= − +⎜ ⎟ ⎜ ⎟⎨ ⎬⎢ ⎥⎝ ⎠ ⎝ ⎠⎪ ⎪⎣ ⎦⎩ ⎭
, (3)
where ( )1/ 2u xσ πσ= and ( )1/ 2v yσ πσ= . In the
spatial-frequency domain, a Gabor wavelet function can act as a bandpass filter. In order to filter a given image IM , a Gabor mask needs to be created by sampling the Gabor function at the corresponding discrete points, and then the mask is used to be convoluted with the studied image.
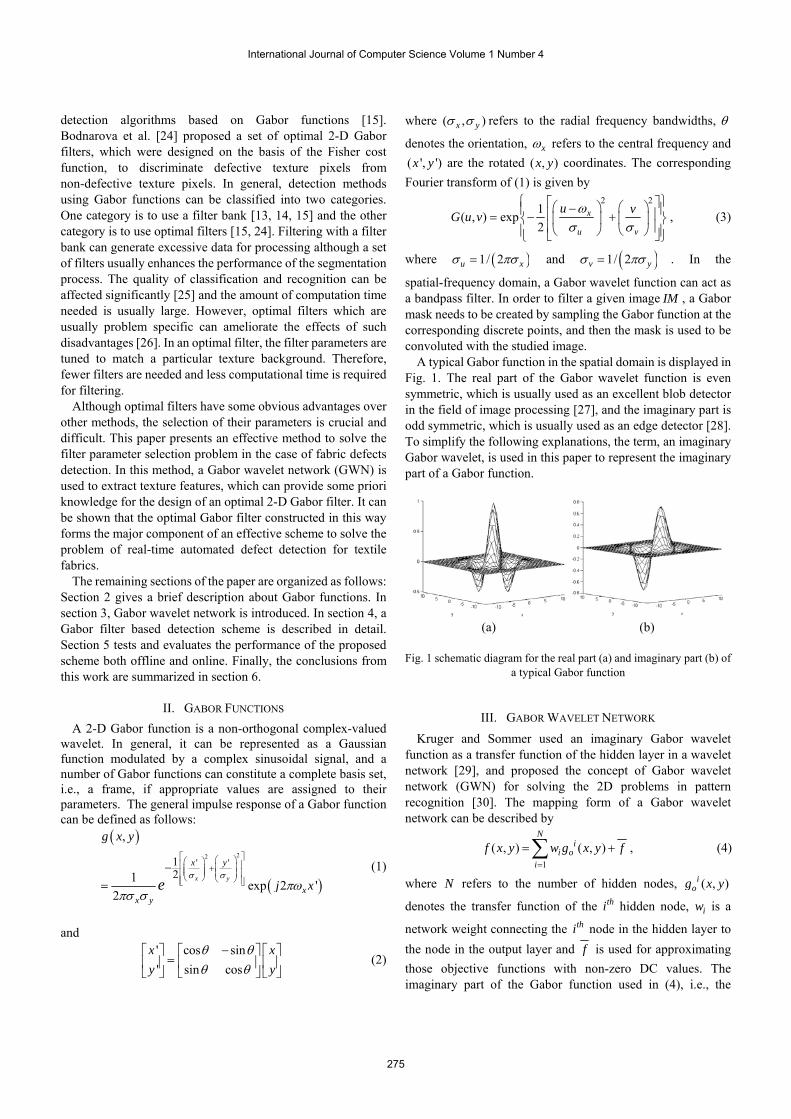
A typical Gabor function in the spatial domain is displayed in Fig. 1. The real part of the Gabor wavelet function is even symmetric, which is usually used as an excellent blob detector in the field of image processing [27], and the imaginary part is odd symmetric, which is usually used as an edge detector [28]. To simplify the following explanations, the term, an imaginary Gabor wavelet, is used in this paper to represent the imaginary part of a Gabor function.
(a) (b)
Fig. 1 schematic diagram for the real part (a) and imaginary part (b) of
a typical Gabor function
III. GABOR WAVELET NETWORK Kruger and Sommer used an imaginary Gabor wavelet
function as a transfer function of the hidden layer in a wavelet network [29], and proposed the concept of Gabor wavelet network (GWN) for solving the 2D problems in pattern recognition [30]. The mapping form of a Gabor wavelet network can be described by
1
( , ) ( , )N
ii o
i
f x y w g x y f=
= +∑ , (4)
where N refers to the number of hidden nodes, ( , )iog x y
denotes the transfer function of the thi hidden node, iw is a
network weight connecting the thi node in the hidden layer to the node in the output layer and f is used for approximating those objective functions with non-zero DC values. The imaginary part of the Gabor function used in (4), i.e., the
International Journal of Computer Science Volume 1 Number 4
275
transfer function of the thi node in the hidden layer, can thus be expressed as
( )( )
( )( )
2
2
2
2
( ) cos ( )sin, exp
2
( )sin ( )cos
2
sin 2 ( )cos ( )sin
i i i ix yi
oi
x
i i i ix y
iy
i i i i ix x y
x t y tg x y
x t y t
x t y t
θ θ
σ
θ θ
σ
πω θ θ
⎧ ⎡ ⎤− − −⎪ ⎣ ⎦= −⎨⎪⎩
⎫⎡ ⎤− + − ⎪⎣ ⎦− ⎬⎪⎭
⎡ ⎤× − − −⎣ ⎦
, (5)
where ixt and i
yt are the translation parameters of the thi
Gabor wavelet, and the other parameters are the same as those of the Gabor wavelets defined in (1). In this network, [ ]x y refers to the network input vector, which is the position of a pixel in a studied image IM , and the output is the corresponding grey level of the pixel assuming that IM is the objective function of the network. Fig.2 depicts the overall architecture of a Gabor wavelet network. It can easily be seen that each Gabor wavelet in a GWN involves six parameters, i.e.,
{ }, , , , , ,i i i i i ix y x y x it t wθ σ σ ω , which should be determined by the
network learning process. For each transfer function, the parameters include the translation parameters, the orientation, the radial frequency bandwidths, the centre frequency, and the corresponding weight. The objective function of the network learning process (the network optimization) is defined as
2
2
min i ii
E IM w g= −∑ . (6)
In this paper, the optimization technique called the Levenberg-Marquardt algorithm is used to conduct the network learning process. Detailed description on the application of the technique in a GWN can be found in [32].
The above discussions clearly indicate that a GWN is a combination of a feed forward neural network and the Gabor wavelet decomposition. The technique has been successfully applied in various studies in the field of pattern recognition [31-34], and the results show that it is an effective task-specific feature extractor.
IV. OPTIMAL GABOR FILTER DESIGN This section proposes a methodology to design an optimal
Gabor filter for detecting fabric defects based on a GWN. Based on this optimal filter, a semi-supervised defect detection scheme is constructed for textile fabrics. Indeed, the defect detection problem consists of two parts, namely, supervised training and unsupervised defect detection. In the first part, a non-defective fabric image is used as the template for training the GWN in order to develop the optimal Gabor filter and to develop the scheme. In the second part, the optimal Gabor filter and a smoothing filter are used to detect defects on fabric images with the same texture background as the template image, which can be either defective or non-defective.
x
y
tx¹,ty¹ бx¹,бy¹θ¹
+
tx²,ty²
txⁿ,tyⁿ
бx²,бy²θ²
бxⁿ,бyⁿθⁿ
• • •
f(x,y)
dc(f)
w¹
w²
wⁿ
ω¹
ω²
ωⁿ
gⁿ
g²
g¹
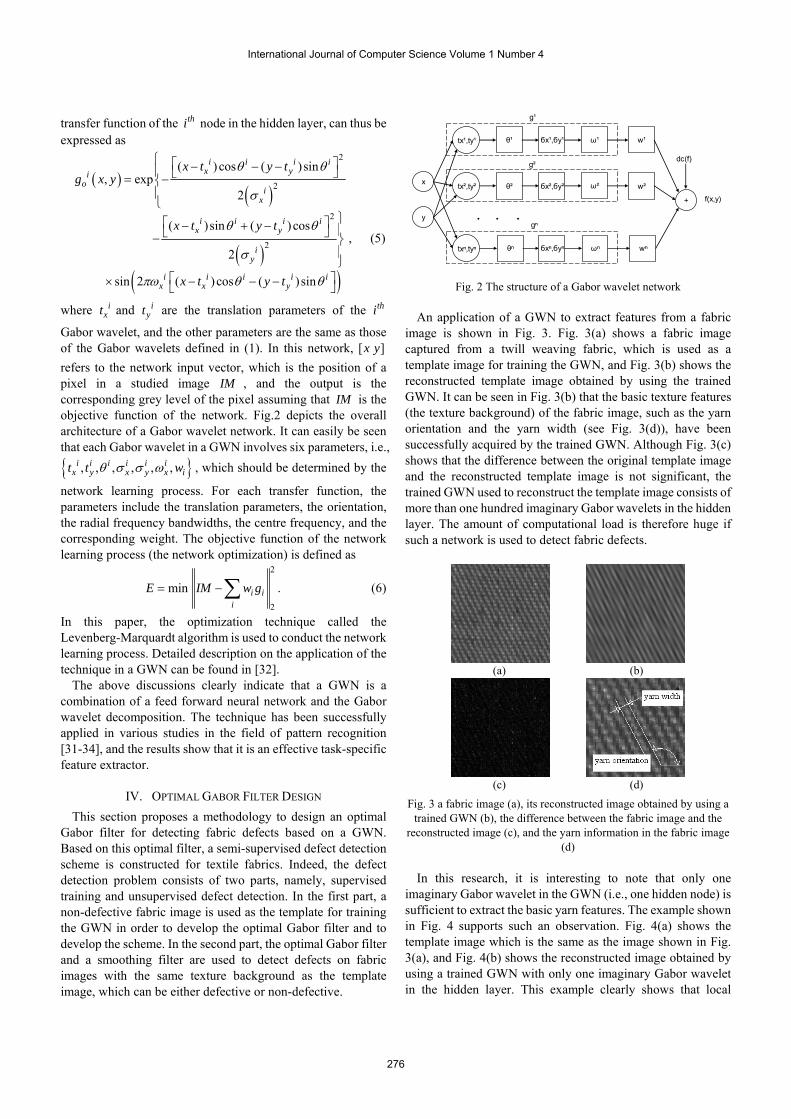
Fig. 2 The structure of a Gabor wavelet network
An application of a GWN to extract features from a fabric image is shown in Fig. 3. Fig. 3(a) shows a fabric image captured from a twill weaving fabric, which is used as a template image for training the GWN, and Fig. 3(b) shows the reconstructed template image obtained by using the trained GWN. It can be seen in Fig. 3(b) that the basic texture features (the texture background) of the fabric image, such as the yarn orientation and the yarn width (see Fig. 3(d)), have been successfully acquired by the trained GWN. Although Fig. 3(c) shows that the difference between the original template image and the reconstructed template image is not significant, the trained GWN used to reconstruct the template image consists of more than one hundred imaginary Gabor wavelets in the hidden layer. The amount of computational load is therefore huge if such a network is used to detect fabric defects.
(a) (b)
(c) (d)
Fig. 3 a fabric image (a), its reconstructed image obtained by using a trained GWN (b), the difference between the fabric image and the
reconstructed image (c), and the yarn information in the fabric image (d)
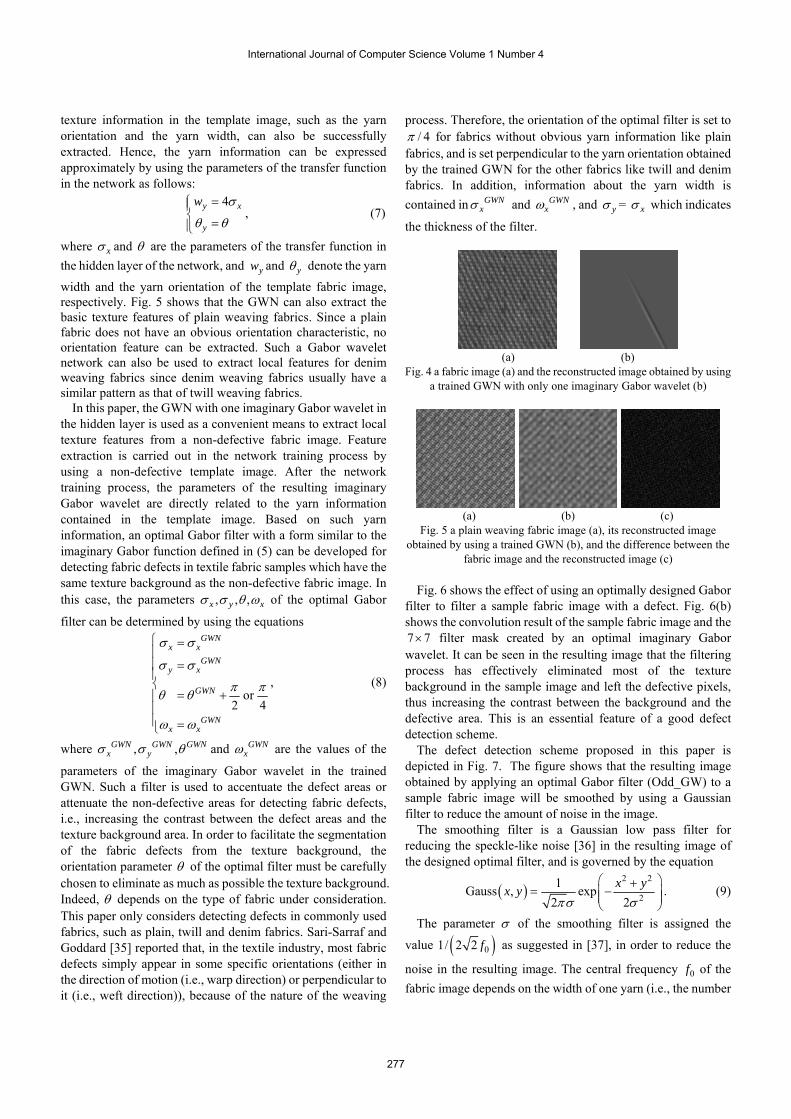
In this research, it is interesting to note that only one
imaginary Gabor wavelet in the GWN (i.e., one hidden node) is sufficient to extract the basic yarn features. The example shown in Fig. 4 supports such an observation. Fig. 4(a) shows the template image which is the same as the image shown in Fig. 3(a), and Fig. 4(b) shows the reconstructed image obtained by using a trained GWN with only one imaginary Gabor wavelet in the hidden layer. This example clearly shows that local
International Journal of Computer Science Volume 1 Number 4
276
texture information in the template image, such as the yarn orientation and the yarn width, can also be successfully extracted. Hence, the yarn information can be expressed approximately by using the parameters of the transfer function in the network as follows:
4y x
y
w σ
θ θ
=⎧⎪⎨ =⎪⎩
, (7)
where xσ and θ are the parameters of the transfer function in the hidden layer of the network, and yw and yθ denote the yarn width and the yarn orientation of the template fabric image, respectively. Fig. 5 shows that the GWN can also extract the basic texture features of plain weaving fabrics. Since a plain fabric does not have an obvious orientation characteristic, no orientation feature can be extracted. Such a Gabor wavelet network can also be used to extract local features for denim weaving fabrics since denim weaving fabrics usually have a similar pattern as that of twill weaving fabrics.
In this paper, the GWN with one imaginary Gabor wavelet in the hidden layer is used as a convenient means to extract local texture features from a non-defective fabric image. Feature extraction is carried out in the network training process by using a non-defective template image. After the network training process, the parameters of the resulting imaginary Gabor wavelet are directly related to the yarn information contained in the template image. Based on such yarn information, an optimal Gabor filter with a form similar to the imaginary Gabor function defined in (5) can be developed for detecting fabric defects in textile fabric samples which have the same texture background as the non-defective fabric image. In this case, the parameters , , ,x y xσ σ θ ω of the optimal Gabor
filter can be determined by using the equations
or
2 4
GWNx x
GWNy x
GWN
GWNx x
σ σ
σ σ
π πθ θ
ω ω
⎧ =⎪⎪ =⎪⎨
= +⎪⎪⎪ =⎩
, (8)
where , ,GWN GWN GWNx yσ σ θ and GWN
xω are the values of the
parameters of the imaginary Gabor wavelet in the trained GWN. Such a filter is used to accentuate the defect areas or attenuate the non-defective areas for detecting fabric defects, i.e., increasing the contrast between the defect areas and the texture background area. In order to facilitate the segmentation of the fabric defects from the texture background, the orientation parameter θ of the optimal filter must be carefully chosen to eliminate as much as possible the texture background. Indeed, θ depends on the type of fabric under consideration. This paper only considers detecting defects in commonly used fabrics, such as plain, twill and denim fabrics. Sari-Sarraf and Goddard [35] reported that, in the textile industry, most fabric defects simply appear in some specific orientations (either in the direction of motion (i.e., warp direction) or perpendicular to it (i.e., weft direction)), because of the nature of the weaving
process. Therefore, the orientation of the optimal filter is set to / 4π for fabrics without obvious yarn information like plain
fabrics, and is set perpendicular to the yarn orientation obtained by the trained GWN for the other fabrics like twill and denim fabrics. In addition, information about the yarn width is contained in GWN
xσ and GWNxω , and yσ = xσ which indicates
the thickness of the filter.
(a) (b)
Fig. 4 a fabric image (a) and the reconstructed image obtained by using a trained GWN with only one imaginary Gabor wavelet (b)
(a) (b) (c)
Fig. 5 a plain weaving fabric image (a), its reconstructed image obtained by using a trained GWN (b), and the difference between the
fabric image and the reconstructed image (c)
Fig. 6 shows the effect of using an optimally designed Gabor filter to filter a sample fabric image with a defect. Fig. 6(b) shows the convolution result of the sample fabric image and the 7 7× filter mask created by an optimal imaginary Gabor wavelet. It can be seen in the resulting image that the filtering process has effectively eliminated most of the texture background in the sample image and left the defective pixels, thus increasing the contrast between the background and the defective area. This is an essential feature of a good defect detection scheme.
The defect detection scheme proposed in this paper is depicted in Fig. 7. The figure shows that the resulting image obtained by applying an optimal Gabor filter (Odd_GW) to a sample fabric image will be smoothed by using a Gaussian filter to reduce the amount of noise in the image.
The smoothing filter is a Gaussian low pass filter for reducing the speckle-like noise [36] in the resulting image of the designed optimal filter, and is governed by the equation
( )2 2
21Gauss , exp
2 2x yx y
πσ σ
⎛ ⎞+= −⎜ ⎟⎜ ⎟
⎝ ⎠. (9)
The parameter σ of the smoothing filter is assigned the
value ( )01/ 2 2 f as suggested in [37], in order to reduce the
noise in the resulting image. The central frequency 0f of the fabric image depends on the width of one yarn (i.e., the number
International Journal of Computer Science Volume 1 Number 4
277
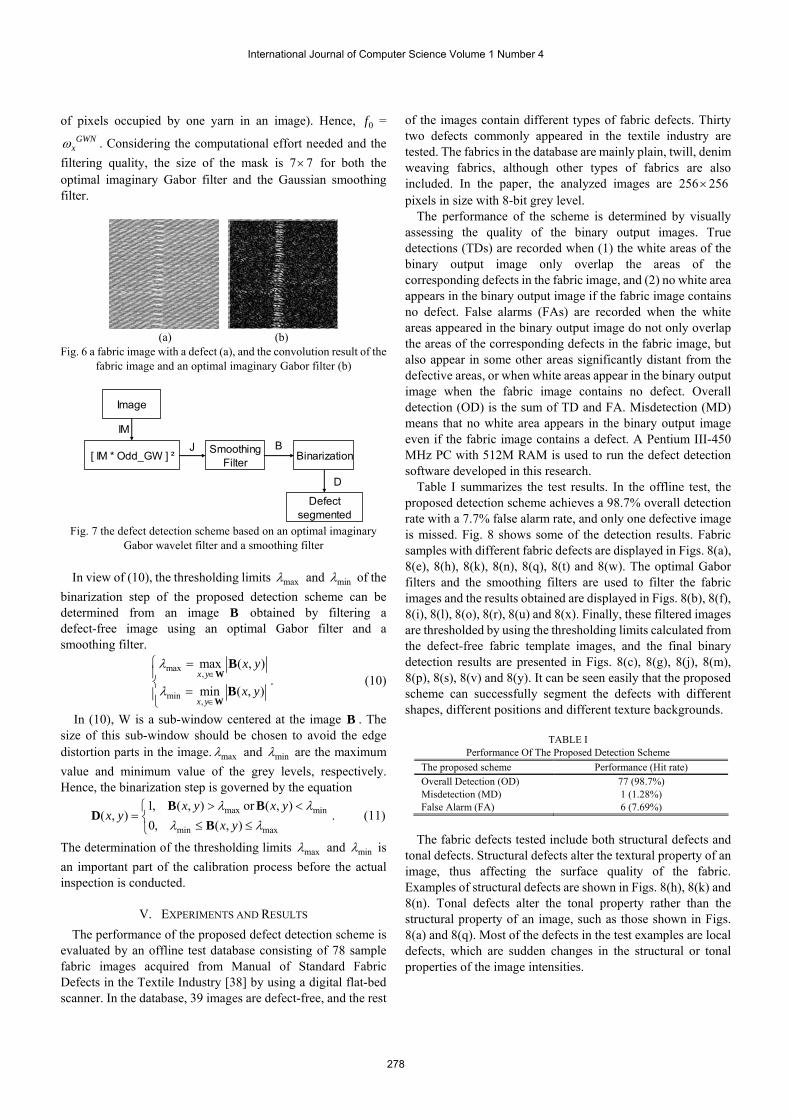
of pixels occupied by one yarn in an image). Hence, 0f = GWN
xω . Considering the computational effort needed and the filtering quality, the size of the mask is 7 7× for both the optimal imaginary Gabor filter and the Gaussian smoothing filter.
(a) (b)
Fig. 6 a fabric image with a defect (a), and the convolution result of the fabric image and an optimal imaginary Gabor filter (b)
Image
[ IM * Odd_GW ] ² Smoothing Filter Binarization
Defect segmented
J B
D
IM
Fig. 7 the defect detection scheme based on an optimal imaginary
Gabor wavelet filter and a smoothing filter
In view of (10), the thresholding limits maxλ and minλ of the binarization step of the proposed detection scheme can be determined from an image B obtained by filtering a defect-free image using an optimal Gabor filter and a smoothing filter.
max ,
min ,
max ( , )
min ( , )x y
x y
x y
x y
λ
λ∈
∈
⎧ =⎪⎨
=⎪⎩
W
W
B
B. (10)
In (10), W is a sub-window centered at the image B . The size of this sub-window should be chosen to avoid the edge distortion parts in the image. maxλ and minλ are the maximum value and minimum value of the grey levels, respectively. Hence, the binarization step is governed by the equation
max min
min max
1, ( , ) or ( , )( , )
0, ( , )x y x y
x yx yλ λ
λ λ> <⎧
= ⎨ ≤ ≤⎩
B BD
B. (11)
The determination of the thresholding limits maxλ and minλ is an important part of the calibration process before the actual inspection is conducted.
V. EXPERIMENTS AND RESULTS The performance of the proposed defect detection scheme is
evaluated by an offline test database consisting of 78 sample fabric images acquired from Manual of Standard Fabric Defects in the Textile Industry [38] by using a digital flat-bed scanner. In the database, 39 images are defect-free, and the rest
of the images contain different types of fabric defects. Thirty two defects commonly appeared in the textile industry are tested. The fabrics in the database are mainly plain, twill, denim weaving fabrics, although other types of fabrics are also included. In the paper, the analyzed images are 256 256× pixels in size with 8-bit grey level.
The performance of the scheme is determined by visually assessing the quality of the binary output images. True detections (TDs) are recorded when (1) the white areas of the binary output image only overlap the areas of the corresponding defects in the fabric image, and (2) no white area appears in the binary output image if the fabric image contains no defect. False alarms (FAs) are recorded when the white areas appeared in the binary output image do not only overlap the areas of the corresponding defects in the fabric image, but also appear in some other areas significantly distant from the defective areas, or when white areas appear in the binary output image when the fabric image contains no defect. Overall detection (OD) is the sum of TD and FA. Misdetection (MD) means that no white area appears in the binary output image even if the fabric image contains a defect. A Pentium III-450 MHz PC with 512M RAM is used to run the defect detection software developed in this research.
Table I summarizes the test results. In the offline test, the proposed detection scheme achieves a 98.7% overall detection rate with a 7.7% false alarm rate, and only one defective image is missed. Fig. 8 shows some of the detection results. Fabric samples with different fabric defects are displayed in Figs. 8(a), 8(e), 8(h), 8(k), 8(n), 8(q), 8(t) and 8(w). The optimal Gabor filters and the smoothing filters are used to filter the fabric images and the results obtained are displayed in Figs. 8(b), 8(f), 8(i), 8(l), 8(o), 8(r), 8(u) and 8(x). Finally, these filtered images are thresholded by using the thresholding limits calculated from the defect-free fabric template images, and the final binary detection results are presented in Figs. 8(c), 8(g), 8(j), 8(m), 8(p), 8(s), 8(v) and 8(y). It can be seen easily that the proposed scheme can successfully segment the defects with different shapes, different positions and different texture backgrounds.
TABLE I Performance Of The Proposed Detection Scheme
The proposed scheme Performance (Hit rate) Overall Detection (OD) 77 (98.7%) Misdetection (MD) 1 (1.28%) False Alarm (FA) 6 (7.69%)
The fabric defects tested include both structural defects and
tonal defects. Structural defects alter the textural property of an image, thus affecting the surface quality of the fabric. Examples of structural defects are shown in Figs. 8(h), 8(k) and 8(n). Tonal defects alter the tonal property rather than the structural property of an image, such as those shown in Figs. 8(a) and 8(q). Most of the defects in the test examples are local defects, which are sudden changes in the structural or tonal properties of the image intensities.
International Journal of Computer Science Volume 1 Number 4
278
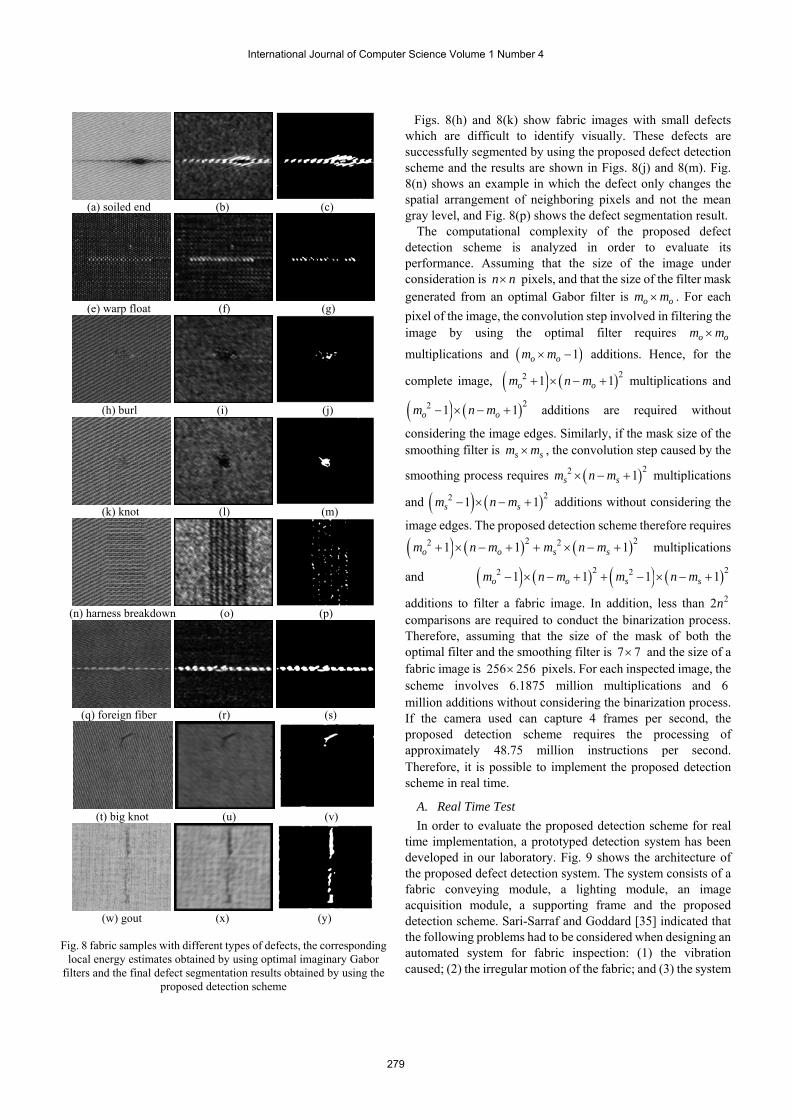
(a) soiled end (b) (c)
(e) warp float (f) (g)
(h) burl (i) (j)
(k) knot (l) (m)
(n) harness breakdown (o) (p)
(q) foreign fiber (r) (s)
(t) big knot (u) (v)
(w) gout (x) (y)
Fig. 8 fabric samples with different types of defects, the corresponding
local energy estimates obtained by using optimal imaginary Gabor filters and the final defect segmentation results obtained by using the
proposed detection scheme
Figs. 8(h) and 8(k) show fabric images with small defects which are difficult to identify visually. These defects are successfully segmented by using the proposed defect detection scheme and the results are shown in Figs. 8(j) and 8(m). Fig. 8(n) shows an example in which the defect only changes the spatial arrangement of neighboring pixels and not the mean gray level, and Fig. 8(p) shows the defect segmentation result.
The computational complexity of the proposed defect detection scheme is analyzed in order to evaluate its performance. Assuming that the size of the image under consideration is n n× pixels, and that the size of the filter mask generated from an optimal Gabor filter is o om m× . For each pixel of the image, the convolution step involved in filtering the image by using the optimal filter requires o om m×
multiplications and ( )1o om m× − additions. Hence, for the
complete image, ( ) ( )22 1 1o om n m+ × − + multiplications and
( ) ( )22 1 1o om n m− × − + additions are required without
considering the image edges. Similarly, if the mask size of the smoothing filter is s sm m× , the convolution step caused by the
smoothing process requires ( )22 1s sm n m× − + multiplications
and ( ) ( )22 1 1s sm n m− × − + additions without considering the
image edges. The proposed detection scheme therefore requires
( ) ( ) ( )2 22 21 1 1o o s sm n m m n m+ × − + + × − + multiplications
and ( ) ( ) ( ) ( )2 22 21 1 1 1o o s sm n m m n m− × − + + − × − +
additions to filter a fabric image. In addition, less than 22n comparisons are required to conduct the binarization process. Therefore, assuming that the size of the mask of both the optimal filter and the smoothing filter is 7 7× and the size of a fabric image is 256 256× pixels. For each inspected image, the scheme involves 6.1875 million multiplications and 6 million additions without considering the binarization process. If the camera used can capture 4 frames per second, the proposed detection scheme requires the processing of approximately 48.75 million instructions per second. Therefore, it is possible to implement the proposed detection scheme in real time.
A. Real Time Test In order to evaluate the proposed detection scheme for real
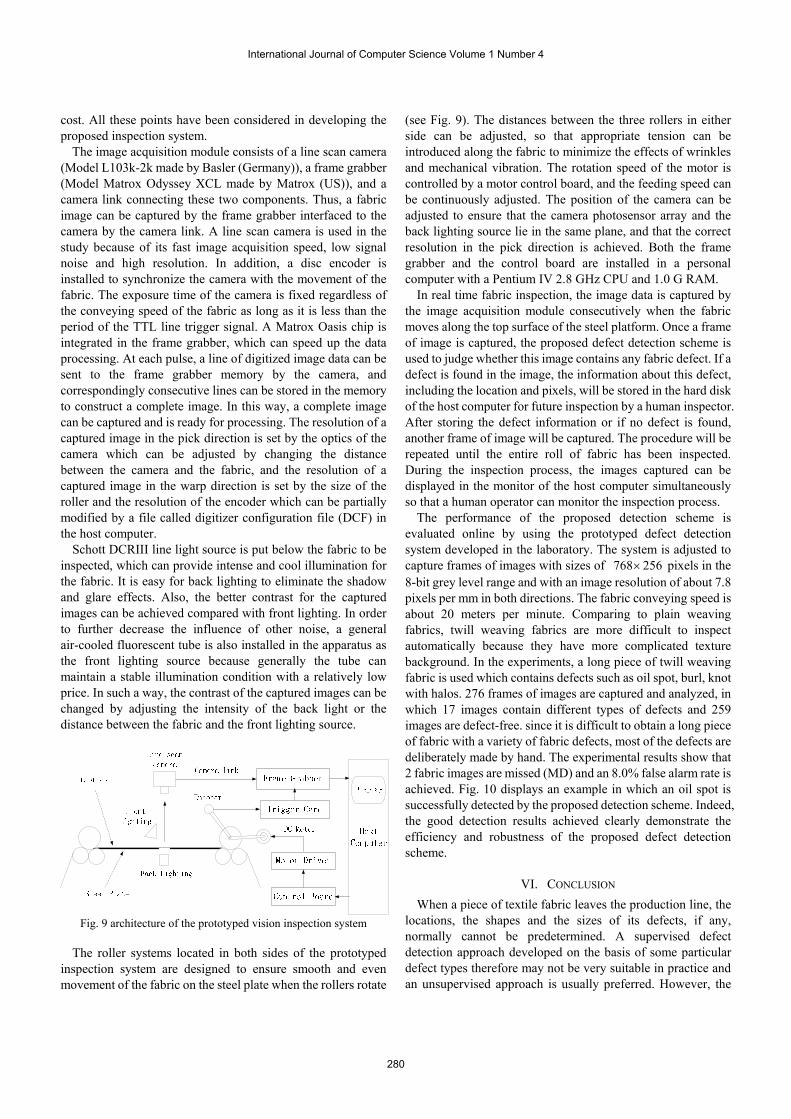
time implementation, a prototyped detection system has been developed in our laboratory. Fig. 9 shows the architecture of the proposed defect detection system. The system consists of a fabric conveying module, a lighting module, an image acquisition module, a supporting frame and the proposed detection scheme. Sari-Sarraf and Goddard [35] indicated that the following problems had to be considered when designing an automated system for fabric inspection: (1) the vibration caused; (2) the irregular motion of the fabric; and (3) the system
International Journal of Computer Science Volume 1 Number 4
279
cost. All these points have been considered in developing the proposed inspection system.
The image acquisition module consists of a line scan camera (Model L103k-2k made by Basler (Germany)), a frame grabber (Model Matrox Odyssey XCL made by Matrox (US)), and a camera link connecting these two components. Thus, a fabric image can be captured by the frame grabber interfaced to the camera by the camera link. A line scan camera is used in the study because of its fast image acquisition speed, low signal noise and high resolution. In addition, a disc encoder is installed to synchronize the camera with the movement of the fabric. The exposure time of the camera is fixed regardless of the conveying speed of the fabric as long as it is less than the period of the TTL line trigger signal. A Matrox Oasis chip is integrated in the frame grabber, which can speed up the data processing. At each pulse, a line of digitized image data can be sent to the frame grabber memory by the camera, and correspondingly consecutive lines can be stored in the memory to construct a complete image. In this way, a complete image can be captured and is ready for processing. The resolution of a captured image in the pick direction is set by the optics of the camera which can be adjusted by changing the distance between the camera and the fabric, and the resolution of a captured image in the warp direction is set by the size of the roller and the resolution of the encoder which can be partially modified by a file called digitizer configuration file (DCF) in the host computer.
Schott DCRIII line light source is put below the fabric to be inspected, which can provide intense and cool illumination for the fabric. It is easy for back lighting to eliminate the shadow and glare effects. Also, the better contrast for the captured images can be achieved compared with front lighting. In order to further decrease the influence of other noise, a general air-cooled fluorescent tube is also installed in the apparatus as the front lighting source because generally the tube can maintain a stable illumination condition with a relatively low price. In such a way, the contrast of the captured images can be changed by adjusting the intensity of the back light or the distance between the fabric and the front lighting source.
Fig. 9 architecture of the prototyped vision inspection system
The roller systems located in both sides of the prototyped
inspection system are designed to ensure smooth and even movement of the fabric on the steel plate when the rollers rotate
(see Fig. 9). The distances between the three rollers in either side can be adjusted, so that appropriate tension can be introduced along the fabric to minimize the effects of wrinkles and mechanical vibration. The rotation speed of the motor is controlled by a motor control board, and the feeding speed can be continuously adjusted. The position of the camera can be adjusted to ensure that the camera photosensor array and the back lighting source lie in the same plane, and that the correct resolution in the pick direction is achieved. Both the frame grabber and the control board are installed in a personal computer with a Pentium IV 2.8 GHz CPU and 1.0 G RAM.
In real time fabric inspection, the image data is captured by the image acquisition module consecutively when the fabric moves along the top surface of the steel platform. Once a frame of image is captured, the proposed defect detection scheme is used to judge whether this image contains any fabric defect. If a defect is found in the image, the information about this defect, including the location and pixels, will be stored in the hard disk of the host computer for future inspection by a human inspector. After storing the defect information or if no defect is found, another frame of image will be captured. The procedure will be repeated until the entire roll of fabric has been inspected. During the inspection process, the images captured can be displayed in the monitor of the host computer simultaneously so that a human operator can monitor the inspection process.
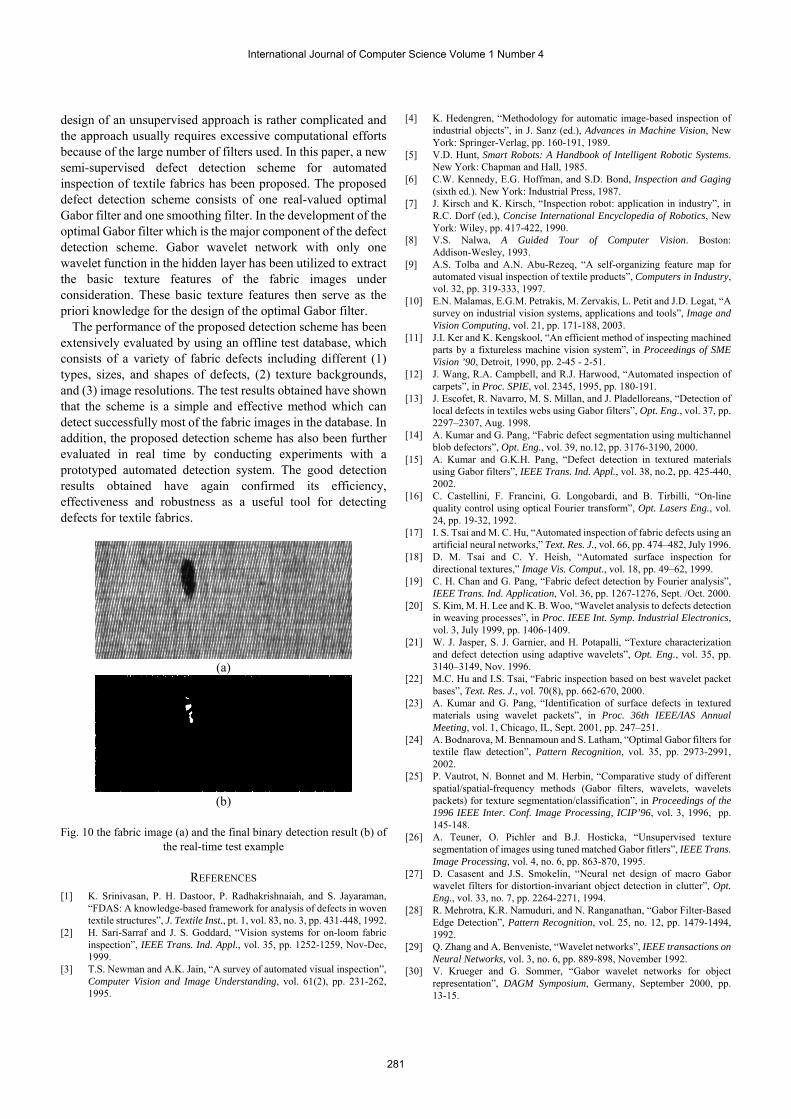
The performance of the proposed detection scheme is evaluated online by using the prototyped defect detection system developed in the laboratory. The system is adjusted to capture frames of images with sizes of 768 256× pixels in the 8-bit grey level range and with an image resolution of about 7.8 pixels per mm in both directions. The fabric conveying speed is about 20 meters per minute. Comparing to plain weaving fabrics, twill weaving fabrics are more difficult to inspect automatically because they have more complicated texture background. In the experiments, a long piece of twill weaving fabric is used which contains defects such as oil spot, burl, knot with halos. 276 frames of images are captured and analyzed, in which 17 images contain different types of defects and 259 images are defect-free. since it is difficult to obtain a long piece of fabric with a variety of fabric defects, most of the defects are deliberately made by hand. The experimental results show that 2 fabric images are missed (MD) and an 8.0% false alarm rate is achieved. Fig. 10 displays an example in which an oil spot is successfully detected by the proposed detection scheme. Indeed, the good detection results achieved clearly demonstrate the efficiency and robustness of the proposed defect detection scheme.
VI. CONCLUSION When a piece of textile fabric leaves the production line, the
locations, the shapes and the sizes of its defects, if any, normally cannot be predetermined. A supervised defect detection approach developed on the basis of some particular defect types therefore may not be very suitable in practice and an unsupervised approach is usually preferred. However, the
International Journal of Computer Science Volume 1 Number 4
280
design of an unsupervised approach is rather complicated and the approach usually requires excessive computational efforts because of the large number of filters used. In this paper, a new semi-supervised defect detection scheme for automated inspection of textile fabrics has been proposed. The proposed defect detection scheme consists of one real-valued optimal Gabor filter and one smoothing filter. In the development of the optimal Gabor filter which is the major component of the defect detection scheme. Gabor wavelet network with only one wavelet function in the hidden layer has been utilized to extract the basic texture features of the fabric images under consideration. These basic texture features then serve as the priori knowledge for the design of the optimal Gabor filter.
The performance of the proposed detection scheme has been extensively evaluated by using an offline test database, which consists of a variety of fabric defects including different (1) types, sizes, and shapes of defects, (2) texture backgrounds, and (3) image resolutions. The test results obtained have shown that the scheme is a simple and effective method which can detect successfully most of the fabric images in the database. In addition, the proposed detection scheme has also been further evaluated in real time by conducting experiments with a prototyped automated detection system. The good detection results obtained have again confirmed its efficiency, effectiveness and robustness as a useful tool for detecting defects for textile fabrics.
(a)
(b)
Fig. 10 the fabric image (a) and the final binary detection result (b) of
the real-time test example
REFERENCES [1] K. Srinivasan, P. H. Dastoor, P. Radhakrishnaiah, and S. Jayaraman,
“FDAS: A knowledge-based framework for analysis of defects in woven textile structures”, J. Textile Inst., pt. 1, vol. 83, no. 3, pp. 431-448, 1992.
[2] H. Sari-Sarraf and J. S. Goddard, “Vision systems for on-loom fabric inspection”, IEEE Trans. Ind. Appl., vol. 35, pp. 1252-1259, Nov-Dec, 1999.
[3] T.S. Newman and A.K. Jain, “A survey of automated visual inspection”, Computer Vision and Image Understanding, vol. 61(2), pp. 231-262, 1995.
[4] K. Hedengren, “Methodology for automatic image-based inspection of industrial objects”, in J. Sanz (ed.), Advances in Machine Vision, New York: Springer-Verlag, pp. 160-191, 1989.
[5] V.D. Hunt, Smart Robots: A Handbook of Intelligent Robotic Systems. New York: Chapman and Hall, 1985.
[6] C.W. Kennedy, E.G. Hoffman, and S.D. Bond, Inspection and Gaging (sixth ed.). New York: Industrial Press, 1987.
[7] J. Kirsch and K. Kirsch, “Inspection robot: application in industry”, in R.C. Dorf (ed.), Concise International Encyclopedia of Robotics, New York: Wiley, pp. 417-422, 1990.
[8] V.S. Nalwa, A Guided Tour of Computer Vision. Boston: Addison-Wesley, 1993.
[9] A.S. Tolba and A.N. Abu-Rezeq, “A self-organizing feature map for automated visual inspection of textile products”, Computers in Industry, vol. 32, pp. 319-333, 1997.
[10] E.N. Malamas, E.G.M. Petrakis, M. Zervakis, L. Petit and J.D. Legat, “A survey on industrial vision systems, applications and tools”, Image and Vision Computing, vol. 21, pp. 171-188, 2003.
[11] J.I. Ker and K. Kengskool, “An efficient method of inspecting machined parts by a fixtureless machine vision system”, in Proceedings of SME Vision ’90, Detroit, 1990, pp. 2-45 - 2-51.
[12] J. Wang, R.A. Campbell, and R.J. Harwood, “Automated inspection of carpets”, in Proc. SPIE, vol. 2345, 1995, pp. 180-191.
[13] J. Escofet, R. Navarro, M. S. Millan, and J. Pladelloreans, “Detection of local defects in textiles webs using Gabor filters”, Opt. Eng., vol. 37, pp. 2297–2307, Aug. 1998.
[14] A. Kumar and G. Pang, “Fabric defect segmentation using multichannel blob defectors”, Opt. Eng., vol. 39, no.12, pp. 3176-3190, 2000.
[15] A. Kumar and G.K.H. Pang, “Defect detection in textured materials using Gabor filters”, IEEE Trans. Ind. Appl., vol. 38, no.2, pp. 425-440, 2002.
[16] C. Castellini, F. Francini, G. Longobardi, and B. Tirbilli, “On-line quality control using optical Fourier transform”, Opt. Lasers Eng., vol. 24, pp. 19-32, 1992.
[17] I. S. Tsai and M. C. Hu, “Automated inspection of fabric defects using an artificial neural networks,” Text. Res. J., vol. 66, pp. 474–482, July 1996.
[18] D. M. Tsai and C. Y. Heish, “Automated surface inspection for directional textures,” Image Vis. Comput., vol. 18, pp. 49–62, 1999.
[19] C. H. Chan and G. Pang, “Fabric defect detection by Fourier analysis”, IEEE Trans. Ind. Application, Vol. 36, pp. 1267-1276, Sept. /Oct. 2000.
[20] S. Kim, M. H. Lee and K. B. Woo, “Wavelet analysis to defects detection in weaving processes”, in Proc. IEEE Int. Symp. Industrial Electronics, vol. 3, July 1999, pp. 1406-1409.
[21] W. J. Jasper, S. J. Garnier, and H. Potapalli, “Texture characterization and defect detection using adaptive wavelets”, Opt. Eng., vol. 35, pp. 3140–3149, Nov. 1996.
[22] M.C. Hu and I.S. Tsai, “Fabric inspection based on best wavelet packet bases”, Text. Res. J., vol. 70(8), pp. 662-670, 2000.
[23] A. Kumar and G. Pang, “Identification of surface defects in textured materials using wavelet packets”, in Proc. 36th IEEE/IAS Annual Meeting, vol. 1, Chicago, IL, Sept. 2001, pp. 247–251.
[24] A. Bodnarova, M. Bennamoun and S. Latham, “Optimal Gabor filters for textile flaw detection”, Pattern Recognition, vol. 35, pp. 2973-2991, 2002.
[25] P. Vautrot, N. Bonnet and M. Herbin, “Comparative study of different spatial/spatial-frequency methods (Gabor filters, wavelets, wavelets packets) for texture segmentation/classification”, in Proceedings of the 1996 IEEE Inter. Conf. Image Processing, ICIP’96, vol. 3, 1996, pp. 145-148.
[26] A. Teuner, O. Pichler and B.J. Hosticka, “Unsupervised texture segmentation of images using tuned matched Gabor fitlers”, IEEE Trans. Image Processing, vol. 4, no. 6, pp. 863-870, 1995.
[27] D. Casasent and J.S. Smokelin, “Neural net design of macro Gabor wavelet filters for distortion-invariant object detection in clutter”, Opt. Eng., vol. 33, no. 7, pp. 2264-2271, 1994.
[28] R. Mehrotra, K.R. Namuduri, and N. Ranganathan, “Gabor Filter-Based Edge Detection”, Pattern Recognition, vol. 25, no. 12, pp. 1479-1494, 1992.
[29] Q. Zhang and A. Benveniste, “Wavelet networks”, IEEE transactions on Neural Networks, vol. 3, no. 6, pp. 889-898, November 1992.
[30] V. Krueger and G. Sommer, “Gabor wavelet networks for object representation”, DAGM Symposium, Germany, September 2000, pp. 13-15.
International Journal of Computer Science Volume 1 Number 4
281
[31] V. Kruger and G. Sommer, “Gabor wavelet networks for efficient heard pose estimation”, Image and vision computing, vol. 20, pp. 665-672, 2002.
[32] V. Krueger, “Gabor wavelet networks for object representation”, Ph.D thesis, Christian Albrechts University, Germany, 2001.
[33] R. S. Feris and R. M. Cesar Junior, “Tracking facial features using Gabor wavelet networks”, Computer graphics and image proceeding, proceedings XII Brazalian Symposium on, 2000, pp. 22-27.
[34] K. L. Mak and P. Peng, “Defect detection in textile fabrics using Gabor wavelet networks”, 18th International Conference on Computer Applications in Industry and Engineering, Hawaii, USA, November 9-11, 2005, pp. 226-231.
[35] H. Sari-Sarraf, J.S. Goddard, “Vision systems for on-loom fabric inspection”, IEEE Trans. Ind. Appl., vol. 35, pp. 1252-1259, 1999.
[36] A.K. Jain and K. Karu, “Learning texture discrimination masks”, IEEE Trans. Pattern Anal. Mach. Intell., vol. 18, pp. 195-205, 1996.
[37] A.K. Jain and F. Furrokhnia, “Unsupervised texture segmentation using Gabor filters”, Pattern Recognition, vol. 23, pp. 1167-1186, 1991.
[38] Graniteville Company, Manual of Standard Fabric Defects in the Textile Industry. Grantiteville Company, South Carolina, 1975.
International Journal of Computer Science Volume 1 Number 4
282
Related Documents