Detecting Anomalous User Behavior Using an Extended Isolation Forest Algorithm: An Enterprise Case Study Li Sun 1 , Steven Versteeg 2 , Serdar Bozta¸ s 1 and Asha Rao 1 1 School of Mathematical and Geospatial Sciences, RMIT University,GPO Box 2476V, Melbourne, VIC 3001, Australia 2 CA Labs, Melbourne, Australia Abstract. Anomalous user behavior detection is the core component of many information security systems, such as intrusion detection, insider threat detection and authentication systems. Anomalous behavior will raise an alarm to the system administrator and can be further combined with other information to determine whether it constitutes an unautho- rised or malicious use of a resource. This paper presents an anomalous user behaviour detection framework that applies an extended version of Isolation Forest algorithm. Our method is fast and scalable and does not require example anomalies in the training data set. We apply our method to an enterprise dataset. The experimental results show that the system is able to isolate anomalous instances from the baseline user model using a single feature or combined features. 1 Introduction Detecting malicious activities is an important part of an information se- curity strategy. Attacks may come from intruders or malicious insiders. While not every anomaly is an attack, nearly every attack includes anoma- lous user behaviour. Effective detection on anomalous user behaviour is therefore an important part of detecting attacks. Many existing machine learning methods for anomaly detection re- quire examples of both acceptable behaviour and malicious behaviour to train the system. Finding a sufficient number of example attacks can be a challenge, as these events by nature are relatively rare. We propose a new method for detecting anomalies in user behaviour based on the isolation forest anomaly detection algorithm. Our method does not require any example anomalies in the training set. We apply our method to an enterprise dataset of staff accessing the payroll system in a large enterprise organisation. In this paper, an effective anomalous user behavior detection system has been developed. The main contributions of this paper are towards arXiv:1609.06676v1 [cs.CR] 21 Sep 2016

Welcome message from author
This document is posted to help you gain knowledge. Please leave a comment to let me know what you think about it! Share it to your friends and learn new things together.
Transcript
Detecting Anomalous User Behavior Using anExtended Isolation Forest Algorithm: An
Enterprise Case Study
Li Sun1, Steven Versteeg2, Serdar Boztas1 and Asha Rao1
1 School of Mathematical and Geospatial Sciences, RMIT University,GPO Box2476V, Melbourne, VIC 3001, Australia
2 CA Labs, Melbourne, Australia
Abstract. Anomalous user behavior detection is the core component ofmany information security systems, such as intrusion detection, insiderthreat detection and authentication systems. Anomalous behavior willraise an alarm to the system administrator and can be further combinedwith other information to determine whether it constitutes an unautho-rised or malicious use of a resource. This paper presents an anomaloususer behaviour detection framework that applies an extended version ofIsolation Forest algorithm. Our method is fast and scalable and does notrequire example anomalies in the training data set. We apply our methodto an enterprise dataset. The experimental results show that the systemis able to isolate anomalous instances from the baseline user model usinga single feature or combined features.
1 Introduction
Detecting malicious activities is an important part of an information se-curity strategy. Attacks may come from intruders or malicious insiders.While not every anomaly is an attack, nearly every attack includes anoma-lous user behaviour. Effective detection on anomalous user behaviour istherefore an important part of detecting attacks.
Many existing machine learning methods for anomaly detection re-quire examples of both acceptable behaviour and malicious behaviour totrain the system. Finding a sufficient number of example attacks can bea challenge, as these events by nature are relatively rare.
We propose a new method for detecting anomalies in user behaviourbased on the isolation forest anomaly detection algorithm. Our methoddoes not require any example anomalies in the training set. We apply ourmethod to an enterprise dataset of staff accessing the payroll system in alarge enterprise organisation.
In this paper, an effective anomalous user behavior detection systemhas been developed. The main contributions of this paper are towards
arX
iv:1
609.
0667
6v1
[cs
.CR
] 2
1 Se
p 20
16

– We apply an extended version of Isolation Forest algorithm to isolateanomalous user behavior. We extend the Isolation Forest algorithmto support categorical data dimensions.
– We evaluate different features and combine less informative featurestogether to achieve high detection effectiveness.
– We evaluate the anomalous user behavior detection system on a largenumber of log files that belongs to a real enterprise.
The remainder of the paper is organized as follows. Section 2 providesresearch background on anomaly detection and discusses related work.Section 3 gives the implementation of our system. Section 4 describes theexperimental setting and reports evaluation results. Section 5 discussesfuture directions and concludes the paper.
2 Related Work
Anomaly user behavior detection techniques are designed to identify rareuser behavior that are outliers to the normal behavior or behaviors thatchanged or carried by other users. These techniques can be categorizedinto three modes, supervised anomaly detection, semi-supervised anomalydetection and unsupervised anomaly detection.
The supervised anomaly detection requires a set of labeled trainingdata, normal or anomalous, to educate the detection software and create apredictive model of normal versus anomalous behavior. Once a new actionis coming, the predictive model is applied to classify the new action.Examples of such approaches include support vector machines [1] andBayesian networks [2]. The problem with the supervised approach is thatthe system can only detect anomalies that conform with its model due tothe lack of anomaly instances. A truly novel anomaly event may escapedetection, as the training data contains no archetype for it. Additionally,huge effort required in labeling training data and human error in labelingwill influence all future analysis.
Semi-supervised anomaly detection has the advantage of only requir-ing labeling for normal data within the training set. This works well forscenarios where anomaly types are difficult to predict, but ‘normal’ iseasy to define. In this mode, an anomaly is anything which lies outsideof the normal labeled data. Semi-Supervised has the benefit of reducingthe level of manual effort required to label the training data, as anoma-lies need not be tagged. This mode also has the benefit of being able todetect novel events, as again, anything not-normal is anomalous. Semi-supervised has difficulties when presented with noisy data sets. As noise

may be distributed across the sample space, much of it may fall outsideof the regions defined as normal, and hence this data will be declaredanomalous and a high false-positive rate will result.
Unsupervised anomaly detection approach has the significant advan-tage of not requiring labeled training data. It operates on the assumptionthat normal data instances are the most common within the data set.Anomalies are rare. There may be other determining factors, such as clus-tering: normal data will congregate in large, dense clusters and anomaliesoccupy isolated positions within the data set. Unsupervised mode can bebetter at detecting novel events and can also recalibrate its definition ofnormal, should the normal-state within the input data evolve over time.Past work has also explored unsupervised learning for anomaly user be-havior detection [3,4]. Cook [5], Eberle [6] and Yan [7] represent threatand non-threat data as a graph and apply unsupervised learning to de-tect anomalies. Our work focus on unsupervised approach. We representuser behaviour by combining features together and apply Isolation Forestalgorithm [8], to build an automatic anomaly user detection system.
3 Methodology
In this paper, we develop an automatic anomalous user detection systemusing an extended version of the Isolation Forest algorithm. The proposedframework is shown in Figure 1. The parser pre-processes all log files andstores logs by users. For each user, the system extracts the features set andbuilds a baseline user model by creating a collection of extended IsolationForest tree. When a new user record is coming, it is mapped into eachof these Isolation Forest trees and an anomaly score is calculated. If itsanomaly score is under the threshold, it is assumed normal, otherwise, ananomalous behavior is recorded and this user is flagged as anomalous.
Fig. 1: The proposed framework

3.1 Isolation Forest
Isolation forest (iForest) [8] is an anomaly detection algorithm. The algo-rithm utilises the observation that if a dataset is organised into a binarysearch tree, anomalies are more likely to be inserted at a lesser depthin a tree, compared to non-anomalous values (see Figure 2). For a givendataset, the algorithm takes n random samples of size m. For each ran-dom sample, a binary search tree is constructed, randomly selecting adimension and partition point for each comparison node in the tree. Tocalculate the anomaly score of a new data point, it is inserted into each ofthe n random trees. The anomaly score is derived from the mean insertiondepth across all of the trees.
Isolation forest has a number of advantages as an anomaly detectionalgorithm:
– It requires relatively small samples from large datasets to derive ananomaly detection function. This makes it fast and scalable.
– It does not require example anomalies in the training data set.– Its distance threshold for determining anomalies is based on tree
depth, which is independent of the scaling of the data set dimensions.
(a) (b)
Fig. 2: (a) In this example dataset, a randomly constructed binary search tree isolatesthe anomalous value (17,17) (shown in red) in just one division, whereas the medoidvalue (7,13) (shown in blue) is isolated in five random divisions. (b) The anomaly hasa tree depth of 1, compared to 5 for the medoid point.

3.2 Extended Isolation Forest to categorical data
Isolation forest was originally proposed for datasets with continuous di-mensions. In this paper we extend the algorithm to consider categoricaldata. Our method only requires that for each categorical dimension, val-ues have an ordering. The ordering may be arbitrary. Each value is thenmapped to a numeric value, based on its ordering.
For example the values true and false may be mapped to false = 0,true = 1.
Having mapped the categorical values to numeric values, the categor-ical dimensions can be treated the same way as the numeric dimensionsin the iForest algorithm.
3.3 Features Extraction
The original format of the log files has a total of 42 fields. Some fieldsare missing in the dataset, such as location information. In this paper, weexplore five fields. They are listed below.
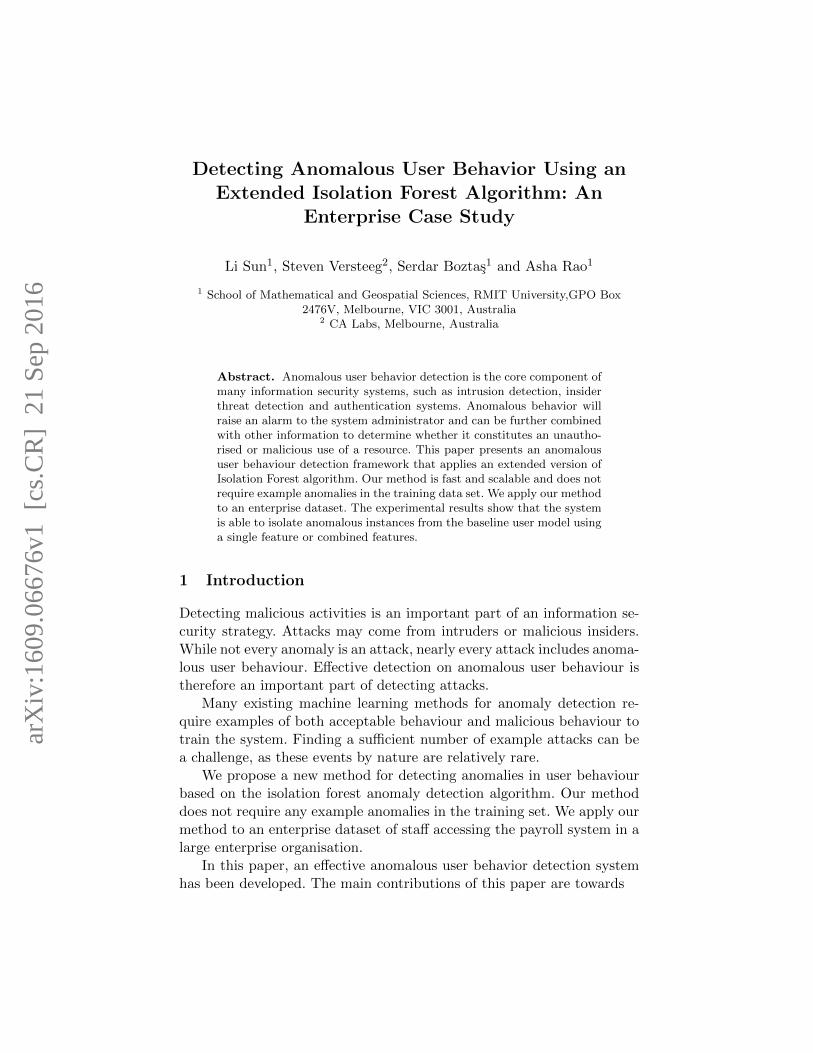
Match Rule The match rule is the rule used in the system for matchauthentication. 8 predefined rules for all logs are listed below and theirdistribution is shown in Figure 3.
– DEVICEIDCHECK
– DEVICEVELOCITY
– USER DEVICE ASSOCIATED AND DEVICE MFP MATCHED
– USER DEVICE ASSOCIATED AND DEVICE MFP NOT MATCHED
– USER DEVICE NOT ASSOCIATED AND DEVICE MFP MATCHED
– USER DEVICE NOT ASSOCIATED AND DEVICE MFP NOT MATCHED
– USERVELOCITY
– USERKNOWN
Signature Check This field is the information on whether the devicesignature matched with the incoming device ID. If it matches, the statusis “Y”. Otherwise, it is “N”. If a Device Check’s value is YN or YY, thisfield can only be Y.
Device Check This field checks whether the device is associated withthe user. There are three values, NN, YN and YY. NN means that thereis no device id on the device. Either we are seeing this device for the firsttime or the user deleted cookies. YN means that the device id has beenread but it is not associated with the user. It is a known device and a
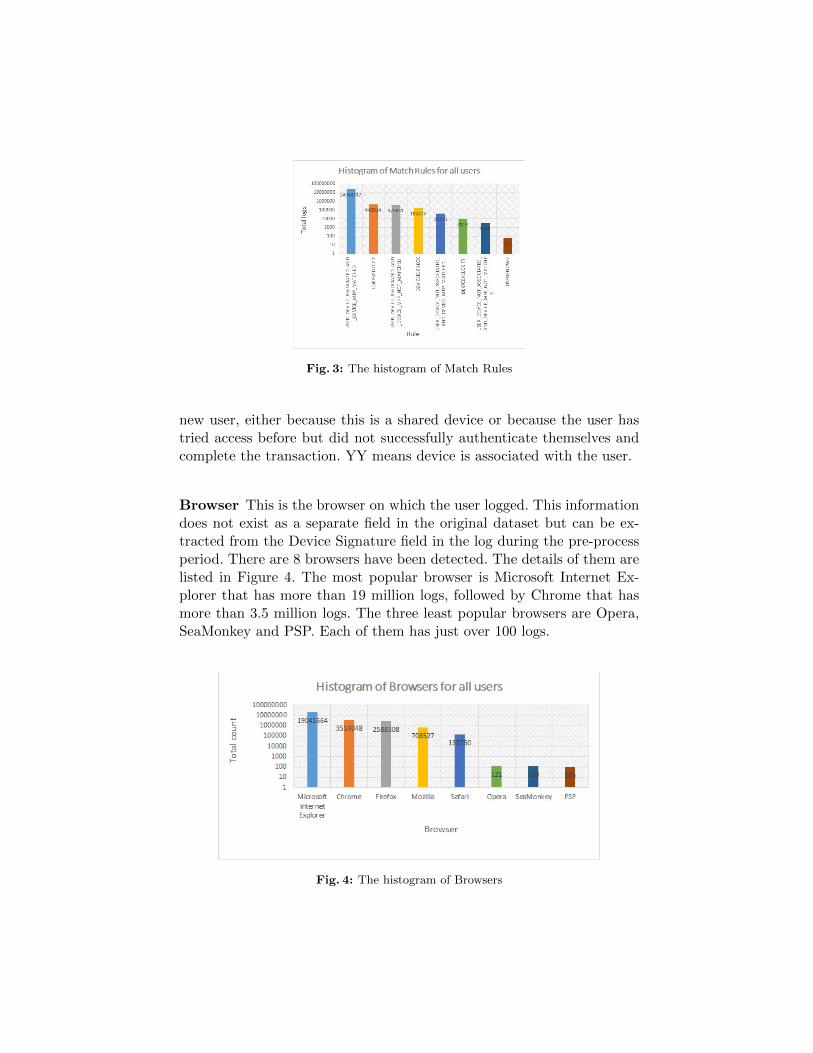
Fig. 3: The histogram of Match Rules
new user, either because this is a shared device or because the user hastried access before but did not successfully authenticate themselves andcomplete the transaction. YY means device is associated with the user.
Browser This is the browser on which the user logged. This informationdoes not exist as a separate field in the original dataset but can be ex-tracted from the Device Signature field in the log during the pre-processperiod. There are 8 browsers have been detected. The details of them arelisted in Figure 4. The most popular browser is Microsoft Internet Ex-plorer that has more than 19 million logs, followed by Chrome that hasmore than 3.5 million logs. The three least popular browsers are Opera,SeaMonkey and PSP. Each of them has just over 100 logs.
Fig. 4: The histogram of Browsers
Log Time This is the Date/Time in GMT that the transaction wasevaluated. The original format of timestamps is “mm/dd/yyyy H:M:S”or “mm/dd/yy H:M:S”. We extract two time information from it in thisresearch. They are date of the week and hour of the day.
4 Experimental Results
Experiments have been carried out to compare the performances of systemusing both single feature and combined features. For evaluation purposein this research, for a specific user, we assume all logs of this user arenormal and all logs of other users are anomalous for this user. Using thisclassification, we measure the detection effectiveness. In the real system,once the user model has been built, any testing log with an anomaly scoreover the threshold will be reported as anomalous.
4.1 Data Sets
All experiments have been carried out on a real enterprise dataset, CARiskMinder user payroll access logs. This dataset contains a total of25,991,654 logs, covering a total of 89 days over 14 weeks starting from15/02/2014.
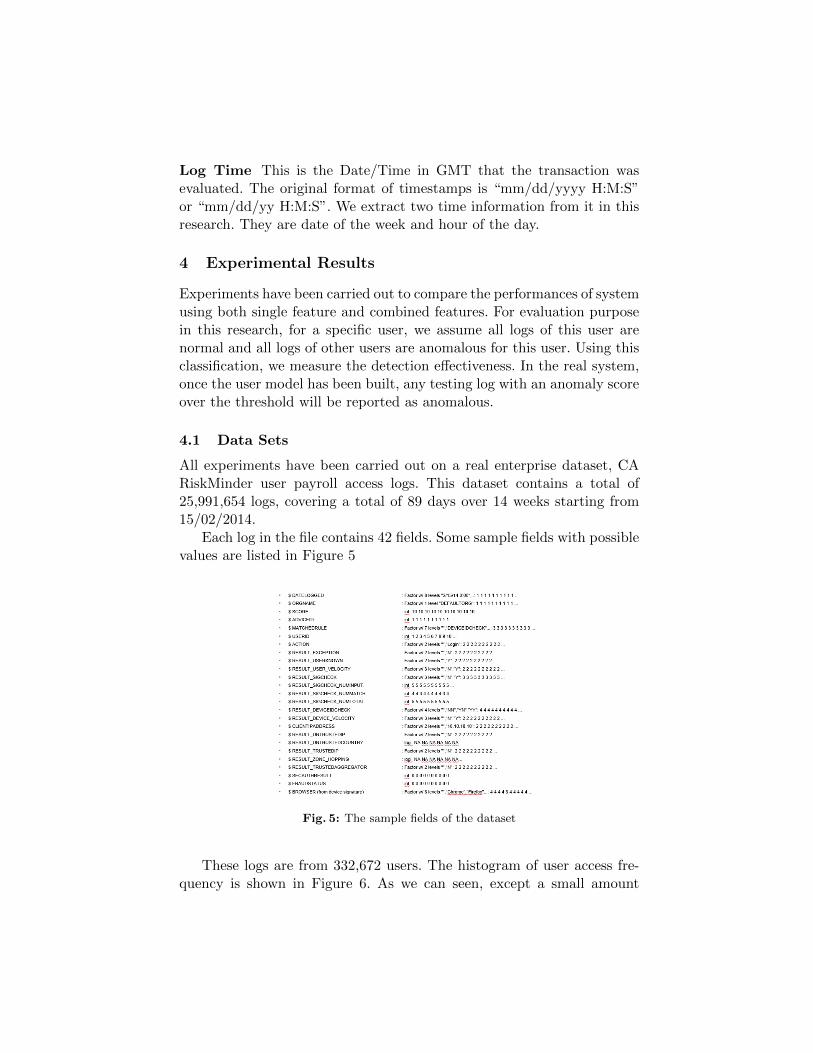
Each log in the file contains 42 fields. Some sample fields with possiblevalues are listed in Figure 5
Fig. 5: The sample fields of the dataset
These logs are from 332,672 users. The histogram of user access fre-quency is shown in Figure 6. As we can seen, except a small amount

of users accessed the system very frequently with over 10,000 accesses,most users only accessed a few hundreds times to the system. This re-search select all users that have access frequency between 501 and 600and build a user model for each of these users. There are total of 495users with 267,762 logs in the selected range. We select this range be-cause there is a reasonable amount of users in this range and these logscontain information that is sufficient for testing. We assume that mosthigh frequently access users might be bots and most low frequently ac-cess users don’t provide enough information. During the testing stage, werandomly select logs from the whole dataset and calculate their anomalyscores against each user model.
Fig. 6: The histogram of user access frequency
4.2 Evaluation Metrics
When comparing the performance of different classification techniques, itis important to assess how well a classification model is able to correctlyassign records to the actual classes. Several metrics are conventionally inuse to numerically quantify the effectiveness of classification performance.
To introduce the metrics, let us define that for a class yj , a record ispositive if it is predicted to belong this specific class and is negative ifit is predicted to belong other classes. Suppose that for a test set withn records, the set of positive records and negative records for the classare known (for example, as the result of human judgment), and P andN are the number of positive records and negative records respectively,n = P +N . Using four important counts [9] defined below, P = TP +FNand N = FP + TN .
– TP represents the true positives which is the number of positiverecords correctly identified as specific class.
– FP represents the false positives, the number of negative records whichdo not belong to the class but were incorrectly identified as it.
– TN represents the true negatives which refers the number of negativerecords correctly identified as other classes.
– FN represents the false negatives, that is the number of positiverecords which belong to the class but were incorrectly identified asother classes.
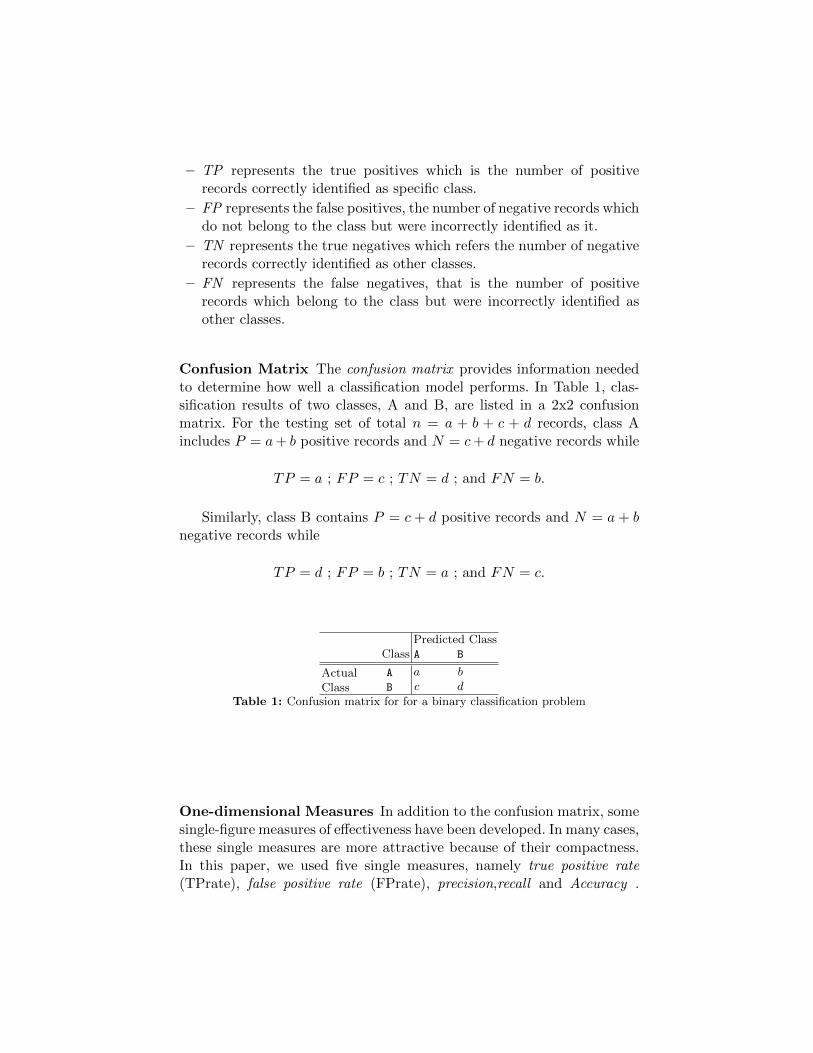
Confusion Matrix The confusion matrix provides information neededto determine how well a classification model performs. In Table 1, clas-sification results of two classes, A and B, are listed in a 2x2 confusionmatrix. For the testing set of total n = a + b + c + d records, class Aincludes P = a+ b positive records and N = c+ d negative records while
TP = a ; FP = c ; TN = d ; and FN = b.
Similarly, class B contains P = c + d positive records and N = a + bnegative records while
TP = d ; FP = b ; TN = a ; and FN = c.
Predicted ClassClass A B
ActualClass
A a b
B c d
Table 1: Confusion matrix for for a binary classification problem
One-dimensional Measures In addition to the confusion matrix, somesingle-figure measures of effectiveness have been developed. In many cases,these single measures are more attractive because of their compactness.In this paper, we used five single measures, namely true positive rate(TPrate), false positive rate (FPrate), precision,recall and Accuracy .

They are calculated [9] as:
TPrate =TP
P=
TP
TP + FN
FPrate =FP
N=
FP
FP + TN
(1)
and
Precision =TP
TP + FP
Recall =TP
TP + FN
Accuracy =TP + TN
TP + FN + FP + TN
(2)
4.3 Comparison of Results
Experiments were carried out to evaluate our approach. In the dataset,there are over 26 million logs from over 330 thousands users. As we dis-cussed before, we select users who have 501-600 access logs. In total, thereare 495 users.
Comparison of systems on classifying users In this study, we com-pare 7 detection systems. All systems implement the extended IsolationForest Algorithm but use different feature sets. There are 5 basic featuresare selected for the study, namely Match Rule, Signature Check, DeviceCheck, Browser and Log Time. The detail of these features are discussedin Section 3.3. In summary, System 1-5 use a single basic feature, System6 and 7 are based on combined feature set: System 6 combines the firstfour basic features; System 7 combines all basic features.
For each system, it runs 10 times on all selected 495 users. In eachrun, for each user, all records are randomly partitioned into two sets, 100records as the test set and the rest as the training set. The training set isused to build the Isolation Forest tree as the baseline user model. Duringthe testing period, another 100 records are randomly selected from thewhole dataset except this user’s. So the test set has a total of 200 recordsand consists two parts, 100 records classified as this user and 100 recordsclassified as the others. All testing logs are mapped into the IsolationForest tree and then a anomaly score will be calculated for each one. Ifthe score is high than the threshold, this record is anomaly. The threshold

in this research is set at 0.80. If the anomalous record belongs to this user,it is regarded as a False Negative. Otherwise, it is a True Negative.
In each run, the mean value of 495 users’ effectiveness is calculatedand the overall performance of each system is calculated as the averageof 10 random runs. The summary of the different systems’ performanceis shown in Table 2.
Packer TP rate FP rate Precision Recall Accuracy
System 1: Single feature Match Rule 99.08% 98.38% 50.18% 99.08% 50.35%System 2: Single feature Signature Check 99.78% 99.08% 50.18% 99.78% 50.35%System 3: Single feature Device Check 99.91% 99.75% 50.04% 99.91% 50.08%System 4: Single feature Browser 99.80% 94.03% 52.11% 99.80% 52.88%System 5: Single feature Time 99.46% 98.54% 50.24% 99.46% 50.46%System 6: Combined 4 features 99.02% 94.85% 51.43% 99.02% 52.08%System 7: Combined 4 features + time 98.92% 97.50% 50.50% 98.92% 50.77%
Table 2: Detailed detection results using single feature or combined features
Though the combined feature system has slightly better performancethan the single feature system, the results show that all tested systemscould not distinguish behaviors carried by different users. This is becausemost features are extracted from categorical data that has very smallvariants. As presented in Figure 3 and 4, the counts of some feature valuesof match rules and browsers are extreme high that means most users havesimilar feature sets. It is hard to use Isolation Forest algorithm to isolateanomaly values.
Detecting anomalous user behavior It is noted that there are logswith high anomaly score detected from both user and others. So the de-tails of each run are examined more closely. Figure 7 gives the histogramof the number of anomalous logs of all 495 users within one run using thesystem 6 described as above. 258 out of 495 users don’t have any anoma-lous behavior, followed by 122 users have only one anomalous behavior,such as change the browser or the match rule.
An output of one user run is shown in Figure 8. As we can see, thereare two anomalous records for user 58376 in this run. An example featuresets of this user’s normal and abnormal behavior are listed in Table 3, Inthis table, the first two rows report two anomalous behavior.

Fig. 7: The histogram of false positive value of 495 users using a combined 4 featuresdetection system. A false positive indicates an anomalous behavior of this user.
Fig. 8: Anomaly scores of 100 records for user58376. It is noted that there are twofalse positive instances.
5 Conclusions
We have demonstrated that isolation forest is an effective algorithm fordetecting anomalous user behaviour. Our method does not require anyexample anomalies in the training data. In this paper we propose a sim-ple method for extending the isolation forest algorithm to data sets whichinclude categorical dimensions. Our application of our method to an enter-prise dataset showed promising results. Our experiments tested whetherwe could accurately distinguish between the behaviour patterns of differ-ent users. Using five principal features from our dataset we obtained arecall of approximately 98.92%. We are able to detect anomalous behaviorcarried out by the user. We noted that access time is a significant feature,

Log No Match Rule Signature Device Browser Anomaly Score12303841 4 1 3 2 0.93074745560 4 1 3 1 0.9307
24592463 3 2 3 5 0.47422399302 3 2 3 1 0.4118
18966962 3 2 3 5 0.47429829951 3 2 3 1 0.4118
11434417 3 2 3 1 0.4118
Table 3: Two anomalous behavior and five normal behavior for user 58376
as users have different patterns of when they usually access the system.In this work we considered each access as an individual event. Futurework will try to improve the overall accuracy by considering sequences ofevents.
References
1. Christopher J. C. Burges. A tutorial on support vector machines for pattern recog-nition. Data Mining and Knowledge Discovery, 2:121–167, 1998.
2. Pang N. Tan, Michael Steinbach, and Vipin Kumar. Introduction to Data Mining.Pearson Education, Inc., 2006.
3. T. Hetherington A. Liu, C. Martin and S. Matzner. A comparison of system callfeature representations for insider threat detection. In IEEE Information AssuranceWorkshop (IAW), pages 340 – 347, 2005.
4. M. Prerau L. Portnoy E. Eskin, A. Arnold and S. Stolfo. A geometric frameworkfor unsupervised anomaly detection: Detecting intrusions in unlabeled data. Ap-plications of Data Mining in Computer Security, D. Barbara and S. Jajodia, Eds.,2002.
5. D. J. Cook and L. B. Holder. Mining graph data. In IEEE Information AssuranceWorkshop (IAW), pages 340 – 347. John Wiley & Sons, Inc., 2007.
6. D. W. Eberle and L. B. Holder. Mining for structural anomalies in graph-baseddata. In International Conference on Data Mining (DMIN), pages 376 – 389, 2007.
7. X. Yan and J. Han. gspan: Graph-based substructure pattern mining. In Interna-tional Conference on Data Mining (ICDM), pages 721 – 724, 2002.
8. Fei Tony Liu, Kai Ming Ting, and Zhi-Hua Zhou. Isolation forest. In 2008 EighthIEEE International Conference on Data Mining, pages 413–422. IEEE, 2008.
9. Sergios Theodoridis and Konstantinos Koutroumbas. Pattern Recognition (4th edi-tion). Academic Press, 2008.
Related Documents