Detecting and Analyzing Bursty Events on Twitter by Pau Perng-Hwa Kung Submitted to the Program in Media Arts and Sciences, School of Architecture and Planning in partial fulfillment of the requirements for the degree of Master of Science in Media Arts and Sciences at the MASSACHUSETTS INSTITUTE OF TECHNOLOGY September 2016 c ○ Massachusetts Institute of Technology 2016. All rights reserved. Author ................................................................ August 15, 2016 Certified by ............................................................ Deb Roy Associate Professor of Media Arts and Sciences Thesis Supervisor Accepted by ........................................................... Pattie Maes Academic Head, Program in Media Arts and Sciences

Welcome message from author
This document is posted to help you gain knowledge. Please leave a comment to let me know what you think about it! Share it to your friends and learn new things together.
Transcript
Detecting and Analyzing Bursty Events on Twitter
by
Pau Perng-Hwa Kung
Submitted to the Program in Media Arts and Sciences, School ofArchitecture and Planning
in partial fulfillment of the requirements for the degree of
Master of Science in Media Arts and Sciences
at the
MASSACHUSETTS INSTITUTE OF TECHNOLOGY
September 2016
c○ Massachusetts Institute of Technology 2016. All rights reserved.
Author . . . . . . . . . . . . . . . . . . . . . . . . . . . . . . . . . . . . . . . . . . . . . . . . . . . . . . . . . . . . . . . .August 15, 2016
Certified by. . . . . . . . . . . . . . . . . . . . . . . . . . . . . . . . . . . . . . . . . . . . . . . . . . . . . . . . . . . .Deb Roy
Associate Professor of Media Arts and SciencesThesis Supervisor
Accepted by . . . . . . . . . . . . . . . . . . . . . . . . . . . . . . . . . . . . . . . . . . . . . . . . . . . . . . . . . . .Pattie Maes
Academic Head, Program in Media Arts and Sciences

2
Detecting and Analyzing Bursty Events on Twitter
by
Pau Perng-Hwa Kung
Submitted to the Program in Media Arts and Sciences, School of Architecture andPlanning
on August 15, 2016, in partial fulfillment of therequirements for the degree of
Master of Science in Media Arts and Sciences
Abstract
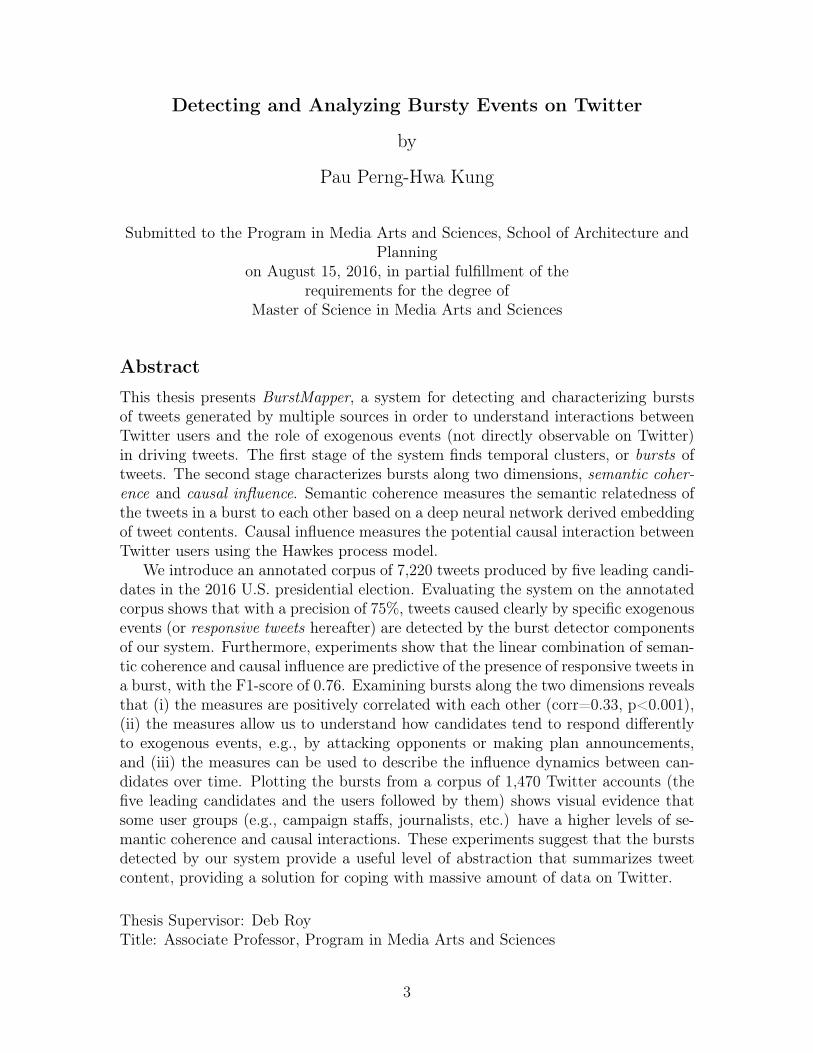
This thesis presents BurstMapper, a system for detecting and characterizing burstsof tweets generated by multiple sources in order to understand interactions betweenTwitter users and the role of exogenous events (not directly observable on Twitter)in driving tweets. The first stage of the system finds temporal clusters, or bursts oftweets. The second stage characterizes bursts along two dimensions, semantic coher-ence and causal influence. Semantic coherence measures the semantic relatedness ofthe tweets in a burst to each other based on a deep neural network derived embeddingof tweet contents. Causal influence measures the potential causal interaction betweenTwitter users using the Hawkes process model.
We introduce an annotated corpus of 7,220 tweets produced by five leading candi-dates in the 2016 U.S. presidential election. Evaluating the system on the annotatedcorpus shows that with a precision of 75%, tweets caused clearly by specific exogenousevents (or responsive tweets hereafter) are detected by the burst detector componentsof our system. Furthermore, experiments show that the linear combination of seman-tic coherence and causal influence are predictive of the presence of responsive tweets ina burst, with the F1-score of 0.76. Examining bursts along the two dimensions revealsthat (i) the measures are positively correlated with each other (corr=0.33, p<0.001),(ii) the measures allow us to understand how candidates tend to respond differentlyto exogenous events, e.g., by attacking opponents or making plan announcements,and (iii) the measures can be used to describe the influence dynamics between can-didates over time. Plotting the bursts from a corpus of 1,470 Twitter accounts (thefive leading candidates and the users followed by them) shows visual evidence thatsome user groups (e.g., campaign staffs, journalists, etc.) have a higher levels of se-mantic coherence and causal interactions. These experiments suggest that the burstsdetected by our system provide a useful level of abstraction that summarizes tweetcontent, providing a solution for coping with massive amount of data on Twitter.
Thesis Supervisor: Deb RoyTitle: Associate Professor, Program in Media Arts and Sciences
3

4
Acknowledgments
A huge thanks to the following people for making this thesis possible:
I would like to thank my advisor, Professor Deb Roy, for providing the research
support for making this thesis happening in the first place. I am truly grateful for
Deb’s patience and the willingness to give guidance where needed. The process has
not just been producing a good research, but also learning the key factors to be
innovative and inspiring.
I would also like to thank Doctor Allen Gorin, who has been actively involved in
the research process and kindly shared many of his valuable research experience. I
am also grateful of my thesis readers, Professor César Hidalgo, and Professor Ryan
P. Adams for providing valuable comments and feedbacks that bring substance into
this thesis. I would like to thank everyone in MASCOM: Chris and Sep for research
and presentation feedbacks; Linda and Keira for patience and kindness to make sure
the thesis progress goes accordingly to the institute rules.
It was fortunate to be around the truly great and inspiring LSM folks. I am
truly thankful. In particular, I would like to thank Soroush who gave really valuable
research feedbacks and pointers, Prashanth for kindly providing data and the awesome
Tweet2Vec model, Mina and Neo for kind support and consultation, and Amber and
Heather for providing every resource necessary to expedite the research process.
I would like to thank my dear friends for being a great source of emotional support,
especially Benjamin and Ken, whom I can truly trust and rely to share visions, and
know there are still amazing folks back in my home country who inspire me to also
be a more intelligent, kind, empathetic person.
Also, many thanks to my family, Mom and Dad, for their support in pursuing a
long-time goal/dream of coming to the MIT.
Lastly, and most importantly, I would like to thank my girlfriend, Ying-Ju (Ruthy),
for continual support and love. If there is anyone to dedicate this thesis to, it would
be her. I am in gratitude beyond words.
5

6
Detecting and Analyzing Bursty Events on Twitter
by Pau Perng-Hwa Kung
This masters thesis has been examined by the following:
Professor Ryan P. Adams . . . . . . . . . . . . . . . . . . . . . . . . . . . . . . . . . . . . . . . . . . . . . . . . . . . . . . . . . .
Thesis Reader
Associate Professor and Head of Advanced Technologies Group
Harvard University and Twitter
7

8
Detecting and Analyzing Bursty Events on Twitter
by Pau Perng-Hwa Kung
This masters thesis has been examined by the following:
Doctor Allen Gorin . . . . . . . . . . . . . . . . . . . . . . . . . . . . . . . . . . . . . . . . . . . . . . . . . . . . . . . . . . . . . . . .
Thesis Reader
Research Affiliate and Visiting Scholar
Johns Hopkins University and Massachusetts Institute of Technology
9

10
Detecting and Analyzing Bursty Events on Twitter
by Pau Perng-Hwa Kung
This masters thesis has been examined by the following:
Professor César A. Hidalgo . . . . . . . . . . . . . . . . . . . . . . . . . . . . . . . . . . . . . . . . . . . . . . . . . . . . . . . .
Thesis Reader
Associate Professor of Media Arts and Sciences
Massachusetts Institute of Technology
11

12
Contents
1 Introduction 19
1.1 Motivation . . . . . . . . . . . . . . . . . . . . . . . . . . . . . . . . . 19
1.1.1 Bursts in tweets . . . . . . . . . . . . . . . . . . . . . . . . . . 21
1.1.2 Properties of tweet bursts . . . . . . . . . . . . . . . . . . . . 21
1.2 Approach and Contributions . . . . . . . . . . . . . . . . . . . . . . . 23
1.3 Thesis Overview . . . . . . . . . . . . . . . . . . . . . . . . . . . . . . 24
2 Related Works 25
2.1 Communication Influence . . . . . . . . . . . . . . . . . . . . . . . . . 25
2.2 Detecting Bursts on Twitter . . . . . . . . . . . . . . . . . . . . . . . 26
2.3 Modeling Semantic Representation on Twitter . . . . . . . . . . . . . 26
2.4 Modeling Influence and Propagation on Twitter . . . . . . . . . . . . 27
2.5 Modeling Behaviors on Twitter . . . . . . . . . . . . . . . . . . . . . 28
3 Methodology 29
3.1 Definitions . . . . . . . . . . . . . . . . . . . . . . . . . . . . . . . . . 29
3.2 Overall Objective . . . . . . . . . . . . . . . . . . . . . . . . . . . . . 30
3.3 Overview of BurstMapper . . . . . . . . . . . . . . . . . . . . . . . . 30
3.4 Topic Categorization . . . . . . . . . . . . . . . . . . . . . . . . . . . 31
3.5 Burst Detection . . . . . . . . . . . . . . . . . . . . . . . . . . . . . . 33
3.6 Attribute Mapping of Tweets . . . . . . . . . . . . . . . . . . . . . . 34
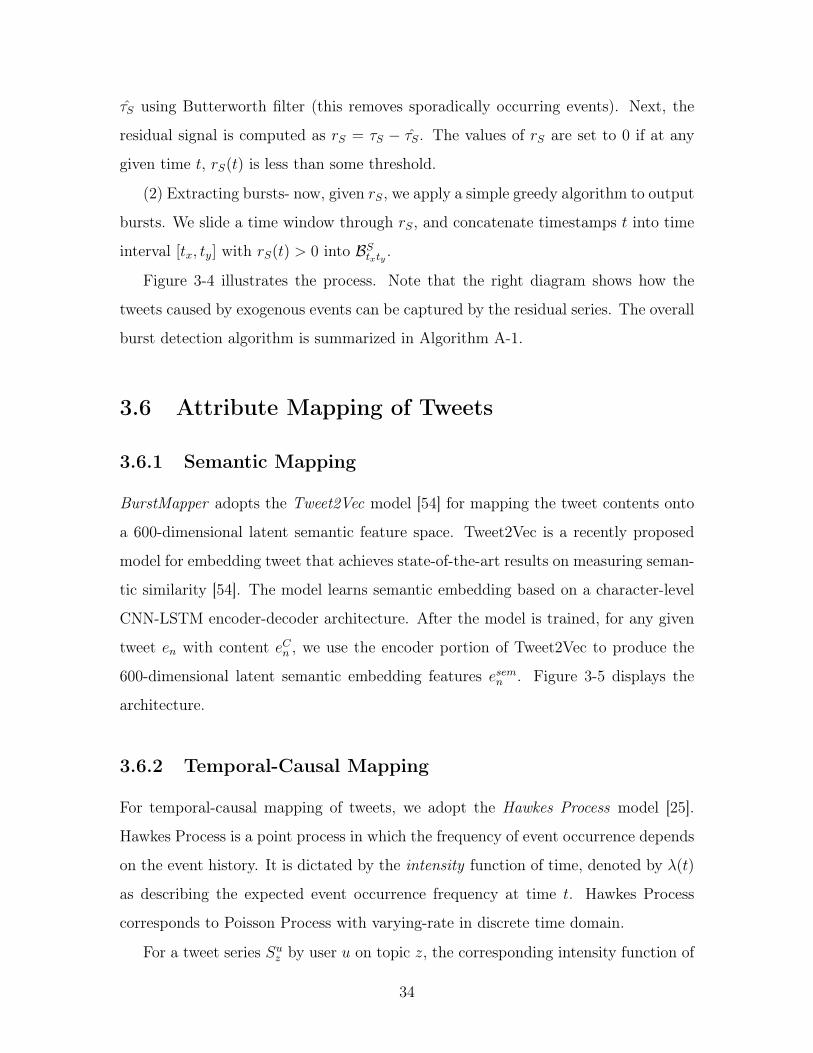
3.6.1 Semantic Mapping . . . . . . . . . . . . . . . . . . . . . . . . 34
3.6.2 Temporal-Causal Mapping . . . . . . . . . . . . . . . . . . . . 34
13
3.7 Burst Characterization and Data Exploration . . . . . . . . . . . . . 36
3.7.1 Burst Characterization . . . . . . . . . . . . . . . . . . . . . . 36
3.7.2 Querying from the Bursts . . . . . . . . . . . . . . . . . . . . 37
4 Evaluations 41
4.1 Datasets Description . . . . . . . . . . . . . . . . . . . . . . . . . . . 41
4.1.1 Detailed Description of Datasets . . . . . . . . . . . . . . . . . 42
4.1.2 Label Annotation . . . . . . . . . . . . . . . . . . . . . . . . . 42
4.2 Evaluating Burst Detector . . . . . . . . . . . . . . . . . . . . . . . . 43
4.3 Evaluating Measures for Burst Characterization . . . . . . . . . . . . 44
5 Data Explorations 47
5.1 Deeper Dive in FiveCandidates . . . . . . . . . . . . . . . . . . . . . 47
5.2 Exploring the FiveCandidatesExpanded Dataset . . . . . . . . . . . . 52
5.3 BurstMapper v.s. Traditional Approaches . . . . . . . . . . . . . . . 54
6 Conclusion 57
A Algorithms 59
B Election Topic Descriptions 61
C Data Annotation Details 63
D Regression Analysis Result 65
14
List of Figures
1-1 Time series of daily tweet volume by three 2016 U.S. presidential can-
didates from July 2015 to April 2016. . . . . . . . . . . . . . . . . . . 20
1-2 Tweet time series by three 2016 U.S. presidential candidates on two
election topics, with fitted constant-rate Poisson Process. . . . . . . . 20
1-3 Two tweet burst examples . . . . . . . . . . . . . . . . . . . . . . . . 22
3-1 An example showing how tweet series 𝒮 is divided into sub-user and
sub-topic streams 𝒮𝑢; 𝒮𝑢𝑧 . ∆𝑡=1 day. . . . . . . . . . . . . . . . . . . 30
3-2 The overall pipeline for the proposed framework BurstMapper . . . . 32
3-3 Architectural schematic of the tweet topic classifier. . . . . . . . . . . 32
3-4 The schematic burst detection algorithm. The enlarged figure shows
how using the residual signal can filter many tweets that are not due
to exogenous events. . . . . . . . . . . . . . . . . . . . . . . . . . . . 33
3-5 Architectural schematic of the deep learning-based tweet semantic em-
bedding model, Tweet2Vec. . . . . . . . . . . . . . . . . . . . . . . . 35
3-6 Graphical illustration of how to compute the two characteristic burst
measures. . . . . . . . . . . . . . . . . . . . . . . . . . . . . . . . . . 38
3-7 Schematic of the burst query procedure, with sample query results on
two election topics. . . . . . . . . . . . . . . . . . . . . . . . . . . . . 39
4-1 Tweet counts per topic and the proportion of examples per each label-
ing category. . . . . . . . . . . . . . . . . . . . . . . . . . . . . . . . . 43
4-2 Precision and recall of correctly identified timestamps containing re-
sponsive tweets. . . . . . . . . . . . . . . . . . . . . . . . . . . . . . . 44
15
4-3 The receiver-operating characteristics (ROC) curve of the classifier on
responsive burst classification task. . . . . . . . . . . . . . . . . . . . 46
5-1 Mapping the bursts onto semantic coherence-causal influence plane
with respect to each presidential candidate. . . . . . . . . . . . . . . . 49
5-2 Heatmap of Sanders’ tweeting activity in terms of the burst measures. 50
5-3 Mapping information influence networks over time for election topic
terrorism. . . . . . . . . . . . . . . . . . . . . . . . . . . . . . . . . . 51
5-4 Burst mapping with regard to semantic/causal measures for each type
of voice group over all candidates. . . . . . . . . . . . . . . . . . . . . 53
5-5 Mapping of measure variability within burst per voice group for each
candidate. . . . . . . . . . . . . . . . . . . . . . . . . . . . . . . . . . 54
5-6 Mapping of bursts relevant to topic Guns, highlighting the incident of
Sandy Hook controversy due to Sanders remarks. . . . . . . . . . . . 55
C-1 A sample question that each worker is asked to label. . . . . . . . . . 64
C-2 Question template. . . . . . . . . . . . . . . . . . . . . . . . . . . . . 64
C-3 Question template. . . . . . . . . . . . . . . . . . . . . . . . . . . . . 64
16
List of Tables
4.1 List of Topics . . . . . . . . . . . . . . . . . . . . . . . . . . . . . . . 41
4.2 A list of features used in regression analysis. . . . . . . . . . . . . . . 45
4.3 Overall performance burst classification over 22 election topics . . . . 45
5.1 Detailed description of events in each region specified in Figure 5-3. . 52
5.2 List of Popular Hashtags in the topic Guns for voices Clinton follow. . 55
B.1 Explanation for each of the 22 election topics. . . . . . . . . . . . . . 61
B.2 Explanation for each of the 22 election topics (cont’d). . . . . . . . . 62
D.1 Feature coding for the features used in regression analysis. . . . . . . 65
D.2 Feature significance over 22 election topics. . . . . . . . . . . . . . . . 66
D.3 Feature significance over 22 election topics (cont’). . . . . . . . . . . . 67
17

18
Chapter 1
Introduction
1.1 Motivation
In recent years, the micro-blogging site Twitter1 has become a major social media
platform for hundreds of millions of users. These users tweet about their lives, share
opinions, and discuss issues across a variety of different topics. The open-access and
mutually visible nature [11] of the platform makes it an ideal place for interested
people to explore how different individuals and organizations interact and respond to
social signals.
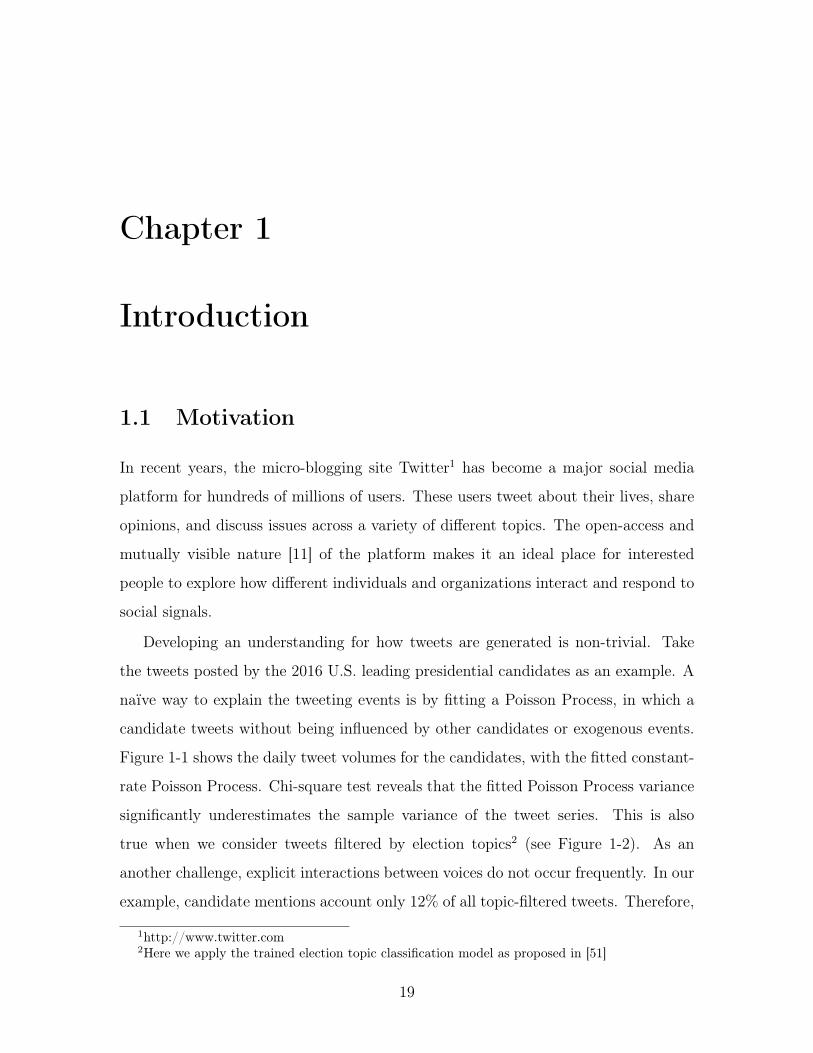
Developing an understanding for how tweets are generated is non-trivial. Take
the tweets posted by the 2016 U.S. leading presidential candidates as an example. A
naïve way to explain the tweeting events is by fitting a Poisson Process, in which a
candidate tweets without being influenced by other candidates or exogenous events.
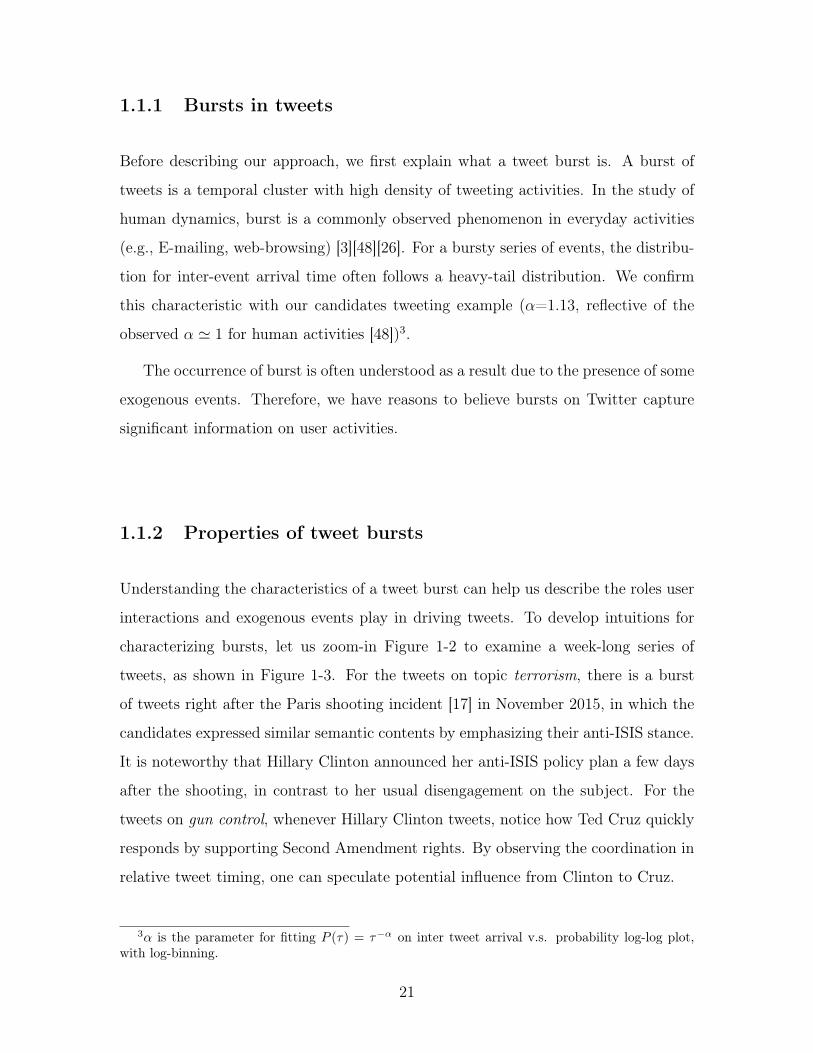
Figure 1-1 shows the daily tweet volumes for the candidates, with the fitted constant-
rate Poisson Process. Chi-square test reveals that the fitted Poisson Process variance
significantly underestimates the sample variance of the tweet series. This is also
true when we consider tweets filtered by election topics2 (see Figure 1-2). As an
another challenge, explicit interactions between voices do not occur frequently. In our
example, candidate mentions account only 12% of all topic-filtered tweets. Therefore,
1http://www.twitter.com2Here we apply the trained election topic classification model as proposed in [51]
19
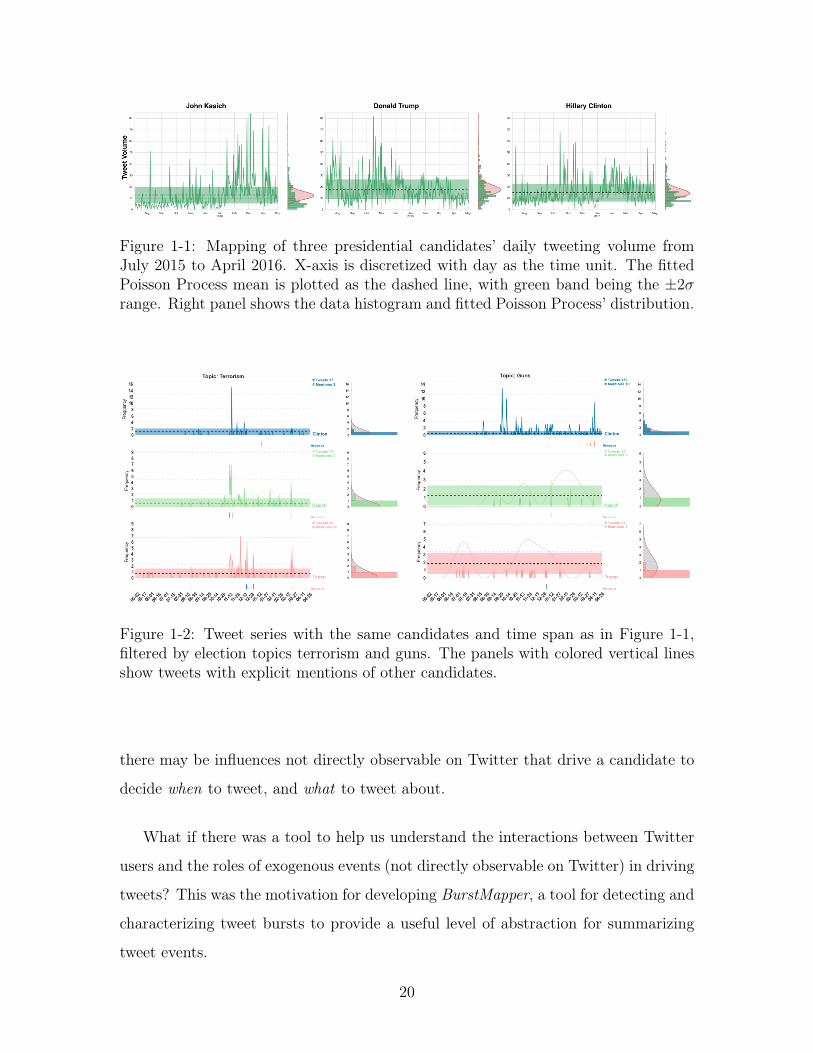
Figure 1-1: Mapping of three presidential candidates’ daily tweeting volume fromJuly 2015 to April 2016. X-axis is discretized with day as the time unit. The fittedPoisson Process mean is plotted as the dashed line, with green band being the ±2𝜎range. Right panel shows the data histogram and fitted Poisson Process’ distribution.
Figure 1-2: Tweet series with the same candidates and time span as in Figure 1-1,filtered by election topics terrorism and guns. The panels with colored vertical linesshow tweets with explicit mentions of other candidates.
there may be influences not directly observable on Twitter that drive a candidate to
decide when to tweet, and what to tweet about.
What if there was a tool to help us understand the interactions between Twitter
users and the roles of exogenous events (not directly observable on Twitter) in driving
tweets? This was the motivation for developing BurstMapper, a tool for detecting and
characterizing tweet bursts to provide a useful level of abstraction for summarizing
tweet events.
20
1.1.1 Bursts in tweets
Before describing our approach, we first explain what a tweet burst is. A burst of
tweets is a temporal cluster with high density of tweeting activities. In the study of
human dynamics, burst is a commonly observed phenomenon in everyday activities
(e.g., E-mailing, web-browsing) [3][48][26]. For a bursty series of events, the distribu-
tion for inter-event arrival time often follows a heavy-tail distribution. We confirm
this characteristic with our candidates tweeting example (𝛼=1.13, reflective of the
observed 𝛼 ≃ 1 for human activities [48])3.
The occurrence of burst is often understood as a result due to the presence of some
exogenous events. Therefore, we have reasons to believe bursts on Twitter capture
significant information on user activities.
1.1.2 Properties of tweet bursts
Understanding the characteristics of a tweet burst can help us describe the roles user
interactions and exogenous events play in driving tweets. To develop intuitions for
characterizing bursts, let us zoom-in Figure 1-2 to examine a week-long series of
tweets, as shown in Figure 1-3. For the tweets on topic terrorism, there is a burst
of tweets right after the Paris shooting incident [17] in November 2015, in which the
candidates expressed similar semantic contents by emphasizing their anti-ISIS stance.
It is noteworthy that Hillary Clinton announced her anti-ISIS policy plan a few days
after the shooting, in contrast to her usual disengagement on the subject. For the
tweets on gun control, whenever Hillary Clinton tweets, notice how Ted Cruz quickly
responds by supporting Second Amendment rights. By observing the coordination in
relative tweet timing, one can speculate potential influence from Clinton to Cruz.
3𝛼 is the parameter for fitting 𝑃 (𝜏) = 𝜏−𝛼 on inter tweet arrival v.s. probability log-log plot,with log-binning.
21
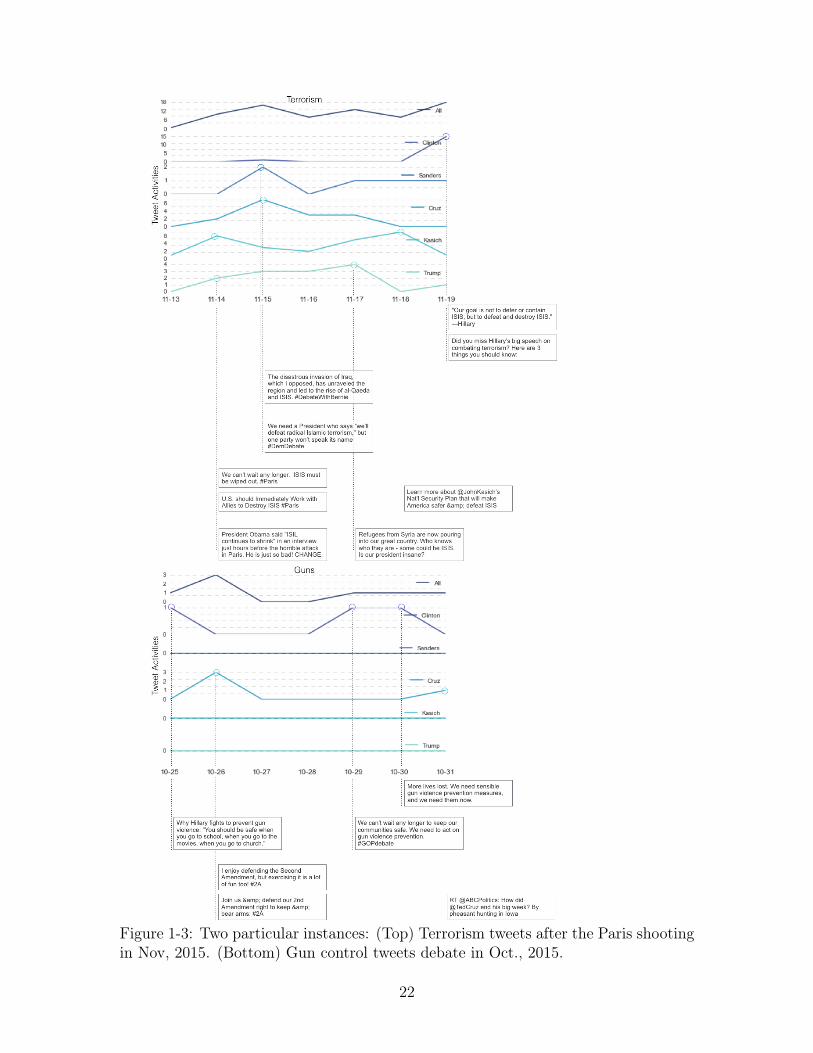
Figure 1-3: Two particular instances: (Top) Terrorism tweets after the Paris shootingin Nov, 2015. (Bottom) Gun control tweets debate in Oct., 2015.
22

1.2 Approach and Contributions
The main objective in this thesis is to develop a system that detects tweet bursts
and analyzes them by their characteristics. We are particularly interested in bursts
in which tweets due to exogenous events occur (hereafter responsive bursts)4. A
successful system should be able to identify many responsive bursts, and the analysis
of burst characteristics should reveal interesting ways a user responds to exogenous
events.
In this thesis, we propose BurstMapper, a system to detect and analyze the
potential drivers to a tweet time series by multiple user sources in terms of tweet
bursts. BurstMapper first applies a topic classifier to generate topic-filtered tweet
series. Next, a burst detection algorithm is used to extract temporal clusters with
high density of tweets. We then characterize bursts along two dimensions of analysis:
semantic coherence that measures the semantic relatedness of tweets in bursts using
a deep neural network derived embedding of tweet contents, Tweet2Vec [54]; causal
influence that measures the potential causal interactions between users by applying
Hawkes Process [25], which infers an influence network based on relative event timing.
BurstMapper provides a new tool to examine how exogenous events play a role
in how a user responds on Twitter. This approach differs from previous works that
use only partial semantic information (e.g., hashtags, URLs) to analyze information
influence on Twitter. Additionally, BurstMapper aims to cope with information over-
load by providing a useful abstraction that summarizes tweet content and potential
user interactions. The framework therefore offers the capability for efficient data ex-
ploration. Lastly, our framework is modular, so we can substitute with better models
of Twitter semantics and temporal causality if needed.
In a nutshell, BurstMapper makes the following contributions:
∙ We design a burst detection algorithm to extract temporal clusters of high
density tweets. Also, to characterize bursts, two measures are designed along4Tweets due to exogenous events do not occur very often. Based on our annotated corpus, only
8% of the tweets are influenced by other voices, with another 30% of tweets triggered by news events.It is therefore important to distinguish responsive bursts in order to examine exogenous event-causedtweets in more detail.
23
the dimensions of semantics and potential causal interactions. The two mea-
sures can be linearly combined as features for classifying responsive bursts. To
our knowledge, this is the first work that applies state-of-the-art semantic and
temporal-causal models to characterize tweet bursts.
∙ We create a manually annotated corpus of 7,220 election related tweets by five
leading U.S. presidential candidates from 2015 to 2016, where each tweet is
labeled as whether it is caused by exogenous events or not.
∙ Each component in our system is evaluated on the annotated corpus. Experi-
mental results show improvements over benchmark methods in evaluating burst
quality and responsive burst classification.
∙ Exploratory data analysis is performed on the annotated corpus, and a larger
dataset that includes the candidates and the users followed by them on Twitter.
Analysis reveals how the two measures can help us observe different ways a can-
didate responds to exogenous events. Testing on the larger dataset reveals how
certain groups of users may have a higher level of potentially causal interactions
and semantic coherence. Lastly, a small case study discusses how BurstMap-
per provides a more information-rich level of abstraction for summarizing tweet
content, in comparison to alternatives using only partial semantic information
like hashtags.
1.3 Thesis Overview
Chapter 2 discusses the related research works and explains how this thesis differs
from them. Chapter 3 introduces the BurstMapper system. Chapter 4 describes data
collection, and evaluation results of the system. Chapter 5 demonstrates exploratory
data analyses on two datasets using BurstMapper. Lastly, we conclude by discussing
the implications of our findings, limitations, and future directions.
24
Chapter 2
Related Works
This thesis shares connections with research works concerning communication influ-
ence and behavior modeling on Twitter. This chapter briefly explains these works
and discusses their relations to the thesis.
2.1 Communication Influence
Influence is an important notion in communication theory that explains how people
interact. Specifically, several theories of influence include: (i) cognitive dissonance
[18]- one may act to correct the perception of surroundings that become inconsistent
with her prior beliefs, (ii) social judgement theory [27]- a change in attitude is con-
trolled by one’s judgement of social context and the effects the change brings, (iii)
elaboration likelihood model [43]- one’s change of attitude is determined by how she
thinks about the persuasive content communicated by others, and (iv) the theory of
reasoned action [1]- one’s reaction is the dual process of her own attitude and learn-
ing from attitudes of others. Influence is also a major concept in many other social
science domains. In political theory for example, rhetoric, lexical expression, and
interactions can dictate the progression of political discourse [7] or election [29].
In computational linguistics, there has been active interest in underdstanding what
affects one’s word choice in a conversation. Recent works have applied probabilistic
topic modeling to map thematic change in language use; scholarly impact can then
25
be measured by observing coordinating shifts in topic distributions between authors
[19]. Another approach analyzes variations in word usage due to the power differ-
ence between individuals [9]. Additionally, a recent work [24] proposes probabilistic
language model that directly considers person-to-person influence.
Notice that the mentioned concepts share a mental model in which influence is
due to both implicit bias and observing others. In our thesis, BurstMapper is inspired
by this mental model. Therefore, we hope the proposed framework can serve as an
alternative tool for data exploration in these fields. Also, this work differentiates from
works in computational linguistics in that this thesis focuses on how content could
stimulate communication events to occur.
2.2 Detecting Bursts on Twitter
Detecting a temporally coherent, or high density region of tweets has close connections
to event detection in data streams, where bursts of tweets correspondingly imply
changes in data’s global latent state [30]. In the context of Twitter platform, event
detection is a well-researched topic. One popular way to detect events is to track use
patterns of popular and informative words [36][8]. Another way is to segment time
where text-based measure for newsworthiness is used to rank potential event segments
[34]. Other works have proposed generative models of text to directly model varying
semantic distribution given time [13].
In this thesis, burst detection is used to extract time regions with unusual in-
tensities of tweeting activity. In particular, BurstMapper deploys a frequency filter
[56], rather than incorporating semantic information. This design choice allows us to
explore a greater variability in the semantic characterization of bursts.
2.3 Modeling Semantic Representation on Twitter
There has been a wealth of research on developing computational methods for mod-
eling tweet contents. Many of these works have been task-driven, where specific
26
methods are designed for sentiment classification [40][12][5], syntactic annotation [39],
speech acts classification [53], stance detection [50], among many other use cases.
Typically, these works construct machine learning models [28][55], or novel features
[10][31][44] tailor-made for the given research tasks. These works provide a sample
view of the vibrant, and fast changing research landscape in modeling tweet contents.
Very recently, a line of research emerges for modeling Euclidean embedding for
tweet contents. Inspired by the widely popular Word2Vec model proposed by Mikolov
et al. [37], researchers have started to apply different shallow to deep neural network
architectures to learn the tweet semantic embedding [54][50]. This thesis focuses on
applying the established models that provide an expressive representation of tweet
semantics.
2.4 Modeling Influence and Propagation on Twitter
Since Twitter is an online social platform, an important research question is to under-
stand influence. Many research works focus on the network structure of the following
relations and interactions among users [2][58]. Other works have taken the idea fur-
ther to summarize social context [6], rank users [57], detect rumors [52], etc. Our work
differs by using both content and timing-based influence to provide an understanding
of potential drivers for tweets, which provides a different perspective to influence on
Twitter.
A particular case of influence that involves relative timing of events is information
propagation. Propagation of information consists of a user exposing to information,
and adopting the information based on her social neighbors. The seminal work of
Gomez-Rogriguez et al. [22] models the observed cascades (e.g., retweets, photo
reshares) with an underlying influence network. Subsequent works have extended
[22] by providing more scalable parameter optimizations [15][20][21], using out-of-
network information [38], as well as exploring other factors of influence like burst in
product item popularity [47][60].
Amidst the research progress, Hawkes Process [25] is a recently popularized alter-
27
native model. This thesis focuses on Hawkes Process because it models multivariate
discrete time series (and not just series of cascades), which is more general. Re-
searchers have applied the model to explain dependencies among a set of social inter-
action [4][42][61], topic cascades [16], and tweet streams [14][59]. This thesis focuses
on a purely application perspective, where in particular we adopt the discrete-time
Hawkes Process proposed by Linderman et al. [35].
2.5 Modeling Behaviors on Twitter
The news-like [32] and openly accessible nature of Twitter has inspired works to
understand Twitter users on a population level, such as predicting election [46], study
politics [45], inferring health outcomes [41], etc. These works often concerns with
profiling users in terms of their demographic attributes and use of words. This thesis
focuses on tweet bursts and mapping them along the dimensions of semantic and
temporal-causal properties. BurstMapper aims to serve as a general tool for providing
useful levels of abstraction for summarizing tweet content, where the other works aim
to solve case-specific data science problems.
28
Chapter 3
Methodology
3.1 Definitions
To start, we first describe the data setting used in the thesis. Assuming the data is
given in the form of a discrete series of tweet events 𝒮 = {𝑒1, ..., 𝑒|𝒮|}. Each tweet event
is generated by a source user account 𝑢 ∈ 𝒰 = {1, ..., |𝒰|}. A tweet 𝑒𝑛 is denoted as a
𝑒𝑛 = (𝑒𝑡𝑛, 𝑒𝑐𝑛, 𝑒
𝑧𝑛, 𝑒
𝑠𝑛, 𝑒
𝐶𝑛 , 𝑒
𝑝𝑛) tuple, with tweet raw data: time 𝑒𝑡𝑛, user identity 𝑒𝑐𝑛, when
the user previously tweeted 𝑒𝑝𝑛, and content 𝐶𝑛; as well as content-derived meta-data:
topic classification 𝑒𝑧𝑛, and categorization of stimulus 𝑒𝑠𝑛.
Additionally, note we can subdivide or filter the original series 𝒮 of tweet events.
First, the tweet time series generated by user 𝑢 is denoted by the superscript 𝒮𝑢.
Second, we use the underscript 𝑧 to denote events filtered by topic 𝑧, so that 𝒮𝑢𝑧 is
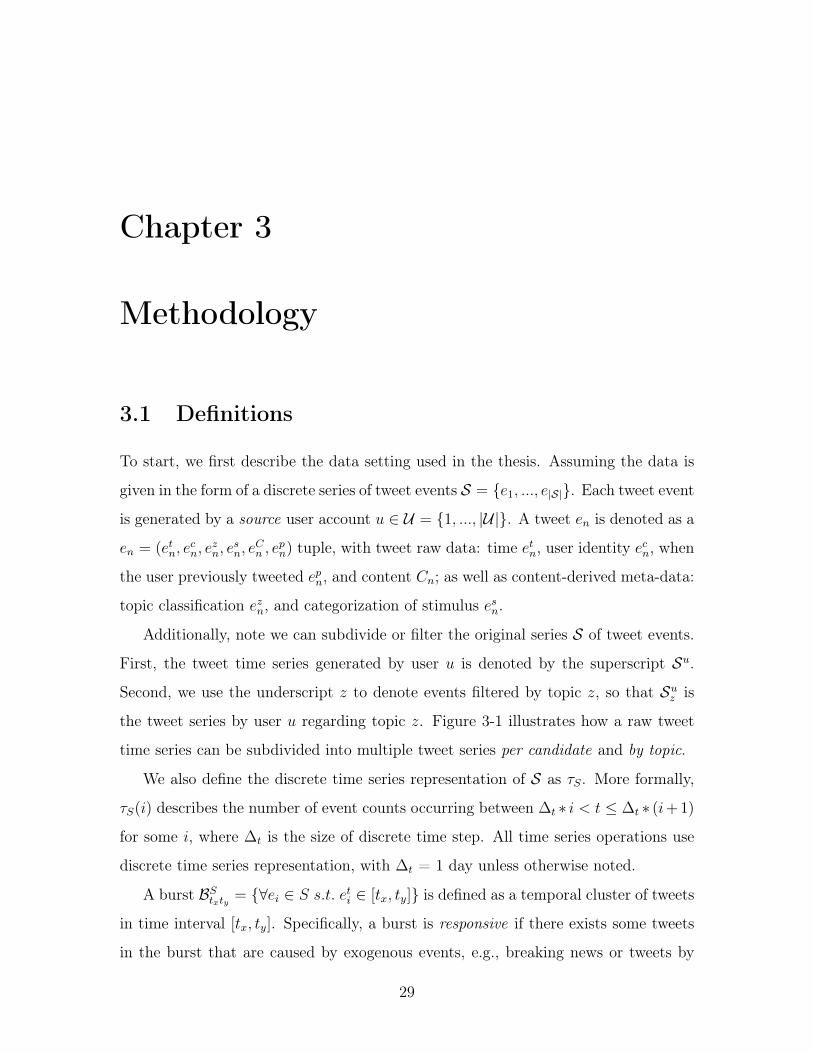
the tweet series by user 𝑢 regarding topic 𝑧. Figure 3-1 illustrates how a raw tweet
time series can be subdivided into multiple tweet series per candidate and by topic.
We also define the discrete time series representation of 𝒮 as 𝜏𝑆. More formally,
𝜏𝑆(𝑖) describes the number of event counts occurring between ∆𝑡 * 𝑖 < 𝑡 ≤ ∆𝑡 * (𝑖+ 1)
for some 𝑖, where ∆𝑡 is the size of discrete time step. All time series operations use
discrete time series representation, with ∆𝑡 = 1 day unless otherwise noted.
A burst ℬ𝑆𝑡𝑥𝑡𝑦 = {∀𝑒𝑖 ∈ 𝑆 𝑠.𝑡. 𝑒𝑡𝑖 ∈ [𝑡𝑥, 𝑡𝑦]} is defined as a temporal cluster of tweets
in time interval [𝑡𝑥, 𝑡𝑦]. Specifically, a burst is responsive if there exists some tweets
in the burst that are caused by exogenous events, e.g., breaking news or tweets by
29
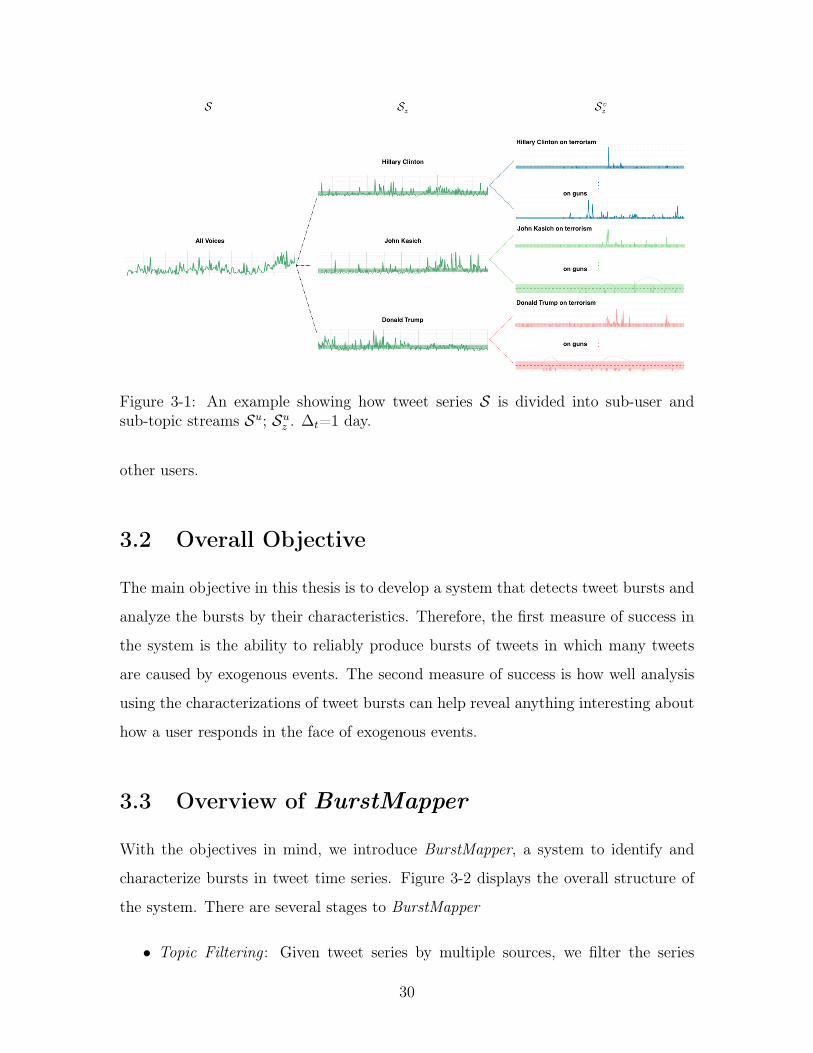
Figure 3-1: An example showing how tweet series 𝒮 is divided into sub-user andsub-topic streams 𝒮𝑢; 𝒮𝑢
𝑧 . ∆𝑡=1 day.
other users.
3.2 Overall Objective
The main objective in this thesis is to develop a system that detects tweet bursts and
analyze the bursts by their characteristics. Therefore, the first measure of success in
the system is the ability to reliably produce bursts of tweets in which many tweets
are caused by exogenous events. The second measure of success is how well analysis
using the characterizations of tweet bursts can help reveal anything interesting about
how a user responds in the face of exogenous events.
3.3 Overview of BurstMapper
With the objectives in mind, we introduce BurstMapper, a system to identify and
characterize bursts in tweet time series. Figure 3-2 displays the overall structure of
the system. There are several stages to BurstMapper
∙ Topic Filtering : Given tweet series by multiple sources, we filter the series
30
into per-topic subbands using a trained topic classifier [51] to provide topic
annotation 𝑒𝑧𝑛.
∙ Burst Detection: Given the topic-filtered series of tweets, a burst detection
algorithm extracts high-density regions of tweet events.
∙ Attribute Mapping of Tweets : The content for each tweet is embedded in a high
dimensional Euclidean space, based upon term-occurrence. This is then reduced
onto a latent semantic feature space by applying the state-of-the-art Tweet2Vec
model [54].
For the topic-filtered series over multiple users 𝑢, Hawkes Process [25] is used
to determine influence from user 𝑢′ to 𝑢 at time 𝑡 by inferring an underlying
influence network based on relative event timing.
∙ Burst Characterization and Data Exploration: Now, each burst can be mapped
along the two dimensions of characterization, semantic coherence and causal
influence, computed based on the semantic and temporal-causal feature map-
ping of tweets. Using the two measure of the tweet bursts, one can design a
classifier that uses the linear combination of the features for responsive burst
classification. Further, examining bursts along the two dimensions can reveal
interesting ways users respond to exogenous events.
For the remainder of this chapter, each component of BurstMapper is explained in
greater detail.
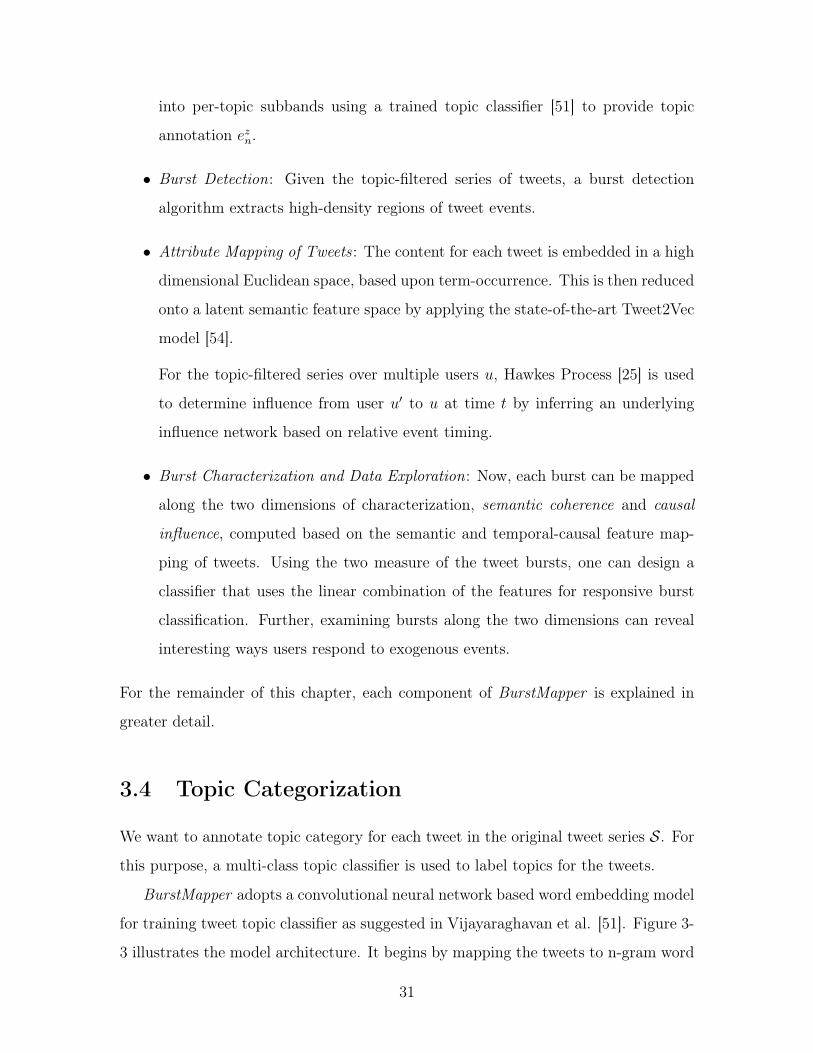
3.4 Topic Categorization
We want to annotate topic category for each tweet in the original tweet series 𝒮. For
this purpose, a multi-class topic classifier is used to label topics for the tweets.
BurstMapper adopts a convolutional neural network based word embedding model
for training tweet topic classifier as suggested in Vijayaraghavan et al. [51]. Figure 3-
3 illustrates the model architecture. It begins by mapping the tweets to n-gram word
31
Figure 3-2: The overall pipeline for the proposed framework BurstMapper
Figure 3-3: The schematic of the computational architecture used in Vijayaraghavanet al. [51] for developing a tweet topic classifier
32
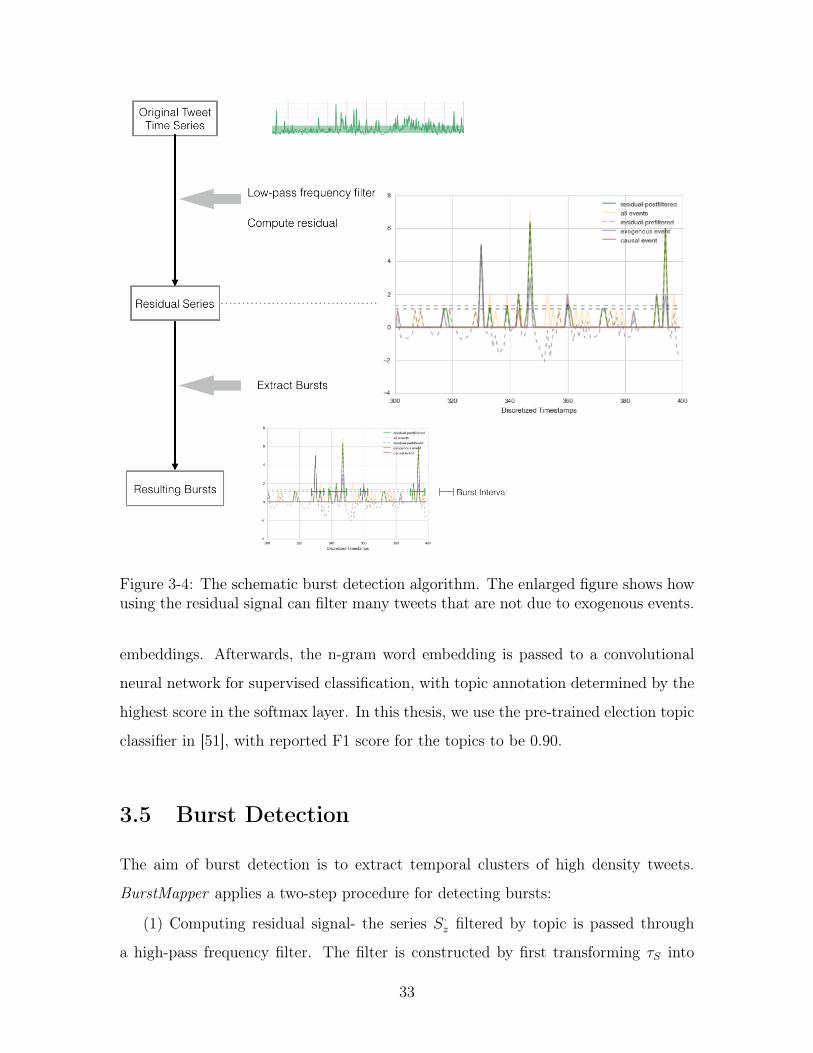
Figure 3-4: The schematic burst detection algorithm. The enlarged figure shows howusing the residual signal can filter many tweets that are not due to exogenous events.
embeddings. Afterwards, the n-gram word embedding is passed to a convolutional
neural network for supervised classification, with topic annotation determined by the
highest score in the softmax layer. In this thesis, we use the pre-trained election topic
classifier in [51], with reported F1 score for the topics to be 0.90.
3.5 Burst Detection
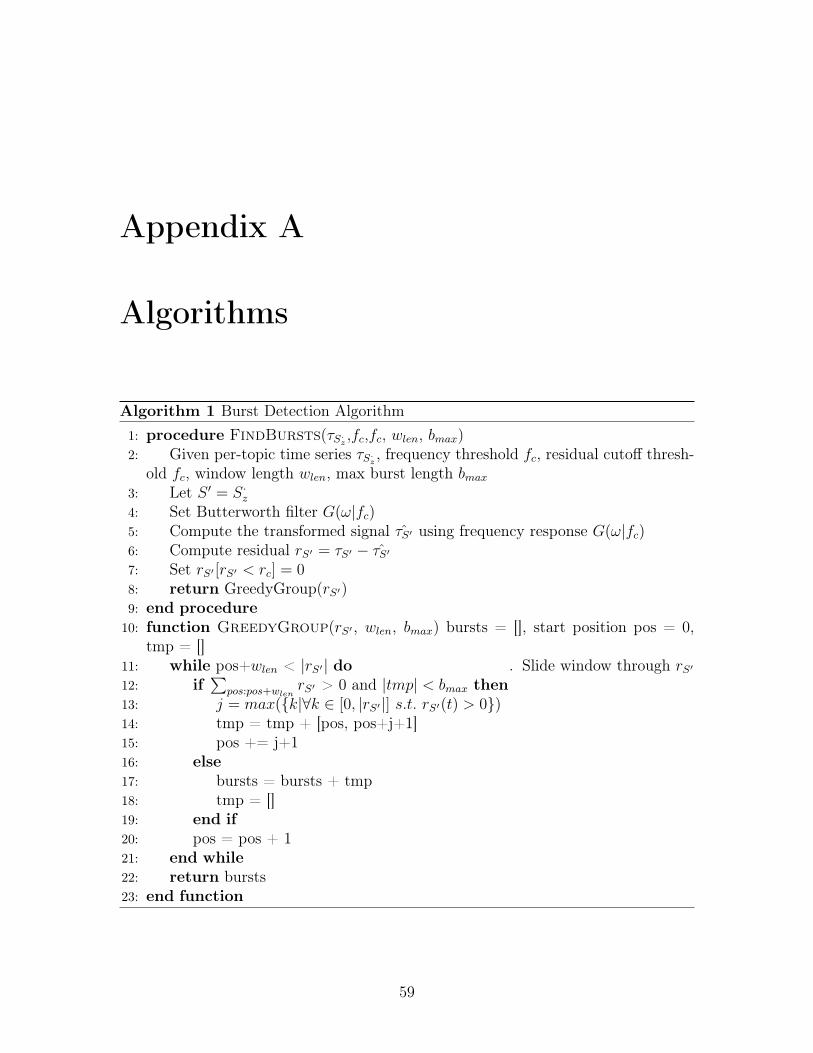
The aim of burst detection is to extract temporal clusters of high density tweets.
BurstMapper applies a two-step procedure for detecting bursts:
(1) Computing residual signal- the series 𝑆·𝑧 filtered by topic is passed through
a high-pass frequency filter. The filter is constructed by first transforming 𝜏𝑆 into
33
𝜏𝑆 using Butterworth filter (this removes sporadically occurring events). Next, the
residual signal is computed as 𝑟𝑆 = 𝜏𝑆 − 𝜏𝑆. The values of 𝑟𝑆 are set to 0 if at any
given time 𝑡, 𝑟𝑆(𝑡) is less than some threshold.
(2) Extracting bursts- now, given 𝑟𝑆, we apply a simple greedy algorithm to output
bursts. We slide a time window through 𝑟𝑆, and concatenate timestamps 𝑡 into time
interval [𝑡𝑥, 𝑡𝑦] with 𝑟𝑆(𝑡) > 0 into ℬ𝑆𝑡𝑥𝑡𝑦 .
Figure 3-4 illustrates the process. Note that the right diagram shows how the
tweets caused by exogenous events can be captured by the residual series. The overall
burst detection algorithm is summarized in Algorithm A-1.
3.6 Attribute Mapping of Tweets
3.6.1 Semantic Mapping
BurstMapper adopts the Tweet2Vec model [54] for mapping the tweet contents onto
a 600-dimensional latent semantic feature space. Tweet2Vec is a recently proposed
model for embedding tweet that achieves state-of-the-art results on measuring seman-
tic similarity [54]. The model learns semantic embedding based on a character-level
CNN-LSTM encoder-decoder architecture. After the model is trained, for any given
tweet 𝑒𝑛 with content 𝑒𝐶𝑛 , we use the encoder portion of Tweet2Vec to produce the
600-dimensional latent semantic embedding features 𝑒𝑠𝑒𝑚𝑛 . Figure 3-5 displays the
architecture.
3.6.2 Temporal-Causal Mapping
For temporal-causal mapping of tweets, we adopt the Hawkes Process model [25].
Hawkes Process is a point process in which the frequency of event occurrence depends
on the event history. It is dictated by the intensity function of time, denoted by 𝜆(𝑡)
as describing the expected event occurrence frequency at time 𝑡. Hawkes Process
corresponds to Poisson Process with varying-rate in discrete time domain.
For a tweet series 𝑆𝑢𝑧 by user 𝑢 on topic 𝑧, the corresponding intensity function of
34
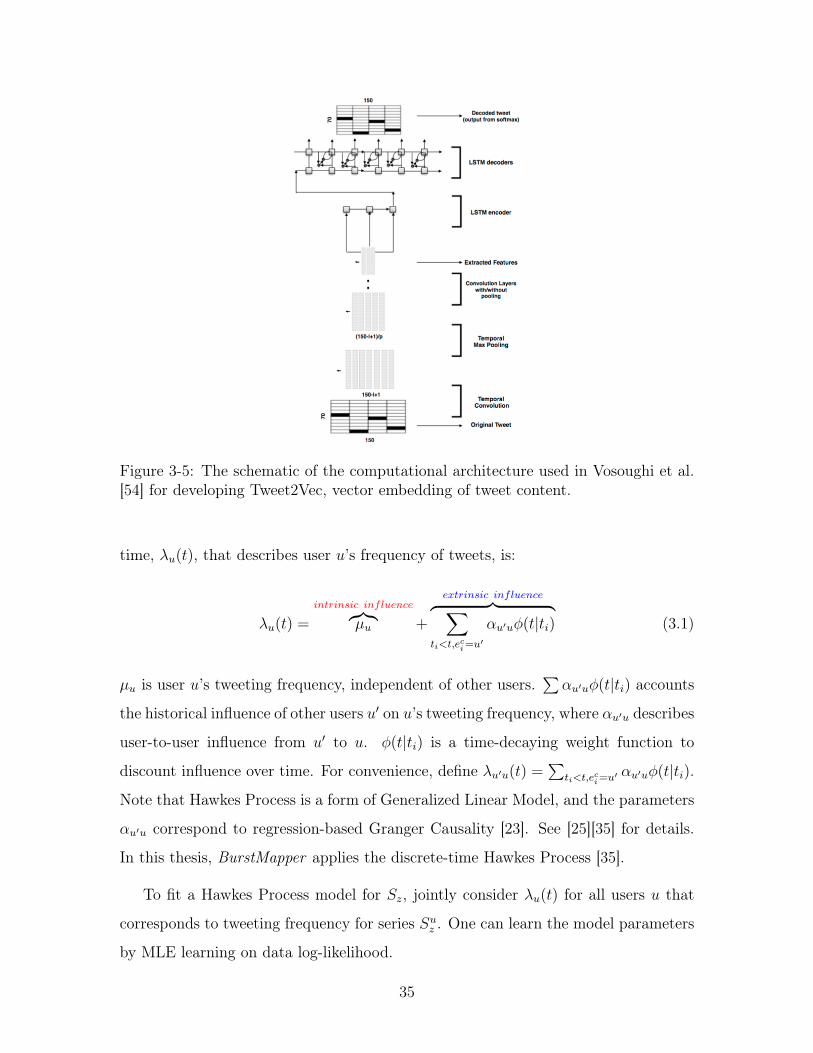
Figure 3-5: The schematic of the computational architecture used in Vosoughi et al.[54] for developing Tweet2Vec, vector embedding of tweet content.
time, 𝜆𝑢(𝑡), that describes user 𝑢’s frequency of tweets, is:
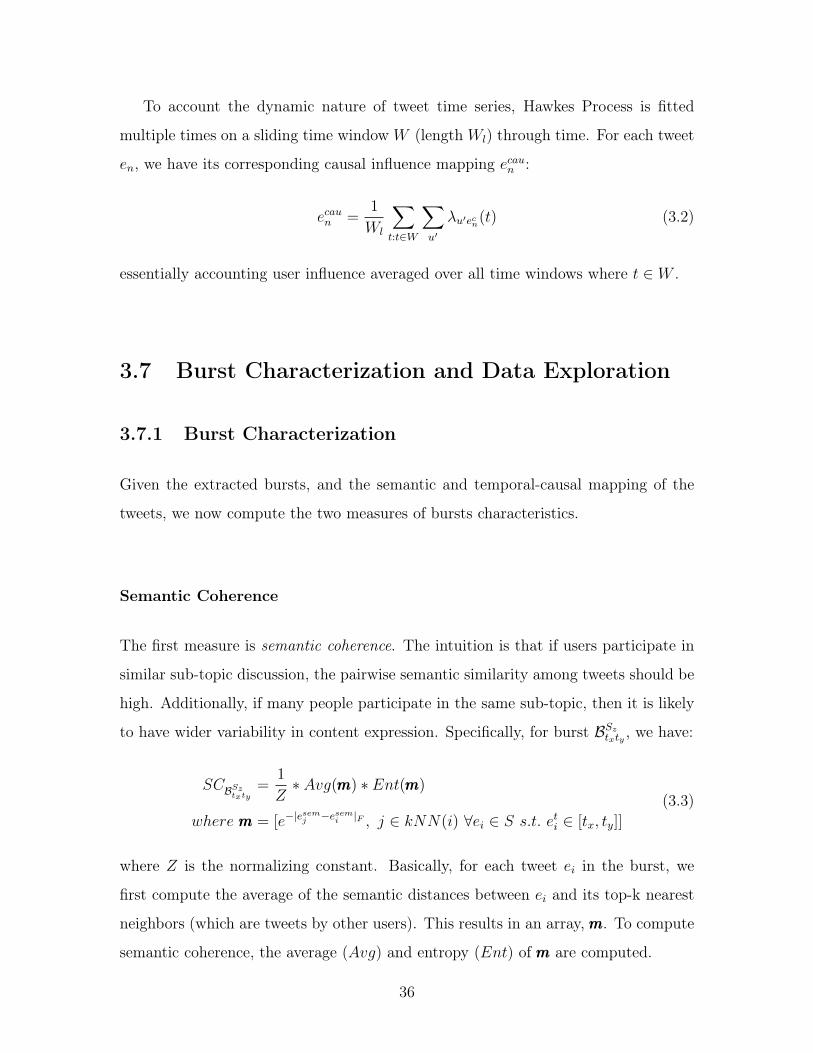
𝜆𝑢(𝑡) =
𝑖𝑛𝑡𝑟𝑖𝑛𝑠𝑖𝑐 𝑖𝑛𝑓𝑙𝑢𝑒𝑛𝑐𝑒⏞ ⏟ 𝜇𝑢 +
𝑒𝑥𝑡𝑟𝑖𝑛𝑠𝑖𝑐 𝑖𝑛𝑓𝑙𝑢𝑒𝑛𝑐𝑒⏞ ⏟ ∑︁𝑡𝑖<𝑡,𝑒𝑐𝑖=𝑢′
𝛼𝑢′𝑢𝜑(𝑡|𝑡𝑖) (3.1)
𝜇𝑢 is user 𝑢’s tweeting frequency, independent of other users.∑︀
𝛼𝑢′𝑢𝜑(𝑡|𝑡𝑖) accounts
the historical influence of other users 𝑢′ on 𝑢’s tweeting frequency, where 𝛼𝑢′𝑢 describes
user-to-user influence from 𝑢′ to 𝑢. 𝜑(𝑡|𝑡𝑖) is a time-decaying weight function to
discount influence over time. For convenience, define 𝜆𝑢′𝑢(𝑡) =∑︀
𝑡𝑖<𝑡,𝑒𝑐𝑖=𝑢′ 𝛼𝑢′𝑢𝜑(𝑡|𝑡𝑖).
Note that Hawkes Process is a form of Generalized Linear Model, and the parameters
𝛼𝑢′𝑢 correspond to regression-based Granger Causality [23]. See [25][35] for details.
In this thesis, BurstMapper applies the discrete-time Hawkes Process [35].
To fit a Hawkes Process model for 𝑆𝑧, jointly consider 𝜆𝑢(𝑡) for all users 𝑢 that
corresponds to tweeting frequency for series 𝑆𝑢𝑧 . One can learn the model parameters
by MLE learning on data log-likelihood.
35
To account the dynamic nature of tweet time series, Hawkes Process is fitted
multiple times on a sliding time window 𝑊 (length 𝑊𝑙) through time. For each tweet
𝑒𝑛, we have its corresponding causal influence mapping 𝑒𝑐𝑎𝑢𝑛 :
𝑒𝑐𝑎𝑢𝑛 =1
𝑊𝑙
∑︁𝑡:𝑡∈𝑊
∑︁𝑢′
𝜆𝑢′𝑒𝑐𝑛(𝑡) (3.2)
essentially accounting user influence averaged over all time windows where 𝑡 ∈ 𝑊 .
3.7 Burst Characterization and Data Exploration
3.7.1 Burst Characterization
Given the extracted bursts, and the semantic and temporal-causal mapping of the
tweets, we now compute the two measures of bursts characteristics.
Semantic Coherence
The first measure is semantic coherence. The intuition is that if users participate in
similar sub-topic discussion, the pairwise semantic similarity among tweets should be
high. Additionally, if many people participate in the same sub-topic, then it is likely
to have wider variability in content expression. Specifically, for burst ℬ𝑆𝑧𝑡𝑥𝑡𝑦 , we have:
𝑆𝐶ℬ𝑆𝑧𝑡𝑥𝑡𝑦
=1
𝑍* 𝐴𝑣𝑔(𝑚𝑚𝑚) * 𝐸𝑛𝑡(𝑚𝑚𝑚)
𝑤ℎ𝑒𝑟𝑒 𝑚𝑚𝑚 = [𝑒−|𝑒𝑠𝑒𝑚𝑗 −𝑒𝑠𝑒𝑚𝑖 |𝐹 , 𝑗 ∈ 𝑘𝑁𝑁(𝑖) ∀𝑒𝑖 ∈ 𝑆 𝑠.𝑡. 𝑒𝑡𝑖 ∈ [𝑡𝑥, 𝑡𝑦]]
(3.3)
where 𝑍 is the normalizing constant. Basically, for each tweet 𝑒𝑖 in the burst, we
first compute the average of the semantic distances between 𝑒𝑖 and its top-k nearest
neighbors (which are tweets by other users). This results in an array, 𝑚𝑚𝑚. To compute
semantic coherence, the average (𝐴𝑣𝑔) and entropy (𝐸𝑛𝑡) of 𝑚𝑚𝑚 are computed.
36
Causal Influence
Causal influence aims to measure temporal-causal activity level within a burst. Using
the temporal-causal mapping of the tweets, we have:
𝐶𝐼ℬ𝑆𝑧𝑡𝑥𝑡𝑦
=1
𝑍* 𝐴𝑣𝑔(𝑔𝑔𝑔)
𝑤ℎ𝑒𝑟𝑒 𝑔𝑔𝑔 = [𝑒𝑐𝑎𝑢𝑖 * 𝜑(𝑒𝑡𝑖 − 𝑒𝑝𝑖 ) ∀𝑒𝑖 ∈ 𝑆 𝑠.𝑡. 𝑒𝑡𝑖 ∈ [𝑡𝑥, 𝑡𝑦]]
(3.4)
The basic intuition is that 𝑒𝑐𝑎𝑢𝑖 computes the level of potential causal influence of
users 𝑢′ on the tweet 𝑒𝑖. 𝜑(𝑒𝑡𝑖 − 𝑒𝑝𝑖 ) computes the wait time between tweet 𝑒𝑖 and
when the user last tweeted.
Applying the Two Measures for Characterizing Bursts
In the later chapters, we will show that by linearly combining the two measures for
a burst, one can develop a classifier for identifying responsive tweet bursts. Also, we
will show that mapping the bursts along the two dimensions can reveal interesting
ways different users generally respond to exogenous events.
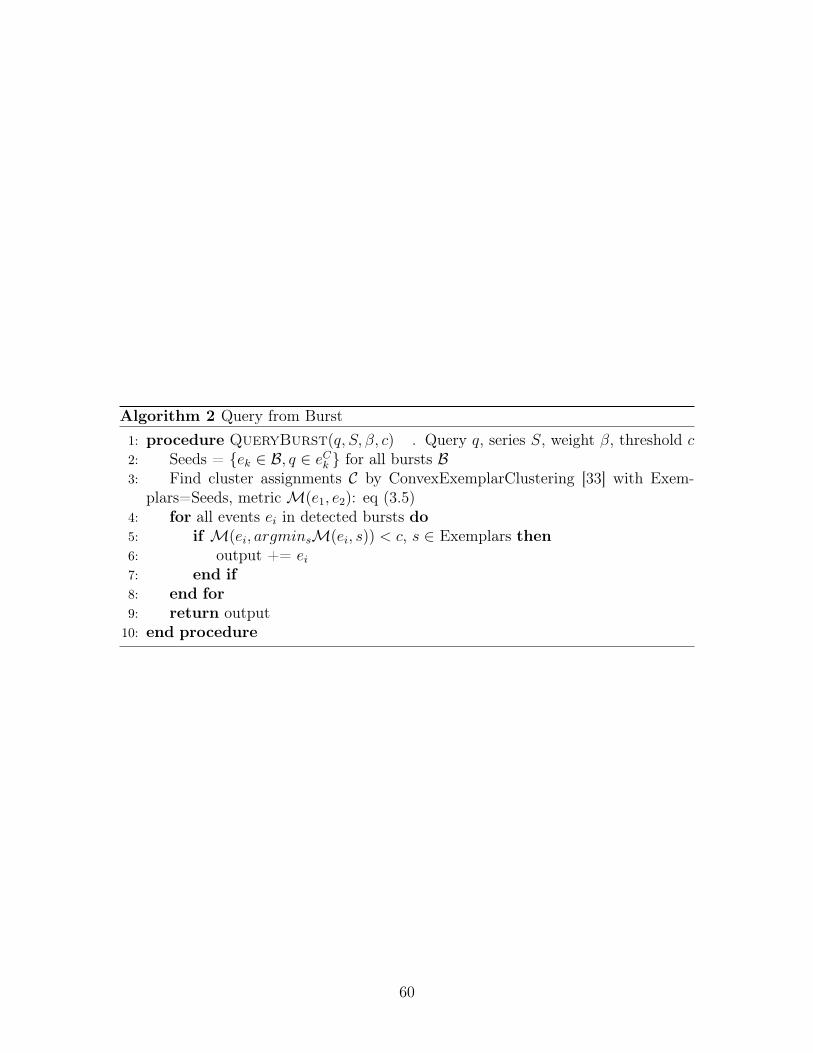
3.7.2 Querying from the Bursts
As the system churns raw tweet series and outputs the detected bursts that are
mapped along the two measures, we also want to be able to search the bursts accord-
ing to some queries of interest. Naïve query pattern matching may fail to retrieve
semantically and temporally similar tweets that do not contain the query terms. We
apply a simple two-step procedure. First, we extract a set of seed tweets based on
those with matching query terms. Second, we apply an exemplar-based clustering
algorithm [33] using the seed tweets as examples. The similarity between pairs of
events for clustering algorithm is computed as
𝑠𝑖𝑚(𝑒1, 𝑒2) = 𝑒−(𝛽*|𝑒𝑠𝑒𝑚1 −𝑒𝑠𝑒𝑚2 |𝐹+(1−𝛽)*|𝑒𝑐𝑎𝑢1 −𝑒𝑐𝑎𝑢2 |𝐹 ) (3.5)
37
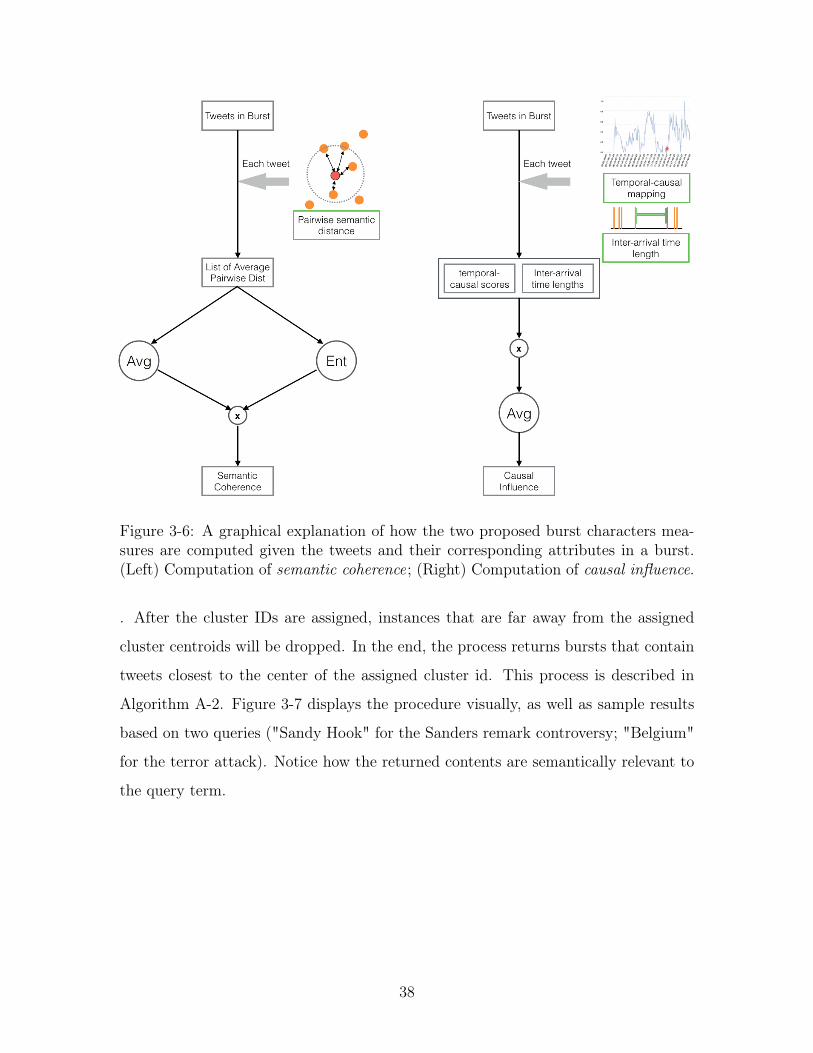
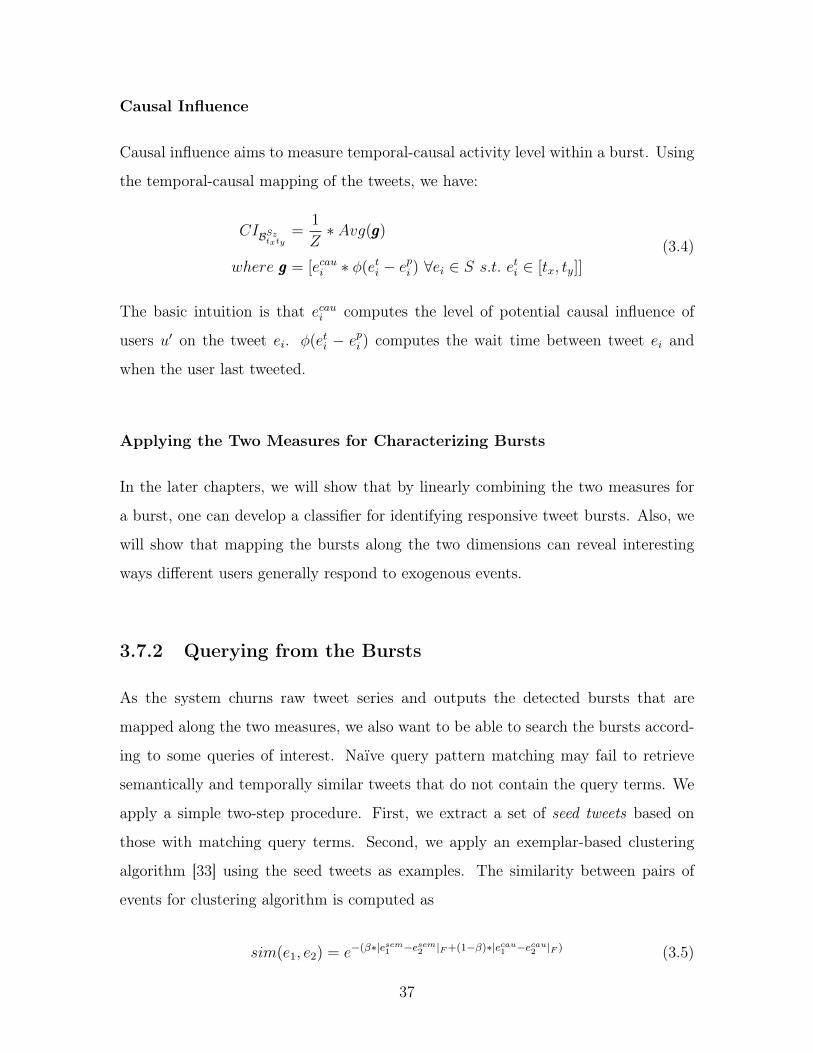
Figure 3-6: A graphical explanation of how the two proposed burst characters mea-sures are computed given the tweets and their corresponding attributes in a burst.(Left) Computation of semantic coherence; (Right) Computation of causal influence.
. After the cluster IDs are assigned, instances that are far away from the assigned
cluster centroids will be dropped. In the end, the process returns bursts that contain
tweets closest to the center of the assigned cluster id. This process is described in
Algorithm A-2. Figure 3-7 displays the procedure visually, as well as sample results
based on two queries ("Sandy Hook" for the Sanders remark controversy; "Belgium"
for the terror attack). Notice how the returned contents are semantically relevant to
the query term.
38
Figure 3-7: (Left) The schematic of the process to query tweet events based on thetwo measures; (Right) Two examples of returned tweets using the event-based queries.
39

40
Chapter 4
Evaluations
4.1 Datasets Description
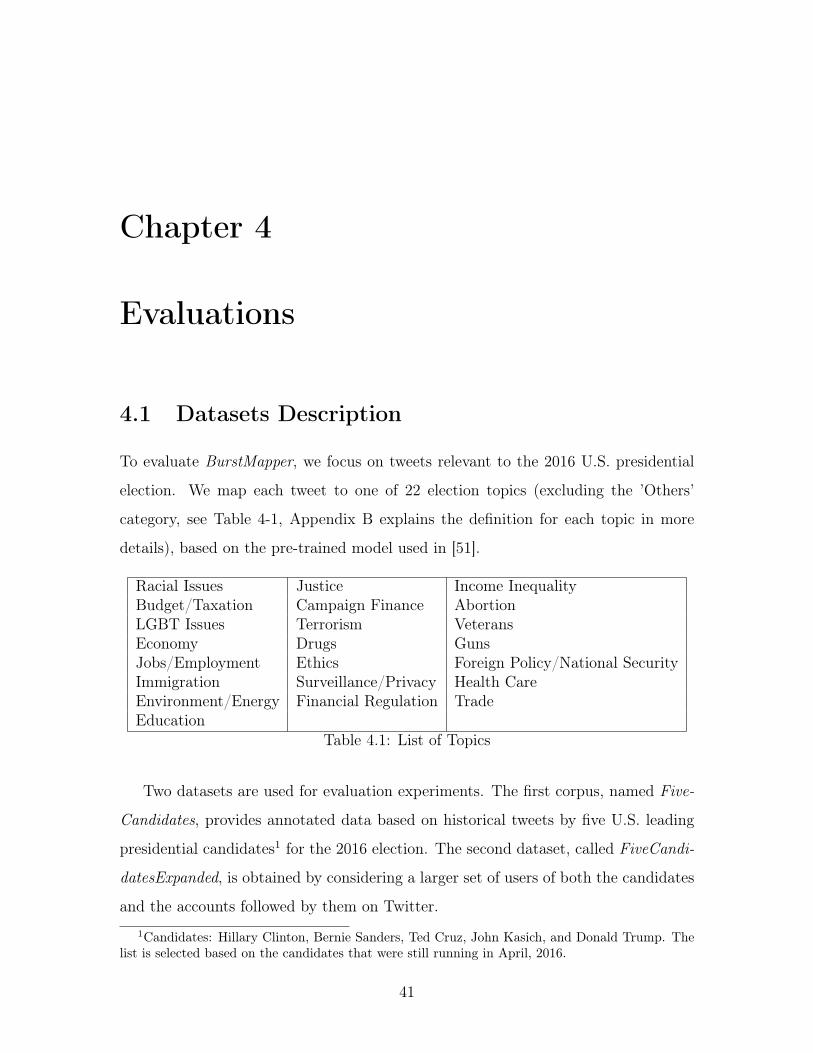
To evaluate BurstMapper, we focus on tweets relevant to the 2016 U.S. presidential
election. We map each tweet to one of 22 election topics (excluding the ’Others’
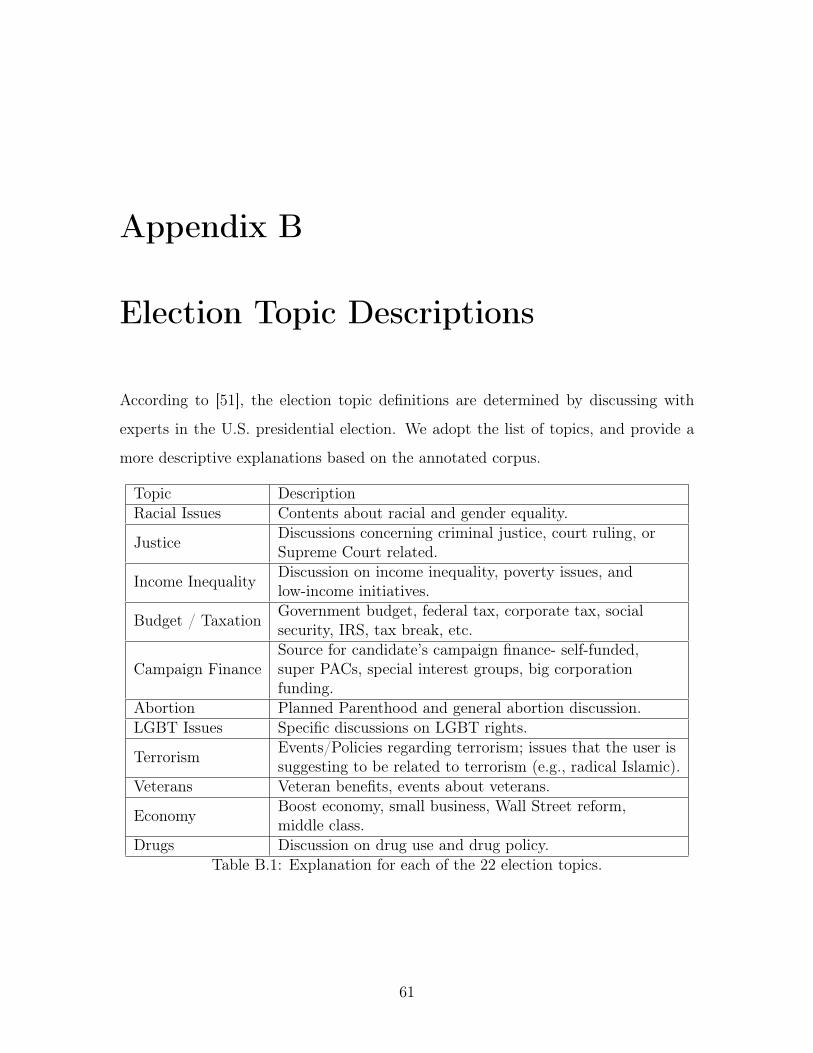
category, see Table 4-1, Appendix B explains the definition for each topic in more
details), based on the pre-trained model used in [51].
Racial Issues Justice Income InequalityBudget/Taxation Campaign Finance AbortionLGBT Issues Terrorism VeteransEconomy Drugs GunsJobs/Employment Ethics Foreign Policy/National SecurityImmigration Surveillance/Privacy Health CareEnvironment/Energy Financial Regulation TradeEducation
Table 4.1: List of Topics
Two datasets are used for evaluation experiments. The first corpus, named Five-
Candidates, provides annotated data based on historical tweets by five U.S. leading
presidential candidates1 for the 2016 election. The second dataset, called FiveCandi-
datesExpanded, is obtained by considering a larger set of users of both the candidates
and the accounts followed by them on Twitter.
1Candidates: Hillary Clinton, Bernie Sanders, Ted Cruz, John Kasich, and Donald Trump. Thelist is selected based on the candidates that were still running in April, 2016.
41
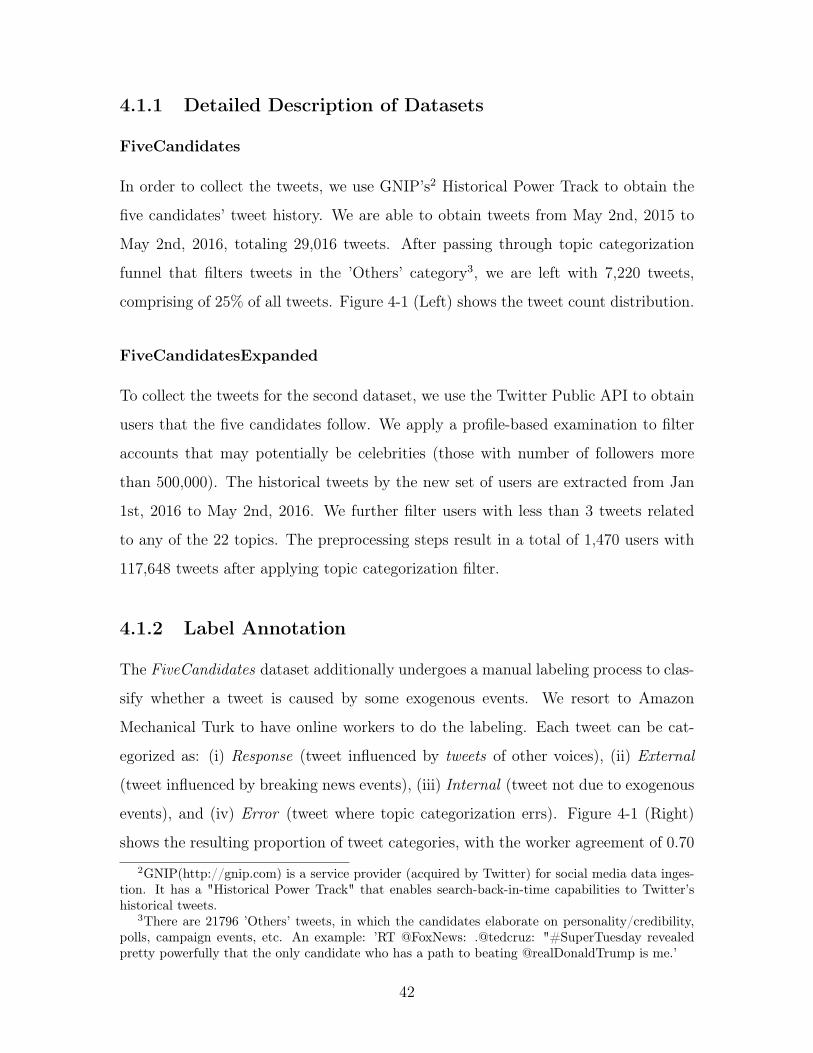
4.1.1 Detailed Description of Datasets
FiveCandidates
In order to collect the tweets, we use GNIP’s2 Historical Power Track to obtain the
five candidates’ tweet history. We are able to obtain tweets from May 2nd, 2015 to
May 2nd, 2016, totaling 29,016 tweets. After passing through topic categorization
funnel that filters tweets in the ’Others’ category3, we are left with 7,220 tweets,
comprising of 25% of all tweets. Figure 4-1 (Left) shows the tweet count distribution.
FiveCandidatesExpanded
To collect the tweets for the second dataset, we use the Twitter Public API to obtain
users that the five candidates follow. We apply a profile-based examination to filter
accounts that may potentially be celebrities (those with number of followers more
than 500,000). The historical tweets by the new set of users are extracted from Jan
1st, 2016 to May 2nd, 2016. We further filter users with less than 3 tweets related
to any of the 22 topics. The preprocessing steps result in a total of 1,470 users with
117,648 tweets after applying topic categorization filter.
4.1.2 Label Annotation
The FiveCandidates dataset additionally undergoes a manual labeling process to clas-
sify whether a tweet is caused by some exogenous events. We resort to Amazon
Mechanical Turk to have online workers to do the labeling. Each tweet can be cat-
egorized as: (i) Response (tweet influenced by tweets of other voices), (ii) External
(tweet influenced by breaking news events), (iii) Internal (tweet not due to exogenous
events), and (iv) Error (tweet where topic categorization errs). Figure 4-1 (Right)
shows the resulting proportion of tweet categories, with the worker agreement of 0.70
2GNIP(http://gnip.com) is a service provider (acquired by Twitter) for social media data inges-tion. It has a "Historical Power Track" that enables search-back-in-time capabilities to Twitter’shistorical tweets.
3There are 21796 ’Others’ tweets, in which the candidates elaborate on personality/credibility,polls, campaign events, etc. An example: ’RT @FoxNews: .@tedcruz: "#SuperTuesday revealedpretty powerfully that the only candidate who has a path to beating @realDonaldTrump is me.’
42
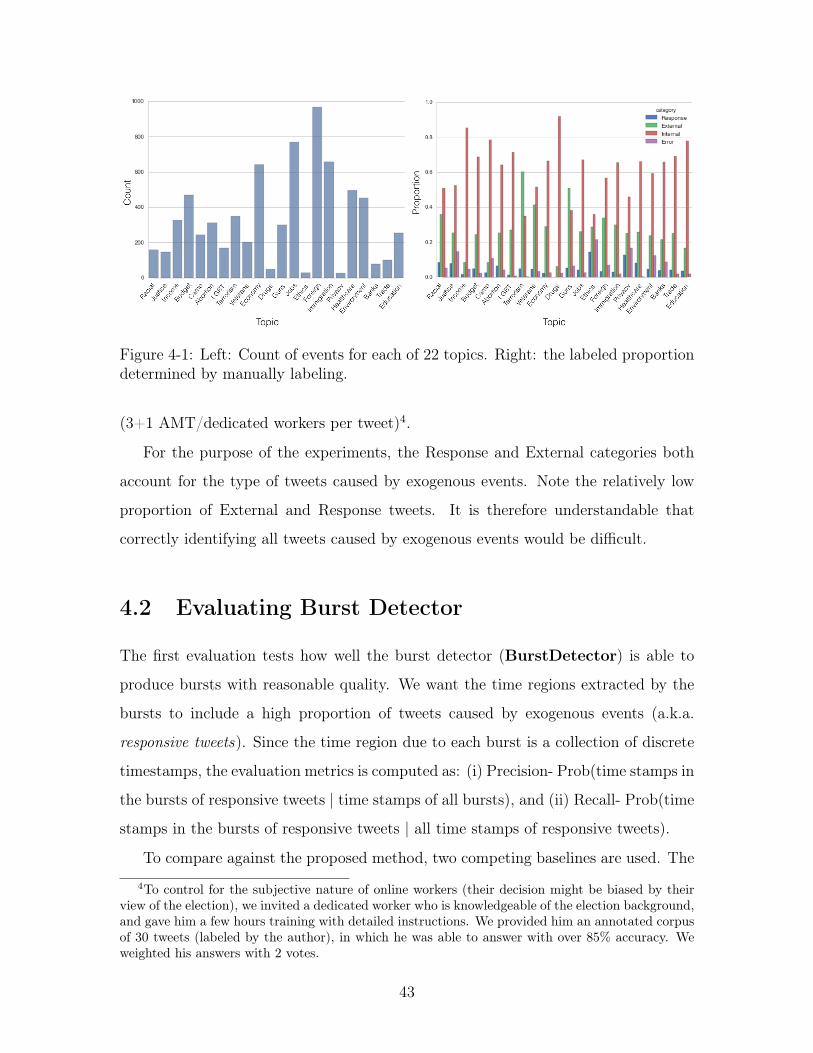
Figure 4-1: Left: Count of events for each of 22 topics. Right: the labeled proportiondetermined by manually labeling.
(3+1 AMT/dedicated workers per tweet)4.
For the purpose of the experiments, the Response and External categories both
account for the type of tweets caused by exogenous events. Note the relatively low
proportion of External and Response tweets. It is therefore understandable that
correctly identifying all tweets caused by exogenous events would be difficult.
4.2 Evaluating Burst Detector
The first evaluation tests how well the burst detector (BurstDetector) is able to
produce bursts with reasonable quality. We want the time regions extracted by the
bursts to include a high proportion of tweets caused by exogenous events (a.k.a.
responsive tweets). Since the time region due to each burst is a collection of discrete
timestamps, the evaluation metrics is computed as: (i) Precision- Prob(time stamps in
the bursts of responsive tweets | time stamps of all bursts), and (ii) Recall- Prob(time
stamps in the bursts of responsive tweets | all time stamps of responsive tweets).
To compare against the proposed method, two competing baselines are used. The
4To control for the subjective nature of online workers (their decision might be biased by theirview of the election), we invited a dedicated worker who is knowledgeable of the election background,and gave him a few hours training with detailed instructions. We provided him an annotated corpusof 30 tweets (labeled by the author), in which he was able to answer with over 85% accuracy. Weweighted his answers with 2 votes.
43
Figure 4-2: Left: Precision of correctly identify the timestamp containing externallystimulated tweets. Right: Recall plot.
first baseline (Sigmoid) applies a thresholded sigmoid activation to the tweet volume
time series. The transformed series is passed to a greedy grouping procedure for
producing bursts. The second baseline (Kleinberg)[30] is a commonly used method
that captures burst as state transitions describing the tweet time series.
Figure 4-2 shows the results. The result shows that while naïve baselines such
as Sigmoid has high recall, in exchange, the precision drops significantly. Klein-
berg is not comparable in performance due to the model assumption that the events
are homogeneous. On Twitter, tweets are due to a complex set of influence. The
assumption behind Kleinberg’s detection method wouldn’t suit this dataset well.
4.3 Evaluating Measures for Burst Characterization
The next phase of evaluation applies the measures to classify whether a burst is
responsive (for such bursts, let the default minimum number of responsive tweets
within a burst be 1). The goal of this evaluation is to test whether the proposed
measures for characterizing burst are in fact informative.
To get some inspiration, we run a logistic regression test to see how semantic
coherence and causal influence measures, as well as feature interactions, are significant
in characterizing bursts. For the regression test, the response variable holds the value
44
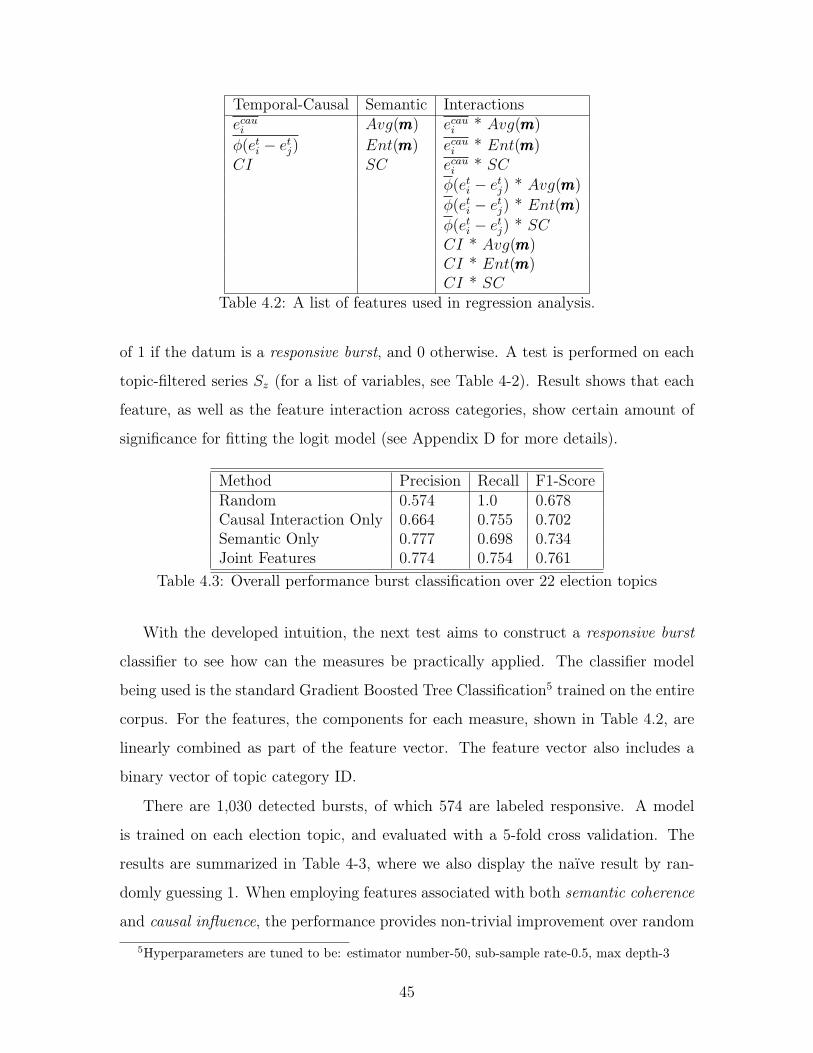
Temporal-Causal Semantic Interactions𝑒𝑐𝑎𝑢𝑖 𝐴𝑣𝑔(𝑚𝑚𝑚) 𝑒𝑐𝑎𝑢𝑖 * 𝐴𝑣𝑔(𝑚𝑚𝑚)
𝜑(𝑒𝑡𝑖 − 𝑒𝑡𝑗) 𝐸𝑛𝑡(𝑚𝑚𝑚) 𝑒𝑐𝑎𝑢𝑖 * 𝐸𝑛𝑡(𝑚𝑚𝑚)𝐶𝐼 𝑆𝐶 𝑒𝑐𝑎𝑢𝑖 * 𝑆𝐶
𝜑(𝑒𝑡𝑖 − 𝑒𝑡𝑗) * 𝐴𝑣𝑔(𝑚𝑚𝑚)
𝜑(𝑒𝑡𝑖 − 𝑒𝑡𝑗) * 𝐸𝑛𝑡(𝑚𝑚𝑚)
𝜑(𝑒𝑡𝑖 − 𝑒𝑡𝑗) * 𝑆𝐶𝐶𝐼 * 𝐴𝑣𝑔(𝑚𝑚𝑚)𝐶𝐼 * 𝐸𝑛𝑡(𝑚𝑚𝑚)𝐶𝐼 * 𝑆𝐶
Table 4.2: A list of features used in regression analysis.
of 1 if the datum is a responsive burst, and 0 otherwise. A test is performed on each
topic-filtered series 𝑆𝑧 (for a list of variables, see Table 4-2). Result shows that each
feature, as well as the feature interaction across categories, show certain amount of
significance for fitting the logit model (see Appendix D for more details).
Method Precision Recall F1-ScoreRandom 0.574 1.0 0.678Causal Interaction Only 0.664 0.755 0.702Semantic Only 0.777 0.698 0.734Joint Features 0.774 0.754 0.761
Table 4.3: Overall performance burst classification over 22 election topics
With the developed intuition, the next test aims to construct a responsive burst
classifier to see how can the measures be practically applied. The classifier model
being used is the standard Gradient Boosted Tree Classification5 trained on the entire
corpus. For the features, the components for each measure, shown in Table 4.2, are
linearly combined as part of the feature vector. The feature vector also includes a
binary vector of topic category ID.
There are 1,030 detected bursts, of which 574 are labeled responsive. A model
is trained on each election topic, and evaluated with a 5-fold cross validation. The
results are summarized in Table 4-3, where we also display the naïve result by ran-
domly guessing 1. When employing features associated with both semantic coherence
and causal influence, the performance provides non-trivial improvement over random
5Hyperparameters are tuned to be: estimator number-50, sub-sample rate-0.5, max depth-3
45
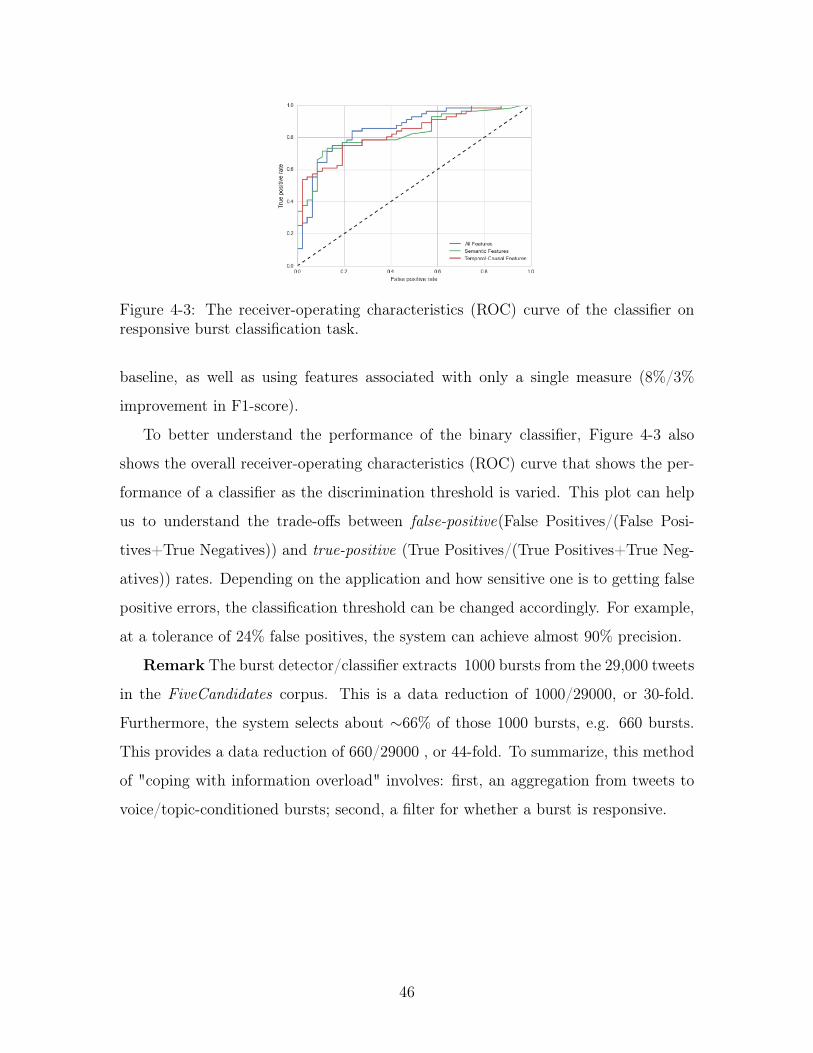
Figure 4-3: The receiver-operating characteristics (ROC) curve of the classifier onresponsive burst classification task.
baseline, as well as using features associated with only a single measure (8%/3%
improvement in F1-score).
To better understand the performance of the binary classifier, Figure 4-3 also
shows the overall receiver-operating characteristics (ROC) curve that shows the per-
formance of a classifier as the discrimination threshold is varied. This plot can help
us to understand the trade-offs between false-positive(False Positives/(False Posi-
tives+True Negatives)) and true-positive (True Positives/(True Positives+True Neg-
atives)) rates. Depending on the application and how sensitive one is to getting false
positive errors, the classification threshold can be changed accordingly. For example,
at a tolerance of 24% false positives, the system can achieve almost 90% precision.
Remark The burst detector/classifier extracts 1000 bursts from the 29,000 tweets
in the FiveCandidates corpus. This is a data reduction of 1000/29000, or 30-fold.
Furthermore, the system selects about ∼66% of those 1000 bursts, e.g. 660 bursts.
This provides a data reduction of 660/29000 , or 44-fold. To summarize, this method
of "coping with information overload" involves: first, an aggregation from tweets to
voice/topic-conditioned bursts; second, a filter for whether a burst is responsive.
46
Chapter 5
Data Explorations
In this chapter, we want to examine the datasets in more detail to see how using
the two measures to analyze burst can help reveal interesting ways users respond to
exogenous events. In particular, three case studies are presented:
∙ We examine FiveCandidates corpus in greater detail. The detected bursts are
mapped along the semantic coherence and causal influence measures to explore
how exogenous events drive each presidential candidate to tweet differently.
∙ Data exploration is further tested on the FiveCandidatesExpanded dataset. Here
we examine if the measures can reveal how certain groups of users may have a
higher level of semantic coherence and potential causal interactions.
∙ The last case study discusses how BurstMapper delivers useful findings not pro-
vided by analyzing tweets with only partial semantic information like hashtags,
URLs, etc.
5.1 Deeper Dive in FiveCandidates
Given the extracted bursts, a natural next step is to see how the bursts are charac-
terized along the two dimensions, semantic coherence and causal influence. We focus
particularly on candidate-level analysis to understand how a candidate becomes re-
sponsive to exogenous events.
47
For each burst, we compute the semantic coherence and causal influence measures.
Specifically, the measures are computed with respect to the tweets by the particular
candidate within a burst. We plot all bursts on a semantic coherence by causal
influence plane. The motivation is that some bursts are not necessarily both highly
semantically coherent and temporally causal, and it is thus interesting to explore
under what situations might bursts not have high values for both measures1. The
results are plotted in Figure 5-1.
We first examine the region with high semantic coherence and high causal influence
measures for a burst. Comparing the bursts between Hillary Clinton and Bernie
Sanders, observe how Sanders’ bursts are mostly about addressing and attacking his
fellow candidates. On the other hand, Clinton focuses more on addressing supporters
and announcing policy plan when major breaking news events occur.
Upon closer inspections on Sanders’ tweets, he has been relatively vocal on topics
where other candidates tweet less frequently about (e.g., financial regulation, worker
inequality, etc). Also, many of his tweets are not burst-related, but rather part of
frequent promotions of his own ideology. However, it turns out Sanders becomes tem-
porally responsive and semantically coherent on battleground topics to attack fellow
candidates. Therefore, in terms of responsiveness to exogenous events, Sanders is
actually more responsive than Clinton, where in contrast Clinton’s tweets are consid-
erably more composed and planned.
Now take a closer view at Clinton’s tweets. When Clinton is temporally respon-
sive and semantically coherent, she is usually responding to some important news
events or controversial issues. One can observe that Clinton takes advantage of the
opportunities to make speeches or plan announcements. Since these announcements
take time to prepare, they often make Clinton slightly lag behind her competitors.
To summarize, analyzing along the semantic coherence and causal influence measures
can reveal different ways the candidates respond to exogenous events. We find that
mapping the bursts along the two dimensions also tell us how other candidates re-
1Temporal-causality measures if relative tweet timing between voices follows a consistent pattern.It is possible to have a burst not having strong temporal-causality between voices, but still be’responsive’ (e.g., a terror attack, which happens only a few times in a year, is such an example).
48
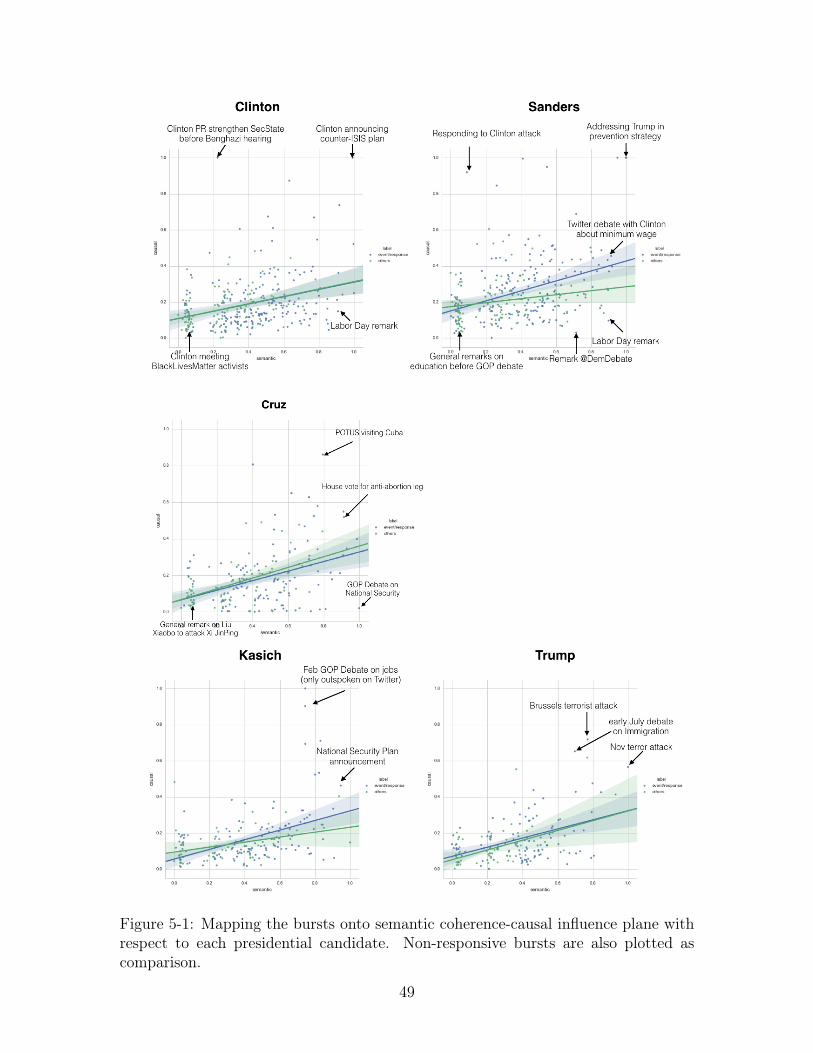
Figure 5-1: Mapping the bursts onto semantic coherence-causal influence plane withrespect to each presidential candidate. Non-responsive bursts are also plotted ascomparison.
49
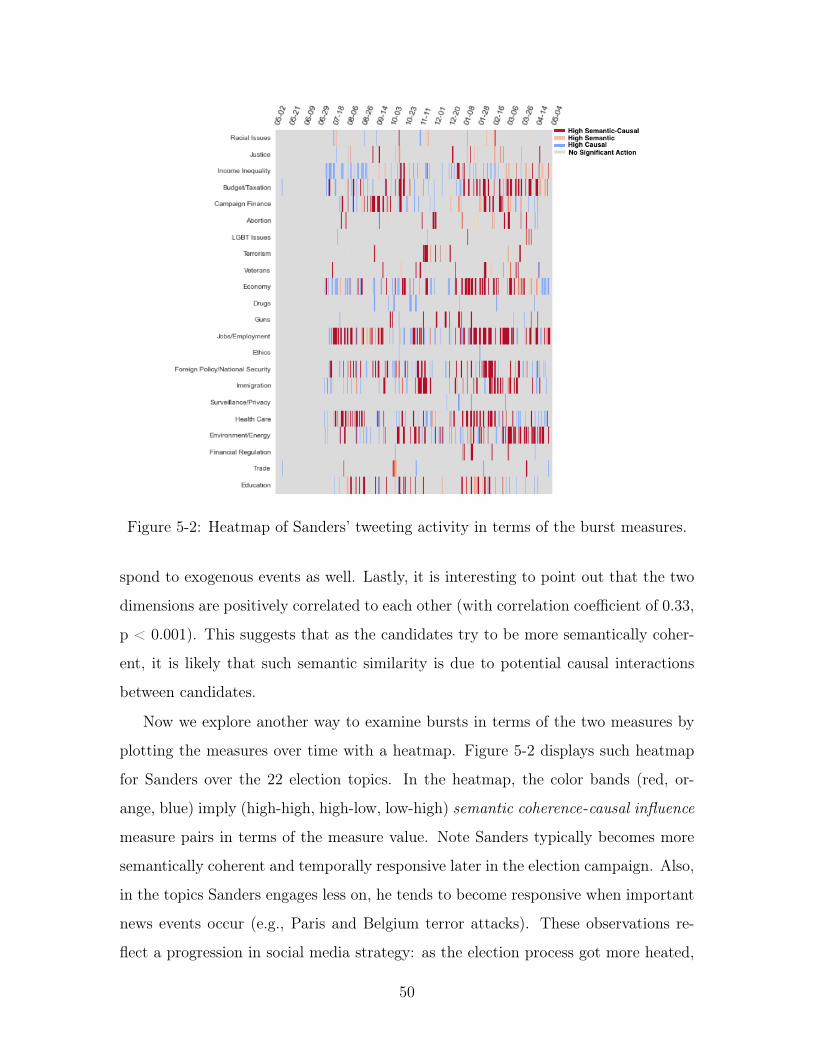
Figure 5-2: Heatmap of Sanders’ tweeting activity in terms of the burst measures.
spond to exogenous events as well. Lastly, it is interesting to point out that the two
dimensions are positively correlated to each other (with correlation coefficient of 0.33,
p < 0.001). This suggests that as the candidates try to be more semantically coher-
ent, it is likely that such semantic similarity is due to potential causal interactions
between candidates.
Now we explore another way to examine bursts in terms of the two measures by
plotting the measures over time with a heatmap. Figure 5-2 displays such heatmap
for Sanders over the 22 election topics. In the heatmap, the color bands (red, or-
ange, blue) imply (high-high, high-low, low-high) semantic coherence-causal influence
measure pairs in terms of the measure value. Note Sanders typically becomes more
semantically coherent and temporally responsive later in the election campaign. Also,
in the topics Sanders engages less on, he tends to become responsive when important
news events occur (e.g., Paris and Belgium terror attacks). These observations re-
flect a progression in social media strategy: as the election process got more heated,
50
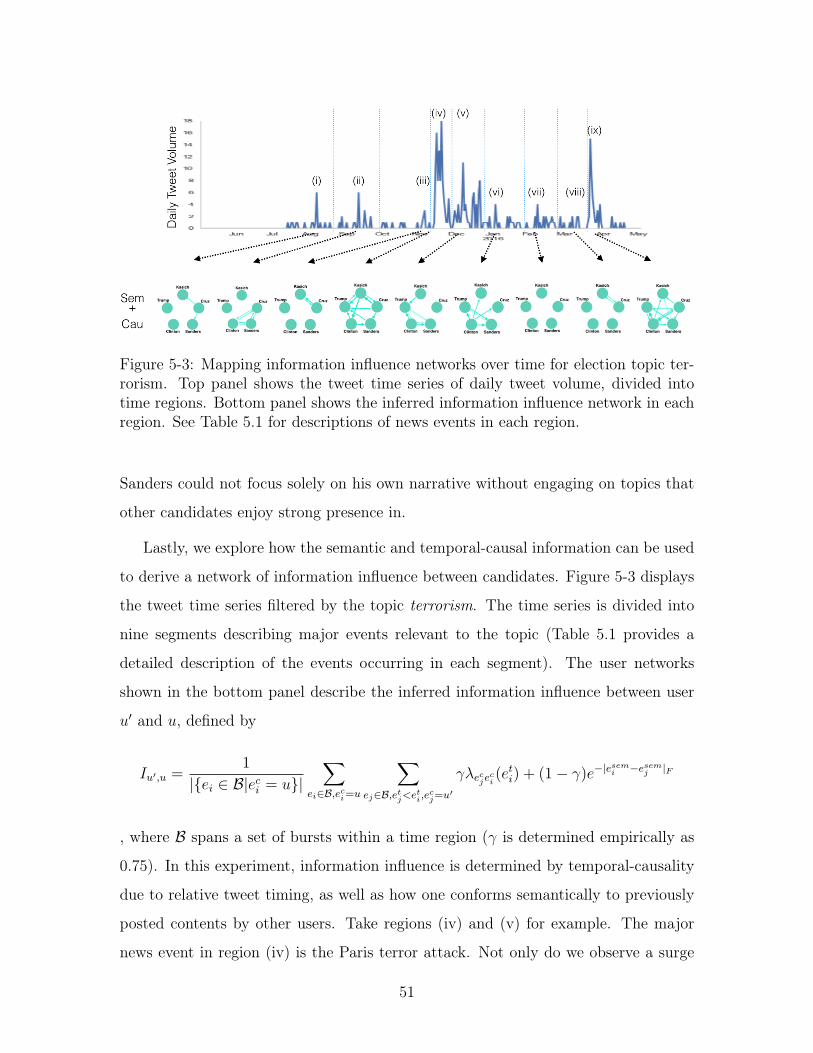
Figure 5-3: Mapping information influence networks over time for election topic ter-rorism. Top panel shows the tweet time series of daily tweet volume, divided intotime regions. Bottom panel shows the inferred information influence network in eachregion. See Table 5.1 for descriptions of news events in each region.
Sanders could not focus solely on his own narrative without engaging on topics that
other candidates enjoy strong presence in.
Lastly, we explore how the semantic and temporal-causal information can be used
to derive a network of information influence between candidates. Figure 5-3 displays
the tweet time series filtered by the topic terrorism. The time series is divided into
nine segments describing major events relevant to the topic (Table 5.1 provides a
detailed description of the events occurring in each segment). The user networks
shown in the bottom panel describe the inferred information influence between user
𝑢′ and 𝑢, defined by
𝐼𝑢′,𝑢 =1
|{𝑒𝑖 ∈ ℬ|𝑒𝑐𝑖 = 𝑢}|∑︁
𝑒𝑖∈ℬ,𝑒𝑐𝑖=𝑢
∑︁𝑒𝑗∈ℬ,𝑒𝑡𝑗<𝑒𝑡𝑖,𝑒
𝑐𝑗=𝑢′
𝛾𝜆𝑒𝑐𝑗𝑒𝑐𝑖(𝑒𝑡𝑖) + (1 − 𝛾)𝑒−|𝑒𝑠𝑒𝑚𝑖 −𝑒𝑠𝑒𝑚𝑗 |𝐹
, where ℬ spans a set of bursts within a time region (𝛾 is determined empirically as
0.75). In this experiment, information influence is determined by temporal-causality
due to relative tweet timing, as well as how one conforms semantically to previously
posted contents by other users. Take regions (iv) and (v) for example. The major
news event in region (iv) is the Paris terror attack. Not only do we observe a surge
51
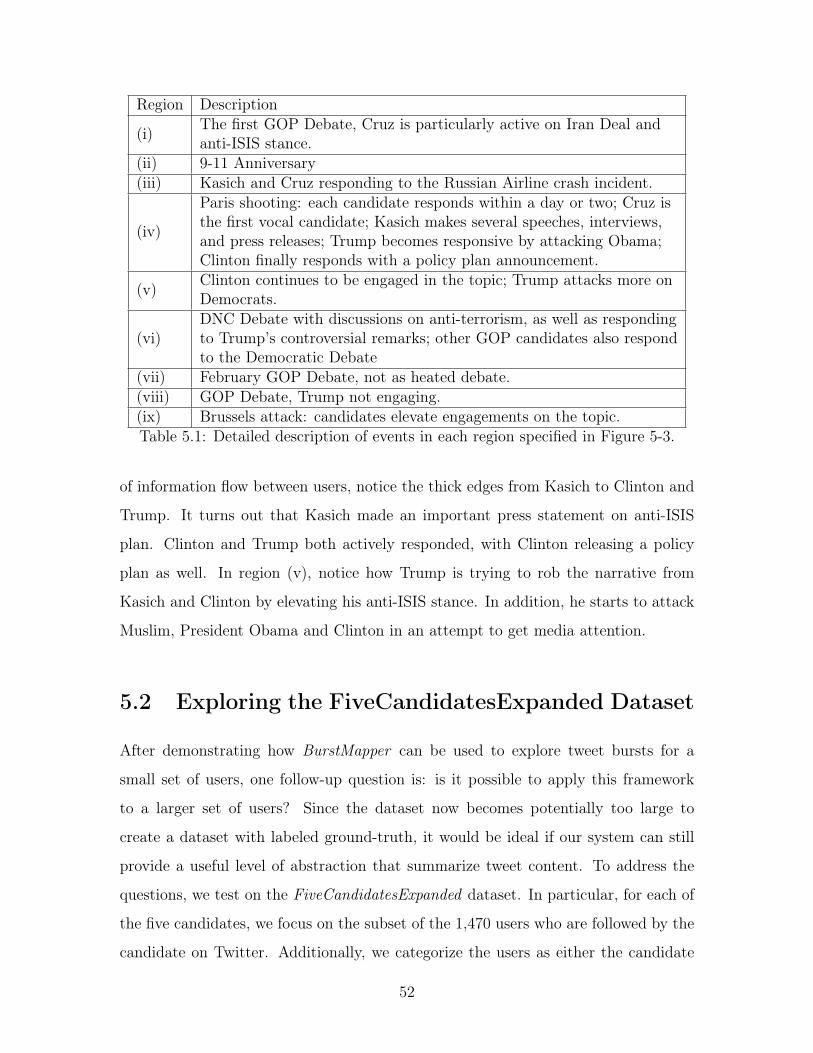
Region Description
(i) The first GOP Debate, Cruz is particularly active on Iran Deal andanti-ISIS stance.
(ii) 9-11 Anniversary(iii) Kasich and Cruz responding to the Russian Airline crash incident.
(iv)
Paris shooting: each candidate responds within a day or two; Cruz isthe first vocal candidate; Kasich makes several speeches, interviews,and press releases; Trump becomes responsive by attacking Obama;Clinton finally responds with a policy plan announcement.
(v) Clinton continues to be engaged in the topic; Trump attacks more onDemocrats.
(vi)DNC Debate with discussions on anti-terrorism, as well as respondingto Trump’s controversial remarks; other GOP candidates also respondto the Democratic Debate
(vii) February GOP Debate, not as heated debate.(viii) GOP Debate, Trump not engaging.(ix) Brussels attack: candidates elevate engagements on the topic.Table 5.1: Detailed description of events in each region specified in Figure 5-3.
of information flow between users, notice the thick edges from Kasich to Clinton and
Trump. It turns out that Kasich made an important press statement on anti-ISIS
plan. Clinton and Trump both actively responded, with Clinton releasing a policy
plan as well. In region (v), notice how Trump is trying to rob the narrative from
Kasich and Clinton by elevating his anti-ISIS stance. In addition, he starts to attack
Muslim, President Obama and Clinton in an attempt to get media attention.
5.2 Exploring the FiveCandidatesExpanded Dataset
After demonstrating how BurstMapper can be used to explore tweet bursts for a
small set of users, one follow-up question is: is it possible to apply this framework
to a larger set of users? Since the dataset now becomes potentially too large to
create a dataset with labeled ground-truth, it would be ideal if our system can still
provide a useful level of abstraction that summarize tweet content. To address the
questions, we test on the FiveCandidatesExpanded dataset. In particular, for each of
the five candidates, we focus on the subset of the 1,470 users who are followed by the
candidate on Twitter. Additionally, we categorize the users as either the candidate
52
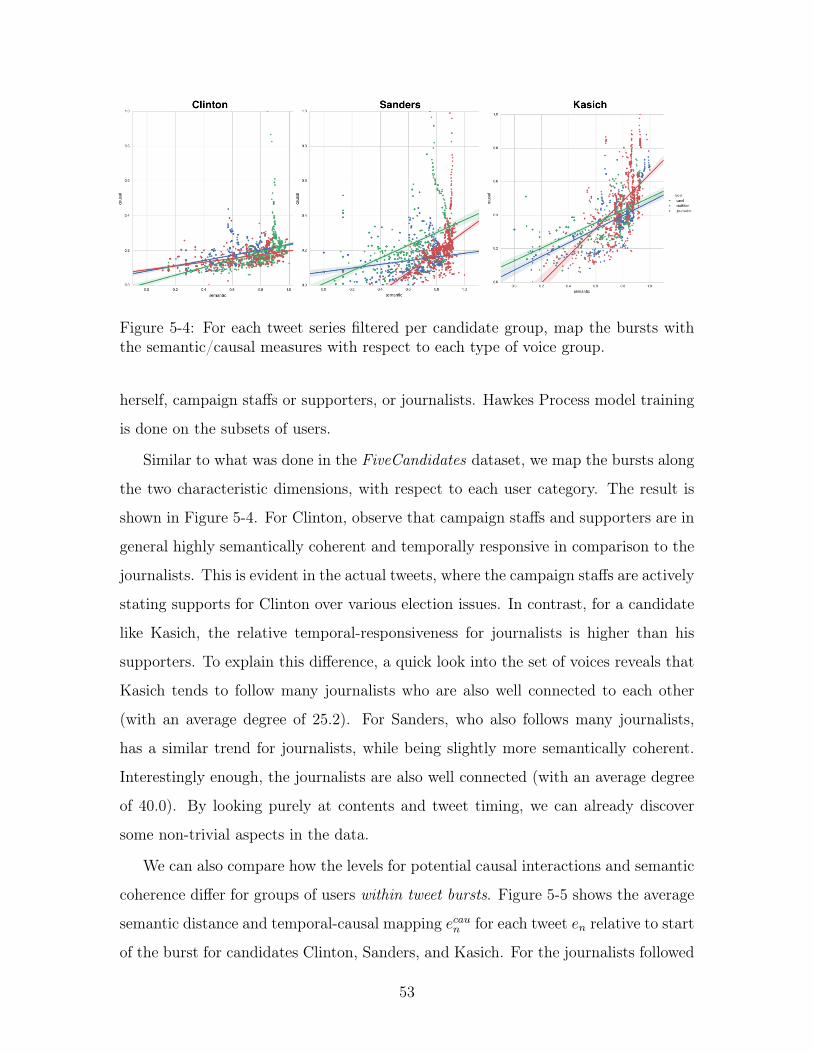
Figure 5-4: For each tweet series filtered per candidate group, map the bursts withthe semantic/causal measures with respect to each type of voice group.
herself, campaign staffs or supporters, or journalists. Hawkes Process model training
is done on the subsets of users.
Similar to what was done in the FiveCandidates dataset, we map the bursts along
the two characteristic dimensions, with respect to each user category. The result is
shown in Figure 5-4. For Clinton, observe that campaign staffs and supporters are in
general highly semantically coherent and temporally responsive in comparison to the
journalists. This is evident in the actual tweets, where the campaign staffs are actively
stating supports for Clinton over various election issues. In contrast, for a candidate
like Kasich, the relative temporal-responsiveness for journalists is higher than his
supporters. To explain this difference, a quick look into the set of voices reveals that
Kasich tends to follow many journalists who are also well connected to each other
(with an average degree of 25.2). For Sanders, who also follows many journalists,
has a similar trend for journalists, while being slightly more semantically coherent.
Interestingly enough, the journalists are also well connected (with an average degree
of 40.0). By looking purely at contents and tweet timing, we can already discover
some non-trivial aspects in the data.
We can also compare how the levels for potential causal interactions and semantic
coherence differ for groups of users within tweet bursts. Figure 5-5 shows the average
semantic distance and temporal-causal mapping 𝑒𝑐𝑎𝑢𝑛 for each tweet 𝑒𝑛 relative to start
of the burst for candidates Clinton, Sanders, and Kasich. For the journalists followed
53
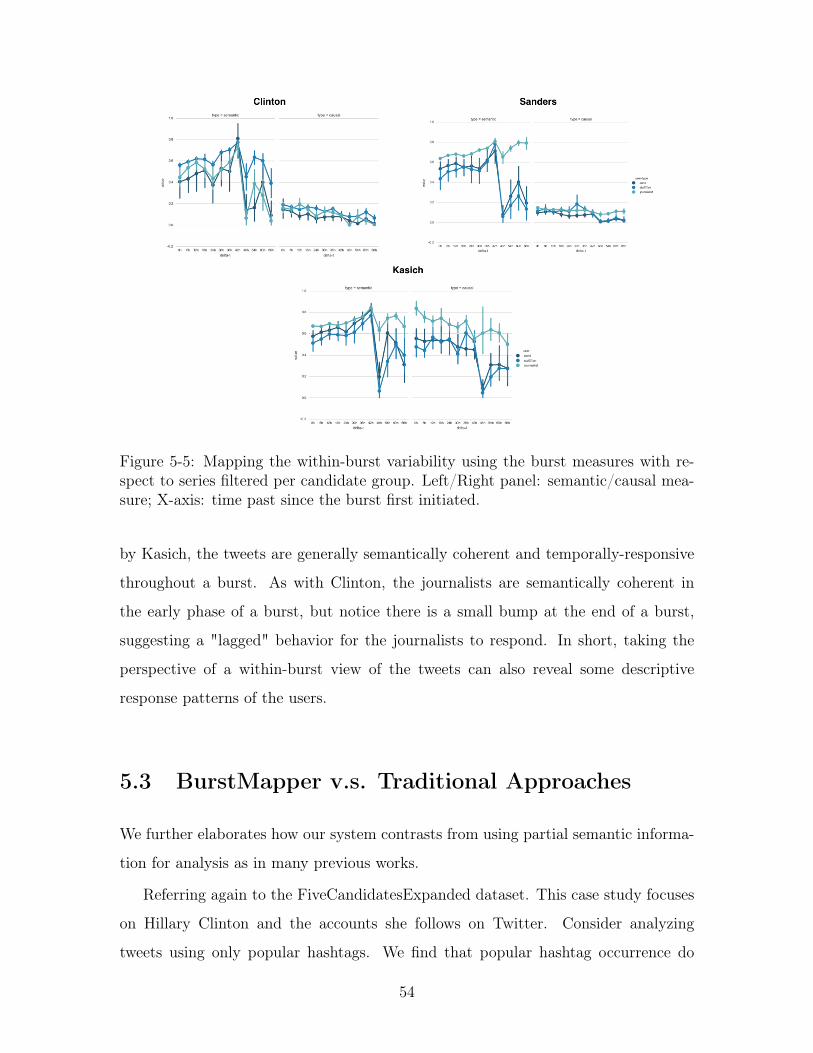
Figure 5-5: Mapping the within-burst variability using the burst measures with re-spect to series filtered per candidate group. Left/Right panel: semantic/causal mea-sure; X-axis: time past since the burst first initiated.
by Kasich, the tweets are generally semantically coherent and temporally-responsive
throughout a burst. As with Clinton, the journalists are semantically coherent in
the early phase of a burst, but notice there is a small bump at the end of a burst,
suggesting a "lagged" behavior for the journalists to respond. In short, taking the
perspective of a within-burst view of the tweets can also reveal some descriptive
response patterns of the users.
5.3 BurstMapper v.s. Traditional Approaches
We further elaborates how our system contrasts from using partial semantic informa-
tion for analysis as in many previous works.
Referring again to the FiveCandidatesExpanded dataset. This case study focuses
on Hillary Clinton and the accounts she follows on Twitter. Consider analyzing
tweets using only popular hashtags. We find that popular hashtag occurrence do
54
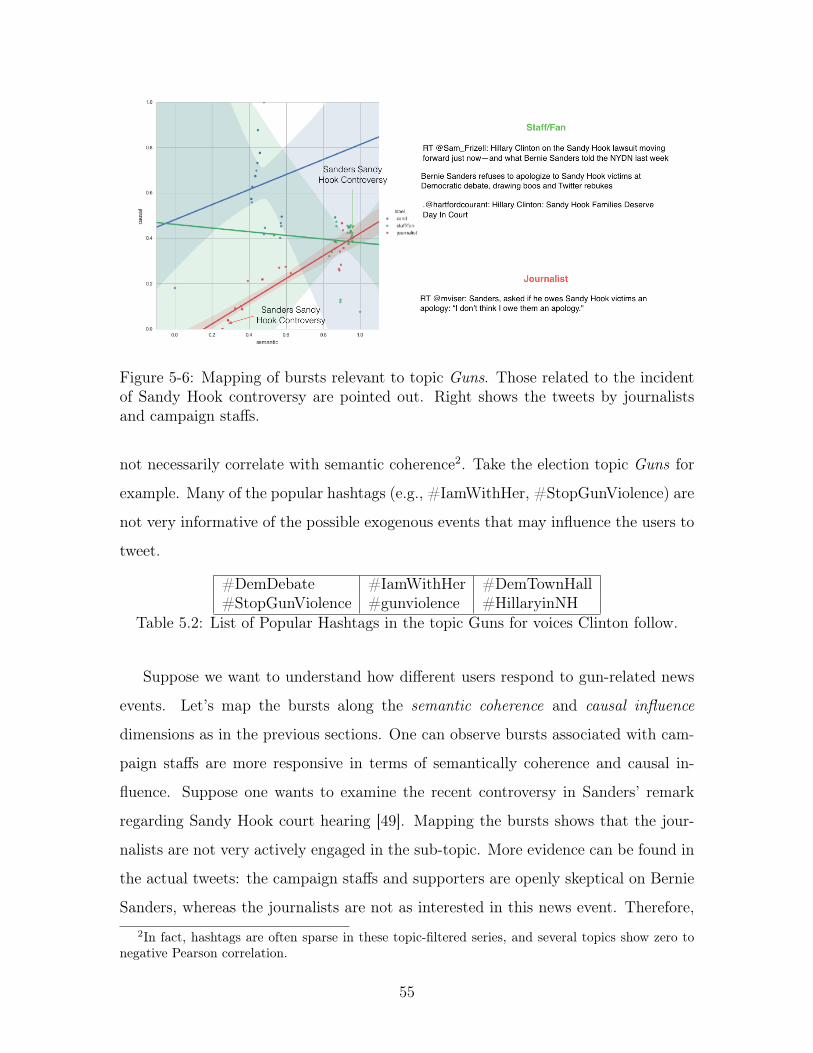
Figure 5-6: Mapping of bursts relevant to topic Guns. Those related to the incidentof Sandy Hook controversy are pointed out. Right shows the tweets by journalistsand campaign staffs.
not necessarily correlate with semantic coherence2. Take the election topic Guns for
example. Many of the popular hashtags (e.g., #IamWithHer, #StopGunViolence) are
not very informative of the possible exogenous events that may influence the users to
tweet.
#DemDebate #IamWithHer #DemTownHall#StopGunViolence #gunviolence #HillaryinNH
Table 5.2: List of Popular Hashtags in the topic Guns for voices Clinton follow.
Suppose we want to understand how different users respond to gun-related news
events. Let’s map the bursts along the semantic coherence and causal influence
dimensions as in the previous sections. One can observe bursts associated with cam-
paign staffs are more responsive in terms of semantically coherence and causal in-
fluence. Suppose one wants to examine the recent controversy in Sanders’ remark
regarding Sandy Hook court hearing [49]. Mapping the bursts shows that the jour-
nalists are not very actively engaged in the sub-topic. More evidence can be found in
the actual tweets: the campaign staffs and supporters are openly skeptical on Bernie
Sanders, whereas the journalists are not as interested in this news event. Therefore,2In fact, hashtags are often sparse in these topic-filtered series, and several topics show zero to
negative Pearson correlation.
55
by using a more complete information of the semantics as well as potential causal in-
teractions, BurstMapper delivers a more expressive tool to perform data exploration
on tweets.
56
Chapter 6
Conclusion
This thesis proposes the BurstMapper system to identify and characterize tweet bursts
to analyze the roles exogenous events play in driving tweets. The system is evalu-
ated on an annotated corpus, with each component showing reasonably good results.
BurstMapper is further demonstrated to be able to characterize bursts in ways help-
ing interested individuals to understand how different users respond differently in the
face of exogenous events. The system is shown to provide informative results even
in larger-scale datasets. We believe the proposed methodology can bring forth a new
way for analyzing tweet communications.
More General Use of BurstMapper
While the evaluations are done specifically on election-related tweets, expanding
BurstMapper to different tweet topics should be a straightforward change of topic
classification model. In fact, the model architecture in [51] can be directly applied to
data in the new topic domain with appropriate training data.
Limitation and Future Work
The proposed system is not without limitations. While the system seems promising to
apply to different topic domains, it is not clear if the residual-based burst detection
would work very well when facing an even larger-scale tweet series. It seems that
57
concepts such as Dirichlet Hawkes Process [14] or models that consider latent state
spaces with content generation should be able to tackle data with higher complexity
data. A natural next step is to try to consider using a point process generative model
to improve the currently proposed burst detection algorithm.
It is also not yet clear to what extent can Tweet2Vec model be generalized. A
more detailed experiment is warranted to see how do finer-grained tweet expressions
map to the latent semantic embedding space. Having a more detailed understanding
of the model can be helpful to enhance the current framework to deal with semantic
similarity with respect to forms of expressions (e.g., language formality, allusion,
sarcasm).
Lastly, while Hawkes Process can acts as a proxy to measure temporal-causality
between pairs of voices, it does not strictly follow the Granger causality by blocking
out potential confounding factors. Therefore, certain degree of noise is inevitable.
Also, in terms of computation, naïve Hawkes Process doesn’t scale with many voices,
as the learning/simulation worst-case complexities are 𝑂(|𝑉 |2𝑇𝑡𝑟𝑎𝑖𝑛)/𝑂(|𝑉 |2𝑇𝑠𝑖𝑚). It
might not scale to millions of voices without special treatment. Knowing that so-
cial network connection is sparse, it is natural to explore how to approximate the
parameter learning by exploiting the sparse network structure.
58
Appendix A
Algorithms
Algorithm 1 Burst Detection Algorithm1: procedure FindBursts(𝜏𝑆·
𝑧,𝑓𝑐,𝑓𝑐, 𝑤𝑙𝑒𝑛, 𝑏𝑚𝑎𝑥)
2: Given per-topic time series 𝜏𝑆·𝑧, frequency threshold 𝑓𝑐, residual cutoff thresh-
old 𝑓𝑐, window length 𝑤𝑙𝑒𝑛, max burst length 𝑏𝑚𝑎𝑥
3: Let 𝑆 ′ = 𝑆·𝑧
4: Set Butterworth filter 𝐺(𝜔|𝑓𝑐)5: Compute the transformed signal 𝜏𝑆′ using frequency response 𝐺(𝜔|𝑓𝑐)6: Compute residual 𝑟𝑆′ = 𝜏𝑆′ − 𝜏𝑆′
7: Set 𝑟𝑆′ [𝑟𝑆′ < 𝑟𝑐] = 08: return GreedyGroup(𝑟𝑆′)9: end procedure
10: function GreedyGroup(𝑟𝑆′ , 𝑤𝑙𝑒𝑛, 𝑏𝑚𝑎𝑥) bursts = [], start position pos = 0,tmp = []
11: while pos+𝑤𝑙𝑒𝑛 < |𝑟𝑆′| do ◁ Slide window through 𝑟𝑆′
12: if∑︀
𝑝𝑜𝑠:𝑝𝑜𝑠+𝑤𝑙𝑒𝑛𝑟𝑆′ > 0 and |𝑡𝑚𝑝| < 𝑏𝑚𝑎𝑥 then
13: 𝑗 = 𝑚𝑎𝑥({𝑘|∀𝑘 ∈ [0, |𝑟𝑆′ |] 𝑠.𝑡. 𝑟𝑆′(𝑡) > 0})14: tmp = tmp + [pos, pos+j+1]15: pos += j+116: else17: bursts = bursts + tmp18: tmp = []19: end if20: pos = pos + 121: end while22: return bursts23: end function
59
Algorithm 2 Query from Burst1: procedure QueryBurst(𝑞, 𝑆, 𝛽, 𝑐) ◁ Query 𝑞, series 𝑆, weight 𝛽, threshold 𝑐2: Seeds = {𝑒𝑘 ∈ ℬ, 𝑞 ∈ 𝑒𝐶𝑘 } for all bursts ℬ3: Find cluster assignments 𝒞 by ConvexExemplarClustering [33] with Exem-
plars=Seeds, metric ℳ(𝑒1, 𝑒2): eq (3.5)4: for all events 𝑒𝑖 in detected bursts do5: if ℳ(𝑒𝑖, 𝑎𝑟𝑔𝑚𝑖𝑛𝑠ℳ(𝑒𝑖, 𝑠)) < 𝑐, 𝑠 ∈ Exemplars then6: output += 𝑒𝑖7: end if8: end for9: return output
10: end procedure
60
Appendix B
Election Topic Descriptions
According to [51], the election topic definitions are determined by discussing with
experts in the U.S. presidential election. We adopt the list of topics, and provide a
more descriptive explanations based on the annotated corpus.
Topic DescriptionRacial Issues Contents about racial and gender equality.
Justice Discussions concerning criminal justice, court ruling, orSupreme Court related.
Income Inequality Discussion on income inequality, poverty issues, andlow-income initiatives.
Budget / Taxation Government budget, federal tax, corporate tax, socialsecurity, IRS, tax break, etc.
Campaign FinanceSource for candidate’s campaign finance- self-funded,super PACs, special interest groups, big corporationfunding.
Abortion Planned Parenthood and general abortion discussion.LGBT Issues Specific discussions on LGBT rights.
Terrorism Events/Policies regarding terrorism; issues that the user issuggesting to be related to terrorism (e.g., radical Islamic).
Veterans Veteran benefits, events about veterans.
Economy Boost economy, small business, Wall Street reform,middle class.
Drugs Discussion on drug use and drug policy.Table B.1: Explanation for each of the 22 election topics.
61
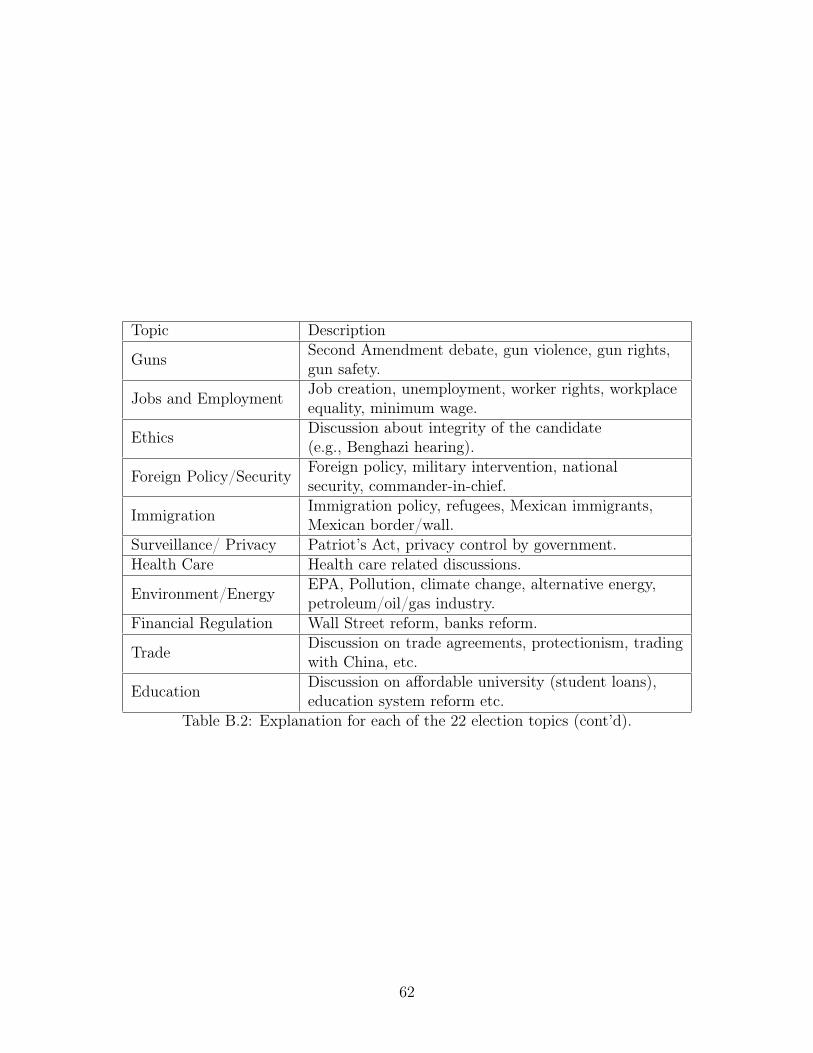
Topic Description
Guns Second Amendment debate, gun violence, gun rights,gun safety.
Jobs and Employment Job creation, unemployment, worker rights, workplaceequality, minimum wage.
Ethics Discussion about integrity of the candidate(e.g., Benghazi hearing).
Foreign Policy/Security Foreign policy, military intervention, nationalsecurity, commander-in-chief.
Immigration Immigration policy, refugees, Mexican immigrants,Mexican border/wall.
Surveillance/ Privacy Patriot’s Act, privacy control by government.Health Care Health care related discussions.
Environment/Energy EPA, Pollution, climate change, alternative energy,petroleum/oil/gas industry.
Financial Regulation Wall Street reform, banks reform.
Trade Discussion on trade agreements, protectionism, tradingwith China, etc.
Education Discussion on affordable university (student loans),education system reform etc.
Table B.2: Explanation for each of the 22 election topics (cont’d).
62
Appendix C
Data Annotation Details
We described in more detail the data labeling process. Recall that we task the workers
to label each tweet into any of the following categories: (External) a tweet due to a
recent newsworthy event (e.g., breaking news, major campaign events); (Response)
a tweet content-wise influenced by, or triggered to respond to the preceding tweets
by others; (Internal) a tweet not due to specific outside influence (news events or
tweets by others); (Error) content not relevant to the given topic label.
Each labeling instance is given the particular tweet, with content, author, topic
category, tweet time, and when author previously tweeted. Lastly, tweets that precede
in time are also presented.
One difficulty is that it is hard to reliably know if one tweet is causally related
to another tweet. Therefore, we specify a set of rules for the workers to follow.
Additional suggestions are given to reduce false positives. See instruction template
to see for more details the actual cases for each label category. Figure B-1 shows
an actual example, notice some styling was done to highlight the importance of the
tweet he/she is tasked to label. B-2 to B-3 shows the question template.
63
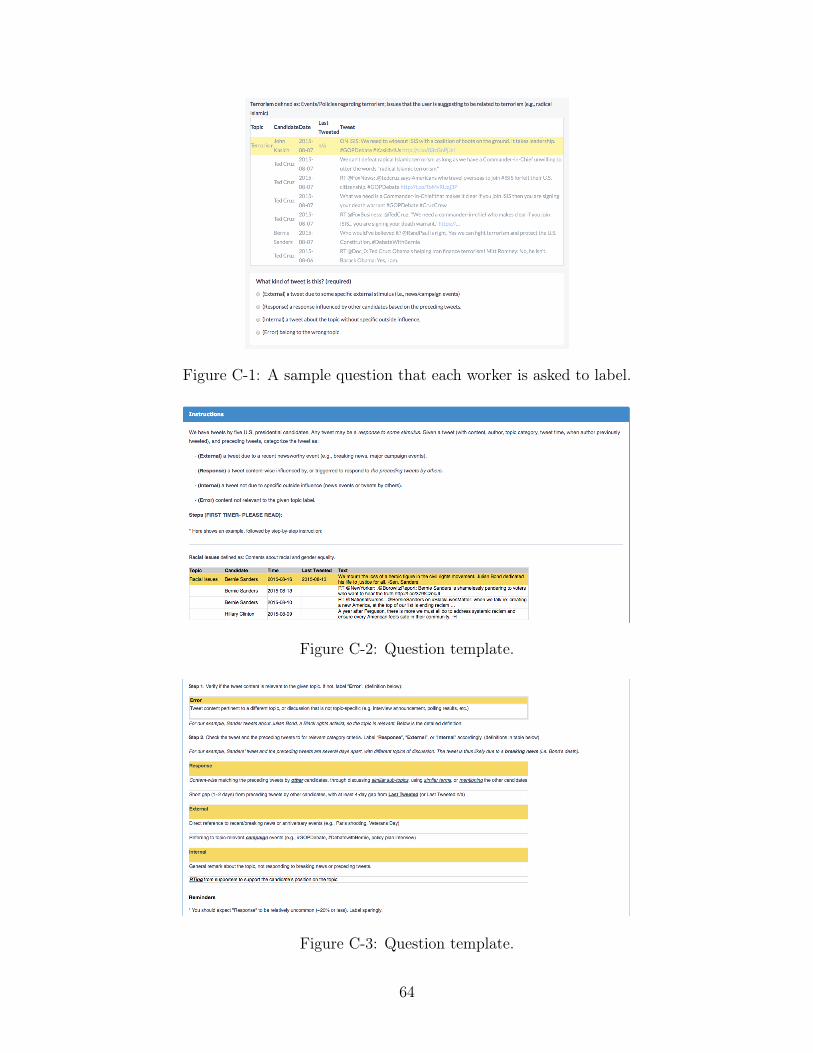
Figure C-1: A sample question that each worker is asked to label.
Figure C-2: Question template.
Figure C-3: Question template.
64
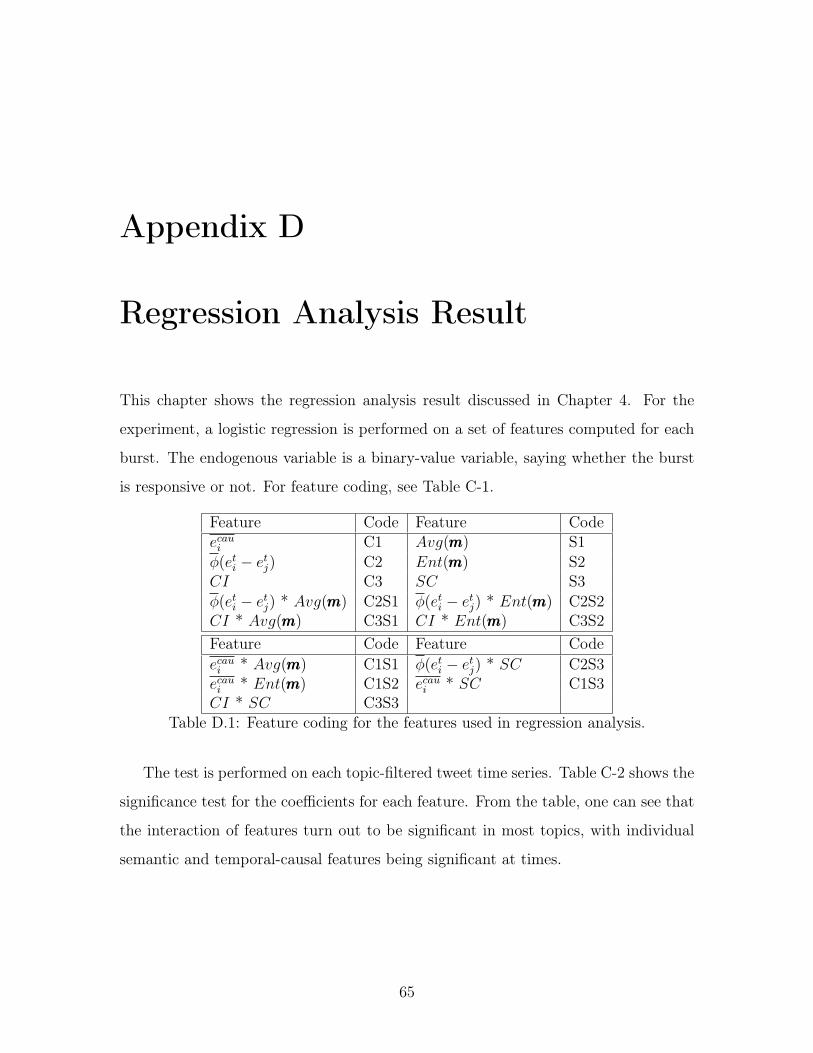
Appendix D
Regression Analysis Result
This chapter shows the regression analysis result discussed in Chapter 4. For the
experiment, a logistic regression is performed on a set of features computed for each
burst. The endogenous variable is a binary-value variable, saying whether the burst
is responsive or not. For feature coding, see Table C-1.
Feature Code Feature Code𝑒𝑐𝑎𝑢𝑖 C1 𝐴𝑣𝑔(𝑚𝑚𝑚) S1𝜑(𝑒𝑡𝑖 − 𝑒𝑡𝑗) C2 𝐸𝑛𝑡(𝑚𝑚𝑚) S2𝐶𝐼 C3 𝑆𝐶 S3𝜑(𝑒𝑡𝑖 − 𝑒𝑡𝑗) * 𝐴𝑣𝑔(𝑚𝑚𝑚) C2S1 𝜑(𝑒𝑡𝑖 − 𝑒𝑡𝑗) * 𝐸𝑛𝑡(𝑚𝑚𝑚) C2S2𝐶𝐼 * 𝐴𝑣𝑔(𝑚𝑚𝑚) C3S1 𝐶𝐼 * 𝐸𝑛𝑡(𝑚𝑚𝑚) C3S2Feature Code Feature Code𝑒𝑐𝑎𝑢𝑖 * 𝐴𝑣𝑔(𝑚𝑚𝑚) C1S1 𝜑(𝑒𝑡𝑖 − 𝑒𝑡𝑗) * 𝑆𝐶 C2S3𝑒𝑐𝑎𝑢𝑖 * 𝐸𝑛𝑡(𝑚𝑚𝑚) C1S2 𝑒𝑐𝑎𝑢𝑖 * 𝑆𝐶 C1S3𝐶𝐼 * 𝑆𝐶 C3S3
Table D.1: Feature coding for the features used in regression analysis.
The test is performed on each topic-filtered tweet time series. Table C-2 shows the
significance test for the coefficients for each feature. From the table, one can see that
the interaction of features turn out to be significant in most topics, with individual
semantic and temporal-causal features being significant at times.
65
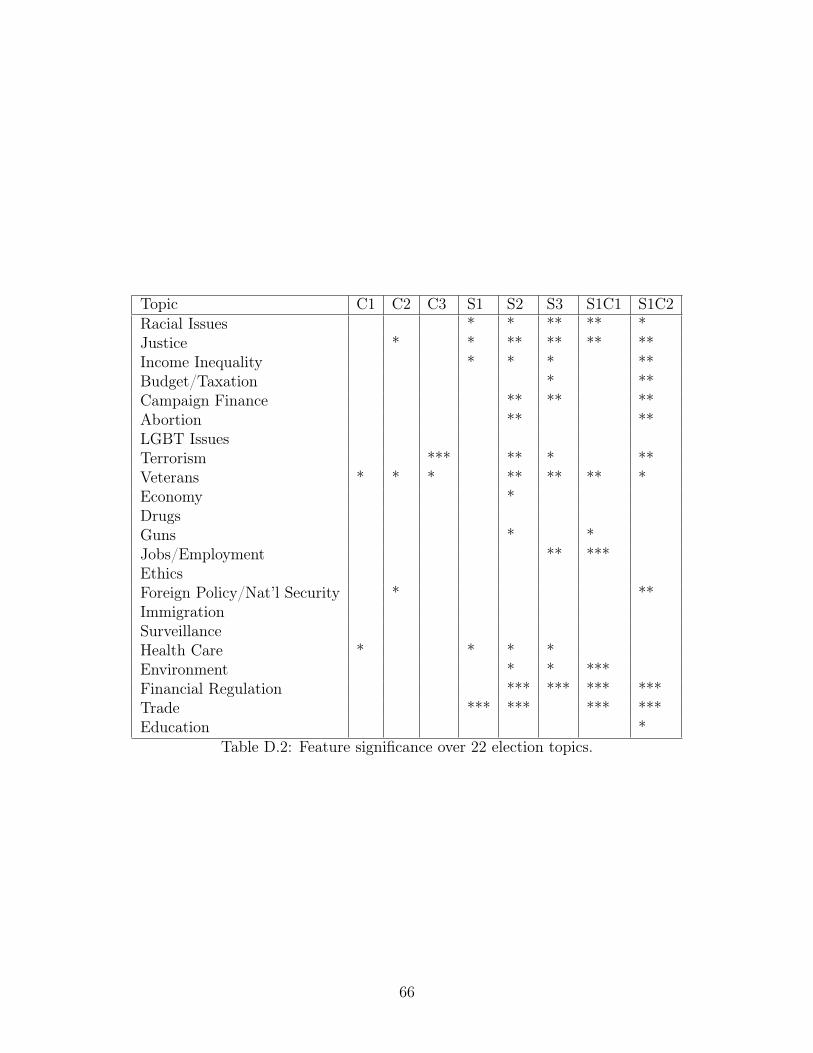
Topic C1 C2 C3 S1 S2 S3 S1C1 S1C2Racial Issues * * ** ** *Justice * * ** ** ** **Income Inequality * * * **Budget/Taxation * **Campaign Finance ** ** **Abortion ** **LGBT IssuesTerrorism *** ** * **Veterans * * * ** ** ** *Economy *DrugsGuns * *Jobs/Employment ** ***EthicsForeign Policy/Nat’l Security * **ImmigrationSurveillanceHealth Care * * * *Environment * * ***Financial Regulation *** *** *** ***Trade *** *** *** ***Education *
Table D.2: Feature significance over 22 election topics.
66
Topic S1C3 S2C1 S2C2 S2C3 S3C1 S3C2 S3C3Racial Issues * *** *** *** *** *** ***Justice ** *** ** ** *** ** **Income Inequality *** * ** *** ** ** ***Budget/Taxation * * * * ** **Campaign Finance * *** ** ** *** ** **Abortion ** * ** * *LGBT IssuesTerrorism *** ** * *** ** ** ***Veterans * *** ** *** *** ** ***Economy * ** * * * * **DrugsGuns ** *Jobs/Employment * * * * *** ***EthicsForeign Policy/Security * ** * ** *Immigration * ** ** ** * * *SurveillanceHealth Care ** ** ** ** ** **Environment ** ** ** ** * **Financial Regulation *** *** ***Trade *** *** *** *** ***Education * * ** * ** **
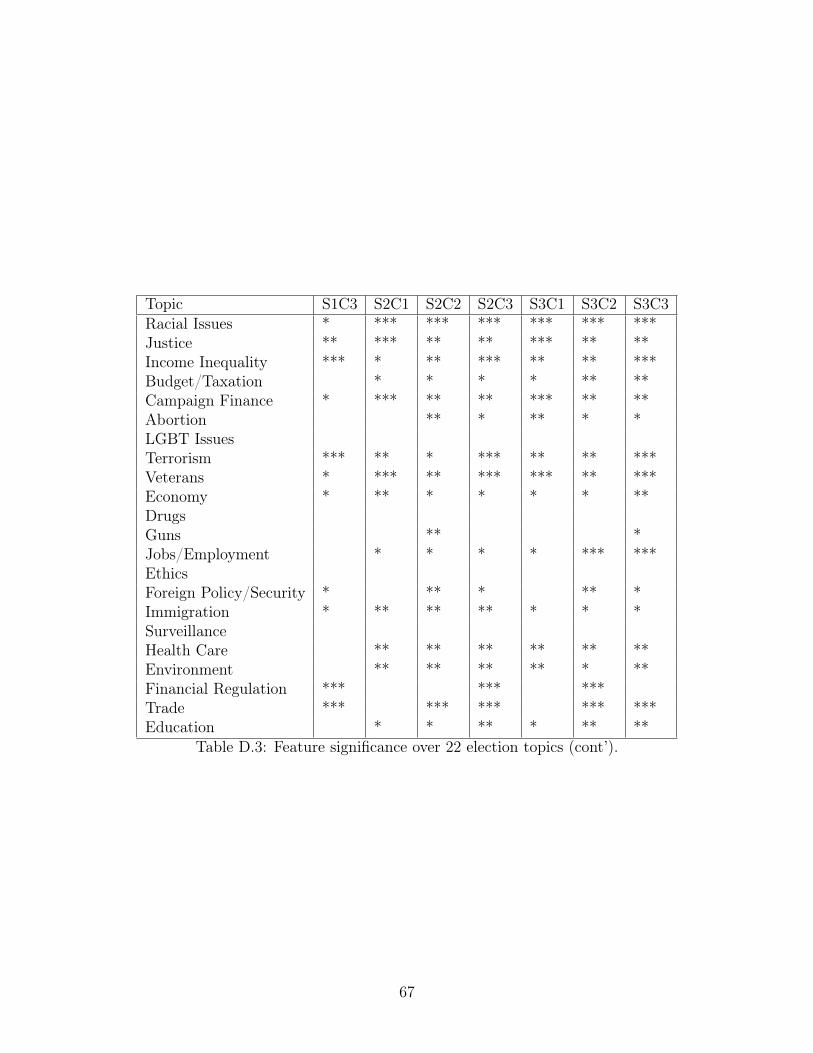
Table D.3: Feature significance over 22 election topics (cont’).
67

68
Bibliography
[1] Icek Ajzen and Martin Fishbein. Understanding attitudes and predicting socialbehaviour. Prentice-Hall, 1980.
[2] Eytan Bakshy, Jake M. Hofman, Winter A. Mason, and Duncan J. Watts. Ev-eryone’s an influencer: Quantifying influence on twitter. In Proceedings of theFourth ACM International Conference on Web Search and Data Mining, WSDM’11, pages 65–74, New York, NY, USA, 2011. ACM.
[3] Albert-Laszlo Barabasi. The origin of bursts and heavy tails in human dynamics.Nature, 435(7039):207–211, 2005.
[4] Charles Blundell, Katherine Heller, and Jeffery Beck. Modelling reciprocating re-lationships with hawkes processes. In Advances in Neural Information ProcessingSystems, 2012.
[5] Johan Bollen, Huina Mao, and Alberto Pepe. Modeling public mood and emo-tion: Twitter sentiment and socio-economic phenomena, 2011.
[6] Yi Chang, Xuanhui Wang, Qiaozhu Mei, and Yan Liu. Towards twitter contextsummarization with user influence models. In Proceedings of the Sixth ACMInternational Conference on Web Search and Data Mining, WSDM ’13, pages527–536, New York, NY, USA, 2013. ACM.
[7] Paul Chilton. Analyzing Political Discourse Theory and Practice. Routledge,Taylor and Francis Group, London and New York, 2004.
[8] Anqi Cui, Min Zhang, Yiqun Liu, Shaoping Ma, and Kuo Zhang. Discoverbreaking events with popular hashtags in twitter. In Proceedings of the 21st ACMInternational Conference on Information and Knowledge Management, CIKM’12, pages 1794–1798, New York, NY, USA, 2012. ACM.
[9] Cristian Danescu-Niculescu-Mizil, Lillian Lee, Bo Pang, and Jon Kleinberg.Echoes of power: Language effects and power differences in social interaction. InProceedings of WWW, pages 699–708, 2012.
[10] Dmitry Davidov, Oren Tsur, and Ari Rappoport. Enhanced sentiment learningusing twitter hashtags and smileys. In Proceedings of the 23rd InternationalConference on Computational Linguistics: Posters, COLING ’10, pages 241–249, Stroudsburg, PA, USA, 2010. Association for Computational Linguistics.
69
[11] Daniel Dennett and Deb Roy. How digital transparency became a force of nature.Scientific American, 312, 2015.
[12] Nicholas A. Diakopoulos and David A. Shamma. Characterizing debate perfor-mance via aggregated twitter sentiment. In Proceedings of the SIGCHI Confer-ence on Human Factors in Computing Systems, CHI ’10, pages 1195–1198, NewYork, NY, USA, 2010. ACM.
[13] Qiming Diao, Jing Jiang, Feida Zhu, and Ee-Peng Lim. Finding bursty topicsfrom microblogs. In Proceedings of the 50th Annual Meeting of the Associationfor Computational Linguistics: Long Papers - Volume 1, ACL ’12, pages 536–544,Stroudsburg, PA, USA, 2012. Association for Computational Linguistics.
[14] Nan Du, Mehrdad Farajtabar, Amr Ahmed, Alexander J. Smola, and Le Song.Dirichlet-hawkes processes with applications to clustering continuous-time doc-ument streams. In Proceedings of the 21th ACM SIGKDD International Confer-ence on Knowledge Discovery and Data Mining, KDD ’15, pages 219–228, NewYork, NY, USA, 2015. ACM.
[15] Nan Du, Le Song, Manuel Gomez-Rodriguez, and Hongyuan Zha. Scalable in-fluence estimation in continuous-time diffusion networks. In C. J. C. Burges,L. Bottou, M. Welling, Z. Ghahramani, and K. Q. Weinberger, editors, Ad-vances in Neural Information Processing Systems 26, pages 3147–3155. CurranAssociates, Inc., 2013.
[16] Nan Du, Le Song, Hyenkyun Woo, and Zha Hongyuan. Uncover topic-sensitiveinformation diffusion networks. In Proceedings of the 16th International Confer-ence on Artificial Intelligence and Statistics, 2013.
[17] Cyclonebiskit et al. November 2015 paris attacks. [Online; accessed 29-July-2016].
[18] L. Festinger. A Theory of Cognitive Dissonance. California: Stanford UniversityPress., 1957.
[19] S.M. Gerrish and Blei D.M. A language-based approach to measuring schol-arly impact. In Proceedings of the 26th International Conference on MachineLearning, 2010.
[20] Manuel Gomez-Rodriguez, David Balduzzi, and Bernhard Scholkopf. Uncoveringthe temporal dynamics of diffusion networks. In Proc. of the 28th InternationalConference on Machine Learning, JMLR:WCP, Bellevue, 2011. ACM.
[21] Manuel Gomez-Rodriguez, Jure Leskovec, David Balduzzi, and BernhardScholkopf. Uncovering the structure and temporal dynamics of information prop-agation. Network Science, 2014.
70
[22] Manuel Gomez Rodriguez, Jure Leskovec, and Andreas Krause. Inferring net-works of diffusion and influence. In Proceedings of the 16th ACM SIGKDDInternational Conference on Knowledge Discovery and Data Mining, KDD ’10,pages 1019–1028, New York, NY, USA, 2010. ACM.
[23] C. W. J. Granger. Investigating causal relations by econometric models andcross-spectral methods. Econometrica, 37:424–438, 1969.
[24] Fangjian Guo, Charles Blundell, Hanna Wallch, and Katherine Heller. Thebayesian echo chamber: Modeling social influence via linguistic accommodation.In Proceedings of the 18th International Conference on Artificial Intelligence andStatistics, 2015.
[25] A.G. Hawkes. Point spectra of some self-exciting and mutually exciting point pro-cesses. Journal of the Royal Statistical Society: Series B (Methodology), 58:83–90,1971.
[26] César A Hidalgo R. Conditions for the emergence of scaling in the inter-eventtime of uncorrelated and seasonal systems. Physica A: Statistical Mechanics andits Applications, 369(2):877–883, 2006.
[27] Carl Hovland and Muzafer Sherif. Social judgment: Assimilation and contrasteffects in communication and attitude change. Westport: Greenwood, 1980.
[28] Long Jiang, Mo Yu, Ming Zhou, Xiaohua Liu, and Tiejun Zhao. Target-dependent twitter sentiment classification. In Proceedings of the 49th AnnualMeeting of the Association for Computational Linguistics: Human LanguageTechnologies - Volume 1, HLT ’11, pages 151–160, Stroudsburg, PA, USA, 2011.Association for Computational Linguistics.
[29] Marion Just, Ann Crigler, Dean Alger, and Timothy Cook. Crosstalk: Citizens,Candidates, and the Media in a Presidential Campaign. University of ChicagoPress, 1996.
[30] Jon Kleinberg. Bursty and hierarchical structure in streams. In Proceedingsof the Eighth ACM SIGKDD International Conference on Knowledge Discoveryand Data Mining, KDD ’02, pages 91–101, New York, NY, USA, 2002. ACM.
[31] Efthymios Kouloumpis, Theresa Wilson, and Johanna Moore. Twitter sentimentanalysis: The good the bad and the omg!, 2011.
[32] Haewoon Kwak, Changhyun Lee, Hosung Park, and Sue Moon. What is twitter,a social network or a news media? In Proceedings of the 19th InternationalConference on World Wide Web, WWW ’10, pages 591–600, New York, NY,USA, 2010. ACM.
[33] Danial Lashkari and Polina Golland. Convex clustering with exemplar-basedmodels. Advances in neural information processing systems, 20, 2007.
71
[34] Chenliang Li, Aixin Sun, and Anwitaman Datta. Twevent: Segment-based eventdetection from tweets. In Proceedings of the 21st ACM International Conferenceon Information and Knowledge Management, CIKM ’12, pages 155–164, NewYork, NY, USA, 2012. ACM.
[35] Scott Linderman and Ryan Adams. Discovering latent network structure in pointprocess data. In Proceedings of the 31st International Conference on MachineLearning, JMLR:WCP, volume 32, Beijing, 2014.
[36] Michael Mathioudakis and Nick Koudas. Twittermonitor: Trend detection overthe twitter stream. In Proceedings of the 2010 ACM SIGMOD InternationalConference on Management of Data, SIGMOD ’10, pages 1155–1158, New York,NY, USA, 2010. ACM.
[37] Tomas Mikolov, Ilya Sutskever, Kai Chen, Greg Corrado, and Jeffrey Dean. Dis-tributed representations of words and phrases and their compositionality. CoRR,abs/1310.4546, 2013.
[38] Seth A. Myers, Chenguang Zhu, and Jure Leskovec. Information diffusion andexternal influence in networks. In Proceedings of the 18th ACM SIGKDD Inter-national Conference on Knowledge Discovery and Data Mining, KDD ’12, pages33–41, New York, NY, USA, 2012. ACM.
[39] Olutobi Owoputi, Chris Dyer, Kevin Gimpel, Nathan Schneider, and Noah A.Smith. Improved part-of-speech tagging for online conversational text with wordclusters. In In Proceedings of NAACL, 2013.
[40] Alexander Pak and Patrick Paroubek. Twitter as a corpus for sentiment analysisand opinion mining. In LREc, volume 10, pages 1320–1326, 2010.
[41] Michael Paul and Mark Dredze. You are what you tweet: Analyzing twitter forpublic health, 2011.
[42] P.O. Perry and P.J. Wolfe. Point process modeling for directed interaction net-works. Journal of the Royal Statistical Society: Series B (Methodology), 75:821–849, 2013.
[43] Richard E Petty and John T Cacioppo. Source factors and the elaborationlikelihood model of persuasion. Advances in Consumer Research, 11:668.
[44] Hassan Saif, Yulan He, and Harith Alani. Alleviating data sparsity for twittersentiment analysis. CEUR Workshop Proceedings (CEUR-WS. org), 2012.
[45] Stefan Stieglitz and Linh Dang-Xuan. Emotions and information diffusion insocial media?sentiment of microblogs and sharing behavior. Journal of Manage-ment Information Systems, 29(4):217–248, 2013.
72
[46] Andranik Tumasjan, Timm Sprenger, Philipp Sandner, and Isabell Welpe. Pre-dicting elections with twitter: What 140 characters reveal about political sen-timent. In Proc. of the 4th International AAAI Conference on Web and SocialMedia, 2010.
[47] Isabel Valera and Manuel Gomez-Rodriguez. Modeling adoption and usage ofcompeting products. In Proceedings of the IEEE International Conference onData Mining, 2015.
[48] Alexei Vázquez, Joao Gama Oliveira, Zoltán Dezsö, Kwang-Il Goh, Imre Kondor,and Albert-László Barabási. Modeling bursts and heavy tails in human dynamics.Physical Review E, 73(3):036127, 2006.
[49] Elise Viebeck. ?shame on you’: Bernie sanders draws sharp rebuke for sandyhook lawsuit comments, 2015. [Online; accessed 29-July-2016].
[50] Prashanth Vijayaraghavan, Ivan Sysoev, Soroush Vosoughi, and Roy Roy. Deep-stance at semeval-2016 task 6: Detecting stance in tweets using character andword-level cnns. In Proc. of the 10th International Workshop on Semantic Eval-uation, NAACL, 2016.
[51] Prashanth Vijayaraghavan, Soroush Vosoughi, and Roy Roy. Automatic detec-tion and categorization of election-related tweets. In Proc. of the 10th Interna-tional AAAI Conference on Web and Social Media, 2016.
[52] Soroush Vosoughi. Automatic Detection and Verification of Rumors on Twitter.PhD thesis, Massachusetts Institute of Technology, 2015.
[53] Soroush Vosoughi and Deb Roy. Tweet acts: A speech act classifier for twitter.CoRR, abs/1605.05156, 2016.
[54] Soroush Vosoughi, Prashanth Vijayaraghavan, and Deb Roy. Tweet2vec: Learn-ing tweet embeddings using character-level cnn-lstm encoder-decoder. In Pro-ceedings of the 39th International ACM SIGIR Conference on Research and De-velopment in Information Retrieval, SIGIR ’16, pages 1041–1044, New York, NY,USA, 2016. ACM.
[55] Xiaolong Wang, Furu Wei, Xiaohua Liu, Ming Zhou, and Ming Zhang. Topicsentiment analysis in twitter: A graph-based hashtag sentiment classificationapproach. In Proceedings of the 20th ACM International Conference on Infor-mation and Knowledge Management, CIKM ’11, pages 1031–1040, New York,NY, USA, 2011. ACM.
[56] Jianshu Weng. Event detection in twitter. 2011.
[57] Jianshu Weng, Ee-Peng Lim, Jing Jiang, and Qi He. Twitterrank: Finding topic-sensitive influential twitterers. In Proceedings of the Third ACM InternationalConference on Web Search and Data Mining, WSDM ’10, pages 261–270, NewYork, NY, USA, 2010. ACM.
73
[58] Shaomei Wu, Jake M. Hofman, Winter A. Mason, and Duncan J. Watts. Whosays what to whom on twitter. In Proceedings of the 20th International Con-ference on World Wide Web, WWW ’11, pages 705–714, New York, NY, USA,2011. ACM.
[59] Shuang-hong Yang and Hongyuan Zha. Mixture of mutually exciting processesfor viral diffusion. In Sanjoy Dasgupta and David Mcallester, editors, Proceed-ings of the 30th International Conference on Machine Learning (ICML-13), vol-ume 28, pages 1–9. JMLR Workshop and Conference Proceedings, May 2013.
[60] Ali Zarezade, Ali Khodadadi, Mehrdad Farajtabar, Hamid R. Rabiee, Le Song,and Hongyuan Zha. Correlated cascades: Compete or cooperate. In WSDM,2016.
[61] Ke Zhou, Hongyuan Zha, and Le Song. Learning social infectivity in sparselow-rank networks using multi-dimensional hawkes processes. In Proceedings ofthe International Conference on Artificial Intelligence and Statistics, volume 16,2013.
74
Related Documents


