Last Close 34.54 (USD) 2017 April 25 NASDAQ Exchange Avg Daily Vol 820,912 52-Week High 40.38 Trailing PE 31.1 Annual Div 0.40 ROE 7.9% LTG Forecast 16.9% 1-Mo Return -0.4% Market Cap 2.3B 52-Week Low 31.97 Forward PE 24.8 Dividend Yield 1.2% Annual Rev 1.4B Inst Own 82.4% 3-Mo Return -6.8% AVERAGE SCORE NEUTRAL OUTLOOK: IBKR's current score is relatively in-line with the market. Score Averages Investment Banking & Svcs. Group: 6.1 Mid Market Cap: 6.2 Banking & Investment Svcs. Sector: 6.8 S&P 500 Index: 6.5 Positive Neutral Negative Average Score Trend (4-Week Moving Avg) 2014-04 2015-04 2016-04 2017-04 Peers -6M -3M -1M -1W Current 1Y Trend CBOE 6 9 8 9 8 ICE 6 6 7 8 8 CME 7 6 7 6 6 NDAQ 6 6 6 4 5 IBKR 6 4 6 8 4 HIGHLIGHTS THOMSON REUTERS I/B/E/S MEAN - The score for Interactive Brokers Group Inc dropped to 4 this week, its worst value over the past year. - The recent change in the Average Score was primarily due to a decline in the Earnings and Relative Valuation component scores. Hold Mean recommendation from all analysts covering the company on a standardized 5-point scale. 7 Analysts Sell Reduce Hold Buy Strong Buy PRICE AND VOLUME CHARTS 1-Year Return: -12.5% 5-Year Return: 125.0% BUSINESS SUMMARY Interactive Brokers Group, Inc. (IBG, Inc.) is a holding company. The Company is an automated global electronic broker and market maker specializing in routing orders, and executing and processing trades in securities, futures, foreign exchange instruments, bonds and mutual funds on over 120 electronic exchanges and market centers around the world and offering custody, prime brokerage, securities and margin lending services to customers. It operates in two segments: electronic brokerage and market making. It conducts its electronic brokerage business through its Interactive Brokers (IB) subsidiaries. It conducts its market making business through its Timber Hill (TH) subsidiaries. In the United States, it conducts its business from Greenwich, Connecticut and Chicago, Illinois. Outside the United States, it conducts business in Canada, England, Switzerland, Liechtenstein, China (Hong Kong and Shanghai), India, Australia and Japan. INTERACTIVE BROKERS GROUP INC (IBKR-O) Banking & Investment Svcs. / Investment Banking & Svcs. / Financial Market Operators STOCKREPORTS+ DETAILED STOCK REPORT Report Date: 2017 April 26 Page 1 of 12 © 2017 Thomson Reuters. All rights reserved.

Welcome message from author
This document is posted to help you gain knowledge. Please leave a comment to let me know what you think about it! Share it to your friends and learn new things together.
Transcript

Last Close34.54 (USD)2017 April 25NASDAQ Exchange
Avg Daily Vol820,912
52-Week High40.38
Trailing PE31.1
Annual Div0.40
ROE7.9%
LTG Forecast16.9%
1-Mo Return-0.4%
Market Cap2.3B
52-Week Low31.97
Forward PE24.8
Dividend Yield1.2%
Annual Rev1.4B
Inst Own82.4%
3-Mo Return-6.8%
AVERAGE SCORE
NEUTRAL OUTLOOK: IBKR's current score isrelatively in-line with the market.
Score Averages
Investment Banking & Svcs. Group: 6.1 Mid Market Cap: 6.2Banking & Investment Svcs. Sector: 6.8 S&P 500 Index: 6.5
Positive
Neutral
Negative
Average Score Trend (4-Week Moving Avg)
2014-04 2015-04 2016-04 2017-04
Peers -6M -3M -1M -1W Current 1Y Trend
CBOE 6 9 8 9 8
ICE 6 6 7 8 8
CME 7 6 7 6 6
NDAQ 6 6 6 4 5
IBKR 6 4 6 8 4
HIGHLIGHTS THOMSON REUTERS I/B/E/S MEAN- The score for Interactive Brokers Group Inc dropped to 4 this
week, its worst value over the past year.
- The recent change in the Average Score was primarily due to adecline in the Earnings and Relative Valuation componentscores.
Hold Mean recommendation from all analysts coveringthe company on a standardized 5-point scale.7 Analysts
Sell Reduce Hold Buy StrongBuy
PRICE AND VOLUME CHARTS1-Year Return: -12.5% 5-Year Return: 125.0%
BUSINESS SUMMARYInteractive Brokers Group, Inc. (IBG, Inc.) is a holding company. The Company is an automated global electronic broker and market maker specializingin routing orders, and executing and processing trades in securities, futures, foreign exchange instruments, bonds and mutual funds on over 120electronic exchanges and market centers around the world and offering custody, prime brokerage, securities and margin lending services to customers.It operates in two segments: electronic brokerage and market making. It conducts its electronic brokerage business through its Interactive Brokers (IB)subsidiaries. It conducts its market making business through its Timber Hill (TH) subsidiaries. In the United States, it conducts its business fromGreenwich, Connecticut and Chicago, Illinois. Outside the United States, it conducts business in Canada, England, Switzerland, Liechtenstein, China(Hong Kong and Shanghai), India, Australia and Japan.
INTERACTIVE BROKERS GROUP INC (IBKR-O)Banking & Investment Svcs. / Investment Banking & Svcs. / Financial Market Operators
STOCKREPORTS+DETAILED STOCK REPORT
Report Date: 2017 April 26
Page 1 of 12© 2017 Thomson Reuters. All rights reserved.

INDICATOR COMPONENTS
The AVERAGE SCORE combines the quantitative analysis of six widely-used investment decision making tools: Earnings,Fundamental, Relative Valuation, Risk, Price Momentum and Insider Trading. A simple average of the underlying component ratings isnormally distributed to rank stocks on a 1-10 scale (10 being awarded to the most favorable). These factors may be evaluated differentlyusing alternative methodologies and the importance of individual factors varies across industries, market capitalization and investmentstyles. Additional criteria should always be used to evaluate a stock.
Earnings Fundamental Relative Valuation Risk Price Momentum Insider Trading
OPTIMIZED SCORE
Historically, companies with an optimized scoreof 4 have tended to moderately underperformthe market over the following 12-month period.
As an alternative approach to equally weighting each of the six factors, independentresearch firm, Verus Analytics, conducted a backtest to empirically determine theoptimal factor blend. Results and weighting vary across four different marketcapitalization categories. For large cap stocks, price momentum and insider tradinghistorically provided the most explanatory power among the six factors and areweighted heavily in the current optimized score. Among the small cap universe, theearnings and fundamental factors joined with insider trading and price momentum toexplain returns.
PEER ANALYSIS Currency in USD
PRICE MOMENTUM VALUATION FUNDAMENTAL ANALYSTS
AverageScore Ticker
Price(2017-04-25)
1-MoReturn
3-MoReturn
1-YrReturn
MarketCap
TrailingPE
ForwardPE
DividendYield
NetMargin
LTGForecast
I/B/E/SMean
# ofAnalysts
6 CME 119.94 0.1% -0.2% 28.0% 40.4B 26.5 24.6 2.2% 42.7% 8.5% Buy 15
8 ICE 60.97 1.9% 5.2% 26.8% 35.9B 25.7 20.3 1.3% 31.6% 12.9% Buy 15
8 FIS 83.86 4.7% 5.0% 27.6% 27.1B 48.5 19.7 1.4% 6.1% 13.2% Buy 25
5 NDAQ 70.53 1.0% 3.2% 9.9% 11.6B 113.8 17.0 1.8% 2.9% 10.4% Buy 14
8 CBOE 84.16 5.9% 8.0% 29.3% 9.3B 37.1 26.9 1.2% 27.6% 17.6% Buy 14
5 MKTX 184.67 -1.6% 4.9% 43.6% 6.9B 55.1 47.0 0.7% 35.8% 16.0% Buy 6
9 OAK 46.55 3.7% 12.8% -3.6% 3.0B 15.0 16.0 5.4% 16.9% 15.0% Hold 9
9 BGCP 11.43 5.4% 2.5% 23.2% 2.8B 30.1 11.8 5.6% 3.9% -- Strong Buy 2
4 IBKR 34.54 -0.4% -6.8% -12.5% 2.3B 31.1 24.8 1.2% 5.4% 16.9% Hold 7
6 YIN 16.50 -17.4% -4.2% -- 1.2B 6.9 6.3 4.9% 34.2% -- Strong Buy 1
4 VIRT 16.10 -4.2% -10.3% -24.9% 653M 18.5 17.8 6.0% 4.7% 0.8% Hold 6
6.5 Average 66.30 -0.1% 1.8% 14.7% 12.8B 37.1 21.1 2.9% 19.3% 12.4% Buy 10.4
PEER COMPANIESCME CME Group Inc MKTX Marketaxess Holdings IncICE Intercontinental Exchange Inc OAK Oaktree Capital GroupFIS Fidelity National Information BGCP BGC Partners IncNDAQ Nasdaq Inc YIN Yintech Investment HoldingsCBOE CBOE Holdings Inc VIRT Virtu Financial Inc
INTERACTIVE BROKERS GROUP INC (IBKR-O)Banking & Investment Svcs. / Investment Banking & Svcs. / Financial Market Operators
STOCKREPORTS+DETAILED STOCK REPORT
Report Date: 2017 April 26
Page 2 of 12© 2017 Thomson Reuters. All rights reserved.

EARNINGS
NEGATIVE OUTLOOK: Weak earnings withrecent analyst downgrades or a history ofmissing consensus estimates.
Currency in USD
Earnings Score Averages
Investment Banking & Svcs. Group: 6.0 Mid Market Cap: 5.9Banking & Investment Svcs. Sector: 6.0 S&P 500 Index: 6.3
Positive
Neutral
Negative
Earnings Score Trend (4-Week Moving Avg)
2014-04 2015-04 2016-04 2017-04
Peers -6M -3M -1M -1W Current 1Y Trend
CBOE 10 10 10 10 10
CME 10 9 10 10 10
ICE 10 6 7 10 10
NDAQ 9 7 8 3 3
IBKR 4 3 4 8 1
EARNINGS INDICATORSEarnings Surprises
(33.3% weight)Estimate Revisions
(33.3% weight)Recommendation Changes
(33.3% weight)
CMENDAQICE
CBOE
IBKR
CBOECMEICE
IBKRNDAQ
CBOECME
IBKRNDAQ
ICE
Last 4 Quarters Last 4 Weeks Last 120 Days
# Positive Surprises (> 2%) 1 # Up Revisions 0 # Broker Upgrades 1# Negative Surprises (< -2%) 2 # Down Revisions 6 # Broker Downgrades 2# In-Line Surprises (within 2%) 1 Avg Up Revisions 0.0%Avg Surprise -2.5% Avg Down Revisions -85.7%
HIGHLIGHTS PRICE TARGET- The Earnings Rating for Interactive Brokers Group Inc declined
significantly over the past week from 8 to 1. The current rating isconsiderably more bearish than the Financial Market Operatorsindustry average of 6.4. IBKR scores a bearish 4 or less for all threecomponent ratings.
- On 2017-04-18, the company announced quarterly earnings of 0.40per share, relatively in-line with the consensus 0.39. Over the past 4quarters, the company has reported 1 positive, 2 negative, and 1 in-line surprises. The average surprise for this time period has been -2.5%.
- IBKR's current quarter consensus estimate has decreased over thepast 90 days from 0.39 to 0.32, a loss of -18.7%. This trails theFinancial Market Operators industry average of -1.0% during the sametime period.
The chart indicates where analysts predict the stock price will be withinthe next 12 months, as compared to the current price.
39.00
38.00
37.00
36.00
35.00
34.00Current Price Price Target
34.54
MEAN
HIGH
LOW
12-Month Price Target
Mean 38.00High 39.00Low 37.00Target vs. Current 10.0%# of Analysts 5
INTERACTIVE BROKERS GROUP INC (IBKR-O)Banking & Investment Svcs. / Investment Banking & Svcs. / Financial Market Operators
STOCKREPORTS+DETAILED STOCK REPORT
Report Date: 2017 April 26
Page 3 of 12© 2017 Thomson Reuters. All rights reserved.

EARNINGS PER SHARE
Earnings per share (EPS) is calculatedby dividing a company's earnings by thenumber of shares outstanding. Analyststend to interpret a pattern of increasingearnings as a sign of strength and flator falling earnings as a sign ofweakness.
The charts provide a comparisonbetween a company's actual andestimated EPS, including the high andlow forecasts.
0.600
0.500
0.400
0.300
0.200
0.10016-06 16-09 16-12 17-03 17-06 17-09
Actuals Estimates
0.360
0.300
0.160
0.400
MEANHIGH
LOW
Quarterly 17-06 17-09Mean 0.317 0.333High 0.340 0.350Low 0.280 0.320# of Analysts 6 6
2.100
1.800
1.500
1.200
0.900
0.6002015 2016 2017 2018
Actuals Estimates
0.620
1.310MEANHIGH
LOW
Annual 2017 2018Mean 1.402 1.601High 1.450 1.710Low 1.370 1.450# of Analysts 5 7
MEAN ESTIMATE TREND ANALYST RECOMMENDATIONSQ
17-06Q
17-09Y
2017Y
2018Price
TargetCurrent 0.317 0.333 1.402 1.601 38.0030 Days Ago 0.376 0.372 1.488 1.747 40.4090 Days Ago 0.390 0.390 1.498 1.836 40.40% Change (90 Days) -18.7% -14.6% -6.4% -12.8% -5.9%
Current Fiscal Year End: 17-12Next Expected Report Date: 2017-07-17
Thomson Reuters I/B/E/S Mean: Hold (7 Analysts)
Strong Buy
Buy
Hold
Reduce
Sell
0
2
4
0
1
EARNINGS SURPRISESComparing a company's actual earnings to the mean expectation ofanalysts results in a difference referred to as a 'positive' or 'negative'surprise. Research has shown that when a company reports asurprise, it is often followed by more of the same surprise type.
Surprise Detail (Last 6 Periods)
SurpriseType
AnnounceDate
Period EndDate
ActualEPS
MeanEPS
Surprise(%)
In-Line 2017-04-18 2017-03-31 0.400 0.394 1.5%Negative 2017-01-17 2016-12-31 0.160 0.172 -7.0%Negative 2016-10-18 2016-09-30 0.300 0.326 -8.0%Positive 2016-07-19 2016-06-30 0.360 0.348 3.4%Positive 2016-04-19 2016-03-31 0.600 0.465 29.0%Negative 2016-01-19 2015-12-31 0.180 0.260 -30.8%
Surprise Summary (Last 12 Quarters)
Surprise Type Amount PercentPositive Quarters (> 2%) 3 25.0%Negative Quarters (< -2%) 7 58.3%In-Line Quarters (within 2%) 2 16.7%
ANNUAL REVENUEA pattern of increasing sales inconjunction with a rising EPS mayinfluence a buy recommendation, whileflat or falling sales and falteringearnings may explain a sellrecommendation. A rising EPS with flator falling sales may result fromincreased cost efficiency and margins,rather than market expansion. Thischart shows the sales forecast trend ofall analysts and the highest and lowestprojections for the current and nextfiscal year.
2.0B
1.8B
1.6B
1.4B
1.2B
1.0B2015 2016 2017 2018
Actuals Estimates
1.2B
1.4BMEAN
HIGH
LOW
2017 2018Mean 1.4B 1.6BHigh 1.5B 1.8BLow 1.4B 1.5BForecasted Growth 2.4% 14.6%# of Analysts 4 7
INTERACTIVE BROKERS GROUP INC (IBKR-O)Banking & Investment Svcs. / Investment Banking & Svcs. / Financial Market Operators
STOCKREPORTS+DETAILED STOCK REPORT
Report Date: 2017 April 26
Page 4 of 12© 2017 Thomson Reuters. All rights reserved.

FUNDAMENTAL
POSITIVE OUTLOOK: Strong fundamentalssuch as high profit margins, low debt levels, orgrowing dividends.
Fundamental Score Averages
Investment Banking & Svcs. Group: 5.5 Mid Market Cap: 6.3Banking & Investment Svcs. Sector: 7.1 S&P 500 Index: 6.3
Positive
Neutral
Negative
Fundamental Score Trend
Q2 Q3 Q4 Q1 Q2 Q3 Q4 Q1 Q2 Q3 Q4 Q12014 2015 2016
PeersQ2
2016Q3
2016Q4
2016Q1
2017 Current 3Y Trend
IBKR 5 4 3 NR 10
CME 9 9 9 NR 8
ICE 9 9 9 NR 7
CBOE 3 3 3 NR 6
NDAQ 10 10 9 NR 6
FUNDAMENTAL INDICATORSProfitability(25% weight)
Debt(25% weight)
Earnings Quality(25% weight)
Dividend(25% weight)
CMECBOEICE
NDAQ
IBKR
CMECBOEIBKRICE
NDAQ
IBKRNDAQ
ICE
CBOECME
IBKR
CMENDAQICECBOE
Revenue Growth -12.6%For year over yearending 2017-03Gross Margin 100.0%For latest 12 monthsending 2016-12Return On Equity 7.9%For interim periodending 2017-03Net Margin 5.4%For latest 12 monthsending 2017-03
Current Ratio --For interim periodending --Debt-to-Capital 42.5%For annual periodending 2016-12Interest Funding 5.3%For interim periodending 2016-03Interest Coverage 10.6For interim periodending 2016-12
Oper. Cash Yield 8.7%For latest 12 monthsending 2015-12Accruals -9.1%For latest 12 monthsending 2015-12Days Sales In Inv. --For annual periodending --Days Sales In Rec. --For annual periodending --
Dividend Growth 0.0%For year over yearending 2017-03Dividend Payout 36.5%For latest 12 monthsending 2017-03Dividend Coverage 26.2For annual periodending 2015-12Current Div. Yield 1.2%For latest 12 monthsending 2017-04
HIGHLIGHTS- The Fundamental Rating for Interactive Brokers Group Inc improved
significantly over the last quarter from 3 to 10. The current rating isconsiderably more bullish than the Financial Market Operatorsindustry average of 6.4.
- The gross margin of 100.0% for IBKR is the highest within its FinancialMarket Operators industry.
- The company's debt-to-capital has been higher than its industryaverage for each of the past five years.
- The operating cash yield for IBKR is the highest within its FinancialMarket Operators industry.
- Of the 9 firms within the Financial Market Operators industry,Interactive Brokers Group Inc is among 9 companies that pay adividend. The stock's dividend yield is currently 1.2%.
INTERACTIVE BROKERS GROUP INC (IBKR-O)Banking & Investment Svcs. / Investment Banking & Svcs. / Financial Market Operators
STOCKREPORTS+DETAILED STOCK REPORT
Report Date: 2017 April 26
Page 5 of 12© 2017 Thomson Reuters. All rights reserved.

RELATIVE VALUATION
NEUTRAL OUTLOOK: Multiples relatively in-linewith the market.
Relative Valuation Score Averages
Investment Banking & Svcs. Group: 7.3 Mid Market Cap: 5.2Banking & Investment Svcs. Sector: 6.2 S&P 500 Index: 5.3
Positive
Neutral
Negative
Relative Valuation Score Trend (4-Week Moving Avg)
2014-04 2015-04 2016-04 2017-04
Peers -6M -3M -1M -1W Current 1Y Trend
ICE 5 6 5 5 6
CBOE 1 1 5 5 5
IBKR 5 6 6 6 5
NDAQ 4 6 4 4 4
CME 2 2 2 2 2
RELATIVE VALUATION INDICATORSForward PEG
(50% weight)Trailing PE(25% weight)
Forward PE(25% weight)
CBOEIBKRICENDAQ
CME
ICECMEIBKR
CBOENDAQ
NDAQICE
CBOECMEIBKR
Forward PEG 1.5
5-Yr Average 1.7
Rel. to 5-Yr Avg. 13% Discount
S&P 500 Index 1.6
Rel. to S&P 500 10% Discount
Trailing PE 31.1
5-Yr Average 35.1
Rel. to 5-Yr Avg. 11% Discount
S&P 500 Index --
Rel. to S&P 500 --
Forward PE 24.8
5-Yr Average 21.3
Rel. to 5-Yr Avg. 17% Premium
S&P 500 Index 18.5
Rel. to S&P 500 34% Premium
HIGHLIGHTS- Interactive Brokers Group Inc currently has a Relative Valuation
Rating of 5 while the S&P 500 index has an average rating of 5.3.- IBKR's Forward PEG of 1.5 represents a 13% Discount to its 5-year
average of 1.7.
- IBKR's Trailing P/E of 31.1 represents a 11% Discount to its 5-yearaverage of 35.1.
- IBKR's Forward P/E of 24.8 represents a 17% Premium to its 5-yearaverage of 21.3.
INTERACTIVE BROKERS GROUP INC (IBKR-O)Banking & Investment Svcs. / Investment Banking & Svcs. / Financial Market Operators
STOCKREPORTS+DETAILED STOCK REPORT
Report Date: 2017 April 26
Page 6 of 12© 2017 Thomson Reuters. All rights reserved.
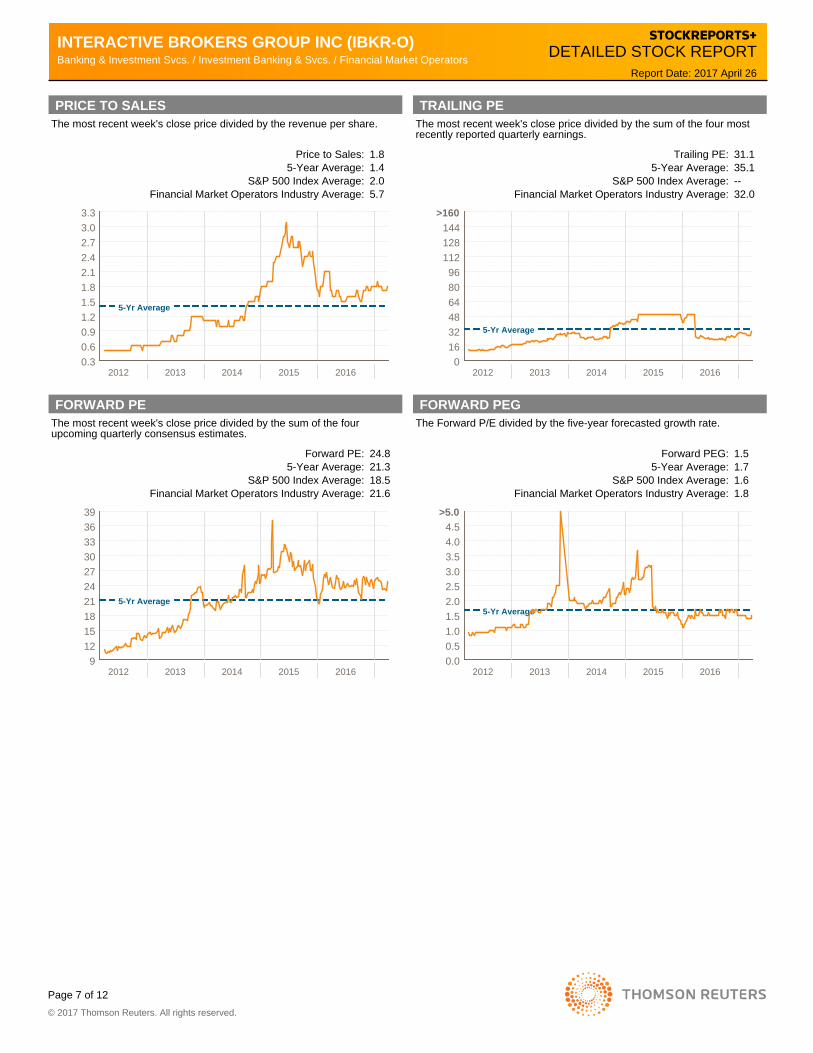
PRICE TO SALESThe most recent week's close price divided by the revenue per share.
Price to Sales: 1.85-Year Average: 1.4
S&P 500 Index Average: 2.0Financial Market Operators Industry Average: 5.7
0.30.60.91.21.51.82.12.42.73.03.3
20162015201420132012
5-Yr Average
TRAILING PEThe most recent week's close price divided by the sum of the four mostrecently reported quarterly earnings.
Trailing PE: 31.15-Year Average: 35.1
S&P 500 Index Average: --Financial Market Operators Industry Average: 32.0
0163248648096
112128144
>160
20162015201420132012
5-Yr Average
FORWARD PEThe most recent week's close price divided by the sum of the fourupcoming quarterly consensus estimates.
Forward PE: 24.85-Year Average: 21.3
S&P 500 Index Average: 18.5Financial Market Operators Industry Average: 21.6
912151821242730333639
20162015201420132012
5-Yr Average
FORWARD PEGThe Forward P/E divided by the five-year forecasted growth rate.
Forward PEG: 1.55-Year Average: 1.7
S&P 500 Index Average: 1.6Financial Market Operators Industry Average: 1.8
0.00.51.01.52.02.53.03.54.04.5
>5.0
20162015201420132012
5-Yr Average
INTERACTIVE BROKERS GROUP INC (IBKR-O)Banking & Investment Svcs. / Investment Banking & Svcs. / Financial Market Operators
STOCKREPORTS+DETAILED STOCK REPORT
Report Date: 2017 April 26
Page 7 of 12© 2017 Thomson Reuters. All rights reserved.

RISK
NEUTRAL OUTLOOK: Moderate risk (mediumvolatility).
Risk Score Averages
Investment Banking & Svcs. Group: 6.8 Mid Market Cap: 7.2Banking & Investment Svcs. Sector: 7.0 S&P 500 Index: 8.2
Positive
Neutral
Negative
Risk Score Trend (4-Week Moving Avg)
2014-04 2015-04 2016-04 2017-04
Peers -6M -3M -1M -1W Current 1Y Trend
NDAQ 9 10 10 10 10
CBOE 8 9 9 9 9
CME 9 9 9 9 9
ICE 9 10 9 9 9
IBKR 7 8 7 7 7
RISK INDICATORSMagnitude Of Returns
(25% weight)Volatility
(25% weight)Beta (1-year)(25% weight)
Correlation(25% weight)
CBOENDAQCMEICEIBKR
CBOECMEICENDAQIBKR
CBOENDAQICE
CMEIBKR
CMEIBKRICENDAQ
CBOE
Daily Returns (Last 90 Days)Best 4.6%Worst -2.6%Monthly Returns (Last 60 Months)Best 17.0%Worst -26.1%
Standard DeviationLast 90 Days 1.23Last 60 Months 7.06Intra-Day Swing (Last 90 Days)Average 1.7%Largest 4.4%
Beta vs. S&P 500 1.52Positive Days Only 1.59Negative Days Only 1.50Beta vs. Group 1.14Positive Days Only 1.33Negative Days Only 1.09
Correlation vs. S&P 500Last 90 Days 60%Last 60 Months 38%Correlation vs. GroupLast 90 Days 62%Last 60 Months 50%
HIGHLIGHTS- Interactive Brokers Group Inc currently has a Risk Rating of 7
while the S&P 500 index has an average rating of 8.2.- On days when the market is up, IBKR shares tends to
outperform the S&P 500 index. However, on days when themarket is down, the shares generally decrease by more thanthe index.
- In the short term, IBKR has shown high correlation (>= 0.4) withthe S&P 500 index. The stock has, however, shown averagecorrelation (>= 0.2 and < 0.4) with the market in the long term.
- Over the last 90 days, the daily price fluctuations of IBKR havebeen in-line with the S&P 500 index firms.
RISK ANALYSISLast 90 Days Last 60 Months
Peers
BestDaily
Return
WorstDaily
Return
#Days
Up
#Days
Down
LargestIntra-Day
Swing
BestMonthlyReturn
WorstMonthlyReturn
IBKR 4.6% -2.6% 29 33 4.4% 17.0% -26.1%
CBOE 2.2% -2.8% 34 28 3.2% 15.0% -10.1%
CME 4.6% -2.9% 30 31 4.1% 16.0% -8.3%
ICE 3.2% -4.8% 34 29 4.4% 13.0% -9.6%
NDAQ 3.5% -1.5% 33 29 4.7% 13.3% -11.0%
S&P 500 1.4% -1.2% 31 31 1.7% 8.3% -6.3%
INTERACTIVE BROKERS GROUP INC (IBKR-O)Banking & Investment Svcs. / Investment Banking & Svcs. / Financial Market Operators
STOCKREPORTS+DETAILED STOCK REPORT
Report Date: 2017 April 26
Page 8 of 12© 2017 Thomson Reuters. All rights reserved.

PRICE MOMENTUM
NEGATIVE OUTLOOK: Weak recent priceperformance or entering historically poorseasonal period.
Currency in USD
Price Momentum Score Averages
Investment Banking & Svcs. Group: 4.4 Mid Market Cap: 6.2Banking & Investment Svcs. Sector: 5.1 S&P 500 Index: 6.1
Positive
Neutral
Negative
Price Momentum Score Trend (4-Week Moving Avg)
2014-04 2015-04 2016-04 2017-04
Peers -6M -3M -1M -1W Current 1Y Trend
CBOE 4 10 7 9 9
ICE 7 6 8 8 8
CME 8 7 5 3 5
NDAQ 6 4 5 2 5
IBKR 4 1 1 2 2
PRICE MOMENTUM INDICATORSRelative Strength
(70% weight)Seasonality(30% weight)
CBOEICE
NDAQCME
IBKR
IBKRICE
CBOECMENDAQ
Relative Strength Indicator (Scale from 1 to 100)IBKR Industry Avg
Last 1 Month 44 51Last 3 Months 46 53Last 6 Months 48 53
Average Monthly Return (Last 10 Years)APR MAY JUN
Company Avg 2.9% 0.7% -0.6%Industry Avg 1.1% 2.3% -0.5%Industry Rank 115 of 122 19 of 122 46 of 122
PRICE PERFORMANCEDaily close prices are used to calculate theperformance of the stock as compared to arelevant index over five time periods.
IBKR
S&P Small
1-Week
1-Month
3-Month
YTD
1-Year
-0.7%3.8%
-0.4%3.8%
-6.8%1.2%
-5.4%2.3%
-12.5%23.1%
IBKR S&P SmallClose Price (2017-04-25) 34.54 85752-Week High 40.38 86252-Week Low 31.97 671
- Interactive Brokers Group Inc has a Price Momentum Rating of2, which is significantly below the S&P 500 index averagerating of 6.1.
- On 2017-04-25, IBKR closed at 34.54, 14.5% below its 52-week high and 8.1% above its 52-week low.
- IBKR shares are currently trading 3.9% below their 50-daymoving average of 35.96, and 4.7% below their 200-daymoving average of 36.24.
INTERACTIVE BROKERS GROUP INC (IBKR-O)Banking & Investment Svcs. / Investment Banking & Svcs. / Financial Market Operators
STOCKREPORTS+DETAILED STOCK REPORT
Report Date: 2017 April 26
Page 9 of 12© 2017 Thomson Reuters. All rights reserved.

INSIDER TRADING
This company does not currently meet the datarequirements to calculate a score for thiscomponent.
Currency in USD
Insider Trading Score Averages
Investment Banking & Svcs. Group: 4.5 Mid Market Cap: 4.2Banking & Investment Svcs. Sector: 5.4 S&P 500 Index: 3.8
Positive
Neutral
Negative
Insider Trading Score Trend (4-Week Moving Avg)
2014-04 2015-04 2016-04 2017-04
Peers -6M -3M -1M -1W Current 1Y Trend
NDAQ 2 1 2 2 3
CBOE 3 3 3 2 2
CME 2 2 2 2 2
ICE 1 2 1 1 1
IBKR 4 NR NR NR NR
INSIDER TRADING INDICATORSShort-Term Insider
(70% weight)Long-Term Insider
(30% weight)
NDAQ
CBOECMEICE
IBKR
CBOECMEICENDAQ
IBKR
Most Recent Buys and Sells (Last 90 Days)Insider Name Role Tran Date Tran Type Shares
There are no insider transactions during this time period.
Insider Summary (Last 6 Months)Total Shares Acquired --Total Shares Disposed --Net Shares --Sector Average -179,024
HIGHLIGHTS- Executives at Interactive Brokers Group Inc have not purchased or
sold any shares thus far this quarter. Over the past five years, theaverage purchase and sell totals for Q2 have been $0 and $287,837respectively.
- Due to a lack of recent insider activity, no Insider Trading Rating canbe calculated for Interactive Brokers Group Inc. However, the averagerating for the Financial Market Operators industry is 3.14, compared tothe S&P 500 index average of 3.78.
MONTHLY BUYS AND SELLS
0
M J J A S O N D J F M A
BUYS
SELLS
No insider activity during the past year50
50
100
100
$ Market Value
Excludesderivativeand optionexercises
TOP INSTITUTIONAL HOLDERS
Institution NameInst.Type
%O/S
SharesHeld
ReportedDate
BlackRock Institutional Inv Mgmt 8.5% 5.78M 2016-12-31The Vanguard Group Inc Inv Mgmt 8.1% 5.50M 2016-12-31Baillie Gifford & Co Inv Mgmt 8.1% 5.50M 2016-12-31Ancient Art Inv Mgmt 4.9% 3.30M 2016-12-31Bares Capital Management Inv Mgmt 4.8% 3.23M 2016-12-31
Updated daily as of 2017-04-26
TOP EXECUTIVE HOLDERS
Insider Name RoleDirect
Shares ValueReportedDate
Galik, Milan P 0.85M 28.9M 2016-12-30Brody, Paul Jonathan CFO 0.64M 21.9M 2016-12-30Frank, Thomas A J CT 0.33M 11.2M 2017-01-04Nemser, Earl H OD 0.10M 3.43M 2017-01-04Mendonca, Denis O 4,584 0.16M 2016-05-09
Updated monthly as of 2017-04-16
INTERACTIVE BROKERS GROUP INC (IBKR-O)Banking & Investment Svcs. / Investment Banking & Svcs. / Financial Market Operators
STOCKREPORTS+DETAILED STOCK REPORT
Report Date: 2017 April 26
Page 10 of 12© 2017 Thomson Reuters. All rights reserved.

DETAILED STOCK REPORT TIPS
The Thomson Reuters Stock Report is a comprehensive, company-specific analysis that includes a proprietary Stock Rating along with underlying component indicators and supportive data elements. The report is updated daily, although some of the data elements and the ratings are updated weekly.
Average Score The Average Score combines a quantitative analysis of six widely-used investment decision making tools - Earnings, Fundamental, Relative Valuation, Risk, Price Momentum, and Insider Trading. First, a simple average of the six underlying component ratings is calculated. Then, a normal distribution is used to rank each stock across the market on a scale of 1 to 10, with 10 being most favorable. A score of 8 to 10 is considered positive, 4 to 7 is neutral, and 1 to 3 is negative. These six factors may be evaluated differently using alternative methodologies, and the importance of individual factors varies across groups, market capitalization and investment styles. Additional criteria should always be used to evaluate a stock.
A company must have sufficient data available for at least four of the six component indicators in order to receive an overall Average Score. Approximately 85% of the stocks within the coverage universe meet the criteria to generate a score.
Optimized Score As an alternative to the average score, the Stock Report includes an Optimized Score generated by independent research firm, Verus Analytics. It uses the same six component ratings, but rather than equally weighting each of the factors, the weighting varies by market capitalization of the underlying security based on backtesting research. These scores are also updated weekly and distributed normally on a 1 to 10 scale, with 10 being best. The variable size is assigned monthly by ranking the market capitalization and assigning the appropriate category as follows:
Large - Top 5.55% Mid - Next 13.87% Small - Next 34.68% Micro - Remaining 45.9%
Indicator Components The six indicators that comprise the stock rating are displayed. Like the stock rating, the component rating scale is 1 to 10, with 10 being best. A company will receive an ‘NR’ for No Rating if the required data elements or criteria are not met. A detailed section for each component is included in the report.
Indicator Trends Within each component section, historical score trends are displayed, typically using a 4-week moving average over a timeframe of the past three years. The dotted orange line indicates the average of the scores over those three years. The most recent occurrences of the best and worst scores are also displayed on the chart in grey boxes to put the current score into historical context.
Next to the trend chart for the company, current score averages are included, along with peer company comparisons of values from 6 months ago, 3 months ago, 1 month ago, the most recent value from 1 week ago, and the current score. The four closest industry peers are presented based on similar market capitalization.
Peer Analysis ● The Thomson Reuters Business Classification (TRBC) system is used for
industry comparisons. It is designed to track and display the primary business of a corporation by grouping together correlated companies that offer products and services into similar end markets. The system includes 10 Economic Sectors, 28 Business Sectors, 54 Industry Groups, and 136 Industries.
● The Peer Analysis section of the report compares the company to its ten closest peers. The peers are selected from the industry based on similar market capitalization. The peer listing may have fewer than ten companies if there are fewer than ten companies classified within that industry.
Highlights The Thomson Reuters proprietary automated text-generation system creates highlights summarizing the most noteworthy data. The bullets will vary by company and will change from week to week as different criteria are met.
Earnings The Earnings Rating is based on a combination of three factors: earnings surprises, estimate revisions, and recommendation changes. Each factor is equally weighted. Then, equal deciles are used to rank each stock across the market on a scale of 1 to 10, with 10 being most favorable. A stock needs to have at least two of the three earnings factors in order to receive a score.
● Earnings Surprises - The number of positive and negative surprises within the last 4 quarters.
● Estimate Revisions - The number of up and down revisions and the average percentage change of those revisions within a 4 week period.
● Recommendation Changes - The number of broker upgrades and downgrades in the last 120 days.
Price Target The price target is based on the predictions of analysts covering the stock and shows the high, low and mean price expected within the next 12 months.
Earnings Per Share The quarterly and annual earnings per share are presented when available, along with the mean, high and low. Quarterly data is displayed for the past 4 quarters (actual) and the next 2 quarters (estimated). Annual data is displayed for the past 2 years (actual) and the next 2 years (estimated).
Mean Estimate Trend The mean estimates show how the consensus has changed over the past 30 days and 90 days for the upcoming two quarters and two years. The percentage change is calculated for the company as a means for comparison by measuring the difference between the current consensus estimate and that of 90 days ago.
Analyst Recommendations The I/B/E/S Mean is the mean recommendation of all analysts covering the stock, as provided by Thomson Reuters I/B/E/S (Institutional Brokers Estimate System). The recommendations are presented on a five-point standardized scale: strong buy, buy, hold, reduce, and sell.
Earnings Surprises ● The surprise summary includes the total number of quarters (and percentage) in
the past 12 quarters in which earnings surprises were positive, negative, or in-line. In order to be recognized as a positive or negative surprise, the percent must be greater than 2% above or 2% below the consensus, respectively.
● The surprise detail section includes a listing of the company's quarterly earnings reported for the most recent 6 quarters. The consensus analyst estimate is provided to determine if the actual earnings report represented a positive surprise, negative surprise, or in-line result.
Fundamental The Fundamental Rating is based on a combination of four factors: profitability, debt, earnings quality, and dividend. Companies that do not pay a dividend are not penalized. Each factor is equally weighted. Then, equal deciles are used to rank each stock across the market on a scale of 1 to 10, with 10 being most favorable. A stock needs to have at least three of the four fundamental factors present for a given fiscal quarter in order to receive a score.
● Profitability is comprised of four data elements. - Revenue Growth: (Net Sales – Previous Net Sales) / Previous Net Sales - Gross Margin: Gross Profit / Net Sales - Return on Equity: Net Income / Total Equity - Net Margin: Net Profit / Net Sales
● Debt is comprised of four data elements.- Current Ratio: Current Assets / Current Liabilities - Debt-to-Capital: Total Debt / Total Capital - Interest Funding: Interest Expense / Operating Cash Flow - Interest Coverage: (Pre-Tax Income + Interest Expense) / Interest Expense
● Earnings Quality is comprised of two data elements. - Days Sales in Inventory: 365 / (Cost of Goods Sold / Inventory) - Days Sales in Receivables: 365 / (Net Sales (Revenues) / Receivables)
● Dividend is comprised of four data elements. The company must have a current dividend yield. - Dividend Growth Rate: (Dividends per Share – Previous Dividends per Share)
/ Previous Dividends per Share - Dividend Funding: Dividends / Operating Cash Flow - Dividend Coverage: (Pre-Tax Income + Interest Expense) / (Interest Expense
+ Dividends) - Dividend Yield: Annual Dividends per Share / Current Market Price per Share
Indicator Trend The fundamental indicator trend displays quarterly scores over the past three years. The best and worst scores over that timeframe can be easily determined from the values shown on the chart for each quarter.
INTERACTIVE BROKERS GROUP INC (IBKR-O)Banking & Investment Svcs. / Investment Banking & Svcs. / Financial Market Operators
STOCKREPORTS+DETAILED STOCK REPORT
Report Date: 2017 April 26
Page 11 of 12© 2017 Thomson Reuters. All rights reserved.

Relative Valuation The Relative Valuation Rating is based on a combination of three factors: Forward PEG (50% weight), Trailing P/E (25% weight), and Forward P/E (25% weight). After the weightings are considered to combine individual factors, equal deciles are used to rank each stock across the market on a scale of 1 to 10, with 10 being most favorable. These common valuation metrics are evaluated against the overall market, the index, and the company's own historic 5-year averages. A stock needs to have at least one of the three relative valuation factors in order to receive a score.
● Trailing P/E: Close Price / Most Recent 4 Quarters of Earnings ● Forward P/E: Close Price/ Upcoming 4 Quarters of Earnings● Forward PEG: Forward P/E / Long-Term Forecasted Growth Rate
Valuation Averages Negative values are excluded when calculating the averages. A maximum value of 100 is placed on Trailing P/E and Forward P/E, a maximum value of 5 is placed on Forward PEG, and a maximum value of 20 is placed on Price to Sales when calculating the averages. Higher values are rounded down to the maximum for the averages.
Valuation Multiples The valuation multiples provide the Trailing P/E, Forward P/E, Forward PEG, and Price to Sales for the company and the S&P 500 index average. In addition, a comparison of the current company’s values to its 5-year average and an industry average are presented. A discount occurs when the company’s ratio is valued more favorably (lower) than that to which it is compared.
Risk The Risk Rating displays stocks on a scale of 1 to 10 with 10 being awarded to the least risky stocks. It is derived by looking at a series of long-term (5-year) and short-term (90-day) stock performance measures including volatility, magnitude of returns, beta, and correlation. Each factor is equally weighted. Then, equal deciles are used to rank each stock across the market. A stock needs to have at least two of the four risk factors in order to receive a score.
● Magnitude of Returns – The best / worst daily returns in the past 90 days and the best / worst monthly returns in the past 60 months.
● Volatility – The standard deviation of the stock price over the last 90 days and last 60 months, along with the average and largest intra-day stock swing.
● Beta – Measures the tendency of a security’s returns to respond to swings in the market, based on the beta of the company versus the relevant index.
● Correlation – Determines how closely the returns of the stock and the relevant index move together, measured over the last 90 days and last 60 months.
Risk Analysis Price analysis for the company and the S&P 500 is provided over two time periods. Daily analysis is provided for the last 90 days, whereas monthly statistics are used for the last 60 months.
Price Momentum The Price Momentum Rating is based on a combination of two technical performance factors: relative strength (70% weight) and seasonality (30% weight). After the weightings are considered to combine individual factors, equal deciles are used to rank each stock across the market on a scale of 1 to 10, with 10 being most favorable. A stock needs to have data for the relative strength factor in order to receive a score.
● Relative Strength – The relative strength of the company for the last 1 month, 3 months, and 6 months on a scale of 1 to 100.
● Seasonality – The average monthly return (price performance) for the currentmonth and next 2 months for the company and industry, over the past 10 years. A lower industry rank indicates a higher return.
Price Performance Daily close prices are used to calculate the price performance of the stock. The performance of the S&P 500 is also displayed as a means of comparison.
Insider Trading The Insider Trading Rating is based on short-term (70% weight) and long-term (30% weight) legal insider trading behavior. After the weightings are considered to combine individual factors, a function similar to a normal distribution is used to rank each stock across the market on a scale of 1 to 10, with 10 being most favorable. A stock needs to have at least one of the two insider trading factors in order to receive a score.
● Short-Term Insider – Uses insider buy and sell transactions within the past 90 days. This factor is based on the Thomson Reuters quantitative insider trading model that considers the insider's role, consensus, number of shares, market capitalization of the company, and the historic stock performance following trades by the given insider.
● Long-Term Insider – Looks at buying, selling and option exercise decisions over the past six months relative to other stocks within the same business sector. The net shares are presented alongside the business sector average as a means of comparison.
Monthly Buys and Sells The total market value of open-market buying and selling is displayed by month in the chart for easy comparison. Transactions by trusts and corporations are excluded, along with buys greater than $10 million and sales greater than $50 million. Transactions for the exercise of derivatives and option exercises are excluded from the totals.
Institutional Holders The top five institutional holders of the company are listed in descending order, based on their total share holdings. Possible values for the institution type include Brokerage, Funds, Inv Mgmt, or Strategic.
Executive Holders The top five executive insiders of the company are listed in descending order, based on their total direct common share holdings (options are not considered). Indirect holdings are excluded, as the owner may not actually have investment discretion over these shares. This table is updated monthly. Insiders who have not filed any transactions or holdings over the past two years are excluded as this may indicate that the individual is no longer associated with the company. Additionally, direct shares held must be greater than 1,000 to be considered.
Insider Roles These role codes may appear in the data for recent insider buys and sells or top executive holders:
AF - Affiliate IA - Investment Advisor AI - Affiliate of Advisor MC - Member of Committee B - Beneficial Owner MD - Managing Director C - Controller O - Officer CB - Chairman OB - Officer / Beneficial Owner CEO - Chief Executive Officer OD - Officer / Director CFO - Chief Financial Officer OE - Other Executive CI - Chief Investment Officer OS - Officer of Subsidiary CO - Chief Operating Officer OT - Officer / Treasurer CT - Chief Technology Officer OX - Divisional Officer D - Director P - President DO - Director / Beneficial Owner R - Retired DS - Indirect Shareholder S - Secretary EC - Member of Exec Committee SH - Shareholder EVP - Exec Vice President SVP - Senior Vice President FO - Former T - Trustee GC - General Counsel UT - Unknown GP - General Partner VC - Vice Chairman H - Officer / Director / Owner VP - Vice President
DISCLAIMER
Thomson Reuters content (“TR Content”) is the intellectual property of Thomson Reuters or its third party content providers. The copying, republication or redistribution of TR Content, including by framing or similar means is expressly prohibited without the prior written consent of Thomson Reuters. The TR content in this report does not constitute a recommendation to buy or sell securities of any kind or constitute investment advice. Past performance is not a guarantee of future results.
All information in this report is assumed to be accurate to the best of our ability. Thomson Reuters excludes all liability, to the maximum extent permitted by law, for any inaccuracies in the TR Content or for the consequences of your reliance on the TR Content. Investors should consider this report as only a single factor when making an investment decision.
INTERACTIVE BROKERS GROUP INC (IBKR-O)Banking & Investment Svcs. / Investment Banking & Svcs. / Financial Market Operators
STOCKREPORTS+DETAILED STOCK REPORT
Report Date: 2017 April 26
Page 12 of 12© 2017 Thomson Reuters. All rights reserved.
Related Documents