OFFICE OF THE ASSTT. ENGINEER (PIA-IWMP) P.S. BAITU DETAIL PROJECT REPORT BARMER (IWMP)-24 YEAR 2010-11 (UNDER INTEGRATED WATERSHED MANAGEMENT PROGRAMME) BLOCK: BAITU DISTRICT : BARMER AGRO CLIMATIC ZONE- I(A) TOTAL GEOGRAPHICAL AREA – 4942 Hac. EFFECTIVE AREA – 4942 HAC. COST OF PROJECT - 741.30 Lacs. UNIT COST- 15,000/Hac. SUBMITTED BY PROJECT MANAGER WaTERSHED CELL CUM DATA CENTRE (WCDC) BARMER, (RAJASTHAN)

Welcome message from author
This document is posted to help you gain knowledge. Please leave a comment to let me know what you think about it! Share it to your friends and learn new things together.
Transcript

OFFICE OF THE ASSTT. ENGINEER (PIA-IWMP) P.S. BAITU
DETAIL PROJECT REPORT
BARMER (IWMP)-24
YEAR 2010-11
(UNDER INTEGRATED WATERSHED MANAGEMENT PROGRAMME) BLOCK: BAITU DISTRICT : BARMER
AGRO CLIMATIC ZONE- I(A)
TOTAL GEOGRAPHICAL AREA – 4942 Hac.
EFFECTIVE AREA – 4942 HAC.
COST OF PROJECT - 741.30 Lacs.
UNIT COST- 15,000/Hac.
SUBMITTED BY
PROJECT MANAGER
WaTERSHED CELL CUM DATA CENTRE (WCDC)
BARMER, (RAJASTHAN)
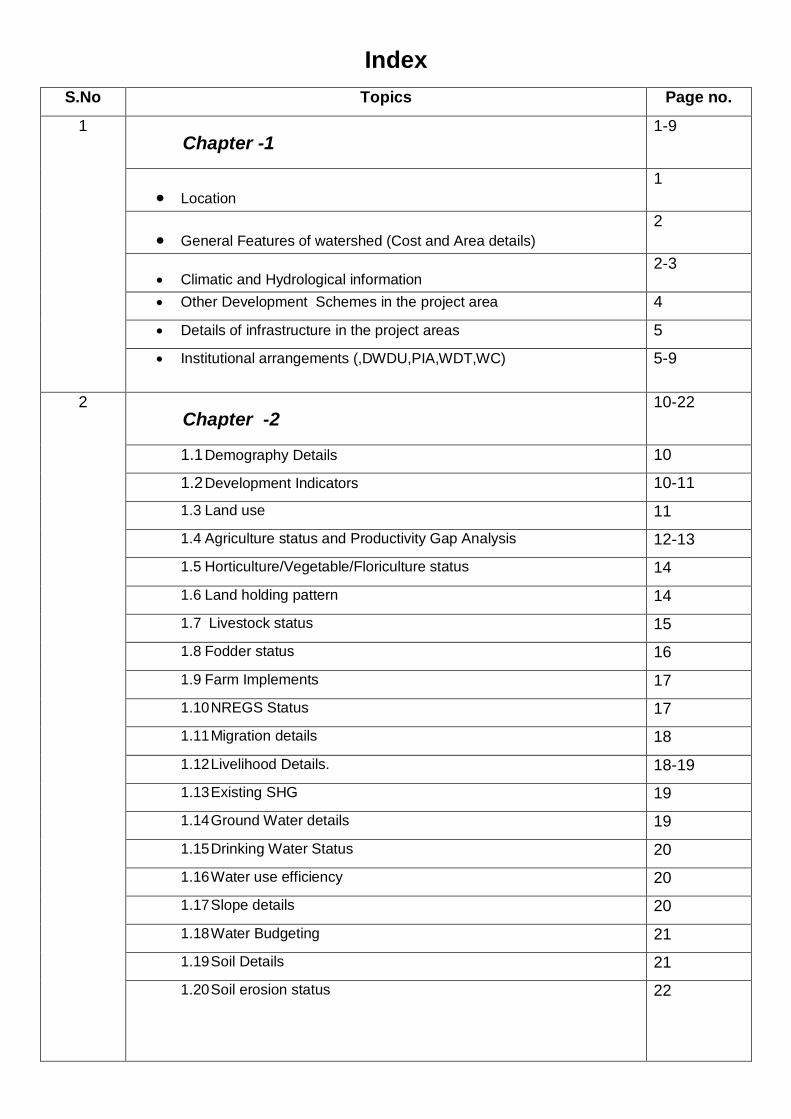
Index
S.No Topics Page no.
1 Chapter -1
1-9
Location 1
General Features of watershed (Cost and Area details) 2
Climatic and Hydrological information 2-3
Other Development Schemes in the project area 4
Details of infrastructure in the project areas 5
Institutional arrangements (,DWDU,PIA,WDT,WC)
5-9
2 Chapter -2
10-22
1.1 Demography Details 10
1.2 Development Indicators 10-11
1.3 Land use 11
1.4 Agriculture status and Productivity Gap Analysis 12-13
1.5 Horticulture/Vegetable/Floriculture status 14
1.6 Land holding pattern 14
1.7 Livestock status 15
1.8 Fodder status 16
1.9 Farm Implements 17
1.10 NREGS Status 17
1.11 Migration details 18
1.12 Livelihood Details. 18-19
1.13 Existing SHG 19
1.14 Ground Water details 19
1.15 Drinking Water Status 20
1.16 Water use efficiency 20
1.17 Slope details 20
1.18 Water Budgeting 21
1.19 Soil Details 21
1.20 Soil erosion status
22

3 Chapter-3 , Proposed Development Plan
23-24
4 Chapter-4, Activity wise Total Abstract of cost
25
5 Chapter-5, Annual Action Plan
1.1 Project fund 1.2 Convergence Plan
26-28
29
6 Chapter -6, Project outcomes
30
7 Technical designs and estimates for proposed
activities
8 Enclosures
8 .1 Maps
a. Location –District, block, village, watershed location map
b. Map of Project with Watershed Boundary demarcation in cadastral map
c. Land Use Land Cover map
d. Existing water bodies, DLT
e. PRA Map (along with photos & paper drawing)
f. GIS based intervention map
g. Treatment map ie proposed works on revenue map
8.2 Documents of Agreements:
Proceedings of gram sabha for EPA approval
Proceedings of gram sabha Resolution for committee constitution
Documents related to PRA exercise
Proceedings of gram sabha for DPR approval
Proceedings of Panchayat Samiti General body for DPR approval
Watershed Committee Registration certificate
MoU – PIA – DWMA, PIA – WC(in case of NGO as PIA)

CHAPTER – I
INTRODUCTION
Location.
Barmer (IWMP)-24 project is located in Baitu Block, of Barmer district. The project area is between the latitudes 26°2'18" to 26°3'22"E &longitudes 71°57'29" to 72°3'53".N It is at a distance of 45 km from its Block head quarters and 75 Kms from the district head quarters. There are no habitations & in the Project area and other details are given below. General features of watershed:-
S.No. Name of Project(as per GOI) Barmer-24
(a) Name of Catchment Cluster
(b) Name of watershed area(local name) Baitu-I (Chibi Cluster)
© Project Area 4942
(d) Net treatable Area 4942
(e) Cost of Project 741.30
(f) Cost/hectare 15000
(g) Year of Sanction 2010-2011
(h) Watershed Code Cluster
(i) No. of Gram Panchayats in project area 2
(j) No. of villages in project area 7 (k) Type of Project Desert
(l) Elevation (metres) 162-167
(m) Major streams -
(n) Slope range (%) 2% to 5%
Villagewise area covered in watershed:-
macro/micro
Name of Gram Panchayat
Name of Villages Covered
Census code of villages
Area
micro Chibi Chibi 02123300 845 micro Chibi Lego Ki Dhani 02121700 669 micro Chibi Bhilo Ki Dhani 02121600 213 micro Chibi Holani 02121900 570 micro Chibi Chenpura 02121500 241 micro Chibi Ambedgar Nagar 02122000 647 micro Santara Dholu 02124300 1757

The watershed falls in Agroclimatic Zone Dry Arid Hot.The soil texture is Sandy to sandy loam. The average rainfall is 30.3 cm . The temperatures in the area are in the range between 28º to 48º centigrade during summer and 7º to 32º centigrade during winter. The major crops in the area are Bajara , Moong, Moth,Til,Guar and 66% land is under cultivation 7% land fallow, 7% land is wasteland. 0% land is irrigated. 464 no of households are BPL (13.09% households) 107 are landless households (4.62% households) and 1320 household are small and marginal farmers 38% (household) .Average land holding in the area is 5 ha. 100% area is single cropped area and 0% is double cropped. The main source of irrigation is not available. The average annual rainfall (10 years) in the area is 256 mm. The Major streams in the Watershed are not available. The major festivals in the village are Holi,Diwali,Akha Teej & Idd. At present this villages is having 15582 population with Communities like Rajput,Bheel jat,Meghwal,purohit ,Tailor,Suthar. Climatic and Hydrological information:-
1 Average Annual Rainfall(mm)
Year Average Annual Rainfall(mm) 1 2001 238 mm
2 2002 56 mm
3 2003 702 mm
4 2004 200 mm
5 2005 66 mm
6 2006 666 mm
7 2007 200 mm
8 2008 306 mm
9 2009 163 mm
10 2010 435 mm
2 Average Monthly rainfall (last ten years)
Month Rainfall(mm)
i) June 27 mm
ii) July 107 mm
iii) August 118 mm
iv) September 29 mm
3 Maximum rainfall intensity (mm)
Duration rainfall intensity(mm) i) 15 minute duration 24
ii) 30 minute duration 18
iii) 60 minute duration 6
4 Temperature (Degree C)
Season Max Min i) Summer Season 48 28
ii) Winter Season 32 7
iii) Rainy Season 38 16
5 Potential Evaporation Transpiration (PET) (mm/day)
Season PET i) Summer 0.15
ii) Winter 0.01

iii) Rainy 0.01
6 Runoff i) Peak Rate (cum/hr) 260 ii) Total run off volume of rainy season (ha.m.) 0.012 iii) Time of return of maximum
flood 5 years Nill
10 years Nill
In-Year 25 Year
iv)Periodicity of Drought in village area
Once in 2.50 Year
Other Development Schemes in the project area:-
S.No Scheme
Name of
the
departme
nt
Key interventions under
the Scheme
Targeted
Beneficiari
es
Provisions under
the Scheme
1 MGNREGS RD
Construction of Tanka,
beri , Gravel Road, Nadi
etc
SC,ST,BPL
& Others
100 DAYS
Gurranted
employment
2 BRGF RD
Construction of
Anganwadi ,School
building,subcenter,Comm
unity center etc
Common
work
Gap filling for
infrastructure
properly use
3 TFC RD
Construction of tanka for
drinking water,
pipelines,Toilets etc
Common
work
Drinking water
& sinitation
4 SFC RD
Construction of tanka for
drinking water,
pipelines,Toilets etc
Common
work
Drinking water
& sinitation
5 IAY RD Construction of Houses BPL
families
Provide House
for poor people
6 ANGANWA
DI ICDS
Development for women
&Childern
women
&Childern
Development for
women
&Childern
7 TSC RD Construction of Toilets BPL
families Sanitation

Details of infrastructure in the project areas :-
Parameters Status
(i) No. of villages connected to the main
road by an all-weather road
7
(ii) No. of villages provided with electricity 4
(iii) No. of households without access to
drinking water
518
(iv) No. of educational institutions : (P)
10
(S)
2
(HS)
1
(VI)
0 Primary(P)/ Secondary(S)/ Higher
Secondary(HS)/ vocational
institution(VI)
(v) No. of villages with access to Primary
Health Centre
4
(vi) No. of villages with access to Veterinary
Dispensary
1
(vii) No. of villages with access to Post Office 1
(viii) No. of villages with access to Banks 1
(ix) No. of villages with access to Markets/
mandis
1
(x) No. of villages with access to Agro-
industries
1
(xi) Total quantity of surplus milk 0
(xii) No. of milk collection centres (U)
0
(S)
0
(PA)
0
(O)
Self
Ownership
(e.g. Union(U)/ Society(S)/ Private
agency(PA)/ others (O))
(xiii) No. of villages with access to Anganwadi
Centre
7
(xiv) Any other facilities with no. of villages
(please specify)
Mobile tower,Internet.
(xv) Nearest KVK Barmer
(xvi) cooperative society Chibi
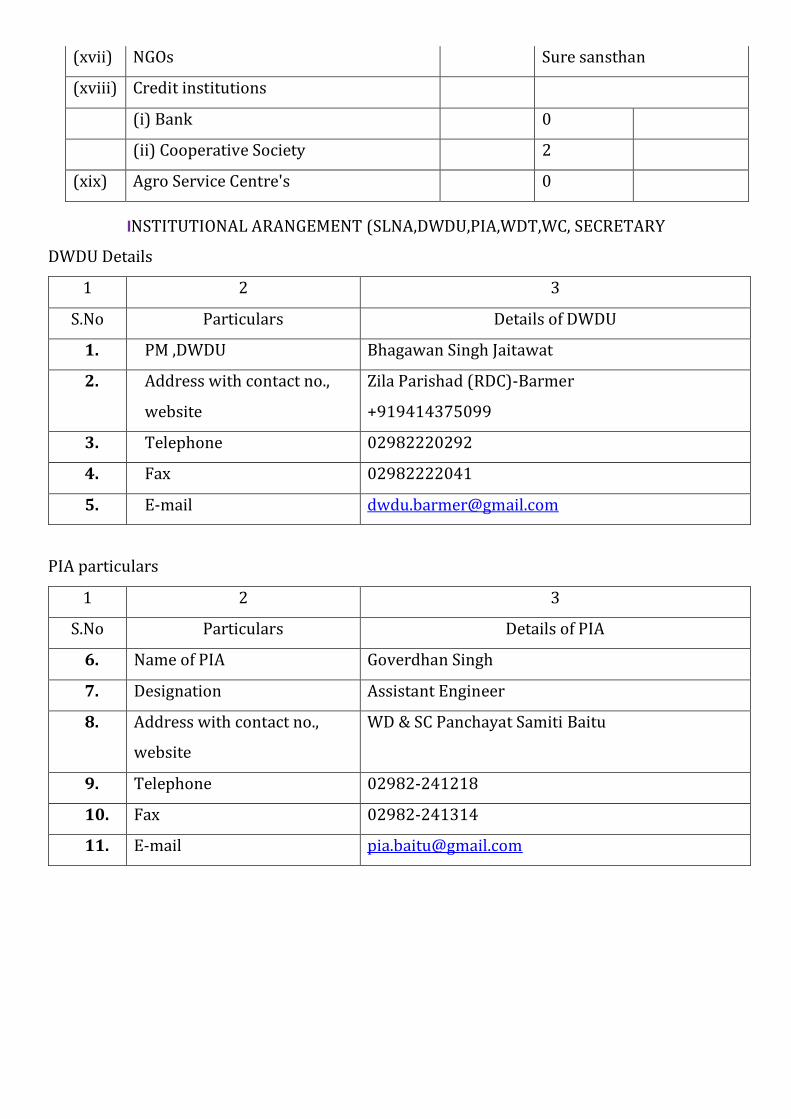
(xvii) NGOs Sure sansthan
(xviii) Credit institutions
(i) Bank 0
(ii) Cooperative Society 2
(xix) Agro Service Centre's 0
INSTITUTIONAL ARANGEMENT (SLNA,DWDU,PIA,WDT,WC, SECRETARY
DWDU Details
PIA particulars
1 2 3
S.No Particulars Details of DWDU
1. PM ,DWDU Bhagawan Singh Jaitawat
2. Address with contact no.,
website
Zila Parishad (RDC)-Barmer
+919414375099
3. Telephone 02982220292
4. Fax 02982222041
5. E-mail [email protected]
1 2 3
S.No Particulars Details of PIA
6. Name of PIA Goverdhan Singh
7. Designation Assistant Engineer
8. Address with contact no.,
website
WD & SC Panchayat Samiti Baitu
9. Telephone 02982-241218
10. Fax 02982-241314
11. E-mail [email protected]
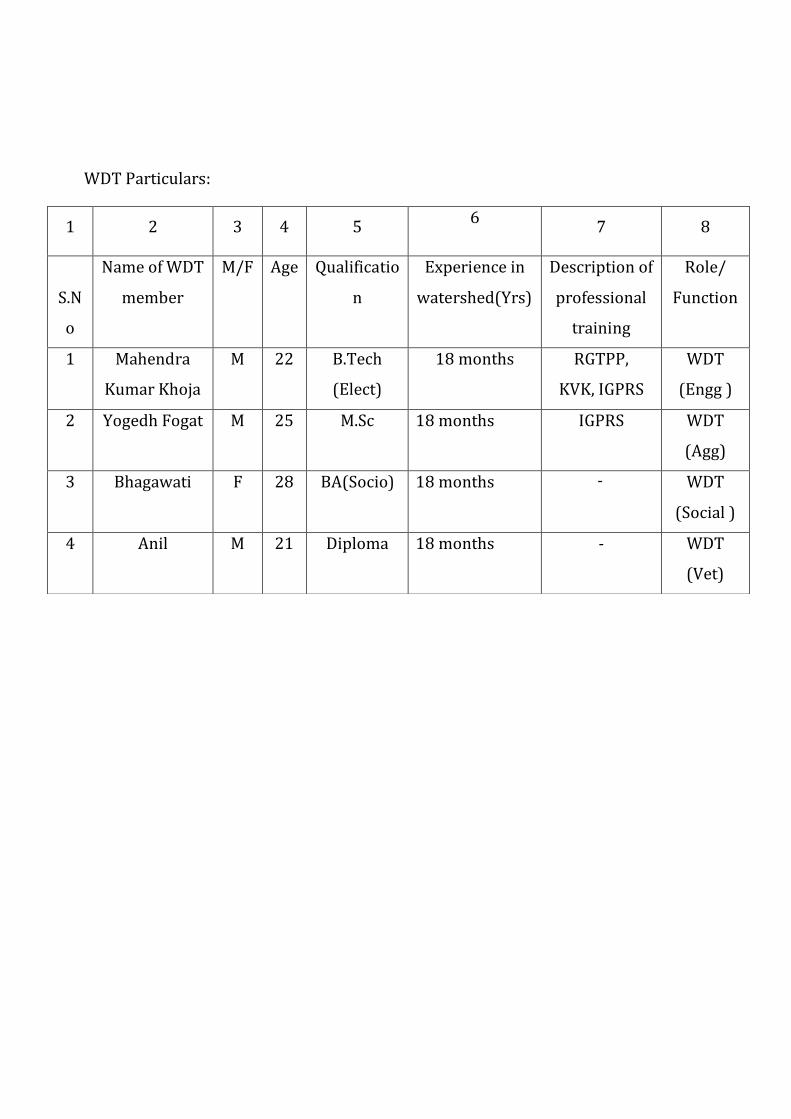
WDT Particulars:
1 2 3 4 5 6
7 8
S.N
o
Name of WDT
member
M/F Age Qualificatio
n
Experience in
watershed(Yrs)
Description of
professional
training
Role/
Function
1 Mahendra
Kumar Khoja
M 22 B.Tech
(Elect)
18 months RGTPP,
KVK, IGPRS
WDT
(Engg )
2 Yogedh Fogat M 25 M.Sc 18 months IGPRS WDT
(Agg)
3 Bhagawati F 28 BA(Socio) 18 months - WDT
(Social )
4 Anil M 21 Diploma 18 months - WDT
(Vet)
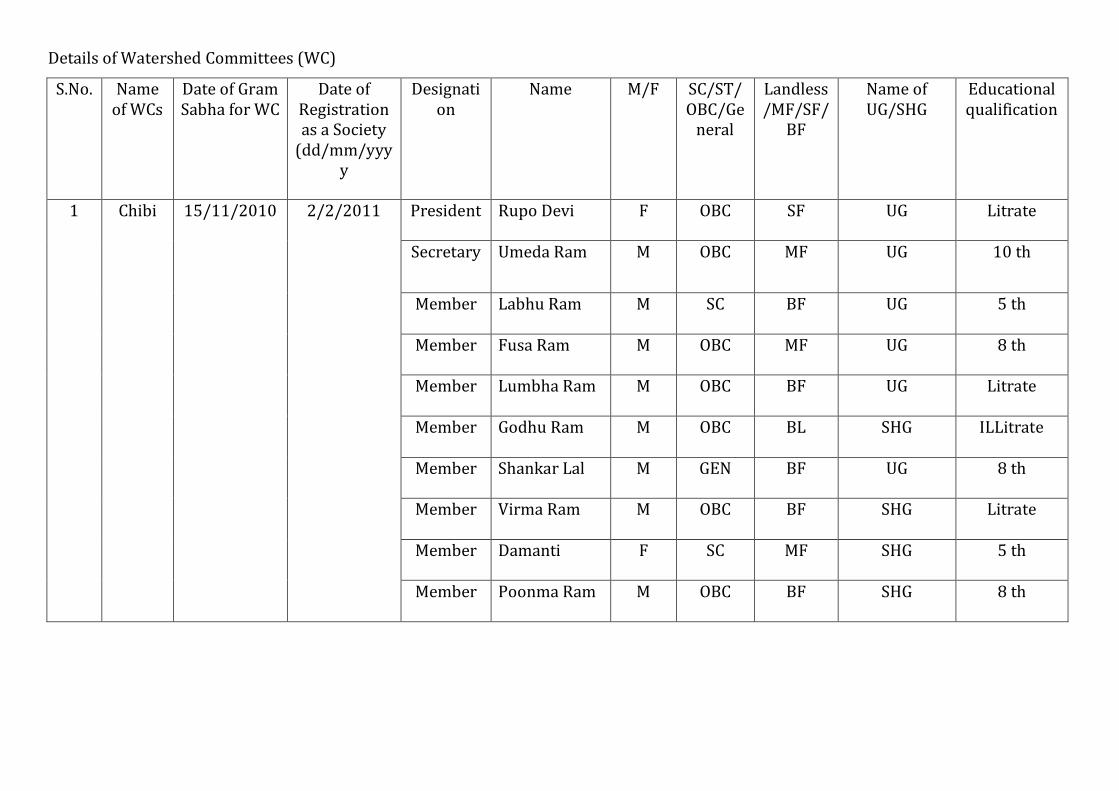
Details of Watershed Committees (WC)
S.No. Name of WCs
Date of Gram Sabha for WC
Date of Registration as a Society
(dd/mm/yyyy
Designation
Name M/F SC/ST/OBC/Ge
neral
Landless/MF/SF/
BF
Name of UG/SHG
Educational qualification
1 Chibi 15/11/2010 2/2/2011 President Rupo Devi F OBC SF UG Litrate
Secretary Umeda Ram M OBC MF UG 10 th
Member Labhu Ram M SC BF UG
5 th
Member Fusa Ram M OBC MF UG 8 th
Member Lumbha Ram M OBC BF UG Litrate
Member Godhu Ram M OBC BL SHG
ILLitrate
Member Shankar Lal M GEN BF UG 8 th
Member Virma Ram M OBC BF SHG Litrate
Member Damanti F SC MF SHG 5 th
Member Poonma Ram M OBC BF SHG
8 th

S.No. Name
of WCs
Date of Gram Sabha for WC
Date of Registration as a Society
(dd/mm/yyyy
Designation
Name M/F SC/ST/OBC/Ge
neral
Landless/MF/SF/
BF
Name of UG/SHG
Educational qualification
2 Santara 28/05/2011 15/06/2011 Chairman Dhuda Ram M OBC SF UG Literate
Secretary Ramsingh M Gen SF SHG Secondary
Member Sumer Singh M Genaral BF UG Literate
Member Amara Ram M SC SF SHG Literate
Member Bhikhi F SC BF UG Literate
Member Keshar Singh M Genaral SF SHG Literate
Member Virma Ram M SC BF UG Literate
Member Uda Ram M SC SF SHG Literate
Member Gop Singh M Gen BF SGH Literate
Member Jetha Ram M OBC SF SGH Literate
CHAPTER – II
Socio economic Features, Problems and Scope
The socio economic conditions of the area can be improved
through increased production which can be achieved through expansion in cultivated area and
productivity enhancement 620 ha land is arable wasteland and 420 ha is fallow can be
brought under cultivation. The productivity gap of major crops in the area as compared with
district and with areas in the same agro climatic zones indicate potential to increase the
productivity. The demonstration of improved package of practices, improved varieties,
increased irrigation facilities and soil conservation measures under the project can bridge this
gap. Due to small land holdings in the area focus of the project would be on diversification in
agriculture (horticulture, vegetables, green houses, Agro forestry, fodder crops)and
diversification in Livelihoods(Agriculture, Animal husbandry, self employment) 135919
Quintal fodder scarcity can be met out through Pasture development .Improved animal
Husbandry practices can increase the productivity of livestock. There are 220 persons
migrate due to lack of job& this migration can be checked through creation of employment
opportunities in the project area through increase in production and diversification in
agriculture and Livelihoods as mentioned above.
The wind erosion is the main problem in the watershed area.Here the wind
velocity reaches upto more than 70 m/sec.As the soil of watershed area is mainly sandy
therefore soil erosion occurs mainly due to wind leadind to land degradation.Here in
watershed area due to scanty rainfall runoff is less resulting in lesser soil erosion.Agriculture
in the watershed area is totally rainfed although there are some tube wells because people use
this water for drinking purpose only.Here in watershed area animal population is fairly good
but the need of breed improvement,vaccination medicinal camps are the key works to be
loked into.The runoff of the area harvest in khet talai /Farm pond and horticulture plantation
made to uplift income per household.People have large livestock holding but there are
problem of drinking water and fodder.To solve the drinking water existing nadi/traditional
rain water harvesting structures Tankas are to be constructed and renovated. Also to met
deficiency of fodder about 45 ha of pasture development can be done in the project area.
Natural Resource Management : The watershed area located in western Rajasthan desert . The ground water depth is 210 meter. Ground water mostly contains florid and is saline. The water is not potable for drinking. The people has to travel 4-5 KM for drinking water. There is no run off due to desert area. . As per need and suggestions given by the beneficiaries/ public representative, the tanka , talai have been proposed to drinking water. While socially surveying the area, it was realized that various water harvesting structures mostly Tanka , talai, khadin have been constructed in the area for storing the water. But due to non availability of pucca agore , outlets/ waste weirs the water was released by cutting the banks. The main problem of the area is availability of stored water. For further development, it has been planned that all the structures will be provided with waste weirs, so that the water can be stored up to the design level without any fear. At the present time no new talai/ ponds have been proposed. During the rainy season it was found that the rain water from the higher areas flows down and spread in the lower area and damaging the fields. As per need and suggestions given by the beneficiaries/ public representative, the diversion channels have been proposed to convey water to nearby ponds. This will certainly solve the problems of the area and sufficient water will also be stored for live stock will help in recharging the nearby wells. The agriculture land of the area is affected by sheet erosion and forming the rills/ gullies. The problem can be solved by bunding the fields. Therefore to protect the land, the main thrust is given on khadin with proper outlets. The agriculture land of the area is affected by wind erosion. The problem can be solved by vegetation , plantation on sand dunes. Therefore to protect the land, the main thrust is given on sand dune stabilization. Agriculture and Horticulture Productivity : In the watershed area the production of Agriculture and Horticulture Plants are not to that extent due to lack of improved variety and techniques. The Agriculture production of different crops grown in Kharif/ Rabi seasons of the proposed watershed area is shown in Table 13. The production will be increased by introduction of new varieties of different crop. The existing horticulture area is shown above. Live Stock –gap of fodder Availability : The existing fodder area in the villages of proposed area is shown above. The availability of fodder in the proposed watershed area is less. To meet the requirement, the farmers of the area have to purchase from other places. The fodder area has to be increased to reduce the demand. Livelihood and Micro enterprises : The people of the area are dependent on Agriculture. In the proposed area the landless families are fully dependent on work. After introduction of NREGA, these families are getting job in the area. But it is not to the extent to increase the livelihood. For development of their livelihood, the various meetings were organized to know their interest and skills. According to social survey conducted in different villages of the project area, different individual and group works/ activities like Kasidakari , Ker-sagari Udhyog,Bhjan Mandal, Carpentry, Mobile Repairing, Motor Cycle Repairing, Compute Hardware/ Software work and Compost Pit/ Vermi compost were identified. According to their interest homogeneous groups have been made. The main thrust was given for land less persons.
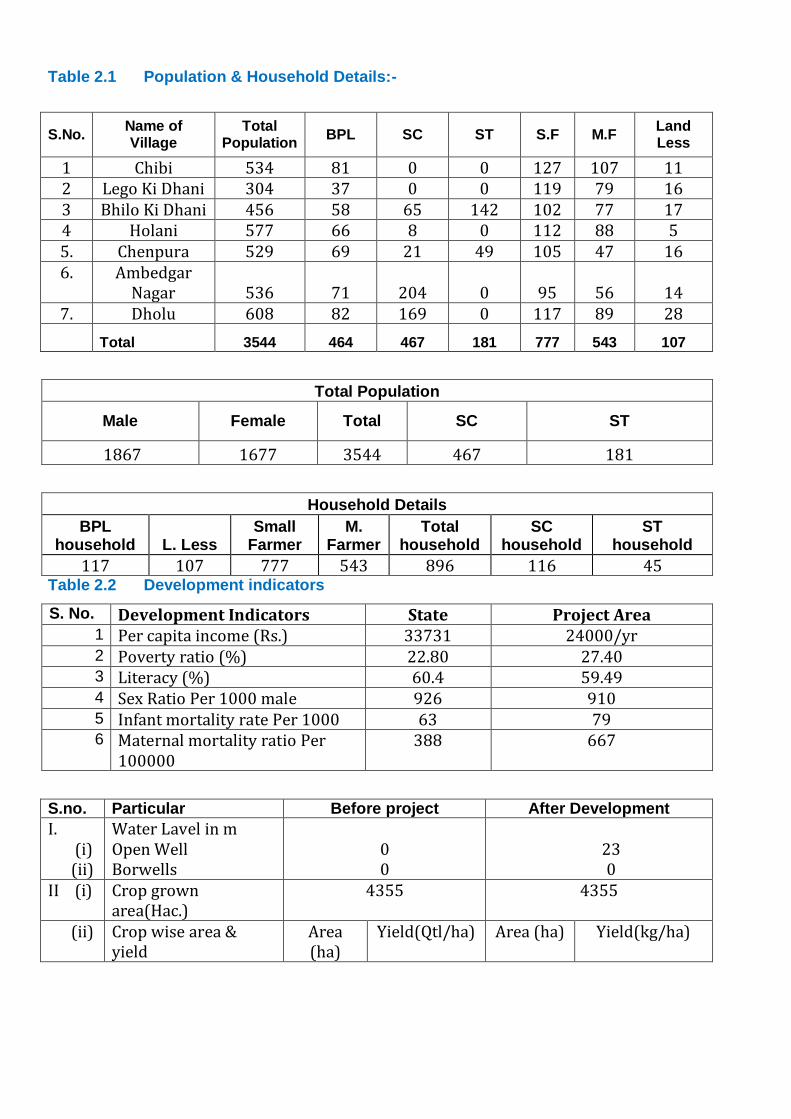
Table 2.1 Population & Household Details:-
S.No. Name of Village
Total Population
BPL SC ST S.F M.F Land Less
1 Chibi 534 81 0 0 127 107 11 2 Lego Ki Dhani 304 37 0 0 119 79 16 3 Bhilo Ki Dhani 456 58 65 142 102 77 17 4 Holani 577 66 8 0 112 88 5 5. Chenpura 529 69 21 49 105 47 16 6. Ambedgar
Nagar 536 71 204 0 95 56 14 7. Dholu 608 82 169 0 117 89 28
Total 3544 464 467 181 777 543 107
Total Population
Male Female Total SC ST
1867 1677 3544 467 181
Household Details
BPL household L. Less
Small Farmer
M. Farmer
Total household
SC household
ST household
117 107 777 543 896 116 45 Table 2.2 Development indicators
S. No. Development Indicators State Project Area 1 Per capita income (Rs.) 33731 24000/yr 2 Poverty ratio (%) 22.80 27.40 3 Literacy (%) 60.4 59.49 4 Sex Ratio Per 1000 male 926 910 5 Infant mortality rate Per 1000 63 79 6 Maternal mortality ratio Per
100000 388 667
S.no. Particular Before project After Development
I. (i) (ii)
Water Lavel in m Open Well Borwells
0 0
23 0
II (i) Crop grown area(Hac.)
4355 4355
(ii) Crop wise area & yield
Area (ha)
Yield(Qtl/ha) Area (ha) Yield(kg/ha)
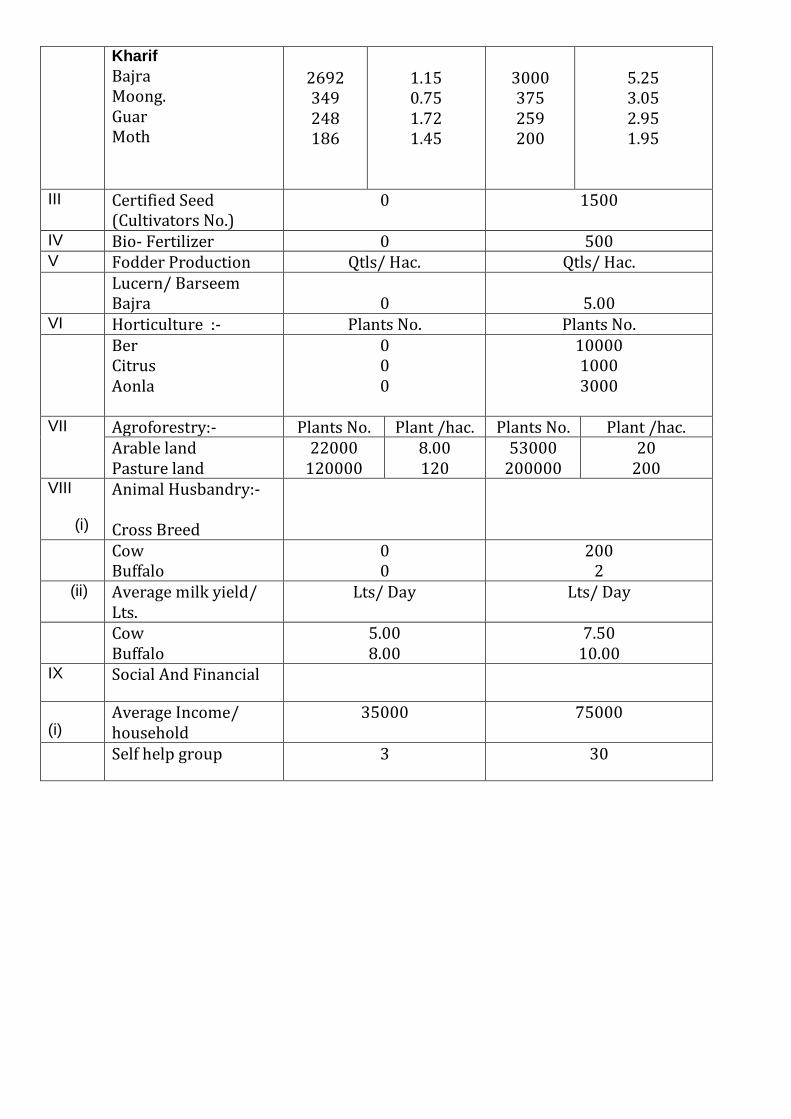
Kharif
Bajra Moong. Guar Moth
2692 349 248 186
1.15 0.75 1.72 1.45
3000 375 259 200
5.25 3.05 2.95 1.95
III Certified Seed (Cultivators No.)
0 1500
IV Bio- Fertilizer 0 500 V Fodder Production Qtls/ Hac. Qtls/ Hac. Lucern/ Barseem
Bajra
0
5.00 VI Horticulture :- Plants No. Plants No. Ber
Citrus Aonla
0 0 0
10000 1000 3000
VII Agroforestry:- Plants No. Plant /hac. Plants No. Plant /hac.
Arable land Pasture land
22000 120000
8.00 120
53000 200000
20 200
VIII (i)
Animal Husbandry:- Cross Breed
Cow Buffalo
0 0
200 2
(ii)
Average milk yield/ Lts.
Lts/ Day Lts/ Day
Cow Buffalo
5.00 8.00
7.50 10.00
IX Social And Financial
(i)
Average Income/ household
35000 75000
(ii) Self help group 3 30
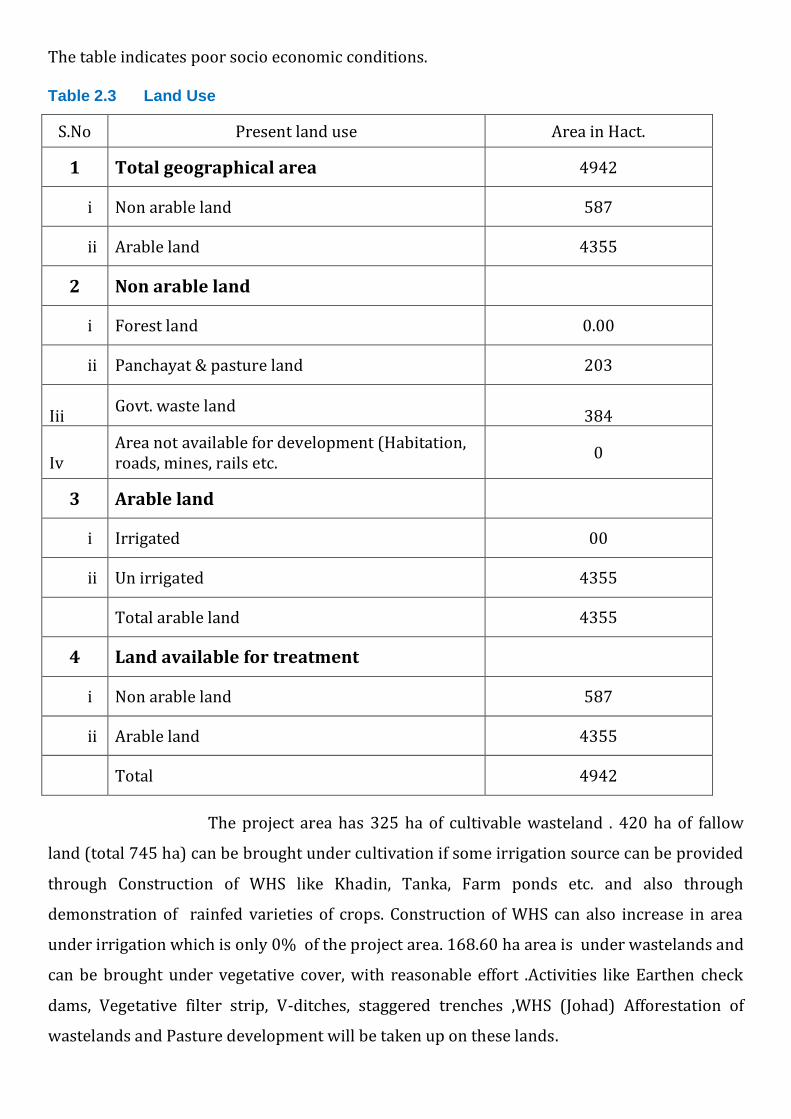
The table indicates poor socio economic conditions. Table 2.3 Land Use
S.No Present land use Area in Hact.
1 Total geographical area 4942
i Non arable land 587
ii Arable land 4355
2 Non arable land
i Forest land 0.00
ii Panchayat & pasture land 203
Iii
Govt. waste land
384
Iv
Area not available for development (Habitation, roads, mines, rails etc.
0
3 Arable land
i Irrigated 00
ii Un irrigated 4355
Total arable land 4355
4 Land available for treatment
i Non arable land 587
ii Arable land 4355
Total 4942
The project area has 325 ha of cultivable wasteland . 420 ha of fallow
land (total 745 ha) can be brought under cultivation if some irrigation source can be provided
through Construction of WHS like Khadin, Tanka, Farm ponds etc. and also through
demonstration of rainfed varieties of crops. Construction of WHS can also increase in area
under irrigation which is only 0% of the project area. 168.60 ha area is under wastelands and
can be brought under vegetative cover, with reasonable effort .Activities like Earthen check
dams, Vegetative filter strip, V-ditches, staggered trenches ,WHS (Johad) Afforestation of
wastelands and Pasture development will be taken up on these lands.

Pasture development the land use table shows that there is 250 hectare
pasture land (5%)This emphasizes the need for taking up pastureland development works
through sowing of promising species of grasses and plantation.
Table 2.4 .a Agriculture and Horticulture status and fuel availability. Cropping Status
Kharif season: (2010- 2011)
S.No Village Bajra Moong Guar Til Moth Total
1 Chibi 430 35 42 16 32 575
2 Lego Ki Dhani 226 42 18 9 22 317
3 Bhilo Ki Dhani 352 40 15 31 78 516
4 Holani 370 68 52 65 129 684
5 Chenpura 422 39 14 18 19 512
6. Ambedgar Nagar 375 35 42 16 32 555
7. Dholu 887 90 65 31 78 1251
Total 2692 349 248 186 390 4355
Table 2.4.b Abstract of cropped Area(ha)
The farmers are using Indigenous varieties of Bajra, whereas varieties like –Hybrid can increase the production. Crop of Bajra: The farmers are using Indigenous varieties of Bajra, whereas varieties like HHB-67,ICMH-356,RHB-30,RHB-131,HHB-67,CZP-9802 can increase the production of Bajra.Crop of Guar: The farmers are using Indigenous varieties of Guar, where as varieties like RGC-936,RGC-1002,RGC-1003,RGM-112 can increase the production of Guar. Crop of Moong: The farmers are using Indigenous varieties of Moong, where as varieties like RMG-62, K-851 can increase the production of Moong.Crop of Moth: The farmers are using Indigenous varieties of Moth, where as varieties like RMO-40, RMO-257,RMO-435 can increase the production of Moth.
Crop Rotation will vary from project to project Bajra - Guar
Guar - Moong Moong - Moth Moong - Fallow
The table shows that only 0 ha is (0%) is double cropped area. Also the crop rotation shows that fallow lands are there. This indicates that there is scope for change in crop rotation in fields where there are fallow lands through Soil and Water conservation measures, crop demonstration and diversification in agriculture. Soil and Water conservation measures besides putting fallow lands under cultivation can change the area under single cropping to double and multiple cropping.
Area under Single crop 4355
Area under Double crop 0
Area under Multiple crop 0

Table 2.4.c Productivity Gap Analysis (The table can also be given in bar chart form)
Bajra 738 645 525 173 125 Moong 410 338 305 107 78 Moth 315 198 195 194 155 Guar 465 305 295 207 174
Analysis of the above table indicate that besides national gap there is wide gap in productivity within state and even within same agro climatic zones. The reasons for this variation are.The farmers are using varieties desi of Bajra moong monthwhereas the recommended varieties like Bajra-Kamdhenu, SR11(Gaveri) Moth- RMO40 ,RMO256 Moong-RMG268,SML268,IPM02-3, Guar-KS277,HFG119,HFG156 etc. Lack of Availability of good quality seeds of desired crop and variety in adequate quantities and time to the farmers. 267341 cum runoff/water availability for cultivation. The productivity gap and reasons of it indicate potential to increase the productivity through crop demonstration .Crop demonstrations would be carried out on improved crops/ varieties, improved agronomic practices. INM, IPM, Mixed cropping, distribution of fodder seed mini kit. Demonstration of improved methods and economics of fodder crops cultivation and also distribution foundation seeds of Forage Crops for further multiplication, introduction of fodder crops in the existing crop rotations. Table 2.5 Existing area under horticulture/Vegetables/Floriculture (ha)
Activity Area Species Varieties Recommended varieties Production
Horticulture NIL NIL NIL NIL NIL
Vegetables NIL NIL NIL NIL NIL
Floriculture NIL NIL NIL NIL NIL
Table 2.6 Land holding Pattern in project area
Type of Farmer
Total Househ
olds
Land holding (ha) irrigation source wise
Land holding (ha)Social group wise
Irrigated
(source)
Rainfed
Total
General
SC ST OBC BPL
(i)Large farmer 777 - 777 777 568
- - 248 -
(ii) Small farmer 1320 - 1320 1320
827 478 215 315 187
(iii) Marginal farmer 543 - 543 543
59 289 123 38 419
(iv) Landless person 107 - 107 107
607 52 47 15 170
Total 2204 - 2204 2204 2061 819 385 616 776
Name of the crop
Productivity kg/ha
India Highest Average
in Rajasthan
Highest Average of Agro climatic zone District Project Area
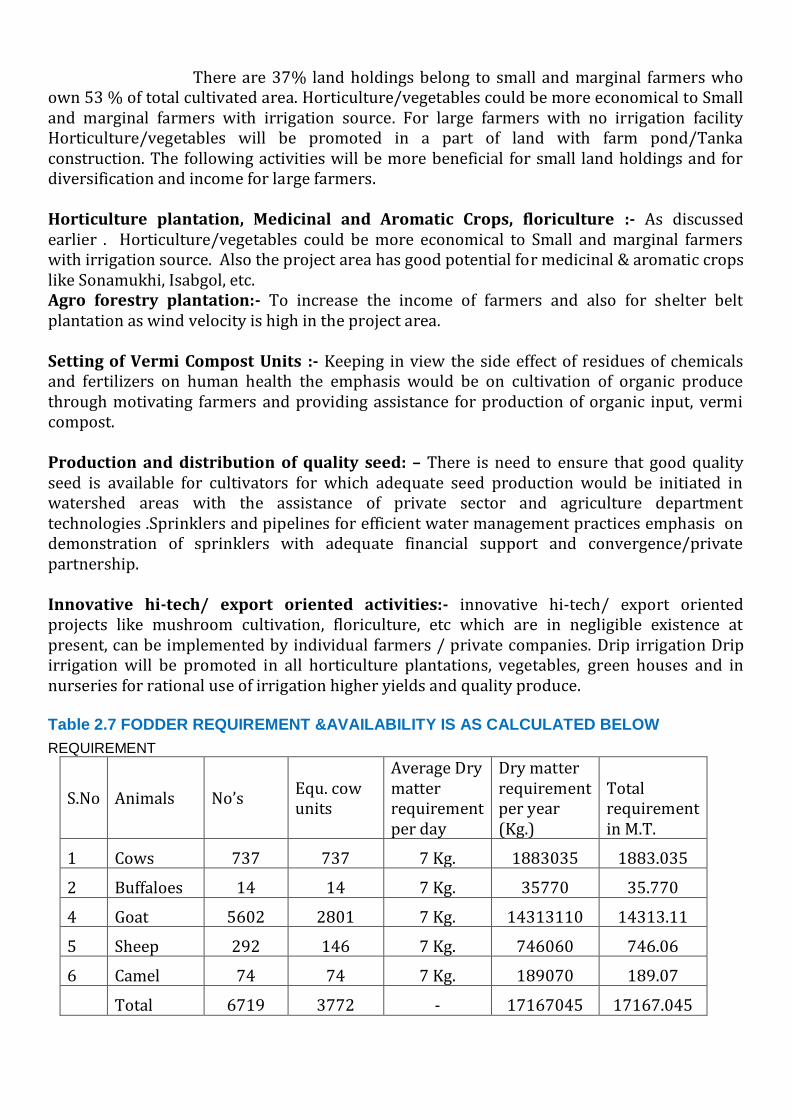
There are 37% land holdings belong to small and marginal farmers who own 53 % of total cultivated area. Horticulture/vegetables could be more economical to Small and marginal farmers with irrigation source. For large farmers with no irrigation facility Horticulture/vegetables will be promoted in a part of land with farm pond/Tanka construction. The following activities will be more beneficial for small land holdings and for diversification and income for large farmers. Horticulture plantation, Medicinal and Aromatic Crops, floriculture :- As discussed earlier . Horticulture/vegetables could be more economical to Small and marginal farmers with irrigation source. Also the project area has good potential for medicinal & aromatic crops like Sonamukhi, Isabgol, etc. Agro forestry plantation:- To increase the income of farmers and also for shelter belt plantation as wind velocity is high in the project area. Setting of Vermi Compost Units :- Keeping in view the side effect of residues of chemicals and fertilizers on human health the emphasis would be on cultivation of organic produce through motivating farmers and providing assistance for production of organic input, vermi compost. Production and distribution of quality seed: – There is need to ensure that good quality seed is available for cultivators for which adequate seed production would be initiated in watershed areas with the assistance of private sector and agriculture department technologies .Sprinklers and pipelines for efficient water management practices emphasis on demonstration of sprinklers with adequate financial support and convergence/private partnership. Innovative hi-tech/ export oriented activities:- innovative hi-tech/ export oriented projects like mushroom cultivation, floriculture, etc which are in negligible existence at present, can be implemented by individual farmers / private companies. Drip irrigation Drip irrigation will be promoted in all horticulture plantations, vegetables, green houses and in nurseries for rational use of irrigation higher yields and quality produce. Table 2.7 FODDER REQUIREMENT &AVAILABILITY IS AS CALCULATED BELOW
REQUIREMENT
S.No Animals No’s Equ. cow units
Average Dry matter requirement per day
Dry matter requirement per year (Kg.)
Total requirement in M.T.
1 Cows 737 737 7 Kg. 1883035 1883.035
2 Buffaloes 14 14 7 Kg. 35770 35.770
4 Goat 5602 2801 7 Kg. 14313110 14313.11
5 Sheep 292 146 7 Kg. 746060 746.06
6 Camel 74 74 7 Kg. 189070 189.07
Total 6719 3772 - 17167045 17167.045

FODDER AVAILABILITY
S.No. Name of Crop Area in
Hac. Coo production
M.T./Hac. Fodder
Availability
A. 1. 2. 3. B. D. 1. 2. 3.
(In Watershed Area) Kharif Crop ;- Bajra Moong Guar Culturable vaste land & pasture land (Out of watershed village Area) Bajra Moong Guar
2692 349 248 750 2500 500 450
0.50 0.20 0.40 2.00 0.50 0.20 0.40
789.00 48.60 90.80 2100.00 1261.50 102.40 185.80
Total
-
-
3575.10
The table above shows there is fodder deficiency (Requirement is 17167.045 tons-and
availability is 4575.10 tons/yr.)
To minimize the large and expanding gap between feed and fodder resource availability
and demand there is need for
Increase in area under fodder crops
Increase in productivity of fodder crops
Development of pastures
And reduction in large number of livestock production through replacement by few but
productive animals
Table 2.9 Agriculture implements
Farm mechanization and seed banks: - As discussed earlier 61 % land holdings belong to
small and marginal farmers who own only 53 % of total cultivated area so owning of big
farm implements by individual farmers is not economical so SHG would be promoted to
buy farm implements and rent to farmer.
S. No Implements Nos.
1 Tractor 30
2 Sprayers-manual/ power 60
3 Cultivators/Harrows 30
4 Seed drill 30
5 Any Other 30

Table 2.10 NREGA Status - No. of Card Holder, activities taken so far, employment
status.
S.No
Name of
Village
No. of
Card
Holders
Employment
Activity taken so far
1
Chibi 136 130 1.Excavation of Talab / Nadi 2.Constraction of Gravel Road 3.Constraction of Tanka
2 Lego Ki Dhani
73 65 1.Excavation of Talab / Nadi 2.Constraction of Gravel Road 3. Constraction of Tanka
3 Bhilo Ki Dhani
112 102 1.Excavation of Talab / Nadi 2.Constraction of Gravel Road 3. Constraction of Tanka
4 Holani 132 107 1.Excavation of Talab / Nadi
2.Constraction of Gravel Road 3. Constraction of Tanka
5 Chenpura 113 102 1.Excavation of Talab / Nadi
2.Constraction of Gravel Road 3. Constraction of Tanka
6
Ambedgar Nagar
129 119 1.Excavation of Talab / Nadi 2.Constraction of Gravel Road 3. Constraction of Tanka
7 Dholu 217 195 1.Excavation of Talab / Nadi
2.Constraction of Gravel Road 3. Constraction of Tanka
Total 912 820 -
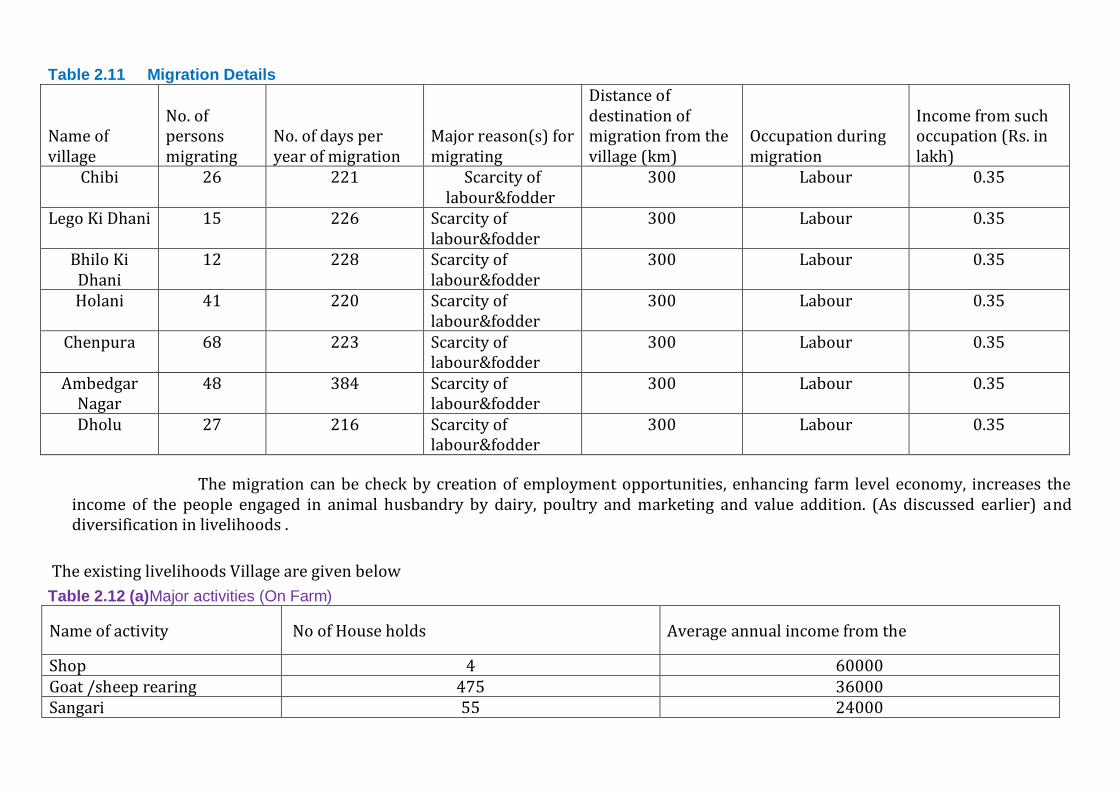
Table 2.11 Migration Details
Name of village
No. of persons migrating
No. of days per year of migration
Major reason(s) for migrating
Distance of destination of migration from the village (km)
Occupation during migration
Income from such occupation (Rs. in lakh)
Chibi 26 221 Scarcity of labour&fodder
300 Labour 0.35
Lego Ki Dhani 15 226 Scarcity of labour&fodder
300 Labour 0.35
Bhilo Ki Dhani
12 228 Scarcity of labour&fodder
300 Labour 0.35
Holani 41 220 Scarcity of labour&fodder
300 Labour 0.35
Chenpura 68 223 Scarcity of labour&fodder
300 Labour 0.35
Ambedgar Nagar
48 384 Scarcity of labour&fodder
300 Labour 0.35
Dholu 27 216 Scarcity of labour&fodder
300 Labour 0.35
The migration can be check by creation of employment opportunities, enhancing farm level economy, increases the income of the people engaged in animal husbandry by dairy, poultry and marketing and value addition. (As discussed earlier) and diversification in livelihoods .
The existing livelihoods Village are given below
Table 2.12 (a)Major activities (On Farm)
Name of activity No of House holds Average annual income from the
Shop 4 60000 Goat /sheep rearing 475 36000 Sangari 55 24000
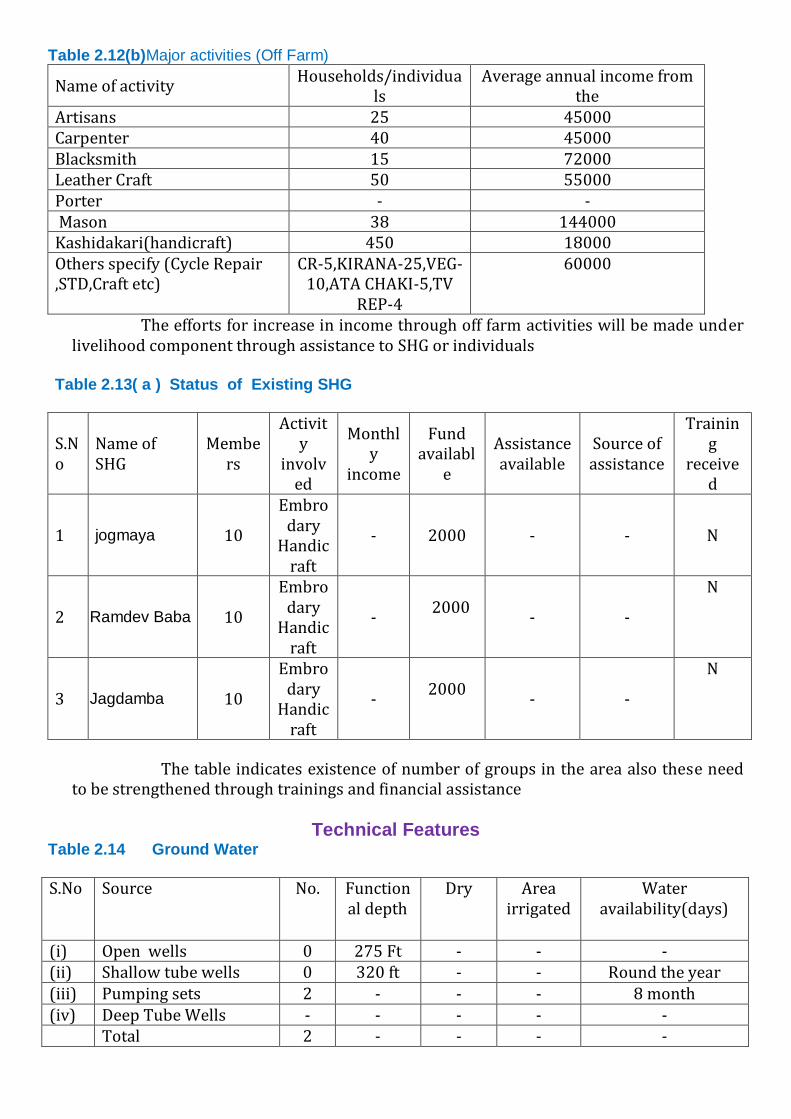
Table 2.12(b)Major activities (Off Farm)
Name of activity Households/individua
ls Average annual income from
the Artisans 25 45000 Carpenter 40 45000 Blacksmith 15 72000 Leather Craft 50 55000 Porter - - Mason 38 144000 Kashidakari(handicraft) 450 18000 Others specify (Cycle Repair ,STD,Craft etc)
CR-5,KIRANA-25,VEG-10,ATA CHAKI-5,TV
REP-4
60000
The efforts for increase in income through off farm activities will be made under livelihood component through assistance to SHG or individuals
Table 2.13( a ) Status of Existing SHG
S.No
Name of SHG
Members
Activity
involved
Monthly
income
Fund availabl
e
Assistance available
Source of assistance
Training
received
1 jogmaya 10
Embrodary
Handicraft
- 2000 - - N
2 Ramdev Baba 10
Embrodary
Handicraft
-
2000
- -
N
3 Jagdamba 10
Embrodary
Handicraft
-
2000
- -
N
The table indicates existence of number of groups in the area also these need to be strengthened through trainings and financial assistance
Technical Features
Table 2.14 Ground Water
S.No Source No. Functional depth
Dry Area irrigated
Water availability(days)
(i) Open wells 0 275 Ft - - - (ii) Shallow tube wells 0 320 ft - - Round the year (iii) Pumping sets 2 - - - 8 month (iv) Deep Tube Wells - - - - - Total 2 - - - -

The table indicates ground water very deep and also need to recharge by construction of anicut and other water harvesting structures.
Table 2.15 Availability of drinking water
S.No Name of the village
Drinking water
requirement
Ltrs/day
Present availability of drinking
water Ltrs/day
No. of drinking
water sources
available
No. functional
No. requires repairs
1 Chibi 400000 300000 15 15 -
2 Lego Ki Dhani
75000 35000 - - -
3 Bhilo Ki Dhani
50000 25000 - - -
4 Holani 150000 100000 4 4 4
5 Chenpura 400000 300000 15 15 -
6 Ambedgar Nagar
75000 35000 - - -
7 Dholu 50000 25000 - - -
Table 2.16 Water Use efficiency
Name of major crop
Area (Hectare) through water
saving devices(Drip/S
prinklers)
through water conserving
agronomic practices#
Any other (pl. specify)
Total
Bajara 0 240 - 240 The tables above indicate need for judicious use of available Water. Encouraging optimum use of water through installation of sprinklers on every operational wells
Table 2.17 Slope details.
Slope of Watershed
S.No. Slope percentage
Area in hectares
1 0 to 3% 2342 2 3 to 8% 921 3 8 to 25% 943 4 > 25% 224
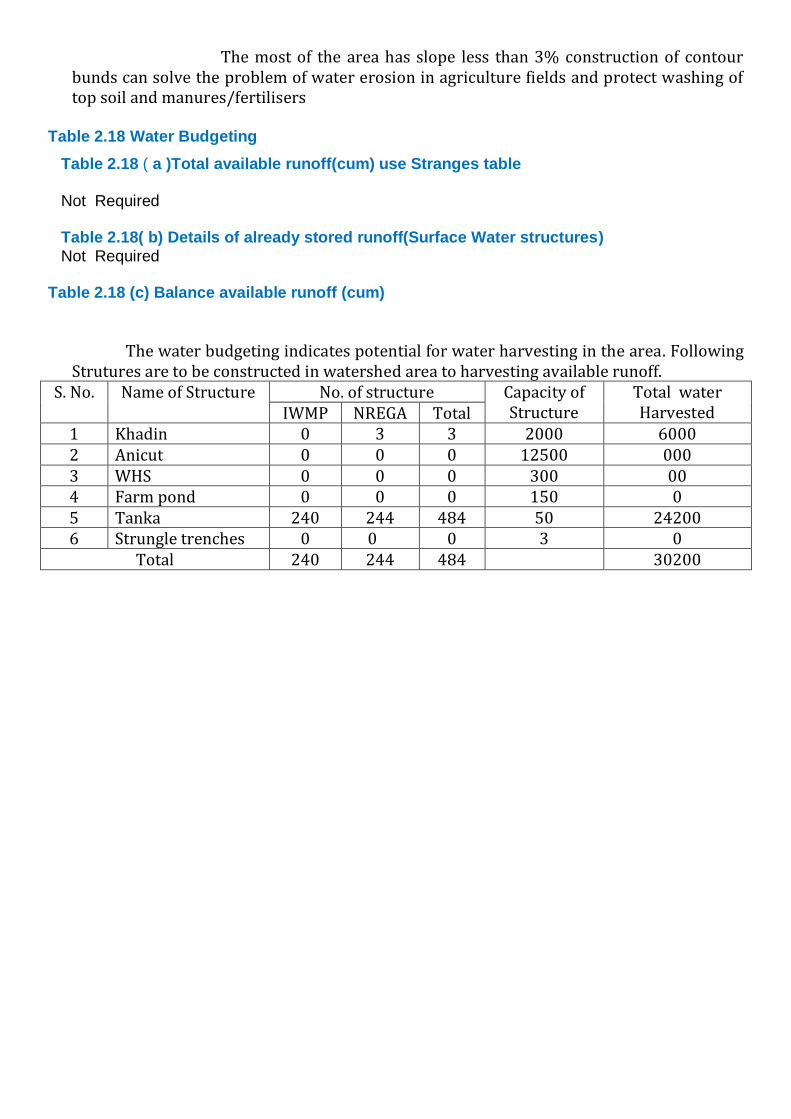
The most of the area has slope less than 3% construction of contour bunds can solve the problem of water erosion in agriculture fields and protect washing of top soil and manures/fertilisers
Table 2.18 Water Budgeting
Table 2.18 ( a )Total available runoff(cum) use Stranges table Not Required Table 2.18( b) Details of already stored runoff(Surface Water structures)
Not Required
Table 2.18 (c) Balance available runoff (cum)
The water budgeting indicates potential for water harvesting in the area. Following Strutures are to be constructed in watershed area to harvesting available runoff.
S. No. Name of Structure No. of structure Capacity of Structure
Total water Harvested IWMP NREGA Total
1 Khadin 0 3 3 2000 6000 2 Anicut 0 0 0 12500 000 3 WHS 0 0 0 300 00 4 Farm pond 0 0 0 150 0 5 Tanka 240 244 484 50 24200 6 Strungle trenches 0 0 0 3 0
Total 240 244 484 30200

Table 2.19 Soil details /Soil Profile
A Major Soil Classes Area in hectares 1 Sandy 865 2 Sandy loam 3686 3 Rocky 0 Soil Depth :
B. Depth (Cms.) Area in hectares
1 0.00 to 7.50 350 2 7.50 to 45.00 3500 3 > 45.00 623 C Soil fertility Status Kg/ha Recommended N 60 120 P 12 80 K 1.50 40 Micronutrients PPM
The analysis of table shows need to improve and maintain soil fertility. Soil health card to every farmer every crop season will be provided, which will include the recommendation for Application micro nutrient and fertilizers
Table 2.20 Erosion details
Erosion status in project Area
Cause Type of erosion
Area affected
(ha)
Run off(mm/
year) Average soil loss
(Tonnes/ ha/ year) Water erosion
a Sheet - - - - b
Rill -
- -
c Gully --
-
-
Sub-Total - Wind erosion 4942 5.6 4942
Total for project 4942 6287.50
The need is: To check land degradation To reduce excessive biotic pressure by containing the number and increase of livestock To check cultivation on sloping lands without adequate precautions of soil and water conservation measures To discourage cultivation along susceptible nallah beds To check Faulty agriculture techniques To check Uncontrolled grazing and developed cattle tracks To check Deforestation of steep slopes To check erosive velocity of runoff, store Runoff, to arrest silt carried by runoff and to recharge Ground Water structures life Earthen check dams, gully plugs, Bank Stabilisation, Loose stone check Dams, Gabions, Earthen embankment (Nadi) and Anicuts would be taken up.

CHAPTER - III
Proposed Development Plan
The Activities are indicative addition /deletion in activities will be as per local conditions
A) Preparatory phase activities Capacity Building Trainings and EPA
The IEC activities like Group meetings, door to door campaign, slogans and wall writings etc. were carried out in all the habitations of Barmer-VI Micro Watershed. A series of meetings were conducted with GP members, community and discussed about the implementation of IWMP programme. User groups were also formed. Grama Sabhas were conducted for approval of EPA (Village), for selecting the watershed committee and approval of DPR.
S.no Name of the Gram Panchayat Date on which Grama
Sabha approved EPA
1 Chibi 6/6/2011
2 Santara 5/7/2011
1 4 5 6 7 8 9 10 11
S. No.
Names of village
Amount earmarked
for EPA
Entry Point
Activities planned
Estimated cost
Expenditure incurred
Balance Expected outcome
Actual outcome
1 Chibi 5.07lacs Tanka & Tanka
Repairing
5.07lacs 5.07lacs - Drinking water for 15 Family
Drinking water for 15 Family
2 Lego Ki Dhani
3.345 lacs Tanka & Tanka Repairing
3.345 lacs 3.345 lacs - Drinking water for 5 Family
Drinking water for 5 Family
3 Bhilo Ki Dhani
1.278 lacs Tanka & Tanka Repairing
1.278 lacs 1.278 lacs - Drinking water for 13 Family
Drinking water for 13 Family
4 Holani 3.42 lacs Tanka & Tanka Repairing
3.42 lacs 3.42 lacs - Drinking water for 11 Family
Drinking water for 11 Family
5 Chenpura 1.446 lacs Tanka & Tanka Repairing
1.446 lacs 1.446 lacs - Drinking water for 12 Family
Drinking water for 12 Family
6. Ambedgar Nagar
3.882 lacs Tanka & Tanka Repairing
3.882 lacs 3.882 lacs - Drinking water for 16 Family
Drinking water for 16 Family
7. Dholu 10.542 lacs Tanka & Tanka Repairing
10.542 lacs 10.542 lacs - Drinking water for 18 Family
Drinking water for 18 Family

The PRA exercise was carried out in all the villages on the dates shown below:
S.no Name of the village/Habitation Date on which PRA
conducted
1 Chibi 30.07.2011
2 Lego Ki Dhani 31.08.2011
3 Bhilo Ki Dhani 01.07.2011
4 Holani 04.08.2011
5 Chenpura 05.08.2011
6 Ambedgar Nagar 04.08.2011
7 Dholu 05.08.2011
Transact walk were carried out involving the community for Social mapping,
Resource mapping. Detailed discussions and deliberations with all the primary
stakeholders were carried out.
Socio-economic survey was carried out during 1/07/2011 to 31/8/2011 (dates)
period covering all the households and primary data on demography, Land holdings,
Employment status, Community activities etc. was collected as mentioned in chapter 2.
State remote sensing department was assigned the work of preparing various thematic
layers using Cartosat-1 and LISS-3 imageries for Creation, development and management of
geo-spatial database depicting present conditions of land (terrain), water and vegetation
with respect to watershed under different ownerships at village level
Various thematic layers provided by SRSAC are :
Digitised Khasara maps of the villages falling in project area.
Base maps (transport network, village/boundaries, and settlements).
Land Use / Land cover map.
Based on GIS thematic layers, Field visits , PRA and analysis of benchmark data (as
discussed in chapter 2) final Treatment plan on revenue map for implementation has been
framed. Thus each intervention identified has been marked on revenue map (map enclosed in
DPR as annexure.The GIS based intervention map,PRA based intervention map are annexed.
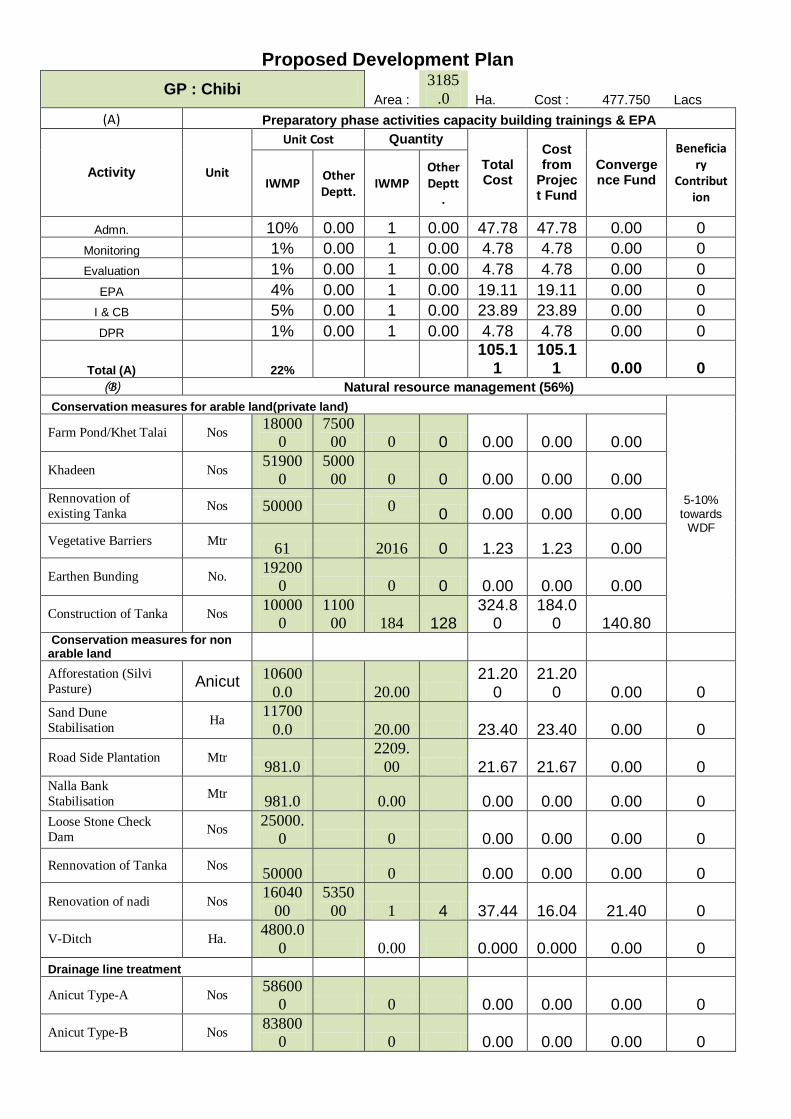
Proposed Development Plan
GP : Chibi Area :
3185
.0 Ha. Cost : 477.750 Lacs (A) Preparatory phase activities capacity building trainings & EPA
Activity Unit
Unit Cost Quantity
Total Cost
Cost from
Project Fund
Convergence Fund
Beneficiary
Contribution
IWMP Other Deptt.
IWMP Other Deptt
.
Admn. 10% 0.00 1 0.00 47.78 47.78 0.00 0
Monitoring 1% 0.00 1 0.00 4.78 4.78 0.00 0 Evaluation 1% 0.00 1 0.00 4.78 4.78 0.00 0
EPA 4% 0.00 1 0.00 19.11 19.11 0.00 0 I & CB 5% 0.00 1 0.00 23.89 23.89 0.00 0 DPR 1% 0.00 1 0.00 4.78 4.78 0.00 0
Total (A) 22% 105.1
1 105.1
1 0.00 0 (B) Natural resource management (56%) Conservation measures for arable land(private land)
5-10% towards
WDF
Farm Pond/Khet Talai Nos
18000
0
7500
00 0 0 0.00 0.00 0.00
Khadeen Nos 51900
0
5000
00 0 0 0.00 0.00 0.00 Rennovation of
existing Tanka Nos 50000
0
0 0.00 0.00 0.00
Vegetative Barriers Mtr 61 2016 0 1.23 1.23 0.00
Earthen Bunding No.
19200
0 0 0 0.00 0.00 0.00
Construction of Tanka Nos 10000
0
1100
00 184 128 324.8
0 184.0
0 140.80 Conservation measures for non
arable land
Afforestation (Silvi
Pasture) Anicut
10600
0.0 20.00 21.20
0 21.20
0 0.00 0 Sand Dune
Stabilisation Ha
11700
0.0 20.00 23.40 23.40 0.00 0
Road Side Plantation Mtr 981.0
2209.
00 21.67 21.67 0.00 0 Nalla Bank
Stabilisation Mtr
981.0 0.00 0.00 0.00 0.00 0 Loose Stone Check
Dam Nos
25000.
0 0 0.00 0.00 0.00 0
Rennovation of Tanka Nos 50000 0 0.00 0.00 0.00 0
Renovation of nadi Nos
16040
00
5350
00 1 4 37.44 16.04 21.40 0
V-Ditch Ha. 4800.0
0 0.00 0.000 0.000 0.00 0 Drainage line treatment
Anicut Type-A Nos
58600
0 0 0.00 0.00 0.00 0
Anicut Type-B Nos 83800
0 0 0.00 0.00 0.00 0

Anicut Type-C Nos 97300
0 0 0.00 0.00 0.00 0
Anicut Type-D Nos 18060
00 0 0.00 0.00 0.00 0
Total (B) 4450 132 429.7 267.5
4 162.20
( C ) Production System and micro enterprise(19%)
Production measures for arable land
20-40%
towards
project cost
Horticulture plantation
19 % of
Project Cost
1 1 94.72 90.77 3.944
Sprinklers and Drip irrigation
Floriculture
Vegetables
Medicinal plants
Vermi compost
Crop Demonstration Micro Enterprise 0
Dairy 0
poultry 0
Local Artisans/crafts 0
Food Processing 0 Other
Total (C) 94.72 90.77 3.94 0
(D) Consolidation 3% 14.33 14.33 0.00 0
Grand Total
643.89
477.75 166.14
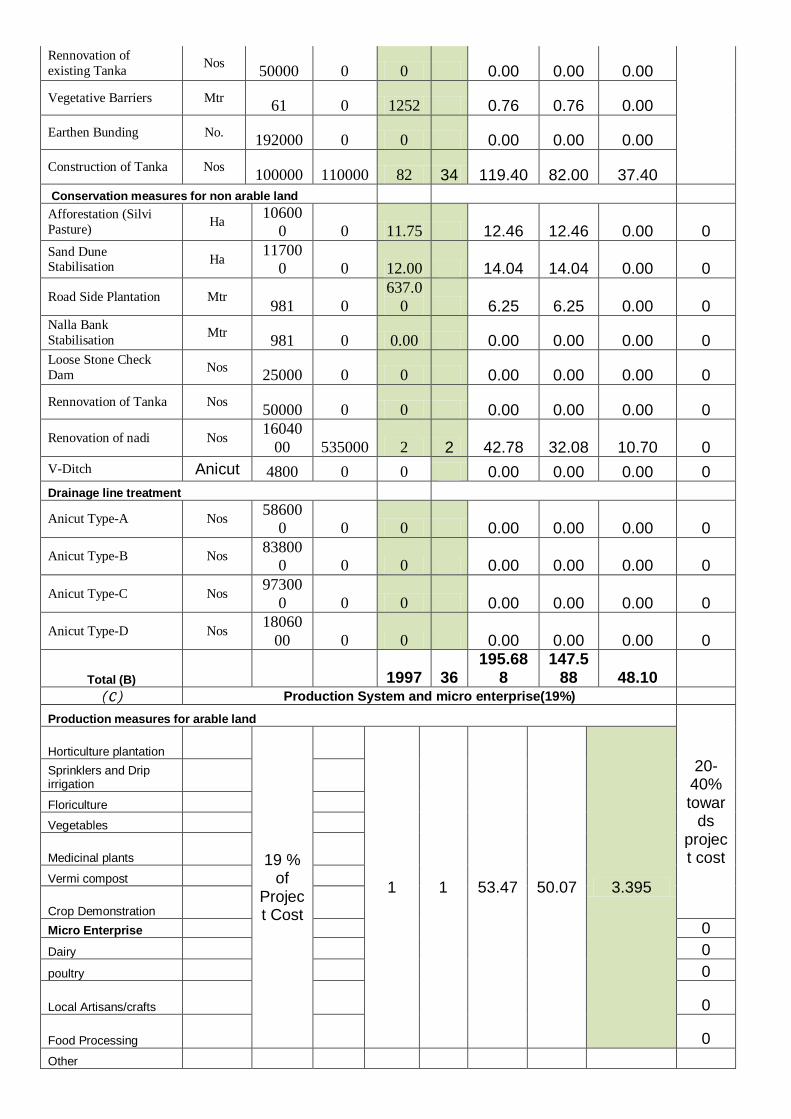
Proposed Development Plan
GP : Santra Area :
1757
.0 Ha. Cost : 263.550 Lacs (A) Preparatory phase activities capacity building trainings & EPA
Activity Unit
Unit Cost Quantity
Total Cost
Cost from
Project Fund
Convergence Fund
Beneficiary
Contribution
IWMP Other Deptt.
IWMP Other Deptt
.
Admn. 10% 0.00 1 0.00 26.36 26.36 0.00 0
Monitoring 1% 0.00 1 0.00 2.64 2.64 0.00 0 Evaluation 1% 0.00 1 0.00 2.64 2.64 0.00 0 EPA 4% 0.00 1 0.00 10.54 10.54 0.00 0
I & CB 5% 0.00 1 0.00 13.18 13.18 0.00 0 DPR 1% 0.00 1 0.00 2.64 2.64 0.00 0
Total (A) 22% 57.98 57.98 0.00 0 (B) Natural resource management (56%) Conservation measures for arable land(private land)
5-10% towards
WDF
Farm Pond/Khet Talai Nos
180000 750000 0 0 0.00 0.00 0.00 Khadeen Nos 519000 500000 0 0 0.00 0.00 0.00
Rennovation of
existing Tanka Nos
50000 0 0 0.00 0.00 0.00
Vegetative Barriers Mtr 61 0 1252 0.76 0.76 0.00
Earthen Bunding No.
192000 0 0 0.00 0.00 0.00
Construction of Tanka Nos 100000 110000 82 34 119.40 82.00 37.40
Conservation measures for non arable land
Afforestation (Silvi
Pasture) Ha
10600
0 0 11.75 12.46 12.46 0.00 0 Sand Dune
Stabilisation Ha
11700
0 0 12.00 14.04 14.04 0.00 0
Road Side Plantation Mtr 981 0
637.0
0 6.25 6.25 0.00 0 Nalla Bank
Stabilisation Mtr
981 0 0.00 0.00 0.00 0.00 0 Loose Stone Check
Dam Nos
25000 0 0 0.00 0.00 0.00 0
Rennovation of Tanka Nos 50000 0 0 0.00 0.00 0.00 0
Renovation of nadi Nos
16040
00 535000 2 2 42.78 32.08 10.70 0 V-Ditch Anicut 4800 0 0 0.00 0.00 0.00 0 Drainage line treatment
Anicut Type-A Nos
58600
0 0 0 0.00 0.00 0.00 0
Anicut Type-B Nos 83800
0 0 0 0.00 0.00 0.00 0
Anicut Type-C Nos 97300
0 0 0 0.00 0.00 0.00 0
Anicut Type-D Nos 18060
00 0 0 0.00 0.00 0.00 0
Total (B) 1997 36 195.68
8 147.5
88 48.10
( C ) Production System and micro enterprise(19%)
Production measures for arable land
20-40% towar
ds project cost
Horticulture plantation
19 % of
Project Cost
1 1 53.47 50.07 3.395
Sprinklers and Drip irrigation
Floriculture
Vegetables
Medicinal plants
Vermi compost
Crop Demonstration Micro Enterprise 0
Dairy 0
poultry 0
Local Artisans/crafts 0
Food Processing 0 Other

Total (C) 53.47 50.07 3.40 0
(D) Consolidation 3% 7.91 7.91 0.00 0
Grand Total
315.04
263.55 51.50
Proposed Development Plan
Consolidated
GP : Chibi , Santra
Area :
4942
.0 Ha. Cost : 741.300 Lacs (A) Preparatory phase activities capacity building trainings & EPA
Activity Unit
Unit Cost Quantity
Total Cost
Cost from
Project Fund
Convergence Fund
Beneficiary
Contribution
IWMP Other Deptt.
IWMP Other Deptt
.
Admn. 10% 0.00 1 0.00 74.13 74.13 0.00 0
Monitoring 1% 0.00 1 0.00 7.41 7.41 0.00 0 Evaluation 1% 0.00 1 0.00 7.41 7.41 0.00 0
EPA 4% 0.00 1 0.00 29.65 29.65 0.00 0 I & CB 5% 0.00 1 0.00 37.07 37.07 0.00 0
DPR 1% 0.00 1 0.00 7.41 7.41 0.00 0
Total (A) 22% 163.0
9 163.0
9 0.00 0 (B) Natural resource management (56%) Conservation measures for arable land(private land)
5-10% towards
WDF
Farm Pond/Khet Talai Nos
18000
0
7500
00 0 0 0.00 0.00 0.00
Khadeen Nos 51900
0
5000
00 0 0 0.00 0.00 0.00 Rennovation of
existing Tanka Nos
50000 0 0 0 0.00 0.00 0.00
Vegetative Barriers Mtr 61 0 3268 0 1.99 1.99 0.00
Earthen Bunding No.
19200
0 0 0 0 0.00 0.00 0.00
Construction of Tanka Nos 10000
0
1100
00 266 162
444.20
266.00 178.20
Conservation measures for non arable land
Afforestation (Silvi
Pasture) Ha
10600
0 0 32 0 33.66 33.66 0.00 0 Sand Dune
Stabilisation Ha
11700
0 0 32 0 37.44 37.44 0.00 0
Road Side Plantation Mtr 981 0 2846 0 27.92 27.92 0.00 0
Nalla Bank
Stabilisation Mtr
981 0 0 0 0.00 0.00 0.00 0 Loose Stone Check
Dam Nos
25000 0 0 0 0.00 0.00 0.00 0
Rennovation of Tanka Nos 50000 0 0 0 0.00 0.00 0.00 0
Renovation of nadi Nos
16040
00
5350
00 3 6 80.22 48.12 32.10 0 V-Ditch Ha. 4800 0 0 0 0.00 0.00 0.00 0
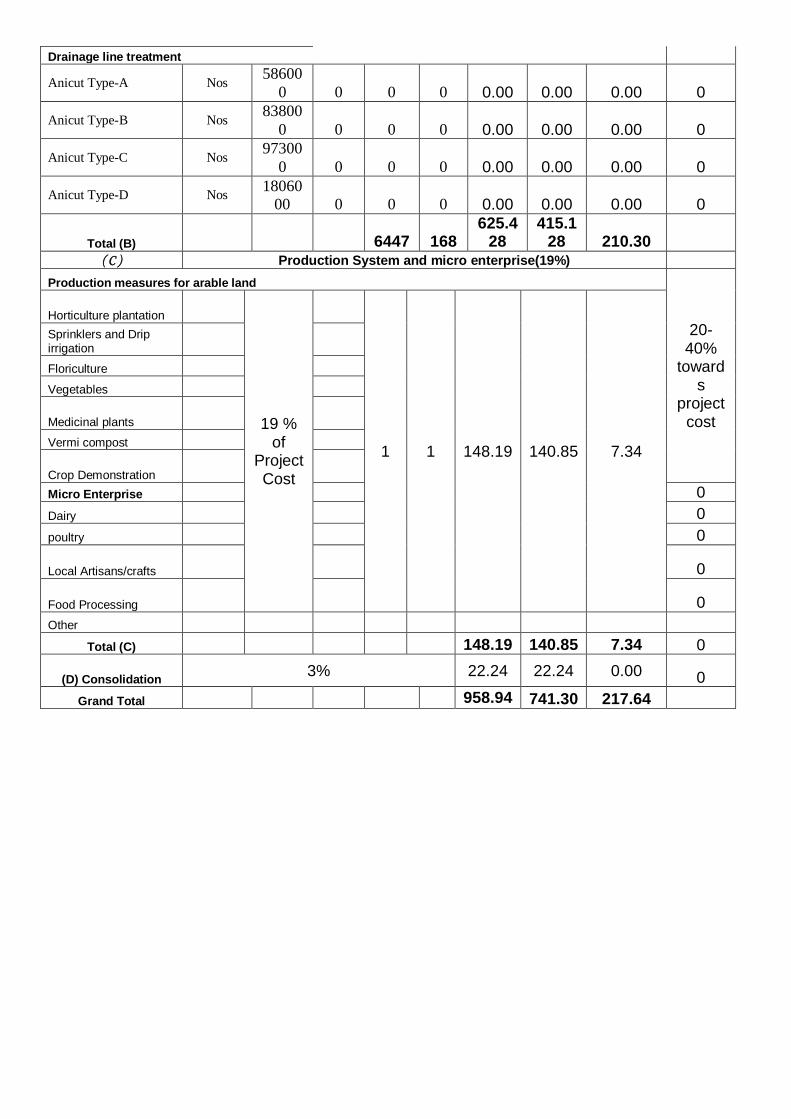
Drainage line treatment
Anicut Type-A Nos
58600
0 0 0 0 0.00 0.00 0.00 0
Anicut Type-B Nos 83800
0 0 0 0 0.00 0.00 0.00 0
Anicut Type-C Nos 97300
0 0 0 0 0.00 0.00 0.00 0
Anicut Type-D Nos 18060
00 0 0 0 0.00 0.00 0.00 0
Total (B) 6447 168 625.4
28 415.1
28 210.30
( C ) Production System and micro enterprise(19%)
Production measures for arable land
20-40%
towards
project cost
Horticulture plantation
19 % of
Project Cost
1 1 148.19 140.85 7.34
Sprinklers and Drip irrigation
Floriculture
Vegetables
Medicinal plants Vermi compost
Crop Demonstration Micro Enterprise 0
Dairy 0
poultry 0
Local Artisans/crafts 0
Food Processing 0 Other
Total (C) 148.19 140.85 7.34 0
(D) Consolidation 3% 22.24 22.24 0.00 0
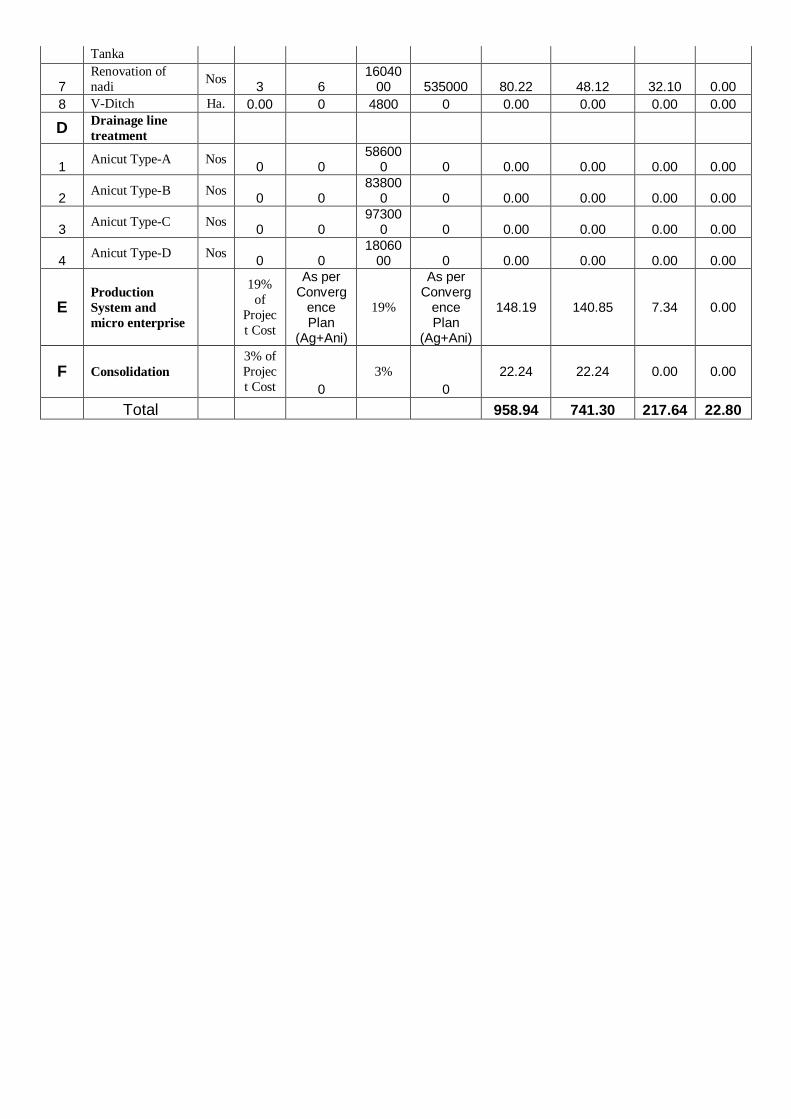
Grand Total 958.94 741.30 217.64
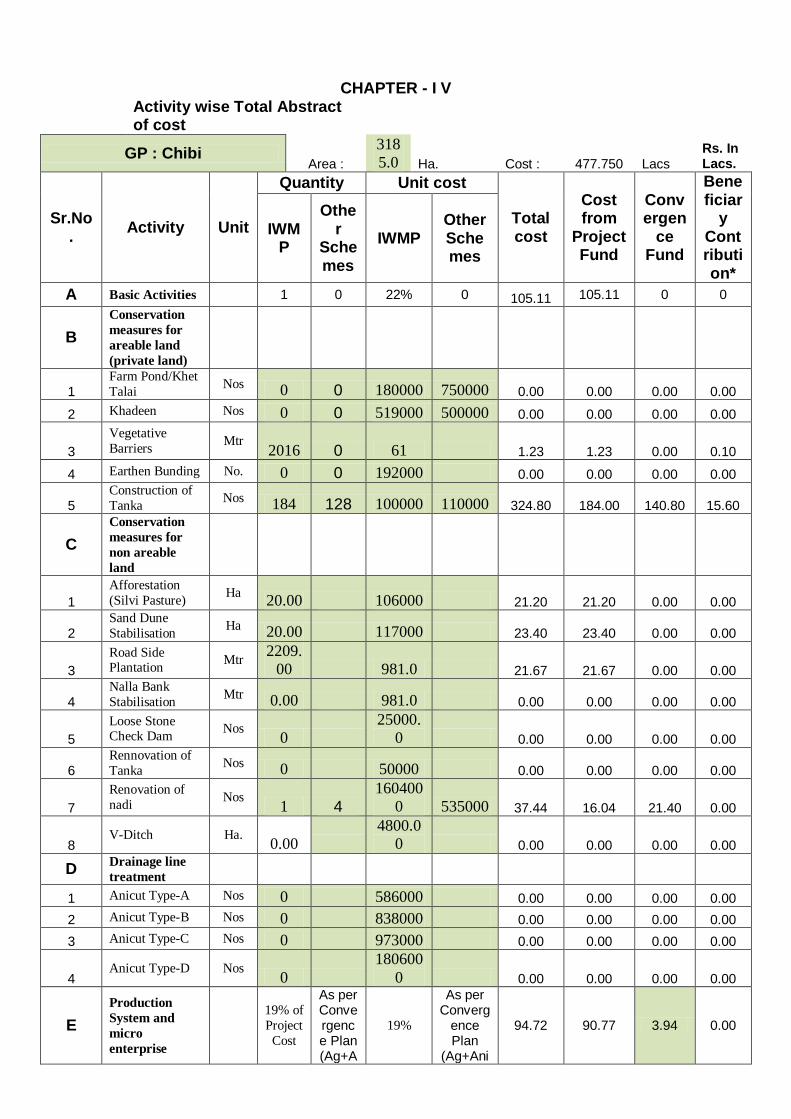
CHAPTER - I V
Activity wise Total Abstract of cost
GP : Chibi
Area :
318
5.0 Ha. Cost : 477.750 Lacs Rs. In Lacs.
Sr.No.
Activity Unit
Quantity Unit cost
Total cost
Cost from
Project Fund
Convergen
ce Fund
Beneficiar
y Contribution*
IWMP
Other
Schemes
IWMP Other Schemes
A Basic Activities 1 0 22% 0 105.11 105.11 0 0
B
Conservation
measures for
areable land
(private land)
1 Farm Pond/Khet
Talai Nos 0 0 180000 750000 0.00 0.00 0.00 0.00
2 Khadeen Nos 0 0 519000 500000 0.00 0.00 0.00 0.00
3
Vegetative
Barriers Mtr
2016 0 61 1.23 1.23 0.00 0.10
4 Earthen Bunding No. 0 0 192000 0.00 0.00 0.00 0.00
5 Construction of
Tanka Nos 184 128 100000 110000 324.80 184.00 140.80 15.60
C
Conservation
measures for
non areable
land
1
Afforestation
(Silvi Pasture) Ha
20.00 106000 21.20 21.20 0.00 0.00
2 Sand Dune
Stabilisation Ha 20.00 117000 23.40 23.40 0.00 0.00
3
Road Side Plantation
Mtr 2209.
00 981.0 21.67 21.67 0.00 0.00
4 Nalla Bank
Stabilisation Mtr 0.00 981.0 0.00 0.00 0.00 0.00
5
Loose Stone Check Dam
Nos 0
25000.
0 0.00 0.00 0.00 0.00
6 Rennovation of
Tanka Nos 0 50000 0.00 0.00 0.00 0.00
7
Renovation of
nadi Nos
1 4 160400
0 535000 37.44 16.04 21.40 0.00
8 V-Ditch Ha.
0.00 4800.0
0 0.00 0.00 0.00 0.00
D Drainage line
treatment
1 Anicut Type-A Nos 0 586000 0.00 0.00 0.00 0.00
2 Anicut Type-B Nos 0 838000 0.00 0.00 0.00 0.00
3 Anicut Type-C Nos 0 973000 0.00 0.00 0.00 0.00
4 Anicut Type-D Nos
0
180600
0 0.00 0.00 0.00 0.00
E
Production
System and
micro
enterprise
19% of
Project
Cost
As per Convergence Plan (Ag+A
19%
As per Converg
ence Plan
(Ag+Ani
94.72 90.77 3.94 0.00

ni) )
F Consolidation
3% of
Project
Cost 0
3%
0
14.33 14.33 0.00 0.00
Total 643.89 477.75 166.14 15.70
*Tentative and will vary during execution according to beneficiary
Activity wise Total Abstract of cost
GP : Santra
Area :
1757.
0 Ha. Cost : 263.550 Lacs
Sr.No.
Activity Uni
t
Quantity Unit cost
Total cost
Cost from
Project Fund
Convergen
ce Fund
Beneficiar
y Contribution*
IWMP Other Schemes
IWMP Other
Schemes
A Basic Activities 1 0 22%
57.98
57.98 0 0
B
Conservation
measures for
areable land
(private land)
1
Farm Pond/Khet
Talai Nos
0 0 180000 750000 0.00 0.00 0.00 0.00
2 Khadeen Nos 0 0 519000 500000 0.00 0.00 0.00 0.00
3 Vegetative
Barriers Mtr
1252 61 0 0.76 0.76 0.00 0.10
4 Earthen Bunding No.
0 192000 0 0.00 0.00 0.00 0.00
5 Construction of
Tanka Nos 82 34 100000 110000 119.40 82.00 37.40 7.00
C Conservation
measures for non
areable land
1
Afforestation
(Silvi Pasture) Ha
11.75 106000 0 12.46 12.46 0.00 0.00
2 Sand Dune
Stabilisation Ha 12.00 117000 0 14.04 14.04 0.00 0.00
3 Road Side
Plantation Mtr 637.00 981 0 6.25 6.25 0.00 0.00
4 Nalla Bank
Stabilisation Mtr 0.00 981 0 0.00 0.00 0.00 0.00
5 Loose Stone Check Dam
Nos 0 25000 0 0.00 0.00 0.00 0.00
6 Rennovation of
Tanka Nos
0 50000 0 0.00 0.00 0.00 0.00
7 Renovation of
nadi Nos
2 2 1604000 535000 42.78 32.08 10.70 0.00
8 V-Ditch Ha. 0 4800 0 0.00 0.00 0.00 0.00
D Drainage line
treatment
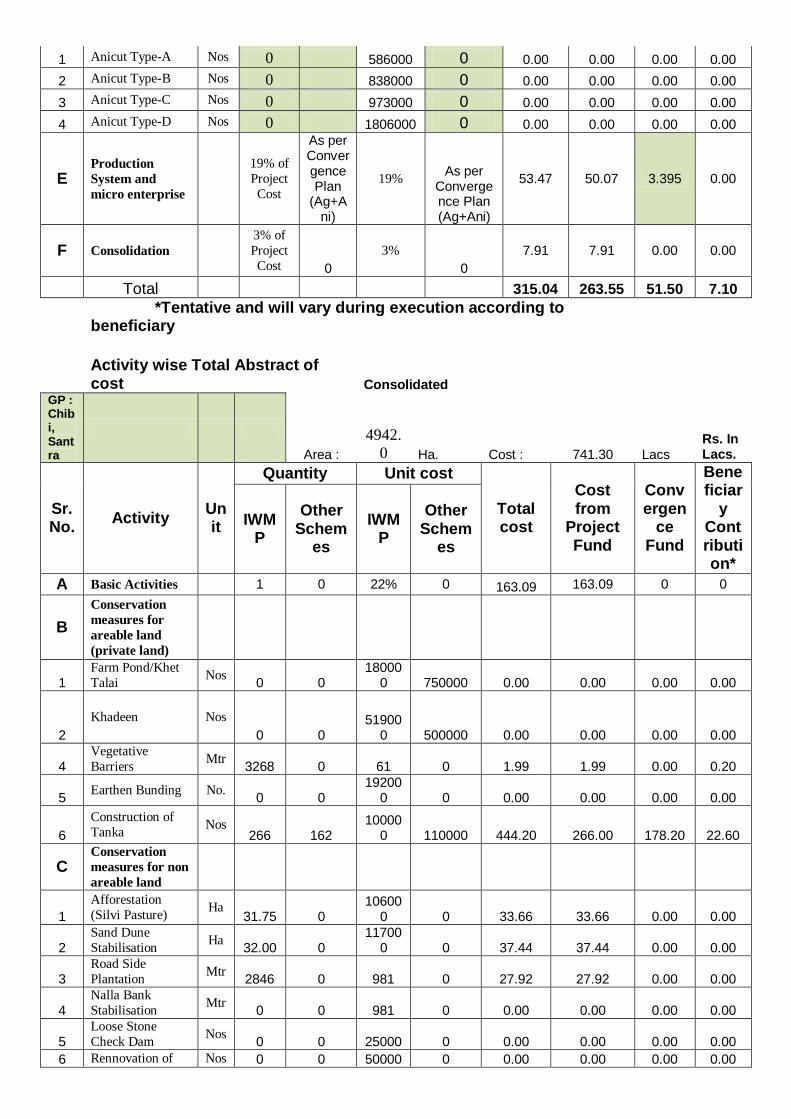
1 Anicut Type-A Nos 0 586000 0 0.00 0.00 0.00 0.00
2 Anicut Type-B Nos 0 838000 0 0.00 0.00 0.00 0.00
3 Anicut Type-C Nos 0 973000 0 0.00 0.00 0.00 0.00
4 Anicut Type-D Nos 0 1806000 0 0.00 0.00 0.00 0.00
E Production
System and
micro enterprise
19% of
Project
Cost
As per Convergence Plan
(Ag+Ani)
19% As per
Convergence Plan (Ag+Ani)
53.47 50.07 3.395 0.00
F Consolidation
3% of
Project
Cost 0
3%
0
7.91 7.91 0.00 0.00
Total 315.04 263.55 51.50 7.10
*Tentative and will vary during execution according to beneficiary
Activity wise Total Abstract of cost Consolidated
GP : Chibi, Santra
Area :
4942.
0 Ha. Cost : 741.30 Lacs Rs. In Lacs.
Sr.No.
Activity Unit
Quantity Unit cost
Total cost
Cost from
Project Fund
Convergen
ce Fund
Beneficiar
y Contribution*
IWMP
Other Schem
es
IWMP
Other Schem
es
A Basic Activities 1 0 22% 0 163.09 163.09 0 0
B
Conservation
measures for
areable land
(private land)
1 Farm Pond/Khet
Talai Nos
0 0 18000
0 750000 0.00 0.00 0.00 0.00
2
Khadeen Nos
0 0 51900
0 500000 0.00 0.00 0.00 0.00
4 Vegetative
Barriers Mtr
3268 0 61 0 1.99 1.99 0.00 0.20
5 Earthen Bunding No.
0 0 19200
0 0 0.00 0.00 0.00 0.00
6
Construction of
Tanka Nos
266 162 10000
0 110000 444.20 266.00 178.20 22.60
C Conservation
measures for non
areable land
1
Afforestation
(Silvi Pasture) Ha
31.75 0 10600
0 0 33.66 33.66 0.00 0.00
2 Sand Dune
Stabilisation Ha
32.00 0 11700
0 0 37.44 37.44 0.00 0.00
3 Road Side
Plantation Mtr
2846 0 981 0 27.92 27.92 0.00 0.00
4 Nalla Bank
Stabilisation Mtr
0 0 981 0 0.00 0.00 0.00 0.00
5 Loose Stone
Check Dam Nos
0 0 25000 0 0.00 0.00 0.00 0.00
6 Rennovation of Nos 0 0 50000 0 0.00 0.00 0.00 0.00
Tanka
7 Renovation of
nadi Nos
3 6 16040
00 535000 80.22 48.12 32.10 0.00
8 V-Ditch Ha. 0.00 0 4800 0 0.00 0.00 0.00 0.00
D Drainage line
treatment
1 Anicut Type-A Nos
0 0 58600
0 0 0.00 0.00 0.00 0.00
2 Anicut Type-B Nos
0 0 83800
0 0 0.00 0.00 0.00 0.00
3 Anicut Type-C Nos
0 0 97300
0 0 0.00 0.00 0.00 0.00
4 Anicut Type-D Nos
0 0 18060
00 0 0.00 0.00 0.00 0.00
E Production
System and
micro enterprise
19%
of
Projec
t Cost
As per Converg
ence Plan
(Ag+Ani)
19%
As per Converg
ence Plan
(Ag+Ani)
148.19 140.85 7.34 0.00
F Consolidation
3% of
Projec
t Cost 0
3%
0
22.24 22.24 0.00 0.00
Total 958.94 741.30 217.64 22.80

CHAPTER-V
Name of the
Project
BARMER(IWMP)-
24/10-11 Macro/Micro Micro
Geographical Area
3185
.0 Ha
G.P. Chibi
Scheme
IWMP
Effective
Area 3185 Ha
Block Baitu
Date of Sanction
14.09.2
010
Total Arable land
2812 Ha
District. BARMER
Date of Appoval of the work
plan
1.
Irrigated
0 Ha
Village Covered 6 NO.
2.
Unirrigated
2812 Ha
Project outlay 477.75 LAC
No. of SHG's
formed 6 NO.
Total Nonarable
land
373 Ha
Total Area 3185.0 Hactare
No. of UG's
formed 3 NO.
1. Pasture
25 Ha
No. of WC's
formed 1 NO. 2. Govt. / waste /OTHER
LAND 348 Ha
YEARWISE WORK PLAN OF WATERSHED COMMITTEE CHIBI
S.
N.
NAME OF
ACTIVITY
Un
it QTY. Unit cost
AMOU
NT
2010-11 2011-12 2012-13 2013-14 2014-15 2015-16 2016-17
TOTAL FIRST
YEAR SECOND YEAR
THIRD
YEAR
FOURTH
YEAR FIFTH YEAR
SIXTH
YEAR
SEVENTH
YEAR
PH
Y FIN
PH
Y FIN
PH
Y FIN PHY FIN PHY FIN
PH
Y FIN
P
H
Y
FIN PH
Y FIN
I. Administration 10% 47.775 11.944
11.9
44
11.94
4
11.94
4
0.00
0 10% 47.775
II Monitoring 1% 4.778 1.194
1.19
4 1.194 1.194
0.00
0 1% 4.778
III Evaluation 1% 4.778 2.389 2.389
1% 4.778
IV Entry point activity 4% 19.110 42 19.110 4% 19.110
V Inst. & Capacity
Building
5% 23.888 8.361
7.16
6 5.972 2.389 5% 23.888
VI DPR Preparation 1% 4.778 1
2.86
7 1 1.911 1% 4.778
TOTAL (A) 22% 105.105
2.86
7 42.520
20.3
04
21.49
9
17.91
6
0.00
0 0.000 105.105
W/S WORK
PHASE
VI
I NRM
56% 267.54
0.00
0 0.000
35.8
31
144.9
97
86.71
2
0.00
0 0.000 267.540
1
Conservation
measures for
areable land
(private land)
(i) Vegetative Barriers Mt
r 2016 61 1.230 0
0.00
0 0 0.000 270
0.16
5 1093 0.666 653 0.399 0
0.00
0 0 0.000 2016 1.230
(ii) Construction of
Tanka
No
s 184 100000 184.000 0
0.00
0 0 0.000 25
24.6
43 100
99.72
1 60
59.63
6 0
0.00
0 0 0.000 184 184.000
2 Conservation
measures for non
areable land
(i) Afforestation (Silvi
Pasture) Ha
20.00 106000.0 21.200 0
0.00
0 0 0.000 3
2.83
9 11
11.49
0 6 6.871 0
0.00
0 0 0.000 20 21.200
(ii) Sand Dune
Stabilisation Ha
20.00 117000.0 23.400 0
0.00
0 0 0.000 3
3.13
4 11
12.68
2 6 7.584 0
0.00
0 0 0.000 20 23.400
(iii
) Road Side Plantation
Mt
r 2209.00 981.0 21.670 0
0.00
0 0 0.000 296
2.90
2 1197
11.74
5 716 7.023 0
0.00
0 0 0.000 2209 21.670
(iv
) Renovation of nadi
No
s 1 1604000 16.040 0
0.00
0 0 0.000 0
2.14
8 1 8.693 0 5.199 0
0.00
0 0 0.000 1 16.040
TOTAL (B) 4450 0.000 267.54 0 0.000 596
35.8
31 2412
144.9
97 1442
86.71
2 0
0.00
0 0.000 4450 267.540
VI
II Livelihoods
9% 43.00
0.00
0 0.000
4.77
8
28.66
5 9.555 42.998
(i) SHG Revolving
Fund
No
s 108 0.250 27.088 0
0.00
0 0 0.000 12
3.01
0 72
18.05
9 24 6.020 0
0.00
0 0 0.000 108 27.088
(a) SHG Indivisual No
s 12 0.250 3.010 0
0.00
0 0 0.000 1
0.33
4 8 2.007 3 0.669 0
0.00
0 0 0.000 12 3.010
(b) SHG Fedration No
s 6 2.000 12.899 0
0.00
0 0 0.000 1
1.43
3 4 8.600 1 2.867 0
0.00
0 0 0.000 6 12.899
TOTAL (C) 127 0.000 43.00
0.0
0 0.00
14.0
9
4.77
8 84.56
28.66
5 28 9.555 0
0.00
0 0.000 127 42.998
IX Production System 10% 47.78
0.00
0 0.000
4.77
8
28.66
5
14.33
3 47.775
(i) Kharif Ha 415 0.010 4.150 0
0.00
0 0 0.000 42
0.41
5 249 2.490 125 1.245 0
0.00
0 0 0.000 415 4.150
(ii) Kitchen Garden Ha 50 0.010 0.500 0
0.00
0 0 0.000 5
0.05
0 30 0.300 15 0.150 0
0.00
0 0 0.000 50 0.500
(iii
) Horticulture Ha
22 0.300 6.600 0
0.00
0 0 0.000 2
0.66
0 13 3.960 7 1.980 0
0.00
0 0 0.000 22 6.600
(iv
) Agro forestry Ha
17 0.200 3.400 0
0.00
0 0 0.000 2
0.34
0 10 2.040 5 1.020 0
0.00
0 0 0.000 17 3.400
(v) Compost pit Ha 42 0.100 4.200 0
0.00
0 0 0.000 4
0.42
0 25 2.520 13 1.260 0
0.00
0 0 0.000 42 4.200
(vi
)
Soil & Water
Testing
No
s 1988 0.002 3.975 0
0.00
0 0 0.000 199
0.39
8 1193 2.385 596 1.193 0
0.00
0 0 0.000 1988 3.975
(vii
) Live stock camp
No
s 35 0.240 8.400 0
0.00
0 0 0.000 4
0.84
0 21 5.040 11 2.520 0
0.00
0 0 0.000 35 8.400
(vii
i) Live stock breed
improvement
No
s 32 0.500 16.000 0
0.00
0 0 0.000 3
1.60
0 19 9.600 10 4.800 0
0.00
0 0 0.000 32 16.000
TOTAL (D) 2601 0.550 47.23
0.0
0 0.00
260.
05
4.72
3 48.23
28.33
5
780.1
5
14.16
8
0.00
0
0.00
0 0.00
79.0
4 47.225
X CONSOLIDATION
PHASE
3% 14.333
0.00
0 0.000
0.00
0 8.600 5.733
3% 14.333
GRAND TOTAL 477.20 2.87 42.52
65.6
4
251.8
3
142.5
2 0.00 0.00 477.20

CHAPTER-V
Name of the
Project
BARMER(IWMP)-
24/10-11 Macro/Micro Micro
Geographical Area
1757
.0 Ha
G.P. Santra
Scheme IWMP
Effective
Area 1757 Ha
Block Baitu
Date of Sanction
14.09.2
010
Total Arable land
1543 Ha
District. BARMER
Date of Appoval of the work
plan
1.
Irrigated
0 Ha
Village Covered 1 NO.
2.
Unirrigated
154
3 Ha
Project outlay 263.55 LAC
No. of SHG's
formed 3 NO.
Total Nonarable
land
214 Ha
Total Area 1757.0 Hactare
No. of UG's
formed 1 NO.
1. Pasture
178 Ha
No. of WC's
formed 1 NO.
2. Govt. / waste /OTHER
LAND 36 Ha
YEARWISE WORK PLAN OF WATERSHED COMMITTEE SANTRA
S.
N.
NAME OF
ACTIVITY Unit QTY. Unit cost
AMOU
NT
2010-11 2011-12 2012-13 2013-14 2014-15 2015-16 2016-17
TOTAL FIRST
YEAR SECOND YEAR
THIRD
YEAR
FOURTH
YEAR FIFTH YEAR
SIXTH
YEAR
SEVENTH
YEAR
PH
Y FIN
PH
Y FIN
PH
Y FIN PHY FIN PHY FIN
PH
Y FIN
PH
Y FIN PHY FIN
I. Administration 10% 26.355 6.589
6.58
9 6.589 6.589 10% 26.355
II Monitoring 1% 2.636 0.659
0.65
9 0.659 0.659 1% 2.636
III Evaluation 1% 2.636 1.318 1.318
1% 2.636
IV Entry point activity 4% 10.542 42 10.542 4% 10.542
V Inst. & Capacity
Building
5% 13.178 4.612
3.95
3 3.294 1.318 5% 13.178
VI DPR Preparation 1% 2.636 1
1.58
1 1 1.054 1% 2.636
TOTAL (A) 22% 57.981
1.58
1 23.456
11.2
01
11.86
0 9.883
0.00
0
0.00
0 57.981
W/S WORK
PHASE
VI
I NRM
56% 147.59
0.00
0 0.000
19.7
66
79.98
7
47.83
4
0.00
0
0.00
0 147.588
1
Conservation
measures for
areable land
(private land)
(i) Vegetative Barriers Mtr 1252 61 0.764 0
0.00
0 0 0.000 168
0.10
2 679 0.414 406 0.248 0
0.00
0 0
0.00
0 1252 0.764
(ii) Construction of
Tanka Nos
82 100000 82.000 0
0.00
0 0 0.000 11
10.9
82 44
44.44
1 27
26.57
7 0
0.00
0 0
0.00
0 82 82.000
2 Conservation
measures for non
areable land
(i) Afforestation (Silvi
Pasture) Ha
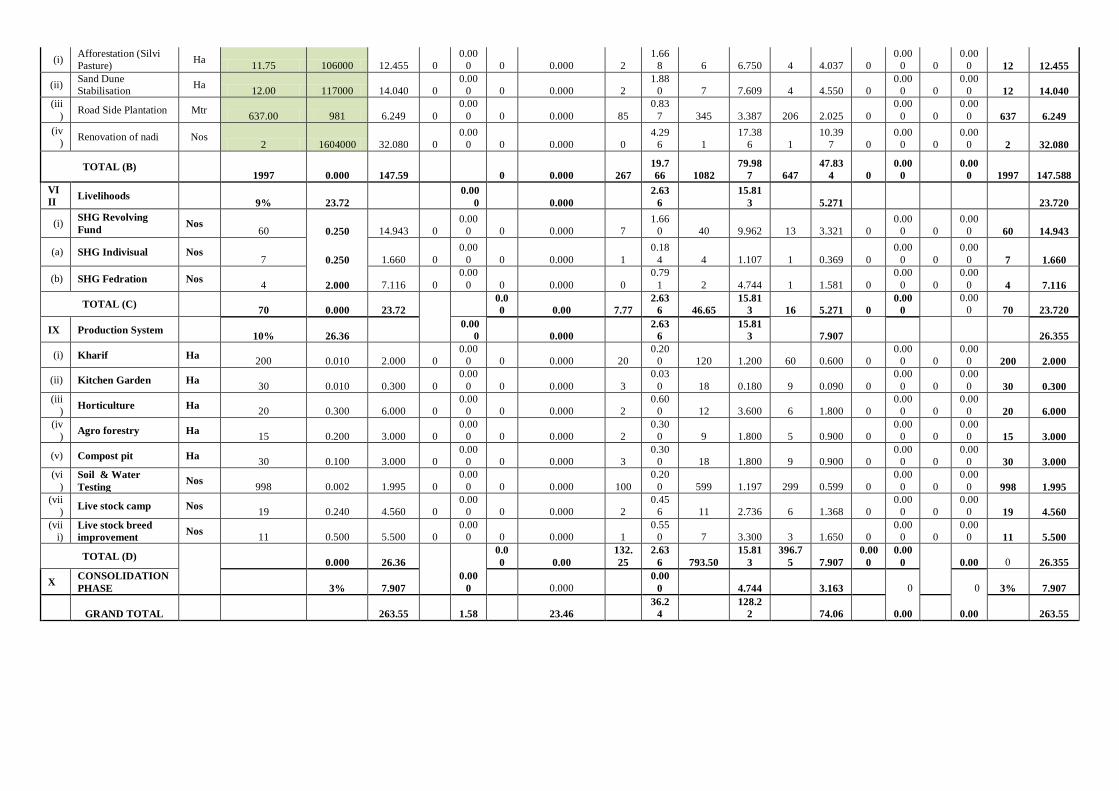
11.75 106000 12.455 0
0.00
0 0 0.000 2
1.66
8 6 6.750 4 4.037 0
0.00
0 0
0.00
0 12 12.455
(ii) Sand Dune
Stabilisation Ha
12.00 117000 14.040 0
0.00
0 0 0.000 2
1.88
0 7 7.609 4 4.550 0
0.00
0 0
0.00
0 12 14.040
(iii
) Road Side Plantation Mtr
637.00 981 6.249 0
0.00
0 0 0.000 85
0.83
7 345 3.387 206 2.025 0
0.00
0 0
0.00
0 637 6.249
(iv
) Renovation of nadi Nos
2 1604000 32.080 0
0.00
0 0 0.000 0
4.29
6 1
17.38
6 1
10.39
7 0
0.00
0 0
0.00
0 2 32.080
TOTAL (B) 1997 0.000 147.59 0 0.000 267
19.7
66 1082
79.98
7 647
47.83
4 0
0.00
0
0.00
0 1997 147.588
VI
II Livelihoods
9% 23.72
0.00
0 0.000
2.63
6
15.81
3 5.271 23.720
(i) SHG Revolving
Fund Nos
60 0.250 14.943 0
0.00
0 0 0.000 7
1.66
0 40 9.962 13 3.321 0
0.00
0 0
0.00
0 60 14.943
(a) SHG Indivisual Nos 7 0.250 1.660 0
0.00
0 0 0.000 1
0.18
4 4 1.107 1 0.369 0
0.00
0 0
0.00
0 7 1.660
(b) SHG Fedration Nos 4 2.000 7.116 0
0.00
0 0 0.000 0
0.79
1 2 4.744 1 1.581 0
0.00
0 0
0.00
0 4 7.116
TOTAL (C) 70 0.000 23.72
0.0
0 0.00 7.77
2.63
6 46.65
15.81
3 16 5.271 0
0.00
0
0.00
0 70 23.720
IX Production System 10% 26.36
0.00
0 0.000
2.63
6
15.81
3 7.907 26.355
(i) Kharif Ha 200 0.010 2.000 0
0.00
0 0 0.000 20
0.20
0 120 1.200 60 0.600 0
0.00
0 0
0.00
0 200 2.000
(ii) Kitchen Garden Ha 30 0.010 0.300 0
0.00
0 0 0.000 3
0.03
0 18 0.180 9 0.090 0
0.00
0 0
0.00
0 30 0.300
(iii
) Horticulture Ha
20 0.300 6.000 0
0.00
0 0 0.000 2
0.60
0 12 3.600 6 1.800 0
0.00
0 0
0.00
0 20 6.000
(iv
) Agro forestry Ha
15 0.200 3.000 0
0.00
0 0 0.000 2
0.30
0 9 1.800 5 0.900 0
0.00
0 0
0.00
0 15 3.000
(v) Compost pit Ha 30 0.100 3.000 0
0.00
0 0 0.000 3
0.30
0 18 1.800 9 0.900 0
0.00
0 0
0.00
0 30 3.000
(vi
)
Soil & Water
Testing Nos
998 0.002 1.995 0
0.00
0 0 0.000 100
0.20
0 599 1.197 299 0.599 0
0.00
0 0
0.00
0 998 1.995
(vii
) Live stock camp Nos
19 0.240 4.560 0
0.00
0 0 0.000 2
0.45
6 11 2.736 6 1.368 0
0.00
0 0
0.00
0 19 4.560
(vii
i) Live stock breed
improvement Nos
11 0.500 5.500 0
0.00
0 0 0.000 1
0.55
0 7 3.300 3 1.650 0
0.00
0 0
0.00
0 11 5.500
TOTAL (D) 0.000 26.36
0.0
0 0.00
132.
25
2.63
6 793.50
15.81
3
396.7
5 7.907
0.00
0
0.00
0 0.00 0 26.355
X CONSOLIDATION
PHASE
3% 7.907
0.00
0 0.000
0.00
0 4.744 3.163 0 0 3% 7.907
GRAND TOTAL 263.55 1.58 23.46
36.2
4
128.2
2 74.06 0.00 0.00 263.55

CHAPTER-V
Consolidate
Name of the
Project
BARMER(IWMP)-
24/10-11 Macro/Micro Micro
Geographical Area
4942
.0 Ha
G.P. Chibi,
Santra
Scheme IWMP
Effective
Area
4942
.0 Ha
Block BAITU
Date of Sanction
14.09.2
010
Total Arable land 4355
.0 Ha
District. BARMER
Date of Appoval of the work
plan
1.
Irrigated
0.0 Ha
Village Covered 7 NO.
2.
Unirrigated
4355
.0 Ha
Project outlay 741.30 LAC
No. of SHG's
formed 9 NO.
Total Nonarable
land
587.
0 Ha
Total Area 4942 Hactare
No. of UG's
formed 4 NO.
1. Pasture
203.
0 Ha
No. of WC's
formed 2 NO. 2. Govt. / waste /OTHER
LAND
384.
0 Ha
YEARWISE WORK PLAN OF WATERSHED COMMITTEE CHIBI & SANTRA
S.
N.
NAME OF
ACTIVITY
Un
it QTY. Unit cost
AMOU
NT
2010-11 2011-12 2012-13 2013-14 2014-15 2015-16 2016-17
TOTAL FIRST
YEAR SECOND YEAR
THIRD
YEAR
FOURTH
YEAR FIFTH YEAR
SIXTH
YEAR
SEVENTH
YEAR
PH
Y FIN
PH
Y FIN
PH
Y FIN PHY FIN PHY FIN
PH
Y FIN PHY FIN PHY FIN
I. Administration 10% 74.13 18.533
18.5
33
18.53
3
18.53
3 10%
74.13
0
II Monitoring 1% 7.413 1.853
1.85
3 1.853 1.853 1% 7.413
III Evaluation 1% 7.413 3.707 3.707
1% 7.413
IV Entry point
activity
4% 29.652 42 29.652 4%
29.65
2
V Inst. & Capacity
Building
5% 37.065 12.973
11.1
20 9.266 3.707 5%
37.06
5
VI DPR Preparation 1% 7.413 1
4.44
8 1 2.965 1% 7.413
TOTAL (A) 22% 163.086
4.44
8 65.976
31.5
05
33.35
9
27.79
9
0.00
0 0.000
163.0
86
W/S WORK
PHASE
VI
I NRM
56% 415.13
0.00
0 0.000
55.5
98
224.9
85
134.5
46
0.00
0 0.000
415.1
28
1
Conservation
measures for
areable land
(private land)
(i) Vegetative
Barriers
Mt
r 3268 61 1.993 0 0 0 0 438 0 1771 1 1059 1 0 0 0 0 3268 1.993
(ii) Construction of
Tanka
No
s 266 100000 266.000 0 0 0 0 36 36 144 144 86 86 0 0 0 0 266
266.0
00

2 Conservation
measures for non
areable land
(i) Afforestation
(Silvi Pasture) Ha
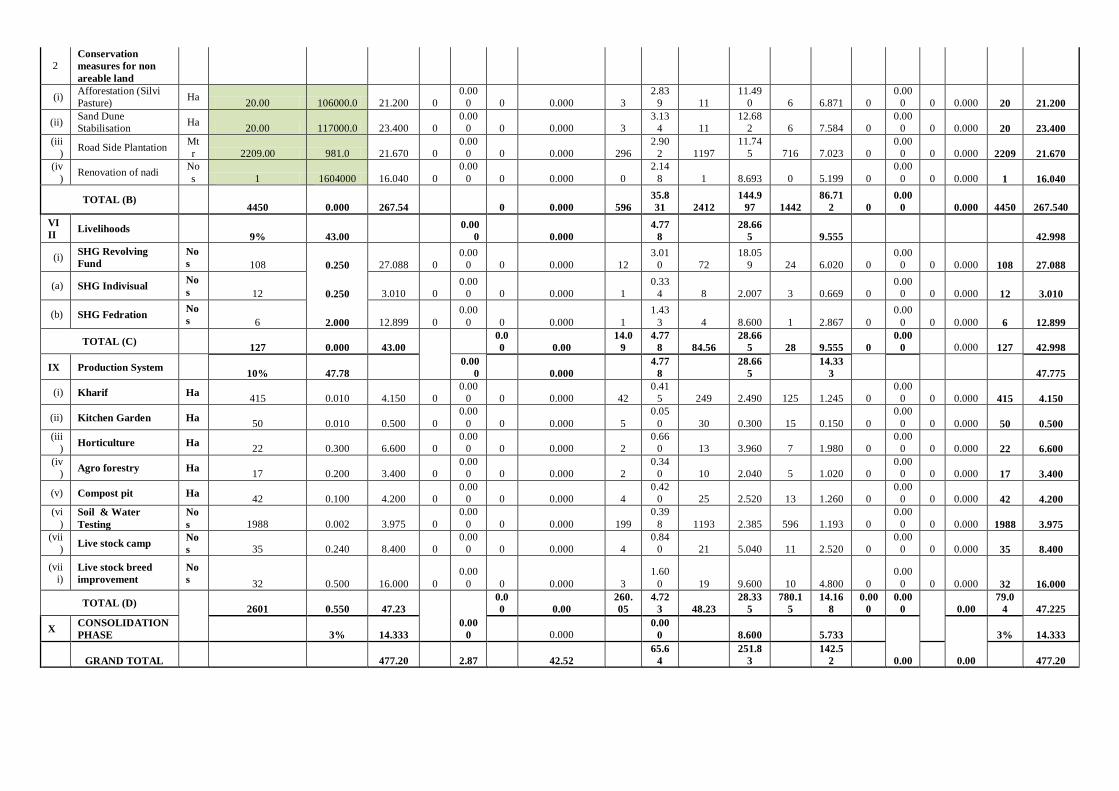
32 106000.0 33.655 0 0 0 0 4 5 17 18 10 11 0 0 0 0 32
33.65
5
(ii) Sand Dune
Stabilisation Ha
32 117000.0 37.440 0 0 0 0 4 5 17 20 10 12 0 0 0 0 32
37.44
0
(iii
)
Road Side
Plantation
Mt
r 2846 981.0 27.919 0 0 0 0 381 4 1542 15 922 9 0 0 0 0 2846
27.91
9
(vii
)
Renovation of
nadi
No
s 3 1604000 48.120 0 0 0 0 0 6 2 26 1 16 0 0 0 0 3
48.12
0
TOTAL (B) 6447 0.000 415.13 0 0.000 863
55.5
97 3494
224.9
84 2089
134.5
46 0
0.00
0 0.000 6447
415.1
28
VI
II Livelihoods
9% 66.72
0.00
0 0.000
7.41
3
44.47
8
14.82
6
66.71
7
(i) SHG Revolving
Fund
No
s 168 0.250 42.032 0
0.00
0 0 0.000 19
4.67
0 112
28.02
1 37 9.340 0
0.00
0 0 0.000 168
42.03
2
(a) SHG Indivisual No
s 19 0.250 4.670 0
0.00
0 0 0.000 2
0.51
9 12 3.113 4 1.038 0
0.00
0 0 0.000 19 4.670
(b) SHG Fedration No
s 10 2.000 20.015 0
0.00
0 0 0.000 1
2.22
4 7
13.34
3 2 4.448 0
0.00
0 0 0.000 10
20.01
5
TOTAL (C) 197 0.000 66.72
0.0
0 0.00
21.8
7
7.41
3 131.21
44.47
8 44
14.82
6 0
0.00
0 0.000 197
66.71
7
IX Production
System
10% 74.13
0.00
0 0.000
7.41
3
44.47
8
22.23
9
74.13
0
(i) Kharif Ha 620 0.010 6.200 0
0.00
0 0 0.000 62
0.62
0 372 3.720 186 1.860 0
0.00
0 0 0.000 620 6.200
(ii) Kitchen Garden Ha 80 0.010 0.800 0
0.00
0 0 0.000 8
0.08
0 48 0.480 24 0.240 0
0.00
0 0 0.000 80 0.800
(iii
) Horticulture Ha
42 0.300 12.600 0
0.00
0 0 0.000 4
1.26
0 25 7.560 13 3.780 0
0.00
0 0 0.000 42
12.60
0
(iv
) Agro forestry Ha
32 0.200 6.400 0
0.00
0 0 0.000 3
0.64
0 19 3.840 10 1.920 0
0.00
0 0 0.000 32 6.400
(v) Compost pit Ha 72 0.100 7.200 0
0.00
0 0 0.000 7
0.72
0 43 4.320 22 2.160 0
0.00
0 0 0.000 72 7.200
(vi
)
Soil & Water
Testing
No
s 2985 0.002 5.970 0
0.00
0 0 0.000 299
0.59
7 1791 3.582 896 1.791 0
0.00
0 0 0.000 2985 5.970
(vii
) Live stock camp
No
s 54 0.240 12.960 0
0.00
0 0 0.000 5
1.29
6 32 7.776 16 3.888 0
0.00
0 0 0.000 54
12.96
0
(vii
i)
Live stock breed
improvement
No
s 44 0.500 22.000 0
0.00
0 0 0.000 4
2.20
0 26
13.20
0 13 6.600 0
0.00
0 0 0.000 44
22.00
0
TOTAL (D) 0.000 74.13
0.0
0 0.00
392.
90
7.41
3 2357.40
44.47
8
1178.
70
22.23
9
0.00
0
0.00
0 0.00 0 74.13
0
X CONSOLIDATI
ON PHASE
3% 22.239
0.00
0 0.000
0.00
0
13.34
3 8.896
3%
22.23
9
GRAND TOTAL 741.30 4.45 65.98
101.
93
360.6
4
208.3
1 0.00 0.00
741.3
0
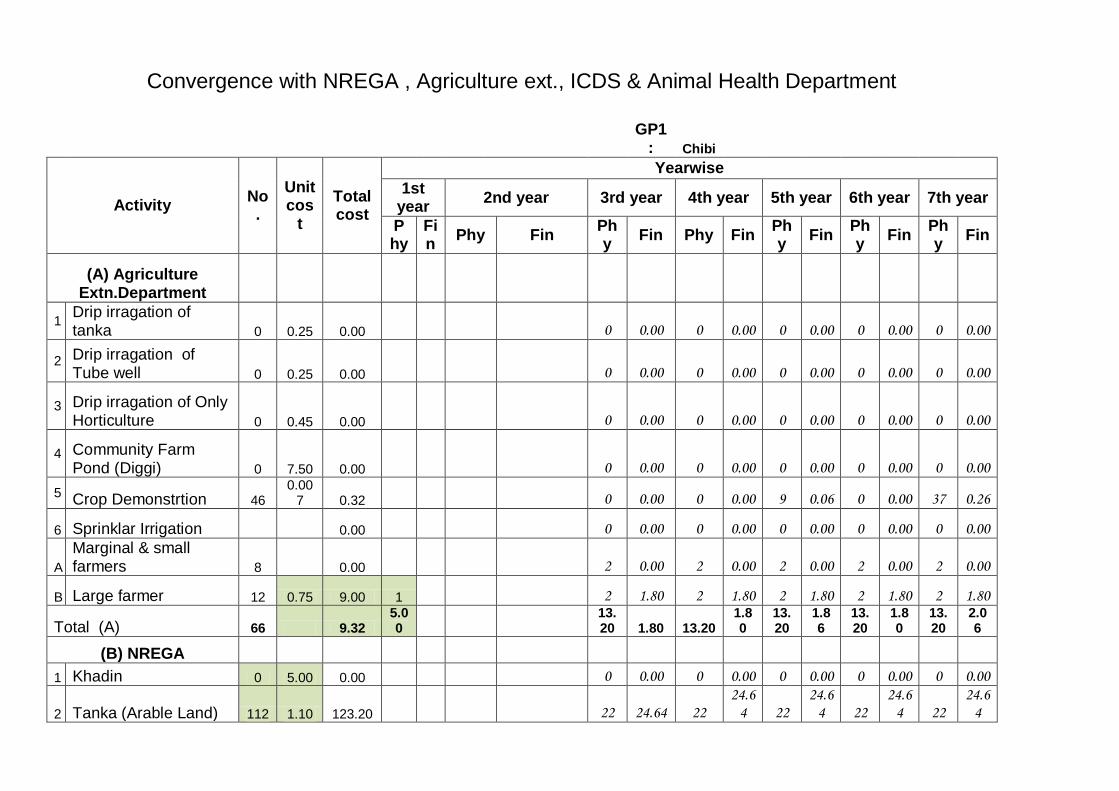
Convergence with NREGA , Agriculture ext., ICDS & Animal Health Department
GP1 : Chibi
Activity No.
Unit cos
t
Total cost
Yearwise
1st year
2nd year 3rd year 4th year 5th year 6th year 7th year
Phy
Fin
Phy Fin Phy
Fin Phy Fin Phy
Fin Phy
Fin Phy
Fin
(A) Agriculture Extn.Department
1 Drip irragation of tanka 0 0.25 0.00 0 0.00 0 0.00 0 0.00 0 0.00 0 0.00
2 Drip irragation of Tube well 0 0.25 0.00 0 0.00 0 0.00 0 0.00 0 0.00 0 0.00
3 Drip irragation of Only Horticulture 0 0.45 0.00 0 0.00 0 0.00 0 0.00 0 0.00 0 0.00
4 Community Farm Pond (Diggi) 0 7.50 0.00 0 0.00 0 0.00 0 0.00 0 0.00 0 0.00
5 Crop Demonstrtion 46 0.00
7 0.32 0 0.00 0 0.00 9 0.06 0 0.00 37 0.26
6 Sprinklar Irrigation 0.00 0 0.00 0 0.00 0 0.00 0 0.00 0 0.00
A
Marginal & small farmers 8 0.00 2 0.00 2 0.00 2 0.00 2 0.00 2 0.00
B Large farmer 12 0.75 9.00 1 2 1.80 2 1.80 2 1.80 2 1.80 2 1.80
Total (A) 66 9.32 5.00
13.20 1.80 13.20
1.80
13.20
1.86
13.20
1.80
13.20
2.06
(B) NREGA
1 Khadin 0 5.00 0.00 0 0.00 0 0.00 0 0.00 0 0.00 0 0.00
2 Tanka (Arable Land) 112 1.10 123.20 22 24.64 22 24.6
4 22 24.6
4 22 24.6
4 22 24.6
4
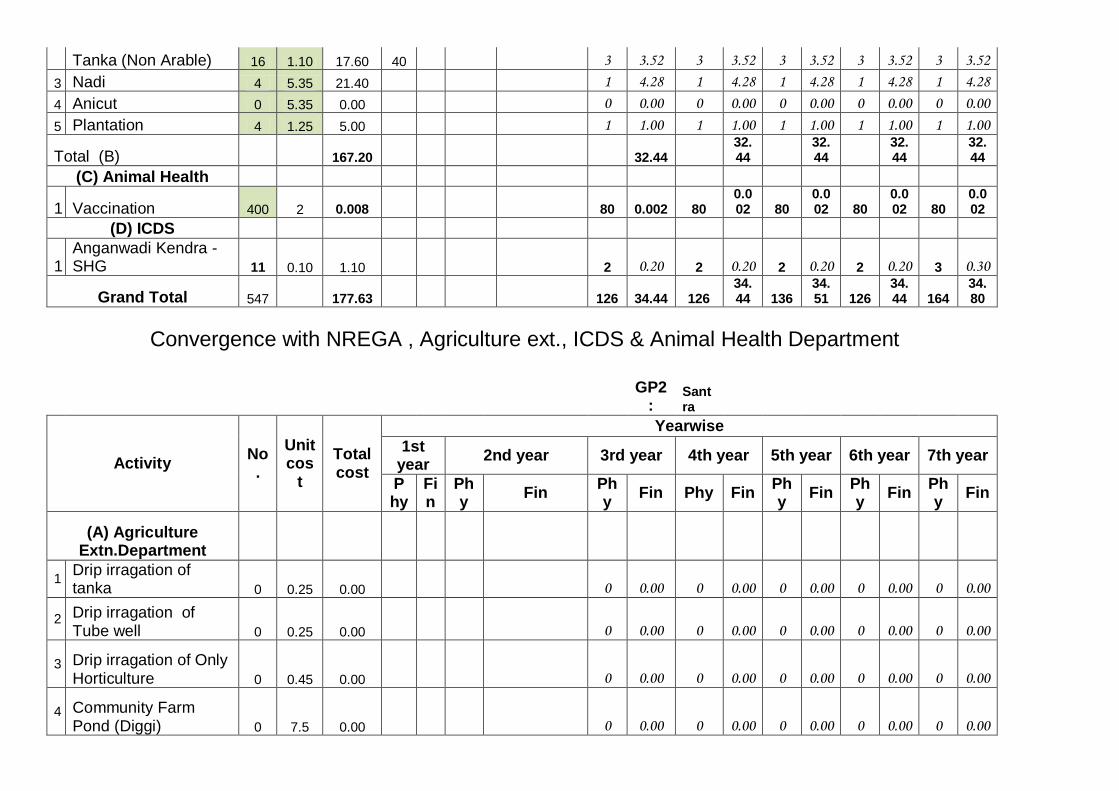
Tanka (Non Arable) 16 1.10 17.60 40 3 3.52 3 3.52 3 3.52 3 3.52 3 3.52
3 Nadi 4 5.35 21.40 1 4.28 1 4.28 1 4.28 1 4.28 1 4.28
4 Anicut 0 5.35 0.00 0 0.00 0 0.00 0 0.00 0 0.00 0 0.00
5 Plantation 4 1.25 5.00 1 1.00 1 1.00 1 1.00 1 1.00 1 1.00
Total (B) 167.20 32.44 32.44
32.44
32.44
32.44
(C) Animal Health
1 Vaccination 400 2 0.008 80 0.002 80 0.002 80
0.002 80
0.002 80
0.002
(D) ICDS
1 Anganwadi Kendra - SHG 11 0.10 1.10 2 0.20 2 0.20 2 0.20 2 0.20 3 0.30
Grand Total 547 177.63 126 34.44 126 34.44 136
34.51 126
34.44 164
34.80
Convergence with NREGA , Agriculture ext., ICDS & Animal Health Department
GP2 :
Santra
Activity No.
Unit cos
t
Total cost
Yearwise
1st year
2nd year 3rd year 4th year 5th year 6th year 7th year
Phy
Fin
Phy
Fin Phy
Fin Phy Fin Phy
Fin Phy
Fin Phy
Fin
(A) Agriculture Extn.Department
1 Drip irragation of tanka 0 0.25 0.00 0 0.00 0 0.00 0 0.00 0 0.00 0 0.00
2 Drip irragation of Tube well 0 0.25 0.00 0 0.00 0 0.00 0 0.00 0 0.00 0 0.00
3 Drip irragation of Only Horticulture 0 0.45 0.00 0 0.00 0 0.00 0 0.00 0 0.00 0 0.00
4 Community Farm Pond (Diggi) 0 7.5 0.00 0 0.00 0 0.00 0 0.00 0 0.00 0 0.00

5 Crop Demonstrtion 34 0.00
7 0.24 0 0.00 0 0.00 7 0.05 0 0.00 27 0.19
6 Sprinklar Irrigation 0.00 0 0.00 0 0.00 0 0.00 0 0.00 0 0.00
A
Marginal & small farmers 16 0.00 3 0.00 3 0.00 3 0.00 3 0.00 3 0.00
B Large farmer 13 0.00 3 0.00 3 0.00 3 0.00 3 0.00 3 0.00
Total (A) 63 0.24 12.60 0.00 12.60
0.00
12.60
0.05
12.60
0.00
12.60
0.19
(B) NREGA
1 Khadin 0 5.00 0.00 0 0.00 0 0.00 0 0.00 0 0.00 0 0.00
2 Tanka (Arable Land) 32 1.10 35.20 6 7.04 6 7.04 6 7.04 6 7.04 6 7.04
Tanka (Non Arable) 2 1.10 2.20 0 0.44 0 0.44 0 0.44 0 0.44 0 0.44
3 Nadi 2 5.35 10.70 0 2.14 0 2.14 0 2.14 0 2.14 0 2.14
4 Anicut 5.35 0.00 0 0.00 0 0.00 0 0.00 0 0.00 0 0.00
5 Plantation 2 1.25 2.50 0 0.50 0 0.50 0 0.50 0 0.50 0 0.50
Total (B) 48.10 9.62 9.62
9.62
9.62
9.62
(C) Animal Health
1 Vaccination 270 2 0.005 54 0.001 54 0.001 54
0.001 54
0.001 54
0.001
(D) ICDS
1 Anganwadi Kendra - SHG 6 0.10 0.60 2 0.20 1 0.10 1 0.10 1 0.10 1 0.10
Grand Total 314 48.94 82 9.82 81 9.72 88
9.77 81
9.72 108
9.91

Convergence with NREGA , Agriculture ext., ICDS & Animal Health Department
Consolidated
GP :
Chibi,
Santra
Activity No.
Unit cost
Total cost
Yearwise
1st year
2nd year 3rd year 4th year 5th year 6th year 7th year
Phy
Fin
Phy
Fin Phy Fin Phy Fin Phy
Fin Phy
Fin Phy
Fin
(A) Agriculture Extn.Department
1 Drip irragation of tanka 0 0.25 0.00 0 0.00 0 0.00 0 0.00 0 0.00 0 0.00
2 Drip irragation of Tube well 0 0.25 0.00 0 0.00 0 0.00 0 0.00 0 0.00 0 0.00
3 Drip irragation of Only Horticulture 0 0.45 0.00 0 0.00 0 0.00 0 0.00 0 0.00 0 0.00
4 Community Farm Pond (Diggi) 0 7.5 0.00 0 0.00 0 0.00 0 0.00 0 0.00 0 0.00
5 Crop Demonstrtion 80 0.007 0.56 0 0.00 0 0.00 1 0.01 0 0.00 79 0.55
6 Sprinklar Irrigation 0 0 0.00 0 0.00 0 0.00 0 0.00 0 0.00 0 0.00
A
Marginal & small farmers 24 0 0.00 5 0.00 5 0.00 5 0.00 5 0.00 5 0.00
B Large farmer 25 0.75 18.75 5 3.75 5 3.75 5 3.75 5 3.75 5 3.75
Total (A) 129 19.31 25.80 3.75 25.80 3.75
25.80
3.76
25.80
3.75
25.80
4.30
(B) NREGA
1 Khadin 0 5 0.00 0 0.00 0 0.00 0 0.00 0 0.00 0 0.00
2 Tanka (Arable Land) 144 1.1 158.4
0 29 31.68 29 31.6
8 29 31.6
8 29 31.6
8 29 31.6
8
Tanka (Non Arable) 18 1.1 19.80 4 3.96 4 3.96 4 3.96 4 3.96 4 3.96
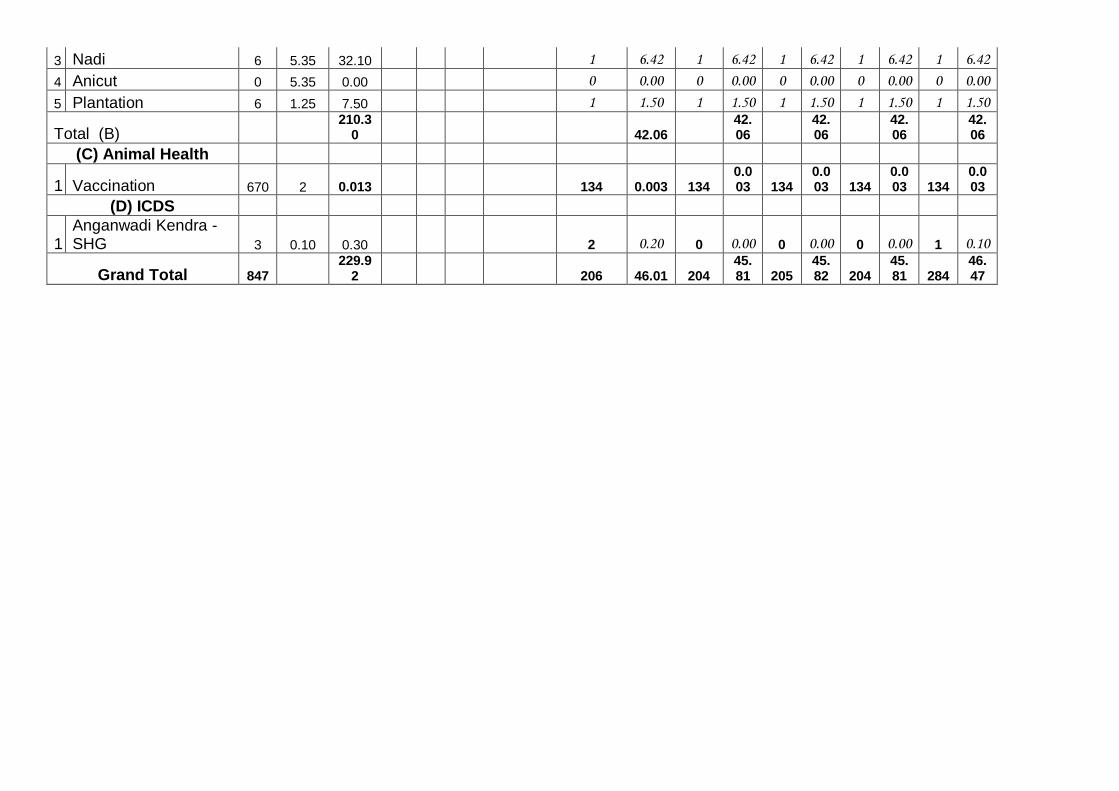
3 Nadi 6 5.35 32.10 1 6.42 1 6.42 1 6.42 1 6.42 1 6.42
4 Anicut 0 5.35 0.00 0 0.00 0 0.00 0 0.00 0 0.00 0 0.00
5 Plantation 6 1.25 7.50 1 1.50 1 1.50 1 1.50 1 1.50 1 1.50
Total (B) 210.3
0 42.06 42.06
42.06
42.06
42.06
(C) Animal Health
1 Vaccination 670 2 0.013 134 0.003 134 0.003 134
0.003 134
0.003 134
0.003
(D) ICDS
1 Anganwadi Kendra - SHG 3 0.10 0.30 2 0.20 0 0.00 0 0.00 0 0.00 1 0.10
Grand Total 847 229.9
2 206 46.01 204 45.81 205
45.82 204
45.81 284
46.47

CHAPTER – VI
EXPECTED OUT COMES
S. No. Item Unit of
measurement Pre-project
Status Expected Post-project
Status Remarks
1 Status of water table (Depth to Ground water level) Meters - -
2 Ground water structures repaired/ rejuvenated No. Nill 2
3 Quality of drinking water Description Saline Good 4 Availability of drinking water Description 8 Month 12 Month 5 Change in irrigated Area Ha - - 6 Change in cropping/ land use pattern Description 7 Area under agricultural crop Ha I Area under single crop Ha 3755 4200 Ii Area under double crop Ha - - Iii Area under multiple crop Ha 0 -
8 Change in cultivated Area Ha 4355 4600 9 Yield of Bajra q/ha 1.15 5.25
Yield of Guar q/ha 1.72 2.95 Yield of Moong q/ha 0.75 3.05 Yield of Moth q/ha 1.45 1.95
10 Production of Bajra Ton 181 8284 Production of Guar Ton 48 820 Production of Moong Ton 18 741 Production of Moth Ton 38 509
11 Area under vegetation Ha Nil 50 12 Area under horticulture Ha Nil 100 13 Area under fuel Ha Nil 218 14 Area under Fodder Ha Nil 50 15 Fodder production Q 4575.10 171670 16 Milk production Litres/day 1850 2900 17 SHGs Active No. Nil 25 18 No. of livelihoods No. 45 60 19 Income per house hold Rs.in la 0.35 0.75 20 Migration No. 75 25 21 SHG Federations formed No. 3 40

Technical designs and estimates for proposed activities
Model Estimate of Vegetative Barrier
Name of work
Vegetative Barrier Name of Panchayat Samiti
:
Baitu Name of watershed project
Barmer (IWMP) -24
Lenth 100 Mtrs.
S. NO. Particular UNIT Qty
Rate Amount
Labour Total Labour Total
1 Cutting and clearing at ordinary jungl including bushes,shurbs grasses on field boundry.
1 X 100.00 X 1.00 Sq.Mtr. 100.00 3.70 3.70 370 370
2 Transportation of thor sticks from nursery to plantation site by vehical including cost of thor stick.
@ 4 sticks per Mtr. No. 400 11 0 4400
3 Loading of planting sticks from beds to vehiclae or unloading of planting sticks from vehicle No.
400 0.31 0.31 124 124
4 Planting of thor sticks in plain or undulating fields. No. 400 2.50 2.50 1000 1000
5 Contigency 3 percent 177
Total 370 6071
Labour 400
Material 5700
Total 6100
Material Thor sticks 400 Nos.
Cost per running Mtr. 61

Vkadk
fuekZ.k
Do 4.4 Ht 4.4 Bt 0.15 Agor Dia
15.3
De 4 Ho 0.6 Lintal L 3.65 CM Wdt
0.075
Di 3.7 Hag 3.95 BW Lgt
48.06495 Catchment Area 168.6275
W Width 0.3 Out Hgt 0.45 Inner Hgt 0.25 Total Hgt
0.75
RATE
Name of Item
Rate Amount Unskilled Skilled Unskilled skilled
1. E/W for Tanka Excivation 0.7853 4 4 3.95
49.63096 CUM 75 3722.322 75 0 3722.322 0
One Extra Lift on Item No. 1
0.7853 4 4 1.5
18.8472 CUM 11 207.3192 11 0 207.3192 0
Two Extra Lift on Item No. 1
0.7853 4 4 0.95
11.93656 CUM 22 262.60432 22 0 262.6043 0
2. CC 1:5:10 Mixing Laying in Position upto 40mm for base 0.7853 4 4 0.15
1.88472 CUM 1566 2951.4715 288 35 542.7994 65.9652
3. CC 1:3:6 Mixing Laying in Position upto 20mm for wall 0.7853 2.31
3.8
6.893363 CUM 2115 14579.464 220 35 1516.54 241.2677
4. Centering Shutering Fixing Removing for cement concrete 3.1415 3.7
3.8
44.16949 SQM 112 4946.9829 20.3 44 896.6406 1943.458
5. RR Stone Masonary in Cement Mortor for above Ground Level in (1:6) 0.7853 5.67
0.45
2.003693 CUM 1840 3686.795 189 249 378.698 498.9195
6. S/F of Jodhpur Stone Patt/Lintal 2 3.65 0.3 0.15
0.3285 CUM 6484 2129.994 625 1621 205.3125 532.4985
7. Jodhpur Stone Slab roofing in CC 1:2:4 50mm thick upto 12mm aggregate 0.7853 4.4
4.4
15.20341 SQM 793 12056.303 89 82 1353.103 1246.679
8. Flooring in CC 1:2:4 50mm thick upto 12mm aggregate 0.7853 3.7
3.7
10.75076 SQM 204 2193.1544 31 53 333.2735 569.7901
9. Inner Plaster (1:4) & 20mm thick 3.1415 3.7
4.25
49.40009 SQM 100 4940.0088 22 22 1086.802 1086.802
10. Outer Pointing (1:3) 3.1415 4.4
0.45
6.22017 SQM 51.8 322.20481 14 28 87.08238 174.1648
11. Alluminium Door .6*.6 1Nos@500 500
500
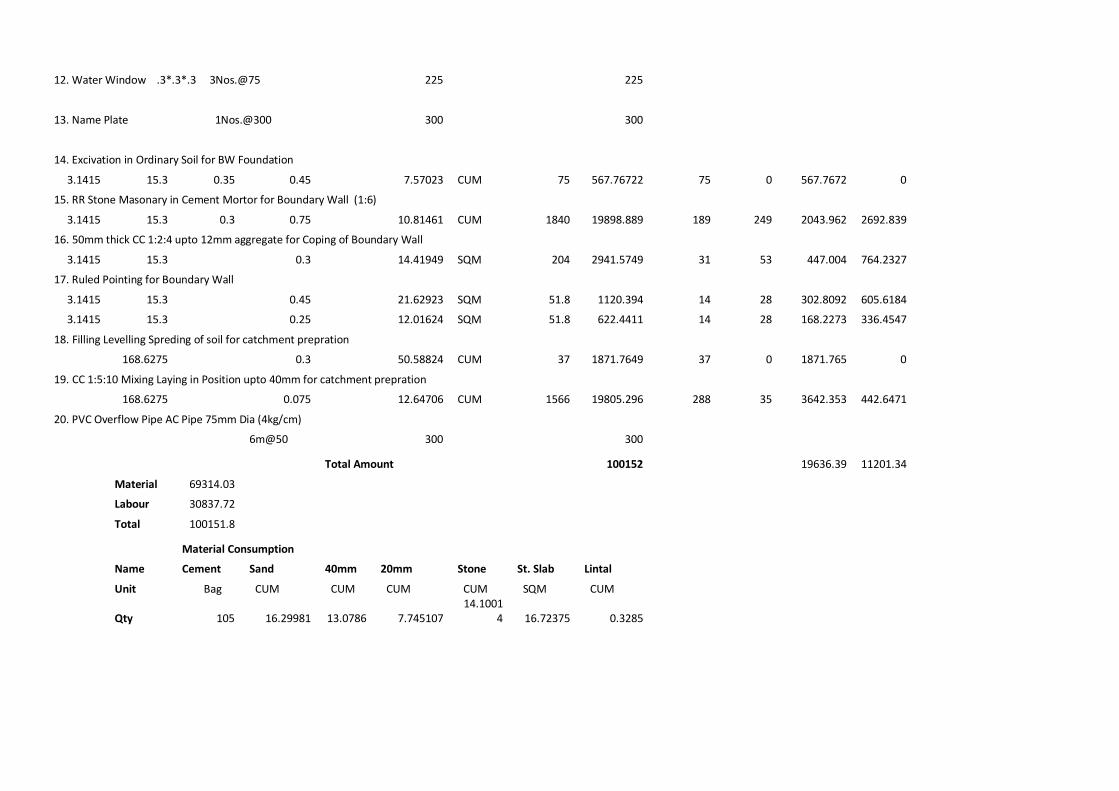
12. Water Window .3*.3*.3 3Nos.@75
225
225
13. Name Plate 1Nos.@300 300
300
14. Excivation in Ordinary Soil for BW Foundation 3.1415 15.3 0.35 0.45
7.57023 CUM 75 567.76722 75 0 567.7672 0
15. RR Stone Masonary in Cement Mortor for Boundary Wall (1:6) 3.1415 15.3 0.3 0.75
10.81461 CUM 1840 19898.889 189 249 2043.962 2692.839
16. 50mm thick CC 1:2:4 upto 12mm aggregate for Coping of Boundary Wall 3.1415 15.3
0.3
14.41949 SQM 204 2941.5749 31 53 447.004 764.2327
17. Ruled Pointing for Boundary Wall 3.1415 15.3
0.45
21.62923 SQM 51.8 1120.394 14 28 302.8092 605.6184
3.1415 15.3
0.25
12.01624 SQM 51.8 622.4411 14 28 168.2273 336.4547
18. Filling Levelling Spreding of soil for catchment prepration
168.6275
0.3
50.58824 CUM 37 1871.7649 37 0 1871.765 0
19. CC 1:5:10 Mixing Laying in Position upto 40mm for catchment prepration
168.6275
0.075
12.64706 CUM 1566 19805.296 288 35 3642.353 442.6471
20. PVC Overflow Pipe AC Pipe 75mm Dia (4kg/cm)
6m@50
300
300
Total Amount
100152
19636.39 11201.34
Material 69314.03
Labour 30837.72
Total 100151.8
Material Consumption
Name Cement Sand 40mm 20mm Stone St. Slab Lintal
Unit Bag CUM CUM CUM CUM SQM CUM
Qty 105 16.29981 13.0786 7.745107
14.10014 16.72375 0.3285

DESIGN OF AGOR FOR TANKA IN BARMER DISTRICT
(For watershed projects)
Capacity of Tanka = 50000 Lit. (Aprox.)
Average rainfall of Distt. = 270mm (Annual)
Capacity of Tanka = Area of Agor x Av. Rainfall
50.00= /4 x( D x D x 0.27 )
D x D = (50.0x4) / (x0.27)
D = 15.359 Mtrs.
Say D = 15.40 Mtrs.

TANKA CAPACITY 50000 Litres
Vkadk fuekZ.k
G.P.
Village
50 mm thick C.C.(1:2:4) with 20 mm size agg.
Alluminium Door
R/R stone masonary in CSM(1:6)
R/R stone masonary in
CSM(1:8)
50 mm thick C.C.(1:2:4) with 20 mm
size agg. For flooring
0.35
5.38
4.50
0.35
R/R stone masonary in
CSM(1:8)
0.8
Agore
0.45
Agore
0.75
50 mm thick C.C.(1:2:4) with 20 mm size agg. For flooring
Lintel
5.38
Kanker / Dhadla 0.14
Kanker /
Dhadla 0.14
4.41
Cement Plaster in CSM(1:4) 20 mm
0.15
0.15
C.C.(1:3:6) with 20 mm
size agg.
C.C.(1:3:6) with 20 mm size agg.
3.96
4.21
3.80
50 mm thick C.C.(1:2:4) with 20 mm size agg. For flooring
0.25
C.C.(1:4:8) with 40 mm.
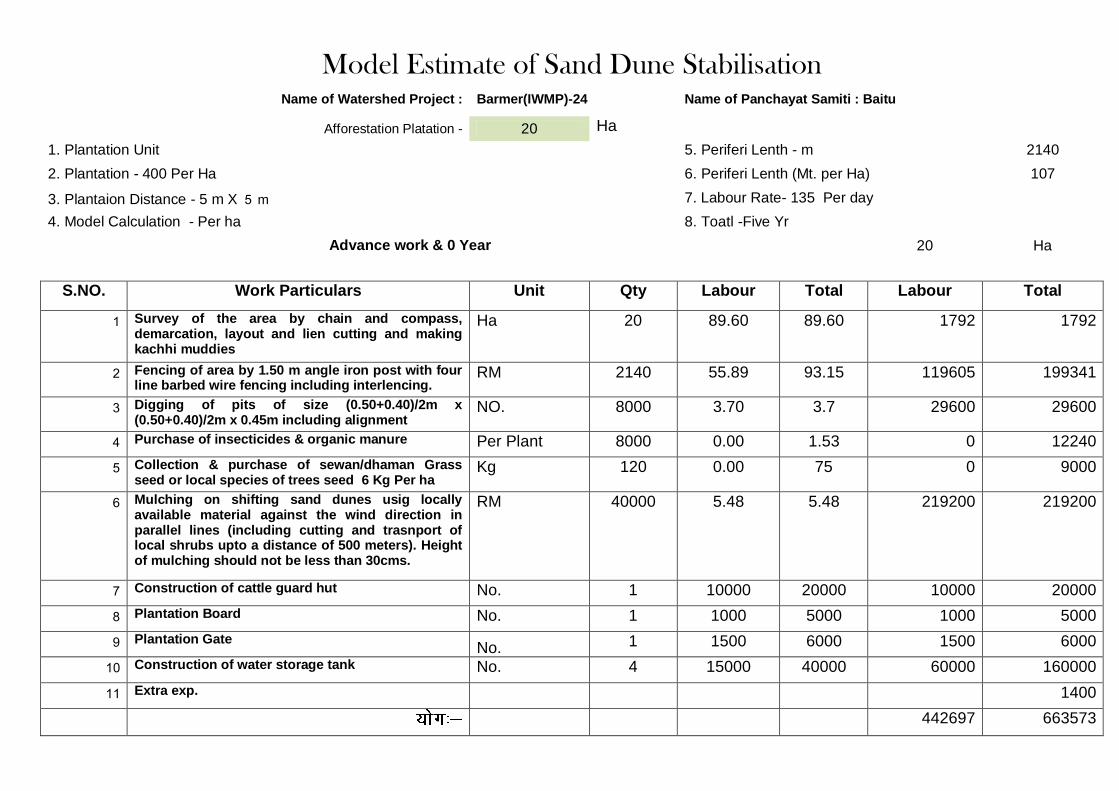
Model Estimate of Sand Dune Stabilisation
Name of Watershed Project : Barmer(IWMP)-24 Name of Panchayat Samiti : Baitu
Afforestation Platation - 20 Ha
1. Plantation Unit
5. Periferi Lenth - m 2140
2. Plantation - 400 Per Ha
6. Periferi Lenth (Mt. per Ha) 107
3. Plantaion Distance - 5 m X 5 m
7. Labour Rate- 135 Per day
4. Model Calculation - Per ha
8. Toatl -Five Yr
Advance work & 0 Year 20 Ha
S.NO. Work Particulars Unit Qty Labour Total Labour Total
1 Survey of the area by chain and compass, demarcation, layout and lien cutting and making kachhi muddies
Ha 20 89.60 89.60 1792 1792
2 Fencing of area by 1.50 m angle iron post with four line barbed wire fencing including interlencing.
RM 2140 55.89 93.15 119605 199341
3 Digging of pits of size (0.50+0.40)/2m x (0.50+0.40)/2m x 0.45m including alignment
NO. 8000 3.70 3.7 29600 29600
4 Purchase of insecticides & organic manure Per Plant 8000 0.00 1.53 0 12240
5 Collection & purchase of sewan/dhaman Grass seed or local species of trees seed 6 Kg Per ha
Kg 120 0.00 75 0 9000
6 Mulching on shifting sand dunes usig locally available material against the wind direction in parallel lines (including cutting and trasnport of local shrubs upto a distance of 500 meters). Height of mulching should not be less than 30cms.
RM 40000 5.48 5.48 219200 219200
7 Construction of cattle guard hut No. 1 10000 20000 10000 20000
8 Plantation Board No. 1 1000 5000 1000 5000
9 Plantation Gate No. 1 1500 6000 1500 6000
10 Construction of water storage tank No. 4 15000 40000 60000 160000
11 Extra exp. 1400
442697 663573

Forest Platation-First year 20 Ha
12 Purchase of Plants No. 8000 0 8.00 0 64000
13 Transportation of plants from nursery to plantation site by camel cart
N0. 8000 0 2.52 0 20160
14 Plantation of plants with treatment, organic manure, primary irrigation, making of thawala & local transportation
No. 8000 0 15.28 0 122240
15 Watering 15 Litre per plant eight times in a year. No. 8000 22.16 45.68 177280 365440
16 One Hoeing and weeding after rain and 8 times hoeing after watering
No. 8000 14.24 14.24 113920 113920
17 Prepairing of seed balls in ratio (1:1:2:2) mixing of 1 Kg seed, manure, sandy soil, loamy soil. Total materil 36Kg per ha.
Kg 120 24.04 24.04 2884.8 2884.8
18 Sowing of seed balls by dibbling method/tractor Ha 20 456 869 9120 17380
19 Prooning of 10 percent Plants upto 1/3 ht. No. 800 1.2 1.2 960 960
20 Watch & ward Month 12 4050 4050 48600 48600
21 Extra exp. 1400
Total 352765 756985
Forest Platation- Second year 20 Ha
22 Purchase of 20 % Plants for replacement No. 1600 0 8.00 0 12800
23 Transportation of plants from nursery to plantation site by camel cart
N0. 1600 0 2.52 0 4032
24 Plantation of 20 % plants with treatment, organic manure, primary irrigation, making of thawala & local transportation
No. 1600 0 15.28 0 24448
25 Watering 15 Litre per plant eight times in a year. N0. 1600 22.16 45.68 35456 73088
26 One Hoeing and weeding after rain and 8 times hoeing after watering
No. 1600 14.24 14.24 22784 22784
27 Collection & purchase of sewan/dhaman Grass seed or local species of trees seed 2 Kg Per ha
Kg 40 0 75 0 3000
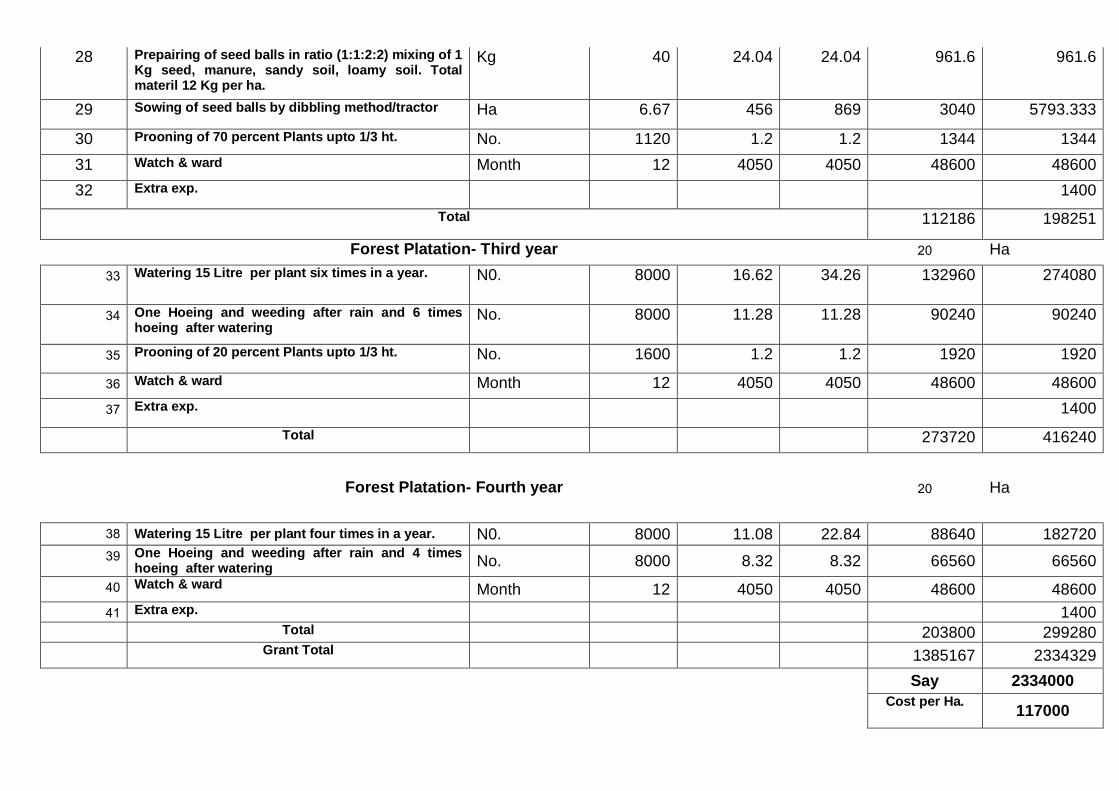
28 Prepairing of seed balls in ratio (1:1:2:2) mixing of 1 Kg seed, manure, sandy soil, loamy soil. Total materil 12 Kg per ha.
Kg 40 24.04 24.04 961.6 961.6
29 Sowing of seed balls by dibbling method/tractor Ha 6.67 456 869 3040 5793.333
30 Prooning of 70 percent Plants upto 1/3 ht. No. 1120 1.2 1.2 1344 1344
31 Watch & ward Month 12 4050 4050 48600 48600
32 Extra exp. 1400
Total 112186 198251
Forest Platation- Third year 20 Ha
33 Watering 15 Litre per plant six times in a year. N0. 8000 16.62 34.26 132960 274080
34 One Hoeing and weeding after rain and 6 times hoeing after watering
No. 8000 11.28 11.28 90240 90240
35 Prooning of 20 percent Plants upto 1/3 ht. No. 1600 1.2 1.2 1920 1920
36 Watch & ward Month 12 4050 4050 48600 48600
37 Extra exp. 1400
Total 273720 416240
Forest Platation- Fourth year 20 Ha
38 Watering 15 Litre per plant four times in a year. N0. 8000 11.08 22.84 88640 182720
39 One Hoeing and weeding after rain and 4 times hoeing after watering
No. 8000 8.32 8.32 66560 66560
40 Watch & ward Month 12 4050 4050 48600 48600
41 Extra exp. 1400
Total 203800 299280
Grant Total 1385167 2334329
Say 2334000
Cost per Ha. 117000
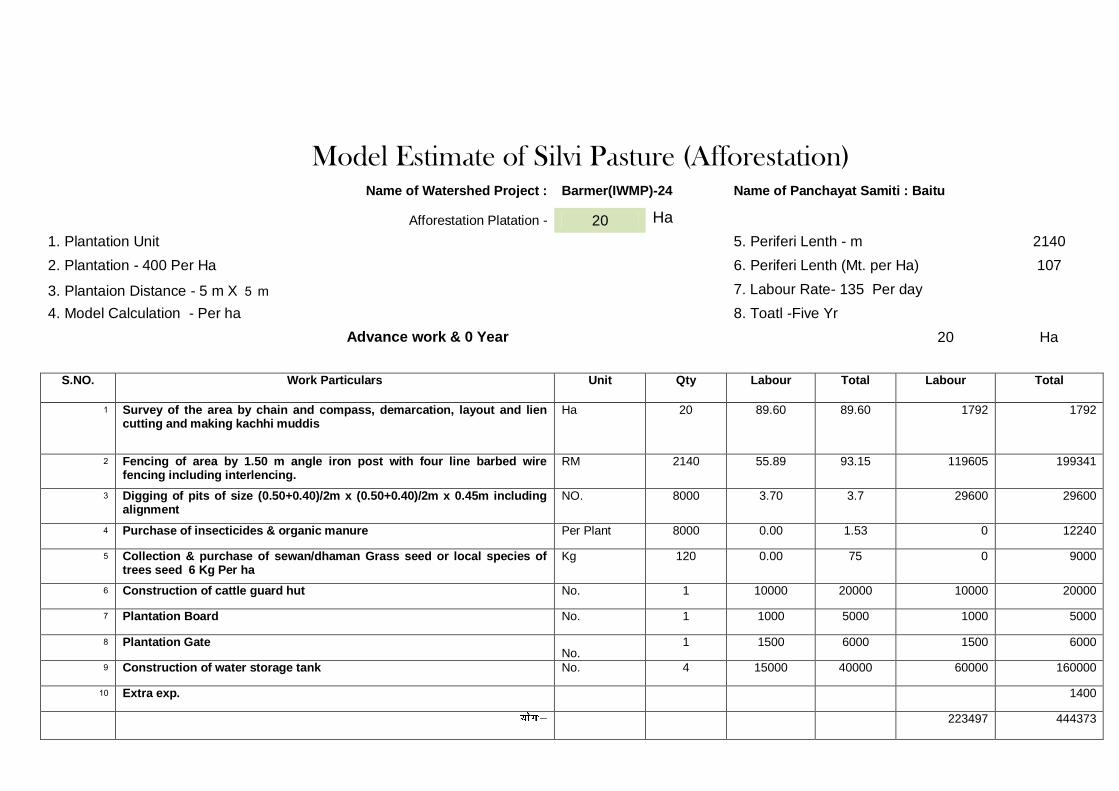
Model Estimate of Silvi Pasture (Afforestation)
Name of Watershed Project : Barmer(IWMP)-24 Name of Panchayat Samiti : Baitu
Afforestation Platation - 20 Ha
1. Plantation Unit
5. Periferi Lenth - m 2140
2. Plantation - 400 Per Ha
6. Periferi Lenth (Mt. per Ha) 107
3. Plantaion Distance - 5 m X 5 m
7. Labour Rate- 135 Per day
4. Model Calculation - Per ha
8. Toatl -Five Yr
Advance work & 0 Year 20 Ha
S.NO. Work Particulars Unit Qty Labour Total Labour Total
1 Survey of the area by chain and compass, demarcation, layout and lien cutting and making kachhi muddis
Ha 20 89.60 89.60 1792 1792
2 Fencing of area by 1.50 m angle iron post with four line barbed wire fencing including interlencing.
RM 2140 55.89 93.15 119605 199341
3 Digging of pits of size (0.50+0.40)/2m x (0.50+0.40)/2m x 0.45m including alignment
NO. 8000 3.70 3.7 29600 29600
4 Purchase of insecticides & organic manure Per Plant 8000 0.00 1.53 0 12240
5 Collection & purchase of sewan/dhaman Grass seed or local species of trees seed 6 Kg Per ha
Kg 120 0.00 75 0 9000
6 Construction of cattle guard hut No. 1 10000 20000 10000 20000
7 Plantation Board No. 1 1000 5000 1000 5000
8 Plantation Gate No.
1 1500 6000 1500 6000
9 Construction of water storage tank No. 4 15000 40000 60000 160000
10 Extra exp. 1400
223497 444373
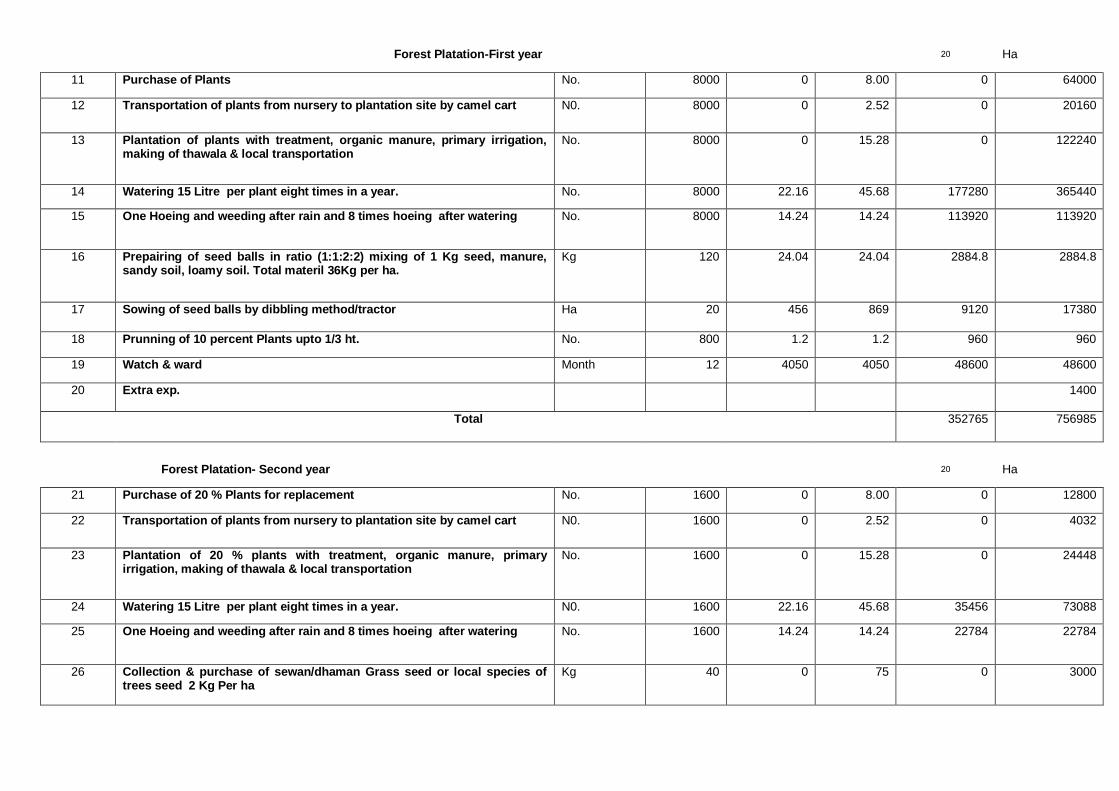
Forest Platation-First year 20 Ha
11 Purchase of Plants No. 8000 0 8.00 0 64000
12 Transportation of plants from nursery to plantation site by camel cart N0. 8000 0 2.52 0 20160
13 Plantation of plants with treatment, organic manure, primary irrigation, making of thawala & local transportation
No. 8000 0 15.28 0 122240
14 Watering 15 Litre per plant eight times in a year. No. 8000 22.16 45.68 177280 365440
15 One Hoeing and weeding after rain and 8 times hoeing after watering No. 8000 14.24 14.24 113920 113920
16 Prepairing of seed balls in ratio (1:1:2:2) mixing of 1 Kg seed, manure, sandy soil, loamy soil. Total materil 36Kg per ha.
Kg 120 24.04 24.04 2884.8 2884.8
17 Sowing of seed balls by dibbling method/tractor Ha 20 456 869 9120 17380
18 Prunning of 10 percent Plants upto 1/3 ht. No. 800 1.2 1.2 960 960
19 Watch & ward Month 12 4050 4050 48600 48600
20 Extra exp. 1400
Total 352765 756985
Forest Platation- Second year 20 Ha
21 Purchase of 20 % Plants for replacement No. 1600 0 8.00 0 12800
22 Transportation of plants from nursery to plantation site by camel cart N0. 1600 0 2.52 0 4032
23 Plantation of 20 % plants with treatment, organic manure, primary irrigation, making of thawala & local transportation
No. 1600 0 15.28 0 24448
24 Watering 15 Litre per plant eight times in a year. N0. 1600 22.16 45.68 35456 73088
25 One Hoeing and weeding after rain and 8 times hoeing after watering No. 1600 14.24 14.24 22784 22784
26 Collection & purchase of sewan/dhaman Grass seed or local species of trees seed 2 Kg Per ha
Kg 40 0 75 0 3000
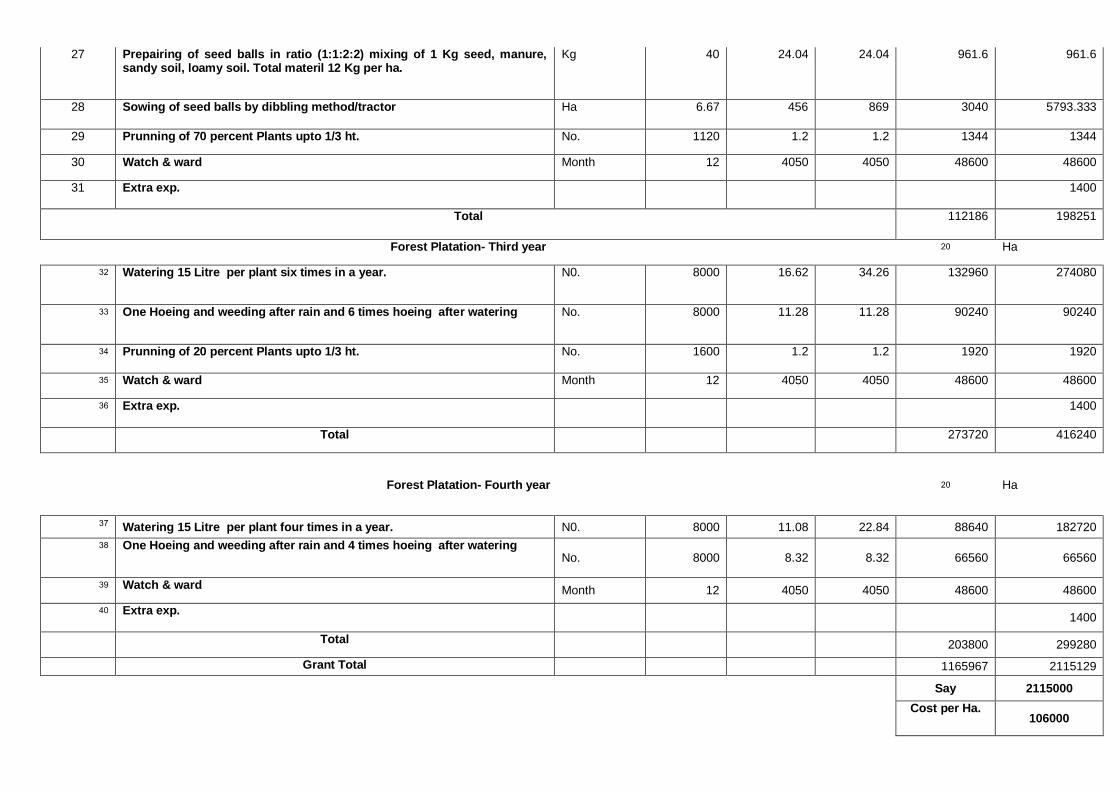
27 Prepairing of seed balls in ratio (1:1:2:2) mixing of 1 Kg seed, manure, sandy soil, loamy soil. Total materil 12 Kg per ha.
Kg 40 24.04 24.04 961.6 961.6
28 Sowing of seed balls by dibbling method/tractor Ha 6.67 456 869 3040 5793.333
29 Prunning of 70 percent Plants upto 1/3 ht. No. 1120 1.2 1.2 1344 1344
30 Watch & ward Month 12 4050 4050 48600 48600
31 Extra exp. 1400
Total 112186 198251
Forest Platation- Third year 20 Ha
32 Watering 15 Litre per plant six times in a year. N0. 8000 16.62 34.26 132960 274080
33 One Hoeing and weeding after rain and 6 times hoeing after watering No. 8000 11.28 11.28 90240 90240
34 Prunning of 20 percent Plants upto 1/3 ht. No. 1600 1.2 1.2 1920 1920
35 Watch & ward Month 12 4050 4050 48600 48600
36 Extra exp. 1400
Total 273720 416240
Forest Platation- Fourth year 20 Ha
37 Watering 15 Litre per plant four times in a year. N0. 8000 11.08 22.84 88640 182720
38 One Hoeing and weeding after rain and 4 times hoeing after watering No. 8000 8.32 8.32 66560 66560
39 Watch & ward Month 12 4050 4050 48600 48600
40 Extra exp. 1400
Total 203800 299280
Grant Total 1165967 2115129
Say 2115000
Cost per Ha. 106000
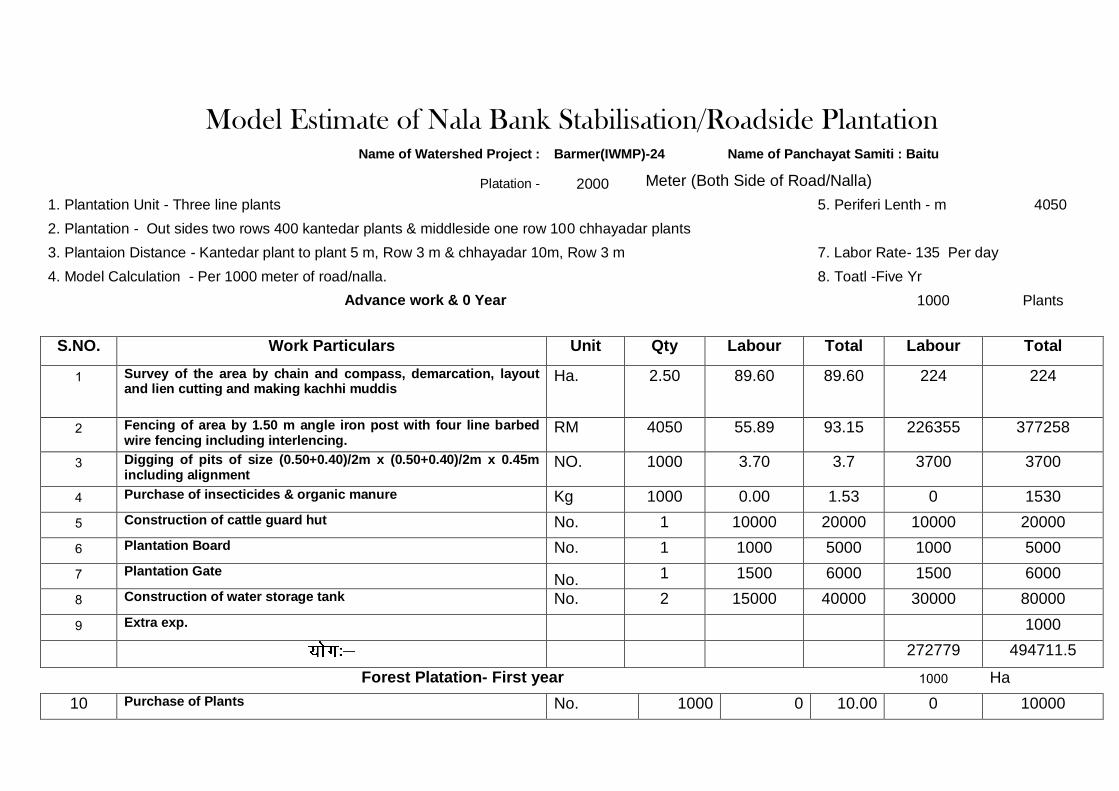
Model Estimate of Nala Bank Stabilisation/Roadside Plantation
Name of Watershed Project : Barmer(IWMP)-24 Name of Panchayat Samiti : Baitu
Platation - 2000 Meter (Both Side of Road/Nalla)
1. Plantation Unit - Three line plants
5. Periferi Lenth - m 4050
2. Plantation - Out sides two rows 400 kantedar plants & middleside one row 100 chhayadar plants
3. Plantaion Distance - Kantedar plant to plant 5 m, Row 3 m & chhayadar 10m, Row 3 m 7. Labor Rate- 135 Per day
4. Model Calculation - Per 1000 meter of road/nalla.
8. Toatl -Five Yr
Advance work & 0 Year 1000 Plants
S.NO. Work Particulars Unit Qty Labour Total Labour Total
1 Survey of the area by chain and compass, demarcation, layout and lien cutting and making kachhi muddis
Ha. 2.50 89.60 89.60 224 224
2 Fencing of area by 1.50 m angle iron post with four line barbed wire fencing including interlencing.
RM 4050 55.89 93.15 226355 377258
3 Digging of pits of size (0.50+0.40)/2m x (0.50+0.40)/2m x 0.45m including alignment
NO. 1000 3.70 3.7 3700 3700
4 Purchase of insecticides & organic manure Kg 1000 0.00 1.53 0 1530
5 Construction of cattle guard hut No. 1 10000 20000 10000 20000
6 Plantation Board No. 1 1000 5000 1000 5000
7 Plantation Gate No. 1 1500 6000 1500 6000
8 Construction of water storage tank No. 2 15000 40000 30000 80000
9 Extra exp. 1000
272779 494711.5
Forest Platation- First year 1000 Ha
10 Purchase of Plants No. 1000 0 10.00 0 10000
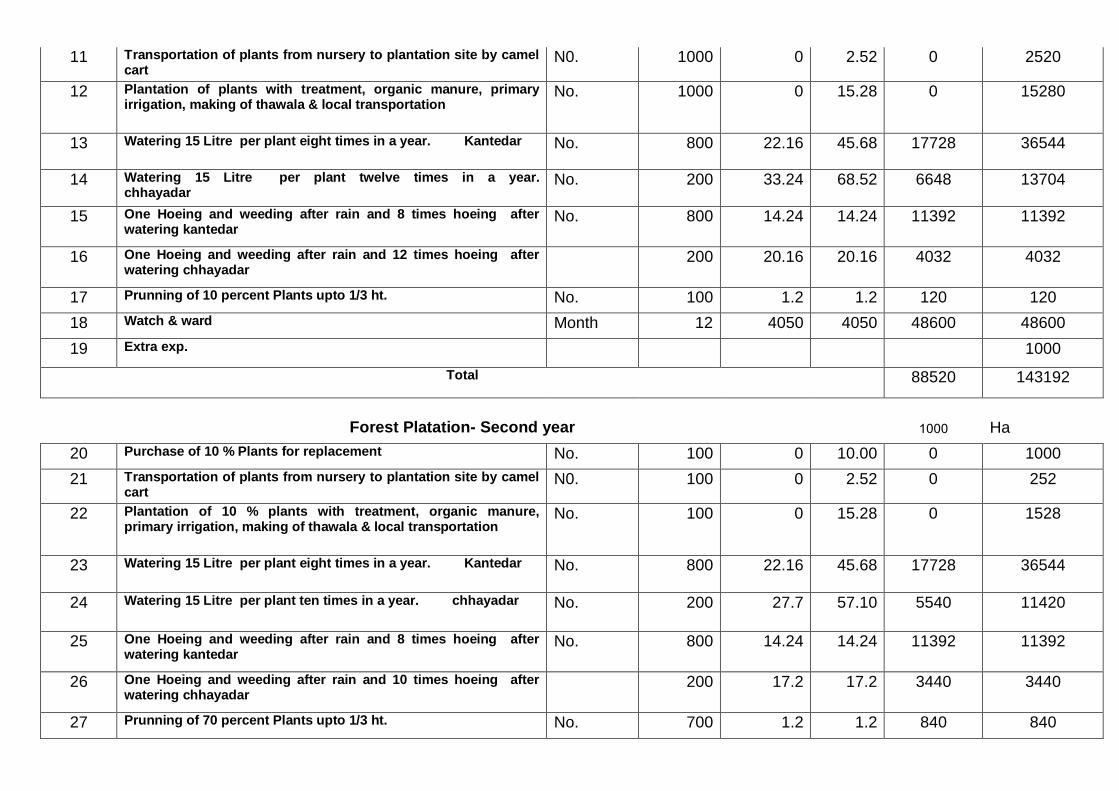
11 Transportation of plants from nursery to plantation site by camel cart
N0. 1000 0 2.52 0 2520
12 Plantation of plants with treatment, organic manure, primary irrigation, making of thawala & local transportation
No. 1000 0 15.28 0 15280
13 Watering 15 Litre per plant eight times in a year. Kantedar No. 800 22.16 45.68 17728 36544
14 Watering 15 Litre per plant twelve times in a year. chhayadar
No. 200 33.24 68.52 6648 13704
15 One Hoeing and weeding after rain and 8 times hoeing after watering kantedar
No. 800 14.24 14.24 11392 11392
16 One Hoeing and weeding after rain and 12 times hoeing after watering chhayadar
200 20.16 20.16 4032 4032
17 Prunning of 10 percent Plants upto 1/3 ht. No. 100 1.2 1.2 120 120
18 Watch & ward Month 12 4050 4050 48600 48600
19 Extra exp. 1000
Total 88520 143192
Forest Platation- Second year 1000 Ha
20 Purchase of 10 % Plants for replacement No. 100 0 10.00 0 1000
21 Transportation of plants from nursery to plantation site by camel cart
N0. 100 0 2.52 0 252
22 Plantation of 10 % plants with treatment, organic manure, primary irrigation, making of thawala & local transportation
No. 100 0 15.28 0 1528
23 Watering 15 Litre per plant eight times in a year. Kantedar No. 800 22.16 45.68 17728 36544
24 Watering 15 Litre per plant ten times in a year. chhayadar No. 200 27.7 57.10 5540 11420
25 One Hoeing and weeding after rain and 8 times hoeing after watering kantedar
No. 800 14.24 14.24 11392 11392
26 One Hoeing and weeding after rain and 10 times hoeing after watering chhayadar
200 17.2 17.2 3440 3440
27 Prunning of 70 percent Plants upto 1/3 ht. No. 700 1.2 1.2 840 840

28 Watch & ward Month 12 4050 4050 48600 48600
29 Extra exp. 1000
Total 87540 116016
Forest Platation- Third year 1000 Ha
30 Watering 15 Litre per plant four times in a year. Kantedar No. 800 22.16 45.68 17728 36544
31 Watering 15 Litre per plant ten times in a year. chhayadar No. 200 27.7 57.1 5540 11420
32 One Hoeing and weeding after rain and 4 times hoeing after watering kantedar
No. 800 14.24 14.24 11392 11392
33 One Hoeing and weeding after rain and 10 times hoeing after watering chhayadar
200 17.2 17.2 3440 3440
34 Prunning of 70 percent Plants upto 1/3 ht. No. 700 1.2 1.2 840 840
35 Watch & ward Month 12 4050 4050 48600 48600
36 Extra exp. 1000
Total 87540 113236
Forest Platation- Fourth year 1000 Ha
37 Watering 15 Litre per plant four times in a year. Kantedar No. 800 14.24 14.24 11392 11392
38 Watering 15 Litre per plant ten times in a year. chhayadar No. 200 17.2 17.2 3440 3440
39 One Hoeing and weeding after rain and 4 times hoeing after watering kantedar
No. 700 1.2 1.2 840 840
40 One Hoeing and weeding after rain and 10 times hoeing after watering chhayadar
12 4050 4050 48600 48600
41 Prunning of 70 percent Plants upto 1/3 ht. No. 200 1.2 1.2 240 240
42 Watch & ward Month 12 4050 4050 48600 48600
43 Extra exp. 1000

Total 113112 114112
Grand Total 649491 981268
Say 981000
Cost per mtr of road/nalla 981

MODEL ESTIMATE
Nameof work :- Renovation of Talab (Nadi)
Name of scheme :- IWMP
Name of Watershed
Project : Barmer(IWMP)-24
Name of P. S. :Baitu
******************************
DETAILS OF MEASUREMENTS AND ABSTRACT OF COST
S.No.
ITEMS No. L W D QTY.
Unit
RATE
AMOUNT
1 Earth work in excavation over areas (exceeding 30 Cm. In depth, 1.5 Mtr. in width as well as 10 Sqm. on plan) including disposal of excavated earth lead up to 50 M and lift up to 1.5 Mtr. disposed earth to be leveled and neatly dressed:All kinds of soil.
Pond 1
42.00
42.00 2.05 3616.20
Cum
Wall 4 50 0.60 0.90 109 Cu

.60
.30 m
Weir 4
2.00
0.60 0.90 4.32
Cum
Weir 2
7.00
0.60 0.90 7.56
Cum
3737.38
Cum
92.00
343838.5
9
2 Add extra for every additional lift of 1.5 Mtr. or part thereof : In all kind of soils. 1
30.25
30.25 1.55 1418.35
Cum
11.00
15601.82
3 Add extra for lead including loading, unloading beyond 50 Mtr. With additional 150 Mtr. lead. Qty. sameas per above item No.1
1418.35
Cum
33.75
47869.21
4 Providing and laying in position cement concrete including curing compaction etc. of specified grade excluding the cost of centering and shuttering =All up to plinth level 1:4:8 (1Cement :4 Course Sand :8 Graded stone aggregate 40 mm nominal size
For side slope 4
42.00
8.60 0.100 144.48
Cum
Bottom 1
34.00
34.00 0.15 86.70
Cum
Top 2
50.00
0.30 0.10 3.00
Cum
2
50.60
0.30 0.10 3.04
Cum
237.22
Cum
1749.00
414890.7
8
5 Providing and laying in position cement concrete including curing compaction etc. of specified grade excluding the cost of centering and shuttering =All up to plinth level 1:3:6 (1Cement :3 Course Sand :6 Graded stone aggregate 20 mm nominal size

For side slope 4
42.00
8.60 0.075 108.36
Cum
Bottom 1
34.00
34.00 0.100 115.60
Cum
Top 2
50.00
0.30 0.050 1.50
Cum
2
50.60
0.30 0.050 1.52
Cum
226.98
Cum
2118.00
480739.4
0
6 Providing and laying in position cement concrete including curing compaction etc. of specified grade excluding the cost of centering and shuttering =All up to plinth level 1:5:10 (1Cement :5 Course Sand :10Graded stone aggregate 40 mm nominal size
Wall 4
50.60
0.60 0.15 18.22
Cum
Weir 4
2.00
0.60 0.15 0.72
Cum
Weir 2
7.00
0.60 0.15 1.26
Cum
20.20
Cum
1566.00
31626.94
7 Random Rubble stone masonary for foundation and plinth in Cement Sand Mortar above 30 Cm. thick wall in : Cement Mortar 1:6 (1-Cement:6-Sand).
Wall 4
50.60
0.45 0.30 27.32
Cum
Wall 4
50.60
0.30 1.05 63.76
Cum
Weir 4 2. 0.45 0.30 1.0 Cu
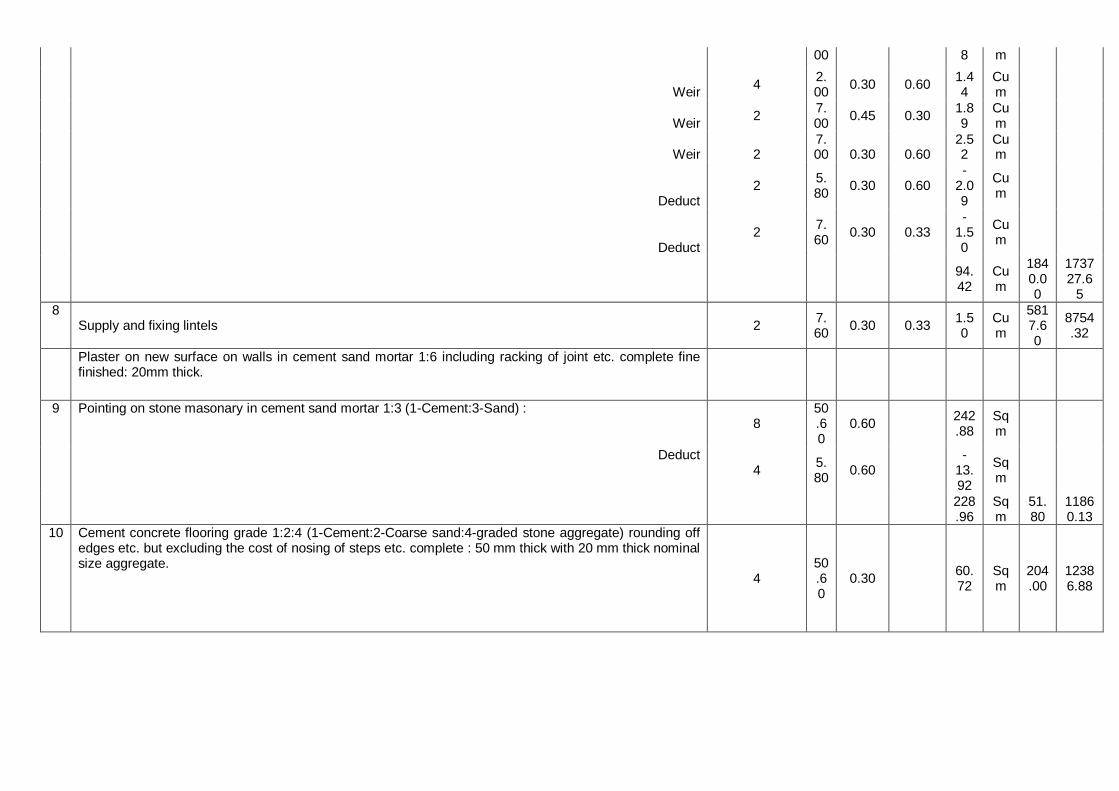
00 8 m
Weir 4
2.00
0.30 0.60 1.44
Cum
Weir 2
7.00
0.45 0.30 1.89
Cum
Weir 2 7.00 0.30 0.60
2.52
Cum
Deduct 2
5.80
0.30 0.60 -
2.09
Cum
Deduct 2
7.60
0.30 0.33 -
1.50
Cum
94.42
Cum
1840.00
173727.6
5
8 Supply and fixing lintels 2
7.60
0.30 0.33 1.50
Cum
5817.60
8754.32
Plaster on new surface on walls in cement sand mortar 1:6 including racking of joint etc. complete fine finished: 20mm thick.
9 Pointing on stone masonary in cement sand mortar 1:3 (1-Cement:3-Sand) : 8
50.60
0.60 242.88
Sqm
Deduct 4
5.80
0.60 -
13.92
Sqm
228.96
Sqm
51.80
11860.13
10 Cement concrete flooring grade 1:2:4 (1-Cement:2-Coarse sand:4-graded stone aggregate) rounding off edges etc. but excluding the cost of nosing of steps etc. complete : 50 mm thick with 20 mm thick nominal size aggregate.
4 50.60
0.30 60.72
Sqm
204.00
12386.88

11 Providing and laying two coats of black rubberized water proof coating after cleaning the existing surface with wire brush, surface should be free from dust, loose particle, oil and grease etc. Apply 1st coat over surface or RCC/Stone slab/Lime terrace/and MS Tanks etc. and apply 2nd coat after drying completely 1st coat (drying period 8 hours) complete in all respects (as per manufacturer's specification).
2600.80
Sqm.
53.00
12
Structural steel work in single section fixed without connecting plate including cutting, hoisting, fixing in position and applying a priming coat of approved steel primer all complete above plinth level up to 4.5 mtr. Height in joist flats, tees, angles and chhanels. Angle 40x40x5mm with drillling holes 3 nos per angle
40 0.90
wt. @3.5kg/m
126.00
Kg 52.20
6577.20
13
Supply and fixing galvanized barbed wire instead of black barbed wire for each wire line. 4
50.60
3.00 607.20
Mtr.
6.30
3825.36
14 Supply and fixing Direction and place identification sign board made out of 2mm thick M.S. sheet framed to angle iron 40x40x5mm and two vertical posts of angle iron of size 65x65x6mm 3meter long with hold fasts, stove enameled paint reflective letter symbol complete of size 120x75 cm.
1 No. 5000.00
5000.00
15 Supply and fixing angle iron gate with enameled paint complete of size 120x90cm. 1
0.90
1.20 wt.
@14kg/sqm
15.12
Kg 52.20
789.26
16 Contigency 46724.63
GRAND TOTAL 1604212.17
Say
Rs.
1604000.00
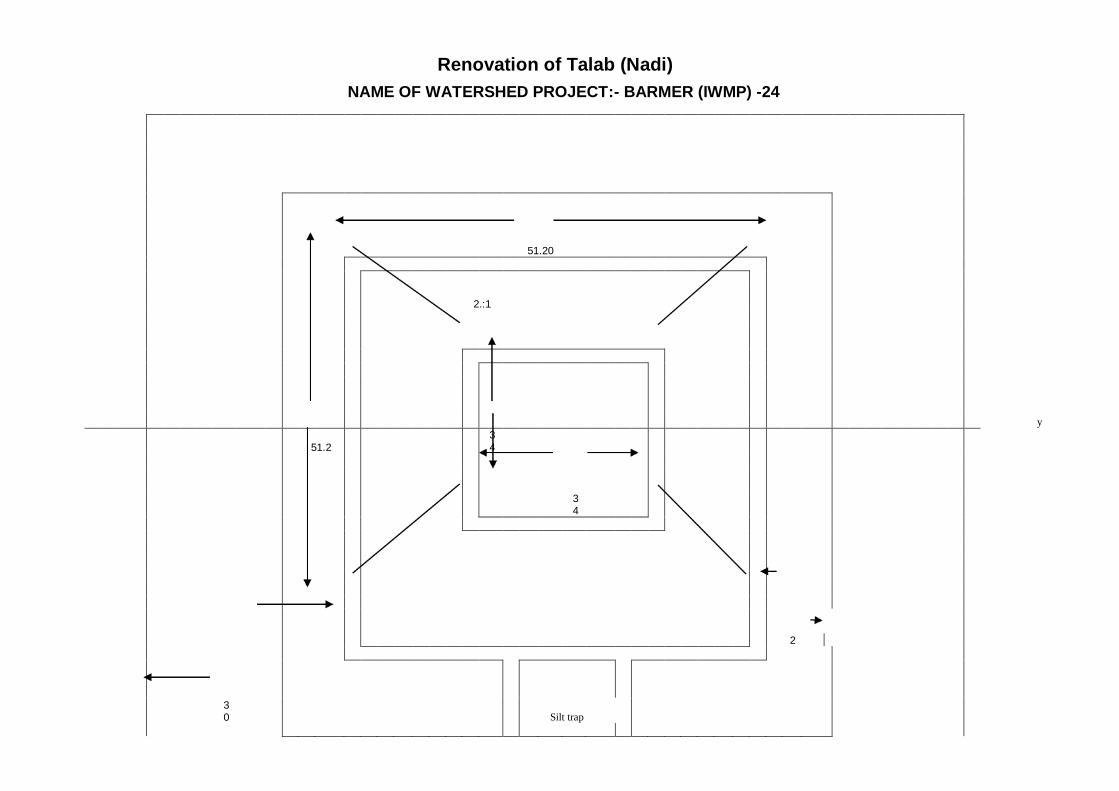
Renovation of Talab (Nadi)
NAME OF WATERSHED PROJECT:- BARMER (IWMP) -24
51.20
2.:1
y
51.2
3
4
34
2
Silt trap
30
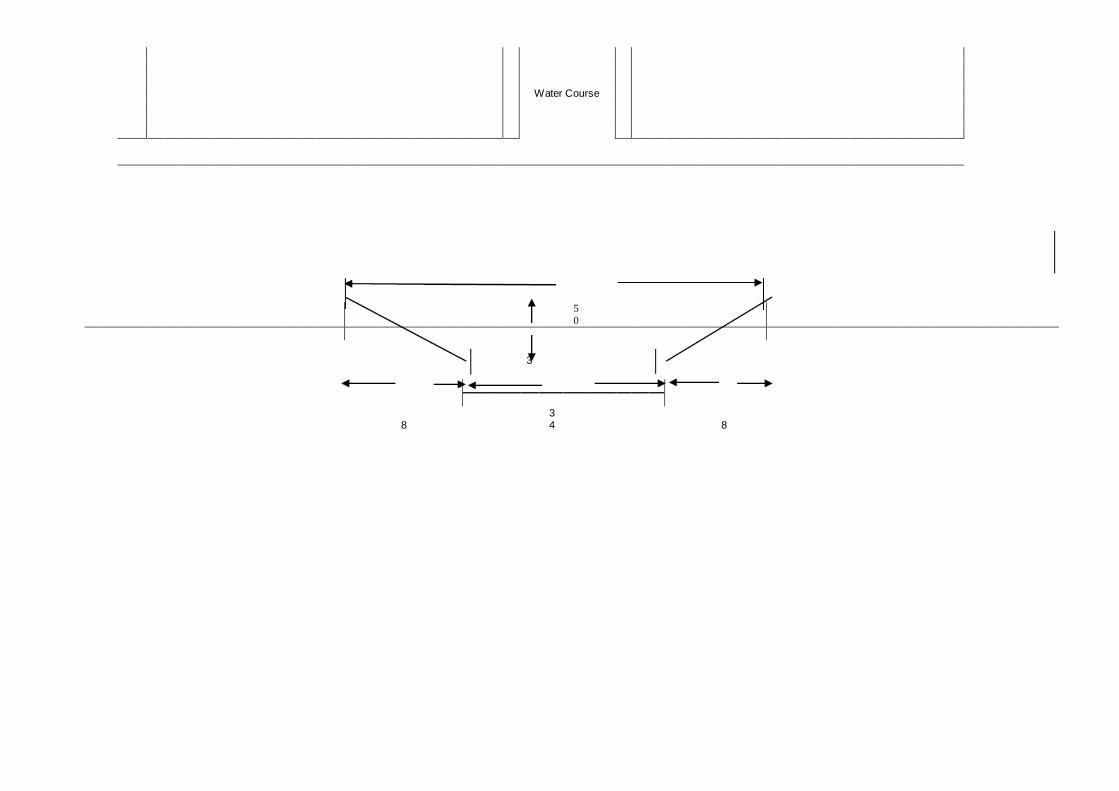
Water Course
5
0
3
8
34
8
Critical Assumption
No severe droughts/ unexpected floods/ natural disasters
Adequate funds are allocated for the same and released on time.
There is no significant pest/ disease attack, and if so, then it will have been contained before irreversible damage is done.
Adverse market conditions do not persist long.
Sound macro-economic and growth conditions continue and the benefits are widely distributed particularly in the rural areas.
Facilitating agencies and resource providers have the required competent staff so that timely and appropriate technical advice and
services are provided to farmers whenever required.
The Capacity Building Plan is implemented, monitored and modified to address evolving needs and feedback from participants.
The execution of the Women’s Empowerment Pedagogy is regularly monitored by the District and State level Implementing Agencies
Means of Verification of indicators
Baseline surveys like household income ,expenditure, health and nutrition etc at the beginning, mid-term and end of the project period
Annual participatory assessment by communities during project period.
Regular project monitoring reports prepared by project monitoring teams/ agencies.
Membership and other Records, Minutes of Meetings maintained by the SHGs, WCs/ Individual beneficiaries/project-related village and
local bodies/PRIs.
External review missions
Data maintained by Government department (Revenue, Agriculture, Groundwater, Irrigation, Animal Husbandry
CHAPTER - VIII Enclosures -
h. Location –District, block, village, watershed location map
i. Map of IWMP Barmer-24 Project (Watershed Boundary demarcation in cadastral & Topo Sheet)
j. PRA Map (along with photos & paper drawing)
k. Treatment map (Indicate proposed works)
l. Cadastral Map on watershed boundary
m. Information on Soils, Soil fertility, Land capability, Soil chemical problems like salinity, alkalinity
n. Land Use Land Cover map
o. Information on existing water harvesting structures & well inventory along with GPS co-ordinates.
p. High resolution, latest Remote Sensing Satellite data
Documents of Agreements:-
q. Proceedings of gram sabha for EPA approval
r. Proceedings of gram sabha Resolution for committee constitution
s. Proceedings of gram sabha for DPR approval
t. DPR approval by district
u. Watershed Committee Registration certificate
v. MoU – PIA – DWMA, PIA – WC(in case of NGO as PIA)
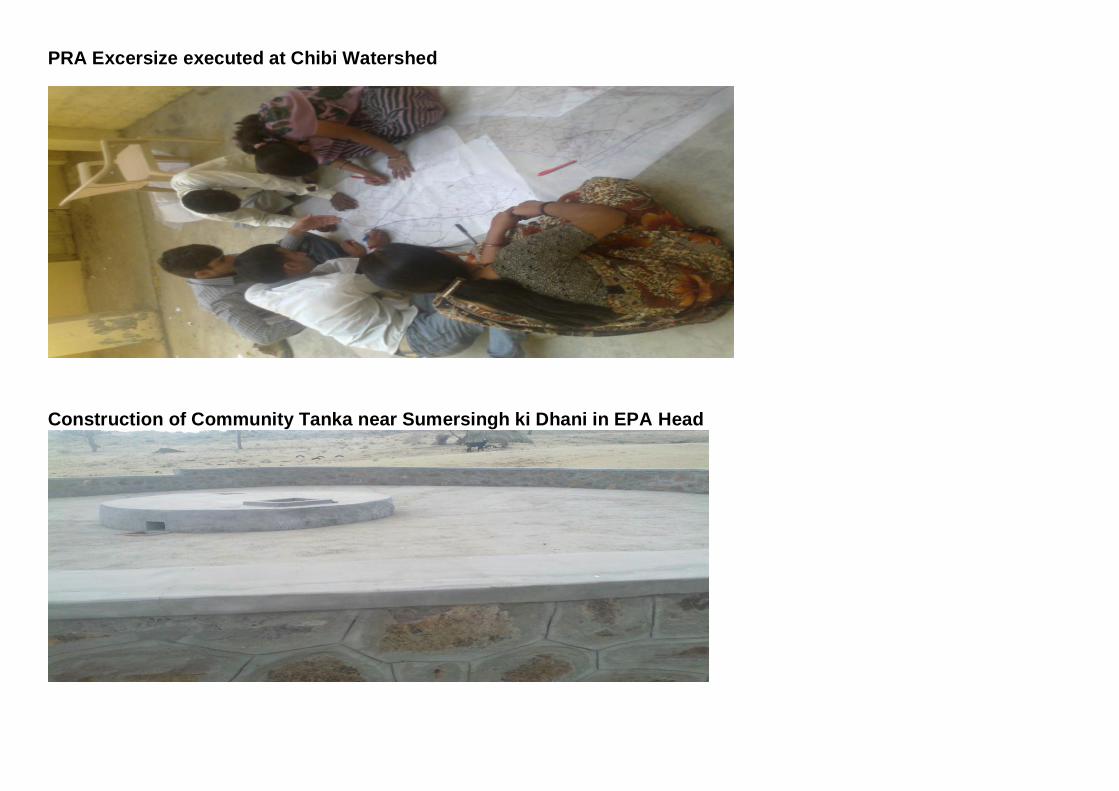
PRA Excersize executed at Chibi Watershed
Construction of Community Tanka near Sumersingh ki Dhani in EPA Head

Gram Sabha Meeting organize at CHIBI
Three Day Farm Produce Training organize at CHIBI


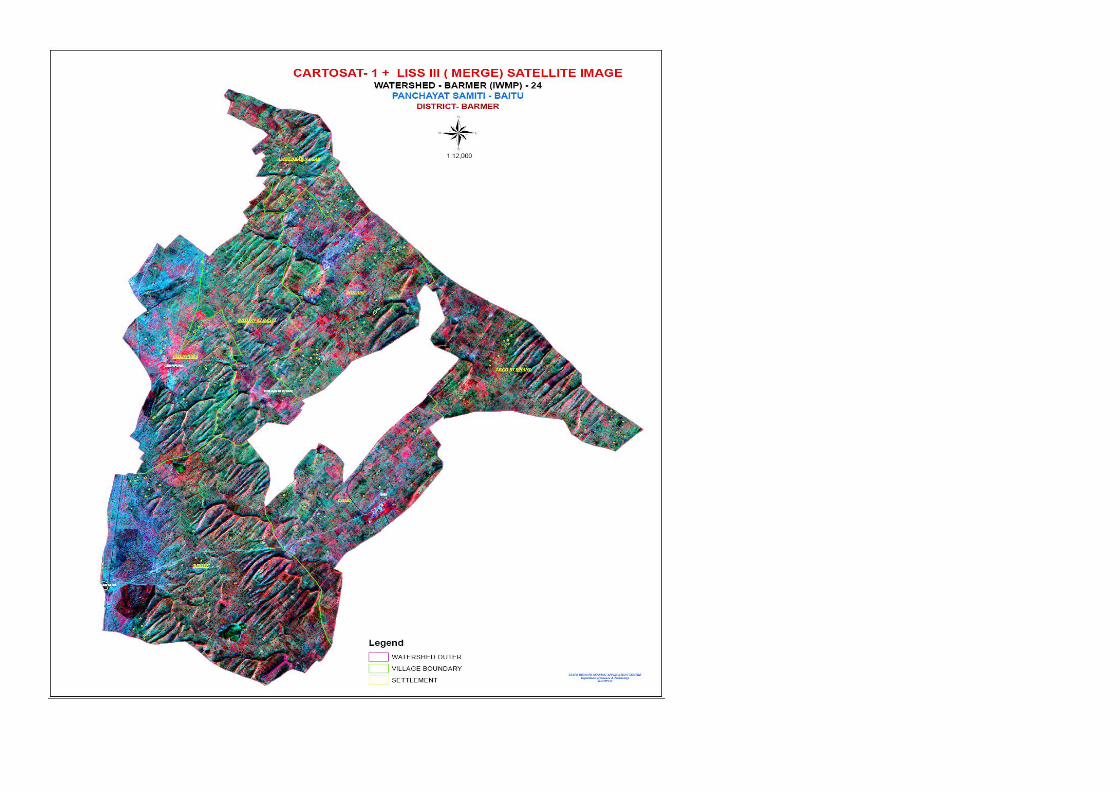
Related Documents