ENERGY STAR Computers Version 8.0 Desktop Computers Discussion March 12, 2018

Welcome message from author
This document is posted to help you gain knowledge. Please leave a comment to let me know what you think about it! Share it to your friends and learn new things together.
Transcript

ENERGY STAR Computers Version 8.0
Desktop Computers Discussion
March 12, 2018

Today’s Objective
Review v8 framework and open discussion (ITI proposal to follow later)
Agenda:
• Categorization Options/Discussion --- 20 min
• Form Factor Innovation (Scope/Definition discussion)---10 min
• Wrap/Next Steps
2

DT Categorization Options
1. P – Score – Current Energy Star v6.1 & v7.0
2. Expandability Score– Current CEC Regulation
3. Simplified Expandability Score (subject to changes)– Proposed by IOUs in 2016
4. Chassis Size (will not be reviewed today)– Japan proposal
3

DT Categories – P score + iGFx/dGFx
• Current Energy Star V6/7 category system
• Processor P-score (# of cores * Base Frequency)
• Graphics – Integrated Graphics or Discrete Graphics
• 6 categories
– The next pages show no real correlation between Base TEC and P-score with 2 different datasets
4
P-Score

P – score vs. Base TECITI dataset used for CEC
5
Two clusters – but weak correlation overall
P-Score

P – score vs. Base TECES v6.1 QPL
6
ENERGY STAR QPL shows poor correlation
P-Score

DT Categories – Expandability Score (CEC)• Currently used by the CEC regulation
– Each interface on the computer gets a unique Expandability Score
• Scoring somewhat correlates to power per port (1 watt = 1 point)
– Pros• Good correlation to Base TEC data (ITI 2016 CEC
database)• Logically makes sense as a motherboard is larger and
has more interfaces the power allowance increases• Has attributes that help define High End Desktop vs
mini PCs
– Cons
• Learning curve
• Lots of interfaces that will be modified over time 7
Table V-7 Expandability
Score
Category
Tier 1
TEC
Limits
Tier2
TEC
Limits
DT / AIO /
Thin
Clients /
Mobile
Gaming
Systems
ES ≤ 250 (NUC / Mini PC)
50 50
250 < ES ≤ 425 (mainstream DT)
80 60
425 < ES ≤ 690 (Larger DT)
100 75
> 690TEC
Exempt
TEC
Exempt
CEC ES

Base TEC – DT Only
8
Clear Step Function of low end of Base TEC
CEC ES

DT Categories – Expandability Score (CEC)
9
Interface Type Interface Score
USB 2.0 or less 5USB 3.0 or 3.1 Gen 1 10USB 3.1 Gen 2 15USB ports or Thunderbolt 3.0 or greater that can provide 100 or more watts of power
100
USB ports or Thunderbolt 3.0 or greater that can provide from 60 or more to less than 100 watts of power
60
USB ports or Thunderbolt 3.0 or greater that can provide from 30 or more to less than 60 watts of power
30
Thunderbolt 3.0 or greater or USB ports that are not otherwise addressed in Table V-1 and that cannot provide 30 or more watts of power 20
Unconnected USB 2.0 motherboard header 10 per headerUnconnected USB 3.0 or 3.1 Gen 1 motherboard header 20 per headerPCI slot other than PCIe x16 (only count mechanical slots) 25PCIe x16 or higher (only count mechanical slots) 75Thunderbolt 2.0 or less 20M.2 (except key M) 10IDE, SATA, eSATA 15M.2 key M, SATA express, U.2 25Integrated liquid cooling 50Either:1) CPU and motherboard support for 4 or more channels of system memory and at least 8 GB of installed and compatible system memory; or2) At least 8 GB of system memory installed on a 256 bit or greater memory interface.
100
CEC ES

DT Categories – Simplified Expand Score (IOUs proposed May 2016)
• Proposed by IOUs / NRDC toward end of CEC process
• Basics
– Simplified Expandability Score (SES) = # of PCIe lanes + 2*(# of High Speed external data port)
• # of PCIe lanes = # of motherboard PCIe lanes implemented on expansion slots
• High Speed External data ports = Max data throughput of >= 10 GB/s and can deliver at least 5W of power
– Also had a PSU size requirement
10
IOUs S-ES

DT Categories – Simplified Expand Score (IOUs proposed May 2016)
• Base TEC does increase with each category so rough correlation
– But not as good as Exp Score
• Category limits were derived from a small sample size
– Would need to start over with category lines if going with this method
• PSU Size does not correlate to Base TEC data (see scatter plot)
• Is the 5W limit for interfaces >= 10 GB/s make sense?
11
Category PSU Size SES Base TEC (June 2016 ITI-CEC dataset)
DT 1 <225 Any 49.8
DT 2.1 ≥225 ≥10 93.4
DT 2.2 ≥375 ≥16 112.4
DT 2.3 ≥575 ≥20 133.6
DT 3 ≥900 ≥36 242.6
IOUs S-ES

DT CategoriesExpandability Score SES
What Expandability Score items move to Simplified Expandability Score?
• Removes
– USB 2.0 and USB 3.1 Gen1
– TBT 2.0
– IDE, SATA, eSATA, SATA express
– HEDT features
• Liquid Cooling
• 4 channels of memory 12
Interface Type Interface ScoreUSB 2.0 or less 5USB 3.0 or 3.1 Gen 1 10USB 3.1 Gen 2 15USB ports or Thunderbolt 3.0 or greater that can provide 100 or more watts of power
100
USB ports or Thunderbolt 3.0 or greater that can provide from 60 or more to less than 100 watts of power
60
USB ports or Thunderbolt 3.0 or greater that can provide from 30 or more to less than 60 watts of power
30
Thunderbolt 3.0 or greater or USB ports that are not otherwise addressed in Table V-1 and that cannot provide 30 or more watts of power 20
Unconnected USB 2.0 motherboard header 10 per headerUnconnected USB 3.0 or 3.1 Gen 1 motherboard header 20 per headerPCI slot other than PCIe x16 (only count mechanical slots) 25PCIe x16 or higher (only count mechanical slots) 75Thunderbolt 2.0 or less 20M.2 (except key M) 10IDE, SATA, eSATA 15M.2 key M, SATA express, U.2 25Integrated liquid cooling 50Either:1) CPU and motherboard support for 4 or more channels of system memory and at least 8 GB of installed and compatible system memory; or2) At least 8 GB of system memory installed on a 256 bit or greater memory interface.
100
IOUs S-ES
CEC ES

Scatter Plot with IOU Categories & ITI Data
13
Scatter plot shows that the IOU categories have a lot of
overlap – PSU sizing category limitations
240 DT & AIO data points
Group 1
Group 2
Group 3
Group 4
IOUs S-ES
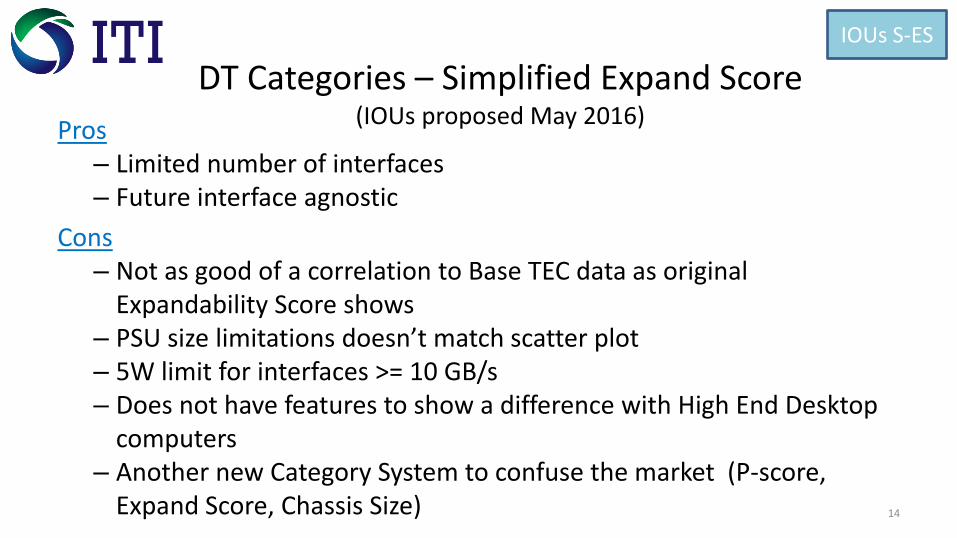
DT Categories – Simplified Expand Score (IOUs proposed May 2016)
Pros– Limited number of interfaces– Future interface agnostic
Cons– Not as good of a correlation to Base TEC data as original
Expandability Score shows– PSU size limitations doesn’t match scatter plot– 5W limit for interfaces >= 10 GB/s– Does not have features to show a difference with High End Desktop
computers– Another new Category System to confuse the market (P-score,
Expand Score, Chassis Size) 14
IOUs S-ES

Next Steps
• Based on today’s discussion, ITI will come back with the DT computers category proposal
15

Form Factor Innovation (Scope/Definitions)
• Computers with Multiple Displays
– Example: Razor Project Valerie
– Proposal: Computers with multiple integrated displays can get an adder for each monitor
• Projector Computers
– An adder for computers with projection technology built in
• Caching Technology
• Always connected states
• Test procedure improvements
• Other HW/SW innovations?16

Back-up
17
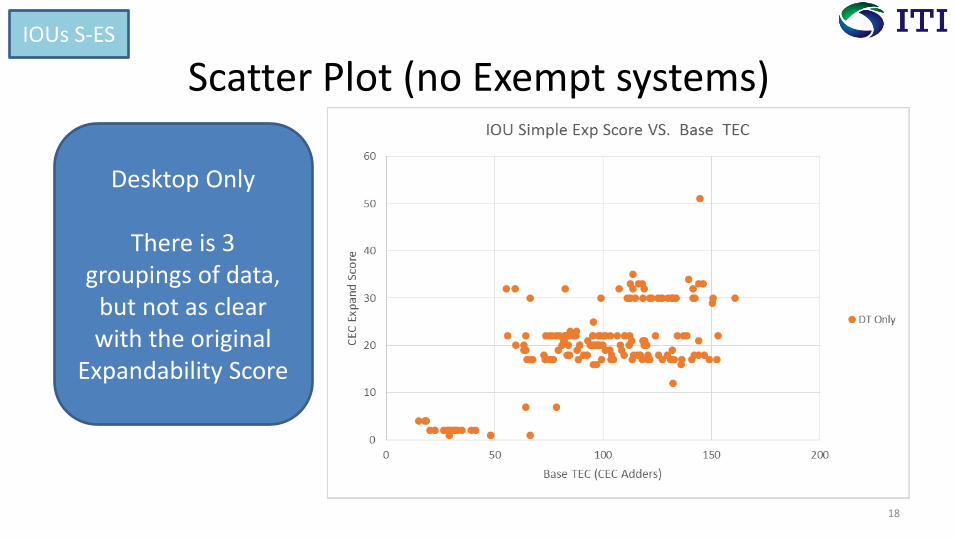
Scatter Plot (no Exempt systems)
18
Desktop Only
There is 3 groupings of data,
but not as clear with the original
Expandability Score
IOUs S-ES

Scatter Plot with Categories
19
Scatter plot shows that the IOU
categories have a lot of overlap
IOUs S-ES

Comparing the Base TEC AverageSES
Modified Category
SES Limit
DT & AIO Count
DT Count
AIO Count
AVG Base TEC (CEC Adders)
DT1 any 67 23 44 43.99
DT2 ≥ 10 126 116 10 97.0
DT3 ≥ 24 42 38 4 99.3
Exempt ≥ 36 7 7 0 224.7
20
CEC ExpCategory
DT & AIO
Count
DT Count
AIO Count
AVG Base TEC (CEC Adders)
DT0 (<250) 76 21 55 31.1
DT1 (250-425) 105 102 3 101.6
DT2 (425-690) 55 55 0 126.3
Exempt 6 6 0 251.4
• Change SES to 3 categories and the Average is very similar between DT2 & DT3.
• Majority of systems might have difference, but there is too many outliers in DT3 that skew the
average
Original SES
Proposal
DT & AIO
Count
DT Count
AIO Count
AVG Base TEC (CEC Adders)
DT1 95 43 52 49.8
DT2.1 84 80 4 93.4
DT2.2 30 28 2 112.4
DT2.3 28 28 0 133.6
DT3 6 6 0 242.6
IOUs S-ES
Related Documents