Debatri Mitra UC ID:63128512 ALL OUR PRICES

Welcome message from author
This document is posted to help you gain knowledge. Please leave a comment to let me know what you think about it! Share it to your friends and learn new things together.
Transcript

Debatri Mitra
UC ID:63128512
ALL OUR PRICES

1
2
INDEX Introduction 3
Design Consideration 4
Using the API 5
Features of MVP and Future Releases 6
A. Release 1
B. Release 2
C. Release 3
D. Release 4
Requirements 11
Appendix A 15
Appendix B 19
Appendix C 20
Appendix D 23
User Interface 25
Architectural Diagram 30
3
Introduction
“All Your Prices”, as I call my app is a simple price prediction application which allows users to
“track and predict” the prices from online e-commerce stores like Amazon.com or
Overstock,com. The price of a particular product varies over the year. In the competitive market
the prices of a product not only vary over time (30%-50% OFF SALES!!) but also according to
various vendors. If we get the same product, cheaper in Amazon than in Ebay then why not? All
the online shoppers like be always stay alert when there will be an online sale and when the
prices of our favorite items will go down. Intelligent buyers often tally the price of an item on
various websites. From a user perspective I must say that it is a very tedious and annoying job to
go online regularly waiting for the magic to happen- “the price of my favorite item has gone
down”. Often it might not happen that the price you think is the lowest price is actually the
lowest price. The price might just go down more say suppose 2 days after I buy the item.
Annoying? I know. So the actual Magic is here!! “All Your Prices” is the solution for all the
shopaholics out there who waste their precious time on shopping online. This app tracks the price
of a particular item over the period of time and how the price varies over time. It uses this to
predict at what time of the year the price of a particular item will be the lowest. Well, this is just
not it. This app not only gives the lowest price of an item over time but also compares the prices
of the competitive vendors like Amazon, Ebay etc and finds out which site will give the lowest
price of a particular item and at which time of the year.
4
Design Considerations
"Track and Predict"-the key words
1. If you’re planning on making your purchase at a later date, you can take into
consideration the price predictions and model predictions to tell you the optimal time to
buy whatever it is you have your eye on.
2. How to choose the correct prediction/forecasting technique-
How well we train our dataset and how efficiently we can come up with a regression
model
Managers are to cope with seasonality, sudden changes in demand levels, price - cutting
maneuvers of the competition, strikes, and large swings of the economy.
The quality of prediction is based on the quality prediction model. Prediction
model is basically a time series forecast- where the aim is to look at historical
data and come up with a model that best explains the time series.
The most popular approach to make the model is the Least Square based methods
where iteratively at each step we calculate the Mean Square Error (MSE) and
adjust the model parameter to minimize this error. Different time series regression
methods use different distance metric or it might use non- SE based models and
rely on econometric models like ARMA, NARMA. Where the problem is solved
from the differential equation point of view.
The selection of a method depends on many factors—the context of the
forecast, the relevance and availability of historical data, the degree of
accuracy desirable, the time period to be forecast, the cost/ benefit (or value)
of the forecast to the company, and the time available for making the
analysis.
5
Using the API
Here are the main steps in using the Prediction API:
1. Create your training data. You must create training data that is appropriate for the
question that you want to answer. This is the most critical and complex step; you should
spend time designing the appropriate training data for your needs. You could also use a
pre-trained model from the hosted model gallery and skip right to step 4: sending a
prediction query.
2. Upload your training data to Google Cloud Storage using standard Google Cloud
Storage tools.
3. Train the API against the data. Call the Prediction API training method, passing in the
location of your training data. You must poll the Prediction API to see when it is
finished training.
4. Send a prediction query. The Prediction API will return an answer that is either an
estimated numeric value, or a categorization of your query object, depending on your
training data.
5. [Optional] Send additional data to your model. If you have a steady stream of new
training data that you'd like to add to your model, you can add new examples to your
existing model individually, instead of uploading all your data at once. This helps
improve your model quickly, as new data becomes available.

6
RELEASE 1
Features of MVP and Future Release
1. Data Dump-
For this part initially we are restricting ourselves in making a webapp and later it can be
converted into a mobile app. In order to track the prices of an item which is an important feature
of our design we need to do a data dump on our storage from different website. It can be like
periodical crawling of the websites- Amazon.com for the first release and store the data in our
database. It can be a daily dump or weekly dump or monthly dump. We can reduce the overhead
by varying the crawler in the sense for the products where the prices fluctuate a lot we can do a
on-demand dump whereas for the products where the prices vary less we can do the data dump at
an interval.
2. Track Prices
Track Prices is one of the most important features of my app. It gives the analysis of how the
prices of one particular item will vary over the period of time. It can be a histogram or a time-
series data. We need to have historical data assembles over the period of time to track the actual
price of an item i.e to analyze how the price varies.
For Example: Often when you add an item to your cart in Amazon it shows “The price has gone
down by 2%”. This analysis is basically tracking. Amazon keeps a track of the price of an item
and how it varies over the period of time and comes up with such an analysis.
3. Store Data
Storing the data is another important feature.In order to track the prices of an item we need to
read the changes in the price of an item over the period of time i.e we need to collect the data
over the period of time and store it for future analysis. The data is quite large and hence we store
the data in a NoSQL database like mongodB. Here data mining is an important concern. We
need to restrict the data to product id, product name and prices. mongodB is schema less so, it
will be easy to scale it for future releases.
7
4. Data Analysis-Learn/Train Data
This feature is somewhat related to tracking the prices of the data. As we collect the data over the
period of time from a particular site, we create our training dataset and train the data.
5. Prediction Algorithm
The most important feature of our app is to predict the price of a particular item. From the
training dataset, we feed our learner and come up with a model-Linear Regression Model (say) to
predict the data.
6. Predict the Price
This is the feature where the user can put the link of the product or the product id the predictor
comes up with predicted value i.e the time of the year when the price of the item will go down
the most.
Appendix A

8
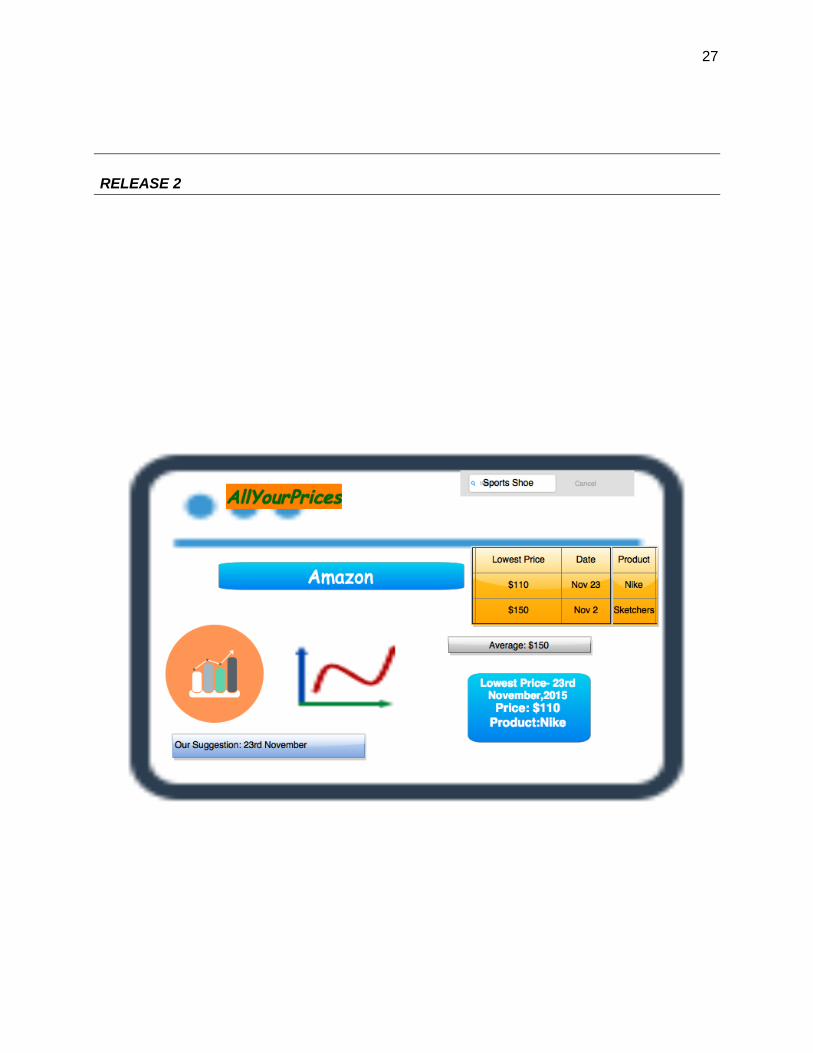
RELEASE 2
Features of MVP and Future Releases
In our second release the only feature that changes is the query optimization. In the first release
we restricted the customer query to a particular product link or product id in a particular site. In
the second release we explore the query a little more and utilize the search engine. Now the
customer can make a more general query. Say the customer wants to buy a Nike Sports shoe. In
the first release the query type allowed for the customer was more specific. The customer was
allowed to give the product id or the product link, whereas in the second query the customer has
more scope for query and the user can give a more general query such as “Sports Shoe”.
Query Type: Text
Query Example: “Sports Shoe”
Appendix B
9
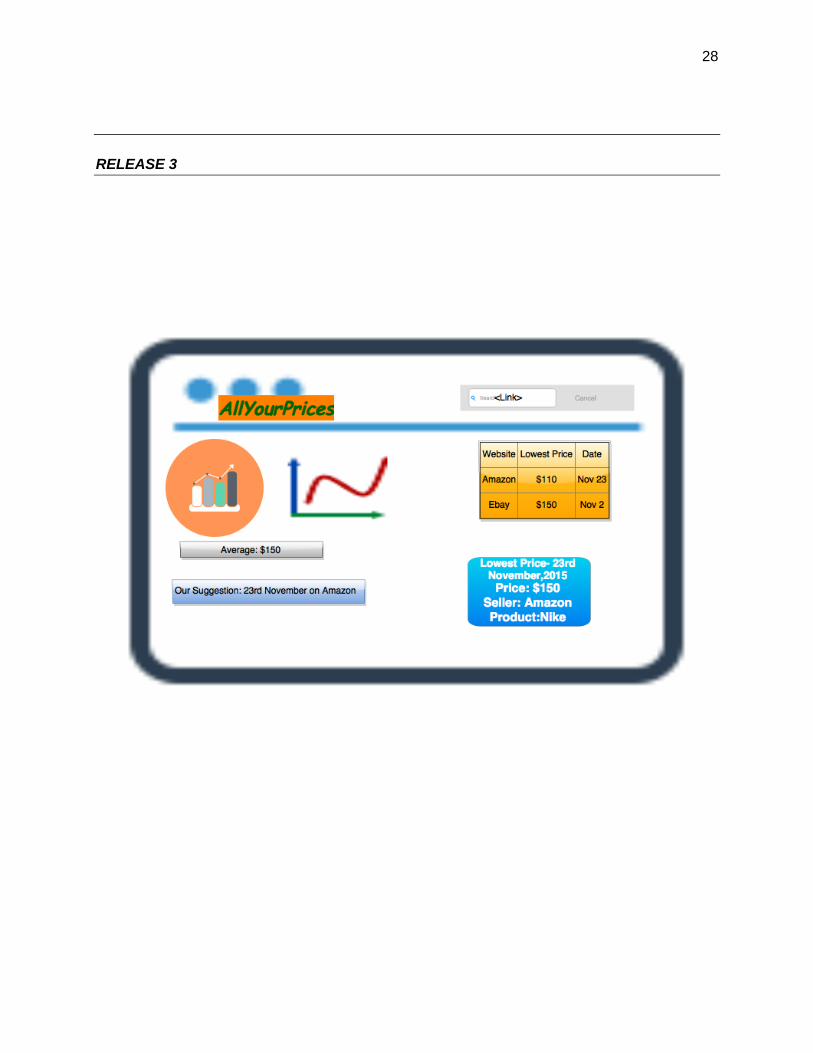
RELEASE 3
Features of MVP and Future Releases
In the first and the second releases we restricted the user to just one site. Now we want to explore
the dataset and collect the price of an item on various websites for the training dataset. However
the query type is now restricted to the link or product id i.e the user can do a specific query in
this Release but he gets data collected from various sites.
Appendix C
10
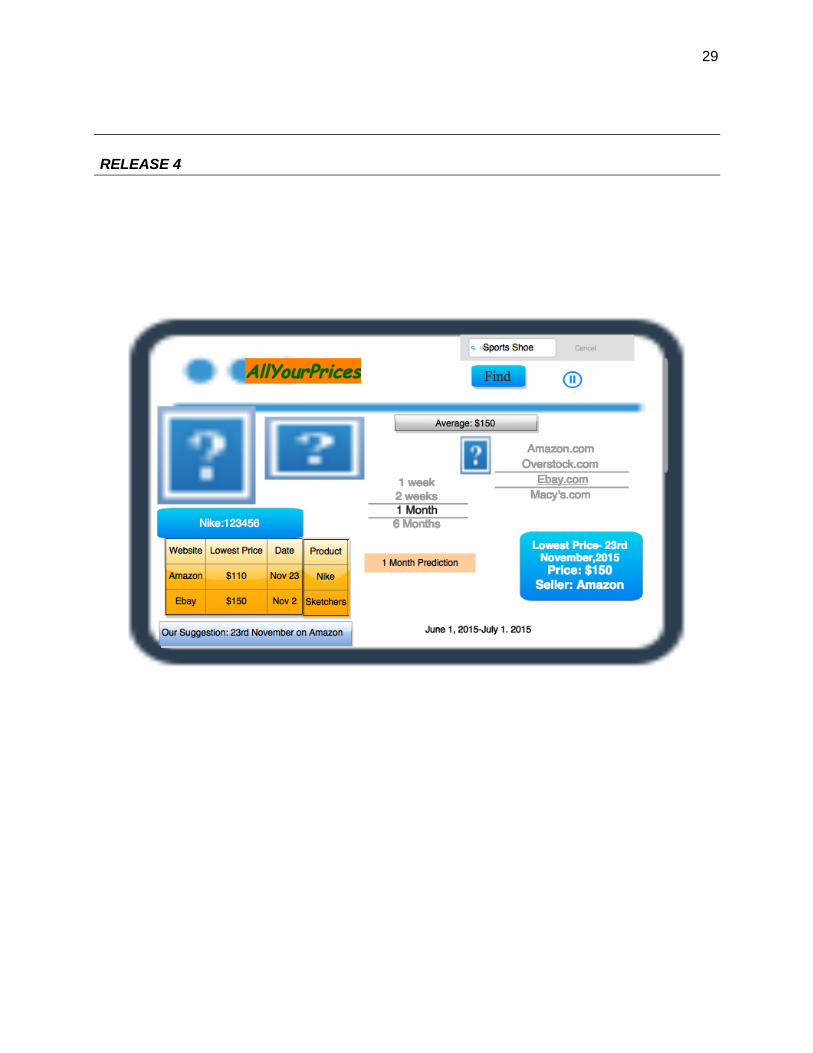
RELEASE 4
Features of MVP and Future Releases
Improvements:-
1. In the first and the second releases we restricted the user to just one site. Now we want to
explore the dataset and collect the price of an item on various websites for the training
dataset. However the query type is not restricted to the link or product id i.e the user can
now do a more generalized query.
2. Here we are providing the user a better and a more friendly interface to check the prices
of their favourite products and also get a time prediction of the prices of the products.
3. In the initial releases the focus was completely on webapp, but in this release the app has
been converted to a mobile app.
4. Another feature is incorporated in the mobile app where the user can pinrest his favourite
item on his mobile and can get a periodic update whenever the price fluctuates over a
certain level.
Appendix D
11
REQUIREMENTS
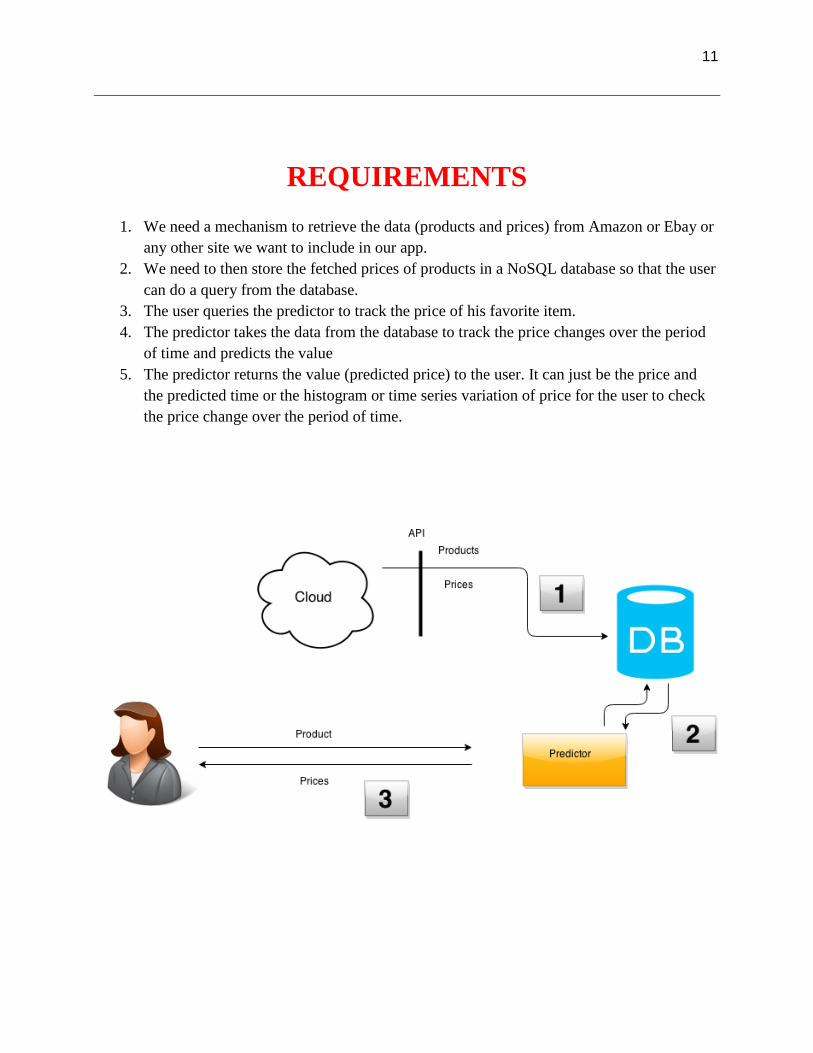
1. We need a mechanism to retrieve the data (products and prices) from Amazon or Ebay or
any other site we want to include in our app.
2. We need to then store the fetched prices of products in a NoSQL database so that the user
can do a query from the database.
3. The user queries the predictor to track the price of his favorite item.
4. The predictor takes the data from the database to track the price changes over the period
of time and predicts the value
5. The predictor returns the value (predicted price) to the user. It can just be the price and
the predicted time or the histogram or time series variation of price for the user to check
the price change over the period of time.
12
Data Retrieval Phase-1
The main functionality is to retrieve the data from the websites. Since, we are dealing with a
large number of data, the data processing takes a lot of time. So it is literally impossible to do an
on- demand dumping of data because that is going to take a lot of time. We can do a periodical
data dumping instead. We use our web crawler to crawl the sites periodically (say, every night)
and dump the data in our data storage. So we are fetching the historical data from the websites.
Data Storage Phase-2.1
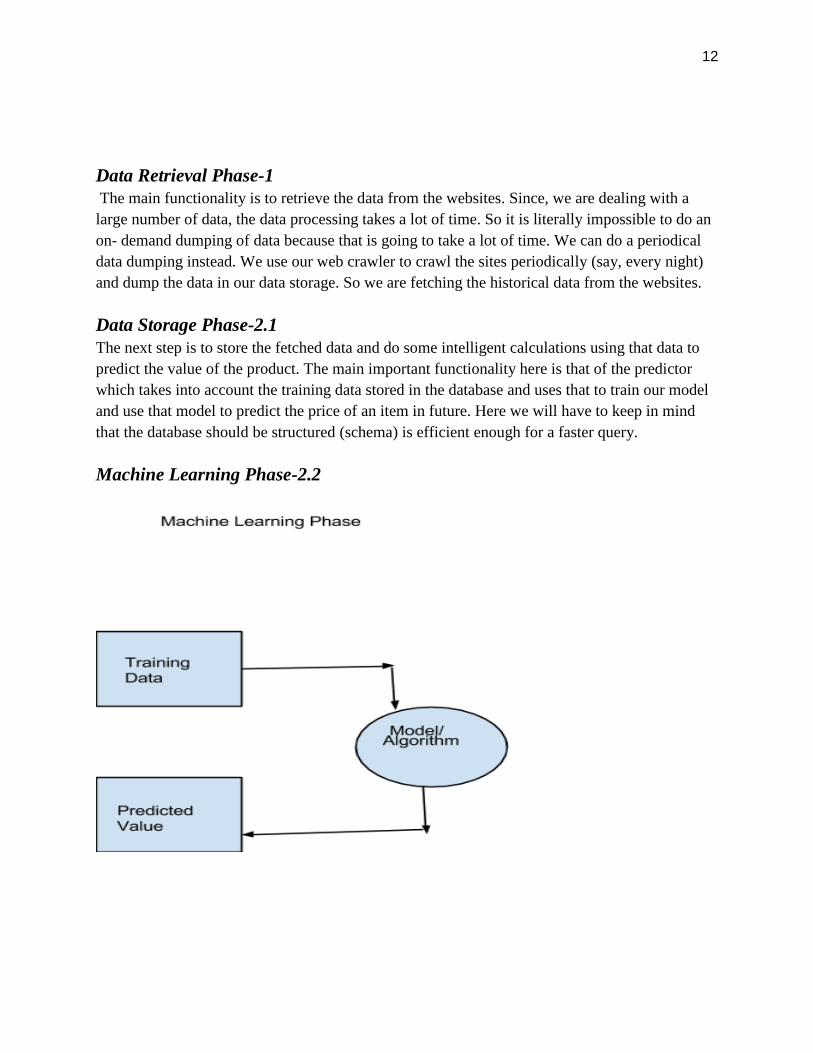
The next step is to store the fetched data and do some intelligent calculations using that data to
predict the value of the product. The main important functionality here is that of the predictor
which takes into account the training data stored in the database and uses that to train our model
and use that model to predict the price of an item in future. Here we will have to keep in mind
that the database should be structured (schema) is efficient enough for a faster query.
Machine Learning Phase-2.2
13
Calculation and Prediction Phase-2.3
User Request-
Release 1- The user puts a “link” of the product he likes as a query to the database. From the link
we get the product id and according to the product-id we search the product. Thus version 1 can
be just used as an plugin. Say the user goes to the Amazon site and searches a product. There can
be a product link beside the the product and when we click of the link the user gets the details
about the product as in the price and the historical prices.
Output-
There are two possible outputs that we need to provide to the user-the current price and the time-
series data of the price variance. Again from the user perspective there should be two
deliverables-
● Lowest price of the product and on which date it will go the lowest. Say the user wants to
buy a camera (Nikon DSLR) and the output will show that the camera price will be the
lowest on 23rd November. However there can be another situation when the user cannot
wait for so long to buy the camera. So the user here needs a time series data to analyze
when the price will go down or fluctuate
● The histogram or time series data that shows the fluctuations in the prices of the item
over the “year”. We are restricting the historical data to one year and not more.
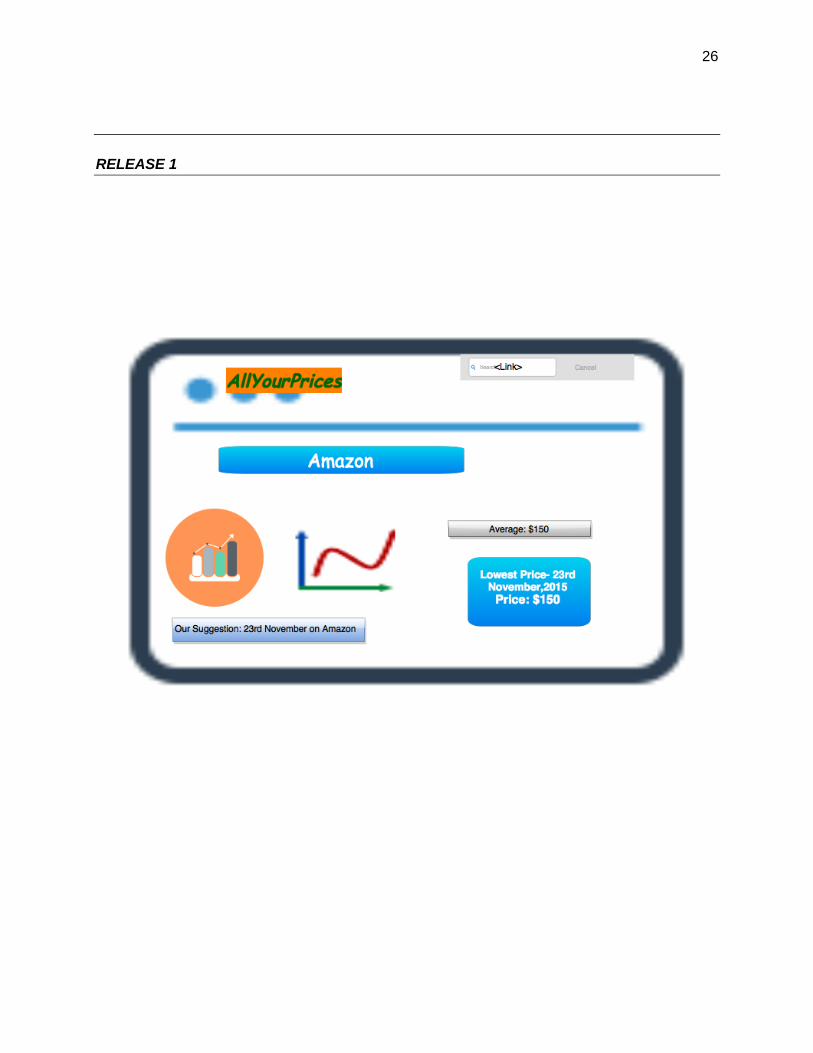
1) Release 1&2-
a. Time series Graph indicating the change in price over the period of time and clearly
indicating at what time of the year the price will go the lowest on Amazon.
b. The price of the product on the particular date.
2) Release 3-
a. Bar chart giving a clear comparison of the changes in prices of the product in different
time of the year and comparing the price among various websites and clearly indicating at
what time of the year the price will go the lowest and on which website.
b. The price of the product on the particular day and which website is giving the lowest
price on that date.
14
3) Release 4-
In the other releases we were focusing on web-app but for the 4th release we are focusing on
mobile app. Also here the modification is the user will be given a periodic prediction over time
i.e the lowest price of the item in the next week, the lowest price of the item in the next 30 days
or the all over lowest price in the next 6 months from the date of query. Since it is a mobile app
the predictor suggests the lowest price of the product and the date and on which website it will be
the lowest. It also allows the user to select different periods of time say “one week” from a drop
down list and once selected it shows the predicted lowest price and the corresponding website.
No graph is shown. Just the clear suggestion is given. But a link to the graph is given which
opens when clicked.
15
Appendix A
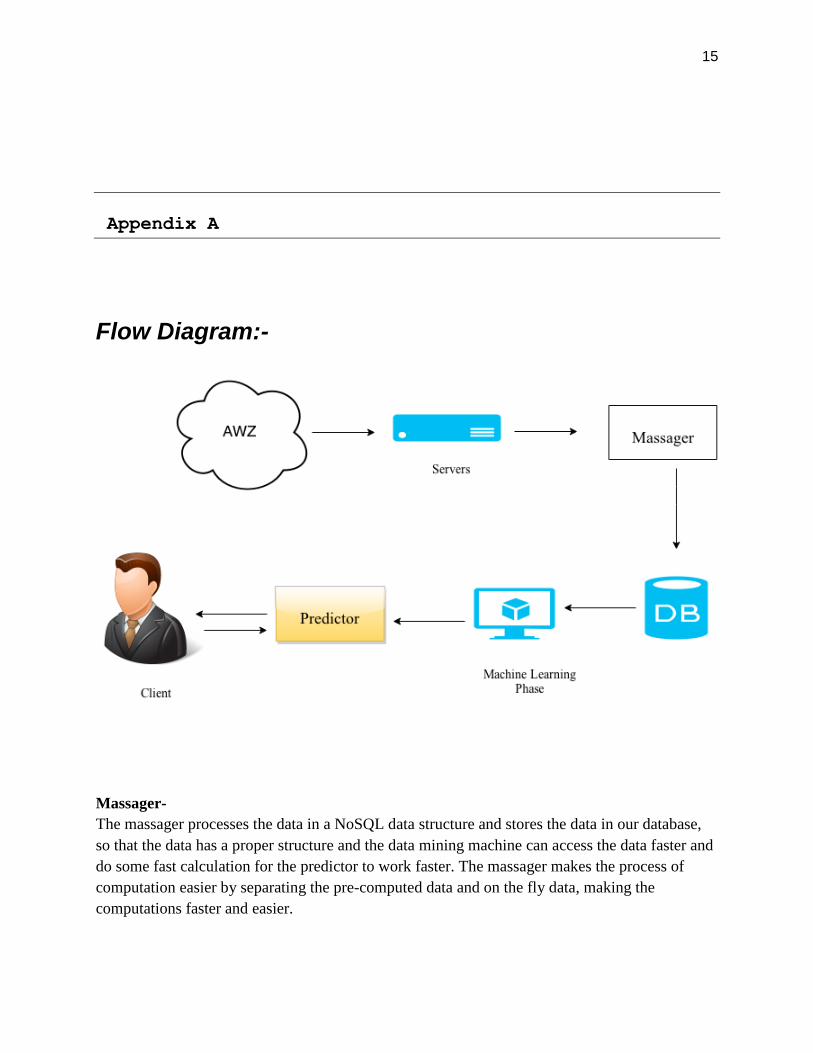
Flow Diagram:-
Massager-
The massager processes the data in a NoSQL data structure and stores the data in our database,
so that the data has a proper structure and the data mining machine can access the data faster and
do some fast calculation for the predictor to work faster. The massager makes the process of
computation easier by separating the pre-computed data and on the fly data, making the
computations faster and easier.
16
DB-
The database gets the data out of the massager which is the pre-computed data. The pre-
computed data is the important information about a product that we need ahead of time to make
prior calculations for the predictor. It acts as training dataset to learn the machine learning model
to get the predicted value. The important information that we need about a product are-
1. Price of the product
2. Timestamp
3. Product-id
4. Product-name
5. Vendor(Amazon/Ebay..)-This one is for future releases.
Machine-Learning Phase-
In this part we are using our training dataset from the DB to learn the model in which we are
going to fit the price. The algorithm is different for different products as the prices of a product
can vary linearly or exponentially and so we need different algorithms to fit it different products.
We do this ML pre-computation and store it to our database which is the Machine Learning
database. These pre-computations are done periodically for updates. The features are Product id,
product price and the timestamp-a three-dimensional dataset.
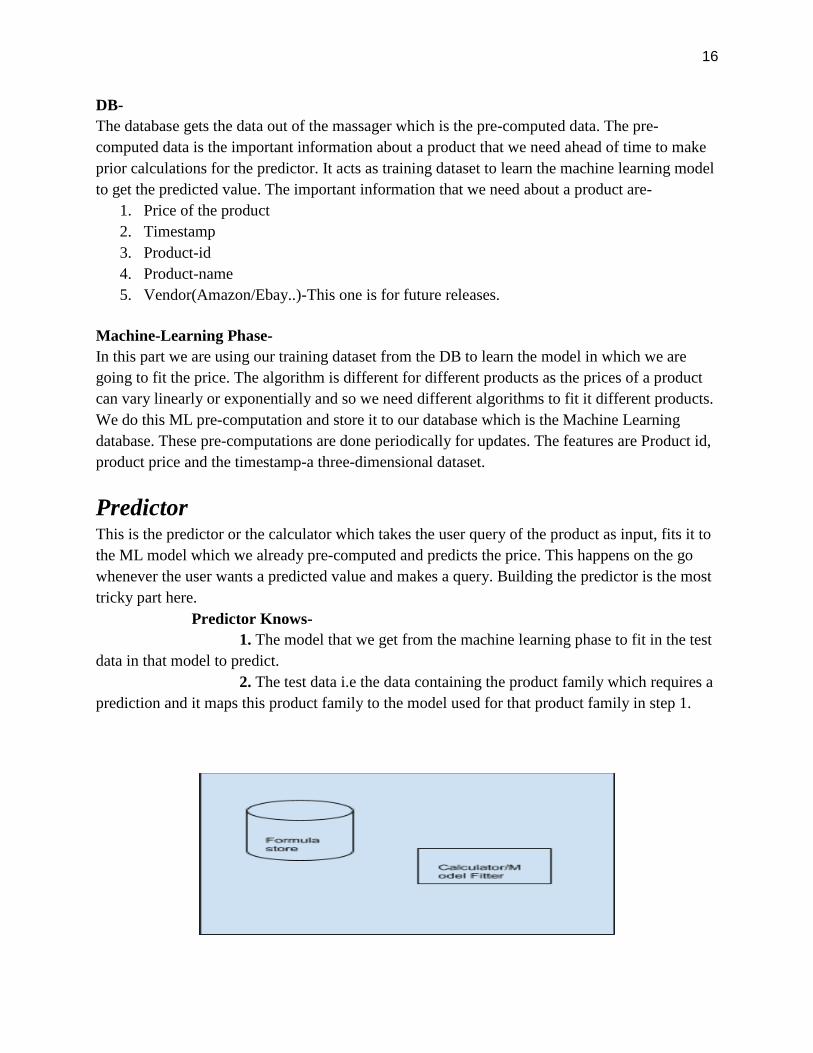
Predictor
This is the predictor or the calculator which takes the user query of the product as input, fits it to
the ML model which we already pre-computed and predicts the price. This happens on the go
whenever the user wants a predicted value and makes a query. Building the predictor is the most
tricky part here.
Predictor Knows-
1. The model that we get from the machine learning phase to fit in the test
data in that model to predict.
2. The test data i.e the data containing the product family which requires a
prediction and it maps this product family to the model used for that product family in step 1.

17
The controller gives the link (Release 1) to the database and retrieves the product family. It gives
the product family to the Predictor. The predictor has a formula store with the models that we get
by learning the training data and using Machine Learning (back end) and it maps the product-
family of the request and the product-family in the formula store and calculates, i.e fit in the test
data to the model and get the predicted price.
Product Model(ML)
Shoe y= x
Product Parameter
Shoe =
1. The controller or the parser takes the request from the user and uses that query to pull the
data in the database. Now we have the data as a <key,value> pair.
2. It gives the predictor a key value pair <product-family, model> where the key is the
product-family and the model used to train is the value, by mapping the product family of
the query from the database and the value from the predictor.
3. The predictor calculates and gives the predicted result. It is a single price indicating the
price of the product when it is the lowest or a stream of data i.e an array of prices
periodically as requested by the user.
18
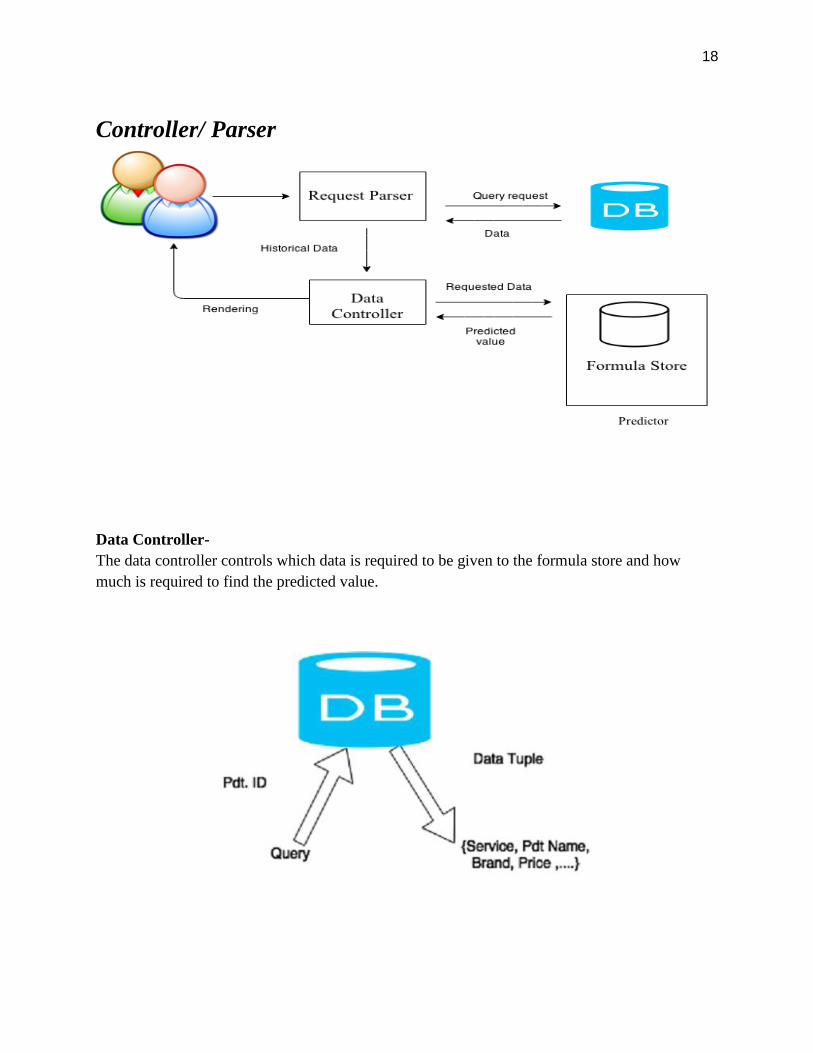
Controller/ Parser
Data Controller-
The data controller controls which data is required to be given to the formula store and how
much is required to find the predicted value.
19
Appendix B
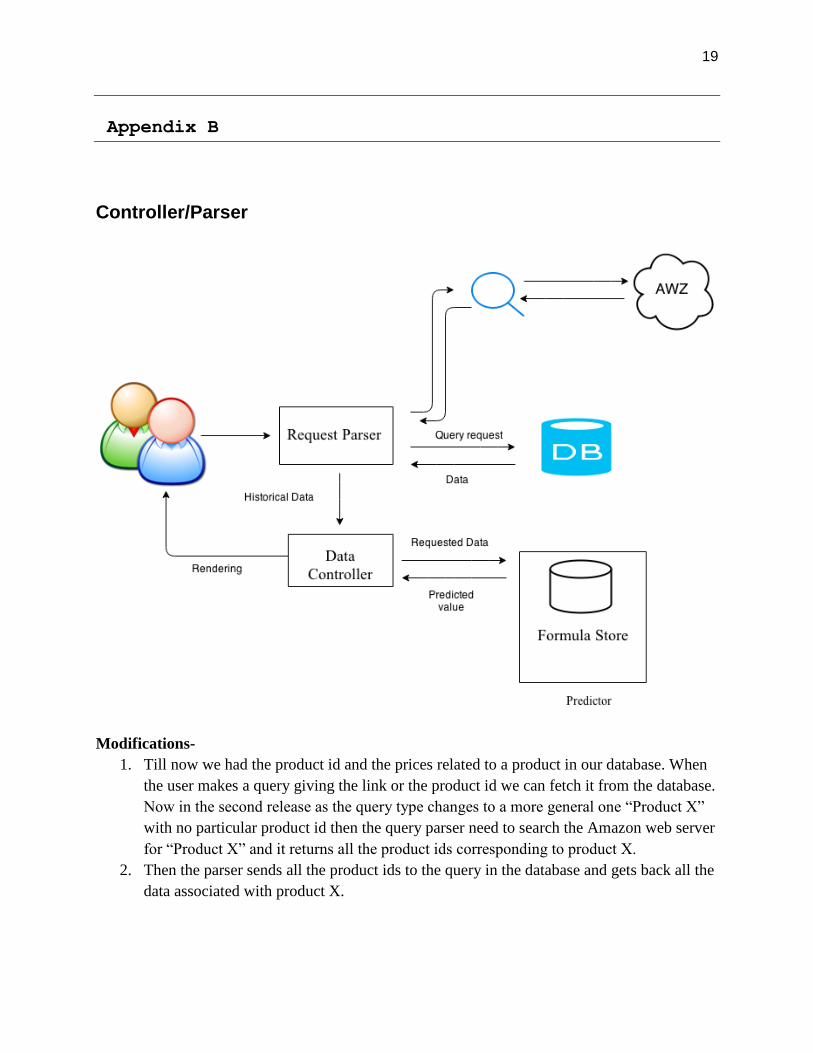
Controller/Parser
Modifications-
1. Till now we had the product id and the prices related to a product in our database. When
the user makes a query giving the link or the product id we can fetch it from the database.
Now in the second release as the query type changes to a more general one “Product X”
with no particular product id then the query parser need to search the Amazon web server
for “Product X” and it returns all the product ids corresponding to product X.
2. Then the parser sends all the product ids to the query in the database and gets back all the
data associated with product X.
20
Appendix C
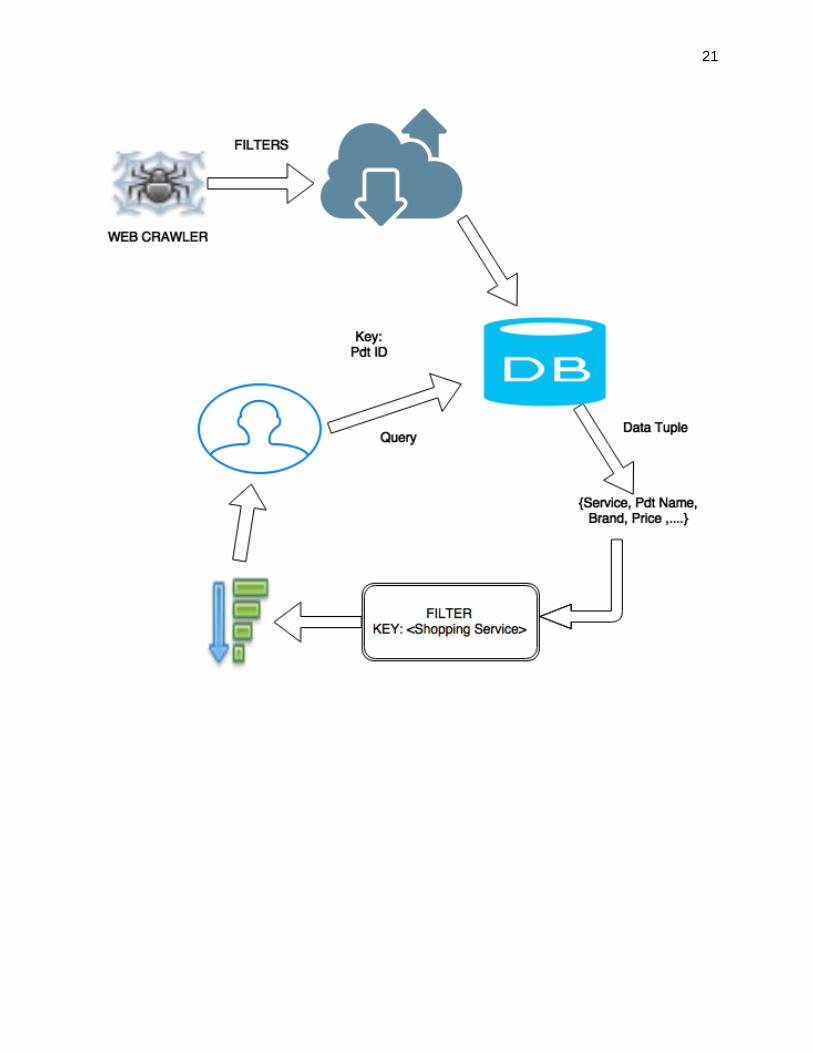
Improvements:
In this phase of the product we improve the service by incorporating support
for product ID based Query on all the shopping services i.e. the user does not
have to specify a particular Shopping service.
In order to deploy this we have to make the Data-Base capable of talking to
different services in parallel and also interpret and extract data from the web
resources.
In order to achieve this the Indexer has to be modified so that it is not
restricted to crawling a specific service.
The indexer will now have the product ID as primary key.
Next we have to maintain a filter that would cluster the search results based on
the online shopping service.
Thus this filter will have two phases – sorting and aggregating. The sorter will
sort the result based on the source as key and aggregator will combine all the
refined results into a group.
Also, in order to index the raw data into a database for fast retrieval it is
necessary to modify the Web Crawler such that it crawls the entire web.
Though in practical sense opening up the Web Crawler to the whole web is
not a good idea as it might get stuck in various loops – so we need to set the
filters of the crawler accordingly and filter junk.
The best approach for data extraction using the crawler is to go one dimension
at a time, so basically one service at a time – going forward making the search
space as exhaustive as possible.
21
22
23
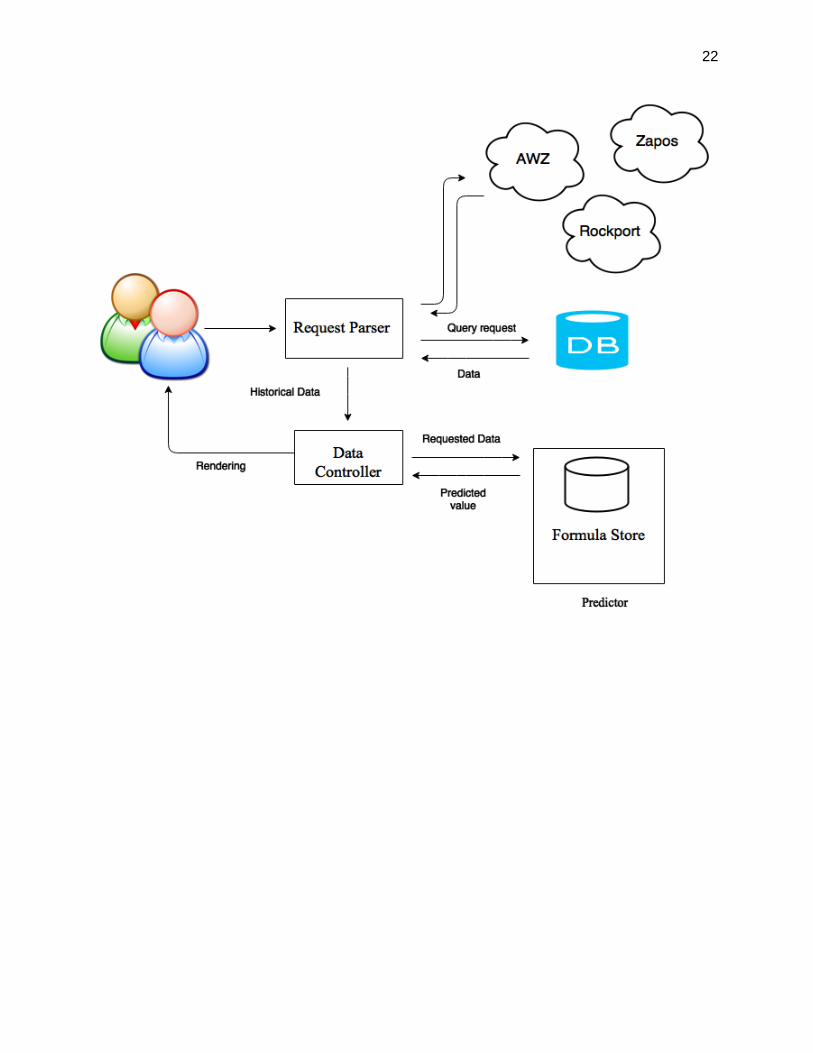
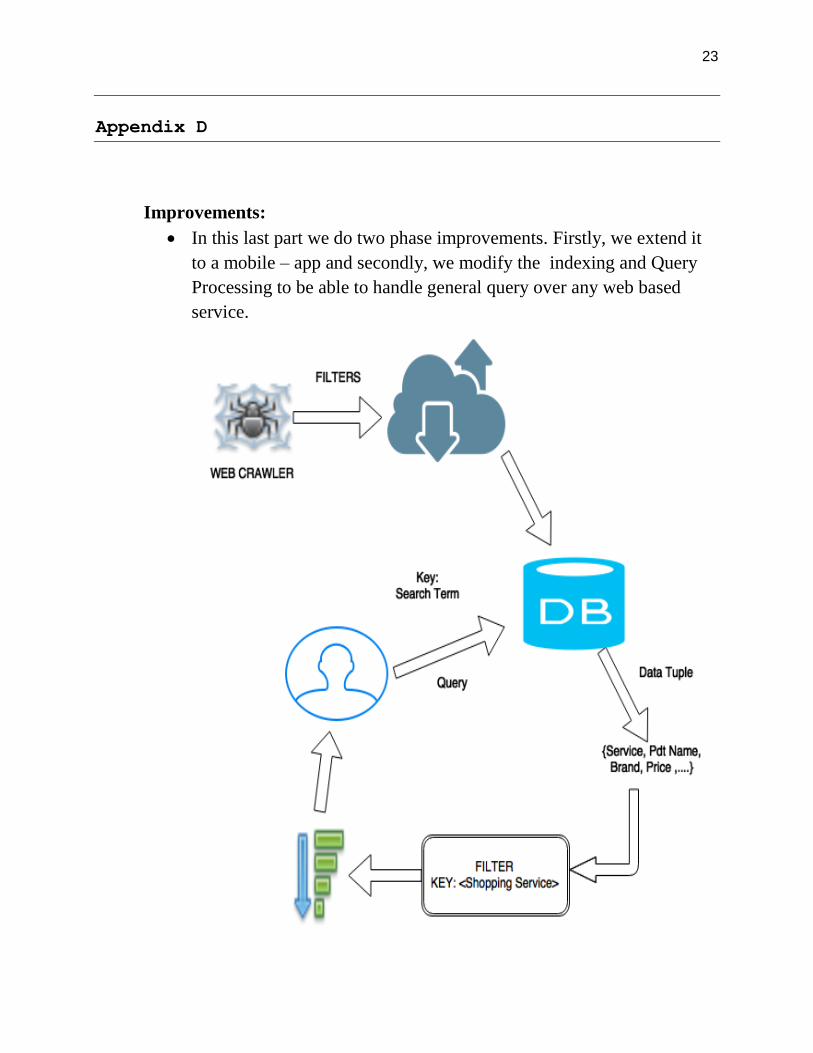
Appendix D
Improvements:
In this last part we do two phase improvements. Firstly, we extend it
to a mobile – app and secondly, we modify the indexing and Query
Processing to be able to handle general query over any web based
service.

24
In order to extend into the mobile app we just need to modify the Data ingestion
process in both direction

25
USER
INTERFACE
26
RELEASE 1
27
RELEASE 2
28
RELEASE 3
29
RELEASE 4

30
ARCHITECTURAL
DIAGRAM
31
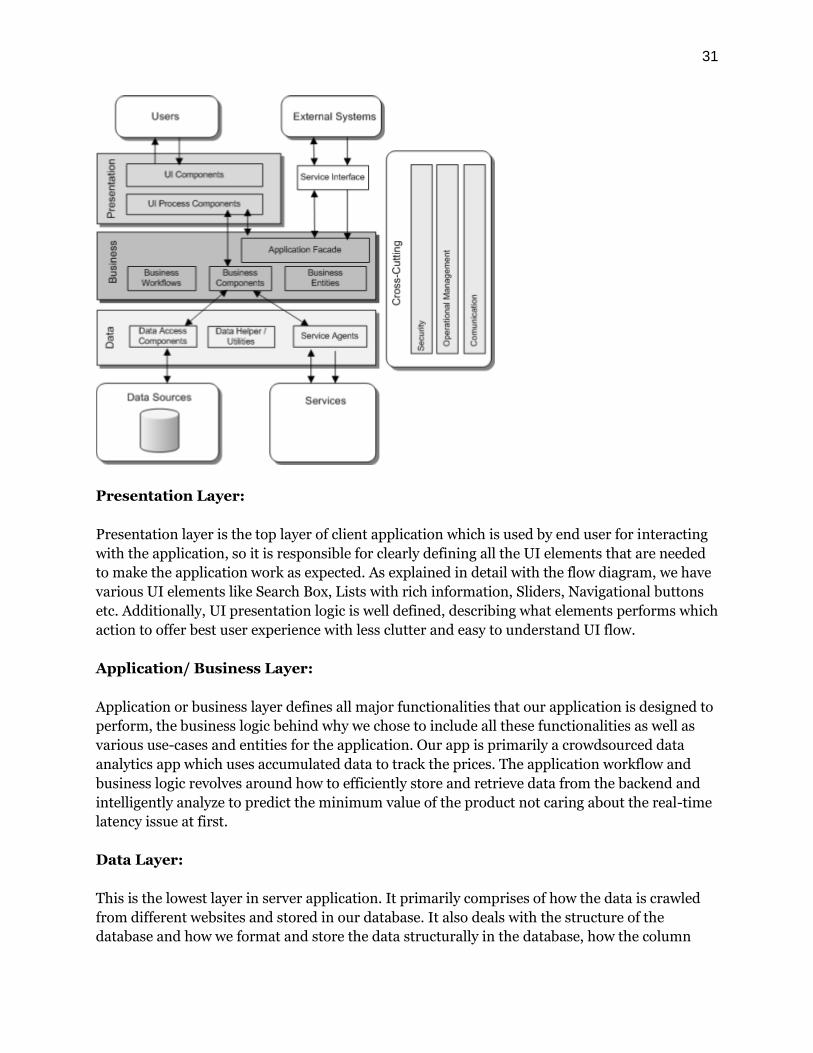
Presentation Layer:
Presentation layer is the top layer of client application which is used by end user for interacting
with the application, so it is responsible for clearly defining all the UI elements that are needed
to make the application work as expected. As explained in detail with the flow diagram, we have
various UI elements like Search Box, Lists with rich information, Sliders, Navigational buttons
etc. Additionally, UI presentation logic is well defined, describing what elements performs which
action to offer best user experience with less clutter and easy to understand UI flow.
Application/ Business Layer:
Application or business layer defines all major functionalities that our application is designed to
perform, the business logic behind why we chose to include all these functionalities as well as
various use-cases and entities for the application. Our app is primarily a crowdsourced data
analytics app which uses accumulated data to track the prices. The application workflow and
business logic revolves around how to efficiently store and retrieve data from the backend and
intelligently analyze to predict the minimum value of the product not caring about the real-time
latency issue at first.
Data Layer:
This is the lowest layer in server application. It primarily comprises of how the data is crawled
from different websites and stored in our database. It also deals with the structure of the
database and how we format and store the data structurally in the database, how the column
32
families are handled for an efficient and fast retrieval. It basically arranges the crowdsource data
in a database. There can be external APIs to get the crowdsource data from the third party like
Amazon or Ebay.
Support Infrastructure/ Services (BackEnd) :
All the crowdsourced data is uploaded to an external high-capacity and highly available
proprietary database, where all data is collected , organized , analyzed and processed for quick
access and ensures that user always gets the accurate information. Various complex access and
data analytics techniques are needed to be used for this purpose. Additional third party
application and services are connected with our application using well defined APIs to get
various supplementary information.
Related Documents
![1 1 1 1 1 1 1 ¢ 1 1 1 - pdfs.semanticscholar.org€¦ · 1 1 1 [ v . ] v 1 1 ¢ 1 1 1 1 ý y þ ï 1 1 1 ð 1 1 1 1 1 x ...](https://static.cupdf.com/doc/110x72/5f7bc722cb31ab243d422a20/1-1-1-1-1-1-1-1-1-1-pdfs-1-1-1-v-v-1-1-1-1-1-1-y-1-1-1-.jpg)