Designing the 2007 Commodity Flow Survey Authors: Scot Dahl, William C. Davie, Jr US Census Bureau Presented by: Ruth Detlefsen US Census Bureau June 19, 2007

Designing the 2007 Commodity Flow Survey Authors: Scot Dahl, William C. Davie, Jr US Census Bureau Presented by: Ruth Detlefsen US Census Bureau June 19,
Dec 28, 2015
Welcome message from author
This document is posted to help you gain knowledge. Please leave a comment to let me know what you think about it! Share it to your friends and learn new things together.
Transcript
Designing the 2007 Commodity Flow Survey
Authors: Scot Dahl, William C. Davie, Jr US Census Bureau
Presented by: Ruth Detlefsen
US Census Bureau
June 19, 2007
2
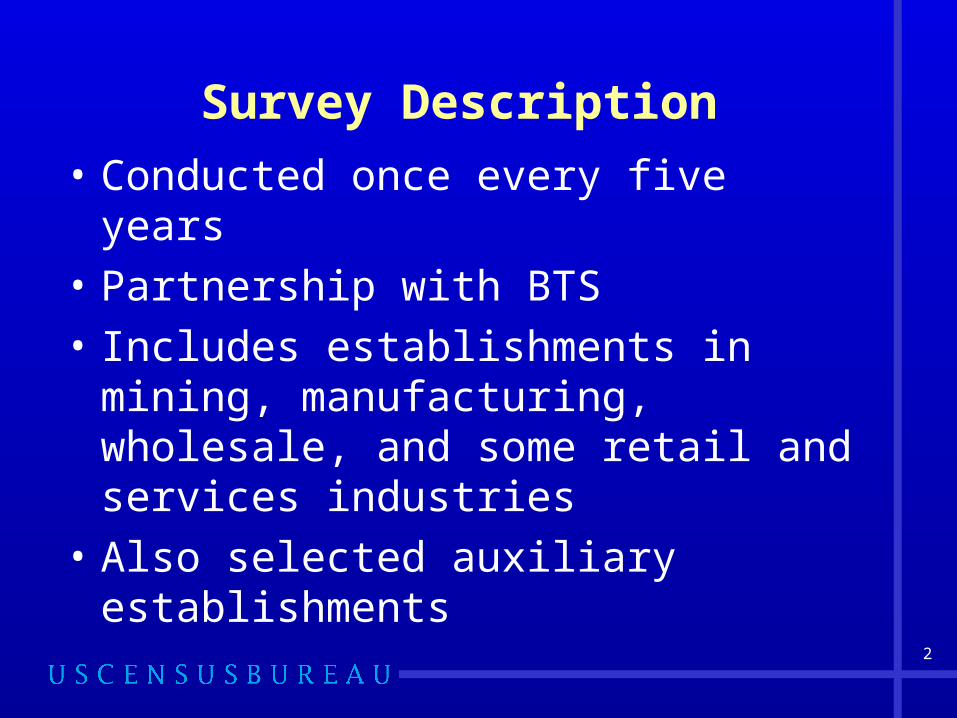
Survey Description
• Conducted once every five years
• Partnership with BTS
• Includes establishments in mining, manufacturing, wholesale, and some retail and services industries
• Also selected auxiliary establishments
3
Summary of Changes for 2007
• Scope & Coverage
• Frame Data
• Questionnaire design
• Sample design
4
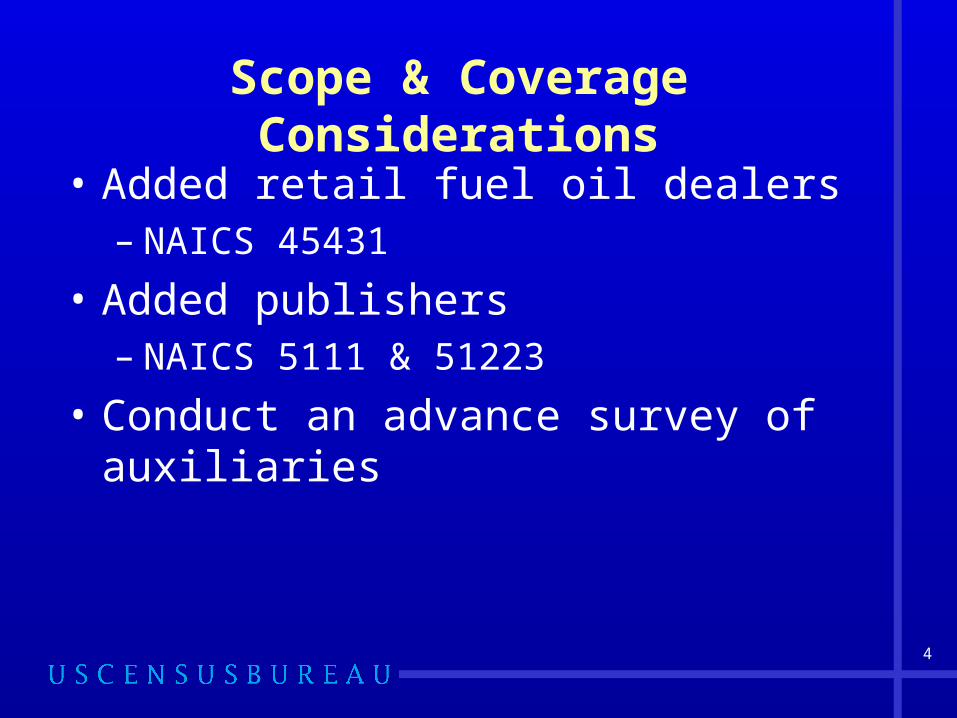
Scope & Coverage Considerations
• Added retail fuel oil dealers – NAICS 45431
• Added publishers – NAICS 5111 & 51223
• Conduct an advance survey of auxiliaries
5
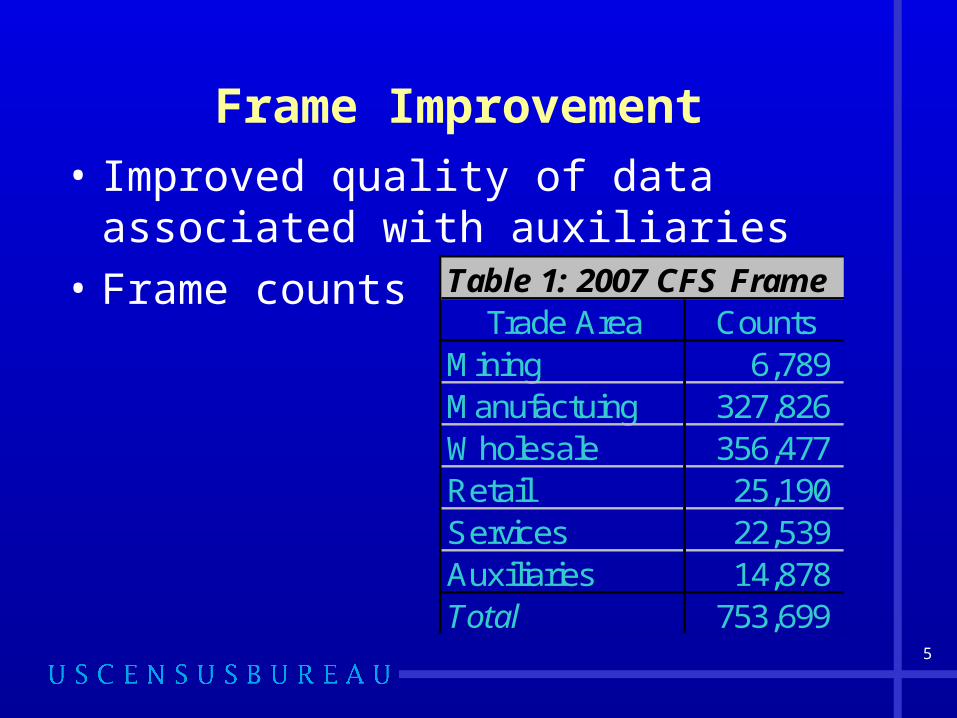
Frame Improvement• Improved quality of data associated
with auxiliaries
• Frame counts Table 1: 2007 CFS FrameTrade Area Counts
Mining 6,789 Manufactuing 327,826 Wholesale 356,477 Retail 25,190 Services 22,539 Auxiliaries 14,878 Total 753,699
6
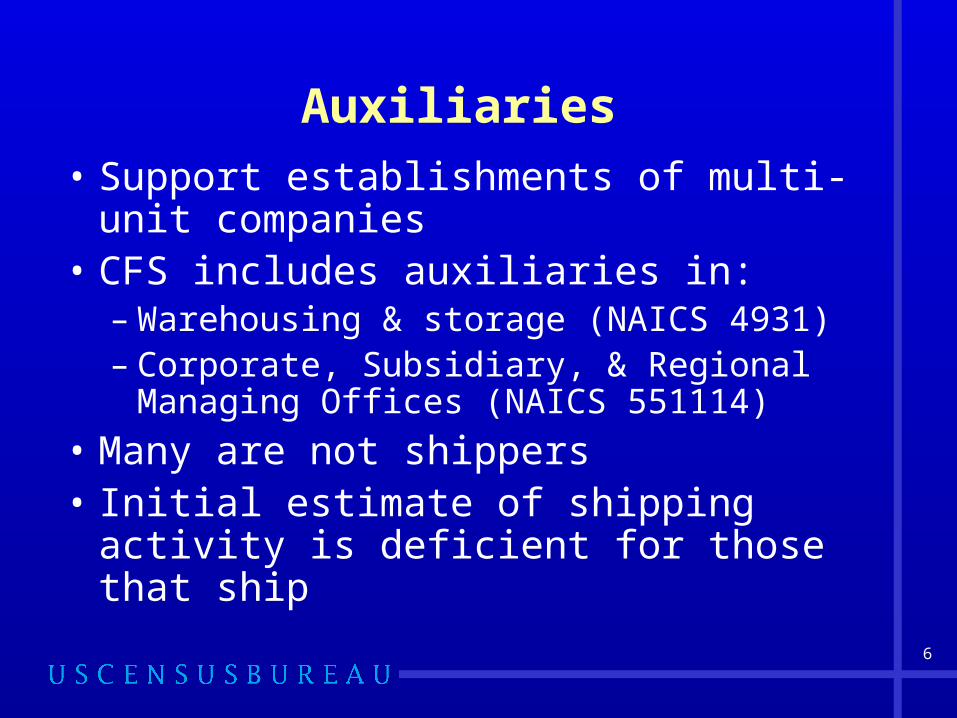
Auxiliaries
• Support establishments of multi-unit companies
• CFS includes auxiliaries in:– Warehousing & storage (NAICS 4931)– Corporate, Subsidiary, & Regional
Managing Offices (NAICS 551114)
• Many are not shippers• Initial estimate of shipping activity is
deficient for those that ship
7
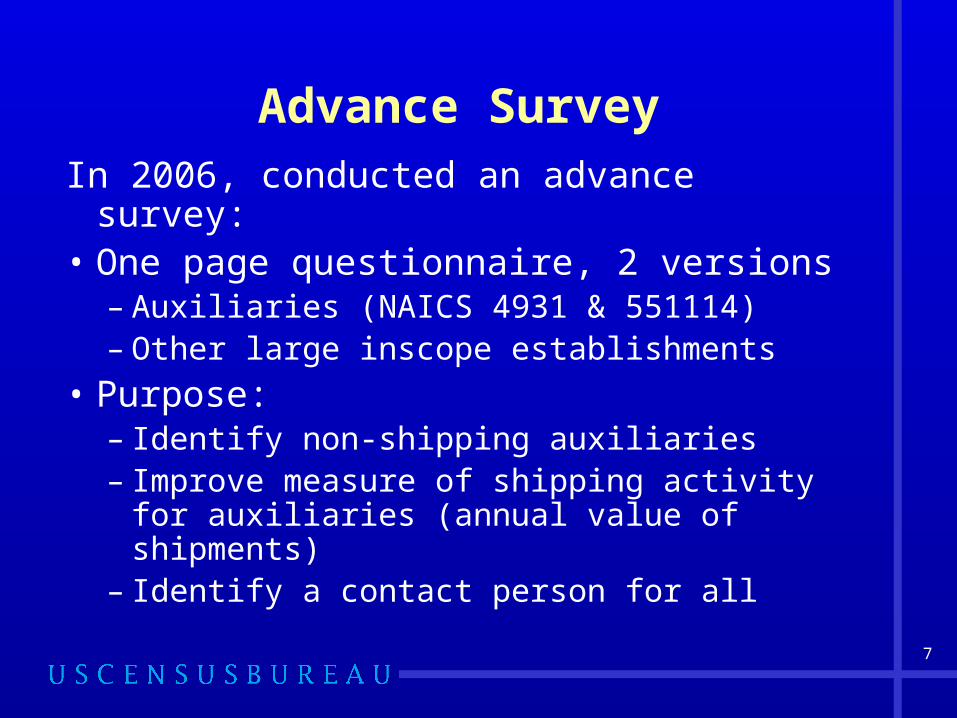
Advance Survey
In 2006, conducted an advance survey:• One page questionnaire, 2 versions
– Auxiliaries (NAICS 4931 & 551114)– Other large inscope establishments
• Purpose:– Identify non-shipping auxiliaries– Improve measure of shipping activity for
auxiliaries (annual value of shipments)– Identify a contact person for all

8
Advance Survey
Response rates:
• Auxiliaries: 87%
• Large establishments: 75%
Table 2: Shipper Status of Advance Survey ResponsesShipper Status Aux Large Total
Shipper 10,716 32,275 42,991Non-Shipper 24,220 1,561 25,781Non-respondents 5,061 11,139 16,200
Total 39,997 44,975 84,972

9
Advance Survey
Measures of shipment activity
Not reported 1,130 Less than 5 4,451 5 - 20 1,652 20 - 50 1,020 50 - 200 1,225 200 - 500 566 500 - 1,000 322 1,000 - 5,000 304 5,000 or more 46
Total 10,716
Table 3: Shipping AuxiliariesNumber of auxiliaries
Annual value of Shipments ($mil)

10
Questionnaire Development
• Three rounds of cognitive visits• Questionnaire changes
– Improved layout and question flow– Greater standardization throughout form – Improved sampling instructions– More consistency between form, instructions, and
the commodity manual– “Intermodal” checkbox– 3PL questions on 4th quarter form
• Electronic spreadsheet response option
11
Issues - 3PLs
• Many companies outsource part or all of their logistics operations
• These Third Party Logistics (3PL) providers are not in-scope to the CFS

12
3PLs - Example
From an SEC filing:
• Company A sells its warehouse to Company B, a real estate investment company
• Company B in turn leases the warehouse to Company C
• Company C will provide warehousing and distribution services for Company A

13
Sample Design
Features:
• Three stages of sampling
• Sample size of ~100,000 establishments
• Primary strata based on geography and industry
• Additional stratification based on size
• Special HAZMAT strata
• Special auxiliary strata

14
Geographic Strata
• 123 primary geographic strata– 73 metropolitan area strata– 50 balance of state strata
• Some metropolitan areas are split by state boundaries
• For 2007, ten metropolitan areas were added.
15
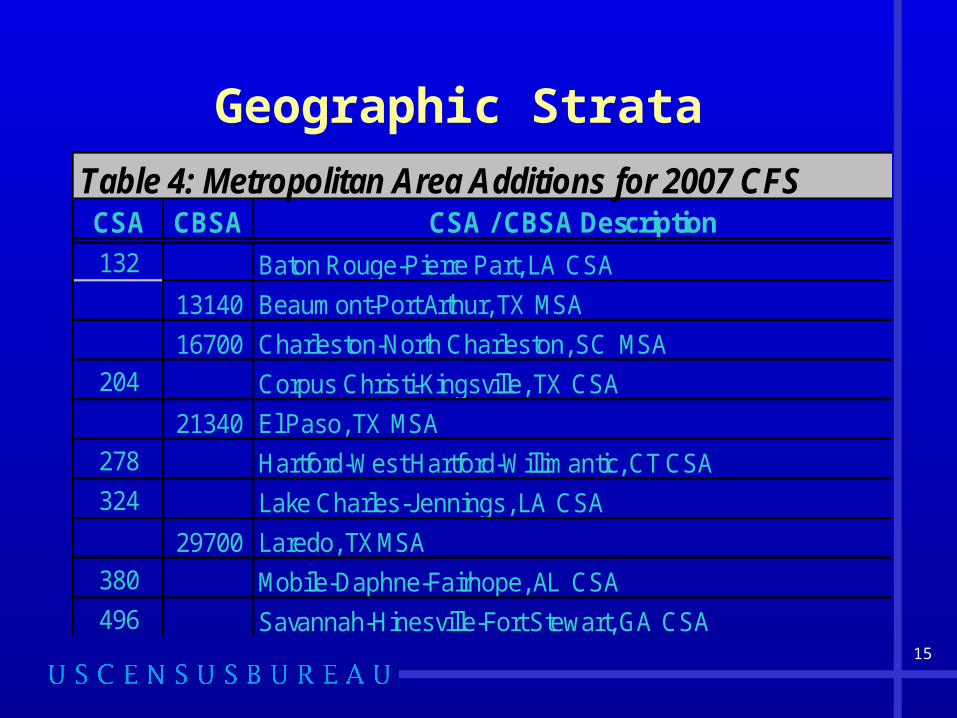
Geographic StrataTable 4: Metropolitan Area Additions for 2007 CFSCSA CBSA CSA / CBSA Description132 Baton Rouge-Pierre Part, LA CSA
13140 Beaumont-Port Arthur, TX MSA
16700 Charleston-North Charleston, SC MSA
204 Corpus Christi-Kingsville, TX CSA
21340 El Paso, TX MSA
278 Hartford-West Hartford-Willimantic, CT CSA
324 Lake Charles-Jennings, LA CSA
29700 Laredo, TX MSA
380 Mobile-Daphne-Fairhope, AL CSA
496 Savannah-Hinesville-Fort Stewart, GA CSA

16
Industry Strata
• Up to 45 industry strata within each geographic area
– Mining (3 industries)– Manufacturing (21 industries)– Wholesale (18 industries)– Non-store Retail (1 industry)– Retail fuel oil dealers (1 industry)– Publishers (1 industry)
17
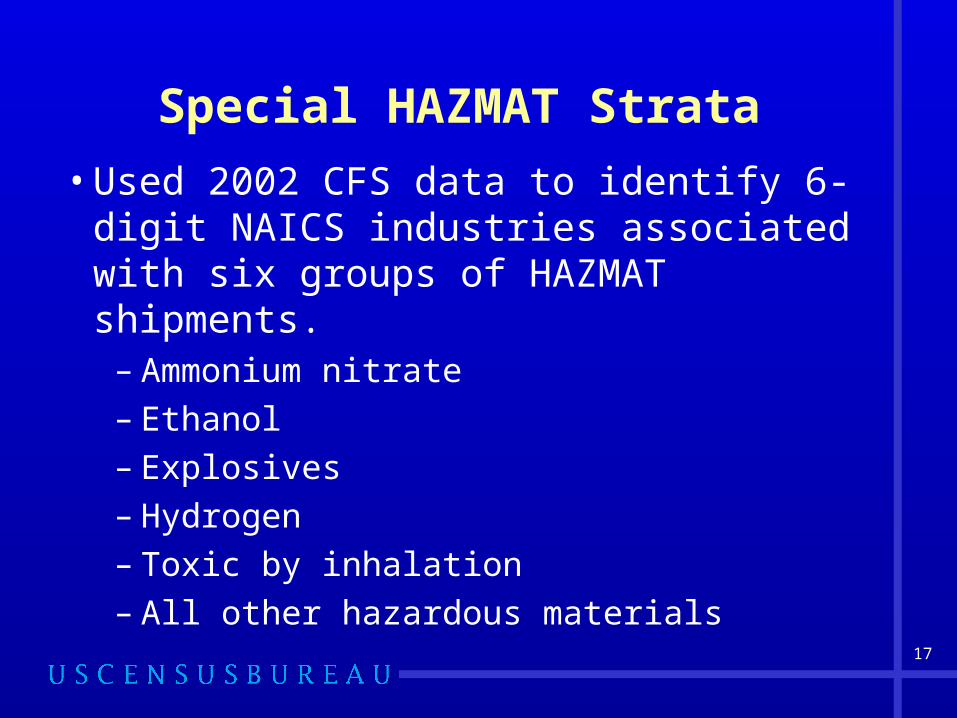
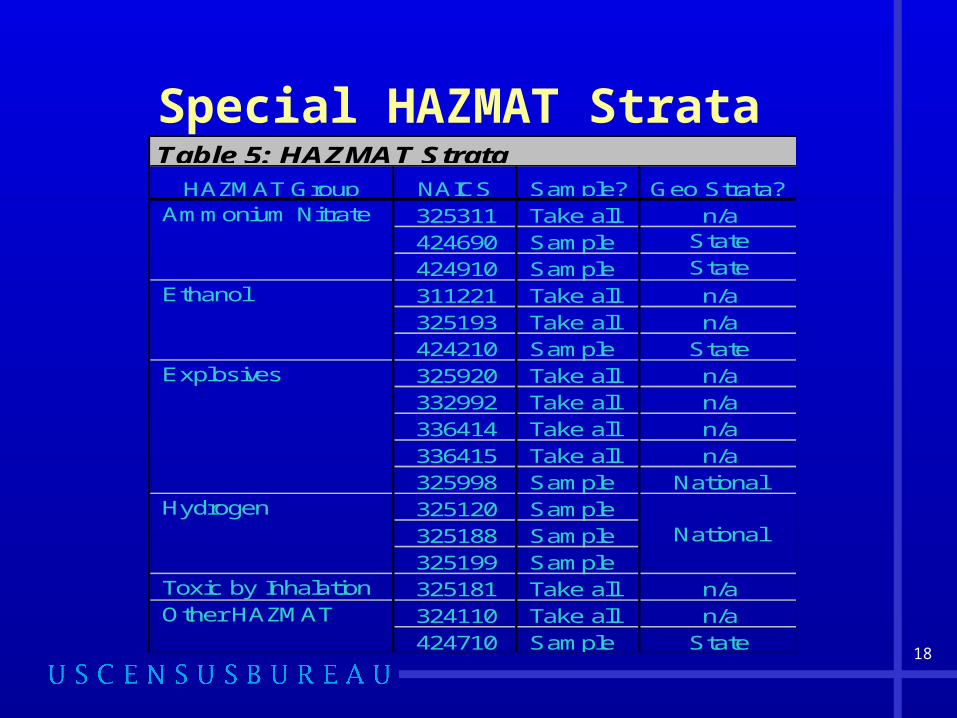
Special HAZMAT Strata
• Used 2002 CFS data to identify 6-digit NAICS industries associated with six groups of HAZMAT shipments.
– Ammonium nitrate– Ethanol– Explosives– Hydrogen– Toxic by inhalation– All other hazardous materials
18
Special HAZMAT Strata
325311 Take all n/a424690 Sample State
424910 Sample State
311221 Take all n/a325193 Take all n/a424210 Sample State325920 Take all n/a332992 Take all n/a336414 Take all n/a336415 Take all n/a325998 Sample National325120 Sample325188 Sample325199 Sample
Toxic by Inhalation 325181 Take all n/a324110 Take all n/a424710 Sample State
HAZMAT Group Sample?
Table 5: HAZMAT Strata
Other HAZMAT
NAICS
National
Ammonium Nitrate
Ethanol
Explosives
Hydrogen
Geo Strata?
19
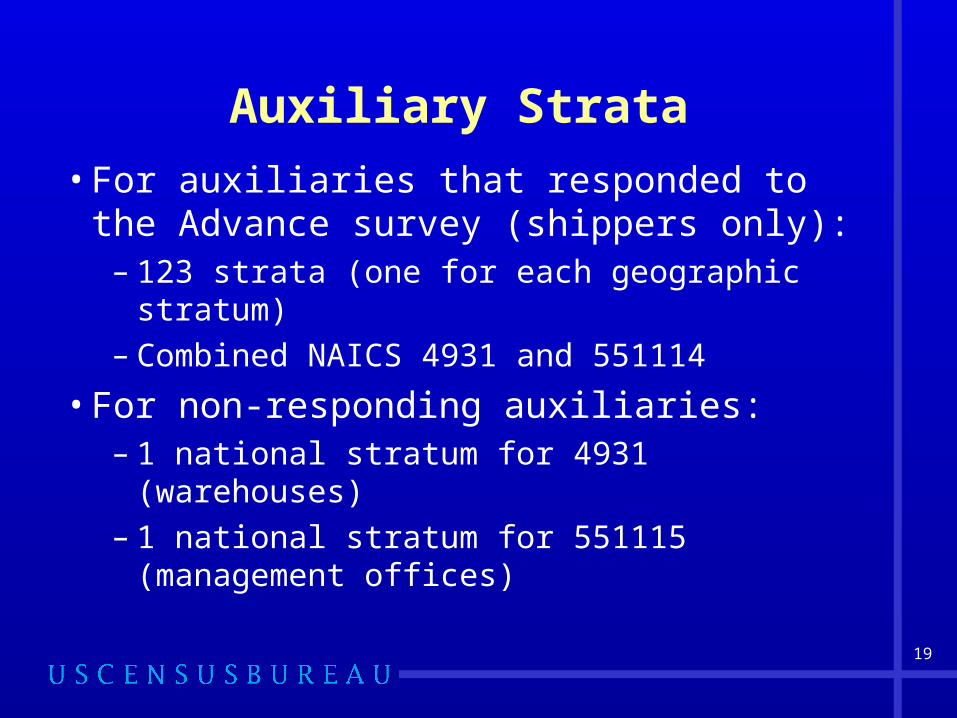
Auxiliary Strata
• For auxiliaries that responded to the Advance survey (shippers only):
– 123 strata (one for each geographic stratum)
– Combined NAICS 4931 and 551114
• For non-responding auxiliaries:– 1 national stratum for 4931 (warehouses)– 1 national stratum for 551115
(management offices)
20
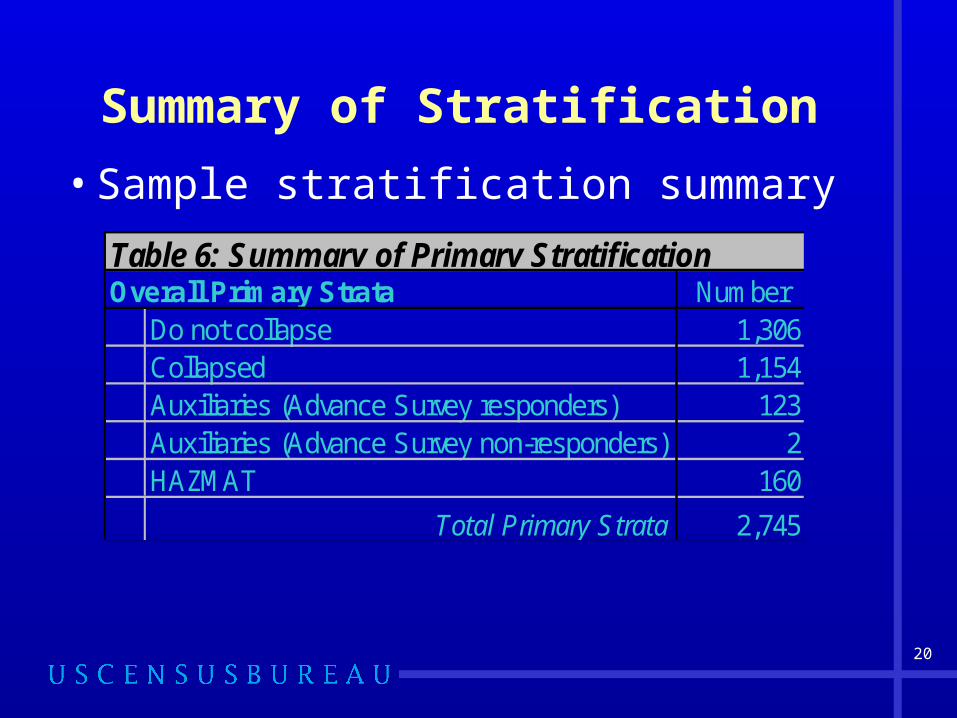
Summary of Stratification
• Sample stratification summary
Overall Primary Strata NumberDo not collapse 1,306Collapsed 1,154Auxiliaries (Advance Survey responders) 123Auxiliaries (Advance Survey non-responders) 2HAZMAT 160
Total Primary Strata 2,745
Table 6: Summary of Primary Stratification
21
Design Constraints
• Sample size of about 100,000 establishments
• CV of about 1.5% for each primary stratum
• Maximum first-stage (establishment) weight of 100
22
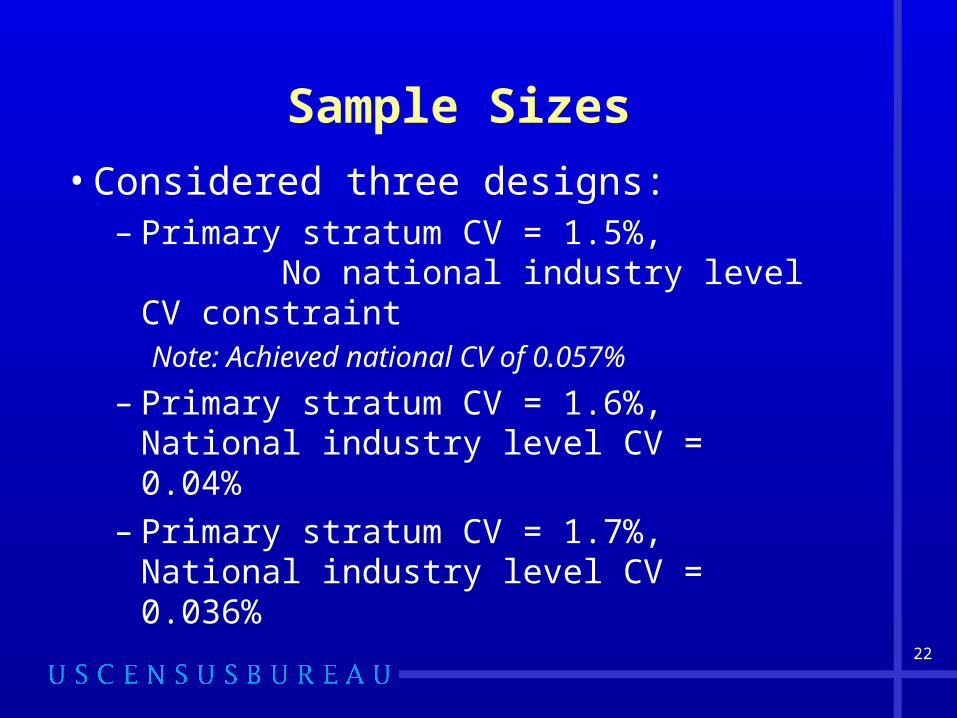
Sample Sizes
• Considered three designs:– Primary stratum CV = 1.5%,
No national industry level CV constraintNote: Achieved national CV of 0.057%
– Primary stratum CV = 1.6%, National industry level CV = 0.04%
– Primary stratum CV = 1.7%, National industry level CV = 0.036%
23
Sample Sizes
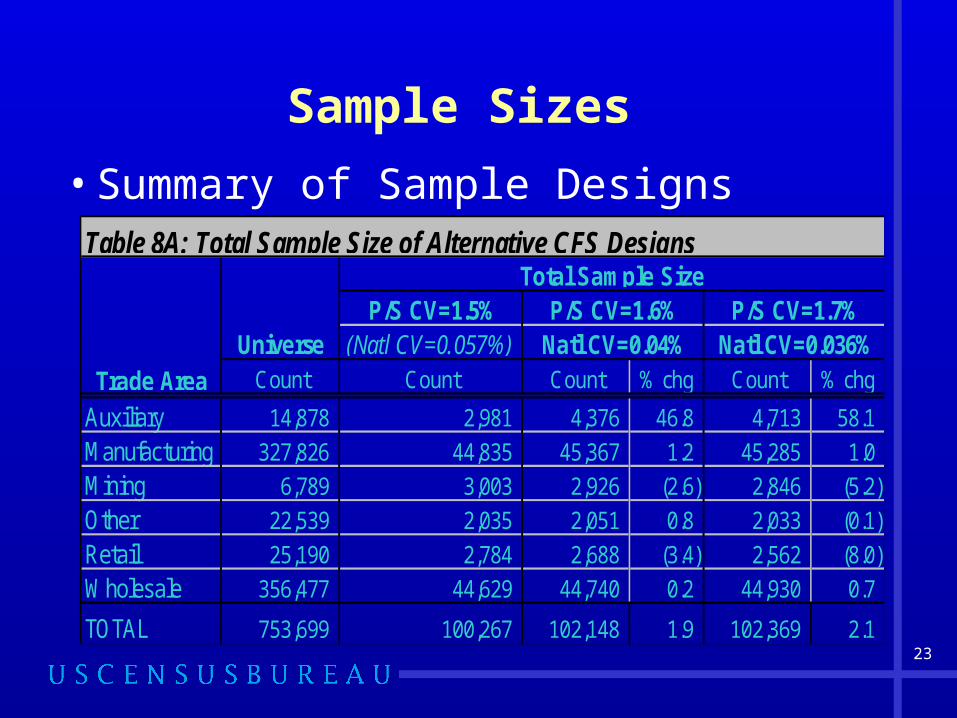
• Summary of Sample Designs
P/S CV=1.5%(Natl CV=0.057%)
Count Count Count % chg Count % chg
Auxiliary 14,878 2,981 4,376 46.8 4,713 58.1
Manufacturing 327,826 44,835 45,367 1.2 45,285 1.0
Mining 6,789 3,003 2,926 (2.6) 2,846 (5.2)
Other 22,539 2,035 2,051 0.8 2,033 (0.1)
Retail 25,190 2,784 2,688 (3.4) 2,562 (8.0)
Wholesale 356,477 44,629 44,740 0.2 44,930 0.7
TOTAL 753,699 100,267 102,148 1.9 102,369 2.1
Total Sample SizeP/S CV=1.6%
Natl CV=0.04%Trade Area
UniverseP/S CV=1.7%
Natl CV=0.036%
Table 8A: Total Sample Size of Alternative CFS Designs

24
Summary
• Recap of 2007 CFS changes:– Expanded industry coverage– Use of Advance survey to improve quality
of frame data for auxiliaries– A redesigned questionnaire– Larger sample size– More detailed geography and industry
stratification– National CV constraint on sample design

Related Documents