Designing Practice Based Approaches for Managing Agricultural Nonpoint- Source Water Pollution Catherine Kling Center for Agricultural and Rural Development, Dept. of Economics, Iowa State University Upper Midwest Stream Restoration Symposium February 24-27, 2013 La Crosse, Wisconsin This research was supported by the National Science Foundation, Dynamics of Coupled Natural and Human Systems Program, award number DEB-1010258, as well as two regional collaborative projects supported by the USDA-NIFA, award numbers 2011-68002-30190 and 2011- 68005-30411.

Welcome message from author
This document is posted to help you gain knowledge. Please leave a comment to let me know what you think about it! Share it to your friends and learn new things together.
Transcript

Designing Practice Based Approaches for Managing Agricultural Nonpoint-Source Water Pollution
Catherine Kling
Center for Agricultural and Rural Development, Dept. of Economics, Iowa State University
Upper Midwest Stream Restoration SymposiumFebruary 24-27, 2013La Crosse, Wisconsin
This research was supported by the National Science Foundation, Dynamics of Coupled Natural and Human Systems Program, award number DEB-1010258, as well as two regional collaborative projects supported by the USDA-NIFA, award numbers 2011-68002-30190 and 2011-68005-30411.

U.S. Water Quality: Lakes
The diverse aquatic vegetation found in the Littoral Zone of freshwater lakes and ponds.
A cyanobacteria bloom in a Midwestern lake.
• Lakes, Reservoirs, Ponds:
– 42% assessed, 65% inadequate water quality to support uses
– Over 11 million acres are “impaired”
– Agriculture third highest source of impairment

Water Quality: Rivers & Streams
Photos courtesy Iowa DNR
• Rivers and Streams:
– 26% assessed, 50% inadequate water quality to support designated uses
– Nearly ½ million stream miles are “impaired”
– Agriculture leading source of impairment (identified as cause of 22% unknown second highest)

Time trend
2002 2004 2006 2008 20100
10
20
30
40
50
60
70
44.5 43.6 44.1
49.752.9
46.8
64.4
57.7
64.666.5
Assessed Waters of United States
Rivers Lakes
Figure 1. US waters assessed as impairedSource: EPA National Summary of Assessed Waters Report

What abatement options exist? Examples from U.S. Agriculture• In field Management Practices
– Reduced (no) tillage– Manure, fertilizer management/reduction– Cover crops, rotation changes– Land retirement
• Structural Practices– Buffers– Grassed Waterways– Denitrification, controlled drainage– Wetland restoration

6
Conservation practices
• Photos courtesy of USDA NRCS
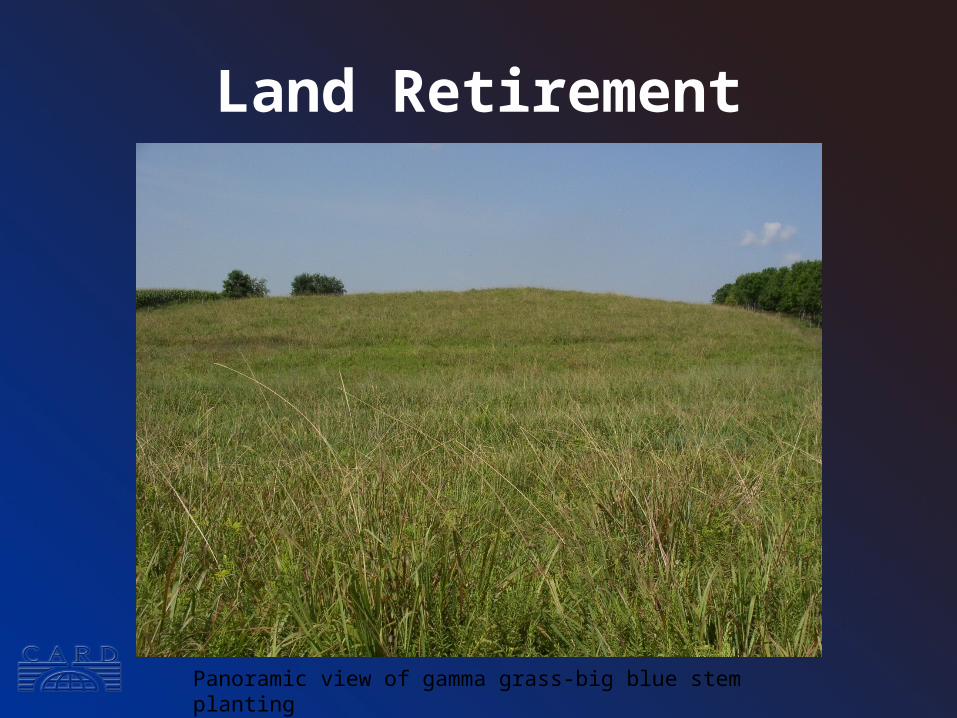
Land Retirement
Panoramic view of gamma grass-big blue stem plantinghttp://www.fsa.usda.gov/Internet/FSA_Image/ia_767_15.jpg
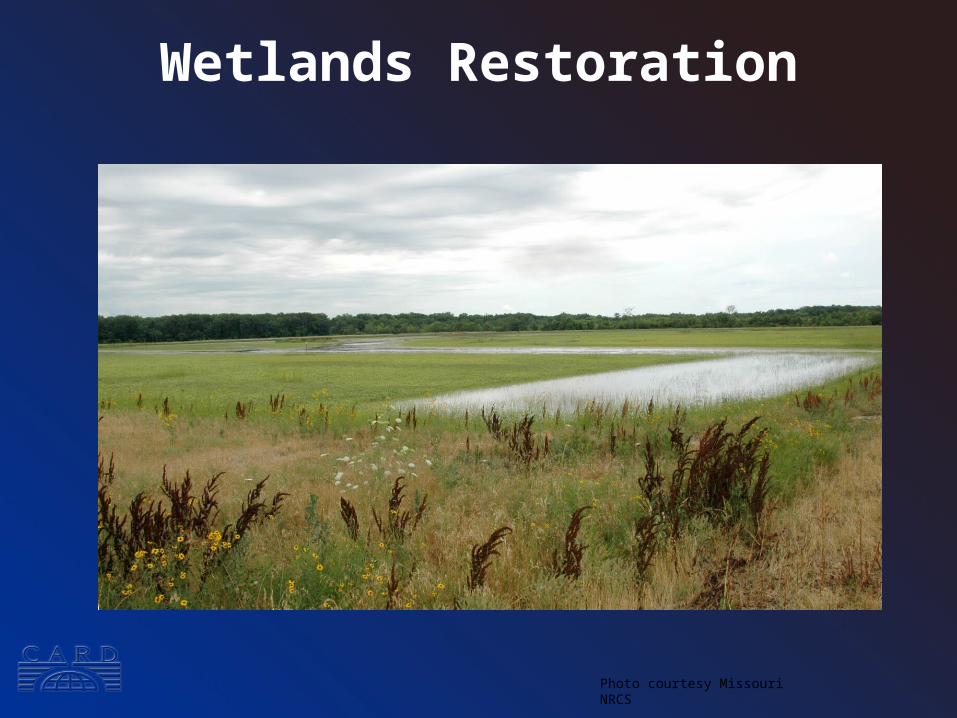
Wetlands Restoration
Photo courtesy Missouri NRCS
Efficacy and Cost of Practices
• Vary by– Pollutant – Field characteristics – Land use in watershed– Provision of other ecosystem services
• Ideally, all of these factors considered in efficient policy design

10
In sum, have to deal with all of these aspects
• Enormous number of farm fields/decision makers
• Each : one or more land use/conservation practices Retire land (e.g., CRP), Reduce tillage, Terraces, Contouring,
Grassed Waterways, Reduce fertilizer, better timing, etc.
• Costs and effectiveness vary across locations
• HOW? Use models to guide policy

Soil and Water Assessment Tool
• Watershed-scale simulation model developed by USDA - Agricultural Research Service
• Predicts ambient (instream) water quality associated with a spatially explicit set of land use/conservation practices
• Gassman et al. (2007) identify over 250 publications using SWAT

Watershed
a
d b
a b
c
a
d
a
b
aa
a
• 13 Fields, 4 land use/abatement options: a, b, c, d
• SWAT simulates water quality under alternative land use, abatement activities
SWAT:N, P, and Sedimen
t

Least Cost Problem• What is the optimal placement of conservation
practices?
• Brute force strategy:
– Using water quality/hydrology model, analyze all the feasible scenarios, picking cost-efficient solutions
– But, if there are N abatement possibilities for each field and there are F fields, this implies a total of possible NF configurations to compare
– 30 fields, 2 options over 1 billion possible scenarios!

Strength Pareto Evolutionary Algorithm
Search technique to approximate pareto optimal frontier
– Integrate Evolutionary Algorithm with water quality model
– Search for a frontier of cost-efficient nutrient pollution reductions
– Zitzler, Laumanns, and Thiele. “SPEA2: Improving the Strength Pareto Evolutionary Algorithm,” TIK-Report 103, May 2001, Errata added September, 2001

Terminology
“Individual” = specific assignment of practices to fields
“Population” = set of individual watershed configurations
b ca a
db
ad
dc
a a

SPEA2 Applied to Optimal Watershed Design
Step II: Run Swat and compute costs
Step VI: Create offspring
Step III: Identify best individuals
Step IV: Evaluate stopping rule
Step V: Choose parents
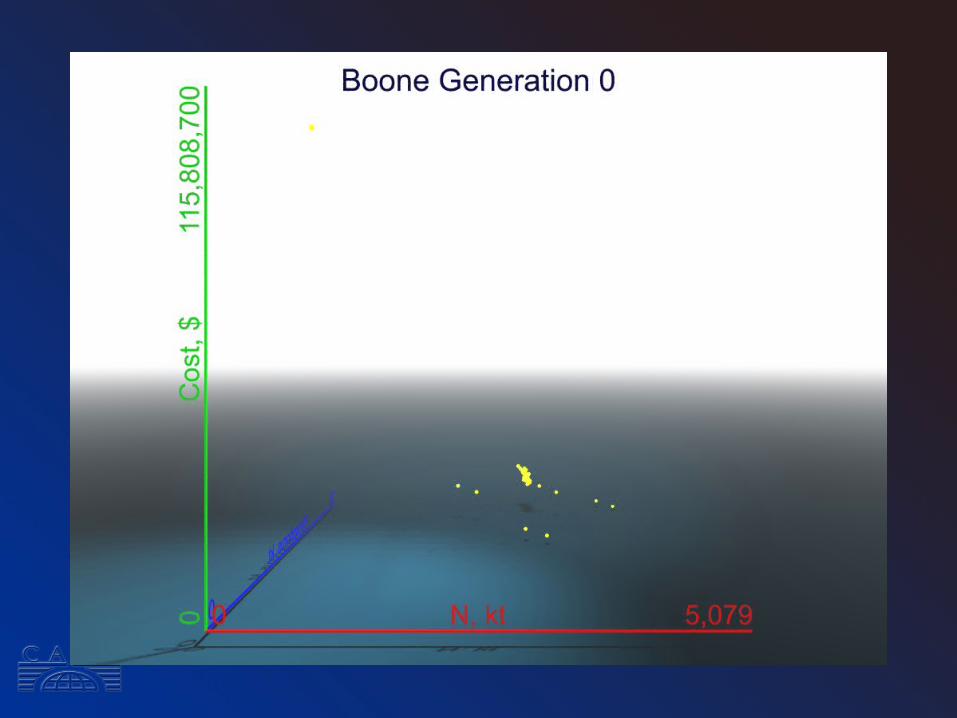
Step I: Generate initial population
Pareto
frontier

Pareto Frontier
• Strength S(i)= # of individuals i dominates• Raw fitness R(i)= sum of strengths of individuals that dominate i• Low value best: R(i)=0 means i is on the frontier

Boone River Watershed Iowa
• ~586,000 acres
• tile drained, 90% corn and soybeans
• 128 CAFOs (~480,000 head swine)
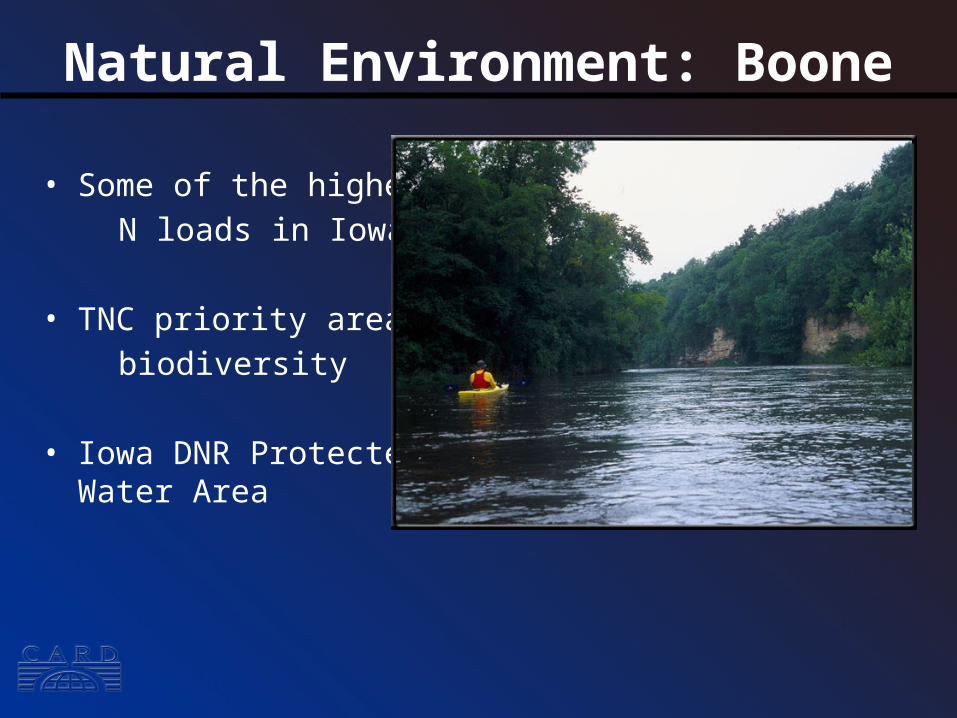
Natural Environment: Boone
• Some of the highest N loads in Iowa
• TNC priority area biodiversity
• Iowa DNR ProtectedWater Area

Common Land Unit Boundaries
• 16,430 distinct CLUs
• Detailed data related to:
land use, farming practices,
production costs,
slope,soils,
CSRs, etc.
• Weather station data
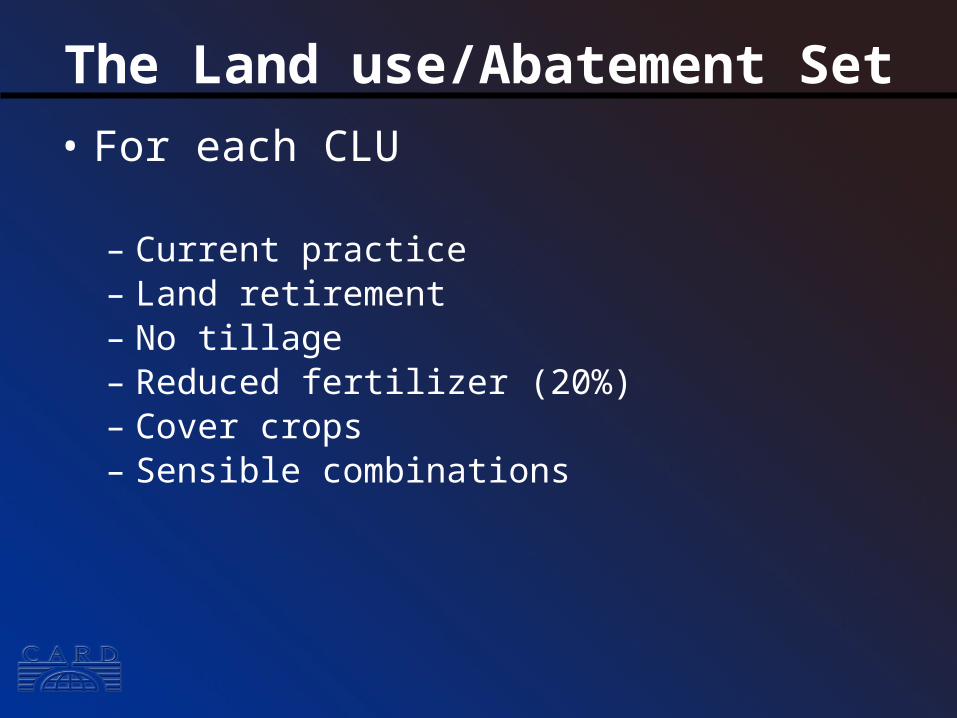
The Land use/Abatement Set
• For each CLU
– Current practice – Land retirement– No tillage– Reduced fertilizer (20%)– Cover crops – Sensible combinations

Gains from Optimal Placement
Practice Allocation (%)
Cost ($1000 dollars) % N % P NT NT, RF
CC,RF
CCNTRF Other
Cover Crops, Red. Fert 15,380 29 32 100
Same N reductions 2,778 29 44 84 13 <1 <1 3
Same Cost 15,365 47 45 8 23 <1 64 5


Least Cost for N and P Reductions
Target %Decrease
CostReduction
(%) Watershed practices (counts of HRUs)
($1,000) ($/acre) N P Baseline NT CCCC,NT RF
NT,RF
CC,RF
CC,NT, RF
RetireLand
10 1,158 2.19 11 21 1781 795 4 0 2 311 3 4 2
20 2,064 3.90 21 33 580 2310 4 2 1 1 2 0 2
30 3,389 6.41 30 44 1 2398 1 3 3 382 5 107 2
40 8,072 15.26 40 45 7 9 4 90 3 2173 5 608 3
50 20,815 39.36 50 50 5 10 5 11 12 966 11 1635 247
60 39,651 74.98 60 60 6 3 5 3 9 213 8 1828 827
70 79,194 149.75 70 81 4 61 2 369 2 417 5 3 2039
80 104,993 198.53 80 89 4 8 3 91 7 1 6 2 2780

Per acre average costs of abatement actions needed to achieve equal percent reductions in N and P

Policies to Attain Nutrient Reductions
• Taxes (or subsidies)
• Voluntary Approaches (may be with financial incentives)
• Regulations
– Technology requirements
– Standards (permits)
– Permit trading, “cap-and-trade,” “offsets”
– Other (compliance requirements, labeling requirements)

Regulation types• Technology Requirements: required to adopt
specific method of production or technologycatalytic converters,
• Standards: required to have a permit to cover their emissions or meet a standard
zoning requirements• Firms may be allowed to buy and sell permits
from one another • Compliance Requirements

• Cost share programs - voluntary– Conservation Reserve Program,– Environmental Quality Improvement Program, – Conservation Security Program, and – Wetlands Reserve Program , etc.
• Reverse auctions• Offsets (baseline and trade)• Labeling, consumer information
programs• Conservation compliance
Property rights with polluters

• Approach for many pollutants– Industrial sources air pollution
– Point sources water pollution
– Smoking bans, etc.
• Policies that are consistent with:– Cap and trade (capped sectors)
– Regulatory requirements
Property rights with society

BMPs: Everglades Agricultural Area
• 718,000 acres (40 acre fields)
• Everglades Regulatory Program– goal 25% P reduction overall– mandatory BMPs, 1995– Implemented via points
• flexibility in BMPs, 25 points/farm• expert judgment set point values• must implement and monitor WQ
Wikipedia
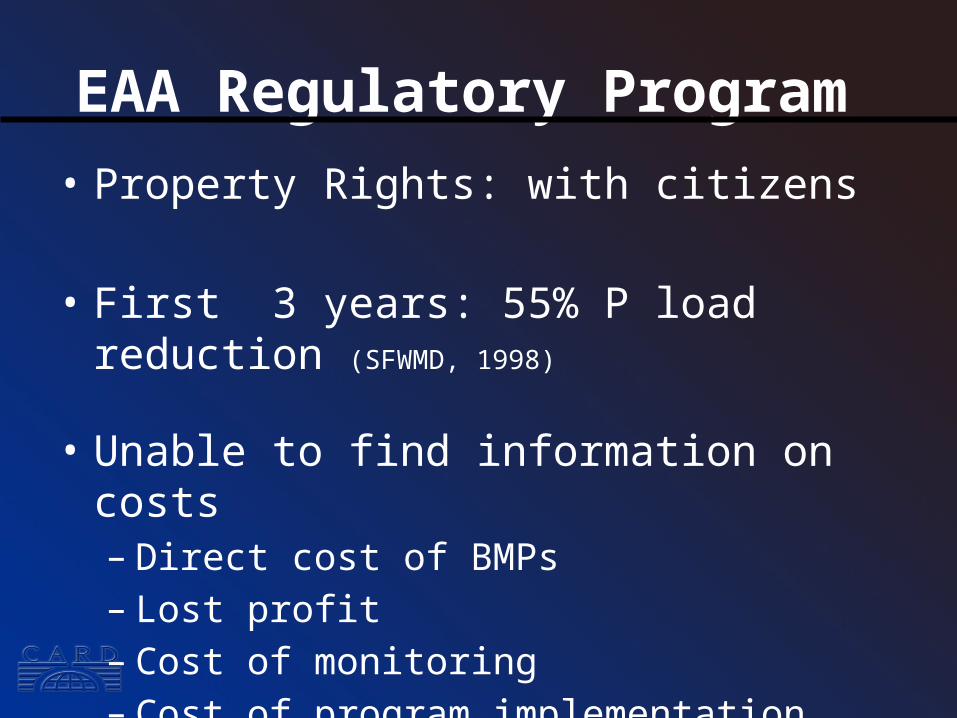
EAA Regulatory Program • Property Rights: with citizens
• First 3 years: 55% P load reduction (SFWMD, 1998)
• Unable to find information on costs– Direct cost of BMPs– Lost profit– Cost of monitoring– Cost of program implementation

Comments and Questions Welcome!
Related Documents