Track performance with Personal Dashboards The big five design decisions

Designing Personal Dashboards - your big 5 design decisions
Jul 28, 2015
Welcome message from author
This document is posted to help you gain knowledge. Please leave a comment to let me know what you think about it! Share it to your friends and learn new things together.
Transcript
Track performance with Personal Dashboards
The big five design decisions

Toby BeresfordCEO Rise.global
I’ve seen over 8,000 dashboards created on our platform

Get better at what you
do
What is a personal dashboard?
Actionable Analytics

Purpose of a personal dashboard?
Trigger timely behaviour change

Who is the dashboard for?
Me

Who designs my dashboard?
I do
e.g. Geckoboard
My coach/manager does
e.g. Rise
A 3rd Party
e.g. Google Analytics
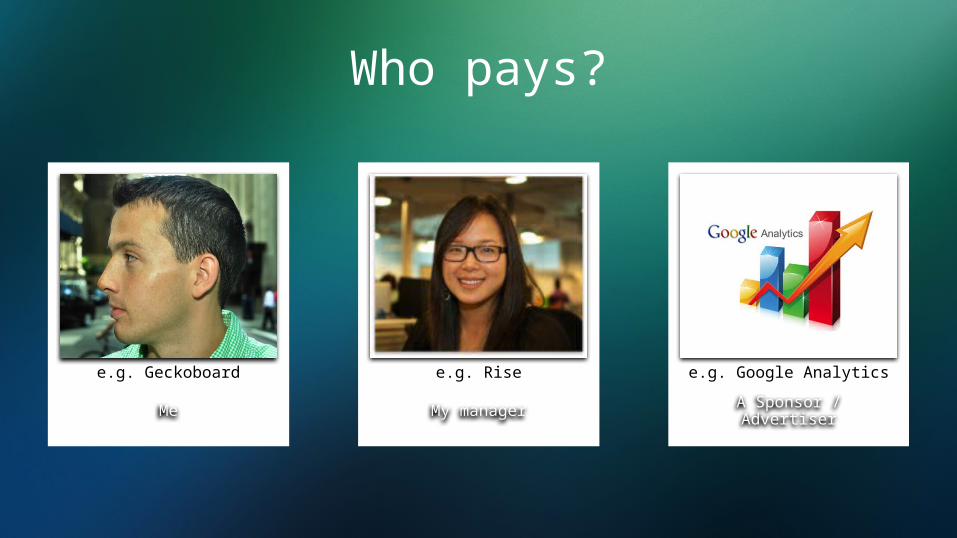
Who pays?
Me
e.g. Geckoboard
My manager
e.g. Rise
A Sponsor / Advertiser
e.g. Google Analytics
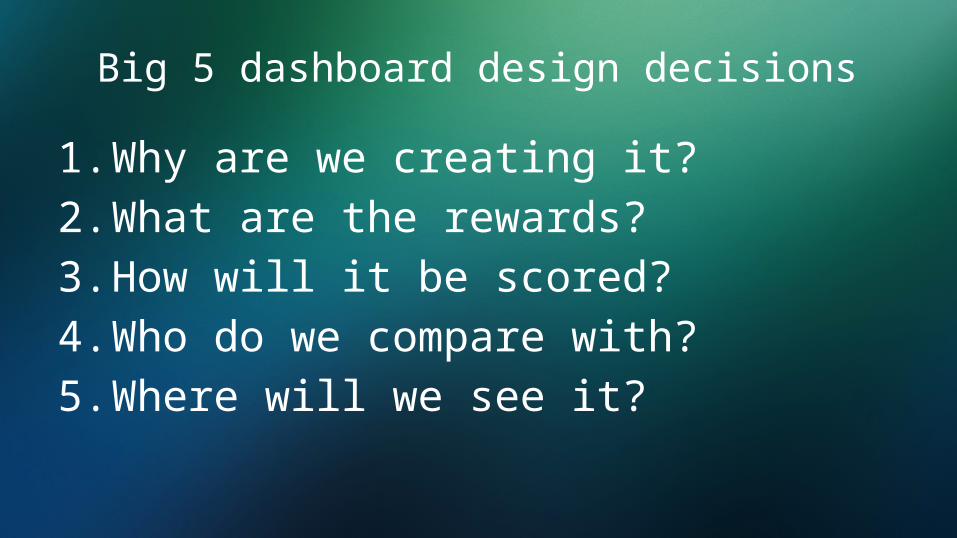
Big 5 dashboard design decisions
1. Why are we creating it?2. What are the rewards?3. How will it be scored?4. Who do we compare with?5. Where will we see it?

#1 – Why are we creating it?
Q: Is the dashboard for measurement or scorekeeping?

Understand your role
Managers measure
Players and Coaches keep
score

Measurement v Scorekeeping
Measurement
Catches people doing it wrong
Externally imposedPresented after the fact
Forces competitionMaximises excuses
Discourages ownershipEnforces manager goals
Scorekeeping
Reinforces good habitsChosen by individual
Feedback during journeyAllows competition
Maximises celebrationStimulates ownershipEnables player goals
Adapted from Scorekeeping for Success, © Chuck Coonradt
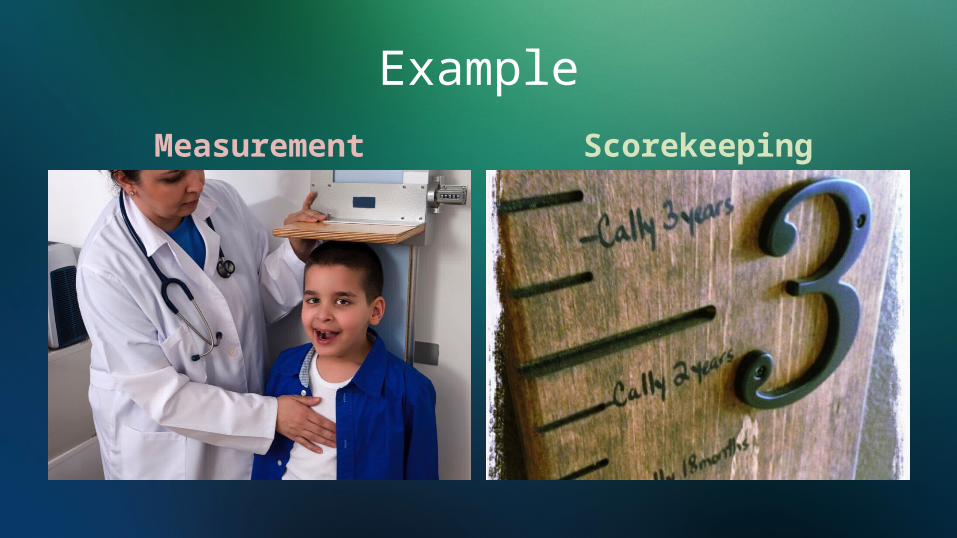
Example
Measurement Scorekeeping
#2 – What are the rewards?
Q: Am I hoping for extrinsic or
intrinsic reward?

Drive - the surprising truth about what motivates us
“if-then rewards usually do more
harm than good. By neglecting
the ingredients of genuine
motivation—autonomy, mastery,
and purpose—they limit what
each of us can achieve.”
Daniel Pink
Bestselling author of Drive
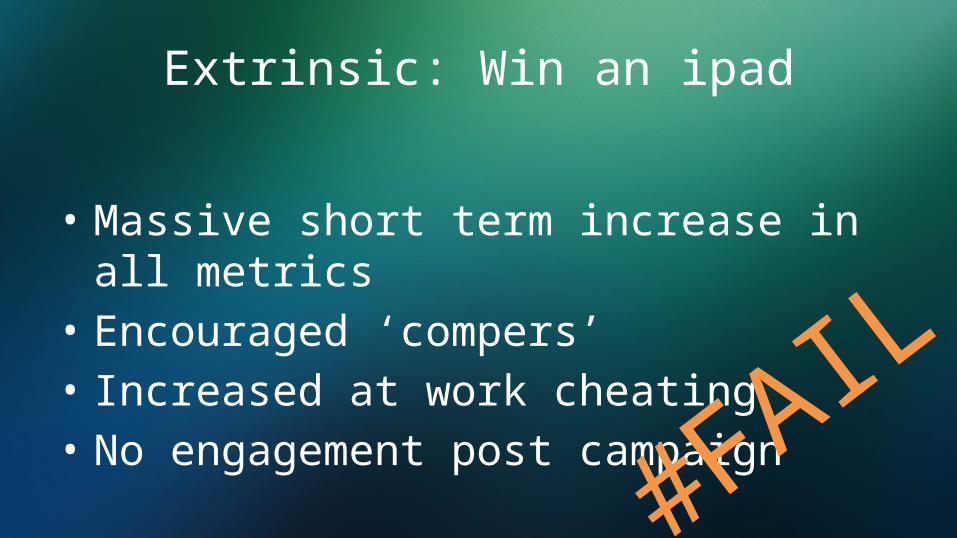
Extrinsic: Win an ipad
• Massive short term increase in all metrics
• Encouraged ‘compers’• Increased at work cheating• No engagement post campaign
#FAIL
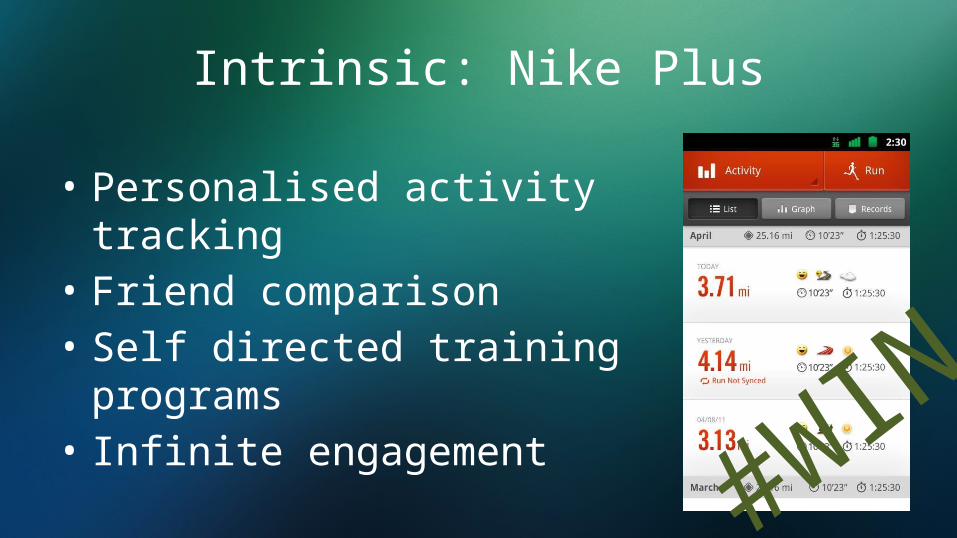
Intrinsic: Nike Plus
• Personalised activity tracking
• Friend comparison• Self directed training
programs• Infinite engagement
#WIN

#3 – How will it be scored?
Q: What scores do I create and show?

Multiple or Single Score?

What is the scoring system?
• What scores can I get? Is the raw data digitally accessible?
• Can weighting be agreed? Politics!• What scores do I hide / show?– Raw scores or derived indicators?– Activity data or Response data?

When designing a dashboard…
PoorUnrelated activities
Un-actionable stats
No goals
Raw numbers
Better
Related activities
Triggers data enquiry
Manual goals
Derived indicators
GreatBalanced single score
Triggers action
Automated goals
KPIs
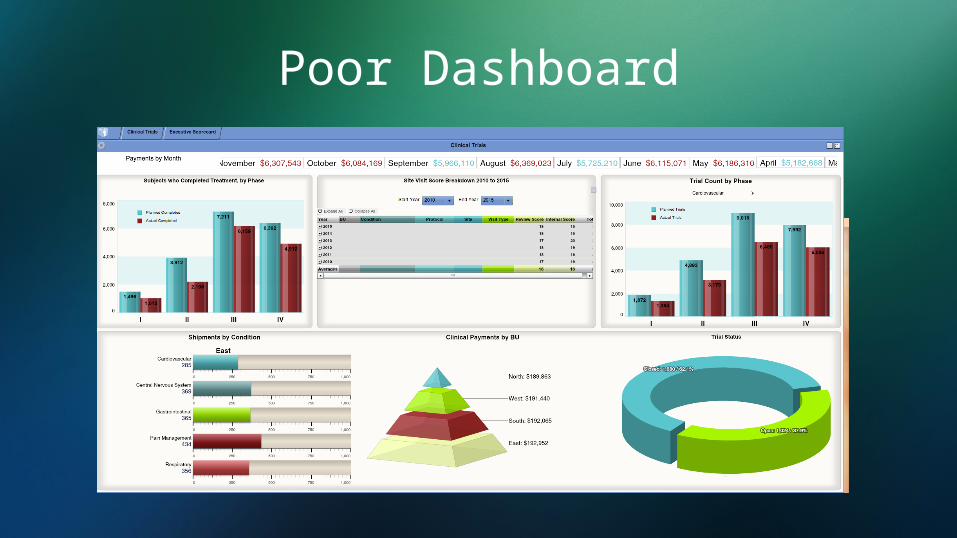
Poor Dashboard

Better Dashboard
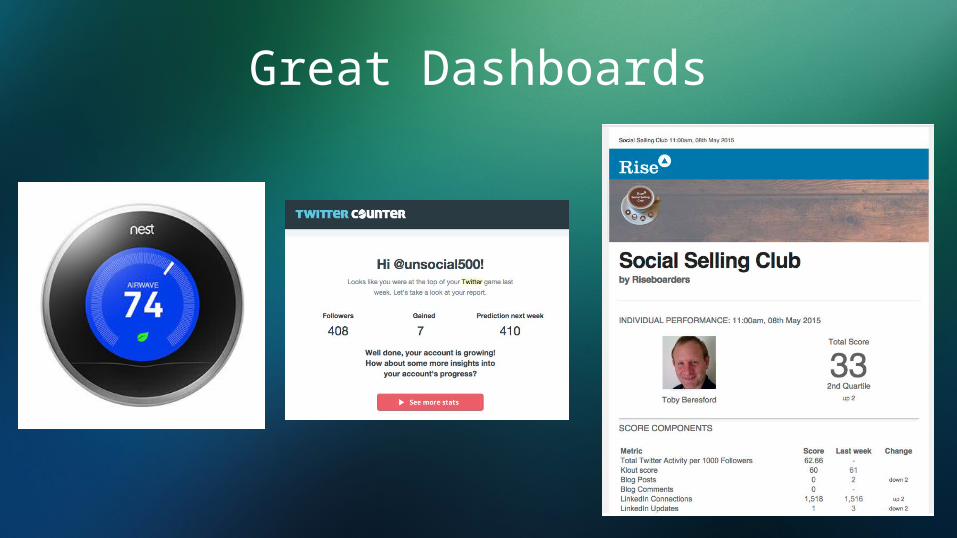
Great Dashboards

nest
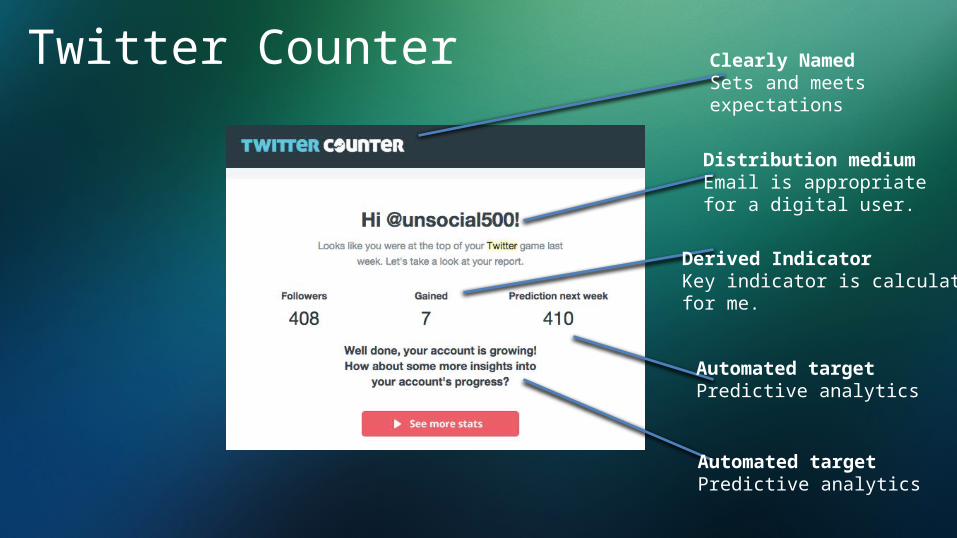
Twitter Counter Clearly NamedSets and meets expectations
Distribution mediumEmail is appropriatefor a digital user.
Derived IndicatorKey indicator is calculatedfor me.
Automated targetPredictive analytics
Automated targetPredictive analytics
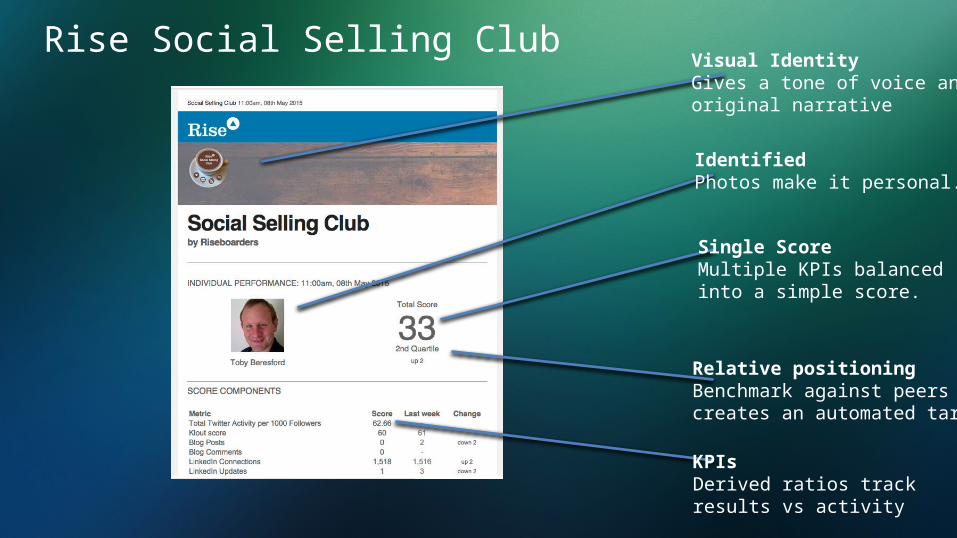
Rise Social Selling Club Visual IdentityGives a tone of voice andoriginal narrative
IdentifiedPhotos make it personal.
Single ScoreMultiple KPIs balancedinto a simple score.
Relative positioningBenchmark against peerscreates an automated target
KPIsDerived ratios track results vs activity
#4 – Who do we compare with?
Q: What is the leaderboard?

Social proof and peer comparison
• Who competes with who?• Who collaborates with who?• Where do you focus?– Self v Self– Individuals v Individuals– Teams v Teams
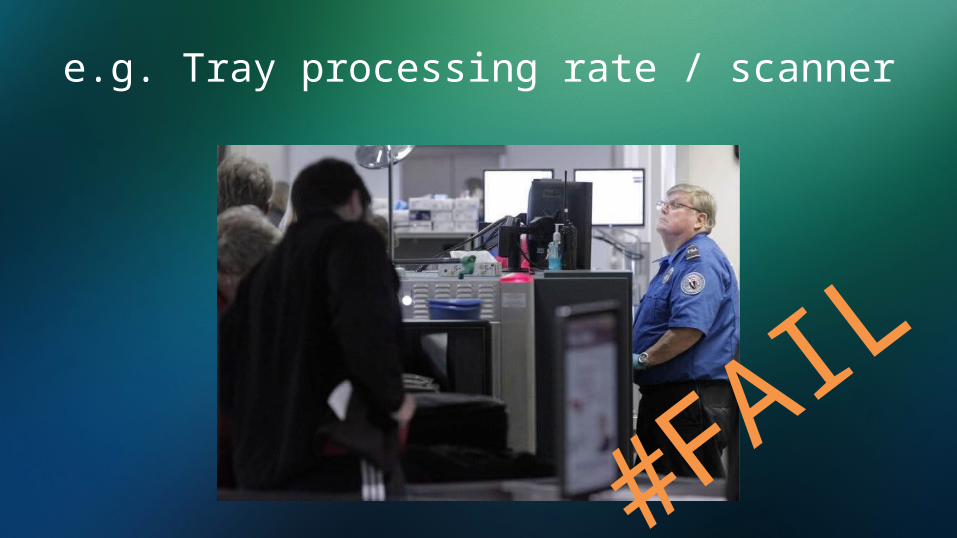
e.g. Tray processing rate / scanner
#FAIL

e.g. Tray processing rate / shift
#WIN

Gurus leaderboard
www.rise.global/gurus

#5 – Where do we see it?
Q: How do we distribute the dashboard?

e.g. Twitter Counter
Tweet
e.g. Rise
Report
e.g. HDI
Magazine
e.g. Campaign
Big Screen
e.g. Geckoboard
So many media options…
Email Tweet Report Magazine Big Screen
Not to mention distribution via app, poster, watch, web and word of mouth….
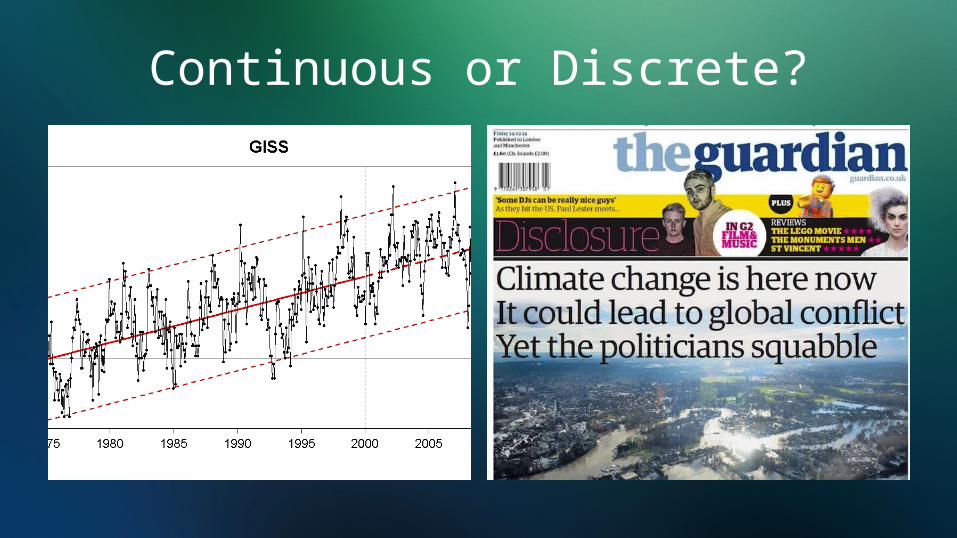
Continuous or Discrete?

Worst board ever?
Out of dateLast release was 4 monthsago.
Period unclearIs this all time / this week?
Two ways to winIs this a leaderboard of brews or of liters (sic)?
Poor Old VladimirCan he ever win?
Distribution mediumScrappy paper makes it feel unimportant
#FAIL

Rise Tweets
#W
IN
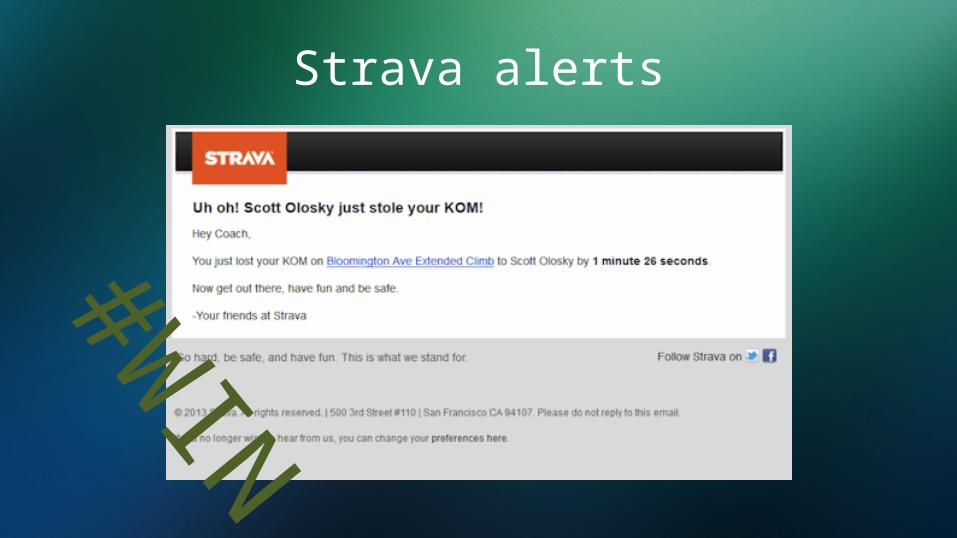
Strava alerts
#W
IN

When in doubt…
Announce

Big 5 dashboard design decisions
1. Why are we creating it?2. What are the rewards?3. How will it be scored?4. Who do we compare with?5. Where will we see it?
OPPORTUNITIES
Where can you find opportunities inside and outside your organisation to introduce personal dashboards?

Stuck in a rut

LowAdoption

New System

Information Overload

Misinformation

Fog

Summary
• Personal dashboards provide actionable analytics that trigger timely behaviour change.
• Use them to clear the fog, drive adoption, and bring simplicity to your end users

Going Deeper
• Read– Drive, Daniel Pink– Scorekeeping for Success, Chuck Conradt– Rise blog – blog.rise.global
• Join– Rise Online Influencer board– bit.ly/riseinfluencer
Related Documents