Nova Southeastern University NSUWorks CEC eses and Dissertations College of Engineering and Computing 2014 Designing for Statistical Reasoning and inking in a Technology-Enhanced Learning Environment Wendy Tu Nova Southeastern University, [email protected] is document is a product of extensive research conducted at the Nova Southeastern University College of Engineering and Computing. For more information on research and degree programs at the NSU College of Engineering and Computing, please click here. Follow this and additional works at: hps://nsuworks.nova.edu/gscis_etd Part of the Computer Sciences Commons , and the Education Commons Share Feedback About is Item is Dissertation is brought to you by the College of Engineering and Computing at NSUWorks. It has been accepted for inclusion in CEC eses and Dissertations by an authorized administrator of NSUWorks. For more information, please contact [email protected]. NSUWorks Citation Wendy Tu. 2014. Designing for Statistical Reasoning and inking in a Technology-Enhanced Learning Environment. Doctoral dissertation. Nova Southeastern University. Retrieved from NSUWorks, Graduate School of Computer and Information Sciences. (10) hps://nsuworks.nova.edu/gscis_etd/10.

Welcome message from author
This document is posted to help you gain knowledge. Please leave a comment to let me know what you think about it! Share it to your friends and learn new things together.
Transcript
Nova Southeastern UniversityNSUWorks
CEC Theses and Dissertations College of Engineering and Computing
2014
Designing for Statistical Reasoning and Thinking ina Technology-Enhanced Learning EnvironmentWendy TuNova Southeastern University, [email protected]
This document is a product of extensive research conducted at the Nova Southeastern University College ofEngineering and Computing. For more information on research and degree programs at the NSU College ofEngineering and Computing, please click here.
Follow this and additional works at: https://nsuworks.nova.edu/gscis_etd
Part of the Computer Sciences Commons, and the Education Commons
Share Feedback About This Item
This Dissertation is brought to you by the College of Engineering and Computing at NSUWorks. It has been accepted for inclusion in CEC Theses andDissertations by an authorized administrator of NSUWorks. For more information, please contact [email protected].
NSUWorks CitationWendy Tu. 2014. Designing for Statistical Reasoning and Thinking in a Technology-Enhanced Learning Environment. Doctoral dissertation.Nova Southeastern University. Retrieved from NSUWorks, Graduate School of Computer and Information Sciences. (10)https://nsuworks.nova.edu/gscis_etd/10.

Designing for Statistical Reasoning and Thinking in a Technology-Enhanced Learning Environment
by
Wendy Tu
A dissertation submitted in partial fulfillment of the requirements for the degree of Doctor of Philosophy
in Computing Technology in Education
Graduate School of Computer and Information Sciences Nova Southeastern University
2014

We hereby certify that this dissertation, submitted by Wendy Tu, conforms to acceptable standards and is fully adequate in scope and quality to fulfill the dissertation requirements for the degree of Doctor of Philosophy. _____________________________________________ ________________ Dr. Martha Snyder, Ph.D. Date Chairperson of Dissertation Committee _____________________________________________ ________________ Nina D. Miville, DBA Date Dissertation Committee Member _____________________________________________ ________________ Gertrude Abramson, Ed.D. Date Dissertation Committee Member Approved: _____________________________________________ ________________ Eric S. Ackerman, Ph.D. Date Dean, Graduate School of Computer and Information Sciences
Graduate School of Computer and Information Sciences Nova Southeastern University
2014

An Abstract of a Dissertation Submitted to Nova Southeastern University in Partial Fulfillment of the Requirements for the Degree of Doctor of Philosophy
Designing for Statistical Reasoning and Thinking in a Technology-Enhanced Learning Environment
by
Wendy Tu August 2014
Difficulties in learning and understanding statistics in college education have led to a reform movement in statistics education in the early 1990s. Although much work has been done, there is more work that needs to be done in statistics education. The progress depends on how well the educators bring interesting real-life data into the classroom. The goal was to understand how course design based on First Principles of Instruction could facilitate tertiary-level students’ conceptual understanding when learning introductory statistics in a technology-enhanced learning environment. An embedded single descriptive case design was employed to investigate how integrating technology and real data into a tertiary level statistics course would affect students’ statistical literacy, reasoning, and thinking. Data including online assignment postings, online discussions, online peer evaluations, a comprehensive assessment, and open-ended interviews were analyzed to understand how the implementation of First Principles of Instruction affected a student’s conceptual understanding in a tertiary level introductory statistics course. In addition, the teaching and learning quality (TALQ) survey was administered to evaluate the teaching and learning quality of the designed instruction from the student’s perspective. Results from both quantitative and qualitative data analyses indicate that the course designed following Merrill’s First Principles of Instruction contributes to a positive overall effectiveness of promoting students’ conceptual understanding in terms of literacy, reasoning, and thinking statistically. However, students’ statistical literacy, specifically, the understanding of statistical terminology did not develop to a satisfactory level as expected.

Acknowledgements
All praises to Allah, Al-Hakeem, Al-Alim. I wish to express my sincere gratitude to my committee members, Drs. Gertrude (Trudy) Abramson and Nina D. Miville, for their thoughtful reviews and constructive feedback. My heartfelt gratefulness goes to Dr. Martha (Marti) Snyder, my advisor, for her consistent and inspiring support and advice throughout the entire process. I thank you, Dr. Snyder, for easing this journey with your timely encouragement. Last, I would like to dedicate my achievement to my deceased parents. Indeed, without their affectionate teaching and guidance, I would not be able to attain my academic success.
v
Table of Contents
Abstract iii Acknowledgements iv List of Tables viii List of Figures ix Chapters 1. Introduction 1
Background 1 Statistics Education 2 Instructional Design Theory and Model Building 4 Problem Statement 5 Dissertation Goal and Research Questions 6 Relevance and Significance 7 Limitations and Delimitations 11 Limitations 11 Delimitations 12 Definition of Terms 13 Summary 14
2. Review of Literature 15
Introduction 15 Real Data Utilized in Statistics Courses 15 Technological Tools Implemented in Statistics Courses 22 Social Networking Services Implemented in Teaching 31 Instructional Theories Supported in Teaching 38 Instructional Theories Employed in Statistics Course Design 38 Merrill’s First Principles of Instruction Supported in Course Design 44 Summary 48
3. Methodology 49
Research Methodology 49 Descriptive Case Study 49 Course Design 53 Participants 55 Data Collection 56 Reliability and Validity 58 Construct Validity 59 External Validity 60
Reliability 61 Data Analysis 61 Quantitative Data Analysis 63 Qualitative Data Analysis 65 Presentation of Results 76 Resource Requirements 76 Barriers and Issues 78 Summary 80
4. Results 81
Introduction 81 Quantitative Data Analyses and Findings 81 TALQ Survey Results 85 TALQ Scales vs. CAOS 88 Qualitative Data Analyses and Findings 91 Intra-coding Agreement Rates 91 Inter-coding Agreement Rates 94 Statistical Tests Results 100 Content Analysis 108 Summary 189
5. Conclusions, Implications, Recommendations, and Summary 191
Conclusions 191 Research Question 1: How do Merrill’s First Principles of Instruction guide the development of an introductory, technology-enhanced, statistics course? 191 Research Question 2: How can StatCrunch, a web-based social data analysis site, be used to support meaningful learning? 198 Research Question 3: How does statistics instruction designed according to Merrill’s First Principles improve teaching and learning quality (TALQ) and develop statistical conceptual understanding? 212
Implications 217 Recommendations 220 Summary 223
Appendices A. Teaching and Learning Quality (TALQ) Survey 227 B. Informed Consent Document 235 C. Permission to Use CAOS Test 240 D. Interview Protocol 241 E. Teaching and Learning Quality (TALQ) Survey Items Arranged by TALQ Scales
242 F. Grading Sheet for Coding Descriptive Statistics 248 G. Nova Southeastern University IRB Approval 249 H. West Los Angeles College Approval Letter 251
I. Grading Sheet for Coding Interview Data 253 J. Amelia’s Interview Question 254 K. Charlie’s Interview Question 256 L. Harry’s Interview Question 258 M. Jessica’s Interview Question 260 N. Screenshot of Week Ten Module: Conducting a Hypothesis Test – An Imbedded
Presumption 262 O. Weekly Module: Conducting a Hypothesis Test – A Four-Step Process 263 P. Weekly Discussion: Testing on a Population Mean 269 Q. Project for Inferring Population Means 270 Reference List 274
List of Tables Tables
1. Course Design Summary 54
2. Categorization Matrix for Coding Online Discussion on the Course Topic of
Descriptive Statistics 69
3. Categorization Matrix for Coding the Interview Data for the Scenario Given in
Appendix D 74
4. Summary Statistics of TALQ Survey Data and CAOS Scores 83
5. Summary Statistics of TALQ Survey Miscellaneous Items 84
6. Correlations between Academic Learning Scale, Learning Scale, Self-report
Mastery Score, and CAOS Score 90
7. Intra-coding Agreement Rates by Each Coder 93
8. Inter-coding Agreement Rates on Weekly Discussions and Topical Projects by
Category 95
9. Inter-coding Agreement Rates on Interview Data by Category 99
10. Independence Test (χ2-test) and Two-Tailed Proportion Z-test Results of Level of
Understanding Explained by Assignment Type 102
11. Percentages of “Clear Understanding” Coding for Interviews 105
12. Percentages of “Clear Understanding” Coding for Various Assessment Types
107

List of Figures Figures
1. Scatterplot of Age and Wall Posts of Amelia’s Facebook Friends 111
2. Histogram of the Number of Photos Tagged on a Facebook Page 115
3. Dotplot of the Age of Amelia’s Facebook Page 122
4. Bar Chart of the Relationship Status of Amelia’s Facebook Page 123
5. Histogram of Amelia’s Sample of Lecture Lengths 124
6. Scatterplot of Work Hours and Credit Hours 126
7. Bar Chart of the Relationship Status of Charlie’s Facebook Friends 132
8. Histogram of Charlie’s Sample of Lecture Lengths 135
9. Histogram of the Age of Harry’s Facebook Friends 154
10. Bar Chart of the Relationship Status of Jessica’s Facebook Friends 170
11. Scatterplot of Age and Wall Posts of Jessica’s Facebook Friends 182
12. Screenshot of Week Ten Module: Inferring Population Means, Part II – Table of
Contents 193
13. Screenshot of Weekly Discussion Forums 197
14. Screenshot of Project for Inferring Population Means Discussion Forum 198 15. Screenshot of Class Group on StatCrunch 199
16. Scatterplot Produced by the Researcher 201
17. Scatterplot Produced by the Students 202
18. Confidence Intervals Produced by StatCrunch at Various Confidence Levels
203
19. Sample Built-in Function on StatCrunch for Selecting Random Samples 205
20. Sample Means Computed from 1000 Samples of Size 25 207
21. Mean and Standard Deviation of the 1000 Sample Means 207
22. Screenshot of Sampling Distribution Applet for a Normal Population Distribution
with n = 2 209
23. Screenshot of Sampling Distribution Applet for a Normal Population Distribution
with n = 100 210
24. Screenshot of Sampling Distribution Applet for a Skewed Population Distribution
with n = 2 210
25. Screenshot of Sampling Distribution Applet for a Skewed Population Distribution
with n = 25 211
26. Screenshot of Confidence Intervals Applet 211
1
Chapter 1
Introduction
Background
For many students, statistics has a reputation for being boring, unappetizing, and the
worst experience in college education (Brown & Kass, 2009; Hogg, 1992). Difficulties in
learning and understanding statistics make it a notorious subject in college education. In
1990, a workshop on statistics education addressing these problems took place in Iowa
(Hogg). The workshop became the first step of the reform movement in statistics
education. Subsequently, Cobb (1992) proposed recommendations on the following three
areas in teaching statistics: emphasize statistical thinking, use more data and concepts,
and foster active learning. Cobb’s proposal was later expanded and formed into the basis
of the GAISE Project (Guidelines for Assessment and Instruction in Statistics Education)
(American Statistical Association, 2005; Franklin & Garfield, 2006). In the GAISE
Project, the following six recommendations for teaching introductory statistics were
proposed:
• Emphasize statistical literacy and develop statistical thinking.
• Use real data.
• Stress conceptual understanding rather than mere knowledge of procedures.
• Foster active learning in the classroom.
• Use technology for developing concepts and analyzing data.
• Use assessments to improve and evaluate student learning.
2
In December 2005, The American Mathematical Association of Two-Year Colleges
(AMATYC) endorsed these recommendations. What is missing is prescriptive guidance
on how to effectively design an introductory statistics course that incorporates these
recommendations.
Statistics Education
Statistical literacy, statistical reasoning, and statistical thinking are the three
overarching goals of statistics instruction (delMas, 2002). While many papers and texts
use the terms interchangeably without giving formal definitions, the fundamental idea is
to emphasize the importance of conceptual understanding and to move away from the
traditional way of solving problems merely for a numerical solution (Chance, 2002).
Rumsey (2002) explains the phrase “statistical literacy” as basic statistical competence
that involves five components: data awareness, an understanding of certain basic
statistical concepts and terminology, knowledge of the basics of collecting data and
generating descriptive statistics, basic interpretation skills, and basic communication
skills (p.9). Statistical reasoning is “the way people reason with statistical ideas and make
sense of statistical information” (Garfield & Gal, 1999, p.1). Reasoning means
understanding statistical processes and being able to interpret statistical results (Garfield,
2002). Finally, the term “statistical thinking” goes beyond “literacy” and “reasoning.” A
statistical thinker views the entire statistical process as a whole and asks “why” to
question and investigate the issues through the context of a problem (Chance, 2002). To
emphasize statistical literacy, Gould (2010) claims that learners need to be able to
analyze data with the context, which echoes Cobb and Moore’s (as cited in Gould)
definition of data as “numbers with a context.” Early exposure to solving data with real
3
and interesting contextual questions motivates students and could create a more relevant
course (Gould; Nolan & Temple Lang, 2009).
Due to advanced modern technology, today’s students are exposed to data directly
and regularly on a daily basis, even before their first experience with introductory
statistics courses (Gould, 2010). As opposed to static and abstract data that are typically
contained in textbooks, students are exposed to complex and constantly changing data
that can fit on a thumb drive. The implications to educators are that we need to think
about the data we are using when teaching statistics and whether these data are relevant
to today’s students. Students today are in need of a new curriculum (Gould). There is
more work needs to be done in statistics education even though much work has been
done through the reform of statistics education (Easterling, 2010). The progress depends
on how well we bring interesting real-life data into the classroom (Easterling; Gould;
Meng, 2009). In this regard, a major change in the design of statistics instruction is
needed. The recent outcry of developing statistical thinking as the primary goal of
statistics education (Brown & Kass, 2009; Hoerl & Snee, 2010; Meng; Nolan & Temple
Lang, 2009) further confirms the need of pedagogical change in statistics education
(Gould; Meng), in particular, in introductory statistics courses (Brown & Kass; Hoerl &
Snee).
Never before has the need for statistics education been greater (Gould, 2010). The
demand of introductory statistics courses has steadily increased each year due to the
academic quantitative requirement in undergraduate studies (Soler, 2010) as well as the
need of statistical thinking in the management level of the business sectors (Brown &
Kass, 2009; Finzer, Erickson, Swendson, & Litwin, 2007). The demand for statistics
4
education coupled with the need to rethink statistics instruction in light of new
technologies, tools, and data, drove the need for the study.
Instructional Design Theory and Model Building
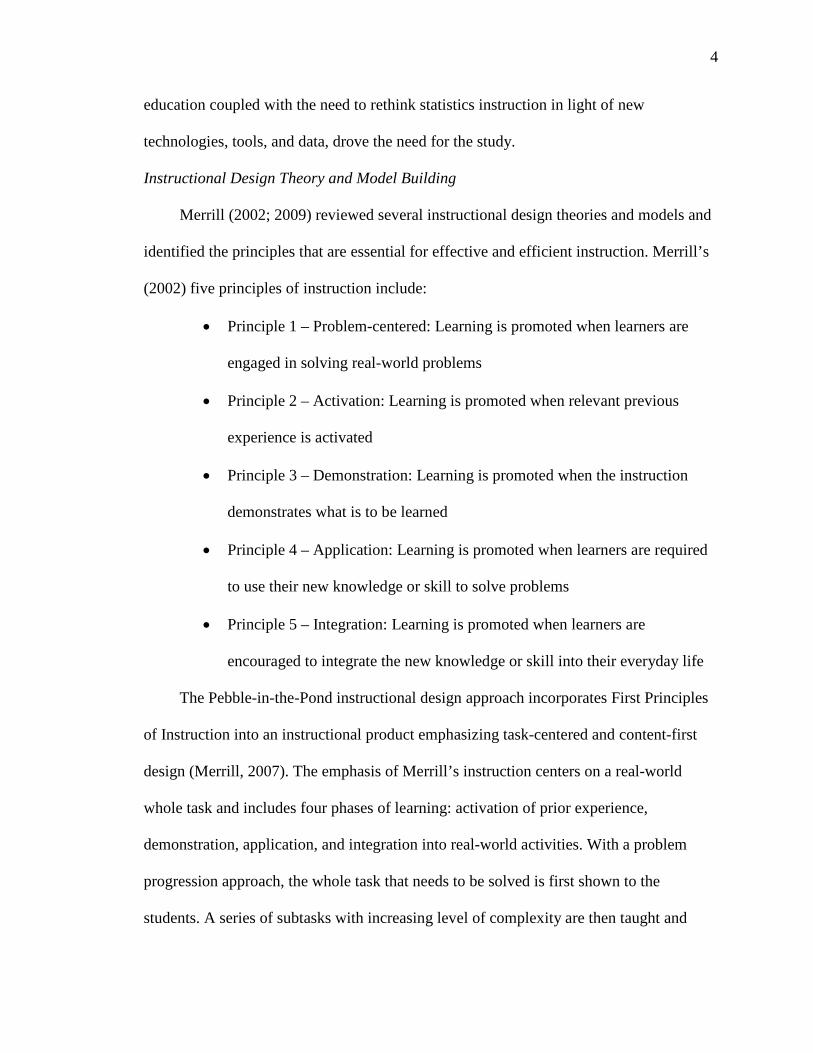
Merrill (2002; 2009) reviewed several instructional design theories and models and
identified the principles that are essential for effective and efficient instruction. Merrill’s
(2002) five principles of instruction include:
• Principle 1 – Problem-centered: Learning is promoted when learners are
engaged in solving real-world problems
• Principle 2 – Activation: Learning is promoted when relevant previous
experience is activated
• Principle 3 – Demonstration: Learning is promoted when the instruction
demonstrates what is to be learned
• Principle 4 – Application: Learning is promoted when learners are required
to use their new knowledge or skill to solve problems
• Principle 5 – Integration: Learning is promoted when learners are
encouraged to integrate the new knowledge or skill into their everyday life
The Pebble-in-the-Pond instructional design approach incorporates First Principles
of Instruction into an instructional product emphasizing task-centered and content-first
design (Merrill, 2007). The emphasis of Merrill’s instruction centers on a real-world
whole task and includes four phases of learning: activation of prior experience,
demonstration, application, and integration into real-world activities. With a problem
progression approach, the whole task that needs to be solved is first shown to the
students. A series of subtasks with increasing level of complexity are then taught and
5
demonstrated. Students are instructed to apply previously learned topics to solve the new
subtask included in the series. Repeating this same cycle of presentation, demonstration,
and application, students receive less and less guidance each time a new subtask is
presented. In the end, it is expected that students are able to integrate what they have
learned to complete an ill-structured conventional whole task without further guidance
(Merrill & Gilbert, 2008).
In an effort to align with the reform movement in statistics education, educators
applied instructional models and theories such as cognitive theory (Lovett & Greenhouse,
2000), cooperative framework (Garfield & Ben-Zvi, 2009), and the constructivist theory
(Roseth, Garfield & Ben-Zvi, 2008) of learning to enhance students’ learning. However,
the models and theories implemented into the statistical instruction have not been
evaluated intensively (Richey & Klein, 2009). Although instructional design experiments
have been conducted in the past for the purpose of developing learner’s statistical
reasoning (Cobb & McClain, 2004), they were mainly designed for students in an
elementary school setting. Specifically, Merrill (2007) asks for more formal studies that
implement a task-centered instructional strategy to validate its efficiency and
effectiveness.
Problem Statement
Students enrolled in tertiary level introductory statistics courses lack the ability to
reason and think statistically (Brown & Kass, 2009; Hoerl & Snee, 2010; Meng, 2009;
Nolan & Temple Lang, 2009). Under the reform movement in statistics education, the
teaching of introductory statistics focuses more on utilizing technology to foster
conceptual understanding including statistical reasoning and the ability of thinking
6
statistically than rote procedures of merely finding a numerical solution (Garfield & Ben-
Zvi, 2007; Gould, 2010). However, learners’ persistent inaccurate statistical reasoning
about statistical ideas has remained unchanged and is still the major issue in learning
statistics (Garfield & Ben-Zvi). Guidance is needed in terms of how to design instruction
for a blended learning environment that integrates technology, real data and promotes
conceptual understanding.
The need for empirically assessing and validating existing and new instructional-
design theories and models under various settings has been a major concern over the
years (Reigeluth & Frick, 1999; Richey & Klein, 2009). Reigeluth and Frick urge
researchers to apply instructional theories when designing courses to validate and
improve the instructional theories. First Principles of Instruction (Merrill, 2009) have yet
to be employed adequately with different disciplines. Thus, verifying instructional design
in different settings with different audiences focusing on the four-phase cycle of
instruction: activation-demonstration-application-integration is needed.
Dissertation Goal and Research Questions
An introductory statistics course was designed based on Merrill’s First Principles of
Instruction (2002). The goal was to understand how the course design based on First
Principles of Instruction can facilitate tertiary-level students’ conceptual understanding
when learning introductory statistics in a technology-enhanced learning environment. The
16-week course was delivered in a blended format at a two-year community college. The
design integrated relevant technology and real-world data, and used a task-centered
instructional strategy (Merrill, 2007). Merrill’s First Principles (2002) of activation,
demonstration, application, and integration were served as the overarching framework for
7
the cycle of instruction, while the Pebble-in-the-Pond approach (i.e., task-centered,
content-first) instructional strategy (Merrill, 2007) was used to implement the principles.
Using a descriptive case study design (Yin, 2009), the following research questions
guided the investigation:
1. How do Merrill’s First Principles of Instruction guide the development
of an introductory, technology-enhanced, statistics course?
2. How can StatCrunch, a web-based social data analysis site, be used to
support meaningful learning?
3. How does statistics instruction designed according to Merrill’s First
Principles improve teaching and learning quality (TALQ) and develop
statistical conceptual understanding?
Relevance and Significance
Using technology for developing concepts and analyzing data when teaching
introductory statistics is one of the six recommendations promoted in the GAISE project
(Franklin & Garfield, 2006). However, the implementation of technology into an
introductory statistics course should go beyond the basic level of utilizing, for instance,
built-in functions of a graphing calculator for the sole purpose of obtaining a numerical
solution. Rather, the focus should be placed on the interpretations of the data or scenario
(Chance, Ben-Zvi, Garfield, & Medina, 2007).
Mason, as cited in Madge, Meek, Wellens, and Hooley (2009) and McLoughlin and
Lee (2007) suggest that social software such as blogs, wikis, and social networking
services (SNS’s) such as Facebook and MySpace could potentially become useful tools of
teaching and learning either with formal educational objectives or informal learning
8
(Selwyn, 2009). The rapid growth of advanced technologies has successfully changed the
learners from being passive content consumers into active co-producers in the process of
learning (McLoughlin & Lee). The sociability aspects of the social networking services
support the learners within the same social environments to interact, collaborate and build
knowledge jointly (McLoughlin & Lee; Selwyn).
StatCrunch (www.statcrunch.com) is a web-based statistical software providing a
full set of statistical analysis including numerical summaries and graphical displays
covered in introductory statistics courses; it is one of the social data analysis sites
developed that allows users to share data sets, results, and reports in the online
community. StatCrunch provides the sharing capabilities within the site that benefits
teaching and learning. Instructors can share a large number of data sets (more than 12,000
are currently available) with their students while students can search for interesting data
sets that motivate them to emulate and strengthen their skills of analyzing data (West,
2009).
In addition to the sharing of the results, the ‘social’ aspect of the site also allows the
communication with one another within the site. Moreover, the capability of setting up
user groups enables the instructors of introductory statistics courses to facilitate
workshops. Student members participate in sharing their results of data analysis along
with their interpretation of the data with one another and comment on each other’s results
and interpretation (West, 2009). It is through the discussion that stimulates students to
carefully examine data in order to understand the data’s context and implications. Such
training induces more thoughts on statistical reasoning and critical thinking (Chick &
Pierce, 2010).
9
Choosing Merrill’s First Principles of Instruction when designing an instruction to
teach blended introductory statistics at the tertiary level is appropriate. The emphasis of
Merrill’s instructional design is using a progression of whole tasks that are real world
activities (Merrill & Gilbert, 2008). Utilizing the real world tasks in instruction agrees
with GAISE recommendation of using real data when teaching introductory statistics
courses (Franklin & Garfield, 2006). Trumpower (2010) documents that students often
have difficulties identifying and interpreting the significance of the numerical results
because of their lack of interest in the variables presented in the questions. Using real-
world data can stimulate the interest in learning statistical principles (Chick & Pierce,
2010) as well as thinking about the meaning of the results (Trumpower).
In addition to the problem-centered instruction technique, peer interaction in the
forms of peer-sharing (activation principle), peer-discussion and peer-demonstration
(demonstration principle), peer-collaboration (application principle), and peer-critique
(integration principle) is highly promoted in first principles of instruction (Merrill &
Gilbert, 2008). Peer interaction activities encourage active learning in the (virtual)
classroom. Consequently, by adequately implementing the fundamental strategies of
instruction, effective, efficient and engaging learning will occur (Merrill, 2008).
With a progression of whole tasks approach, students have the chance to self-
evaluate constantly through each stage of learning. In the meantime, through constant
evaluation, instructors could help students improve their learning by providing feedback
along the way. The inclusion of peer-critique in the instruction further extends the
assessment to include constructive recommendations from the peer that benefits the
students involved in the process of peer-evaluation. The GAISE recommendation of
10
using assessments to improve and evaluate student learning, and fostering active learning
in the classroom discussed previously are yet coincided with another two guidelines that
are included in GAISE recommendations (Franklin & Garfield, 2006).
Merrill’s First Principles of Instruction could support student’s conceptual learning
rather than mere knowledge of procedures, one of the GAISE recommendations. A task-
centered instructional strategy along with the peer interaction facilitates conceptual
understanding. When a whole task is presented to the students, students need to be able to
analyze the scenario and identify a suitable method of statistical analysis. During the
process of peer-discussion, students need to be able to explain their reasoning to fellow
students about why they chose the statistical analysis to solve the whole task or problem.
Selecting the correct approach and convincing others involve clear conceptual
understanding. Being able to analyze and interpret data helps learners to understand the
world. Implementing Merrill’s First Principles of Instruction into the design of a tertiary
level introductory statistics course has the potential to achieve the imperative and
ultimate goal of statistics education to “prepare citizenry for thinking and computing with
data” (Gould, 2010, p. 298).
As a result, the relevance and significance of the study are threefold. First, one of
the recommendations in GAISE is to use real data when teaching introductory statistics
courses. As a result of technology in this modern world, learners are exposed to and
surrounded by data on a daily basis. Bringing the practical, real-world data produced in
the social life such as Facebook into the classroom of introductory statistics courses
encourages instructors to go beyond the flat structures of using well-formulated examples
provided in the texts, but rather, design instruction with authentic data exploration
11
experience for the learners. Second, how social networking tools can be used in blended
learning environments to support the teaching has not yet been documented adequately
(Arnold & Paulus, 2010). Specifically, analyzing data generated from Facebook through
the social data analysis site StatCrunch integrates the practice of technology as well as
real-world social life into introductory statistics curriculum. This integration can provide
the instructors teaching blended tertiary level of introductory statistics courses to
experience a new level of pedagogical strategy. Finally, although emphasizing statistical
literacy and developing statistical thinking is the first recommendation suggested in
GAISE guideline, it is the most challenging (Brown & Kass, 2009; Garfield & Ben-Zvi,
2007; Hoerl & Snee, 2010). With the implementation of Merrill’s First Principles of
Instruction in designing the introductory statistics courses, the impact on students
learning introductory statistics could be documented. The outcomes can be valuable and
can serve as experiences for the current and future instructors teaching blended tertiary
level statistics courses. Consequently, there is a need to document the effectiveness and
the efficiency of implementing First Principles of Instruction when designing the blended
introductory statistics course at a tertiary level and understand the impacts of First
Principles of Instruction have on improving student’s statistical thinking.
Limitations and Delimitations
Limitations
Although beyond researcher’s control, some factors may have impacts on the study
results. The limitations of the study include:
• Although the results of the study can be generalized to the theoretical propositions
through replication, they cannot be used for statistical generalization. That is, the
12
findings of the study should not be generalized to all the other tertiary level
introductory statistics courses since the case in the case study does not represent a
sample (Yin, 2009; 2012).
• Since there was no replication involved in the study, the results of the study can
only be applied to the participants of the case study.
• Due to its descriptive case study design, causality cannot be established in the
study (Yin, 2009). That is, even the results of the study show students’ capability
of thinking statistically, it cannot be concluded that the implementation of
Merrill’s First Principles of Instruction into introductory statistics courses causes
the improvement.
Delimitations
The case study was conducted by purposefully imposing the following constrains to
confine its scope of the research.
• Participants were restricted to those students who enrolled into a hybrid online
statistics course at a two-year community college in Greater Los Angeles area.
• The following topics were covered in the introductory statistics course for the
study: descriptive statistics, probability, probability models, sampling distribution,
inferences, and two-sample inferences.
• Three instructional instances for each topic were designed according to Merrill’s
First Principles of Instruction and delivered as teaching examples and homework
assignments.
• The research study was restricted for the duration of one semester (16 weeks).
13
Definition of Terms
To clarify the understanding of the terms used throughout the study, the following
definitions are provided.
First Principles of Instruction: An instructional theory incorporating five principles that
are essential for effective and efficient instruction. The five principles of instruction are
problem-centered, activation, demonstration, application, and integration (Merrill, 2002;
2009).
Pebble-in-the-pond instructional design: A problem progression approach that integrates
First Principles of Instruction into an instructional product emphasizing task-centered and
content-first design (Merrill, 2007). With less and less guidance throughout the
instruction, learners are expected to be able to integrate what they have learned to
complete an ill-structured conventional whole task without further guidance (Merrill &
Gilbert, 2008).
Statistical literacy: Basic statistic skills include data consciousness, an understanding of
statistical concepts and terminology, knowledge of data collection and generating
descriptive statistics, interpreting the results using non-technical terms, and
communicating the results with people who are not familiar with statistics (Rumsey,
2002).
Statistical reasoning: Understanding statistical processes and being able to interpret
statistical results (Garfield, 2002).
Statistical thinking: Being able to view the entire statistical process as a whole and asks
“why” to question and investigate the issues through the context of a problem (Chance,
2002).
14
Summary
Chapter one introduced First Principles of Instruction, the instructional design
theory, as the building frame of an innovative pedagogical design in an attempt to remove
the obstacles that statistics education is currently facing. The goal was to understand how
this innovative pedagogical design based on First Principles of Instruction can facilitate
tertiary-level students’ conceptual understanding when learning introductory statistics in
a technology-enhanced learning environment. Three research questions that guided the
investigation were presented. The relevance and significance derived from the need to
document real-world data exploration experience for the learners, social networking sites
to support the teaching, and the impacts of First Principles of Instruction on learners’
ability to think statistically were detailed. Finally, limitations and delimitations were
summarized, and terms relevant to the study were defined.
15
Chapter 2
Review of the Literature
Introduction
Chapter two presents a review of the literature in real data utilized in statistics
courses, technological tools implemented in statistics courses, social networking services
implemented in teaching, instructional theories employed in statistics course design, and
Merrill’s First Principles of Instruction supported in course design.
Real Data Utilized in Statistics Courses
Much research on implementing real-world data in teaching introductory statistics
is available. Ridgway and Nicholson (2010) urged the educators to provide tasks that are
relevant to students when teaching statistics. A group of ninety students aged 13-15 from
four different schools was evaluated about their statistical literacy using mashup
presentations that comprised interactive multivariate displays of survey data together with
newspaper articles related to the topic of the interactive displays. Students were asked to
create open responses such as writing a letter to the editor or creating a video or
PowerPoint in response to the display. Even though untaught with formal statistical ideas,
a majority of student work was well presented in terms of style, sense of audience, or
structure and logical coherence. The results were contrary to the majority of research
results supporting the idea that students have difficulty comprehending basic statistical
ideas when learning statistics. The researchers speculated that students’ difficulty with
comprehending statistical ideas could be a result of depriving of the use of real, authentic
16
data. When isolated tasks that are devoid of context are presented to the students, the
irrelevant technical work becomes meaningless to the students. On the other hand, tasks
that are relevant to students can increase student engagement, and thus, students are more
capable of demonstrating what they understand.
Gordon and Finch (2010) demonstrated how using real-world data could improve
learners’ critical thinking. In 2008, with a purpose of training first year undergraduate
students to critically utilize and evaluate statistical information, staff in the Statistical
Consulting Centre (SCC) at the University of Melbourne developed the course Critical
Thinking with Data (CTWD). Since the course was designed to provide fundamental
ideas about statistical literacy, the math component was removed from the design of the
course. Students taking CTWD were asked to respond to questions (orally and in writing)
regarding research and arguments based on data. Using a topic-based approach, the
CTWD course included a total of 15 topics categorized in four themes (finding data as
evidence; examining evidence in data; understanding uncertainty in data; and drawing
conclusions from evidence in data). Three researchers with strong statistical backgrounds
and from different disciplines were invited to give lectures on an application in their area.
Media reports with rich representation such as video clips and images that gained
popularity among students were included as examples to motivate students’ learning.
With a dramatically different approach of teaching/learning statistics, student feedback
exposed students’ concern of not knowing what was expected from them, especially the
assessment. However, the majority of students agreed that, after taking the course, they
“felt confident about critically evaluating media reports of quantitative data” (78%), and
they “had developed their capacity to think about quantitative information” (81%). This
17
approach, however, is not achieved without difficulties. Finding instructors who possess
the right skills and experience, and who are willing to teach the course with a non-
mathematical approach has become a major challenge for the course developers. In
addition, finding rich media content for examples and assessments is nonetheless an
ongoing and time-consuming task.
In line with the importance of using real-world data, research has demonstrated the
usage of archived databases when teaching statistics (Lee, 2010; Meier, McCaa, & Lam,
2010). According to Lee, real data collection is time consuming, especially with a large
set of data. However, the experience of going through the process of data production is
valuable and should not be ignored in the process of learning statistics. The cleaned and
artificial data provided in most of the statistics textbooks deprive students’ opportunities
in experiencing data exploration. Lee recommended using the online database developed
by Lee and Famoye (cited in Lee) where data collected through ongoing hands-on
activities were stored. The data cumulated in the database inherit the nature of real-world
data of being real, messy, and large. To help students learn to diagnose the potential
issues in the process of data production, Lee addressed the issues and demonstrated with
the selected-real-time hands-on activities stored in the database. The major data
production issues addressed were (1) choice of measurement units, (2) robustness of
measuring techniques, (3) the operational definition of variable, (4) subjective sampling
or random sampling, (5) outliers vs. errors, (6) observational vs. experimental study, and
(7) underline target population.
With the world’s largest repository of census microdata, Meier et al. (2010)
described the pros and cons of the use of Integrated Public Use Micro Series (IPUMS) in
18
their introductory statistics taught in two universities in the U.S. IPUMS is the largest
repository of census microdata in the world containing individual responses to census
questionnaires conducted in more than 84 countries (representing more than four-fifths of
the world’s population) from 1960 to the present. Although census microdata have been
made available as a teaching tool through the IPUMS-International project, the data
accessibility could still be challenging. Another challenge of using the microdata is the
compatibility of the samples created over time in different countries due to the lack of
coordination among different national statistical agencies. Nonetheless, Meier et al.
claimed that using IPUMS data in teaching statistics facilitated students’ learning through
real-world data to answer important questions. In addition, due to the nature of the data
being collected across time from countries worldwide, students gained insight about other
countries and developed general global awareness.
In addition to seeking real-world data to incorporate into the teaching of statistics,
research has shown different approaches of implementing real data. One approach is to
ask students to collect their own data (Libman, 2010) and the other approach is to gather
data generated by students enrolled in the class (Neumann, Neumann, & Hood, 2010;
Zeleke & Lee, 2010). Based on a constructivist approach, Libman (2010) integrated real-
life data collection as an alternative teaching strategy to motivate students taking the
control of learning in an introductory statistics course at a teachers college. Students were
informed in the beginning of the semester that they were required to collect data based on
their topics of interest and conduct descriptive statistics analysis. Descriptive statistics, in
general, include topics of graphical display, numerical analysis, and association between
two variables. Students were requested to formulate specific questions they wished to
19
explore from their own data collection based on the statistical tools they had learned from
each topic. The researcher reported that due to its relevance to individual student’s
personal or professional life, the data collected by the students generated meaningful and
countless discussions between students and instructors. Students showed great
enthusiasm to deal with data. Many students went beyond the assignment requirement to
explore their outcomes. Homework assignments were no longer static but full of
challenge, which reflects the true nature of the real-life data analysis. With such a
teaching approach, students became “knowledge producers rather than knowledge
consumers” (p. 14). From student feedback, students reported that they were “using their
minds” when learning the topics and not just “for the exam.” Many students also reported
that they believed they have learned something useful that they could use for the future in
their lives. Although without formal empirical validation, the average grade of the
students showed an increase of more than 0.5 standard deviations higher than the
previous classes.
Neumann et al. (2010) conducted a mixed method study in a university introductory
statistics course to understand how the usage of student data gathered from the students
enrolled in the course affects student engagement in learning. A 17-question survey
including quantitative and qualitative questions was given to approximately 225
behavioral and social science majors in the beginning of the course. Subsequently, data
collected from the survey were used as real-world data to connect students in learning
various statistical topics discussed throughout the entire course. An interview was
conducted in the semester following the course completion. A random sample of 38
students, stratified according to their final grades, participated in the interview and
20
replied to the semi-structured open-ended question “What are your thoughts on the use of
the data gathering survey in the course?” In addition, six questions required a rating, and
questions regarding student demographic information were also gathered to investigate
the effectiveness of the usage of student data in teaching statistics. Results showed that
students surveyed agreed that studying student data created interest in learning statistics,
increased the relevance of studying statistics, and helped them understand statistical
concepts. Moreover, students also agreed that studying student data reduced their anxiety
and increased their motivation in learning statistics.
Incorporating in-class activities generating real data from students in a calculus
based introductory statistics course taught primary to science majors and online activities
developed by Lee and Famoye (as cited in Zeleke & Lee, 2010), Zeleke and Lee
developed lesson plans to enhance conceptual understanding. Four components were
included in each activity: data generation, descriptive data analysis, relating information
from data to statistical model, and making conclusions. Prior to data collection, students
discussed and reached a consensus of data measurement (how to measure hand size, for
instance). After collecting their own data, students worked in groups to make sense of the
adopted statistical process for data analysis. Students made conclusions by comparing
results of their own data with the results from across the nation by accessing to the online
real-time database developed by Lee and Famoye. The survey conducted at the end of the
semester showed that more hands-on activities with data generated from students are
preferred from the students’ perspective.
DePaolo and Robinson (2011) reported a study where real-life data employed in the
introductory business statistics course were generated from an on-campus café shop run
21
by a group of business students from the same college of business. When a submarine
sandwich shop on campus closed the business, undergraduate business students at a
midwestern public university devised an innovative plan to launch a student-run café to
serve clientele in their college of business. This student-run business provided business
students opportunities to apply what they had learned in the classroom about setting up a
business in a real-world phenomenon. In addition, time series data were collected for
students taking the business introductory statistics course to analyze and tie the statistical
results to a business context to deduce strategies and make suggestions to the manager.
Data were collected over 48 days in the spring semester of 2010 from three sources: total
daily sales in dollars, the number of items sold daily for each food item (including soft
drinks, sandwiches, and cookies), and maximum daily temperature. The staff at the café
believed that weather played a role affecting the sales. They believed that when the
weather was cold, people tended not to leave the building and therefore ate at the café.
On the other hand, the sales dropped due to more outdoor activities during the warm
days. The researchers presented examples of how the café data can be used to
demonstrate some basic statistical concepts through time series and forecasting analyses.
An innovative teaching plan of learning through real data is also documented in the
literature. That is, student teachers learned how to design activities for teaching statistics
based on real data. Chick and Pierce (2010) reported an effective and practical approach
to assist student teachers to produce content-related lesson plans with real data. In the
first year of the experiment with a cohort of 27 pre-service elementary teachers enrolled
in the course, student teachers were supplied with a statistically rich and regularly
updated website of a local water company in Melbourne, Australia to identify topics that
22
could be taught using the water storage data. Working in pairs, 13 lesson plans with an
objective of teaching statistics were developed. The results showed that the teachers
failed to see the teaching opportunities and underutilized the real-world data when
forming teaching plans. In nearly half of the proposed teaching plans, student teachers
could not connect the teaching instructions with the original water storage data. Having
learned the lesson from the previous year, the researchers provided an intervention with a
framework of planning questions using the latest results in 2008 Olympic Games to help
the new cohort of another 27 pre-service elementary teachers to identify mathematical
teaching plans prior to the creation of statistical lesson plans with water storage data. In
this workshop of promoting ideas to produce lesson plans, the workshop leader provided
her perspectives of learning opportunities from the latest Olympic results. Student
teachers also discussed and exchanged ideas. With the experience of identifying and
implementing learning opportunities obtained from the workshop, 14 lesson plans using
water storage data and developed by the new cohort showed that the intervention helped
the student teachers to produce more appropriate and content-related statistical lesson
plans with the real-world water storage data.
Technological Tools Implemented in Statistics Courses
One of the GAISE recommendations is to use technology for developing conceptual
understanding and analyzing data. Many researchers have reported on how and what
technologies have been implemented into the design of introductory statistics courses in
response to this recommendation. The use of technology reduces the computational time
so that the instructors can spend more time on teaching conceptual understanding. Using
a graphing calculator is perhaps one of the most commonly applied technologies in a
23
class setting due to its handiness. Tan (2012) conducted an experimental study to
examine if there was significant impact of using graphing calculator as an instructional
approach when teaching topics of probability distribution (including random variable,
Poisson distribution, binomial distribution, and normal distribution) at a private
university in Malaysia. Pre-university students (N = 65) were assigned to either an
experimental group (using a graphing calculator instructional approach) or a control
group (using a conventional instructional approach). Students in each group were
classified as low, average, or high achievers based on their math final exam scores from
the previous semester. A Probability Achievement Test (PAT) was given to all the
participants in both experimental group and control group at the beginning and at the end
of the semester to measure their performance. To ensure consistency, the same instructor
with the only exception of different instructional approach taught both groups. Prior to
the beginning of the study, an independent t-test on the mean math final exam scores
from the previous semester revealed insignificant difference between experimental (mean
= 73.12, SD = 19.874) and control groups (mean = 73.06, SD = 19.733). The results of
the pre-test confirmed further that no significant difference found between experimental
(mean = 1.99, SD = 1.954) and control groups (mean = 2.95, SD = 2.630) with respect to
their math competency prior to the learning of probability. However, post-test results
showed statistically significant higher achievement in experimental group (mean = 75.71,
SD = 5.037) than that in the control group (mean = 42.19, SD = 23.162). The most
remarkable result was that the implementation of the graphing calculators when teaching
probability significantly improved the performance for all the levels of participants
before the study in the experimental group (mean = 77.94, SD = 1.589 for high achievers;
24
mean = 75.45, SD = 5.395 for average achievers; mean = 71.64, SD = 6.785 for low
achievers) whereas no satisfactory learning results were observed in the control group
regardless of the levels before the study (mean = 57.48, SD = 13.358 for high achievers;
mean = 31.29, SD = 24.921 for average achievers; mean = 22.80, SD = 14.933 for low
achievers). In addition to the quantitative results, the researcher also analyzed the
qualitative data through the collection of the journal entries from the participants.
Students' comments made in their journals showed that participants in the group where
graphing calculators were employed interacted with each other more and were
enthusiastic in exploring different methods to solve the problems due to the reduction of
calculation time through the usage of the graphing calculators. In contrast, comments
made from students in the control group showed a negative view of learning probability
as boring. The long process of calculation through the formulas created a passive learning
experience with little interaction among the peers. Tan concluded that the implementation
of the graphing calculators when teaching the topics of probability distribution enhanced
the learning of students at all levels (high, average, and low). It was especially beneficial
to those students who were the average and low-level of achievers. The shortening of the
process of tedious calculation created a student-centered learning environment where
students could actively interact and discuss questions related to the concept.
Due to the importance of students’ capability of making decisions using statistical
results, Shaltayev, Hodges, and Hasbrouck (2010) stressed that there was a need to find
an easy-to-learn software program to handle the computational procedure of the statistical
analysis. Shaltayev et al. claimed that using a learner-friendly software tool reduced the
learning curve during the time of teaching. In the meantime, teaching time can be more
25
effectively used in exploring conceptual understanding instead of spending a substantial
part of the lecture learning the software tool operation. In order to test if the Excel-based
statistical analysis software package VISA (Visual Statistical Analysis) was an intuitive
enough tool, Shaltayev et al. conducted an empirical experiment in spring 2006. In the
experiment, one instructor using the same lecturing materials taught three sections of a
business statistics course. Two of the three sections of the course were taught in a
computer lab whereas the third section was taught in a regular classroom equipped with a
podium computer and a projector. Students participated in the sections where the lectures
were conducted in the lab had a hands-on opportunity to learn the tool while students in
the regular classroom section learned the software tool through instructor demonstration
only. Student grades based on quizzes, homework assignments, tests and a final exam
were used to compare student performance between the two methods. Additionally,
teaching effectiveness was evaluated using the IDEA (Individual Development and
Educational Assessment) student rating system. Results from student grades and IDEA
ratings showed that regardless of the delivery method of the software package (teaching
by providing hands-on opportunities or through demonstration only), both the grades and
the evaluation ratings appeared to be the same between the two teaching methods. Based
on these results, Shaltayev et al. concluded that VISA was an easy-to-learn software
package and there should be no limitations imposed on student learning. Shaltayev et al.
described that the usage of VISA package required very little computer skills except
some basic Excel commends such as copy and paste. Using the VISA package to analyze
statistical data involved answering a series of questions related to the data collected and
the objective of the problem to be addressed. Once these questions were correctly
26
answered, an appropriate statistical test from the VISA package could be selected. The
process of using the VISA package for statistical analysis eliminated the need to
memorize tedious and complicated formulas.
In addition to statistical software packages and graphing calculators, another
commonly used technology taught in tertiary introductory statistics courses to facilitate
conceptual understanding of abstract ideas is the computer simulation. Through the usage
of simulation, abstract concepts such as sampling distributions, regression analysis, and
probability become less challenging. Mills (2005) conducted a randomized experiment on
the concepts related to the Central Limit Theorem (CLT) through a volunteer group of
undergraduate students taking introductory statistics course in a research university.
Students were randomly divided into two groups: traditional group (control group) and
Computer Simulation Methods (CSM) group (treatment group). No statistically
significant difference was found between the two groups on their pre-test results;
however, the post-test results of the CSM group showed a statistically significant higher
achievement than the post-test results of the traditional group (t = 2.35, p = 0.026).
Statistically significant results were also found between pre-test and post-test within the
CSM group (t = 4.3, p = 0.001). These test results indicate the effectiveness of the
computer simulation in enhancing students’ conceptual learning. In addition, the attitude
survey shows that students in the CSM group have more positive attitudes toward their
instructional unit than their counterparts of students in the traditional group. However, the
follow-up test used to evaluate student’s conceptual understanding on CLT over a longer
period of time shows no statistically significant difference between the CSM and the
traditional groups (F = 1.01, p = 3.23). Mills argues that the formulation of concept on a

27
specific topic requires the integration of other related topics and needs a longer period of
time to become mature. The insignificant results may be due to the limited time between
the pre- and post-tests as it takes time to complete the ideas transformation.
Using wikis to promote learning (Ben-Zvi, 2007) is innovative in the field of
statistics education. Ben-Zvi contends that active learning, as suggested in the GAISE
guidelines, can be best achieved through collaboration. Therefore, the collaborative
activities employed through the wikis are suitable to achieve the suggested active
learning. To be in line with the call of statistics reform of emphasizing the learning of
statistics on statistical literacy, reasoning, and thinking, Ben-Zvi proposes the following
activities designed in the wiki environment: interpretations and critique of articles and
graphs; generating a glossary of statistical terms in collaboration for assessing student
statistical literacy; collaborative short essay writing and solving open-ended statistical
problems collaboratively for assessing student statistical reasoning; and collaborative
statistical projects for assessing student statistical thinking. In addition, student personal
diaries can also be designed into a wiki-based environment to help the instructor
understand student’s learning progress. In the meantime, instructors can use that
information obtained from the diary to modify the instruction.
The use of clickers has becoming more popular recently in the educational setting.
Two studies examined the clicker use when teaching introductory statistics. One
examined the use of clickers employed in a large class format (Kaplan, 2011) and the
other examined how the use of clickers might affect student engagement and learning
(McGowan & Gunderson, 2010). Confronting the challenge of fostering active learning
with large class format, Kaplan employed the usage of Personal Response Systems
28
(clickers) in her introductory statistics course to facilitate better student-teacher
interactions. Twelve activities were developed to enhance students’ conceptual
understanding of various topics including sampling, variability, probability models,
sampling distributions, confidence intervals and hypothesis testing. Using large data sets
generated from the large numbers of students (120 students in each lecture), responses
gathered from students’ clickers became a learning asset to assist the conceptual
understanding of statistical inference. Two activities were described in this case study
report to illustrate how clickers were used to engage student’s learning. The Gettysburg
Address activity was designed to address the conceptual understanding of sampling bias
and variability that may occur from samples selected through non-random sampling
methods. Students were asked to estimate the mean word length of the Gettysburg
Address from samples selected using 1) self-determined selection, and 2) technology
generated random number list. The results of students’ respective estimated mean word
lengths were collected via clickers. Charts displayed that although some individual
students could estimate the mean word length quite well through self-selected samples,
the variation of the word lengths collected from non-random self-selected samples for the
entire class was much higher than the variation of the word lengths collected through
random samples from the entire class. Although not covered at the time of this activity,
students were asked to calculate the mean of all the means collected from random
samples. Thus, the concept of sampling distribution was informally introduced. Another
activity involved cell phone usage while driving. The Cell Phone Drivers activity was
based on a scenario that a legislator claimed that the cell phone usage while driving was
reduced to less than 12%. However, while waiting for a bus, a student noticed that 4 out
29
of 10 people drove by were using their cell phones. In this activity, students were first
asked to discuss the qualification of conducting a hypothesis test and realized that the
sampling distribution was skewed due to the smaller sample size of 10 drivers. Thus, the
hypothesis test could not be conducted under this situation. Students agreed to increase
the sample size to 100. Through simulation, a new set of 100 random numbers was
generated to represent the 100 drivers. Since the assumption of the population proportion
was 12%, numbers 1 through 12 represented drivers talking on their cell phone while
numbers 13 through 100 represented drivers not talking on their cell phone. Simulation
results were entered through clickers to form a graph of sampling distribution of the
sample proportions for students to examine the eligibility of conducting a hypothesis test.
McGowan and Gunderson (2010) designed an experiment to explore how the use of
clickers as a pedagogical tool might affect student engagement of learning. The
experiment involved students enrolled in introductory statistics courses from January to
April in 2008 at a large mid-western university in the US and took place during the 90-
minute lab sections taught by a team of 24 Graduate Student Instructors (GSIs). A total of
1197 student data were included for the analysis. Three aspects of student engagement
were considered: behavioral engagement (following the instructions and doing the work),
emotional engagement (interest, values, and emotions), and cognitive engagements (self-
regulation, motivation, and effort). Student learning was measured using validated
instruments including four topic scales (normal distribution, sampling distributions,
confidence intervals, and significance tests) as well as the Comprehensive Assessment of
Outcomes in a first Statistics course (CAOS) from the ARTIST (Assessment Resource
Tools for Improving Statistical Thinking) project. The treatment of the experiment was
30
the “clicker use.” Three components of clicker use that might affect student engagement
and learning were considered: frequency (High, Low), agglomeration (Off, On), and
external incentive (High, Moderate, Low). The number of clicker questions asked during
a lab session defines the frequency as high (at least six clicker questions were asked) or
low (3-4 clicker questions were asked). Agglomeration refers to asking at least 3 clicker
questions consecutively (Agglomeration = On) or clicker questions were dispersed
throughout the session (Agglomeration = Off). External incentive was considered in
terms of tracking student names and assigning grades based on participation (High),
tracking student names but no grades assigned (Moderate), and neither tracking nor
grades assigned (Low). The results showed little evidence that clicker use could affect
student engagement regardless of the aspect of emotion, cognition, or behavior. On the
other hand, however, student learning could be improved if not too many clicker
questions were asked throughout the class session. Results also showed that imposing
external incentive (tracking student names as well as assigning grades) encouraged
students’ participation of clicker use.
Not all the technologies were found useful in enhancing statistics learning. With an
objective of investigating whether the offering of videoed lectures affect students’
learning, Evans, Wang, Yeh, Anderson, Haija, McBratney-Owen, et al. (2007) compared
students’ learning outcomes obtained from the course taught traditionally in Fall 2004
with the outcomes obtained from the course offering distance option that included video
access available for all the students in the course taught in Spring 2005. The researchers
found that the class offering recorded class lecture videos synchronized with PowerPoint
lecture notes did not outperform the class with no recorded videos offered in the previous
31
term. In fact, the exam grades showed statistically significant lower in the class with
recorded videos available than the class with no recorded videos available for the
students (p-value < 0.01).
Social Networking Services Implemented in Teaching
Despite that social networking services have become popular among college
students, the conservative and slowly adopted attitude toward new technology in higher
education has not yet picked up the trend and fully taken the advantage to integrate it into
pedagogic teaching and learning process (Roblyer, McDaniel, Webb, Herman, & Witty,
2010). Roblyer et al. studied the adoption and usage of Facebook between college faculty
and students at a mid-sized, southern public university in the U.S. and found that
Facebook usage for instructional purposes was the least-common use in their practice.
However, perspectives on using Facebook for instruction-related purposes showed quite
different results. While Faculty members considered the technology was not for
education, students were more likely to agree that Facebook was a convenient tool for
education.
College students’ attitude toward the usage of Facebook in learning is not always
the same, though. In the U.K., researchers studied how first-year undergraduate students
at a British university utilized a university Facebook network for transitioning into
university life (Madge et al., 2009). A total of 213 (7%) campus-based first-year
undergraduate students were recruited voluntarily to participate in an online mixed
method study survey conducted over a six-week period in 2008. The results showed that
during the pre-registration period, students utilized Facebook as a means to socially
integrate into university life. Twenty-three percent of the surveyed students continued the
32
adoption of Facebook for social purposes after settling into university life. For some
students, however, Facebook became more of an informal educational network than just a
social network. These students transitioned the usage of Facebook for discussing
academic work on a daily basis with other students (10%) or contacting faculty (1%).
Qualitative results showed that students strongly disagreed that Facebook be utilized as a
tool for formal learning. If Facebook should be used academically, respondents suggested
that it should be used to exchange information about academic-work related matters such
as due dates of the assignments and should not be used in formal learning “involving
formal assessment” (p. 148).
In the U.S., DeAndrea, Ellison, LaRose, Steinfield and Fiore (2012) evaluated how
a campus-only, closed online private social networking site could support freshmen prior
to their arrival on campus. With a hope of easing the transition from high school for
incoming college freshman, a campus-only, closed online private social networking site,
SpartanConnect, was created by the housing department at a Midwestern university to
provide informational resources as well as access to other students, staff, and faculty in
the summer prior to the students’ arrival on campus. To measure the bridging self-
efficacy and academic self-efficacy, the students completed a pre-test survey prior to
their arrival on the campus in the summer and a follow-up survey during the first two
weeks of the semester. The bridging self-efficacy measured the extent to which students
believed that the social sites could bring together students to provide adequate academic
support. The academic self-efficacy, on the other hand, measured academic achievement
from students’ perspectives. A total of 265 freshmen students completed both of the
surveys. Results revealed that although no significant relationships were found between
33
the use of the social networking site and academic self-efficacy, students perceived a
diverse social support network during their first-year at college.
For the sole purpose of understanding specific activities in which students engaged
on social networking sites (SNS) and how those activities developed informal learning,
research at various educational settings took place in different countries. In Israel, a case
study including a total of 47 Facebook and 26 Twitter official accounts registered from
2008 to 2010 by Israeli higher education institutes was conducted for the purpose of
understanding how the use of SNS facilitated informal learning (Forkosh-Baruch &
Hershkovitz, 2012). This empirical exploratory case study examined the extent the Israeli
universities and colleges and subdivisions within these institutes utilized SNS in terms of
content patterns, activity patterns, and interactivity within the SNS accounts. Forkosh-
Baruch and Hershkovitz analyzed the descriptive statistics of the wall messages posted on
Facebook fan pages that were open to the public as well as the tweets in Twitter accounts.
Using content analysis, the researchers further classified all the tweets into categories for
better understanding of how these tweets could facilitate informal learning. Distinction
was found between tweets posted in universities' and colleges' Twitter accounts: The
largest portion (43%) of the tweets posted in universities were discussions of professional
materials not originated by the institutes while the largest portion (34%) of the tweets
posted in colleges were discussions related to social issues. In Facebook accounts, on the
other hand, a significant difference of number of likers was found between pages where
wall discussions could be initiated either by the owner only (X = 177) or by the likers as
well (X = 677). These results, as suggested by Forkosh-Baruch and Hershkovitz, implied
that the higher education institutes should encourage interaction and collaboration in their
34
SNS accounts to promote informal learning. The analysis of the results also revealed that
many SNS accounts were managed as commercial sites rather than focusing on social
interaction. The researchers recommended the SNS sites were operated with sharing
information and discussion in mind to enhance their unique characteristics and the
effectiveness. Even though the overall research findings implied that the potential of SNS
as ways of sharing academic knowledge in higher education institutes had not yet been
established in Israel, the researchers concluded that SNS did promote knowledge sharing
for the purpose of facilitating informal learning within the community.
To assist the educators in developing a more engaging and relevant curriculum for
learners, Greenhow and Robelia (2009) conducted a qualitative study to understand how
a selected group of public high school students and regular MySpace users formed their
identity using this social networking site (SNS). These students were from low-income
families living in a large metropolitan area in the U.S. In addition, the researchers studied
these students' informal learning in SNS focusing on their technological fluency and
digital citizenship, two of the six important competencies expected from students of
twenty-first century. Defined by the International Society for Technology in Education
(ISTE) and Partnership for 21st Century Skills, "technological fluency is the ability to
select and use technology applications and systems effectively and productively,
including the capacity to troubleshoot and transfer learning to new systems as they
develop. Digital citizenship is the ability to practice and advocate online behavior that
demonstrates legal, ethical, safe, and responsible uses of information and communication
technologies” (ISTE, as cited in Greenhow & Robelia, p. 125). For a better understanding
of how participants developed their informal learning through MySpace, data collection
35
involved triangulating multiple sources of data, including interviews, think-aloud, and
content analysis of students' MySpace pages. The results showed that students gained
technological fluency and developed the awareness and responsibilities as digital citizens
during the identity formation process. However, the insufficient understanding of the
copyright issues, for instance, suggested that although students had developed the
concept of digital citizenship, the understanding of the importance of digital citizenship
competency had yet to be fully established. Even though informal learning did occur in
SNS, Greenhow and Robelia claimed that participants did not perceive the connection
between online informal learning and offline classroom formal learning. In particular,
students were not fully taking social sites' advantages for academic and career
networking. Based on these findings, Greenhow and Robelia suggested that new learning
and teaching theories needed to be developed to accommodate and maximize the benefits
learners could get from SNS.
Studies investigating how SNS encourage or prevent students from formal learning
were also documented. Junco (2012) examined the relationship between Facebook use
and student engagement during the Fall 2010 semester at a 4-year public university in the
U.S. A survey was conducted online to all the students (5415) at the university with a
response rate of 44%. The survey included a 19-item engagement scale selected from the
National Survey of Student Engagement (NSSE) instrument for measuring academic and
co-curricular engagement, demographic-related questions, questions regarding a student’s
technology use, and the items measured the Facebook use such as time spent on
Facebook, how often they checked Facebook, and how often they conducted various
activities on Facebook. In addition to the engagement scale obtained from NSSE
36
instrument, time spent preparing for class and time spent in co-curricular activities were
also surveyed as measurements of student engagement. Results showed that while time
spent on Facebook was negatively related to engagement, it was positively related to time
spent engaging in co-curricular activities. Even though time spent on Facebook, in
general, showed negatively related to engagement, a closer look at different activities
involved in Facebook showed that communicative activities such as commenting on
content and creating or RSVP’ing to events were positively predictive of both
engagement scale score and time spent on participating co-curricular activities. On the
other hand, the non-communicative activities such as playing games and checking up on
friends were negatively related to engagement as well as time engaging co-curricular
activities. Finally, a negative relationship existed between the frequency of Facebook
chat and time spent preparing for class. Due to some positive relationship between
Facebook use and student engagement in real-world activities, Junco concluded the study
by suggesting the administrators and faculty adopt the use of Facebook when developing
educational practices that maximize students’ engagement to improve their academic
outcomes.
Through empirical studies, Wodzicki, Scwammlein, and Moskaliuk (2012)
examined how young adults between 19 and 29 years use the German equivalent of
Facebook social networking site, StudiVZ, for informal learning and information
exchange to support their educational learning. Study 1 took place during the four weeks
between October and November 2008. A total of 774 StudiVZ users completed the online
survey. Study 2 was a follow-up, which included 140 university students who
participated in Study 1. In Study 3, the wall postings of a randomly selected group of
37
StudiVZ users were analyzed. Results obtained from all three studies were consistent and
confirmed that young adults use StudiVZ mainly for social interaction with about one-
fifth of the users involved in course-related knowledge exchange. In particular, freshmen
are more frequent users utilized StudiVZ as a platform to exchange information related to
course materials. According to the researchers, this result could be due to freshman not
knowing anyone at the university in the beginning of their college years.
Dabbagh and Kitsantas (2012) described a learner-centered pedagogical framework
to assist college instructors to demonstrate to students how to use social media to create
Personal Learning Environments (PLE) that foster self-regulated learning. Dabbagh and
Kitsantas strongly advocated that social media based PLEs can facilitate both formal and
informal learning. However, to create and manage a PLE that can provide the learning
experience the learner desires needs some training. The learner needs to effectively apply
their self-regulatory skills in order to create a sustaining PLE to incorporate his or her
formal and informal learning needs. According to Dabbagh and Kitsantas, the framework
that assists the learners to create their customized social media based PLEs includes three
levels of interactivity that social media tools provide: (1) personal information
management, (2) social interaction and collaboration, and (3) information aggregation
and management (p. 6). At level 1, the instructors should encourage individual learner to
set up a goal of learning and create a private learning space through social media tools
such as blogs or wikis using self-generating content. At level 2 of the framework, learners
are encouraged to extend their private learning space to a social learning space by
including some basic sharing and collaborative activities to foster informal learning.
Through self-monitoring, learners are prompted to seek more formal learning tasks.
38
Learners at level 3 are encouraged to synthesize information gathered from the previous
two levels to evaluate their overall learning experience.
Instructional Theories Supported in Teaching
Instructional Theories Employed in Statistics Course Design
To be in line with the reform of statistics education, the emphasis of teaching
statistics should be placed on promoting students’ development of statistical reasoning
and thinking (Ben-Zvi, 2007). To achieve this goal, students should be encouraged to
induce deep thinking of the materials learned. However, deep thinking cannot be
developed in a traditional teacher-centered classroom. It can only be developed in a
student-centered environment; Garfield and Ben-Zvi (2009) called this Statistical
Reasoning Learning Environment (SRLE). The SRLE model is developed based on the
constructivist theory of learning as well as Cobb and McClain’s (as cited in Garfield &
Ben-Zvi) six principles of instructional design. Along the line, Lovett and Greenhouse
(2000) promote cognitive theory-based five principles of learning. Although these five
principles of learning describe students’ learning conditions while the SRLE emphasizes
on the design of the learning environment, they are both designed to enhance students’
statistical reasoning, critical thinking, and conceptual understanding; moreover, the
information learned can be retained and transferred to the subsequent class or be applied
to the real world (Garfield & Ben-Zvi; Lovett & Greenhouse).
On the other hand, the theory of collaborative learning is also highly regarded as an
effective method in promoting students’ conceptual understanding of the introductory
statistics courses (Roseth, Garfield, & Ben-Zvi, 2008; Sisto, 2009). Students can develop
their communication skills and practice how to involve in teamwork effectively as the
39
added benefits through collaboration (Roseth et al.). While collaboration among students
in statistics classroom enhances effective learning, collaboration among statistics
educators can, among other things, provide guidance to new teacher by sharing
experiences (Roseth et al.). By doing so, it sustains students’ effective learning in
statistics without the need to sacrifice due to the new instructor’s inexperience in teaching
the course. Roseth et al. urge more research studies on the use of collaborative teaching
in statistics to evaluate its sustainability.
Sisto (2009) employed collaborative learning theory in a tertiary introductory
statistics where students with multi-nationalities learned to effectively communicate
statistical results and consumed statistical information through the usage of collaborative
group projects. The group project consists of three components: a business memo
(interpret the findings to a non-statistician), an appendix (summarize the results to a
statistician), and a PowerPoint presentation (present the process of the project
development, findings as well as the reflections). In addition to the assignment, students
were also involved in assessing their own project (self-assessment) and the project
completed by other groups (peer assessment). Through the collaborative group projects,
students not only learned statistics but also learned how to conduct self-assessment and
peer-assessment, and how to write constructive and specific comments.
Based on experiential learning theory approach, Hiedemann and Jones (2010)
compared the learning outcomes between students participating in academic service
learning (ASL) projects and those who participated in case studies (CS). Specifically, the
goal of the study was to assess students’ mastery of course content through their final
exams and students’ perceptions of the relevance of statistics to their professional
40
development through a survey conducted at the beginning and the end of the academic
terms. The study spanned across three academic quarters in 2008 where ASL projects
were mandated for students to accomplish in four of the six sections of an introductory
business statistics course and CS activities were required for the remaining two sections.
The CS assignments provided scenarios in which student was acted as a statistical
consultant to make a recommendation to a client through available statistical data and
analyses. The ASL project involved actually working with a local farmers market
organization to determine if there was a difference between the prices at the farmers
market and the prices of produce sold at the local grocery stores and co-ops. Both ASL
and CS emphasized real-world applications and interpreting results in layman’s terms.
However, Hiedemann and Jones argued that even though both ASL and CS are built upon
experiential learning models, there are major differences between the two pedagogical
methods. First, while the background of a CS is often unreal or historical, the background
of an ASL is real and current which motivates students with more vivid and engaging
experience. Second, ASL involves direct interaction with people or organizations outside
the classroom, which promotes professional accountability toward the individuals or the
organizations with whom they work. The result is a timely project with better quality.
Finally, ASL projects provide opportunities to serve a broader community. Through the
community service experience, students may view statistics as more relevant to their
professional development and, thus, are more motivated to learn. Results indicated that
although the mean final exam score in the ASL section (79.60) was higher than that in the
CS section (77.02), no statsitically significant result was obtained for the two groups.
Therefore, the study results did not provide evidence that ASL improved mastery of
41
course content comparing with CS. On the other hand, there was a statistically significant
difference between ASL and CS groups with respect to their perceptions of the relevance
of statistics to their professional development. Students’ focus group responses verified
the positive attitudes toward statistics resulting from the participation in an ASL project.
Through focus groups conducted after the completion of the course, ASL participants
evaluated the ASL project as being helpful in course content learning with respect to data
collection, the inclusion or the exclusion of relevant or irrelevant data information, as
well as the communication skills necessary when communicating using non-technical
terms.
Widely used in the field of healthcare professions (Rogal & Snider, 2008; Vittrup &
Davey, 2010), problem-based instructional approaches are extended from experiential-
based instructional approaches (Savery, 2009). Based on a constructivism learning theory
framework called 4MAT system, the faculty at the Cleveland Clinic Learner College of
Medicine (CCLCM) of Case Western Reserve University developed a problem-based
biostatistics course (Nowacki, 2011). The purpose of the redesign was to intrigue
student's interest in learning statistics through connecting the role of statistics to medical
research. The 4MAT system involves a learning process that engages students by
answering four questions: Why? (The motivation for learning), What? (Identifying and
seeking knowledge), How? (Trying out and applying knowledge), and If? (Reflecting
what have learned and extending it to new setting). The Attitudes Toward Statistics
(ATS) post-course survey results showed a statistically significant increase toward
students' perception of the usefulness of statistics comparing with the pre-course survey
results. Students reflected the new design of the course as lively and effective due to its
42
student-centered approach, tremendous amount of student engagement, and its emphasis
on application. Nowacki contributed the students' optimism to the problem-based design
that required students' active involvement in preparation prior to the class as well as
discussion throughout the learning process.
Similar to problem-based learning approach, Lesser and Kephart (2011) described a
case study of the design and implementation of a single lesson plan used on the first day
of class in a graduate-level statistics course for K-12 teachers in the spring 2009
semester. The instructional design of the intervention involved several phases: Initial
individual reflection, small group discussion, whole class discussion, and further
individual reflection. Several important aspects of problem-based inquiry learning
approach from this case study were highlighted: 1) While small group interactions
provide students a low-stress environment to develop understandings through exchanging
their reasoning with the peers in the group, whole-class discussion offers an opportunity
for instructor to verify students' correct understanding and allow the learning community
to build on a common conceptual ground. 2) Problems designed based on open-ended
questions allow students to challenge misconceptions and wonder about implications. 3)
In an inquiry-based instruction environment, both students and instructors are equally
responsible for classroom conversation and knowledge construction. The instructor's role
is both a facilitator and co-learner. Lesser and Kephart concluded that through the
inquiry-based learning approach, students could develop quality thinking and thus, gain
conceptual understanding.
Dhand and Thomson (2009) described a scenario-based approach of teaching
biostatistics to veterinary students at the University of Sydney. The focus was on the real-
43
life problems. Four case studies were designed to teach the topics of hypothesis tests
including one-sample t-test, two-sample t-test with pooled variance, two-sample t-test
with unequal variances, and paired t-test. The approach used for teaching the test of
hypothesis involved the following eight steps: 1) Set the context through the scenario, 2)
Inform the objective of the study, 3) Descriptive analyses: Interpretation of the summary
statistics and the graphical summaries, particularly the boxplots, 4) Hypothesis
specification: Specify the null and the alternate hypotheses, 5) Examine the assumptions
of the significance test, 6) Conduct the actual hypothesis test, 7) Make decisions by
interpreting the p-value and the confidence interval and relating the test results back to
the scenario in context, and 8) Implication: Other examples of similar use of the tests
conducted in journal articles were presented to the students and asked for interpretation
of the test results. An informal questionnaire was administered to a conveniently selected
group of 24 students at the end of the semester to obtain information about students
learning experience with this scenario-based approach and their perceptions about the
course. About 80% of the respondents agreed that the scenario-based pedagogical
approach was easy to follow and helped them to understand the concepts. However,
student perceptions about the usage of learning the course remained low (42%). The
author claimed, nonetheless, that the scenario-based approach was a good start in
teaching statistics but more efforts were required to increase student perceptions about
the applicability of the subject to their professional life.
There has been a concern about the lack of quantitative literacy in the
undergraduate social science students in the UK. To address this concern, the Economic
and Social Research Council (ESRC) in the UK issued several calls for proposals. In
44
response to the calls, Marriott & Davies (2009) designed a pedagogical instruction
utilizing the evidence-based statistical problem solving approach (PSA) to teach statistics
for this group of student population. In PSA, students go through a process of four stages:
plan, collect, process, and discuss. To illustrate how PSA can be utilized in learning
statistics, the authors provided two examples: student accommodation and crime in the
neighborhood. In each example, students were actively engaged in discussing their own
experiences related to the topic. Several questions emerged and led to the conduction of a
questionnaire. In student accommodation, for example, questions such as what type of
accommodation it was, how far the accommodation was from their classes, how much
they paid in rent were included in the survey for descriptive analyses. In particular, one
specific question was developed during the plan stage of PSA: Whether the average
rental was the same for different types of accommodation (living at home, university-
provided accommodation, or private sector accommodation). This specific question
resulted in the introduction and the discussion of analysis of variance (ANOVA).
Similarly, the authors suggested a typical question that can be discussed in the crime in
the neighborhood activity: whether students from different universities would have
different perceptions of crime in their location. Students would then learn the statistical
method of chi-squared test of independence to analyze the data collected from themselves
to answer this question.
Merrill’s First Principles of Instruction Supported in Course Design
Literature documents the implementation of Merrill’s First Principles of Instruction
into course design for online courses (Francom, Bybe, Wolfersberger, & Merrill, 2009;
Mendenhall, Wu, Suhaka, Mills, Gibson, & Merrill, 2006) and staff-training courses
45
(Collis & Margarkyan, 2005; Gardner & Jeon, 2009). When the director of the Center for
International Entrepreneurship at Brigham Young University – Hawaii proposed an
online course in entrepreneurship for non-business majors, the staff at university’s Center
for Instructional Technology and Outreach listened and implemented Merrill’s task-
centered instructional strategy in the course design. With the task-centered instructional
strategy approach, the final exam of the course included an analysis of a new whole task.
Out of the 12 students took the final exam, more than half (seven students) of the students
received a grade of A or B with four students receiving a C and one student receiving a
D. Students expressed overall satisfaction with the course design. The researchers
concluded that the task-centered instructional strategy appears to be effective in teaching
students who have no previous experience about entrepreneurship (Mendenhall et al.,
2006).
For a purpose of offering more online classes with effective teaching and increasing
students responsibility of learning, staff at Center for the Improvement of Teaching and
Outreach (CITO), Brigham Young University - Hawaii (BYU - Hawaii) underwent a
major revision of instructional strategies. Francom et al. (2009) introduced a redesign of a
general education course, Biology 100, implementing Merrill's First Principles of
Instruction with a task-centered approach in summer 2008 with 89 students in two
classes. The redesign involved students' active participation in pre-class, in-class, and
after-class activities. Prior to the class, students were assigned to read the task and the
related materials in the book that would be used to solve the task. When students came to
the class, the instructor first demonstrated how to solve that task using the materials
students had previously read from the book, followed by a group discussion on a new
46
second task. The third task assigned as a homework assignment after the class was to be
worked individually. Individual student posted his/her response to the third task within
his/her own group to exchange ideas. All the students from the same group then
collaborated on a group response and submit the completed third task to the instructor. A
post-course survey showed that more than three-fourths (76%) of students enjoyed the
new teaching strategy of being able to take their own learning responsibility and apply
materials learned from the class to complete more relevant real-world tasks. Course
instructor's confirmed this finding through informal class observations of active group
discussion about the task.
In a cooperate setting, Collis and Margarkyan (2005) reported how they
incorporated and extended Merrill's First Principles of Instruction into a course designed
for workplace learning at Shell Exploration and Production (Shell EP). Thus, Merrill Plus
was developed to reflect the specific corporate context for a business setting. In their
version of Merrill Plus, six aspects were added in addition to the original five principles
of instruction: Engaging in real-world problems, activating existing knowledge as a
foundation for new knowledge, demonstrating new knowledge to the learner, applying
new knowledge by the learner, and integrating new knowledge into learner's world. In the
context of Shell EP, the six added aspects to Merrill Plus were collaboration, learning
from others, supervisor support, technology support, re-use, and differentiation. Collis
and Margarkyan suggested that each organization should work out on its own version of
Merrill Plus by retaining the original five First Principles of Instruction and adding
aspects relevant to its own practices.
47
Gardner and Jeon (2009), on the other hand, described the obstacles instructional
designers encountered when redesigning a staff-training course employing Merrill’s First
Principles of Instruction to replace the original one-day face-to-face training given by the
subject matter experts (SMEs) at Utah State University. The training course was to
provide information on using a collegiate administrative suite Banner. Since the original
training course focused solely on introducing Banner’s functions rather than
demonstrating and applying to real-world problems, it was found ineffective in
performing complex tasks. Although the redesigned training course was found more
effective than the original training course, it was not accomplished without encountering
obstacles in the process of redesigning the course. The major obstacle encountered, as
reported, was the difficulty that the subject matter experts (SMEs) had when producing
examples of real-world tasks due to SMEs’ lack of knowledge relating what a real-world
task is. Another obstacle of designing the new training course was that it was time
consuming when designers embedded technology solutions, such as Encoding Flash and
HTML, into the design.
Although Merrill’s First Principles of Instruction could be employed in the
instructional design to improve the course, do they improve student learning? Frick,
Chadha, Watson, and Zlatkovska (2010) designed an empirical study to answer this
question. A course evaluation instrument used to measure teaching and learning quality
(TALQ) was developed for students to evaluate if Merrill’s First Principles of Instruction
is included in the teaching of the course (Frick, Ghadha, Watson, Wang, & Green, 2009).
TALQ also evaluates student’s own Academic Learning Time (ALT). Traditionally,
when ALT is reported to occur during the learning process, student experiences positive
48
learning results. The survey was administered during the fall 2007 semester at a large
Mid-western university. A volunteer sample of 464 students in 12 different courses
taught by eight different instructors filled out the paper form of TALQ. Instructor ratings
of student mastery (level of achievement of course objectives) in the course were
independently reported after the completion of the semester. The results showed that
when students agreed that First Principles of Instruction were employed in class, those
same students were more likely to report their positive experiences of ALT. Moreover,
instructors were more likely independently rated those who reported positive experiences
of ALT with high ratings of course mastery. The implication of the results, according to
the researchers, is that the tasked-centered instructional strategy promotes student
learning.
Summary
Chapter two included an overview of the research literature informing the
instructional theory of Merrill’s First Principles of Instruction supported in course design.
An overview of the strategies applied in the instructional design when teaching
introductory statistics at the tertiary level was also presented. The strategies include the
implementation of the real-world examples, implementation of technological tools, and
the incorporation of instructional theories. In addition, a review on social networking
services employed in academics was provided for an overall understanding of how the
usage of social networking services affect student formal and informal learning in an
academic setting.
49
Chapter 3
Methodology
Research Methodology
With the aim of understanding how integrating technology and real data into a
tertiary level statistics course affect students’ statistical literacy, reasoning, and thinking,
a case study research design was employed. Merrill’s First Principles served as the
guiding framework for the instructional design.
When the study of interest is to understand cognitive or affective aspects of learning
process, the inherent limitations due to its social or behavioral nature prevent the
researchers from quantitatively measuring the results. Qualitative research methods, on
the other hand, could unearth subjects’ thinking through open dialogues such as
interviews or online postings to produce a rich description of participants’ thinking (Gal
& Ograjensek; Groth, 2010). Therefore, qualitative research, specifically, a descriptive
case study design was employed to describe how applying First Principles can have an
impact on learners’ degree of thinking statistically.
Descriptive Case Study
Traditionally, the case study has not been treated as a formal research method but
merely a preliminary study of some other type of research method for the sole purpose of
exploring the investigation (Yin, 2009). However, Yin (2009; 2012) stressed the
permissibility of using case studies to not only process but also document and analyze the
implementation. Case studies emphasize the connection between a real-life phenomenon
50
and its context. The inclusion of contextual conditions is necessary for a thorough
understanding of a phenomenon. According to Yin (2009), three conditions need to be
considered for the selection of an appropriate research method: a) the type of research
question posed, b) the extent of control an investigator has over actual behavioral events,
and c) the degree of focus on contemporary as opposed to historical events (p. 8). Case
studies ask “how” and “why” questions. Specifically, the portrayal of what happened in a
particular case leads to a descriptive case study (Yin, 2012). As much as an experiment
relies on the manipulation of participants’ behaviors, a case study relies on multiple
sources of evidence due to its lack of control of behavioral events. Case studies, unlike
histories, focus on contemporary events. In this case, the goal was to understand how the
implementation of Merrill’s First Principles of Instruction could affect students’
development of statistical thinking. In particular, the study described what happened to
students’ cognitive development when learning tertiary level introductory statistics.
Therefore, a descriptive case study design was suitable.
In designing case studies Yin (2012) suggests these three steps: Defining a case,
selecting one of four types of case study designs, and using theory in design work. Based
on these three steps, the following process was adopted to answer the research questions:
1. Defining a case: The case is also called a unit of analysis. Once the case is
properly defined, it is desirable to set up the time frame of the case study.
This case includes the students enrolled in one section of a blended tertiary
level introductory statistics course at a two-year community college in
Greater Los Angeles area in Spring 2013 for duration of one semester (from
February 4 to June 3, 2013).
51
2. Selecting one of four types of case study designs: The four types of case
study designs are holistic single-case design, embedded single-case design,
holistic multiple-case design, and embedded multiple-case design.
According to Yin (2009), a single-case study is an appropriate design when
testing a well-formulated theory. This single case is considered to be a
critical case. Since the study was to test the impact of the well-devised First
Principles of Instruction on a student’s learning, an embedded single-case
study design was implemented. Represented as a form of mixed methods
design, embedded case design allows surveys or other research methods to
be embedded within the single case study design for collecting quantitative
data. While the unit of analysis was the class, the embedded subunit of
analysis was the individual student in the class. The embedded survey
employed teaching and learning quality (TALQ) instrument (Frick et al.,
2009; 2010) for evaluating the teaching and learning quality of the designed
instruction from student’s perspective (Appendix A). The instrument was
slightly modified to suit the study. A list of modification is illustrated
below.
• Two questions were removed from Part 1 of the survey. One question
was related to participants’ academic classification in terms of freshman,
sophomore, junior, senior or a graduate student. The other question was
about the course delivery modalities (online, hybrid, or face to face).
• A slight change of the wording of Question 15 in Part 2 of the survey
was made to reflect the specific technology used in the course. The
52
original question was stated as, “The media used in this course (texts,
illustrations, graphics, audio, video, computers) helped me to learn
instead of distracting me”. The question was modified into, “The
technology used in this course (online homework, online discussion
platform, StatCrunch) helped me to learn instead of distracting me.”
• A change of wording was made on Question 33 in Part 4 of the survey to
reflect the specific coursework participants were learning. The original
wording of the question was, “Assignments, tasks, or problems I did in
this course are clearly relevant to my professional goals or field of
work.” The modified version of the question was, “Assignments, tasks,
or problems I did in this course are helping me to develop the skills of
thinking statistically.”
3. Using theory in design work: It is vital to develop some theoretical
propositions or theory during the case design phase. The theory
development provides a blueprint for data collection. With a preliminary
theory, the researcher could build and challenge this initial theoretical
perspective. However, one should be cautious with this approach. On one
hand, the theoretical perspective could guide the researcher in data
collection. On the other hand, it could also limit the ability to discover new
theories. Therefore, the researcher needs to practice with great care. Work
with the initial perspective and at the same time, be prepared to modify or
even abandon it after the first round of data collection. Since the study is to
understand how First Principles of Instruction could affect students’
53
learning of introductory statistics, the initial theoretical proposition was set
as the following: The impact of First Principles of Instruction on a student’s
learning is positive. The proposition remained unchanged throughout the
entire study.
Course Design
In order to understand how the implementation of First Principles of Instruction can
affect a student’s learning of tertiary level introductory statistics course, instructional
instances on the topics of an introductory statistics course were designed following
Merrill’s (2007) prescriptions for creating task-centered instruction. Materials covered in
the entire course were arranged into five topics: Data Collection, Descriptive Statistics
(including Regression Analysis), Probability & Probability Distributions, Sampling &
Inferences on Population Means, and Sampling & Inferences on Population Proportions.
To avoid the frustration of using new tools such as StatCrunch and Etudes (Easy-to-Use-
Distance-Education-Software), an online discussion board, modules of trainings on
StatCrunch and Etudes were included in the first week of the 16-week course along with
the first course topic of Data Collection. The contents of the instructional instances for
topics of Descriptive Statistics (including Regression Analysis), Sampling & Inferences
on Population Means, and Sampling & Inferences on Population Proportions were
derived based on Gould and Ryan’s (2013) textbook and posted on weekly modules on
the official course website Etudes. Due to time limitation, no instructional instances and
projects were designed for the topics of Data Collection and Probability & Probability
Distributions. The contents of these two course topics were from Sullivan’s (2010)
textbook. Table 1 summarizes the course design for the study.
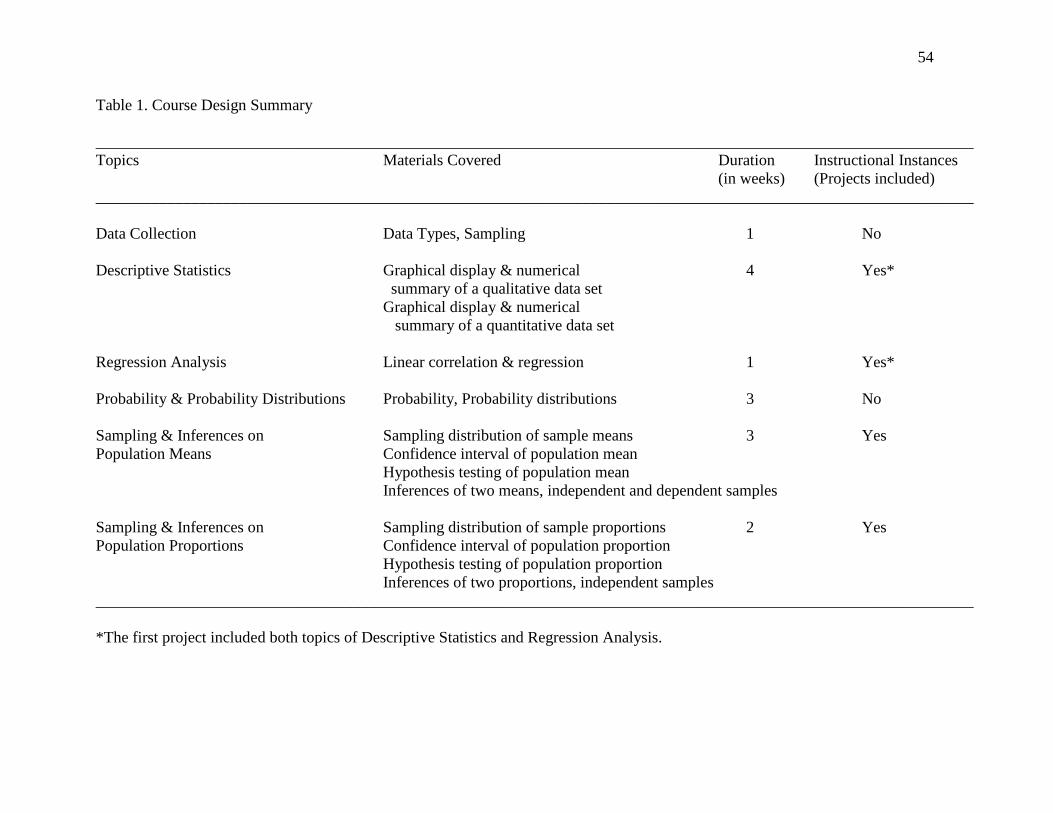
54
Table 1. Course Design Summary
______________________________________________________________________________________________________________ Topics Materials Covered Duration Instructional Instances
(in weeks) (Projects included) ______________________________________________________________________________________________________________ Data Collection Data Types, Sampling 1 No Descriptive Statistics Graphical display & numerical 4 Yes*
summary of a qualitative data set Graphical display & numerical summary of a quantitative data set
Regression Analysis Linear correlation & regression 1 Yes* Probability & Probability Distributions Probability, Probability distributions 3 No Sampling & Inferences on Sampling distribution of sample means 3 Yes Population Means Confidence interval of population mean Hypothesis testing of population mean Inferences of two means, independent and dependent samples Sampling & Inferences on Sampling distribution of sample proportions 2 Yes Population Proportions Confidence interval of population proportion Hypothesis testing of population proportion Inferences of two proportions, independent samples ______________________________________________________________________________________________________________
*The first project included both topics of Descriptive Statistics and Regression Analysis.
55
Participants
Thirty-nine students were pre-enrolled into a blended tertiary level introductory
statistics course taught by the researcher at a two-year community college in Greater Los
Angeles area prior to the start of the semester in Spring 2013. Of the 39 pre-enrolled
students, seven students failed to show up for the first class meeting and hence were
dropped from the class. Eight walk-in students were added to the class on the first class
meeting day. Out of the total 40 enrolled students, 30 consented to the study. Total
enrollment dropped to 21 students three weeks into the semester. By the time the first
project was due (the fifth week of the semester), 15 students remained in class. The
semester ended with eight students actively involved in class participation including the
interviews and final assessment. Two students, although officially enrolled in the class by
the end of the semester, ceased participating in class discussion weeks before the end of
the semester.
Those who did not consent to the study dropped the course at early stages of the
study and their postings were not included for data analysis. Even though 30 students
consented to the study, nine of them never participated in class discussion and were
dropped prior to the fourth week of the semester. Overall, data were collected from a total
of 21 students. Of these 21 participants, eight participated in the semester end open-ended
interview, TALQ survey and the final CAOS assessment. Traditionally, the retention rate
is relatively low in this college due to its disadvantaged socioeconomic background.
Hence, this high attrition rate is typical for this online hybrid introductory statistics
course.
56
Data Collection
Guided by the study’s initial theoretical proposition, four sources of evidence were
used for data collection: postings from the online discussion forum, an end-of-course
comprehensive assessment, open-ended interviews, and the TALQ (teaching and learning
quality) survey. An informed consent (Appendix B) was collected from the participants
prior to data collection. The following describes the four types of data that were collected
throughout the study.
1. Online discussion forum data. Postings from the online discussion forum including
weekly discussions and three projects were collected and analyzed.
2. Comprehensive assessment. The level of mastery of course objectives (the mastery
of statistical literacy, reasoning, and thinking) was assessed independently using a
modified version of Comprehensive Assessment of Outcomes in a first Statistics
Course (CAOS) test instrument (delMas, Garfield, Ooms, & Chance, 2007) at the end
of the semester. The letter of permission to use CAOS test instrument for the study is
in Appendix C.
3. Open-ended interviews. Eight interview questions with different scenarios of the
same level of difficulty were designed for the open-ended interviews conducted at the
end of the semester to eight actively participated students. An interview question was
randomly selected and assigned to each participant to assess their statistical reasoning
and thinking capabilities. Each interview question consisted of two parts. Students
were asked to complete the first part of the interview before receiving the second part
of the interview question. Appendix D shows an example of interview questions. To
alleviate participants’ anxiety, which may directly affect the performance, interviews
57
were conducted in writing using the discussion forum instead of orally. Eight
discussion forums, each designed exclusively for each participant, were created for
replying the interview questions. Since the scenarios were similar to what the
participants had practiced regularly in weekly discussions and projects, no further
explanations regarding the given scenarios and questions were provided at the time of
the interviews. This procedure also helped to avoid bias. However, prior to the
interviews, participants were reminded to “think aloud” when responding to the
questions. Follow-up questions, such as “What do you mean by …?” were prompted
whenever necessary immediately after the submission of each part of the interview
questions for clarification. Specifically, students were asked to use the think-aloud
method to perform the following tasks during the interview:
a. In part one, participants were asked to describe the appropriate statistical
analysis process that should be employed in order to answer the statistical
question given in the scenario.
b. In part two, based on the given scenario, a statistical analysis printout from
StatCrunch was shown to the participant. The participant was asked to
make a conclusion and interpretation according to the printout (Appendix
D).
This think-aloud interview process enabled the researcher to capture the students’
cognitive process of whether the phenomena of thinking and reasoning statistically
occurred, and if they did occur, how accurate or inaccurate the process was when
solving a statistical problem. Specifically, part one of the interview questions
assessed student’s statistical thinking capability while part two of the interview

58
questions assessed student’s statistical reasoning capability. Statistical literacy related
to basic statistical skills was assessed in the entire interview process through the
students’ responses.
4 TALQ instrument. The TALQ survey including the following student self-reported
nine scales was administered at the end of the semester: academic learning time
(ALT) scale, learning progress scale, learner satisfaction scale, and Merrill’s five-
principle scales including authentic problems scale, activation scale, demonstration
scale, application scale, integration scale, and Pebble-in-the-Pond approach scale. As
suggested by Frick et al. (2009), TALQ scales can serve as a baseline for course
evaluation to accompany objective assessments of student learning comprehension
(statistical literacy, reasoning, and thinking in this case). The results of the assessed
mastery of course objectives were compared with the self-reported level of mastery of
course objectives obtained from the TALQ survey. To avoid response bias, a
colleague administered the survey and kept the survey results in a sealed envelope.
The participants were informed prior to the survey that the access to the survey results
was made unavailable to the researcher until the completion of grade submission.
Reliability and Validity
The quality of a research study can be established through the rigor of construct
validity, internal validity, external validity, and reliability (Yin, 2009). Internal validity is
irrelevant to descriptive studies since it seeks to establish causal relationships for
explanatory studies only (Yin). Each one of the other three tests, namely, construct
validity, external validity, and reliability is defined and described with respect to the
study as follows.
59
Construct Validity
According to Kiddler and Judd (as cited in Yin, 2009), construct validity clearly
identifies the operational measures that gauge the concepts being studied. Case studies
risk the reputation of making subjective decisions for data collection due to the lack of
properly defined operational measures. To handle this issue, Yin (2009) recommends
using multiple sources of evidence including, but not limited to, documentation, archival
records, interviews, direct observations, participant-observation, and physical artifacts.
The essence of using multiple sources of evidence in case studies is to establish construct
validity through data triangulation. The approach of applying various types of evidence in
data collection is to ensure the coverage of a broader range of issues, and more
importantly, to converge lines of inquiry (Yin). Validity can be confirmed when data
have been triangulated, sources of evidence are corroborated and convergent consistently
to one conclusion (Tellis, 1997).
However, the challenge of collecting multiple sources of evidence is not limited to
more costly and time consuming, rather, the know-how of all the techniques required
prior to data collection. Yin (2009) warns that the improper usage of data collection
techniques could render a failed validity construct. Yin suggests different ways of gaining
experiences of conducting case studies. One of them is to practice data collection
techniques through the design of pilot studies. Another recommendation to increase the
construct validity of a case study is to maintain a chain of evidence in such a way that an
external observer should be able to follow the steps either from initial research questions
to final conclusions or from conclusions back to initial research questions through the
evidence presented in the report (Yin).
60
To ensure the construct validity of the study, evidence was collected through
various sources including the online discussion postings, a comprehensive assessment,
open-ended interviews, and the TALQ survey. Data were triangulated to form convergent
lines of inquiry. The researcher maintained a chain of evidence after data collection. A
pre-test study of the teaching examples and homework assignments were conducted for
the purpose of refining the instructional design prior to implementation with the target
population. According to Yin (2009), a pre-test study is a rehearsal prior to the formal
data collection to ensure that the entire data collection plan will be carried out
accordingly. In the study, real tasks were created through online social networking sites
for designing task-centered teaching examples and assignments. The suitability of the real
task design was tested and refined through the pre-studies conducted in two face-to-face
tertiary level introductory statistics courses in the fall semester of 2012.
External Validity
External validity defines “the domain to which a study’s findings can be
generalized” (Kidder & Judd, as cited in Yin, 2009, p. 40). A common misunderstanding
about the generalizability of case studies is that the results of a case study cannot be
generalized beyond the immediate study. More often than not, the generalization refers to
the statistical generalization. While statistical generalization is not possible for case
studies, analytic generalization is possible for replicating the procedures in another case
or cases. That is, a broader theory can be generalized through replicating using multiple-
case designs (Yin, 2009). Although the current study is a single-case designed study, the
external validity can be established through the replication of the study in different cases
(classes).
61
Reliability
Reliability focuses on repeating the same case and obtaining the same results as the
previous study. The goal of striving for a high level of reliability is to reduce the chances
of erring and to prevent the bias in data analysis (Yin, 2009). To address the
establishment of the reliability of a case study, Yin recommends that case study
researchers create a formal and presentable case study database. The sources of evidence
should be organized for easy retrieval by other investigators so that the written case study
report would not become the sole source for reviewing the evidence. During the process,
the evidence obtained from various sources should remain intact. Twisting or imposing
biases on the evidence should be strictly avoided. In addition, the loss of original
evidence through carelessness should be strictly prevented. To increase the reliability, a
case study database was created to organize the data collected from the four data sources.
Data Analysis
Both quantitative and qualitative data were collected. Focus should not be placed on
either type of data alone. Rather, one should look for the convergence of information
through reviewing and analyzing data collected from different sources (Yin, 2009). Case
study analysis is not easy due to its lack of fixed formulas to guide the process (Yin).
Nonetheless, Yin describes four general analytic strategies (replying on theoretical
propositions, developing a case description, using both qualitative and quantitative data,
and examining rival explanations) and five analytic techniques (pattern matching,
explanation building, time-series analysis, logic models, and cross-case syntheses) for
analyzing case study data.
62
Two strategies are relevant here, namely, using both qualitative and quantitative
data and relying on theoretical propositions. When quantitative data are played in a
supportive role in a case study where qualitative data remain central to the entire study,
the analytic strategy of using both qualitative and quantitative data becomes a powerful
way to guide the analysis (Yin, 2009). The strategy of relying on theoretical propositions
is to follow the hypothesized theoretical propositions set up in the beginning of the study.
The proposition helps to organize the entire case study by focusing attention on the
relevant data collected for the study. This strategy is especially useful with respect to the
theoretical propositions originating from ‘how’ questions (Yin). The goal was to
understand how First Principles of Instruction could affect students’ learning of
introductory statistics. Hence, it was suitable to apply the strategy of relying on
theoretical propositions in analyzing the case study data.
Among the five analytic techniques, pattern matching is the most relevant in this
case. The technique of pattern matching is based on matching-the-pattern logic when
comparing an empirical pattern with a predicted one (Trochim, as cited in Yin, 2009).
Yin claims the suitability of using pattern-matching technique in a descriptive case study
with an emphasis that the predicted pattern of the studied variables should be defined
prior to data collection. Based on the initial proposition that the implementation of First
Principles of Instruction has positive impact on students’ learning, the pattern-matching
analytic technique was used to compare the predicted positive outcomes with the actual
students’ learning outcomes. Through the coded qualitative data as well as the
quantitative data, the question of the establishment of initial proposition was answered
through matching the pattern analytic technique. Theoretically, if the observed outcomes
63
are as predicted, a solid conclusion about the positive effects of First Principles of
Instruction can be drawn. On the other hand, if the results fail to follow the entire
predicted pattern, then the initial proposition is considered to be questionable. The
qualitative data collected from online discussions and interviews along with the
quantitative data obtained through the TALQ survey and comprehensive assessment were
used to deduce a theoretical proposition that either supports or disapproves the
hypothesized theoretical proposition established in the beginning of the study.
Quantitative Data Analysis
The TALQ survey included a total of 48 items. Among them, three items were
related to course demographics – class rating (a 10-point Likert scale with 10 being
outstanding and 1 being poor), expected grade, and self-reported course mastery (a 10-
point Likert scale with 10 being high master and 1 being low master). Individual self-
expected grades for the final eight participants were reported. Descriptive statistics
including mean and standard deviation scores for class rating and self-reported course
mastery score were calculated.
The remaining 45 TALQ survey items including 37 items of nine TALQ scales,
three global rating items, and five miscellaneous items were scattered randomly
throughout the instrument. A five-point Likert scale was used for each item with 5
indicating “strongly agree” and 1 indicating “strongly disagree.” The nine TALQ scales
are Academic Learning Time (ALT) scale (5 items), learning scale (5 items), learner
satisfaction scale (4 items), First Principles of Instruction – authentic problems scale (5
items), First Principles of Instruction – activation scale (5 items), First Principles of
Instruction – demonstration scale (4 items), First Principles of Instruction – application
64
scale (3 items), First Principles of Instruction – integration scale (5 items), and First
Principles of Instruction – Pebble-in-the-pond approach scale (1 item). Modified from
Frick, Chadha, Watson, Wang, and Green (2008), the TALQ survey with items arranged
by the nine TALQ scales is listed in Appendix E.
Descriptive statistics including mean and standard deviation scores for each scale of
the TALQ survey were calculated. The mean and standard deviation of ratings for each
scale were found based on the ratings obtained from eight participants. The individual
participant’s rating for each scale was first computed by finding the average of the ratings
of the related survey items. For example, five items were related to Academic Learning
Scale. Harry (Pseudonym is used) rated five items related to Academic Learning Scale as
4, 5, 4, 4, and 5, which gave an average of 4.4. Likewise, the average ratings of
Academic Learning Scale for the other seven participants were: 4.6, 3.6, 4.4, 5.0, 4.0, 4.2,
and 4.2. Using these eight ratings from the participants, the mean and standard deviation
of Academic Learning Scale rating were then computed.
Nine TALQ survey items were negatively worded to ensure the internal consistency
of the responses. No conflicts of item agreement/disagreement were detected. Therefore,
no items were excluded from data analysis. The rating for negatively worded items was
recorded reversely before averaging out with the other related survey items.
The comprehensive assessment CAOS test used to objectively assess students’
mastery of the course was given at the end of the study. Summary statistics including
mean and standard deviation of CAOS test scores were computed. In addition, linear
correlations among nine TALQ scales, learner satisfaction scale, class rating, global
rating, self-report course mastery scores and objectively assessed course mastery scores
65
(CAOS) were first examined through scatterplots to detect the linear pattern. The linear
correlation between each pair of two variables was then quantified through the use of
Pearson correlation coefficient (r) and reported.
Qualitative Data Analysis
Content analysis was conducted on the discussion forum postings including
weekly discussions and topical projects, and the interview data for gaining an
understanding of students’ cognitive development of thinking statistically. Content
analysis is a type of qualitative research analysis method that analyzes documents
involving vast amount of textual data through comparing the similarities and contrasting
the differences for a purpose of finding patterns and understanding the trends in
communications (Burnard, 1996; Elo & Kyngäs, 2007; Harwood & Garry, 2003). The
aim is to categorize the key issues in data (Burnard). In particular, content analysis is
most useful in capturing the cognitive development in an online learning environment
(Gerbic & Stacey, 2005). Elo and Kyngäs mention two types of content analysis:
inductive content analysis and deductive content analysis. The inductive way is preferred
when there is lack of former knowledge dealing with the phenomenon or when the
knowledge is fragmented. On the other hand, the deductive approach is recommended
when testing a previously developed theory in a different context. The deductive
approach of content analysis is was relevant in this case since the goal was to test how the
course design based on First Principles of Instruction can facilitate tertiary-level students’
conceptual understanding when learning introductory statistics.
Three phases are involved in content analysis: preparation, organizing, and
reporting (Elo & Kyngäs, 2007). The preparation and organizing phases are presented in
66
this section while reporting phase is presented in the Presentation of Results section. The
preparation phase begins with the selection of the unit of analysis followed by the choice
of unit of meaning (Elo & Kyngäs; Graneheim & Lundman, 2003). According to
Graneheim and Lundman, the most suitable unit of analysis is the whole interview while
a meaning unit can be defined as words, sentences, or paragraphs that are related to a
central meaning. Four course topics, descriptive statistics, regression analysis, sampling
and inferences on population means, and sampling and inferences on population
proportions, were discussed in the discussion forums for the entire period of study. The
unit of analysis of the online postings is the entire course topic of each individual
participant. The unit of meaning is each posting posted by each individual participant.
The specific steps for analyzing online postings involved in the preparation phase are as
follows:
1. Since online postings were stored permanently on the online learning
management system, Etudes, transcribing was not required. Transcripts of online
postings were downloaded after the completion of each course topic discussion.
Take the discussion topic of descriptive statistics as an example, the online
postings related to the topic including weekly discussions and a topical project
along with participants’ critiques were downloaded and saved in one file.
2. To protect the privacy of the participants, real names were removed and
pseudonyms were randomly assigned before coding.
3. Each posting within the same file was numbered according to the assigned
pseudonym alphabetically for random sampling in later organizing phase.
4. Two copies of each file were prepared for the two coders for coding.
67
Next in the organizing phase, the content analysis process consisted of three core
elements: coding the data, organizing the data, and testing for reliability and validity
(Hardwood & Gary, 2003). Prior to the coding, the researcher read through the data as
many times as necessary for the purpose of making sense of the data and obtaining an
overall feel of the data (Burnard, 1996; Creswell, 2008; Elo & Kyngäs, 2007). When a
deductive content analysis was chosen, as was in this study, a structured categorization
matrix determined from literature reviews was developed prior to the coding. An example
of such matrix is shown later when summarizing the organizing phase for analyzing
online postings. Only aspects that fit the predetermined categorization were chosen for
coding (Elo & Kyngäs; Hardwood & Gary). Content analysis is frequently criticized by
its bias stemmed from the researcher’s subjectivity. To overcome the judging bias,
training in coding is necessary. To increase the reliability and validity of the research
findings, measures of reliability should be computed and reported (Hardwood & Garry,
2003). When measuring the reliability of coding, one should start with intra-rater
reliability (the coder agreeing with oneself over time), followed by inter-rater reliability
(two or more coders agreeing with one another) (De Wever, Schellens, Valcke, & Keer,
2006; Hardwood & Garry). Two coders were recruited and each coder was paired with
the researcher to assist with the coding. In particular, coder #1 was paired with the
researcher (coder #2) in coding the weekly discussions and the topical projects of
Descriptive Statistics and Regression Analysis, and the interview data. Coder #3 was
paired with the researcher (coder #2) in coding the remaining two topics of Sampling &
Inferences of Population Means and Sampling & inferences of Population Proportions.
The organizing phase for analyzing online postings is summarized as follows:
68
1. Each coder read through the transcripts for each course topic covered in the study
until an overall sense of the data was obtained.
2. The researcher (one of the coders) developed a categorization matrix for each
course topic covered in the study to evaluate student’s conceptual understanding
learned from each topic. As an example, the conceptual understanding of the topic
of descriptive statistics focused on shape, center, variability, and unusual/extreme
values for quantitative data sets, and typical outcomes and variability for
categorical data sets (Gould & Ryan, 2013). Table 2 displays a categorization
matrix that was used to understand students’ conceptual learning on the topic of
descriptive statistics. Each coder followed the established coding scheme when
coding the online postings (Appendix F). That is, if the discussion of “skewness”
or “symmetry,” for instance, were not mentioned in describing the shape of the
distribution of a quantitative data set, the student’s concept of the shape of the
distribution is considered to be vague and weak. On the other hand, if a specific
shape of the distribution, a bimodal skewed distribution, for example, can be
deduced from a categorical data set, it is equally considered as lack of conceptual
understanding of the shape of the distribution since there is no certain ordering of
categories in categorical data set. Hence, this fact renders the discussion of the
shape of the distribution meaningless (Gould & Ryan).
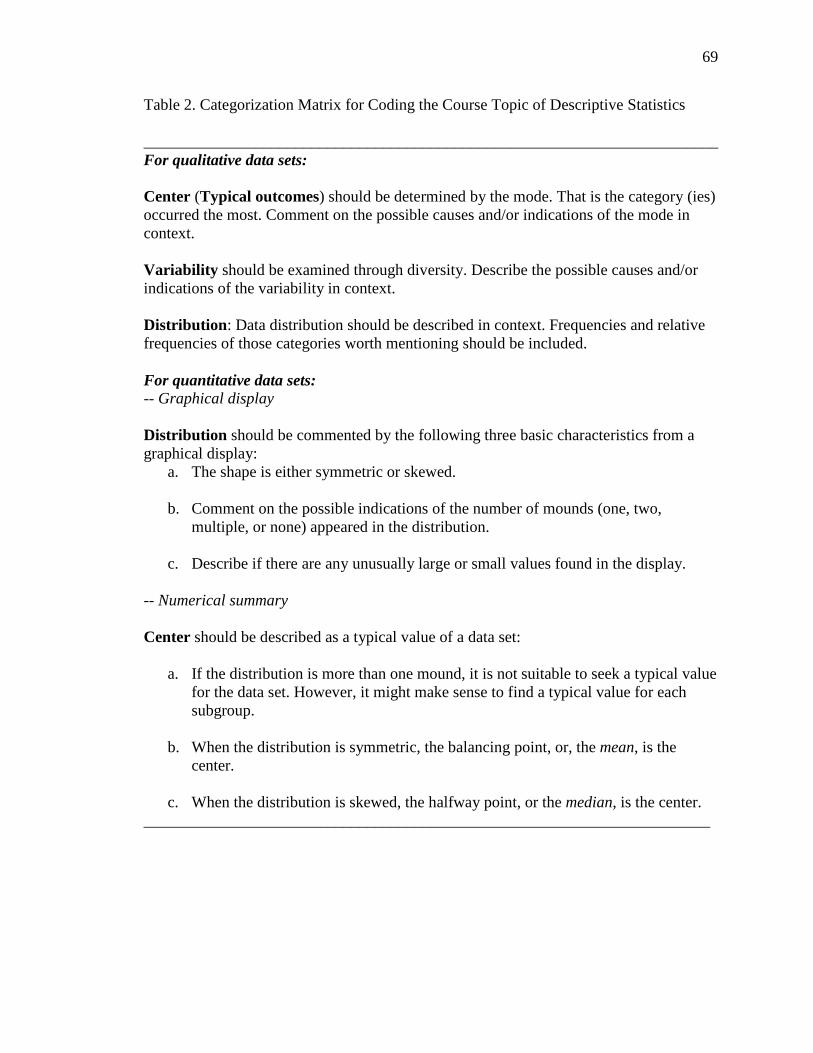
69
Table 2. Categorization Matrix for Coding the Course Topic of Descriptive Statistics
________________________________________________________________________ For qualitative data sets: Center (Typical outcomes) should be determined by the mode. That is the category (ies) occurred the most. Comment on the possible causes and/or indications of the mode in context. Variability should be examined through diversity. Describe the possible causes and/or indications of the variability in context. Distribution : Data distribution should be described in context. Frequencies and relative frequencies of those categories worth mentioning should be included. For quantitative data sets: -- Graphical display Distribution should be commented by the following three basic characteristics from a graphical display:
a. The shape is either symmetric or skewed.
b. Comment on the possible indications of the number of mounds (one, two, multiple, or none) appeared in the distribution.
c. Describe if there are any unusually large or small values found in the display.
-- Numerical summary Center should be described as a typical value of a data set:
a. If the distribution is more than one mound, it is not suitable to seek a typical value for the data set. However, it might make sense to find a typical value for each subgroup.
b. When the distribution is symmetric, the balancing point, or, the mean, is the
center.
c. When the distribution is skewed, the halfway point, or the median, is the center. _______________________________________________________________________
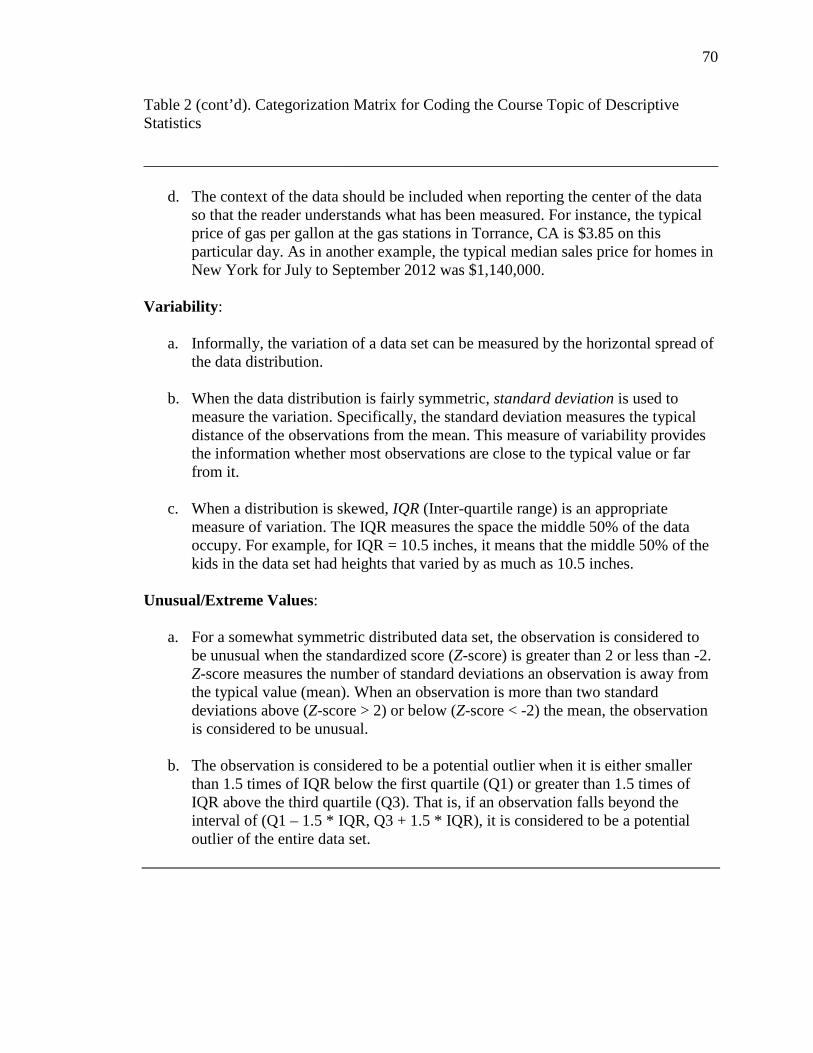
70
Table 2 (cont’d). Categorization Matrix for Coding the Course Topic of Descriptive Statistics ________________________________________________________________________
d. The context of the data should be included when reporting the center of the data so that the reader understands what has been measured. For instance, the typical price of gas per gallon at the gas stations in Torrance, CA is $3.85 on this particular day. As in another example, the typical median sales price for homes in New York for July to September 2012 was $1,140,000.
Variability :
a. Informally, the variation of a data set can be measured by the horizontal spread of the data distribution.
b. When the data distribution is fairly symmetric, standard deviation is used to
measure the variation. Specifically, the standard deviation measures the typical distance of the observations from the mean. This measure of variability provides the information whether most observations are close to the typical value or far from it.
c. When a distribution is skewed, IQR (Inter-quartile range) is an appropriate
measure of variation. The IQR measures the space the middle 50% of the data occupy. For example, for IQR = 10.5 inches, it means that the middle 50% of the kids in the data set had heights that varied by as much as 10.5 inches.
Unusual/Extreme Values:
a. For a somewhat symmetric distributed data set, the observation is considered to be unusual when the standardized score (Z-score) is greater than 2 or less than -2. Z-score measures the number of standard deviations an observation is away from the typical value (mean). When an observation is more than two standard deviations above (Z-score > 2) or below (Z-score < -2) the mean, the observation is considered to be unusual.
b. The observation is considered to be a potential outlier when it is either smaller
than 1.5 times of IQR below the first quartile (Q1) or greater than 1.5 times of IQR above the third quartile (Q3). That is, if an observation falls beyond the interval of (Q1 – 1.5 * IQR, Q3 + 1.5 * IQR), it is considered to be a potential outlier of the entire data set.
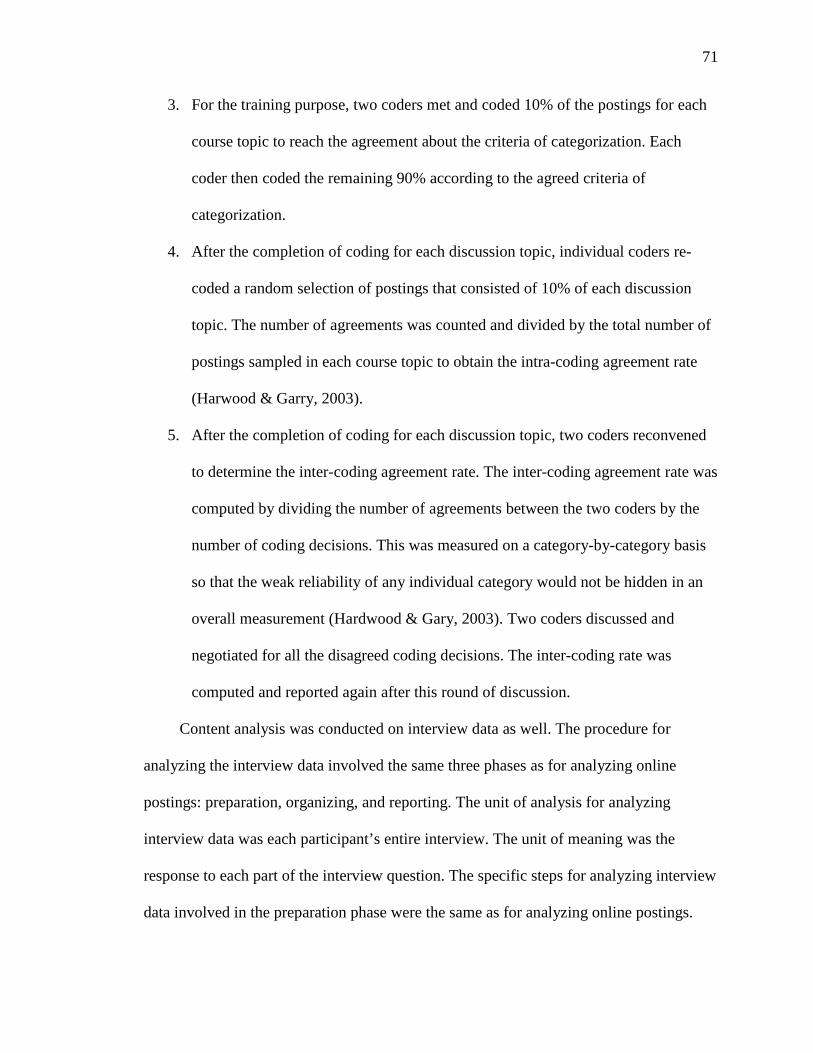
71
3. For the training purpose, two coders met and coded 10% of the postings for each
course topic to reach the agreement about the criteria of categorization. Each
coder then coded the remaining 90% according to the agreed criteria of
categorization.
4. After the completion of coding for each discussion topic, individual coders re-
coded a random selection of postings that consisted of 10% of each discussion
topic. The number of agreements was counted and divided by the total number of
postings sampled in each course topic to obtain the intra-coding agreement rate
(Harwood & Garry, 2003).
5. After the completion of coding for each discussion topic, two coders reconvened
to determine the inter-coding agreement rate. The inter-coding agreement rate was
computed by dividing the number of agreements between the two coders by the
number of coding decisions. This was measured on a category-by-category basis
so that the weak reliability of any individual category would not be hidden in an
overall measurement (Hardwood & Gary, 2003). Two coders discussed and
negotiated for all the disagreed coding decisions. The inter-coding rate was
computed and reported again after this round of discussion.
Content analysis was conducted on interview data as well. The procedure for
analyzing the interview data involved the same three phases as for analyzing online
postings: preparation, organizing, and reporting. The unit of analysis for analyzing
interview data was each participant’s entire interview. The unit of meaning was the
response to each part of the interview question. The specific steps for analyzing interview
data involved in the preparation phase were the same as for analyzing online postings.
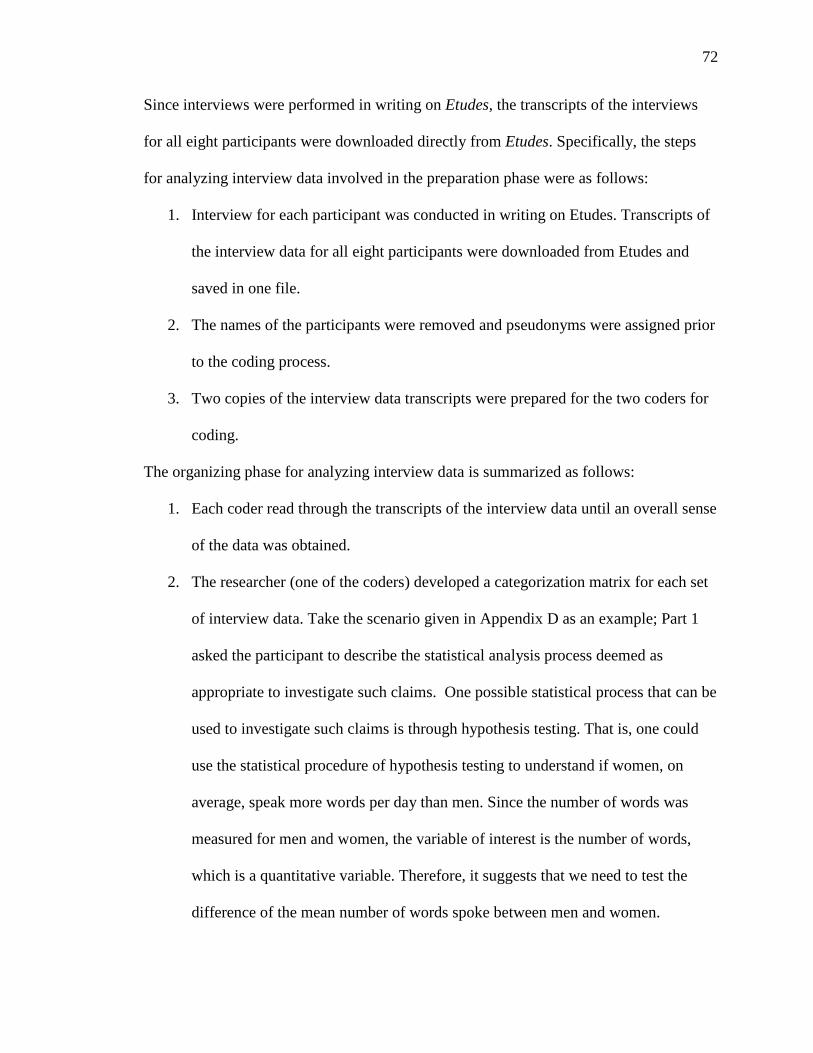
72
Since interviews were performed in writing on Etudes, the transcripts of the interviews
for all eight participants were downloaded directly from Etudes. Specifically, the steps
for analyzing interview data involved in the preparation phase were as follows:
1. Interview for each participant was conducted in writing on Etudes. Transcripts of
the interview data for all eight participants were downloaded from Etudes and
saved in one file.
2. The names of the participants were removed and pseudonyms were assigned prior
to the coding process.
3. Two copies of the interview data transcripts were prepared for the two coders for
coding.
The organizing phase for analyzing interview data is summarized as follows:
1. Each coder read through the transcripts of the interview data until an overall sense
of the data was obtained.
2. The researcher (one of the coders) developed a categorization matrix for each set
of interview data. Take the scenario given in Appendix D as an example; Part 1
asked the participant to describe the statistical analysis process deemed as
appropriate to investigate such claims. One possible statistical process that can be
used to investigate such claims is through hypothesis testing. That is, one could
use the statistical procedure of hypothesis testing to understand if women, on
average, speak more words per day than men. Since the number of words was
measured for men and women, the variable of interest is the number of words,
which is a quantitative variable. Therefore, it suggests that we need to test the
difference of the mean number of words spoke between men and women.

73
Specifically, we want to test if, on average, the women’s mean number of words
used is greater than the men’s mean number of words used per day.
In Part 2 of the same interview question, the researcher in one study
conducted a hypothesis test to investigate if the mean number of words used per
day by men at a certain university differs from 7,000 words. From the StatCrunch
printout, we see that the mean number of words used per day from a sample of 20
men at that university was 12,866.7 words, which represents about 3.15 standard
errors above the hypothesized mean of 7,000 words per day. Consequently, the p-
value is quite low at 0.0053. This p-value tells us that if men really uses 7,000
words per day, the probability of men using as many as 12,866.7 words or more
from the hypothesized 7,000 words than 12,866.7 words per day is 0.0053. This is
a rather small probability, which suggests that if the null hypothesis is true, the
outcome is surprising. We therefore reject Ho and conclude that the mean number
of words used per day by men at this university should be different from 7,000
words.
A categorization matrix used to evaluate student’s conceptual understanding
in terms of statistical literacy, reasoning, and thinking for the scenario given in
Appendix D was developed and presented in Table 3. Each coder followed the
established coding scheme when coding the interview data transcripts.
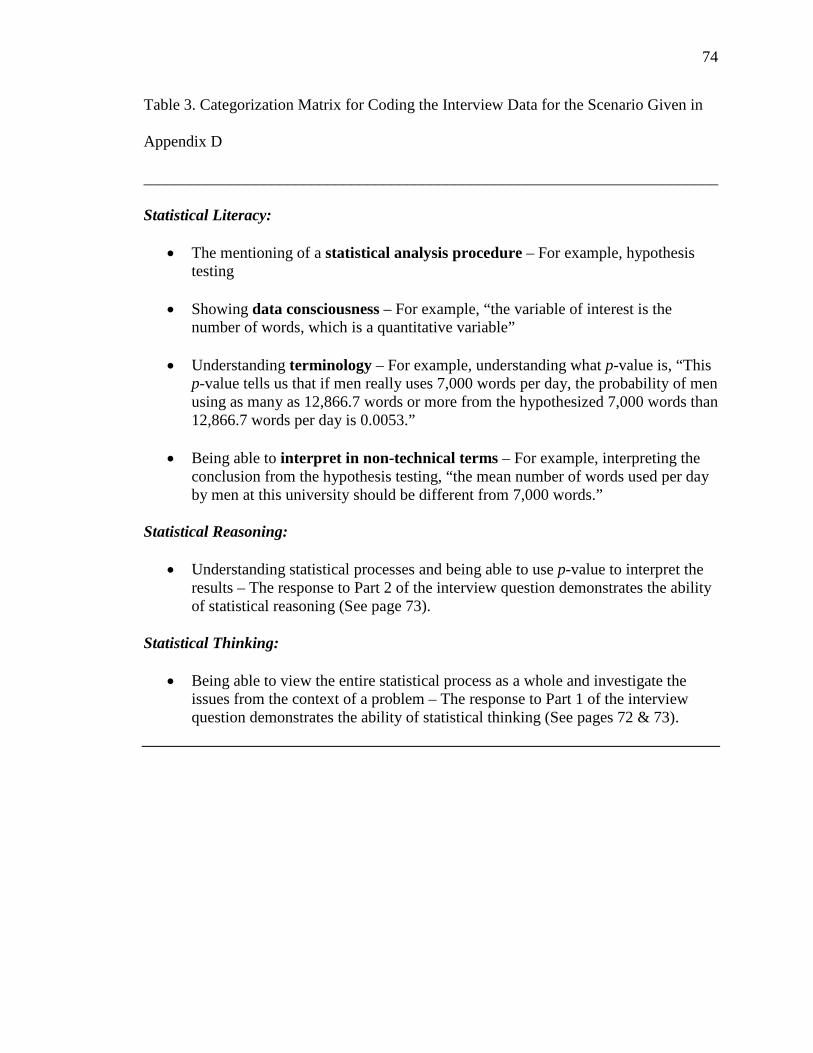
74
Table 3. Categorization Matrix for Coding the Interview Data for the Scenario Given in
Appendix D
________________________________________________________________________ Statistical Literacy:
• The mentioning of a statistical analysis procedure – For example, hypothesis testing
• Showing data consciousness – For example, “the variable of interest is the
number of words, which is a quantitative variable”
• Understanding terminology – For example, understanding what p-value is, “This p-value tells us that if men really uses 7,000 words per day, the probability of men using as many as 12,866.7 words or more from the hypothesized 7,000 words than 12,866.7 words per day is 0.0053.”
• Being able to interpret in non-technical terms – For example, interpreting the
conclusion from the hypothesis testing, “the mean number of words used per day by men at this university should be different from 7,000 words.”
Statistical Reasoning:
• Understanding statistical processes and being able to use p-value to interpret the results – The response to Part 2 of the interview question demonstrates the ability of statistical reasoning (See page 73).
Statistical Thinking:
• Being able to view the entire statistical process as a whole and investigate the issues from the context of a problem – The response to Part 1 of the interview question demonstrates the ability of statistical thinking (See pages 72 & 73).

75
3. For the training purpose, two coders coded 10% of the interview data together to
reach the agreement about the criteria of categorization. Each coder then coded
the remaining 90% according to the agreed criteria of categorization.
After the completion of coding, individual coder re-coded a random selection of
three interviews; one from each course topic of regression analysis, inferring on
population means, and inferring on population proportions. The number of
agreements were counted and divided by the total number of interviews sampled
in each course topic to obtain the intra-coding agreement rate.
4. After the completion of coding, two coders reconvened to determine the inter-
coding agreement rate. Inter-coding agreement rate was computed by dividing the
number of agreements between the two coders by the number of coding decisions.
Again, this was measured on a category-by-category basis to reveal the possible
weak reliability of any individual category. Two coders discussed and negotiated
for all the disagreed coding decisions. The inter-coding rate was computed and
reported again after this first round of discussion.
In addition to qualitatively analyzing the collected qualitative data through content
analysis, two statistical tests were performed for the purpose of quantitatively analyzing
the coding results obtained fro each course topic. The two statistical tests performed were
χ 2 independence test and two-tailed proportion Z-test. Specifically, the χ 2 independence
tests were conducted to understand how implementing Merrill’s First Principles of
Instruction was related to the level of understanding for each course topic as well as all
the topics combined. The two-tailed proportion Z-tests, on the other hand, were
76
conducted to compare the achievements of clear understanding over time from weekly
discussions to topical project for each course topic as well as for all the topics combined.
Presentation of Results
To answer the research questions, the results from qualitative data analysis were
presented using tables, appendices, and narrative descriptions. As recommended by Polit
and Beck (as cited in Elo & Kyngäs, 2007), linking study results with the original data is
vital in increasing the reliability of the study. Appendices and summarized tables
displaying categorization matrices were used to demonstrate the links between the data
and the study results. In addition, a narrative description of each category was supported
by direct quotes obtained from the online postings and interview data to illustrate
participant’s conceptual understanding in terms of statistical literacy, reasoning, and
thinking. Tables were used to present the quantitative analysis results.
Resource Requirements
The following resources were employed to complete the investigation:
1. Social networking sites: Real-life whole tasks were designed based on the
information generated from social networking sites such as Facebook and
YouTube.
2. StatCrunch: The web-based social data analysis site was used as a statistical
tool for the students when analyzing data.
3. Etudes: Etudes, stands for Easy-to-Use-Distance-Education-Software, is an
online learning management system (LMS) supported by the non-profit
organization Etudes, Inc. Etudes was the course website where all the
participants collaborated, discussed, and critiqued.
77
• http://www.indiana.edu/~edsurvey/evaluate/: A website where the web
version of TALQ (teaching and learning quality) instrument can be
viewed. TALQ instrument was used to evaluate the proposed
instructional design from student’s perspective.
4. ARTIST (Assessment Resource Tools for Improving Statistical Thinking)
website (https://app.gen.umn.edu/artist/): The website provides a variety of
assessment resources for teaching first courses in statistics. As suggested by
Frick et al (2009), TALQ scales can be served as a baseline for course
evaluation to accompany objective assessments of student learning
comprehension (statistical literacy, reasoning, and thinking in this case).
The modified Comprehensive Assessment of Outcomes in a first Statistics
Course (CAOS) test instrument developed by the team was used as a final
assessment to objectively assess student’s learning of statistical reasoning
and thinking.
5. Introductory Statistics: Exploring the World through Data (Gould & Ryan,
2013): Instructional instances were developed based on the content of this
textbook.
6. The Basic Practice of Statistics (Moore, Notz, & Fligner, 2013) and
Statistics, Learning from Data (Peck, 2014): Interview questions were
adapted from these textbooks to assess students’ cognitive process of
thinking statistically.
7. Two independent coders: In the process of content analysis, a second coder
is necessary to increase the reliability of coding. In addition to the
78
researcher, two coders were recruited to assist the researcher in analyzing
qualitative data collected from various course topics. The selection of the
independent coders was reviewed through interviews. Candidates included
former students of the researcher as well as those recommended by
colleagues who teach statistics. Qualified coders were selected based on
their strong academic and research background in statistics. The coding of
qualitative data collected for each course topic was completed by the
researcher and one of the recruited coders.
8. Approvals from Nova Southeastern University and study site: Institutional
Review Board (IRB) approval from Nova Southeastern University and
approval letter from study site were obtained and attached respectively in
Appendix G and Appendix H.
Barriers and Issues
Students who take the introductory statistics course at two-year community colleges
are usually taking the course for the purpose of transferring to four-year colleges.
Although prerequisite of successfully passing intermediate algebra is compulsory, many
students taking the introductory statistics course have weak mathematics background.
Therefore, it is challenging to impose student’s statistical literacy and statistical thinking
when teaching introductory statistics at two-year community colleges with a diverse
student mix. It was documented in David and Brown (2010) that when faculty of the
Department of Mathematics and Statistics at the University of Canterybury (UC) in New
Zealand redesigned the entry-level statistics course that served about one-quarter of all
the first-year UC undergraduates (about 1000 students) majoring in business and science
79
related fields in 2008, the emphasis was placed on teaching critical thinking. The newly
designed instruction motivated students enrolled in the course to engage themselves in
learning. Nonetheless, students who were not self-directed and who took the tutorials did
not benefit from the instructional materials. Therefore, well-designed instruction is not a
guarantee to student’s success in learning if the student lacks motivation.
Designing instruction for the purpose of developing student’s ability to think
statistically at the appropriate level was another challenge. In particular, finding suitable
online social sites that produce data that could be used for statistical analysis in a
meaningful way was not easy. Moreover, the designing of the whole tasks was time
consuming. Three real-world whole tasks were necessary for each course topic when
implementing Merrill’s First Principles into the instruction. Among the three tasks, the
first was given as an example in the weekly module to demonstrate the task; the second
was designed and assigned in weekly discussion forum for students to practice the task;
the third was designed and given in the project to assess students’ learning.
The work of data collection and analysis was daunting given the qualitative nature
of the approach. Using multiple sources of evidence with a purpose of corroborating the
same phenomenon (that is, data triangulation) enhances the construct validity, one of the
criteria for having good quality of a research design. The common sources of evidence
for case study research include direct observations, interviews, archival records,
documents, participant-observation, and physical artifacts (Yin, 2009; 2012). The main
sources of data that were collected in the study were obtained through online postings in
the weekly discussion forums and three topical projects. Data collected from open-ended
interviews conducted at the end of the study were also used toward the understanding of
80
the effectiveness of the implementation of First Principles of Instruction. Content
analysis, which involves several stages, was also used as suggested by Oncu and Cakir
(2011).
Summary
Presented in this chapter was a descriptive case study design that was used to
describe how the implementation of Merrill’s First Principles of Instruction affects
students’ statistical reasoning and thinking when taking introductory statistics course at a
two-year community college. Specifically, the researcher designed and delivered a hybrid
online introductory statistics course using real data generated from social networking
sites as well as technology provided by an online social data analysis site, StatCrunch.
The assurance of the quality was also discussed through the description of reliability and
validity. The strategies for improving reliability and validity were thoroughly described.
The analysis and presentation of the qualitative and quantitative aspects of the study were
depicted. Resources that were required for the design of the study were noted. Finally,
barriers and issues that the researcher encountered during the study design were also
illustrated.
81
Chapter 4
Results
Introduction
The goal was to understand how the course design based on First Principles of
Instruction could facilitate tertiary-level students’ conceptual understanding when
learning introductory statistics in a technology-enhanced learning environment. As stated
in Chapter 3, a total of 30 students consented to the study. However, due to student
attrition during the semester, the semester ended with eight active students. Therefore,
only data collected from the final eight participants who completed the entire course
work and received a course grade were analyzed to understand participants’ development
of conceptual understanding of the course materials over time. Both quantitative and
qualitative data were collected and analyzed. Data analysis results are presented in this
chapter. While numerical data analysis was performed to analyze the results from the
TALQ survey and CAOS assessment, content analysis was used to analyze the online
weekly discussions, topical projects, and interviews. In addition, the numerical data
analysis was also conducted on the coding obtained from content analysis.
Quantitative Data Analyses and Findings
Quantitative data include data obtained from the TALQ survey and CAOS
assessment. Summary statistics of the TALQ survey data organized in terms of the nine
self-report scales (Academic Learning Scale, Learning Scale, Learner Satisfaction Scale,
First Principles of Instruction – Authentic Problems Scale, First Principles of Instruction
82
– Activation Scale, First Principles of Instruction – Demonstration Scale, First Principles
of Instruction – Application Scale, First Principles of Instruction – Integration Scale, and
Pebble-in-the-Pond Approach Scale), two self-report ratings (Global Rating, and Class
Rating), self-report course mastery score, and objectively assessed course mastery score
(CAOS) are reported in Table 4. Summary statistics of five self-report miscellaneous
items are reported in Table 5. The five-point Likert scale, with 5 indicating Strongly
Agree and 1 indicating Strongly Disagree, was used for all the survey items except for
class rating and self-report course mastery score. Class rating and self-report course
mastery score were rated using 10-point Likert scale with 10 indicating outstanding class
rating and high course mastery, and 1 indicating poor class rating and low course
mastery, respectively.
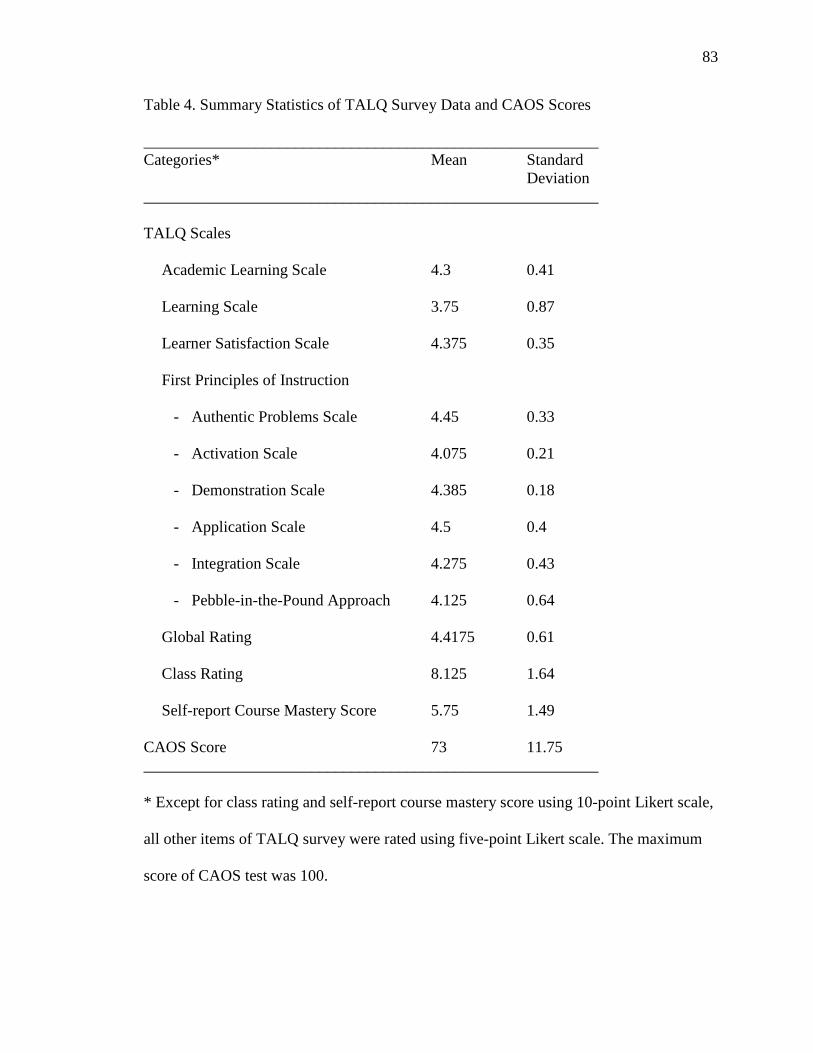
83
Table 4. Summary Statistics of TALQ Survey Data and CAOS Scores
_________________________________________________________ Categories* Mean Standard Deviation _________________________________________________________ TALQ Scales
Academic Learning Scale 4.3 0.41
Learning Scale 3.75 0.87
Learner Satisfaction Scale 4.375 0.35
First Principles of Instruction
- Authentic Problems Scale 4.45 0.33
- Activation Scale 4.075 0.21
- Demonstration Scale 4.385 0.18
- Application Scale 4.5 0.4
- Integration Scale 4.275 0.43
- Pebble-in-the-Pound Approach 4.125 0.64
Global Rating 4.4175 0.61
Class Rating 8.125 1.64
Self-report Course Mastery Score 5.75 1.49
CAOS Score 73 11.75 _________________________________________________________
* Except for class rating and self-report course mastery score using 10-point Likert scale,
all other items of TALQ survey were rated using five-point Likert scale. The maximum
score of CAOS test was 100.
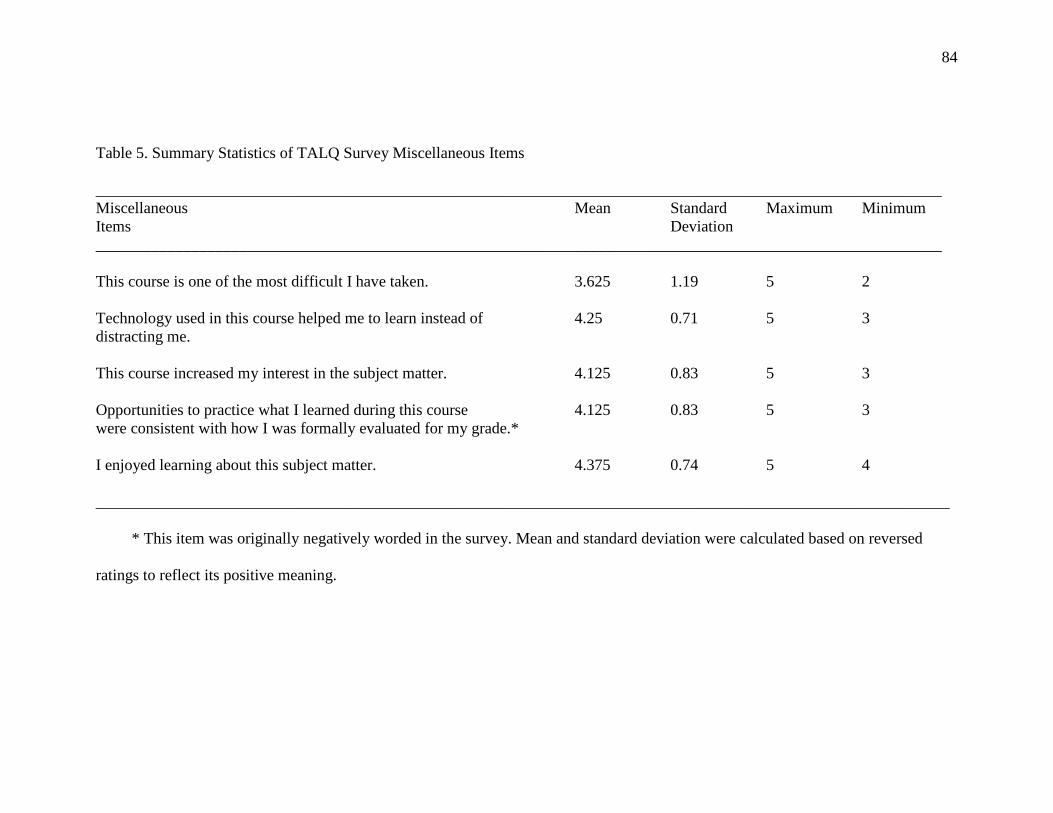
84
Table 5. Summary Statistics of TALQ Survey Miscellaneous Items
__________________________________________________________________________________________________________ Miscellaneous Mean Standard Maximum Minimum Items Deviation __________________________________________________________________________________________________________ This course is one of the most difficult I have taken. 3.625 1.19 5 2 Technology used in this course helped me to learn instead of 4.25 0.71 5 3 distracting me. This course increased my interest in the subject matter. 4.125 0.83 5 3 Opportunities to practice what I learned during this course 4.125 0.83 5 3 were consistent with how I was formally evaluated for my grade.* I enjoyed learning about this subject matter. 4.375 0.74 5 4
___________________________________________________________________________________________________________
* This item was originally negatively worded in the survey. Mean and standard deviation were calculated based on reversed
ratings to reflect its positive meaning.
85
TALQ Survey Results
Comparing Academic Learning Scale, Learning Scale, and Learner Satisfaction
Scale (Table 4), Learner Satisfaction Scale has the highest mean rating of 4.375 (SD =
0.35) indicating that, on average, the participants in the study agreed that they were
satisfied with this course. Academic Learning Scale has the mean rating of 4.3 (SD =
0.41) indicating that, on average, the participants agreed that they put a great deal of
effort and time into this course. Learning Scale, on the other hand, received the lowest
mean rating of 3.75 (SD = 0.87) compared to the Learner Satisfaction Sale and the
Academic Learning Scale. However, the mean rating of 3.75 indicates that, generally,
participants held a near agreement with the statement “I learned a lot in this course.”
Six scales are related to the implementation of First Principles of Instruction. The
mean ratings of the six scales related to the implementation of First Principles of
Instruction range from 4.075 to 4.5 showing participants’ agreement with the
implementation of Merrill’s First Principles of Instruction in the course design in general.
In particular, Application Scale received the highest mean rating of 4.5 (SD = 0.4)
showing that participants agreed nearly strongly that they were given opportunities to
practice what they have learned in the course and their course instructor provided them
with appropriate feedback whenever necessary. With a mean rating of 4.45 (SD = 0.33),
The Authentic Problems Scale indicates participants’ agreement on learning and working
on authentic tasks. Demonstration Scale (Mean = 4.385 and SD = 0.18) rates the
inclusion in the course design to demonstrate skills students expected to learn. The
Integration Scale (Mean = 4.275 and SD = 0.43) result shows that the participants agreed
that the course design allowed them to discuss and defend what they learned in the

86
course. In addition, the course design allowed them to apply what they learned in the
course to real life situations. Although the Activation Scale received the lowest mean
rating of 4.075 (SD = 0.21) among all the scales related to the implementation of First
Principles of Instruction, on average, participants agreed that they had a chance to recall
and apply past experience to connect to the new knowledge and skills they were learning.
Finally, the Pebble-in-the-Pond Approach Scales summarizes the overall course design of
implementing Merrill’s First Principles of Instruction by surveying this one question,
“My instructor gradually reduced coaching or feedback as my learning or performance
improved during this course.” Out of a total of eight participants, seven strongly agreed
or agreed with one participant held neutral agreement of the approach, which rendered a
mean rating of 4.125 (SD = 0.64).
Both Global Rating and Class Rating evaluate the overall quality of the course and
the instructor. While Global Rating was rated from 1 to 5, Class rating was rated from 1
to 10. Participants agreed (with a mean Global Rating of 4.4175 and SD of 0.61) that the
overall quality of the course and the instructor were outstanding. When cross-examined
by the Class Rating, the mean Class Rating of 8.125 (SD = 1.64) indicates that, on
average, the participants considered the class as a great class, which agrees with the
Global Rating result. When asked about the course grade one expected to receive (not
shown in Table 4), six of eight participants expected to pass with a C or above while two
participants replied “Don’t Know.” Finally, participants evaluated their own course
mastery with respect to achievement of objectives of the course. On a scale from 1 to 10,
with 1 indicating a low master, 5 indicating a medium master, and 10 indicating a high
master, the mean Self-report Course Mastery Score was 5.75 (SD = 1.49), indicating that,
87
on average, participants evaluated themselves as medium masters of the course. The
mean objectively assessed course mastery scores (CAOS) of 73 (SD = 11.75) supports
the self-reported medium course mastery.
The summary statistics of five miscellaneous items surveyed through the TALQ
survey are recorded in Table 5. On average, participants agreed with the items
“Technology used in this course helped me to learn instead of distracting me.” (Mean =
4.25 and SD = 0.71), “This course increased my interest in the subject matter.” (Mean =
4.125 and SD = 0.83), “Opportunities to practice what I learned during this course were
consistent with how I was formally evaluated for my grade.” (Mean = 4.125 and SD =
0.83), and “I enjoyed learning about this subject matter.” (Mean = 4.375 and SD = 0.74).
On the issue of “most difficult course I have taken,” however, the mean dropped down to
3.625 with a somewhat higher standard deviation of 1.19, comparing with the other
survey items. The relatively high variation of agreement on the issue of “most difficult
course I have taken” indicates that not all the participants considered the introductory
statistics course as the most difficult course they have taken. The ratings ranged from as
low as 2 (Disagree) to as high as 5 (Strongly Agree). In summary, participants, on
average, agreed or strongly agreed with all the nine scales in TALQ survey except a
somewhat higher variation on the issue of Learning Scale. Some participants expressed
their concerns of not having adequately learned the course. This result explains an
average of a medium course master self-evaluation result, which, in turn, supported by
the mean objectively assessed course master CAOS score of 73. As for the concern of the
difficulty level of the course, since not all the participants surveyed considered this
course as the most difficult course they have taken, this could be an indication that the
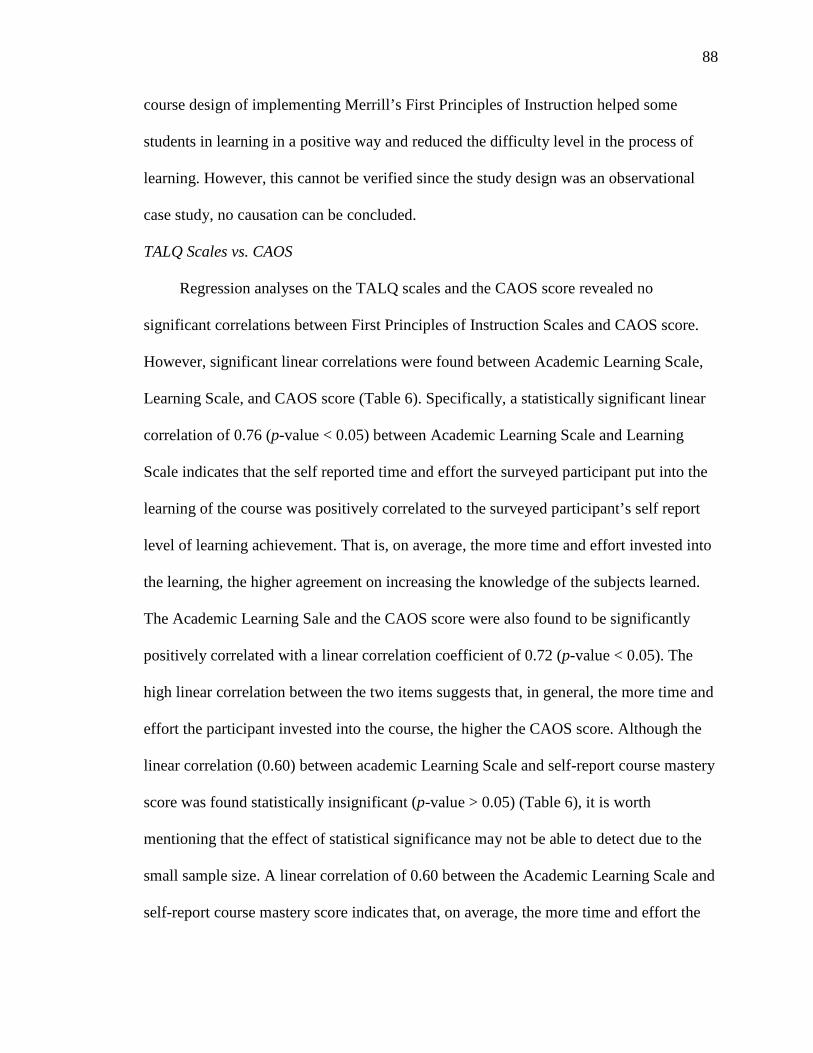
88
course design of implementing Merrill’s First Principles of Instruction helped some
students in learning in a positive way and reduced the difficulty level in the process of
learning. However, this cannot be verified since the study design was an observational
case study, no causation can be concluded.
TALQ Scales vs. CAOS
Regression analyses on the TALQ scales and the CAOS score revealed no
significant correlations between First Principles of Instruction Scales and CAOS score.
However, significant linear correlations were found between Academic Learning Scale,
Learning Scale, and CAOS score (Table 6). Specifically, a statistically significant linear
correlation of 0.76 (p-value < 0.05) between Academic Learning Scale and Learning
Scale indicates that the self reported time and effort the surveyed participant put into the
learning of the course was positively correlated to the surveyed participant’s self report
level of learning achievement. That is, on average, the more time and effort invested into
the learning, the higher agreement on increasing the knowledge of the subjects learned.
The Academic Learning Sale and the CAOS score were also found to be significantly
positively correlated with a linear correlation coefficient of 0.72 (p-value < 0.05). The
high linear correlation between the two items suggests that, in general, the more time and
effort the participant invested into the course, the higher the CAOS score. Although the
linear correlation (0.60) between academic Learning Scale and self-report course mastery
score was found statistically insignificant (p-value > 0.05) (Table 6), it is worth
mentioning that the effect of statistical significance may not be able to detect due to the
small sample size. A linear correlation of 0.60 between the Academic Learning Scale and
self-report course mastery score indicates that, on average, the more time and effort the

89
survey participant put into the course, the higher the participant’s self-report course
mastery score.
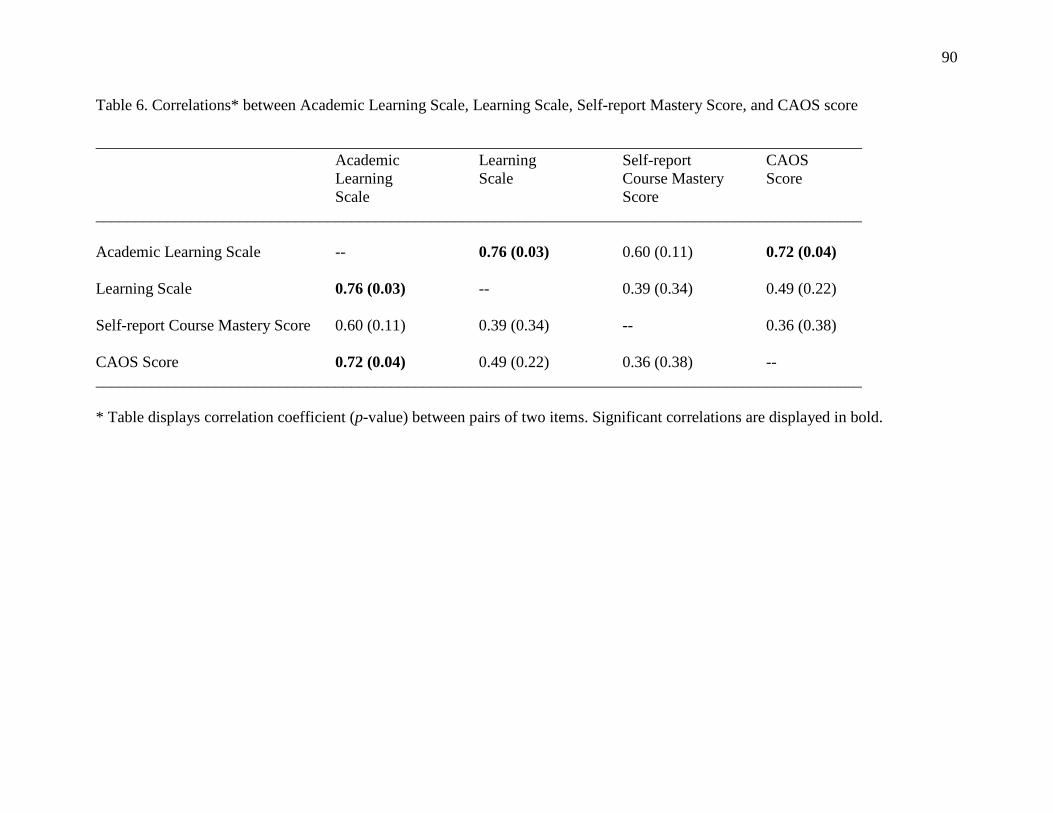
90
Table 6. Correlations* between Academic Learning Scale, Learning Scale, Self-report Mastery Score, and CAOS score
________________________________________________________________________________________________ Academic Learning Self-report CAOS
Learning Scale Course Mastery Score Scale Score
________________________________________________________________________________________________ Academic Learning Scale -- 0.76 (0.03) 0.60 (0.11) 0.72 (0.04)
Learning Scale 0.76 (0.03) -- 0.39 (0.34) 0.49 (0.22)
Self-report Course Mastery Score 0.60 (0.11) 0.39 (0.34) -- 0.36 (0.38)
CAOS Score 0.72 (0.04) 0.49 (0.22) 0.36 (0.38) -- ________________________________________________________________________________________________
* Table displays correlation coefficient (p-value) between pairs of two items. Significant correlations are displayed in bold.
91
In summary, the Academic Learning Scale is positively correlated to Learning
Scale, self-report course mastery score, and CAOS score. The results show that, on
average, the more time and effort the surveyed participant reported to spend in the course,
the higher agreements on gaining more knowledge from the course and achieving a
higher-level of self reported mastery of the course, and the higher objective CAOS score
in the final course assessment.
Qualitative Data Analyses and Findings
Qualitative data include data collected from online weekly discussions, topical
projects, and interviews. Content analysis was conducted in analyzing these data
qualitatively. This section begins with the quantitative descriptions of intra-coding and
inter-coding agreement rates of the collected qualitative data. Next, statistical tests results
(independence tests and Z-tests) on coding results collected through content analysis
from weekly discussions and topical projects were analyzed for an understanding of the
overall effectiveness of implementing Merrill’s First Principles of Instruction.
Percentages of “clear understanding” coding from interviews were also calculated and
analyzed. Finally, a detailed description of cognitive development toward conceptual
understanding based on a purposeful sample of four students selected from the final eight
active participants was presented in accordance with statistical literacy, reasoning, and
thinking to reflect the goal of this study.
Intra-coding Agreement Rates
Intra-coding agreement rate measures the coder agreement with oneself over time.
While the researcher (Coder #2) coded the weekly discussions, topical projects, and
interview data for the entire studied period, two research assistants assisted the researcher
92
and shared the coding work. Coder #1 coded the weekly discussions and topical projects
for the topics of Descriptive Statistics and Regression Analysis, and interviews. Coder #2
coded the topics of Sampling & Inferences on Population Means and Sampling &
Inferences on Population Proportions. Table 7 shows the intra-coding agreement rates for
eight participants who completed the semester-end CAOS tests as well as TALQ surveys
of their weekly discussions, topical projects, and interview data by each coder. The
overall intra-coding agreement rates of all the coders for the entire study period ranged
from 85% to 100% with two intra-coding agreement rates falling below 90% (85% and
87%).
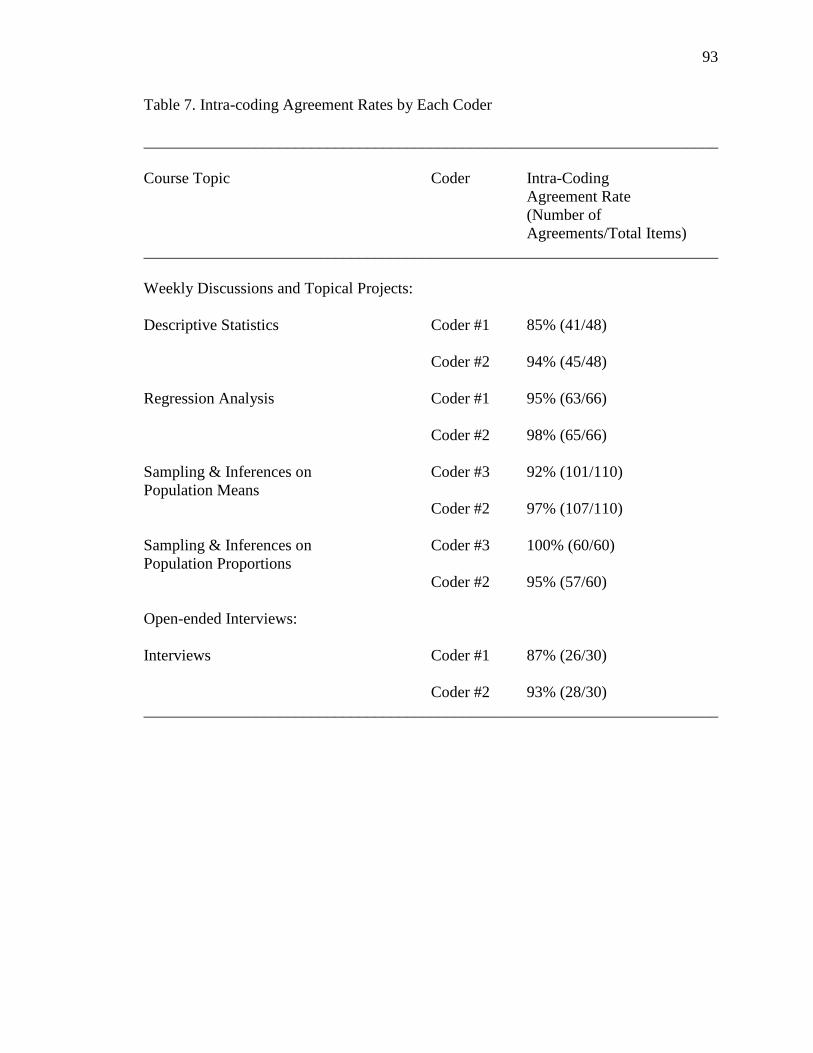
93
Table 7. Intra-coding Agreement Rates by Each Coder
________________________________________________________________________ Course Topic Coder Intra-Coding Agreement Rate
(Number of Agreements/Total Items)
________________________________________________________________________ Weekly Discussions and Topical Projects: Descriptive Statistics Coder #1 85% (41/48) Coder #2 94% (45/48) Regression Analysis Coder #1 95% (63/66) Coder #2 98% (65/66) Sampling & Inferences on Coder #3 92% (101/110) Population Means Coder #2 97% (107/110) Sampling & Inferences on Coder #3 100% (60/60) Population Proportions Coder #2 95% (57/60) Open-ended Interviews:
Interviews Coder #1 87% (26/30)
Coder #2 93% (28/30) ________________________________________________________________________

94
Inter-coding Agreement Rates
Inter-coding agreement rate measures the agreement between two coders. Tables 8
and 9 show the first-round inter-coding agreement rates by category coded for the eight
finalists of their weekly discussions and topical projects, and interview data, respectively.
For the first round, the two coders’ agreement on all the categories ranged from 86% to
100% with an overall agreement rates ranged from 93% to 98% on four course topics.
After discussing and negotiating for all the disagreed coding decisions, the coders
reached to 100% inter-coding agreement rate for each category. Two items of the
interview data failed to reach 100% agreement rates for the first round of coding. After
reconvening, the two coders reached to 100% agreement rates.
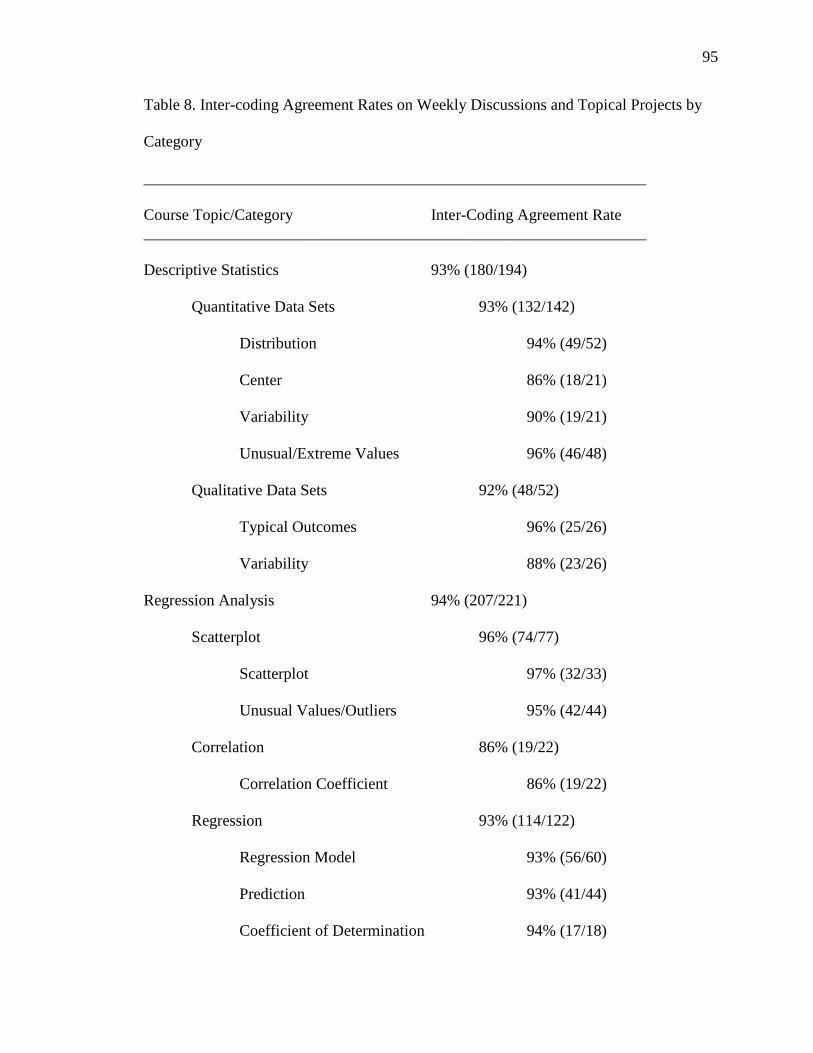
95
Table 8. Inter-coding Agreement Rates on Weekly Discussions and Topical Projects by
Category
_______________________________________________________________ Course Topic/Category Inter-Coding Agreement Rate _______________________________________________________________ Descriptive Statistics 93% (180/194) Quantitative Data Sets 93% (132/142) Distribution 94% (49/52) Center 86% (18/21) Variability 90% (19/21) Unusual/Extreme Values 96% (46/48)
Qualitative Data Sets 92% (48/52)
Typical Outcomes 96% (25/26) Variability 88% (23/26) Regression Analysis 94% (207/221) Scatterplot 96% (74/77) Scatterplot 97% (32/33) Unusual Values/Outliers 95% (42/44) Correlation 86% (19/22) Correlation Coefficient 86% (19/22) Regression 93% (114/122) Regression Model 93% (56/60) Prediction 93% (41/44) Coefficient of Determination 94% (17/18)
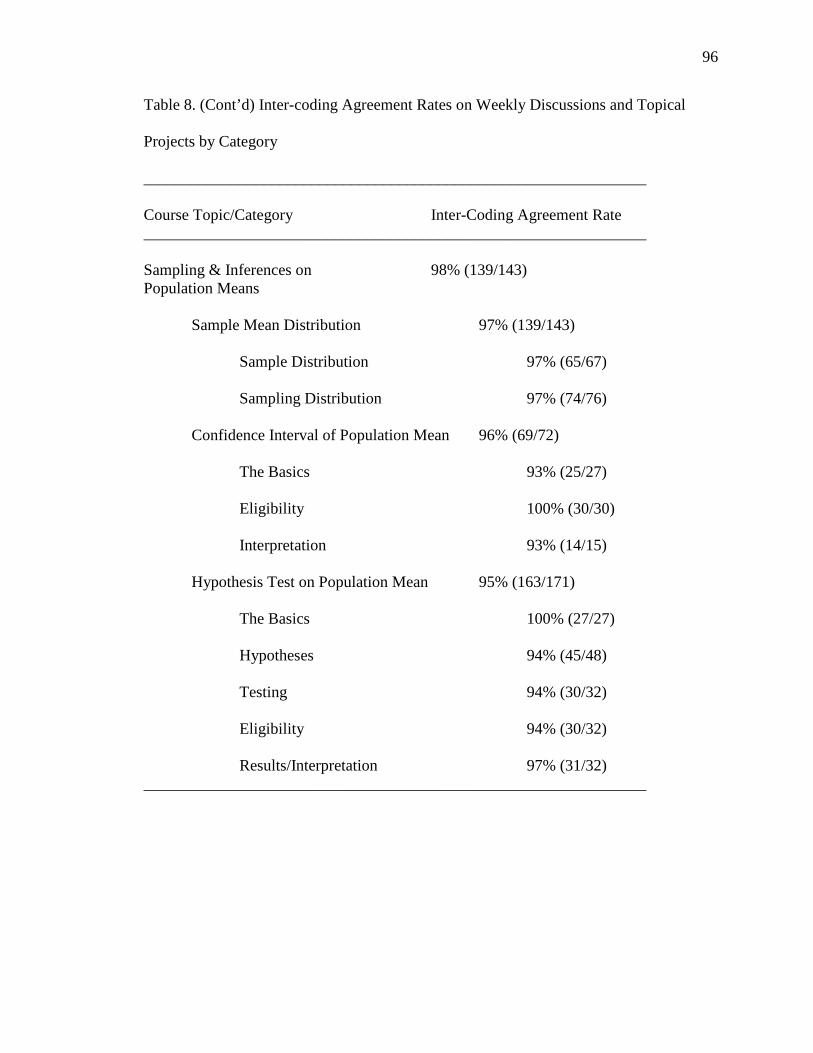
96
Table 8. (Cont’d) Inter-coding Agreement Rates on Weekly Discussions and Topical
Projects by Category
_______________________________________________________________
Course Topic/Category Inter-Coding Agreement Rate _______________________________________________________________ Sampling & Inferences on 98% (139/143) Population Means Sample Mean Distribution 97% (139/143) Sample Distribution 97% (65/67) Sampling Distribution 97% (74/76) Confidence Interval of Population Mean 96% (69/72) The Basics 93% (25/27) Eligibility 100% (30/30) Interpretation 93% (14/15) Hypothesis Test on Population Mean 95% (163/171) The Basics 100% (27/27) Hypotheses 94% (45/48) Testing 94% (30/32) Eligibility 94% (30/32) Results/Interpretation 97% (31/32) _______________________________________________________________
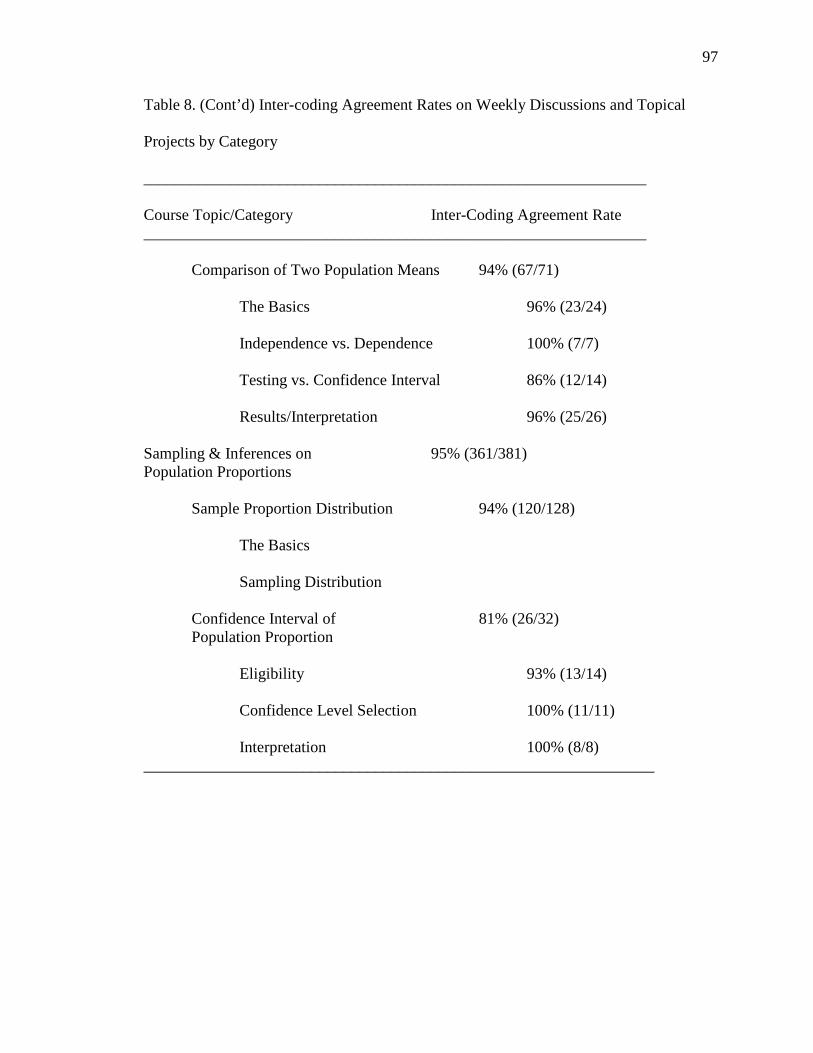
97
Table 8. (Cont’d) Inter-coding Agreement Rates on Weekly Discussions and Topical
Projects by Category
_______________________________________________________________ Course Topic/Category Inter-Coding Agreement Rate _______________________________________________________________ Comparison of Two Population Means 94% (67/71) The Basics 96% (23/24) Independence vs. Dependence 100% (7/7) Testing vs. Confidence Interval 86% (12/14) Results/Interpretation 96% (25/26) Sampling & Inferences on 95% (361/381) Population Proportions
Sample Proportion Distribution 94% (120/128) The Basics Sampling Distribution Confidence Interval of 81% (26/32) Population Proportion
Eligibility 93% (13/14)
Confidence Level Selection 100% (11/11)
Interpretation 100% (8/8) ________________________________________________________________
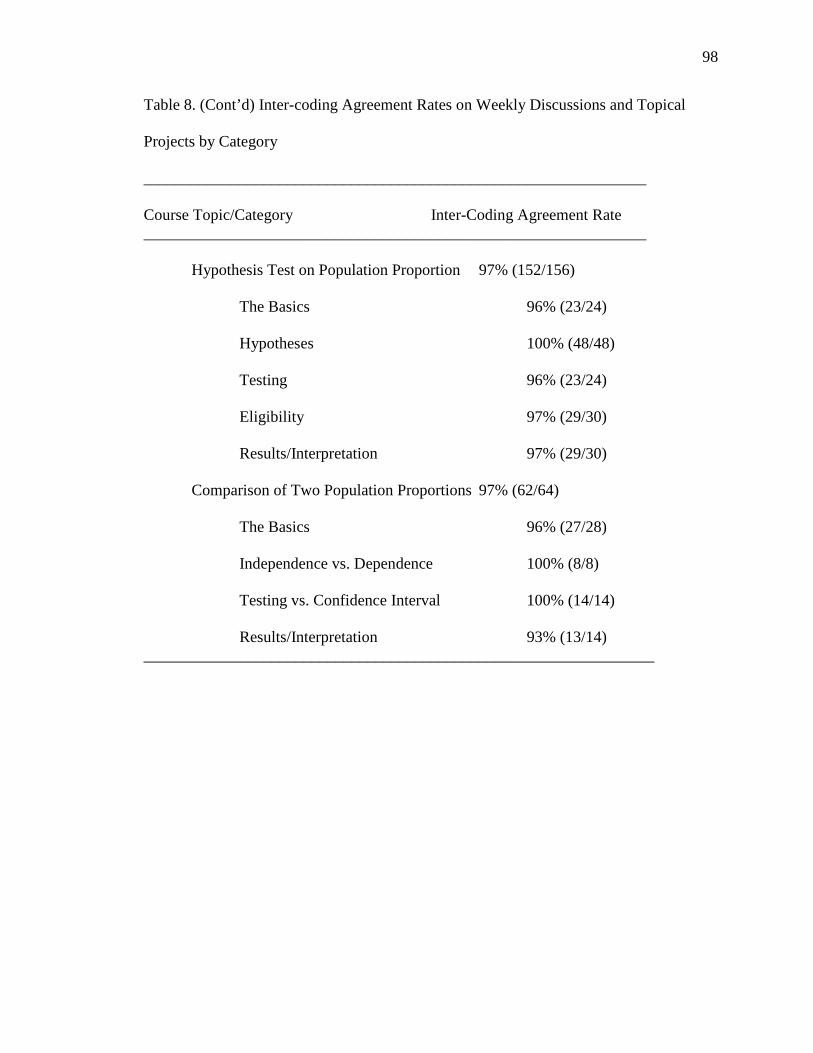
98
Table 8. (Cont’d) Inter-coding Agreement Rates on Weekly Discussions and Topical
Projects by Category
_______________________________________________________________ Course Topic/Category Inter-Coding Agreement Rate _______________________________________________________________
Hypothesis Test on Population Proportion 97% (152/156) The Basics 96% (23/24) Hypotheses 100% (48/48) Testing 96% (23/24) Eligibility 97% (29/30) Results/Interpretation 97% (29/30) Comparison of Two Population Proportions 97% (62/64) The Basics 96% (27/28) Independence vs. Dependence 100% (8/8) Testing vs. Confidence Interval 100% (14/14) Results/Interpretation 93% (13/14) ________________________________________________________________
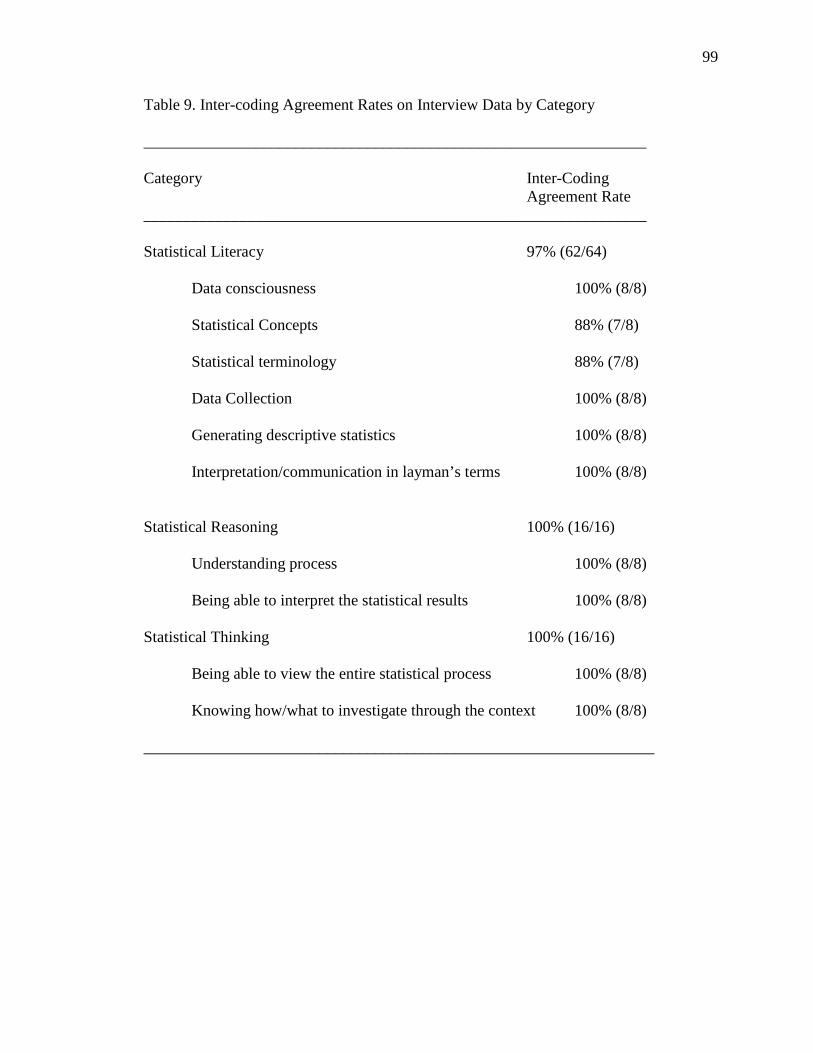
99
Table 9. Inter-coding Agreement Rates on Interview Data by Category
_______________________________________________________________ Category Inter-Coding Agreement Rate _______________________________________________________________ Statistical Literacy 97% (62/64)
Data consciousness 100% (8/8)
Statistical Concepts 88% (7/8) Statistical terminology 88% (7/8) Data Collection 100% (8/8) Generating descriptive statistics 100% (8/8) Interpretation/communication in layman’s terms 100% (8/8)
Statistical Reasoning 100% (16/16)
Understanding process 100% (8/8) Being able to interpret the statistical results 100% (8/8)
Statistical Thinking 100% (16/16)
Being able to view the entire statistical process 100% (8/8) Knowing how/what to investigate through the context 100% (8/8)
________________________________________________________________
100
Statistical Tests Results
For the purpose of evaluating the effectiveness of implementing Merrill’s First
Principles of Instruction in promoting conceptual understanding, two statistical tests,
namely, chi-square independence test (χ 2 -test) and two-tailed proportion Z-test were
conducted on each course topic as well as all the topics combined. Chi-square
independence tests (χ 2 -tests) were performed to first examine whether implementing
Merrill’s First Principles of Instruction (explanatory variable) was related to the level of
understanding (response variable) when learning Introductory Statistics. The explanatory
variable, the implementation of Merrill’s First Principles of Instruction, was described by
the assignment type (weekly discussions and topical project) while the response variable,
level of understanding, was classified by three levels of understanding (none, vague, and
clear). According to the Pebble-in-the-Pond framework, an example was first
demonstrated in the weekly module. A question similar to the example given in the
module was assigned in the weekly discussions with reduced guidance followed by a
third similar question with the minimum guidance assigned in the topical project.
Therefore, it is appropriate to use the assignment type to understand whether the
implementation of Merrill’s First Principles of Instruction could effectively increase
students’ conceptual learning. Next, two-tailed proportion Z-tests were conducted to
empirically compare the achievements of clear understanding between weekly
discussions and topical project for each course topic as well as for the entire course topics
combined. Specifically, two-tailed proportion Z-tests were conducted to compare the
percentages of obtaining a “clear-understanding” coding between weekly discussions and
topical projects.

101
Table 10 shows χ 2 -test and two-tailed proportion Z-test results between assignment type
and level of understanding for each course topic as well as for all the course topics
combined. For the topic of Descriptive Statistics, the large p-value (0.102) from χ 2 -test
indicates that the level of understanding is independent to the assignment type. That is,
the implementation of Merrill’s First Principles of Instruction was not related to students’
understanding level when learning the topic of Descriptive Statistics. Although a
significant Z-test result (p-value = 0.3573) of the proportions of “clear understanding”
coding between weekly discussions and the topical project was not found, the sample
difference shows a 9% increase in “clear understanding” coding from weekly discussions
(49%) to topical project (58%). A similar no association result (p-value = 0.4173)
between the implementation of Merrill’s First Principles of Instruction and students’ level
of understanding appeared when learning the topic of Regression Analysis. Moreover, an
insignificant (p-value = 0.3092) decrease of 8% of “clear understanding” coding was
found from weekly discussions (53%) to the topical project (45%).
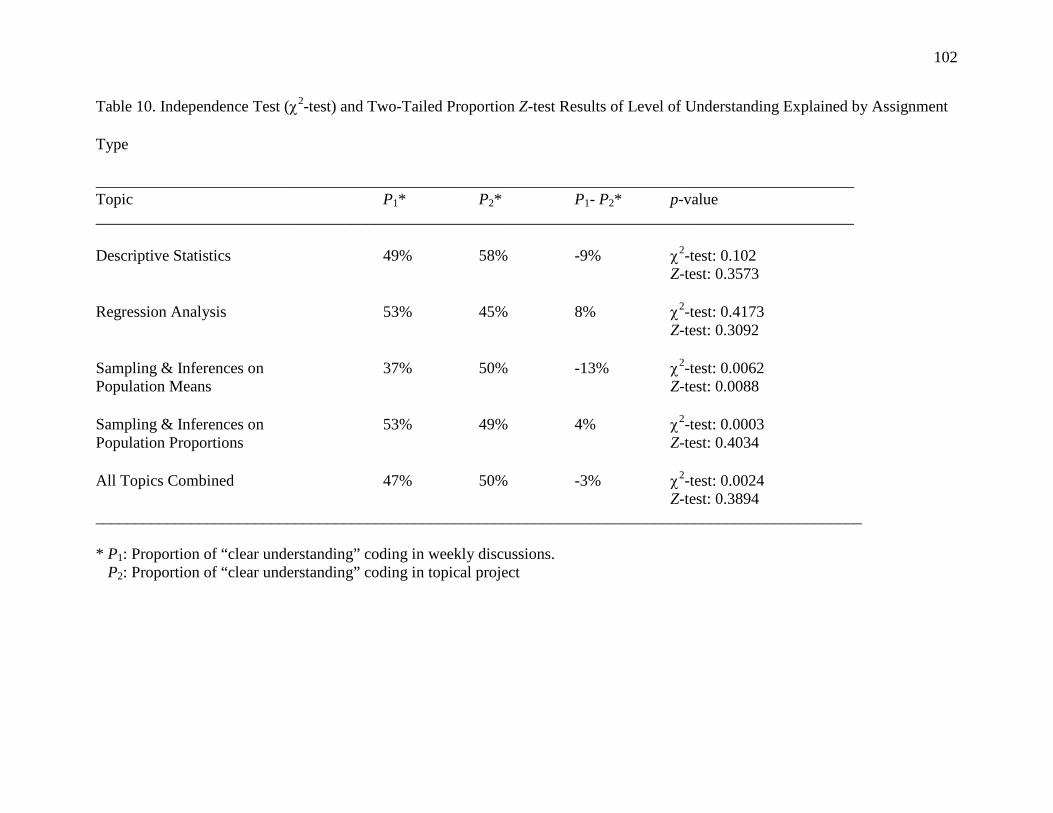
102
Table 10. Independence Test (χ2-test) and Two-Tailed Proportion Z-test Results of Level of Understanding Explained by Assignment
Type
_______________________________________________________________________________________________ Topic P1* P2* P1- P2* p-value _______________________________________________________________________________________________ Descriptive Statistics 49% 58% -9% χ
2-test: 0.102 Z-test: 0.3573
Regression Analysis 53% 45% 8% χ
2-test: 0.4173 Z-test: 0.3092 Sampling & Inferences on 37% 50% -13% χ
2-test: 0.0062 Population Means Z-test: 0.0088 Sampling & Inferences on 53% 49% 4% χ
2-test: 0.0003 Population Proportions Z-test: 0.4034 All Topics Combined 47% 50% -3% χ
2-test: 0.0024 Z-test: 0.3894 ________________________________________________________________________________________________
* P1: Proportion of “clear understanding” coding in weekly discussions. P2: Proportion of “clear understanding” coding in topical project
103
However, when the course continued, significant association (p-value = 0.0062)
appeared on the course topic of Inferring Population Means between the implementation
of Merrill’s First Principles of Instruction and the level of understanding. Specifically, a
statistically significant (p-value = 0.0088) increase of 13% in “clear understanding”
coding found from weekly discussions (37%) to the topical project (50%). Put together,
the implementation of Merrill’s First Principles of Instruction to teach Inferring
Population Means resulted in a statistically significant increase in students’
understanding. There was a practical significance increase of 13% of clear understanding
among the eight participants.
Significant association (p-value = 0.0003) between the implementation of Merrill’s
First Principles of Instruction and the level of understanding was also found on the course
topic of Inferring Population Proportions. However, an insignificant (p-value = 0.4034)
decrease of 4% in “clear understanding” coding was detected from weekly discussions
(53%) to the topical project (49%). Although one cannot make a causal conclusion by
saying that Merrill’s First Principles of Instruction negatively affected students’ level of
understanding, one could conclude, from the results of this case study, that in learning the
topic of Inferring Population Proportions, the implementation of Merrill’s First Principles
of Instruction was inversely related to students’ level of understanding. However, the
decrease of 4% in clear understanding was statistically insignificant.
When combining all course topics, a statistical significant (p-value = 0.0024)
association between the implementation of Merrill’s First Principles of Instruction and
the level of understanding was revealed. Nonetheless, the increase of 3% of clear
104
understanding from online discussions (47%) to topical projects (50%) was statistically
insignificant (p-value = 0.3894).
Finally, percentages of “clear understanding” coding in terms of statistical literacy,
statistical reasoning, statistical thinking, and overall interview results were calculated and
are displayed in Table 11. Recall that each participant received a different set of
interview questions. Although different course topics were involved in the interview
questions, the purpose of the interviews was to evaluate participants’ conceptual
understanding in terms of statistical literacy, statistical reasoning, and statistical thinking.
The percentage of items related to statistical literacy marked as clear understanding was
at the lowest of 29%, comparing with 69% of clear understanding for each of the
categories of statistical reasoning and statistical thinking. That is, less than one-third of
the items evaluating statistical literacy in the interviews can be considered as having clear
understanding of the basic statistical skills such as data consciousness, statistical literacy,
statistical concepts, and being able to interpret the statistical results using context to
communicate with others. On the other hand, for every 10 items evaluating statistical
reasoning and statistical thinking, almost seven items were marked as having clear
understanding. The items evaluated in each category of statistical literacy, statistical
reasoning, and statistical thinking are listed in Appendix I.
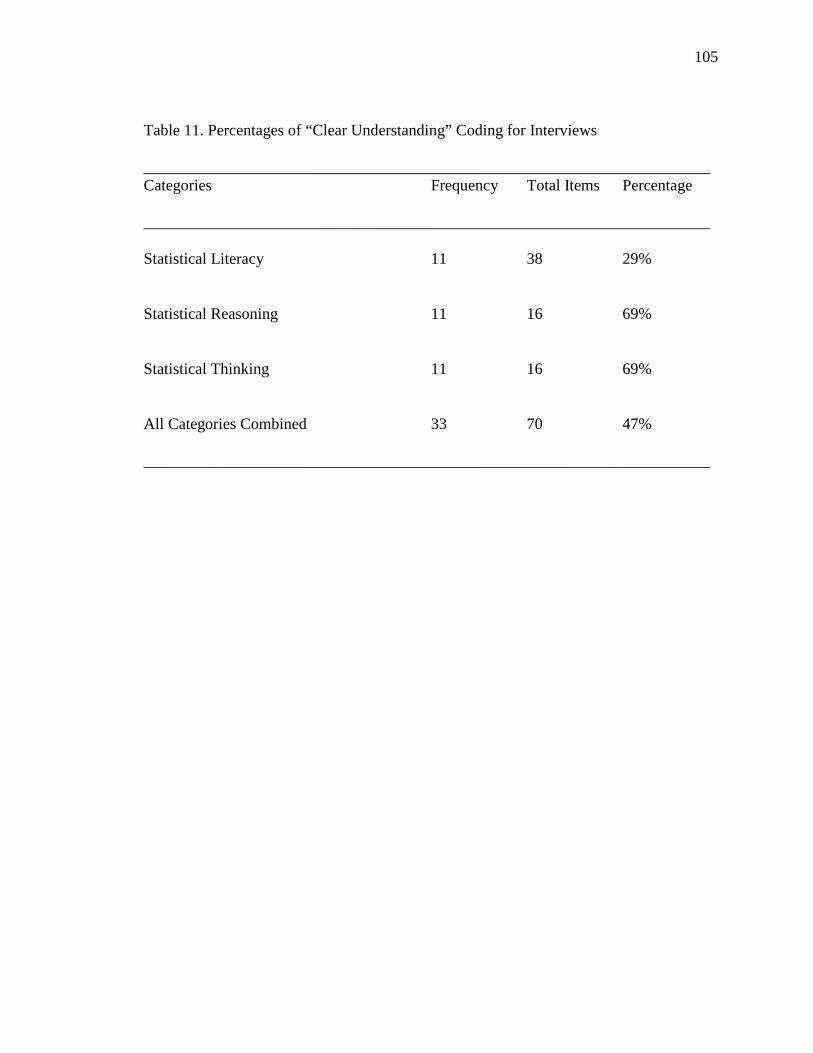
105
Table 11. Percentages of “Clear Understanding” Coding for Interviews
_______________________________________________________________________ Categories Frequency Total Items Percentage _______________________________________________________________________ Statistical Literacy 11 38 29%
Statistical Reasoning 11 16 69% Statistical Thinking 11 16 69% All Categories Combined 33 70 47% _______________________________________________________________________
106
When combining all the three categories of statistical literacy, statistical reasoning,
and statistical thinking, the overall percentage of clear conceptual understanding found
from the interview was 47%. Comparing the percentage of overall clear understanding
found from the interview with the percentages of overall clear understanding found from
weekly discussions (47%) and topical projects (50%), it can be concluded that there is no
practical differences of clear understanding between during-semester training (online
discussions and topical projects) and the semester-end interviews (Table 12). This result
can be translated as; overall, the clear conceptual understanding had been established
during the semester training and was maintained at the similar level at the semester-end
interviews.
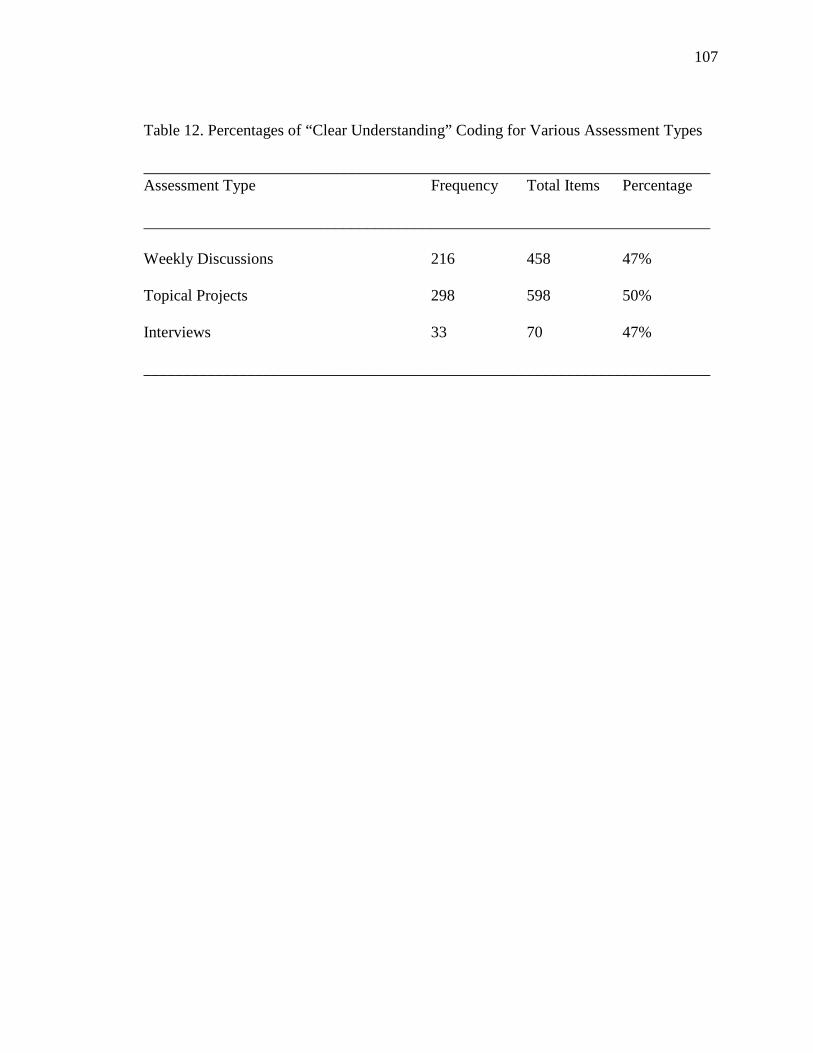
107
Table 12. Percentages of “Clear Understanding” Coding for Various Assessment Types
_______________________________________________________________________ Assessment Type Frequency Total Items Percentage _______________________________________________________________________ Weekly Discussions 216 458 47% Topical Projects 298 598 50% Interviews 33 70 47% _______________________________________________________________________
108
Content Analysis
The content analysis results were generated from a purposeful sample of four
students selected from the final eight active participants with a consideration of their
grade, gender, and most importantly, their learning process, to reflect how the course
design did or did not benefit their statistical concept development over the entire study
period. The sample consists of two female students and two male students. Arranged
alphabetically by their pseudonyms, the four students selected are Amelia, Charlie,
Harry, and Jessica.
To better understand whether Merrill’s Pebble-in-the-Pond instructional approach
facilitates student’s conceptual understanding, findings from content analysis were
discussed from each selected participant in accordance with their conceptual development
related to statistical literacy and statistical reasoning. The design of the weekly
discussions for each course topic allows students to know how and what to investigate by
modeling after the examples given in the weekly modules. Therefore, a student’s
capability of thinking statistically was only evaluated through the open-ended interview
because the interview question related to which course topic was not informed to the
student prior to or during the interview. Merrill’s Pebble-in-the-Pond instructional
approach was designed into the instructional instances starting with the topic of
Descriptive Statistics in the second week of the study period. Followed by the course
topics of Regression Analysis, Sampling & Inferences on Population Means, and
Sampling & Inferences on Population Proportions (Table 1).
Amelia. 1. Findings associated with statistical literacy
109
a. Data consciousness
Data Type
In the first weekly discussion assignment when learning the course
topic of Descriptive Statistics, students were asked to graphically and
numerically summarize the qualitative variable, Popular Week, defined
as "The week when the most people were talking about this page", in a
data set consisting of various responses collected from a sample of
Facebook pages of the mosques in the United States. Stemming from the
misunderstanding of the structure of the data set and a lack of solid
understanding in differentiating between qualitative data and
quantitative data, Amelia analyzed the variable Popular Week in terms
of other quantitative variables included in the data set. Amelia posted,
The distribution (or values) of the data set for the variable,
‘Popular Week’, include the number of likes, the number of people
mentioning the page and the number of photos posted on the page.
Although several categories are contained within the variable
‘Popular Week’, the center of the variable is the number of likes
received.
The confusion on the basic understanding of the data type between
qualitative data and quantitative data remained a challenge to Amelia
toward the end of the semester when she discussed the choice of an
appropriate test statistic in testing the population proportion. Note that
standard deviation could not be found from a qualitative data set, Amelia
110
wrote, “Since our population standard deviation is unknown at this
point, our test statistic will be …”.
Valid Data
Another issue of data consciousness was related to having the
consciousness of excluding irrelevant data in the process of data
analysis. In setting up a statistical process of regression analysis to
answer a question concerning the linear correlation between the number
of hours worked per week and the number of credit hours taken for those
students who worked, Amelia used all the responses in the data set
including those students who did not work. However, as time
progressed, Amelia successfully showed her consciousness of including
only data that were relevant to the question of concern. In her project of
making inferences of her Facebook friends’ age, Amelia examined only
those responses “where age has been reported”. When estimating the
proportion of her Facebook friends who attended college, Amelia
consciously included only friends who “have reported attending college”
to show her awareness of avoiding the inclusion of irrelevant data.
b. Understanding statistical concepts and terminology
In learning the course topic of Descriptive Statistics in the
beginning of the semester, Amelia showed no difficulties in
differentiating the statistical terms. However, facing the many new
statistical terms appeared in learning new course topics, Amelia
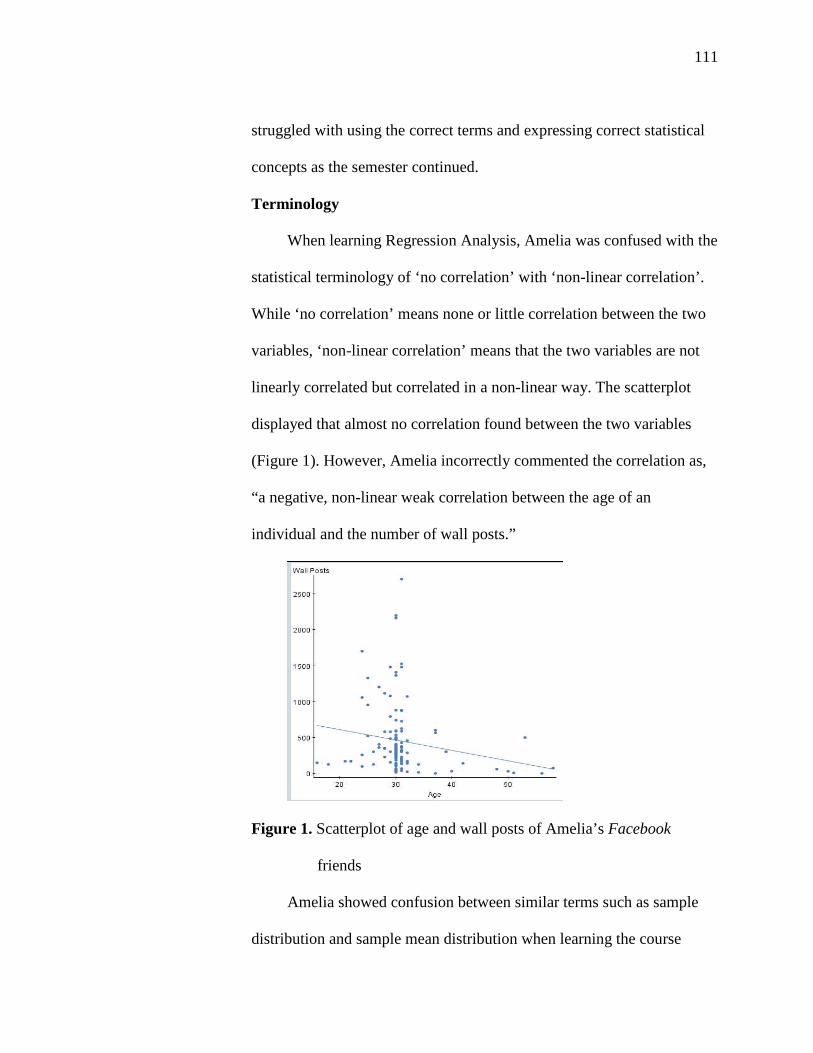
111
struggled with using the correct terms and expressing correct statistical
concepts as the semester continued.
Terminology
When learning Regression Analysis, Amelia was confused with the
statistical terminology of ‘no correlation’ with ‘non-linear correlation’.
While ‘no correlation’ means none or little correlation between the two
variables, ‘non-linear correlation’ means that the two variables are not
linearly correlated but correlated in a non-linear way. The scatterplot
displayed that almost no correlation found between the two variables
(Figure 1). However, Amelia incorrectly commented the correlation as,
“a negative, non-linear weak correlation between the age of an
individual and the number of wall posts.”
Figure 1. Scatterplot of age and wall posts of Amelia’s Facebook
friends
Amelia showed confusion between similar terms such as sample
distribution and sample mean distribution when learning the course

112
topics of Sampling & Inferences on Population Means and Sampling &
Inferences on Population Proportions. The misusages of these terms
stemmed from the confusions of the terms learned in the beginning of
the semester. In Descriptive Statistics, Amelia understood clearly about
the terms such as population, sample, mean, and proportion. However,
Amelia later developed her own terms that were not part of the statistical
terminology such as ‘population mean distribution’, ‘mean population
proportion’, and ‘mean sample proportion’.
Apart from the misusages of the terms mentioned, the term
‘degrees of freedom’ was incorrectly interpreted as ‘margin of error’: “I
believe the degrees of freedom (or margin of error) is large.” Therefore,
Amelia interpreted the degrees of freedom of 24 as, “give or take 24
minutes”. At times, Amelia misused the term confidence level (used in
constructing confidence intervals) for significance level (used in
conducting hypothesis tests) and vice versa.
Statistical Concepts
An incorrect basic understanding of the term ‘level of significance’
was found in Amelia’s posting: “The level of significance is to
determine the strength of our test; it is also the probability that we will
make either a Type I or Type II error.” A misconception related to level
of significance appeared in her weekly discussions when Amelia made a
decision of a hypothesis test by comparing the p-value (2.6%) with the
level of significance (5%): “This result indicates that we can safely
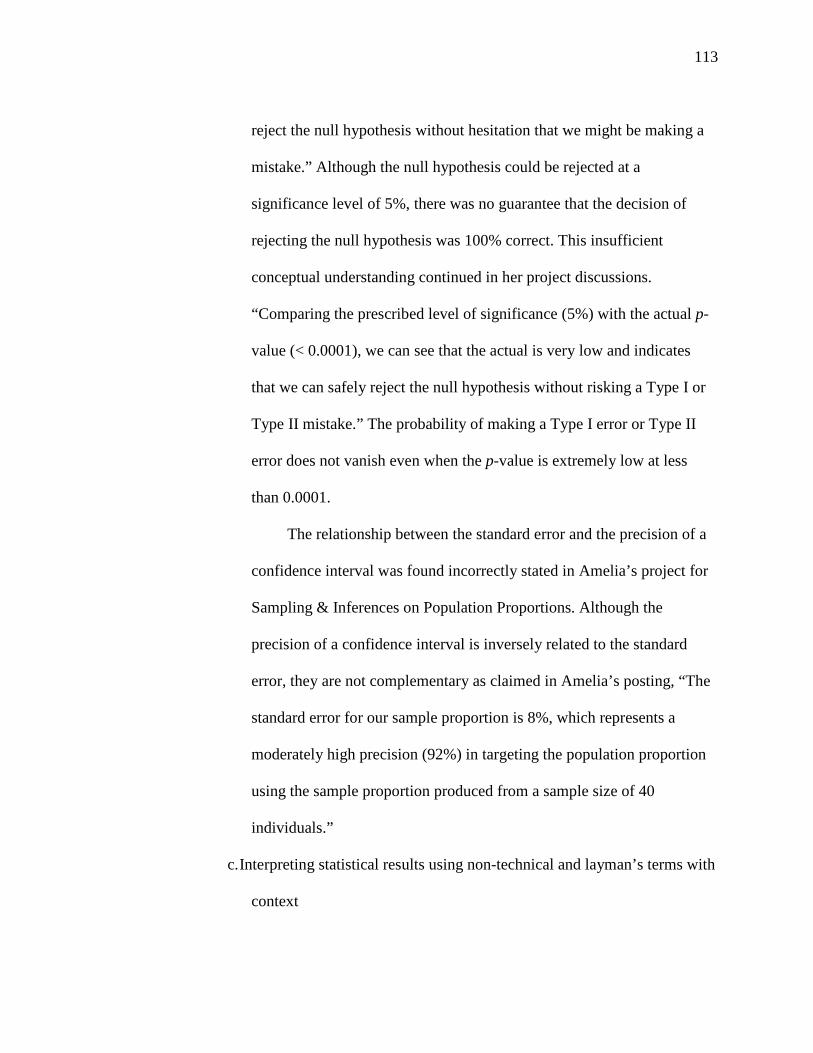
113
reject the null hypothesis without hesitation that we might be making a
mistake.” Although the null hypothesis could be rejected at a
significance level of 5%, there was no guarantee that the decision of
rejecting the null hypothesis was 100% correct. This insufficient
conceptual understanding continued in her project discussions.
“Comparing the prescribed level of significance (5%) with the actual p-
value (< 0.0001), we can see that the actual is very low and indicates
that we can safely reject the null hypothesis without risking a Type I or
Type II mistake.” The probability of making a Type I error or Type II
error does not vanish even when the p-value is extremely low at less
than 0.0001.
The relationship between the standard error and the precision of a
confidence interval was found incorrectly stated in Amelia’s project for
Sampling & Inferences on Population Proportions. Although the
precision of a confidence interval is inversely related to the standard
error, they are not complementary as claimed in Amelia’s posting, “The
standard error for our sample proportion is 8%, which represents a
moderately high precision (92%) in targeting the population proportion
using the sample proportion produced from a sample size of 40
individuals.”
c. Interpreting statistical results using non-technical and layman’s terms with
context
114
Context
Throughout the first weeks of learning the course topic of
Descriptive Statistics, Amelia was struggling with the inclusion of the
context when interpreting the statistical results. For instance, in the
weekly discussion of analyzing the number of photos tagged to a
Facebook page from a histogram (Figure 2), Amelia wrote, “… the
majority of values (number of photos that have this page tagged) is high
for the values between 0-500” when she actually meant that the majority
of the mosques in the survey had 500 or fewer photos tagged on their
Facebook pages. This same issue of lacking the context appeared in her
project posting for the course topic of Descriptive Statistics. After
finding an interval to determine the extremely old and young ages of her
Facebook friends, Amelia wrote, “So, any value outside of (28.5, 32.5)
of our data set is considered an outlier. There are several outliers within
this data set, which makes sense based on the other analysis done
above.” There was no mentioning of the age when interpreting the
outliers.
115
Figure 2. Histogram of the number of photos tagged on a Facebook
page
The issue of reporting the results with no context continued in her
weekly discussions when making inferences about population means.
Although Amelia demonstrated good understanding of the terms used in
hypothesis testing such as null hypothesis, alternative hypothesis, Type I
error, Type II error, p-value, and level of significance, no proper context
was included when making interpretations of these terms. For example,
in testing the mean lecture length being longer than 80 minutes, Amelia
interpreted the null hypothesis as, “the population mean is no different
than 80 minutes”, and Type I error as, “if our data shows a population
mean greater than 80 minutes; when in fact, 80 minutes is the true
population mean.”
116
Non-technical Terms
In posting her weekly discussions for the topic of hypothesis
testing on population proportions, the interpretation of the terms was
laden with technical terms such as ‘reject’, ‘accept’, ‘null hypothesis’,
and ‘fail to’. These technical terms added to the difficulty in
understanding the conclusion of the statistical results. The following
interpretation of the terms Type I error and Type II error was found in
her weekly discussions:
A Type I error will occur if we reject our null hypothesis by failing
to determine that 50% of the surveyed Muslim population believed
the story to be false when in fact 50% is the accurate population
proportion who hold this belief. A Type II error will occur if accept
the determination that 50% believed the story to be false when the
population proportion who came to this conclusion is not 50% and
this hypothesis should be reject.
A similar posting of the interpretation of a Type I error and Type II
error was also found to be incomprehensible in Amelia’s project.
2. Findings associated with statistical reasoning
a. Understanding statistical processes
Amelia understood the statistical processes of analyzing
descriptive statistics of one variable and finding correlation between two
quantitative variables. However, Amelia showed difficulties in the
process of making inferences on a population parameter.
117
Randomization and Normality Assumptions
Amelia had vague concepts about the randomization and normality
requirements for conducting inferential statistical analysis. When
commenting on the randomization requirement for estimating a
population mean in her weekly discussions, Amelia stated, “We would
not be able to construct a confidence interval if our data was not
collected through voluntary surveys or other reliable methods – because
no methods for determining the confidence intervals exist in this case.”
Unlike what Amelia commented, a confidence interval could be found
even if data were from a non-random sample. However, the statistical
results obtained could not be inferred to the entire population. As for the
normality requirement, it refers to the requirement of the sample mean
distribution being somewhat symmetric. One of the possibilities for a
sample mean distribution to be symmetric is, according to the Central
Limit Theorem, when the distribution of the population where the
samples are drawn from is symmetric. However, Amelia quoted the
other way around, “Based on the Central Limit Theorem, if the sample
mean distribution shape is symmetric, it can be assumed that the
population distribution shape will also be symmetric.” This same
mistake was also found in her project.
A similar normality assumption was required in making inferences
of comparing two population proportions. The normality assumption
includes the fulfillment of large samples (at least 10 successes and 10

118
failures in each sample) and big populations (population size should be
at least 10 times of its sample size). In the project, Amelia compared the
proportions of liking a book between her male and female Facebook
friends through conducting a hypothesis test. Prior to the test, Amelia
mistakenly concluded that both of the requirements were satisfied when
there were only seven successes (providing the title of the book liked) in
the sample of her male Facebook friends. Using a sample size of 50
male friends, Amelia needed to have at least 500 male Facebook friends.
With a total number of 414 Facebook male and female friends, unless
sampled with repetition, the big population requirement could not be
satisfied.
Level of Significance
In discussing the choice of a significance level for testing a
population proportion in her weekly discussions, Amelia wrote, “Since
our population size is pretty small, it’s important to not have a
significance level that is too high or too low.” Firstly, the size of the
population was large since the population associated with the survey
consists of all the Muslims in 27 countries. Secondly, the choice of
significance level is not related to the population size. Rather, the choice
of the significance level is related to the consideration of the probability
of making a Type I error or Type II error. Choosing a lower significance
level restricts the chance of making a Type I error, unlike what Amelia
claimed, “Our likelihood of making a Type I error increases if the level
119
is too low.” Although Amelia no longer linked the significance level to
the population size in her project posting, the choice of significance
level at 5% was not theoretically justified. Amelia understood that the
level of significance was used to represent as a standard “to determine
whether to reject the null hypothesis or not.” However, she contradicted
the purpose of the level of significance by saying, “I have chosen this
based on the moderate requirement that we do not want to commit a
Type I error by rejecting the null hypothesis in error, when in fact it is
true.” By choosing the level of significance at 5%, one allows up to 5%
chance of committing a Type I error. If one is serious in avoiding
making a Type I error, a lower level of significance, for example, 1%,
should be used instead of 5%.
Estimating ‘Mean’ Proportion
When estimating the proportion of her Facebook friends who
reported having attended college in the project, Amelia was supposed to
construct a confidence interval for the population proportion of her
Facebook friends who reported having attended college. However,
stemmed from the lack of data consciousness between the mean
(quantitative data) and the proportion (qualitative data), Amelia
constructed a 95% confidence interval for the ‘mean population
proportion’ of her Facebook friends who reported having attended
college. The interval was constructed by treating the sample proportion
of 50% of her Facebook friends who reported having attended college as
120
the sample mean. Amelia made the same mistake of treating the sample
proportion of her Facebook friends residing in Los Angeles (11%) as the
sample mean when conducting a hypothesis test in her project.
Continued with the confusion between the mean and the proportion,
Amelia incorrectly set up the statistical procedure to test the difference
of two ‘mean’ proportions between her male and female friends. Hence,
the hypothesis testing was on the difference of two means rather than the
difference of two proportions, which contributed to invalid statistical
results.
Hypothesis Test
Even though making inferences of proportion was mistaken by
making inferences of mean, Amelia understood the purpose of a
hypothesis test was to seek the opportunity (with significant sample
evidence) to reject the null hypothesis. This correct statistical concept
about a hypothesis test was shown in the following explanation,
“Meaning, the assumption for our hypothesis is that 50% of the Muslims
in the surveyed 27 countries considered the story to be false. We are
seeking to determine whether there’s evidence to conclude that more
than 50% believed the story to be false.”
b. Being able to interpret statistical results
In the beginning of the semester when learning the topics of
Descriptive Statistics and Regression Analysis, Amelia was unsure what
to look for from the statistical results produced from StatCrunch. She

121
was also confused with how to interpret the statistical results. However,
Amelia showed more confidence knowing what to interpret and became
more comfortable in the interpretation of the results toward the semester
end when learning the topic of Sampling & Inferences of Population
Proportions.
Descriptive Statistics
When analyzing the number of photos tagged on a Facebook page
from a graphical display in the weekly discussions for the course topic
of Descriptive Statistics (Figure 2), Amelia described only the shape of
the data distribution. There was no mentioning of the number of mounds
and no discussion on the unusually large amount of photos tagged on the
Facebook pages. A similar discussion of the age of her Facebook friends
through a graphical display was posted in Amelia’s project. From the
dotplot constructed in StatCrunch (Figure 3), Amelia incorrectly
concluded from the dotplot display that the shape was a skewed
distribution. Although there was a mentioning of having “one mound
within this data set”, there was no interpretation of the mound. No
discussion of unusual/extreme values was reported, either.
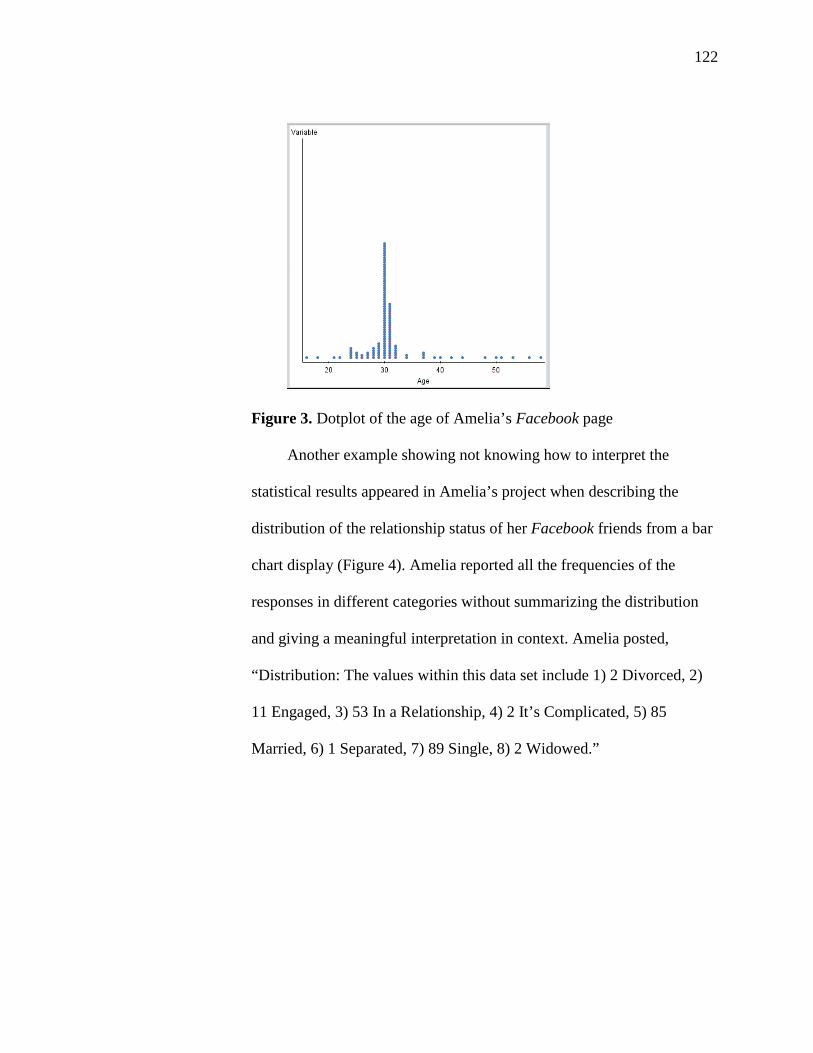
122
Figure 3. Dotplot of the age of Amelia’s Facebook page
Another example showing not knowing how to interpret the
statistical results appeared in Amelia’s project when describing the
distribution of the relationship status of her Facebook friends from a bar
chart display (Figure 4). Amelia reported all the frequencies of the
responses in different categories without summarizing the distribution
and giving a meaningful interpretation in context. Amelia posted,
“Distribution: The values within this data set include 1) 2 Divorced, 2)
11 Engaged, 3) 53 In a Relationship, 4) 2 It’s Complicated, 5) 85
Married, 6) 1 Separated, 7) 89 Single, 8) 2 Widowed.”
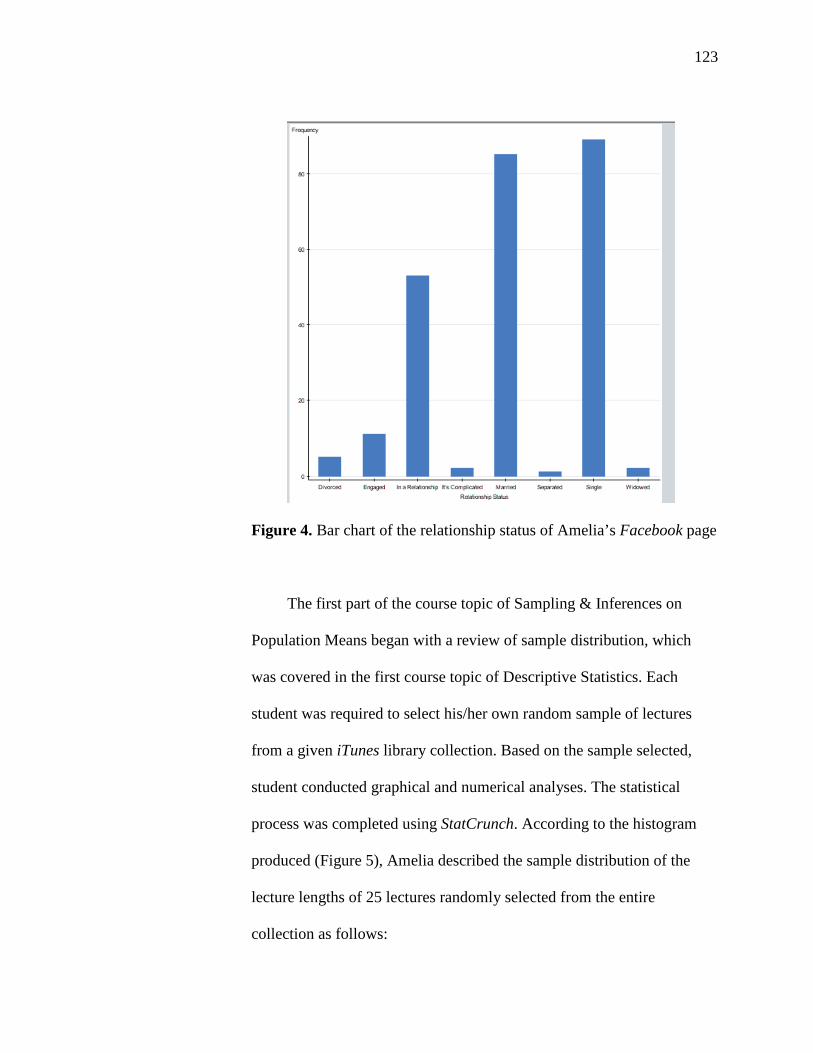
123
Figure 4. Bar chart of the relationship status of Amelia’s Facebook page
The first part of the course topic of Sampling & Inferences on
Population Means began with a review of sample distribution, which
was covered in the first course topic of Descriptive Statistics. Each
student was required to select his/her own random sample of lectures
from a given iTunes library collection. Based on the sample selected,
student conducted graphical and numerical analyses. The statistical
process was completed using StatCrunch. According to the histogram
produced (Figure 5), Amelia described the sample distribution of the
lecture lengths of 25 lectures randomly selected from the entire
collection as follows:
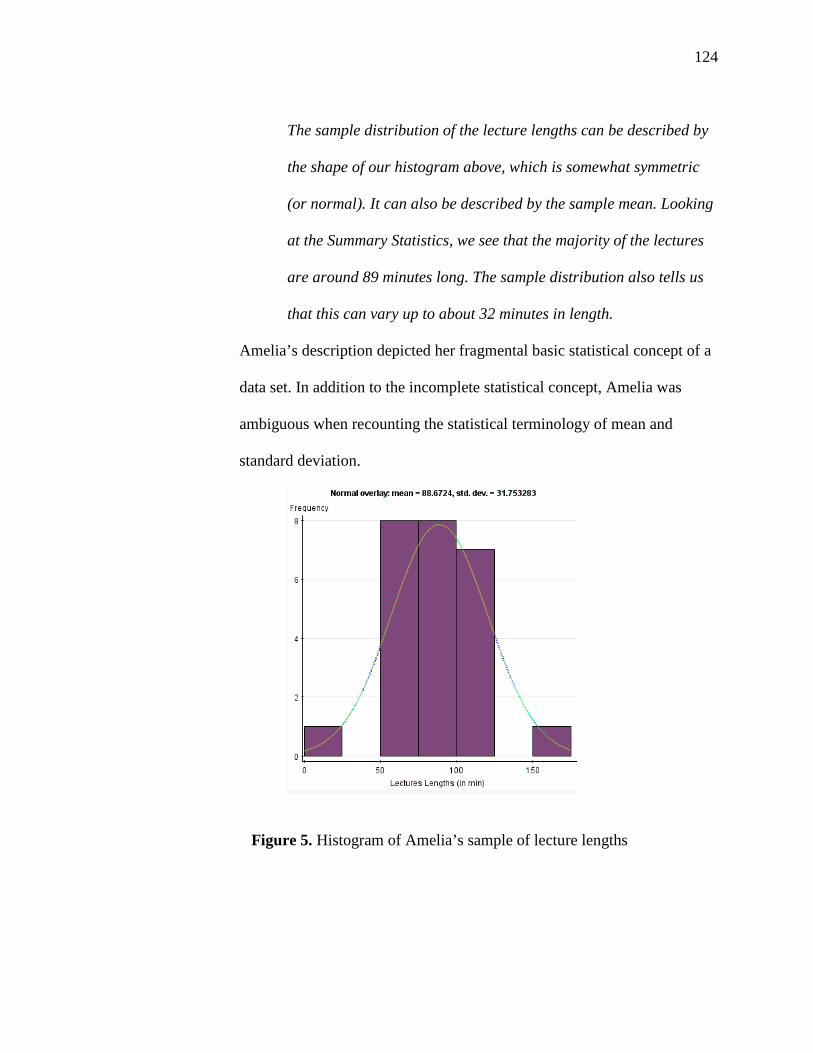
124
The sample distribution of the lecture lengths can be described by
the shape of our histogram above, which is somewhat symmetric
(or normal). It can also be described by the sample mean. Looking
at the Summary Statistics, we see that the majority of the lectures
are around 89 minutes long. The sample distribution also tells us
that this can vary up to about 32 minutes in length.
Amelia’s description depicted her fragmental basic statistical concept of a
data set. In addition to the incomplete statistical concept, Amelia was
ambiguous when recounting the statistical terminology of mean and
standard deviation.
Figure 5. Histogram of Amelia’s sample of lecture lengths

125
Regression Analysis
When learning Regression Analysis, Amelia demonstrated
difficulties in recognizing the regression outliers and clusters through the
scatterplot due to the misunderstanding of these statistical terms. In
particular, Amelia confused the regression outliers with the outliers from
a one-variable data set. Due to this confusion, in analyzing the existence
of the regression outliers and the clusters from the scatterplot produced
between work hours and credit hours in her weekly discussions (Figure
6), Amelia incorrectly concluded, “The student worked 44 hours per
week while taking 4 credit hours in school” as a regression outlier.
Amelia continued to discuss whether this regression outlier could be
considered as influential, “The outlier doesn’t seem very influential in
the overall trend, shape and strength of the scatterplot.” An influential
regression outlier influences the strength of the correlation between the
two variables, not “the strength of the scatterplot” as explained in
Amelia’s posting. The underlying issue of this statement is the
misconception of what a scatterplot could provide. Scatterplot is a means
used to visualize the correlation between the two studied variables. It is
inappropriate to discuss the trend, shape or the strength of a scatterplot.
Rather, it is more suitable to analyze the trend, shape, and the strength of
the correlation between the two variables. As for the clusters, it should
be apparent that there were no clusters formed in the scatterplot.
However, Amelia posted, “There are also a few clusters.”

126
Figure 6. Scatterplot of work hours and credit hours
Amelia did not overcome the challenges of correctly recognizing
the regression outliers and clusters from the scatterplot in her project
discussions when she analyzed the relation between the age and the
number of wall posts of her Facebook friends (Figure 1). In contrast to
Amelia’s posting, “There does not appear to be any outliers in the
scatterplot”, several regression outliers appeared. They were the
individuals with ages around 30 and having more than 2000 wall posts.
As for the clusters, unlike what Amelia claimed, “There are several
clusters around the age of 30 and between 0-500 wall posts”, there were
two clusters found in the scatterplot produced from her Facebook
friends. One cluster contains the majority of the observations that are
following the negative trend indicating that the older the individual is the
fewer number of wall posts on his/her Facebook page. The other cluster
appeared on the scatterplot was the group of those regression outliers.
127
Those regression outliers were the individuals who were at the age of 30
but with many more wall posts (more than 2000) on their Facebook
pages than the other Facebook friends who were at the age of 30 with
fewer than 2000 wall posts on their Facebook pages.
In the project discussions for the topic of Regression Analysis,
Amelia reported the slope and y-intercept of the regression model
produced through StatCrunch with no interpretation of the terms in
context. Even though the y-intercept of 898 had no practical meaning in
context since it represented the number of wall posts on her Facebook
friend’s page when her friend was at the age of 0, there should be a
mentioning in this regard. The slope of the regression model was
reported as −14.42with no interpretation in context. However, Amelia
knew how to use the slope to explain the negative trend, “The slope is
−14.42. This makes sense because we can see a dramatic decrease in the
number of wall posts for individuals who are older than 30.”
The coefficient of determination (r2) was also incorrectly
interpreted in the project. Amelia understood that r2 measured the
quality of the regression model but failed to interpret it correctly. With
an r2 of 3%, in context, it means that the percentage of the variation of
the number of wall posts that can be explained by the regression model
through age was only 3%. Amelia’s incorrect understanding of r2 was
depicted in the following posting: “The r-squared for this particular
128
regression line is 3%, which means to predict the number of wall posts
based on age using this line would be accurate only 3% of the time.”
3. Findings associated with open-ended interview & summary
Amelia’s open-ended interview question given at the end of the semester
was related to the topic of Regression Analysis (Appendix J). Amelia’s reply to
the first part of the interview reflected her capability of thinking statistically.
Specifically, Amelia understood that the appropriate statistical process she
should employ to investigate the question assigned to her was through
regression analysis.
Well since the values within the data set are paired and we would like to
see the relationship (whether strong or weak; positive or negative, linear
or non-linear) between the two values, I am thinking a regression analysis
would be the best method to answer the question. For instance, I would
imagine that the outcome of our results might say something like "It is
typical that when a brother is 65 inches tall, his sister would usually be
about 62 inches tall." or something to that effect.
The second part of the interview evaluated the statistical reasoning ability.
While her reply reflected clear understanding of the process of conducting a
regression analysis, Amelia failed to correctly interpret some of the statistical
results such as commenting on the existence of the regression outliers from a
scatterplot, describing incorrectly the correlation as nonlinear, and interpreting
incorrectly the coefficient of determination (r2).

129
Based on looking at the scatterplot, it seems as though there is definitely a
moderately-positive-nonlinear correlation because the dots are not
forming one line; there are outliers and although the trend does not
necessarily seem to move upward in a distinguishable way, it certainly
does not seem to move downward. If I had to choose between positive and
negative based on the scatterplot alone, I would say positive.
Also, when I review the regression model the r (correlation coefficient)
reflects the same thing I was observing from the scatterplot. There is
about a 55% (or, moderate but slightly positive) correlation between the
heights of the brothers and the sisters.
I would not use this regression model to predict Tonya's height based on
her brother Damian's height because the R-sq value is very low; the R-sq
value represents the strength of the model. It is approximately 31%. This
tells me that the model would likely be accurate in approximately 3 out of
10 predictions.
As for the statistical literacy, Amelia could verbalize the statistical
terminology correctly except for the term “slightly positive” correlation. While
the magnitude of the correlation coefficient reflects the strength of the
correlation, the sign of the correlation coefficient portraits the positive or
negative trend of the correlation. A 55% correlation indicates a positively
moderate correlation between the variables. Moreover, the lack of thorough
understanding of the statistical terminology attributed to the incorrect
130
interpretation of the statistical results of regression outliers, nonlinear
correlation, and coefficient of determination (r2) as mentioned above.
In summary, Amelia established the skills of knowing what and how to
investigate a statistical question regarding the topic of Regression Analysis.
Amelia’s greatest improvement in learning the course of introductory statistics
reflected on her having data consciousness including being able to differentiate
between qualitative data and quantitative data, and having consciousness of
dealing with missing data in an appropriate way. Being able to communicate
statistical results with people who are not familiar with statistics was another
big achievement for Amelia in learning the course. Amelia progressed from
interpreting the results without including the context to being able to use non-
technical terms with the context. By the end of the course, Amelia was able to
discuss the statistical results with comfort. However, she did not overcome the
difficulties of correctly interpreting the statistical results. Her deficiencies in
giving correct interpretation stemmed from incorrect statistical concepts due to
the lack of thorough understanding of the statistical terminology.
Charlie. 1. Findings associated with statistical literacy
a. Data consciousness
Data Type
Not being able to differentiate between qualitative data and
quantitative data was found in Charlie’s postings. One instance of
confusion between the data types appeared at the time of learning
131
Regression Analysis. Students were asked to choose two quantitative
variables of their own and conduct an analysis of the correlation between
the two chosen quantitative variables. The two variables Charlie chose
were the birth year of his Facebook friends and the number of wall posts.
Although the variable of the number of wall posts was quantitative, the
variable of birth year was not. Charlie mistook the seemingly quantitative
display of the birth year (1993, for example) as a quantitative variable.
Another instance of negligence of differentiating between the data
types occurred when learning Sampling & Inferences on Population
Means. In his project, Charlie posted, “The quantitative variable I chose
for this portion of the project is ‘Age’.” However, instead of estimating the
mean age of his Facebook friends, Charlie stated, “Of the 280 individuals,
my claim is that at least 75% of them are younger than 25.” Apparently,
Charlie was not aware that estimating proportion (75%) involved
analyzing qualitative data of the ‘yes’ count to the survey question ‘Are
you younger than 25?’ rather than analyzing the quantitative data of age.
Valid Data
In the beginning of the course, Charlie did not establish the
consciousness of handling the missing data. This can be seen in his project
for Descriptive Statistics when he chose to analyze the relationship status
of his Facebook friends (Figure 7). Without excluding the missing data,
Charlie concluded that the mode was “the category marked with the
asterisk” where asterisk represents the missing data. Charlie translated the
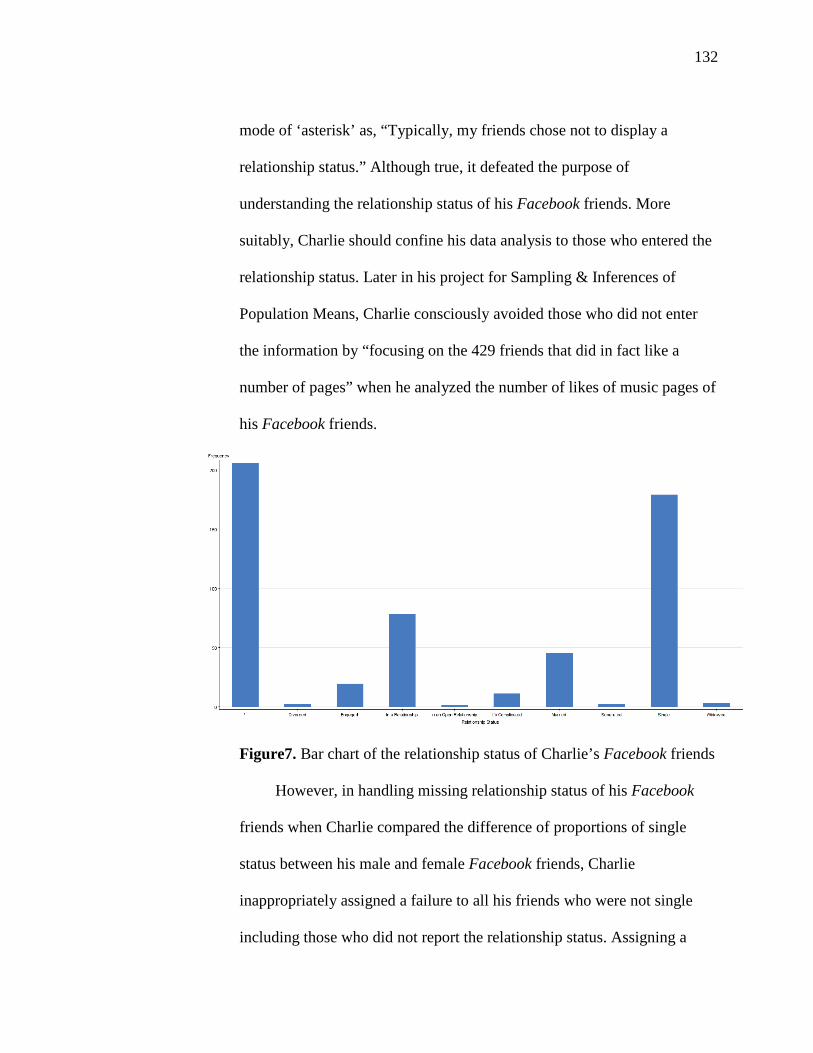
132
mode of ‘asterisk’ as, “Typically, my friends chose not to display a
relationship status.” Although true, it defeated the purpose of
understanding the relationship status of his Facebook friends. More
suitably, Charlie should confine his data analysis to those who entered the
relationship status. Later in his project for Sampling & Inferences of
Population Means, Charlie consciously avoided those who did not enter
the information by “focusing on the 429 friends that did in fact like a
number of pages” when he analyzed the number of likes of music pages of
his Facebook friends.
Figure7. Bar chart of the relationship status of Charlie’s Facebook friends
However, in handling missing relationship status of his Facebook
friends when Charlie compared the difference of proportions of single
status between his male and female Facebook friends, Charlie
inappropriately assigned a failure to all his friends who were not single
including those who did not report the relationship status. Assigning a
133
failure to a missing status was assuming the friend was not single, which
may not be the case. The incorrect handling of the missing data produced
inaccurate statistical results.
b. Understanding statistical concepts and terminology
Terminology
In learning the course topic of Descriptive Statistics, there were no
major issues for Charlie in regard to the understanding of terminology.
However, as the semester continued, new statistical terms were introduced
with the new topics. It seemed that Charlie was overwhelmed by the large
number of statistical terms. Many incomplete statistical concepts were
detected in his postings due to the incomprehension of the terminology.
The misuse of the statistical terms related to statistical inferences
appeared several times in Charlie’s postings. For example, ‘average’ is
used to replace the statistical term ‘mean: “The parameter will be the
average number of music likes amongst my friends.” Charlie was
confused constructing a confidence interval with conducting a hypothesis
test. He used the term ‘confidence interval test’ as in this posting: “With
these two factors, the sample results used above qualify 95% confidence
interval test.” The confusion between a sample mean distribution and a
sample distribution was seen when Charlie incorrectly used sample
statistics in describing the center and the variation of a sample mean
distribution.

134
Perhaps the most confusing usage of the statistical terms for Charlie
was the misusage between proportion and mean. Attributing to the lack of
data consciousness, Charlie mistakenly termed the proportion as the mean.
For example, in his weekly discussions where the word ‘United’ was
found 12 times in his random selection of 1000 words from a text.
Therefore, the sample proportion of having the word ‘United’ in his
sample was 0.012. However, Charlie used the statistical term ‘mean’ to
describe the numerical value of 0.012: “From 1000 words taken from the
text, the mean was 0.012.” This same mistake occurred again in his project
discussions when he found the proportion of his female Facebook friends
to be 0.516 but termed it as the mean.
The confusion between proportion and mean continued when Charlie
discussed the center of the sample proportion distribution in his project.
The center of a sample proportion distribution should be the population
proportion. However, Charlie stated, “We use the mean to determine the
center” when no mean could be found from qualitative responses. This
confusion between proportion and mean contributed to the claim stated in
his project that he wished to estimate “the number of friends that are
female”. The term “number of friends” was falsely stated and gave an
impression of dealing with a quantitative variable when in fact the variable
should be ‘gender’, a qualitative variable.
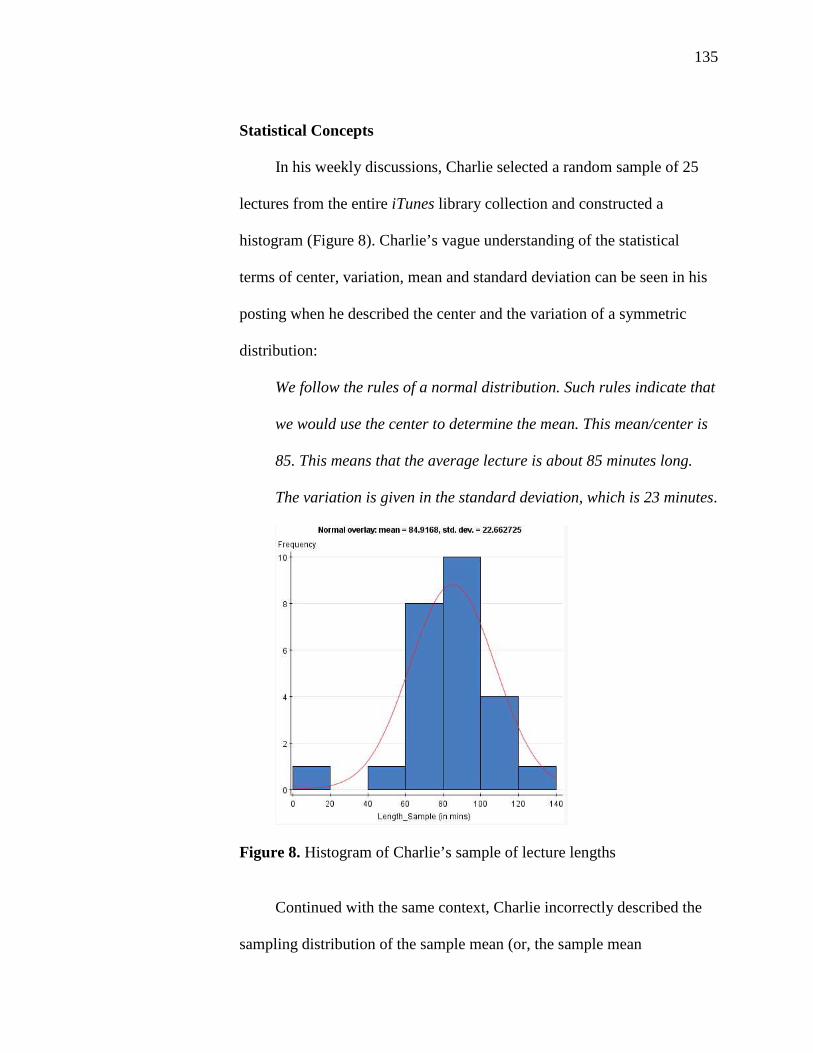
135
Statistical Concepts
In his weekly discussions, Charlie selected a random sample of 25
lectures from the entire iTunes library collection and constructed a
histogram (Figure 8). Charlie’s vague understanding of the statistical
terms of center, variation, mean and standard deviation can be seen in his
posting when he described the center and the variation of a symmetric
distribution:
We follow the rules of a normal distribution. Such rules indicate that
we would use the center to determine the mean. This mean/center is
85. This means that the average lecture is about 85 minutes long.
The variation is given in the standard deviation, which is 23 minutes.
Figure 8. Histogram of Charlie’s sample of lecture lengths
Continued with the same context, Charlie incorrectly described the
sampling distribution of the sample mean (or, the sample mean
136
distribution) as follows: “The sampling distribution of the sample mean is
85.” Sampling distribution of the sample mean is a distribution of all the
sample means of all the samples with the same sample size randomly
selected from the population. It is a distribution describing the collection
of sample means, not just one sample mean as described by Charlie.
Putting in context, the sample mean distribution should be described as the
distribution of the sample mean lengths of all the samples of 25 lectures
randomly selected from the entire collection. Charlie continued to say,
“This is in accordance to the Central Limit Theorem which states the
population mean would be the same as the mean for the 25 lectures used in
the sample.” The mean of 25 lectures selected in a sample is the sample
mean. The sample mean, mostly likely, is not the same as the population
mean. Rather, the mean of all the sample means collected in the sample
mean distribution is, according to the Central Limit Theorem, the same as
the population mean.
Charlie was confused with the two important probabilities involved
in hypothesis testing, namely, level of significance and p-value. In testing
the hypothesis that the mean lecture length of all the lectures in the
collection to be longer than 80 minutes, Charlie wrongly interpreted the
significance level as a probability of null hypothesis being true. Rather,
the significance level should be the probability of rejecting the null
hypothesis when in fact the null hypothesis is true. With the inclusion of
confusing technical terms and an incorrect interpretation, Charlie
137
incorrectly explained the meaning of using a significant level at 5% as,
“The probability of making a false inference based on the random sample
we obtained which was a mean lecture length greater than 80, is only 5%.”
Similar to the level of significance, the p-value shows the probability
of making a Type I error based on the sample evidence. The smaller the p-
value is, the less probability of making a Type I error according to the
sample evidence. Hence, the smaller the p-value is, the stronger the
evidence to reject the null hypothesis. The value of the p-value should not
be used to judge the truth-value of the null hypothesis. However, Charlie
showed his incorrect conceptual understanding of the p-value when
commenting, “The smaller the p-value, the more likely it is that the null
hypothesis is false.” This exact same wording showing the misconception
of the p-value was posted again weeks later in his weekly discussions
when testing a population proportion.
c. Interpreting statistical results using non-technical and layman’s terms with
context
Context
Charlie failed to include the context when making an interpretation
of the statistical results. For instance, “The variation of the sample is
shown by the standard deviation which is 22”, and “The confidence
interval (17.40, 27.71) means that we can conclude with a 95% level of
confidence that the mean is between these two numbers.”
138
Non-technical Terms
In hypothesis testing, the interpretation of a Type I error and Type II
error using non-technical terms was especially challenging for Charlie.
Although Charlie understood that a Type I error would be made “if I said
the null hypothesis was false when in fact it was true”, the interpretation
made in his weekly discussions was unclear and incomplete: “if I said of
the Muslims [in the] surveyed [27 countries], there was not exactly 50%
who believed the story to be untrue.” In the project, the interpretation
Charlie made on a Type I error and Type II error regarding his Facebook
friends residing in California was again incomprehensible and confusing.
Type I error would have been if I would have rejected the null
hypothesis stating that 55% of my friends resided in California when
there was significant evidence to prove otherwise. If I would have
failed to reject this hypothesis of 55% of my friends residing in
California and there was not significant evidence to prove my
hypothesis, I would have made a Type II error.
2. Findings associated with statistical reasoning
a. Understanding statistical processes
Hypothesis Test
In discussing the hypothesis testing on a claim that the mean lecture
length of all the lectures collected in the researcher’s YouTube library
collection to be longer than 80 minutes, Charlie’s comments on the
139
hypotheses revealed his incorrect conceptual understanding of the process
of hypothesis testing.
The null hypothesis is only an estimate so expect this to be wrong.
We would like to keep this estimate only moderately wrong. This
means it should more accurate than not. The alternative hypothesis
is more general. It deals with greater than and/or less than which
allows for a broader range of accuracy.
When making inferences of population proportions, Charlie still
struggled with the incomprehensive understanding of the hypothesis
testing process. He posted in his weekly discussions, “As stated in the
module, we would first assume the null hypothesis to be true which states
that exactly 50% of the Muslims [in the] surveyed [27 countries] believed
the story to be untrue.” To be able to reject the null hypothesis, one needed
to have significant sample evidence. Without giving the explanation why
the sample evidence was significant, Charlie wrote, “I do believe the
evidence to be statistically significant. There is no indication of
otherwise.” On the other hand, having significant sample evidence does
not justify the eligibility of making inferences to the population. Rather,
inferences can only be made when the sample statistic was obtained from
a representative sample. However, Charlie went on to say, “We would use
the sample evidence to make inferences that apply to the whole
population” without addressing the issue of the sample being
representative.
140
Charlie’s project discussions on the hypothesis testing showed a
serious flaw of his understanding the process. The statistical concept of
testing a population parameter is to use a sample statistic as the evidence
and conclude about the hypothetical parameter without having the
knowledge of the parameter. In the project, Charlie tested the hypothesis
of having majority of his Facebook friends claiming California as their
hometown state. He began by finding the proportion (55%) of all of his
Facebook friends who claimed California as their hometown state. With
the known population proportion of 55%, Charlie tested that the
population proportion of his Facebook friends who claimed California as
their hometown state to be 55%. Sure enough, the testing result was that
55% of his Facebook friends were from California.
In preparing and getting ready to conduct a hypothesis test, much
statistical concept is involved in making the choice of level of
significance, checking the satisfaction of the requirements for testing, and
making the choice of a test statistic. Charlie’s misconceptions on these
issues were revealed in his postings.
Level of Significance
Choosing an appropriate significance level is to safeguard the
minimal tolerance of committing a Type I error. There was no ‘accurate’
level of significance as claimed in Charlie’s weekly discussions: “The
significance level I would use would be 5%. I chose to use this because it
is usually an accurate alpha to use when conducting a hypothesis test.”

141
Normality Assumption
The requirement of the normality assumption for inferring the
population mean is to ensure the eligibility of converting the sample
statistic into a standardized z score or t score. However, Charlie reversed
the cause and the consequence: “The normality assumption aspect is
satisfied by the fact that the sample uses a z-score which means it has a
normal distribution.” Later for constructing a confidence interval to
compare the difference of proportions of single status between his male
and female Facebook friends, Charlie failed to check the minimum
requirements of at least 10 successes (having a single status) and at least
10 failures (not having a single status) to satisfy part of the normality
requirements. Of Charlie’s samples of 25 male and female Facebook
friends, only 9 were non-single in the male sample and only 8 were single
in his female sample. The confidence interval constructed was considered
invalid due to the failure of meeting the minimum success and failure
requirements.
Test Statistic
The choice of a test statistic for inferring a population mean depends
on the availability of the population standard deviation. A t test statistic
should be used in replacement of the z test statistic when testing a
population mean with an unknown population standard deviation. Charlie
made an incorrect choice of a z test statistic in his weekly discussions.
However, the justification of using a z score was because “we are dealing
142
with a sample”. This incorrect choice continued in his project discussions.
Charlie constructed a z confidence interval instead of a t confidence
interval when the population standard deviation was not available.
Similarly, the incorrect choice of a z test over a t test occurred for testing
the mean age of his Facebook friends and testing the difference of mean
number of viewers between two YouTube channels under the situations
where the population standard deviations were not available.
b. Being able to interpret statistical results
Descriptive Statistics
In regard to the course material of Descriptive Statistics, Charlie was
not sure how to describe the distribution of the number of photos tagged to
Facebook pages from a histogram (Figure 3). Without the context, Charlie
posted,
The graph is skewed to the right. This indicates that the number of
photos that have this page tagged is most frequent from 0-500 and
declines from this point on. The graph has 1 mound, which shows
that the sub group of 0-500 is larger than the rest of the sub groups.
With the majority of the Facebook pages surveyed having up to 500
photos tagged, the one having more than 4000 photos tagged to the page
should be considered as unusual. However, Charlie concluded, “There are
no unusual values because no values are unusually low or unusually high.”
143
Regression Analysis
In learning Regression Analysis, Charlie discussed the trend between
the number of hours worked per week and the number of credit hours
taken from a scatterplot (Figure 6). While the scatterplot clearly showed a
linear trend, Charlie concluded with a nonexistence of linear trend. One
possible explanation for Charlie not considering the trend as linear might
come from a wrong understanding that all the observations have to be
tightly close to a line to be considered as linear.
The coefficient of determination (r2) between the work hours and the
number of credit hours taken was found to be 72%, which indicated that
72% of the variation in the number of credit hours taken can be explained
by the work hours through the regression model. However, Charlie’s
posting in regard to the interpretation of the coefficient of determination
(r2) was incomplete: “Based on the linear regression model, roughly 72%
of the variation can be explained.” Furthermore, there was no mentioning
in Charlie’s posting that with an r2 of 72%, the model provided a good
prediction of the number of credit hours taken through the work hours.
Inferential Statistics
The concept of ‘proving’ the hypothesized parameter to be ‘true’ or
‘false’ through the results of a hypothesis test or a confidence interval was
incorrectly and repeatedly brought up by Charlie when learning the topics
of Sampling & Inferences for Population Means and Sampling &
Inferences for Population Proportions. Hypothesis testing involves using
144
sample evidence to reject or not to reject the hypothesized parameter.
Since the parameter is unknown, rejecting the hypothesized parameter
does not imply that it is a false hypothesized parameter. Likewise, failing
to reject the hypothesized parameter does not imply that it is a true
hypothesized parameter. Therefore, hypothesis testing cannot be used as a
proof process to conclude which hypothesis is true or false. In comparing
the difference between the mean numbers of views from two YouTube
channels when Charlie concluded, “There is significant evidence to prove
that there is a difference between the two means.”
The incorrect statistical concept of ‘proving’ one hypothesis being
‘true’ or ‘false’ appeared in learning the course topic of Sampling &
Inferences of Population Proportions. With a p-value of less than 0.0001,
one rejects the null hypothesis. In context, this would be interpreted as
more than 50% of the Muslims in the surveyed 27 countries considered the
story of killing Osama bin Laden was untrue. However, Charlie
concluded, “The null hypothesis is false in this case.”
Similarly, the truth-value of a parameter could not be confirmed
through the results of a confidence interval either. When Charlie discussed
the 95% confidence interval constructed for estimating the mean age of his
Facebook friends, he falsely confirmed that the sample mean age (22.55)
was the mean age of all his Facebook friends: “This means that we can say
with 95% level of confidence that the population mean is 22.55 based on
the results taken from the sample.”

145
In the weekly discussions on the topic of hypothesis testing on the
mean lecture length of all the lectures collected in researcher’s YouTube
library, Charlie incorrectly applied the rule of rejection and concluded
with an incorrect conclusion. The hypothesis test produced a p-value of
5.67%, which was higher than the significance level of 5%. With this
result, one should not reject the null hypothesis since the p-value was
greater than the significance level. However, Charlie decided to reject the
null hypothesis because “My p-value was slightly over 5%. My
interpretation of this is that the null hypothesis is significantly false.”
Charlie seemed to mistakenly consider the p-value as the probability of the
null hypothesis being false. He continued to state, “Even though the p-
value is not exactly what we would say to be false, it is rather close to
what we would call false.” In concluding the test results, Charlie rejected
the mean lecture length of all the lectures in the collection being 80
minutes long (as stated in the null hypothesis), but concluded that the
sample mean (89.04) should be the population mean, “The null hypothesis
stated µ = 80 when actually µ = 89.04.”
The same mistake was made in Charlie’s project discussions when
testing the mean age of his Facebook friends being younger than 25 years.
Charlie made the test decision subjectively according to his own wish
rather than following the objective rule of rejection.
The null hypothesis states that the average age of my friends would
be equal to 25. I would disagree in this case. I would much rather go
146
with the alternative hypothesis which states that the mean age of my
friends would be less than 25. This better suits my claim that at least
75% of my friends are younger than 25.
Another incorrect concept about the p-value appeared when
comparing the mean recitation times between the two reciters. With a
significance level of 5% and a p-value found to be 12.03%, Charlie stated,
“In this case it would be more than likely that the null hypothesis is false
because the 12.03% is rather close but to be on the safe side I wouldn’t
reject the null hypothesis. The alternative hypothesis held to be true.” A
large p-value suggests an insignificant sample evidence to reject the null
hypothesis. The magnitude of the p-value (large or small) should not be
used as an indication of true or false null hypothesis.
When explaining if one can conclude a plausible difference of
number of views between the two YouTube channels from a significant
hypothesis test result, Charlie stated, “There appears to a difference
between the two channels but it is hard to tell because the sample size and
standard deviations are different.” Hypothesis test results provide a test
statistic and a p-value. It does not provide a plausible interval of
differences between the two compared groups. The population means of
two independent groups can be compared using a two-sample t-test under
certain conditions with different sample sizes and sample standard
deviations. Therefore, sample sizes and standard deviations were
irrelevant to the question.
147
The misinterpretation of the results was also found when Charlie
interpreted the confidence interval constructed for comparing the
proportion of males and females having experiences with marijuana. The
confidence interval of the difference between two proportions was found
to be (5%,11%), which indicated that the percentage of male 12th graders
having experiences with marijuana was about 5% to 11% higher than the
percentage of female 12th graders having experiences with marijuana.
Charlie, however, incorrectly interpreted the interval result of
(5%,11%)as, “There is a difference in the proportion of males and
females who use Marijuana. We can say with a 99% level of confidence
that the difference between the two proportions is between 0.05 and 0.11.”
Charlie was confused by the statistical analyses of comparison
between two groups and with finding the association between two
variables. He constructed a confidence interval to compare the difference
of proportions of single status between his male and female Facebook
friends. However, Charlie posted, “I want to know if the fact that an
observation is male has any relation to a single status.” Because of the
misunderstanding, Charlie interpreted his confidence interval result of
(−3%,51%)as an indication of “being a male does make it more likely to
be single.”
3. Findings associated with open-ended interview and summary
Charlie’s interview question was related to making inferences of
population means, particularly, comparing the difference of two means from
148
dependent samples (Appendix K). The process could be accomplished through
either conducting a hypothesis test or constructing a confidence interval.
Charlie’s reply to the first part of the interview revealed his incompetency in
statistical thinking. The capability of viewing the entire statistical process as a
whole was not established through the learning of the course.
In this case I would use a 95% interval test to determine whether or not
male daters overstate their height in online dating profiles. The success in
this study would be yes the observation did overstate their height and
failure in this case would be if they put their actual height, understated
their height or did not list any height. One would have to determine the
actual height of the observations in the sample and compare such results
with the heights listed on the sites. The sample would have to be chosen at
random and the sample would have to fit the qualifications of the
normality assumption. To fit the normality assumption, the population
would have to be 10 times the sample size and the sample would have to
be large enough to have 10 successes and 10 failures. I chose this test
because it would give an unbiased estimation of the proportion of males
who did overstate their heights on their online profile. Such a test would
allow for inferences to be made on the entire population thus making it
possible to say if the majority of males overstated their height or not.
In the follow-up prompt, Charlie was asked to elaborate on the following
specific questions: Why would you prefer a confidence interval to a hypothesis
test? Are there any particular reasons of your choice? Also, please be specific
149
about the statistical analysis method you prefer, for instance, confidence interval
of what (parameter)?
Charlie’s responses to the follow-up questions were recorded below:
As I was reading my statement I wanted to change it but I remembered you
said once submitted we could not change it. I actually think a hypothesis
test would be more appropriate. I say this because I used majority. My
would be Ho =.50 and my null hypothesis would be >.50. I say this
because anything over .50 would be considered majority. I believe the
population parameter would be the Sampling Distribution of the Sample
Mean.
Charlie’s replies to the second part of the interview questions reflected his
shortages of statistical reasoning capabilities. Charlie did not understand the
statistical process given in the scenario. In addition, he failed to interpret the
statistical results correctly.
No there is not significant evidence that on average male online daters
overstate their height in online dating profiles. The confidence interval
states that the sample mean is between .31 and .83. The sample mean
height even differs from the actual mean by .57 and the standard deviation
in height is .81. These proportions are too large to make any inferences on
the population.
No he cannot generalize his conclusion [to all the online male daters].
Once again, his confidence interval has too large of a margin to make any
generalization. The interval is (.31, .83). If the sample mean falls at .32
150
then it would mean the majority of males don't overstate their height and if
the sample mean was .82 that would mean that the majority did overstate
their height.
In summary, Charlie struggled with interpreting statistical results correctly
throughout the semester. Charlie showed fragmented conceptual understanding
of the statistical processes of making inferences of the population means and
making inferences of the population proportions through conducting a
hypothesis test or constructing a confidence interval. In addition to the lack of
reasoning and thinking statistically, the interview results revealed Charlie’s lack
of fundamental understanding in the area of statistical literacy. Specifically,
Charlie showed no data consciousness when applying statistical analysis to the
data collected. Attention was not given to the data type prior to the data
analysis, which resulted in the uncertainty of inferring between means and
proportions. Incorrect and incomplete statistical terms were found when
responding to the interview questions. Solid understanding of the statistical
terms ensures sound statistical concepts. Charlie’s overall performance for the
entire course period was insufficient conceptual understanding in terms of
statistical literacy, reasoning, and thinking.
Harry. 1. Findings associated with statistical literacy
a. Data consciousness
Data Type
151
Harry displayed his consciousness of data type of a variable being
qualitative or quantitative throughout the entire study period. For example,
in his weekly discussions when learning Descriptive Statistics, he posted
“Since the variable of Popular Week is qualitative, the typical outcome
should be determined by the mode.”
Valid Data
In the beginning of the semester, Harry handled missing data
incorrectly. When analyzing the relationship status of his Facebook
friends, Harry included those who declined revealing their relationship
status in his analysis. Instead of concluding that typically, his Facebook
friends were single (after excluding the missing data), Harry concluded by
posting the following:
From my bar chart, I conclude that the relationship status with the
highest occurring frequency among my friends is actually ‘*’, which
means they have declined to list a relationship status … Therefore,
the center, or typical value of this data set, is * (declined to list).
Proper handling of the misinformed data is another aspect of having
consciousness of including the relevant data. When incorrect data are
detected, the statistician should take precaution of either correcting or
removing the data. The inappropriate handling of the misinformed age
provided by his Facebook friends was found in Harry’s project for
Descriptive Statistics. Harry explained how he handled the inaccurate data
when one of his Facebook friends reported an age of 107: “The Facebook
152
friend … is my friend [named removed], who was mostly likely
attempting a poor joke when he entered his age into Facebook, since I
know for a fact that he is 20 years old. However, as it pertains to our data,
his age is 107.”
Harry’s handling of the irrelevant data was corrected and
appropriately addressed for the remaining of the semester. In learning
Sampling & Inferences on Population Means, Harry excluded the missing
data as stated in his posting, “For this first part of the project, I have
chosen to estimate the population mean number of movie likes between all
my friends on Facebook that entered a value under the ‘# of movie likes’
column.” When learning Sampling & Inferences on Population
Proportions, Harry compared the proportions of his Facebook friends
having single status between male and female friends. He excluded those
data without specifying the relationship status prior to his random
selection of samples from his male and female Facebook friends.
b. Understanding statistical concepts and terminology
Terminology
The confusion between similar statistical terms was found in
learning Regression Analysis. For instance, Harry used correlation to
explain coefficient of determination (r2) of 72%: “The data shows that the
r-squared value reveals a 72% correlation. This is a high correlation
rating!” Another instance of confusion between similar terms was found
when Harry interpreted the coefficient of determination: “We understand

153
this to mean that a full 72% of the variance in the number of credit hours
can be explained by the above model.” Note that Harry was confused
between the terms variation and variance. Variation and variance are two
different statistical terms even though they have similar meaning.
Variation refers to the variability while a variance is a numerical value of
the square of a standard deviation.
The misusage of statistical terminology was also found in Harry’s
weekly discussions on the topic of sample mean distribution. Sampling
distribution of the sample mean is also known as sample mean
distribution. Harry incorrectly used “sampling distribution of the
population mean” for the term sampling distribution of the sample mean,
and “sample distribution mean” for the term sample mean distribution.
Statistical concepts
Harry was able to describe the sample distribution in terms of its
shape, center, and variation when learning the topic of Descriptive
Statistics. Specifically, Harry demonstrated the correct understanding of
the center of a data set: “Center is described as a typical value of a data
set”. However, Harry incorrectly described the number of mounds
appeared in the graphical display of a histogram constructed for analyzing
the age of his Facebook friends in his project discussions (Figure 9).
Statistically, a mound should be determined by a clear separation of bars,
not by the ‘size’ of the bars alone as cited in his posting:
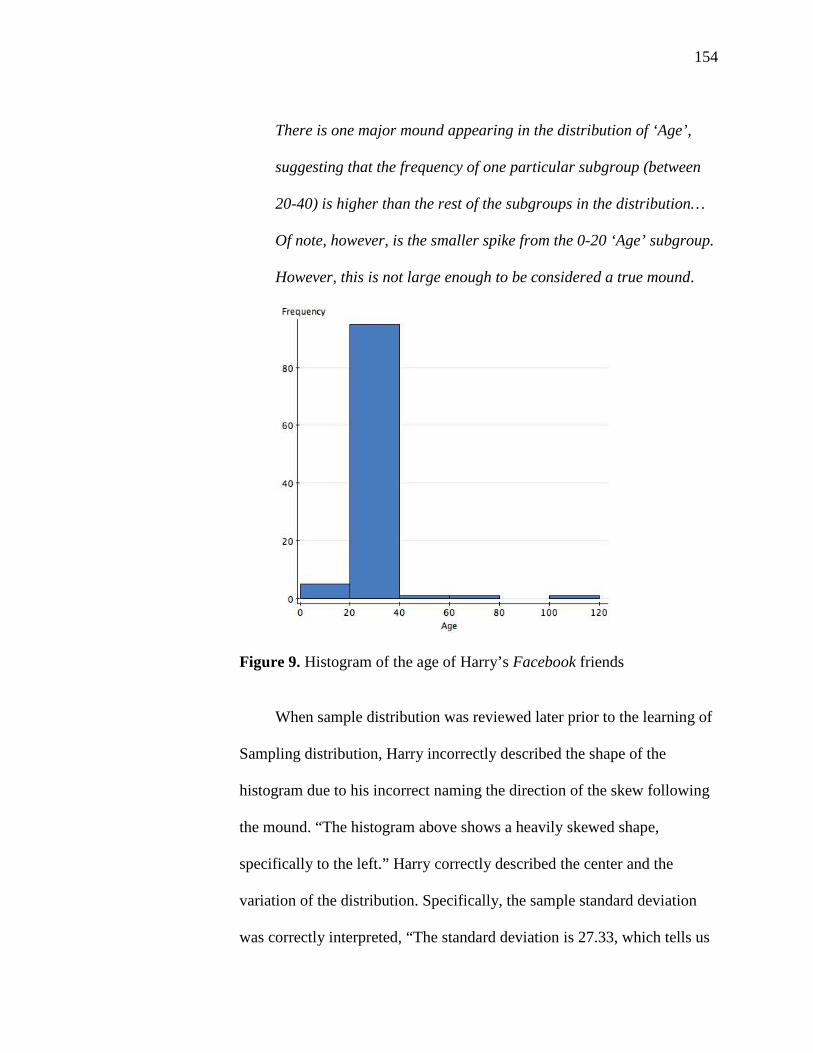
154
There is one major mound appearing in the distribution of ‘Age’,
suggesting that the frequency of one particular subgroup (between
20-40) is higher than the rest of the subgroups in the distribution…
Of note, however, is the smaller spike from the 0-20 ‘Age’ subgroup.
However, this is not large enough to be considered a true mound.
Figure 9. Histogram of the age of Harry’s Facebook friends
When sample distribution was reviewed later prior to the learning of
Sampling distribution, Harry incorrectly described the shape of the
histogram due to his incorrect naming the direction of the skew following
the mound. “The histogram above shows a heavily skewed shape,
specifically to the left.” Harry correctly described the center and the
variation of the distribution. Specifically, the sample standard deviation
was correctly interpreted, “The standard deviation is 27.33, which tells us
155
that the lengths (in minutes) of each lecture contained in my sample
deviates from the sample mean by roughly 27.33 minutes.”
Standard error of a sampling distribution is much similar to the
standard deviation of a sample distribution. Although Harry understood
that the standard deviation of a sample described a typical deviation of
individual observation from the sample mean, he failed to comprehend
that the standard error of the sample mean distribution described a typical
deviation of the sample mean from the population mean. “We find the
standard error to be 5.154 minutes. This means that, accounting for all the
different possible combinations of 25 objects (which form a sample),
taken from the population of 59, the mean values of all the samples would
deviate by about 5 minutes.”
However, as the learning continued, Harry demonstrated a clear
understanding of the standard error of a sample proportion distribution. A
correct statistical concept of defining the sample proportion distribution
was also found in the weekly discussions when students were asked to
choose a document from a given website and define a word of their choice
as a success (picking a particular word ‘the’ as a success, for example).
Using the success defined, Harry flawlessly described the corresponding
sample proportion distribution as, “The sampling distribution of the
sample proportion of ‘the’ words of a sample size of 500 is the distribution
of all the sample proportions of ‘the’ words calculated from all the
156
samples of 500 words randomly selected with replacement from the
transcript of the Emancipation Proclamation.”
Harry’s clear conceptual understanding of the precision of an
estimator was demonstrated when he discussed the variation of the sample
proportion distribution. With a standard error of 0.00053, Harry
contributed the small standard error (variation) to a large sample size. He
commented on the precision of the estimator produced from a large
sample that is used to estimate the parameter, “The large sample size of
500 words helps to create a tiny standard error of less than half a percent,
which indicates the high precision of targeting the population proportion
using the sample proportion produced from a sample of 500 words.”
However, Harry was confused between the sample distribution and
the sample proportion distribution. Hence, in response to the description of
the shape of the sample proportion distribution when estimating the
proportion of his single Facebook friends, Harry claimed that it was not
possible to describe the shape of the distribution of a qualitative data set.
Although Harry’s claim was true for qualitative data, the sample
proportion distribution describes the distribution of all the sample
proportions (numerical data) of single relationship status on his Facebook
list. Therefore, unlike what Harry claimed, it was suitable to discuss the
shape of the sample proportion distribution.
In response to the choice of confidence level, Harry chose to use
99% instead of 95%. His justification of using a higher confidence level

157
leading to a higher level of accuracy was an incorrect statistical concept.
Rather, a higher confidence level ensures a higher reliability in terms of
the estimation results.
I’m choosing to set my confidence level at 99%, due in part to the
very large sample size. This will make the confidence interval
technically less precise, but not by much, while also having the
added benefit of making it much more accurate than, say, a 95%
confidence interval.
On the other hand, an accurate translation of the level of significance
was found in his weekly discussions: “Using 5% as a significance level
means that the probability of making a false conclusion that the mean
lecture length of all the lectures collected in Ms. Miao’s iTunes library is
longer than 80 minutes while in fact it is not is maintained at no more than
5%.”
c. Interpreting statistical results using non-technical and layman’s terms with
context
Context
With a correct understanding of the statistical terms Type I error and
Type II error, Harry interpreted the terms without including the context.
“If I were to analyze the sample data and find the population mean to be
greater than 80, when in fact the population mean is equal to 80” and “If I
were to analyze the sample data and find the population mean to be 80,

158
when in fact the population mean is greater than 80”, for Type I error and
Type II error, respectively.
In describing the population distribution as the distribution of all the
words appeared in the transcript of the Emancipation Proclamation, Harry
failed to give a precise description of the population distribution in
context. “The population distribution in this context is a binomial
distribution with a success defined as selecting the word ‘the’.”
Non-technical Terms
Being able to communicate in layman’s terms when explaining the
statistical results was a challenge to Harry in the beginning of the semester
when learning Descriptive Statistics. The challenges can be seen in the
following posting as shown in the weekly discussions. “The week when
the most people were talking about this page (popular week) is 07/15/12,
which reached a graph-high 7 frequencies. The next most-frequent week
was 12/16/12, with 6 frequencies”, and
The distribution of ‘photos’ is skewed to the right, which suggests to
me that the majority of the number of ‘photos’ is at the lower end
(between 0-500) with very few Facebook pages having a value for
‘photos’ greater than 4000.
Although Harry struggled with interpretation in clear context in
weekly discussions, the following postings in his topical project showed
statistical interpretations of center and variability, respectively, in clear
context with non-technical terms. “That is, the typical age of a given
159
friend of mine on Facebook is 22”, and “The IQR for this data set is 3.
This means that the middle 50% of my friends on Facebook that listed an
age vary by as much as 3 years.”
Harry interpreted the slope of the regression model between work
hours and credit hours taken clearly in layman’s term with context as
follows, “The data shows that for students who work, each time there is an
increase of one hour spent at work, there is a decrease of roughly half of a
credit hour taken (.445632) that follows.”
When interpreting the p-value, Harry failed to address it in non-
technical terms as the probability of concluding that the mean lecture
length is longer than 80 minutes when it is in fact 80 minutes. Rather, it
was interpreted as the following: “The probability of rejecting that the
mean lecture length is 80 minutes (the null hypothesis) when it is in fact
80 minutes, is less than 2%.”
2. Findings associated with statistical reasoning
a. Understanding statistical processes
Randomization and Normality Assumptions
The process of making inferences of a population parameter (mean
or proportion) requires the fulfillment of randomization and normality
assumptions. Harry demonstrated a clear understanding of the purpose of
randomization requirement was to be able to “infer the confidence interval
results to the entire population of lectures contained in Ms. Miao’s iTunes
library.” As for the normality assumption, it refers to the normal
160
distribution of the sample mean distribution not the sample distribution as
stated in Harry’s posting: “The sample must follow a relatively normal
distribution, which is referred to as the normality assumption.” However,
later in his project, Harry described precisely and clearly in regard to the
normality assumption.
We need to make sure that the sample mean distribution does follow
a normal distribution. Central Limit Theorem states that as long as
the population distribution is a normal distribution, then the sample
mean distribution is a normal distribution. If the population
distribution is not a normal distribution (as is the case with our
population) then the sample size needs to be large enough (usually at
least 25) for the sample mean distribution resembling a normal
distribution. Since we have already selected a sample size that
satisfies this requirement, we can consider it qualified.
Hypothesis Testing
The process of hypothesis testing involves the rejection of the
presumption of a true null hypothesis and concluding the support of the
alternative hypothesis through significant sample evidence. Harry’s
posting in his weekly discussions demonstrated his understanding:
For the purpose of hypothesis testing, the null hypothesis is assumed
to be true. In this case, we assume the statement ‘the population
mean lecture length is 80 minutes’ is true. The alternative hypothesis
represents a statement that we are trying to find evidence to support.
161
In this case, we are trying to find evidence to support the hypothesis
that ‘ the population mean lecture length is greater than 80 minutes’.
The posting of Harry’s project for testing population means in
relation to a hypothesis test showed a complete hypothesis testing
procedure with clear understanding of the statistical concepts. Harry began
the process by choosing the variable of age and defining the population.
“The population that I will be sampling from contains each of my 302
Facebook friends that entered a value under the ‘age’ column.” Harry
understood a hypothesis testing is to make decision on the presumed
hypothesized population parameter based on the sample evidence (sample
estimator).
I begin with the assumption that the population mean age is 20
years. Next, I’ll use the sample mean of 22.63 years as evidence in a
hope to reach a decision that we could reject the presumption. If that
happens, we say that the sample mean is significant to conclude that
the population mean age is older than 20 years. Alternatively, if we
fail to reject that the presumption is true, and then we say that the
sample evidence is insignificant to conclude that the population
mean age is older than 20 years. We will use the sample mean as
evidence in testing the claim of a population mean, due to the fact
that the sample mean is what’s known as an unbiased estimator to
the population mean.
Harry then discussed the selection of level of significance in context.
162
Next, we must select a significance level for the hypothesis test. The
significance level is the probability of rejecting H0 when H0 is true,
also known as making a Type I error. The significance level is
prescribed prior to conducting the test in order to keep the
probability of making such a mistake as low as possible without
compromising the quality of the test. This can usually be achieved at
a = 5%. Putting this in context, a significance level at 5% means
that the probability of making a false conclusion that the mean age
of all my friends on Facebook is older than 20 years while in fact it
is not is maintained at no more than 5%.
Next, a justification of using t-test instead of a Z-test was given:
Also, before we are ready to go forward with this hypothesis test, we
must choose an appropriate test statistic. To choose an appropriate
test statistic means that we need to choose the correct sample
estimator, which is to say, an unbiased estimator, and its sampling
distribution. Typically, when testing the population mean, the sample
estimator is the sample mean and the sampling distribution of the
sample mean is a Z distribution. In our case, since the population
standard deviation can be easily found out using StatCrunch, we can
use Z distribution. However, for the purposes of this project, I will
assume that the population standard deviation is unknown.
Therefore, there is a need to use sample standard deviation to
estimate the population standard deviation when calculating the
163
standard error. Because of this, a modified t-distribution would be
used instead of the Z distribution.
The next paragraph in Harry’s posting showed his clear understanding of
the relationship between the computed p-value and the prescribed level of
significance.
P-value is similar to significance level in that they are both
probabilities of making a Type I error. The major difference is that
the significance level is a probability prescribed before the
hypothesis test is actually performed. P-value, on the other hand, is
the actual probability of making a Type I error computed from the
sample estimator. We use significance level as a guideline to decide
if we could reject the null hypothesis by comparing it with the p-
value. So long as the probability of making Type I error computed
from the sample evidence (P-value) is less than or equal to the
prescribed probability of making a Type I error (significance level),
we feel safe to reject the null hypothesis. On the other hand, if p-
value had been larger than my level of significance, I would have felt
that the chance of making Type I error was too high, and I would
have avoided rejecting the null hypothesis. This, however, puts me at
risk of making Type II error, which would mean rejecting my
alternate hypothesis of µ > 60, when in fact this is true.
As the course continued, the discussion on the topic of testing on
population proportion was fluently elaborated. Harry demonstrated clear
164
understanding of hypothesis testing especially in describing the null
hypothesis, alternative hypothesis, Type I error, Type II error, significance
level, and p-value in context. Continued onto the project, Harry did a
complete and correct analysis on testing his hypothesis of having more
than 50% female Facebook friends.
b. Being able to interpret statistical results
Descriptive Statistics
From a skewed distribution result, the center and the variation should
be described by the median and the interquartile range (IQR), respectively.
However, Harry incorrectly described the center and the variation using
mean and standard deviation, respectively. “The center of the sample
distribution is the mean number of movie likes of 21.4 and the variation of
the sample distribution is the standard deviation of the number of movie
likes of 36.43.”
Inferential Statistics
In interpreting a confidence interval result for the purpose of
estimating the population mean, Harry gave correct interpretation in non-
technical terms with the context: “With 95% confidence we can conclude
that the mean lecture length of all the lectures given by Shaykh Riyadh
collected in Ms. Miao’s iTunes library is between 79.14 minutes and 101.7
minutes, from about 1 hour 20 minutes to 1 hour 42 minutes long.”
However, Harry had difficulties interpreting the confidence interval
result for the purpose of comparing the difference of two population
165
means. In his project, a confidence interval of −5,2.5( )was produced for
the age difference between his female and male Facebook friends. The
opposite signs of the end points of the interval indicated an insignificant
sample evidence to conclude that there was a difference in age between
the female and male Facebook friends due to the possibility of the mean
age difference being zero. Contrary to the insignificant result, Harry
interpreted the confidence interval result as “there is a statistically
significant result that the difference in mean age in years between male
and female Facebook friends of mine is between either of these options:
men are, on average, 5 years older, or women, on average, are about 2.5
years older” due to “not much difference at all between the mean ages of
my male and female Facebook friends”.
This misinterpretation of the confidence interval results was
corrected when Harry compared the difference of proportions of having
single status between his Facebook male and female friends. With a
confidence interval result of −0.15,0.35( ) , Harry concluded, “there is no
statistically significant result that the proportion of my male Facebook
friends that are single is different from the proportion of my female
Facebook friends that are single.”
3. Findings associated with open-ended interview & summary
The interview question Harry received at the end of the semester was
about comparing the difference of two population proportions (Appendix L).
166
The statistical process of investigating if there is any difference between the two
population proportions could be accomplished through either conducting a
hypothesis test or constructing a confidence interval. The following response
from Harry’s first part of the interview reflected that he was able to view the
entire statistical process as a whole. However, there were some deficiencies in
his response in terms of what and how to investigate. Although Harry
mentioned the word “comparing”, he failed to identify what to compare
specifically. That is, there was no specific mentioning of the parameters
(population proportions) found in his reply. As for the process of investigation,
Harry considered the process of conducting a hypothesis test was superior to the
process of constructing a confidence interval. However, both conducting a
hypothesis test and constructing a confidence interval were equally qualified to
answer the question described in the scenario.
The question given to me has a clear, definitive question that we are trying
to have answered. There is not simply a command to describe, or estimate
a value for a population parameter. Instead, we are clearly asked to
"determine if subjects with pre-existing cardiovascular symptoms were at
an increased risk of cardiovascular events while taking subitramine, an
appetite suppressant, comparing with those who took placebo." The
important word in this sentence is "comparing". This suggests to me that
the most appropriate course of action for the researcher to take is to
conduct a hypothesis test.

167
I can already see, based on this question, what the null and alternative
hypotheses would be. The alternative hypothesis, or the hypothesis which
we are testing, is to see if the subjects who took the appetite suppressant
are at in INCREASED risk of cardiovascular events, as opposed to the
placebo group.
The second part of the interview contained two questions. The second part
of the interview evaluated the ability of statistical reasoning: understanding
statistical processes and being able to interpret statistical results. Harry’s
response to the first question of this part of the interview revealed his
understanding of the statistical process presented to him in the scenario.
Although Harry was able to interpret the statistical results, the statistical
concepts on level of significance and p-value were not well established.
By setting the significance level at 5%, we have pre-specified the
likelihood that we will make a Type I error. A Type I error occurs when
you reject the null hypothesis, even though the null hypothesis is true. A
Type I error, in context, would be if we were to conclude that subjects with
preexisting cardiovascular symptoms who take subitramine are at
increased risk of cardiovascular events while taking the drug, when in fact
there is no difference in risk between those that take the drug, and those
that take a placebo. However, by examining our P-value (and armed with
the knowledge that we set our significance level at 5%) we can feel
comfortable knowing that it's unlikely that we will commit a Type I error.
Our P-value, which is calculated at 0.022, or 2.2%, is lower than our
168
significance level, which means that we feel safe rejecting the null
hypothesis. That being said, it's difficult to CONCLUDE anything from 1
study. Based on our hypothesis test results, however, using this sample we
would say that there is statistically significant evidence that subjects with
preexisting cardiovascular symptoms who take subitramine are at
increased risk of cardiovascular events while taking the drug.
The conclusion Harry made in regard to the second question of the second
part of the interview was incorrect. The causal effect could be established if data
were collected from a randomized experiment.
I can't CONCLUDE anything about the greater population of patients
with preexisting cardiovascular symptoms. This is only one study, and
although there is statistically significant evidence, there is still a chance
(indicated by the probability, or P-value) that we have committed a Type I
error. Additionally, could be variables that the researchers failed to take
into account. For example, the study samples 9804 people who were
already overweight or obese, with preexisting cardiovascular disease
and/or type 2 diabetes; these patients are already at increased risk of the
primary outcome measured, and due to this fact, you can not conclude that
subitramine CAUSES a greater risk.
In summary, Harry had no major issues of understanding the statistical
processes and interpreting the statistical results throughout the entire semester.
Although incorrect conceptual understanding of certain terminology led to
incorrect interpretation of some of the statistical results, Harry showed his
169
capability of identifying relevant statistical results obtained from StatCrunch
when analyzing the data. In the beginning of the semester, communicating the
results in non-technical terms was found challenging for Harry. However, he
overcame this issue as the learning progressed. Harry’s good interpretation skill
of using non-technical terms with context was also demonstrated in his
interview replies. However, the skill of having consciousness of data type
preceding the data analysis was not exhibited in the interview even though it
was always well established in his weekly and project discussions. Despite
some minor deficiencies in statistical literacy, Harry demonstrated very well
capabilities in reasoning and thinking statistically.
Jessica. 1. Findings associated with statistical literacy
a. Data consciousness
Valid Data
In the first part of her project for Descriptive Statistics, Jessica chose
to analyze the qualitative variable Relationship Status of her Facebook
friends. In describing the center of the relationship status from a bar chart
(Figure 10), Jessica posted:
The center, or mode, of the bar graph is the answer with the most
occurrences, and in this case “no answer” is the center. This means
that over 200 friends decided not to fill out or answer the
relationship status section of their Facebook pages.
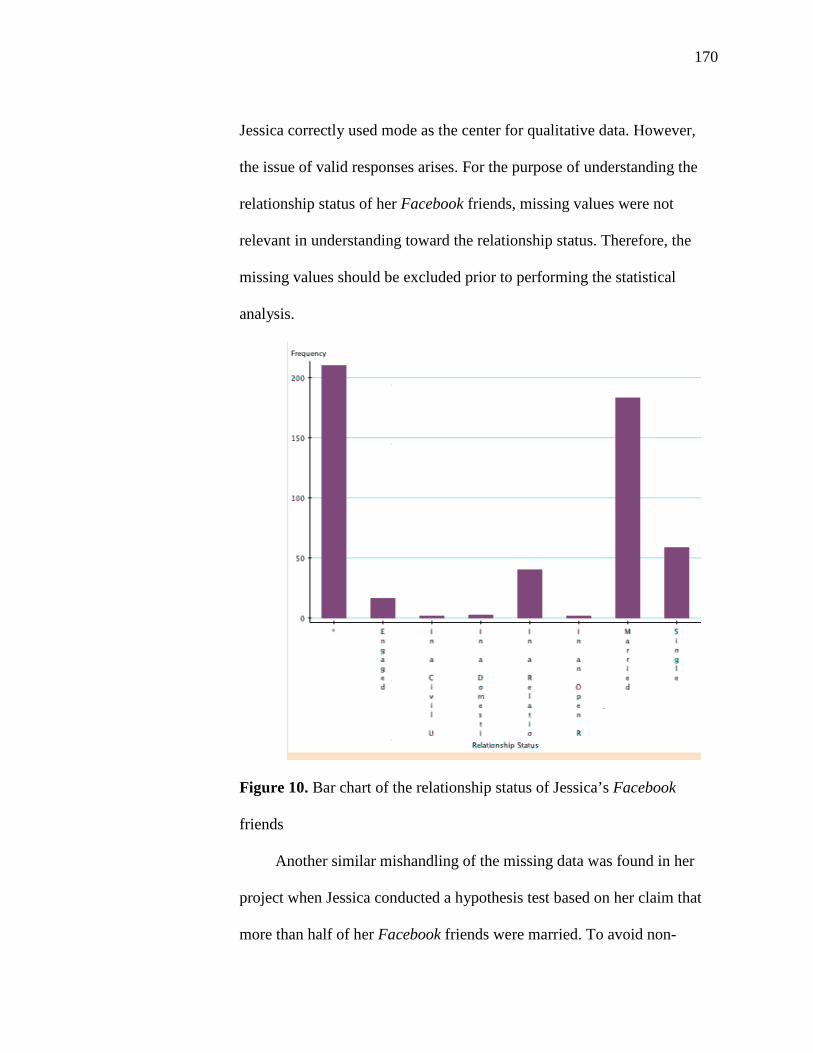
170
Jessica correctly used mode as the center for qualitative data. However,
the issue of valid responses arises. For the purpose of understanding the
relationship status of her Facebook friends, missing values were not
relevant in understanding toward the relationship status. Therefore, the
missing values should be excluded prior to performing the statistical
analysis.
Figure 10. Bar chart of the relationship status of Jessica’s Facebook
friends
Another similar mishandling of the missing data was found in her
project when Jessica conducted a hypothesis test based on her claim that
more than half of her Facebook friends were married. To avoid non-
171
response bias, Jessica should have those who did not specify the
relationship status on the Facebook accounts excluded from the population
prior to the sample selection. Instead, using StatCrunch, Jessica selected a
random sample of 100 Facebook friends. “Out of the 100 friends, only 54
chose to share their relationship status. The friends who did not share their
relationship status were removed from the sample.”
For the interpretation of y-intercept of the regression model
describing the relationship between her Facebook friend’s age and the
number of wall posts on the page, she commented:
The y-intercept is the average value for y when x is zero. Since our
scatterplot includes the values of zero for x (Age), we can find the y-
intercept. Using the regression line, the value for wall posts (y) is
1243 for a person who is age 0. Now, age 0 has no real-world
meaning, because a person of age 0 does not use Facebook. But
since I did not exclude it from the scatterplot, it is meaningful to find
it as the y-intercept as a way of understanding the average amount
of wall posts.
The inclusion of the age of zero does not justify that y-intercept is
meaningful. Whether finding y-intercept is meaningful or not should be
determined by its practical meaning. Furthermore, none of Jessica’s
Facebook friends claimed an age of zero. Rather, Jessica mistakenly
considered those friends who did not provide the age (missing data) was
equivalent to having an age of zero.
172
As equally important as properly handling the missing data, one
should have the consciousness of excluding the irrelevant data prior to
data analysis. In response to the question posted in weekly discussions:
For students who work, is there a linear relationship between the number
of hours worked per week and the number of credit hours taken? Jessica
failed to exclude those students who did not work.
b. Understanding statistical concepts and terminology
Terminology
The misusage of the statistical terms was found in several occasions
of Jessica’s postings. One type of the misusage of the terminology found
in Jessica’s postings was using the terms not defined in the course of
statistics such as “sampling mean”, “sampling distribution mean”, and
“mean proportion”. The other type of the misusage resulted from the
confusion between the terms. In making a comparison of the mean number
of wall posts between male and female Facebook friends, gender and
number of wall posts should be the explanatory variable and the response
variable, respectively. However, Jessica erroneously stated, “using gender
as the response variable and wall posts as the explanatory variable.”
Jessica was confused with the statistical terms of count and
proportion. In her project for inferring population proportions, Jessica
defined the population parameter as “the appearance of the word ‘Sarah’
in the text” when it should be defined as the proportion of the word
‘Sarah’ appearing in the text. The confusion of statistical terms between
173
margin of error and standard error was also found in Jessica’s posting:
“The spread of the sampling distribution of the sample proportion is
defined by the margin of error, or the standard error of the p-hat
distribution.”
Statistical Concepts
Jessica correctly used median and IQR to measure the center and
variability, respectively, of a skewed distribution when learning
Descriptive Statistics. However, IQR is a measurement describing the
variation of, specifically, the middle 50% of the observations, not just any
50% of the observations as shown in the following posting: “The IQR is
318. So, 50% of the photos tagged to a Facebook page of a mosque that
was surveyed in the US varied by as much as 318 photos.” This same
mistake was found again later in her project when Jessica described the
variability of her Facebook friends’ number of wall posts of their
Facebook pages: “The IQR for the number of wall posts is 789. This tells
us that the amount of wall posts each friend posted varies by as much as
789 posts.” In the same project of analyzing her Facebook friends’ number
of wall posts on their Facebook pages, Jessica correctly used median as
the center of wall posts. However, the median was incorrectly interpreted
as a measurement of relative position:
For the quantitative variable ‘Wall Posts’, the exact middle value is
539 wall posts posted by Facebook friends. This means that 50% of

174
friends posted to their wall fewer than 539 times and 50% of friends
posted to their wall more than 539 times.
In Regression Analysis, Jessica understood correctly that the purpose
of the coefficient of determination (r2) was to evaluate the quality of the
regression model: “We can use the model with a good degree of accuracy
when predicting the amount of classes a student will take when given how
many hours he or she will work.” However, Jessica incorrectly explained
the coefficient of determination of 72% as “the extent to which the x and y
variables can be explained using the linear regression model.”
Jessica understood the slope of the regression model and gave
correct interpretation with appropriate context: “The slope of the
regression line is -18.018574. This means that for every increase of one
year of age we can see a decrease of about 18 wall posts.” However,
Jessica incorrectly related the slope to the correlation. Jessica commented
on the slope of -18 as an indication of having “a weak linear regression.”
Although the sign of the slope agrees with the sign of the correlation
coefficient, the magnitude of the slope does not provide the strength of the
correlation.
A lack of solid understanding on the topic of sample mean
distribution appeared in Jessica’s posting. The mean of the sample mean
distribution equals to the population mean. However, Jessica incorrectly
stated that the mean of the sample equals to the population mean. “The

175
average lengths of the entire collection of lectures and the sample of 25
lectures have equal means of 86.79 minutes.”
Jessica gave correct interpretation of the term standard deviation in
learning Descriptive Statistics. She interpreted standard deviation of 29.44
minutes as, “Typically, the length of each lecture in the sample varies
from the sample mean by about 29.44 minutes.” Similarly, the standard
error of the sample mean distribution should be interpreted as a typical
distance from the mean of all the sample means. However, Jessica
inaccurately interpreted it as the variation among the sample means: “The
standard error is 5.154 minutes. This means that, if all the samples of size
25 were taken from the entire iTunes lecture collection, the mean values of
all the samples would vary by about 5 minutes in length.” However, the
mistake was corrected later in the project. Jessica accurately interpreted
the standard error of the sample mean distribution: “In context, this means
that, if a sufficient amount of samples of size 30 are taken from the
population and the mean is found for each sample, on average, the means
of the various samples will vary from the population mean by about 152
wall posts.”
Jessica mistakenly described the p-value as a regular probability
when p-value should be a conditional probability. “The p-value is a
probability of stating that more than 50% of Muslims from the 27
countries believe the story of Osama bin Laden’s death to be untrue.”
Even though Jessica did not describe the p-value correctly, she understood
176
clearly the difference between the significance level and the p-value: “The
p-value represents the probability of making a Type I error and is
computed from the sample results as opposed to the prescribed probability
of the significance level chosen in the beginning [of the test].”
Jessica’s understanding of the confidence level was vague. This
vague understanding was found when Jessica constructed confidence
intervals using two different confidence levels, 95% and 99%. Jessica
made the following comment regarding the two different confidence
levels: “The confidence interval at 99% is going to be much more accurate
but a little less precise than the confidence interval at 95%.” A higher
confidence level does not lead to a higher level of accuracy, rather, a
higher level of reliability. The confidence interval constructed with a
confidence level of 99% is one of the many possible intervals one could
get. As explained later by Jessica, “There is no way for me to know for
sure if the [confidence interval constructed from the] sample chosen was
[the one] that captures the true population proportion.” Therefore, a higher
confidence level does not determine a higher level of accuracy. However,
a higher confidence level does lead to less precision due to a wider
interval vs. a narrower interval produced from a lower confidence level,
hence, higher precision from a lower confidence level.
Finally, the misconception of ‘proving’ the null hypothesis to be true
or untrue as a result of hypothesis testing on a parameter appeared
repeatedly in Jessica’s projects. Testing or estimating for the purpose of
177
inferring a population parameter cannot and should not be used to ‘prove’
the truth-value of the parameter. In testing the population mean, Jessica
stated, “I wish to claim that the average age of all of my Facebook friends
is younger than 35 years old. Thus, the presumption is that the average age
is 35 years old, which defines the null hypothesis. Since I wish to prove
otherwise, the alternative hypothesis is the case where the average age, or
mean age, is less than 35 years old.” When comparing the difference
between two population means through a hypothesis test, Jessica
explained, “For testing purposes, I wish to prove that there is a difference
between the amount of posts posted by males and the amount posted by
females.” The misconception of being able to ‘prove’ through a hypothesis
test appeared again when she explained her reason of conducting a
hypothesis test over constructing a confidence interval, “because I was
more interested at first to see if there was a statistically significant result to
prove the null hypothesis that there is no difference between married
female and male Facebook friends.”
c. Interpreting statistical results using non-technical and layman’s terms with
context
Context
In the beginning of the course, Jessica had difficulty including the
context when interpreting the statistical results. For example, in describing
the center of the data when analyzing the bar chart of a qualitative variable
Popular Week (Figure 2), she failed to include the context of the variable
178
Popular Week. “Looking at the bar chart for Popular Week, one can see
the center of the data, as defined at the category that occurs the most, is at
07/15/12. The other week with a high frequency is 12/16/12.” This issue
of lacking the context continued in the following week when describing
the frequency of “60 times” from analyzing the histogram of a quantitative
variable (Figure 3). “This indicates that most of the values for the amount
of photos tagged to a certain mosque on Facebook were between 0 and
500 and occurred 60 times.” Later, in reviewing the sample distribution,
Jessica explained why the mean was used to describe the center; however,
no context of the mean was included: “Since the shape is symmetric, the
mean is used to describe the center and that value is 90.04 minutes.”
Correct interpretation with the inclusion of context was found toward
the end of the study period when testing the mean lecture length of the
lectures collected in iTunes library, the null hypothesis is that the mean
lecture length is 80 minutes while the alternative hypothesis is that the
mean lecture length is longer than 80 minutes long. Using context, Jessica
gave correct interpretation of Type I error and Type II error: “a Type I
error would occur if a conclusion was made stating that the mean lecture
length of the entire iTunes library collection was not 80 minutes long
when in fact it was 80 minutes long. A Type II error would occur if a
statement was made concluding the mean lecture length of the entire
iTunes collection was 80 minutes in length when in reality the mean was
greater than 80 minutes in length.”
179
2. Findings associated with statistical reasoning
a. Understanding statistical processes
Randomization and Normality Assumptions
Randomization and normality assumptions are required for making
inferences on population means or population proportions through either
constructing confidence intervals or conducting hypothesis tests. A clear
understanding of the requirements can be seen in her project posting.
Jessica explained the satisfaction of the randomization requirement:
“Since the StatCrunch was used to produce random numbers, the sample
being used is random.” She continued to describe the satisfaction of the
normality requirement.
The normality assumption is a requirement that the sample mean
distribution follows a normal distribution. The population
distribution being used is not a normal distribution, so the sample
size must be at least 25. The sample size being used is 30, so the
sample mean distribution will indeed follow a normal distribution.
However, before the project submission on the same topics, Jessica
struggled with the normality assumption requirement in her weekly
discussions. The requirement of the normality assumption when making
inferences on a population mean refers to the requirement of a bell-shaped
symmetric sample mean distribution. Jessica erroneously referred the
requirement of a bell-shaped symmetric distribution to a sample
distribution. In addition, the large sample size requirement (with the
180
sample size being at least 25) is needed only if the distribution of the
population does not follow a normal distribution. Jessica posted the
weekly discussion on the requirement of normality assumption when
inferring population mean through constructing a confidence interval:
The first requirement is normality assumption. As seen by the
histogram, the sample follows a somewhat normal distribution. The
second requirement is the size of the sample given the distribution is
not normal. The sample size in this case is 25, the minimum
requirement. So, if the sample distribution had not been normal, or if
it is not perfectly normal, the sample still meets the requirements for
producing a 95% confidence interval.
In the following week on conducting a hypothesis test on a
population mean, the same incorrect understanding about the normality
requirement was found in Jessica’s weekly discussion: “Normality
assumption states that the population distribution must be symmetric in
order for the sample distribution to be symmetric.”
Even though the concept of normality assumption requirement for
making inferences on population means was corrected in her project
submission as shown earlier, it appeared incorrectly stated with similar
mistakes when Jessica discussed the normality assumption requirement for
making inferences on population proportions. Similar to the normality
assumption for making inferences on population means ensures the sample
mean distribution following a normal distribution, the normality
181
assumption requirement for making inferences on population proportions
ensures the sample proportion distribution following a normal distribution.
However, Jessica incorrectly explained that the normality assumption
requirement was “for the sample to follow a normal distribution”.
b. Being able to interpret statistical results
Descriptive Statistics
The analysis of a variable in a data set begins with the recognition of
the data type of the variable. Since qualitative data have no numerical
values, it was incorrect to describe the shape of the distribution from a bar
chart (Figure 2) as depicted in her posting. “The distribution of the data
occurs evenly throughout the graph and does no fall heavily to one side or
the other.” In the following week when analyzing the histogram of a
quantitative variable, Jessica did not know what to look for from the graph
and was uncertain how to approach the discussion of extreme values.
Regression Analysis
Jessica had difficulties analyzing regression outliers and clusters
from a scatterplot due to her not having a thorough understanding of the
terms. Mistreated the observations as one-variable data set, Jessica
incorrectly described the observation “over 40 hours of work with under 5
hours of classes taken” found on the scatterplot (Figure 6) as “a potential
outlier” because “compared with the rest of the data, we can see this value
is unusual”. Jessica went on to conclude that “there are a few clusters on
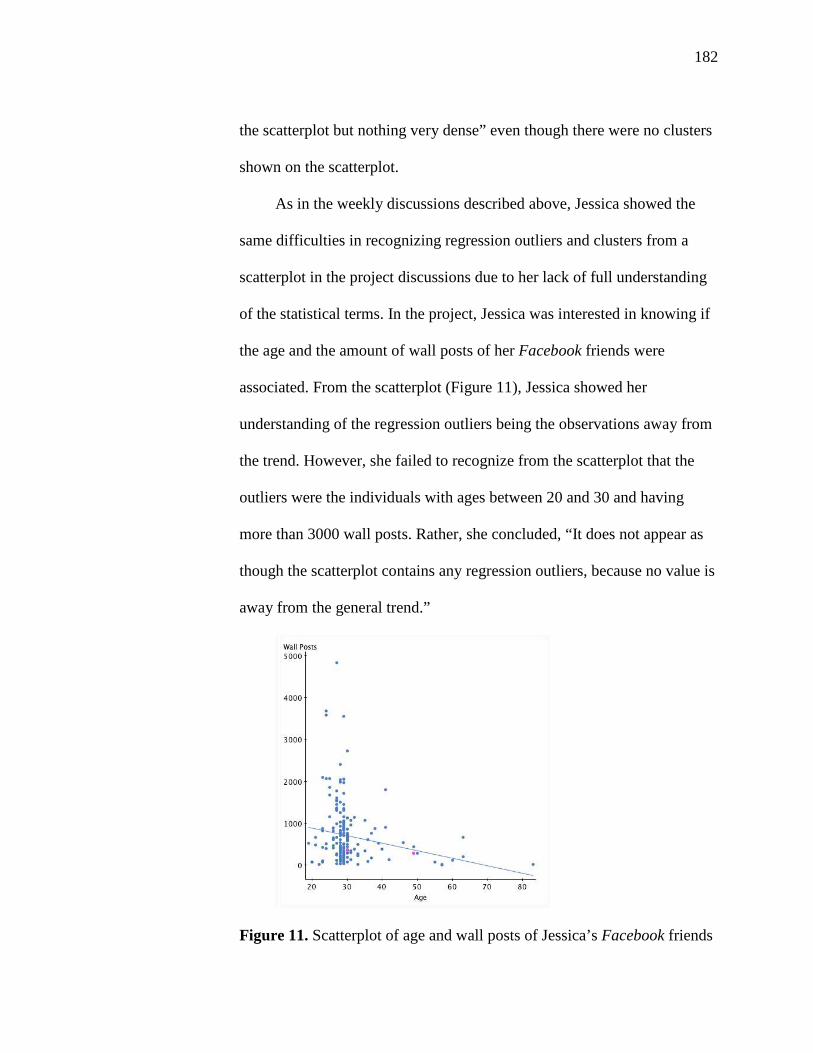
182
the scatterplot but nothing very dense” even though there were no clusters
shown on the scatterplot.
As in the weekly discussions described above, Jessica showed the
same difficulties in recognizing regression outliers and clusters from a
scatterplot in the project discussions due to her lack of full understanding
of the statistical terms. In the project, Jessica was interested in knowing if
the age and the amount of wall posts of her Facebook friends were
associated. From the scatterplot (Figure 11), Jessica showed her
understanding of the regression outliers being the observations away from
the trend. However, she failed to recognize from the scatterplot that the
outliers were the individuals with ages between 20 and 30 and having
more than 3000 wall posts. Rather, she concluded, “It does not appear as
though the scatterplot contains any regression outliers, because no value is
away from the general trend.”
Figure 11. Scatterplot of age and wall posts of Jessica’s Facebook friends

183
Next, Jessica described the clusters appeared in the scatterplot as
follows: “The scatterplot does show several clusters. Many values appear
at age 30 and with wall posts numbering less than 500. Also, strong
clusters occur at age 30 with wall posts around 1,000 and also 2,000.”
There were two clusters found in the scatterplot produced from Jessica’s
Facebook friends. But unlike what Jessica described, one cluster contained
the majority of the observations that were following the negative trend
indicating that the older the individual was, the fewer number of wall
posts on his/her Facebook page. The other cluster appeared on the
scatterplot was the group of those regression outliers. Those regression
outliers were the individuals who were between the age of 20 and 30 but
with much more number of wall posts (more than 3000) on their Facebook
pages than the other Facebook friends who were between the age of 20
and 30 with fewer than 3000 wall posts on their Facebook pages. In
addition to the incorrect description of the clusters, it seemed that Jessica
used the term ‘strong clusters’ to describe the clusters as containing many
observations. There is no classification of a cluster in terms of its strength.
A cluster containing many observations does not make it a strong one.
Likewise, a cluster containing fewer observations does not make the
cluster a weak one.
Jessica showed correct understanding of the statistical results and
correct interpretation of the negative trend displayed on the scatterplot. In
regard to the negative trend, Jessica stated, “This indicates that when
184
students worked less, they enrolled in more classes and when students
worked more, they enrolled in fewer classes.” The slope of the regression
model was also correctly interpreted. The following posting was found in
the weekly discussions where Jessica stated,
The slope of the regression line between amount of work hours and
the amount of class hours is -.445632. Since the scatterplot displays
a negative correlation between the two variables, it makes sense that
the slope is negative. This means that for each increase of one hour
of work, there will be a .445632 hours decrease in the amount of
class hours.
Inferential Statistics
Jessica correctly interpreted the statistical results of confidence
intervals for estimating population means in her weekly discussions:
“With 95% confidence, I can conclude that the mean of all the lectures in
Ms. Miao’s iTunes library, given by Shaykh Riyadh, are between 77.89
minutes and 102.20 minutes in length.” The correct interpretation of
confidence interval results for estimating population means was also found
in her project posting, “With 95% confidence, I can conclude that the
mean amount of wall posts posted by my Facebook friends is between 413
wall posts and 743 wall posts.” However, Jessica showed difficulties in
interpreting the confidence interval results when comparing the difference
between two population means. With an interval of (-6830, 40961), one
should conclude with an insignificant difference of the mean number of
185
views between SmartGirl's and Mufti Menk's YouTube channels.
Specifically, the difference of mean number of views between the two
channels could be somewhere between 6830 fewer and 40961 more views
on SmartGirl’s YouTube channel than on Mufti Menk's YouTube channel.
Rather, Jessica concluded, “there is a significant statistical result
indicating that the mean number of views of the SmartGirls channel is -
6830 to 40961 views more than Mufti Menk’s channel.”
When making the decision of rejecting or not rejecting the null
hypothesis from hypothesis testing results, one compares the p-value with
the prescribed level of significance. The level of significance is served as a
threshold to maintain the quality of the test in terms of the probability of
making a Type I error. When one wishes the probability of making a Type
I error to be no more than 5%, the level of significance will be set up at
5%. Therefore, if the probability of a Type I error computed through the
sample evidence (p-value) is higher than 5%, one should not reject the null
hypothesis to avoid making a Type I error. Jessica demonstrated her clear
understanding of making decision when the p-value is much higher than
the level of significance. She posted the following in her weekly
discussion when testing the population mean:
The p-value is much greater than the significance level chosen at the
beginning of the hypothesis testing procedure. The risk of making a
Type I error is much too high. Thus, the mean of the 30 lecture
lengths taken from Ms. Miao’s iTunes collection, 82.53 minutes long,
186
is insignificant to conclude that the population mean length of the
iTunes collection is longer than 80 minutes long.
However, Jessica would violate the rejection rule when p-value was close
to the level of significance even though p-value was larger than the
prescribed level of significance. As discussed in her project when testing
the population mean age of her Facebook friends, Jessica stated: “The p-
value given through calculation is 0.0591, which is pretty much the same
as alpha at 5%. Thus, the mean of the sample of 30 of my Facebook
friends is statistically significant to conclude that the population mean of
all of my Facebook friends is younger than 35 years old.” The same
mistake was repeated when Jessica compared the proportions of her
married female Facebook friends and married male Facebook friends in
her project where the p-value was found to be 0.0546. Due to its value
larger than the prescribed level of significance at 5%, one should not reject
the null hypothesis. However, Jessica claimed, “the p-value is low” and
made an incorrect conclusion by rejecting the null hypothesis.
3. Findings associated with open-ended interview and summary
The open-ended interview question assigned to Jessica was related to
Regression Analysis (Appendix M). Jessica’s reply to the first part of the
interview reflected her capability of thinking statistically. In particular, Jessica
was able to view the entire statistical process as a whole and knew how and
what to investigate through the context.
187
The appropriate statistical analysis procedure is regression analysis.
Since the health expert wishes to find a link between fiber content in
breakfast cereals per gram and the amount the cereals costs per cup, the
best procedure is to construct a regression model. The two variables in
question are both quantitative variables, thus further proving the
eligibility for a regression model. The health expert can then make
predictions about fiber content and expected cost to the consumer, if the
two variables are linearly correlated.
Two questions were posted in the second part of the interview to examine
Jessica’s statistical reasoning capability. In responding to the strength of the
correlation between the two variables posted in the first question, Jessica
analyzed the correlation correctly from the perspective of a scatterplot followed
by a quantified correlation coefficient (r).
Looking at the scatterplot alone offers little confidence that the fiber
content of the 18 cereals and their costs are correlated. However, looking
closely, it is clear that as cost goes up on the x-axis, fiber content also
increases on the y-axis. It is because of this relationship that I believe that
the two variables share a positive linear correlation. Now looking at the
simple linear regression results, one can be certain that the two variables
share a weak positive linear correlation. I know this is true because the R
value (correlation coefficient) is .2415. The value of R is low and positive,
thus confirming the weak positive linear correlation between the fiber
content in grams per cup and the cost in cents per cup of the cereals.
188
Jessica continued to comment on the advice that a health expert could provide to
her client using the regression model produced. In replying to the second
question, Jessica wrote:
I would tell the health expert that the regression model is moderately good
at predicting the amount of variation of the fiber content in the cereals
based on the cost of the cereals. The R-squared value is .5831869, or
58%. This indicates that only 58% of the variation of the two variables
can be explained by this particular regression model. 42% of the
variation cannot be accounted for through this regression model. This
means that predicting the amount of fiber content in the cereal based how
much the cereal costs will not result in a highly accurate result. The
negative results of trusting a regression model with a moderate or low
coefficient of determination (R-squared) is, in this case, an overestimation
or underestimation of fiber content per cost.
After prompting for more clarification of "The negative results of trusting a
regression model with a moderate or low coefficient of determination (R) is, in
this case, an overestimation or underestimation of fiber content per cost”,
Jessica replied,
I mean that if the regression model is not that accurate, it would be
difficult to tell a consumer willing to pay 60 cents per cup of cereal that
she will get so many grams of fiber in her box of cereal. She could be
getting way less or way more. An underestimation seems like the outcome
the health expert would want to avoid. An underestimation means that she
189
would be paying 60 cents per cup and getting less fiber than what the
regression model predicted.
Jessica’s replies to both questions posted in the second part of the
interview demonstrated her competence of reasoning statistically. Her replies
reflected the clear understanding of the process as well as her capability of
interpreting the statistical results. However, Jessica misread the value of r2 of
0.058 (5.8%) as 0.58 (58%). Due to the mistake, Jessica commented the
regression model as “moderately good” when in reality, using the regression
model for estimation should be considered as having a poor quality.
In summary, Jessica’s overall interview results revealed her competence in
her conceptual understanding in terms of statistical literacy, reasoning and
thinking. Specifically from the interview results, it was noticeable that Jessica
established her data consciousness of recognizing the data type prior to the data
analysis. Perhaps, the biggest achievement for Jessica throughout the study
period was being able to communicate the statistical results using context in
non-technical terms.
Summary
Chapter four presented the data analysis results of participants’ conceptual
understanding via the data collected from TALQ survey, CAOS assessment, postings
from online weekly discussions and topical projects, and open-ended interviews
conducted at the semester end. The quantitative data analyses including summary
statistics of the TALQ survey and CAOS assessment, and regression analyses between
TALQ scales and CAOS score were performed and analyzed. The possible indications of
190
the findings were discussed. Content analysis was conducted in analyzing postings from
online weekly discussions, topical projects, and interviews. Quantitative descriptions of
intra-coding and inter-coding agreement rates were computed and displayed. The overall
effectiveness of implementing Merrill’s First Principles of Instruction was analyzed
through statistical tests results performed on the coding results between the weekly
discussions and the topical project submission. Percentages of “clear understanding”
coding from interviews were also calculated and analyzed. Finally, a detailed qualitative
description of cognitive development toward conceptual understanding in terms of
statistical literacy, reasoning, and thinking was presented through a selected purposeful
sample of participants.
191
Chapter 5
Conclusions, Implications, Recommendations, and Summary
Conclusions
For the purpose of understanding how the course design based on First Principles of
Instruction can facilitate tertiary-level students’ conceptual understanding when learning
introductory statistics in a technology-enhanced learning environment, a case study was
conducted in a blended introductory statistics course at a two-year college in Greater Los
Angeles area in Spring 2013. Three research questions guided the study:
1. How do Merrill’s First Principles of Instruction guide the development
of an introductory, technology-enhanced, statistics course?
2. How can StatCrunch, a web-based social data analysis site, be used to
support meaningful learning?
3. How does statistics instruction designed according to Merrill’s First
Principles improve teaching and learning quality (TALQ) and develop
statistical conceptual understanding?
This section will answer the three research questions based on the observations, the
statistical results, and the content analysis results collected and analyzed from the case
study.
Research Question 1: How do Merrill’s First Principles of Instruction guide the
Development of an Introductory, Technology-Enhanced, Statistics Course?
192
Using Merrill’s Pebble-in-the-Pond instructional design approach, instructional
instances on the topics of Descriptive Statistics (including Regression Analysis),
Sampling & Inferences on Population Means, and Sampling & Inferences on Population
Proportions were designed with an emphasis placed on real-world whole tasks and the
development of the four phases of learning: Activation, demonstration, application, and
integration. Real-world whole tasks were designed mainly utilizing data gathered from
social networking sites (e.g. Facebook, iTunes, and YouTube). Prior to the discussion of
each topic, readings on related topics were assigned to the students. For the activation
phase of learning, the assigned readings for the current topic along with the content
learned from the previous lessons enabled students to activate relevant previous
experience when learning through the modules. For the demonstration and application
phases of learning, real-world examples were demonstrated in the weekly modules for the
materials covered followed by weekly forum discussions. Weekly forum discussions
were designed to provide students opportunities to apply their new knowledge and skills
to solve problems similar to the examples demonstrated in the modules. Finally, a topical
project after each course topic delivered was designed to allow students to integrate their
statistical skills to statistically analyze the profiles of their Facebook friends.
The course topic of Sampling & Inferences on Population Means was divided into
three parts: Part I – Sample Mean Distribution & Confidence Interval for the Population
Mean, Part II – Significance Test for the Population Mean, and Part III – Comparing Two
Population Means. These three parts of the topic were delivered in three weeks, namely,
the ninth, the tenth, and the eleventh week of the semester. As an example to illustrate
how Merrill’s First Principles of Instruction were implemented in developing the
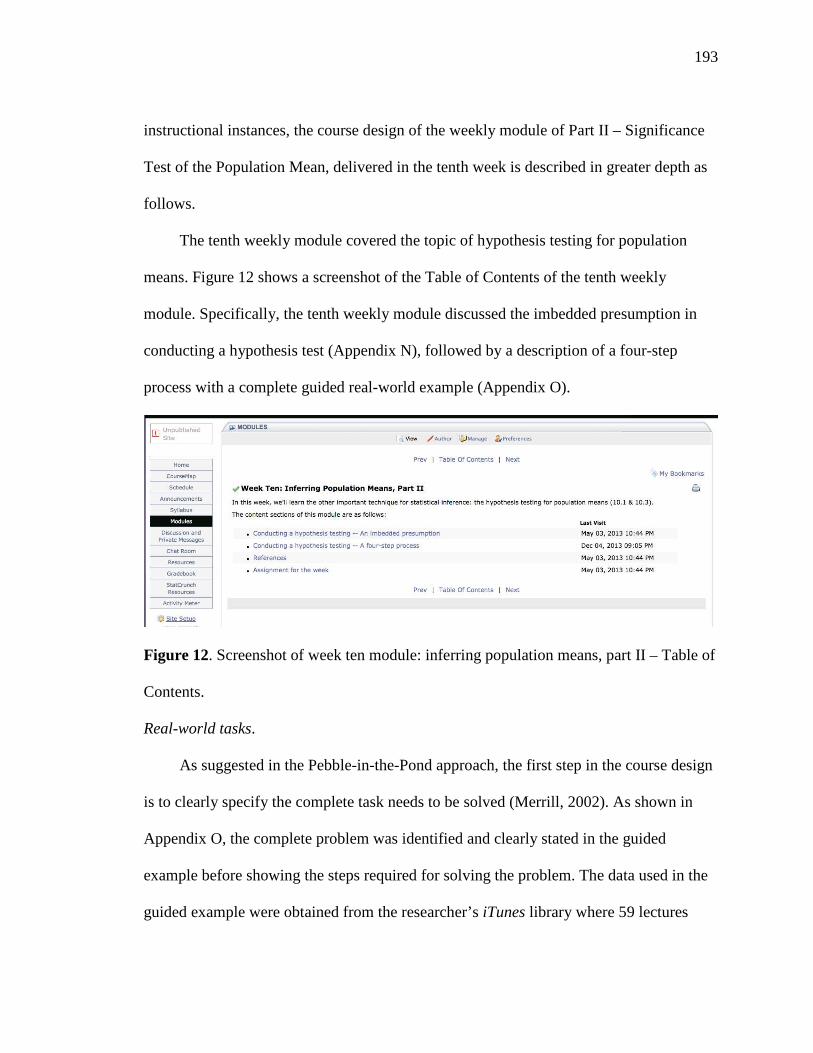
193
instructional instances, the course design of the weekly module of Part II – Significance
Test of the Population Mean, delivered in the tenth week is described in greater depth as
follows.
The tenth weekly module covered the topic of hypothesis testing for population
means. Figure 12 shows a screenshot of the Table of Contents of the tenth weekly
module. Specifically, the tenth weekly module discussed the imbedded presumption in
conducting a hypothesis test (Appendix N), followed by a description of a four-step
process with a complete guided real-world example (Appendix O).
Figure 12. Screenshot of week ten module: inferring population means, part II – Table of
Contents.
Real-world tasks.
As suggested in the Pebble-in-the-Pond approach, the first step in the course design
is to clearly specify the complete task needs to be solved (Merrill, 2002). As shown in
Appendix O, the complete problem was identified and clearly stated in the guided
example before showing the steps required for solving the problem. The data used in the
guided example were obtained from the researcher’s iTunes library where 59 lectures
194
were collected with various lengths ranging from 17.73 minutes to 167.88 minutes.
Rather than using fabricated data, the real-world data set of 59 lecture lengths was used
as the base of the extended population in the guided example. Through complex and ill-
structured problems, students gain the experience of handling the messy nature of the
real-life data (Merrill & Gilbert, 2008). Although there were no missing data involved in
the data set, some lectures were split into more than one audio file due to the capacity
limitations of the technology. Since the task was testing the mean length of the lectures,
students were aware that the different parts of the same lecture should be combined prior
to the data analysis. In order for StatCrunch to perform analysis, students were alerted
that the recording time should be converted from hour-minute-second format (e.g.
1:22:52) used in iTunes into minutes. Issues related to handling real-world tasks
continued in the topical project when students analyzed the variables of their choice of
their Facebook friends. Prior to sample selection, the missing values should be excluded
to avoid sampling bias. It was through constant exposure to the “unclean” real-life data
that students developed data consciousness, an important aspect of statistical literacy.
Activation phase.
Students were instructed always to read the related chapter and sections covered in
the textbook prescribed prior to the studying of the weekly modules. For the topic of
Significance Test for the Population Mean, students were instructed to read 10.1 and 10.3
of the assigned Sullivan (2010) textbook. Furthermore, the course material of
significance tests was relevant to confidence intervals delivered in the previous week in
that both methods were used in making inferences of the population parameters. Students
were reminded that both methods require the sample mean obtained from the sample
195
selected randomly from the population to make an informed decision about the unknown
population mean. Specifically, a confidence interval estimates the population mean while
a significance test is used to support or not to support a claim made with respect to the
population mean (Appendix N). Specifically, the random sample of 25 lecture lengths
used for conducting the hypothesis test in the guided example was the same as the sample
used in the previous weekly module for constructing the confidence intervals. With the
same interpretation of the statistical results obtained through constructing a confidence
interval (as learned in Part I) and conducting a hypothesis testing (as learned in Part II),
the relevant previous experience students gained from constructing a confidence interval
could be activated when learning the topic of hypothesis testing. With a p-value of less
than 0.0001 obtained through the hypothesis test, one could conclude that the sample
evidence was significant to support the claim that the mean lecture length in the
researcher’s iTunes collection was longer than 60 minutes (Appendix O). This result
agreed with a 95% confidence interval of (76.5, 98.4) constructed in the previous week
where the interval was interpreted as, “With 95% confidence, the mean lecture length in
the researcher’s iTunes collection was between 76.5 minutes and 98.4 minutes.” Since
the interval covers the length greater than 60 minutes, it coincides the significant result
obtained through the hypothesis test.
Demonstration phase.
The guided example given in the module used the data set of 59 lecture lengths
collected from researcher’s iTunes library. Using the same random sample of 25 lecture
lengths selected for constructing a confidence interval, a hypothesis test was conducted to
test the claim that the mean lecture length of the iTunes collection was greater than 60
196
minutes. The example demonstrated how to conduct a hypothesis test following the four-
step process adopted from Gould and Ryan (2013). The four steps of the hypothesis test
were to hypothesize, prepare and get ready to test, compute to compare, and make
decision and interpret. A detailed explanation of each step of the hypothesis test was
discussed for the purpose of developing students’ conceptual understanding. Rather than
merely showing how to “do” the problem, the interpretation with the context using non-
technical terms was emphasized in the demonstration. After setting up the two
hypotheses and going through the lengthy preparation step, the computation was
performed through the usage of StatCrunch. Finally, the decision of the test was made
and the interpretation of the statistical results obtained from hypothesis test in layman’s
terms was addressed (Appendix O).
Application phase.
Using the same collection of lectures collected in researcher’s iTunes library as
shown in the guided example in the weekly module, students were asked to apply the
statistical analysis skills learned in the module to conduct a hypothesis test that the
population mean lecture length of the collection was greater than 80 minutes through
their own random sample selections. Appendix P shows the instructions of conducting a
hypothesis test given for the online weekly discussion. The screenshot of the weekly
discussion forums for the topic of Inferring Population Means is displayed in Figure 13.
Students posted and shared their results of hypothesis testing in the weekly discussion
forum. Learning is promoted when learners are engaged in sharing experiences (Merrill
& Gilbert, 2008). Through different sample results due to distinctive samples, students
experienced various p-values ranging from as low as 0.01 to as high as 0.22. This hands-
197
on experience allowed students to practice the skills learned from the module. Students
learned that statistical analysis was a scientific method used to make decisions about the
unknown population parameter. In addition, through the sharing of their postings and
discussions, students experienced the differences of the results due to the uncertainty of
the unknown characteristics of the population parameter.
Figure 13. Screenshot of weekly discussion forums
Integration phase.
Finally, the integration phase of learning was promoted through a comprehensive
topical project that required students to apply the materials learned in all three parts, Part
I – Sample Mean Distribution & Confidence Interval for the Population Mean, Part II –
Significance Test for the Population Mean, and Part III – Comparing Two Population
Means, of the topic of Inferring Population Means to perform the necessary statistical
analyses on the variables of their choice of their Facebook friends’ profiles. Appendix Q
shows the three parts of the project assigned to students after the completion of the topic
of Sampling & Inferences on Population Means. Similar to weekly discussions, a Project
198
for Inferring Population Means forum was set up and allowed students to share, post,
critique, and defend with one another to promote learning (Figure 14).
Figure 14. Screenshot of project for inferring population means discussion forum
Research Question 2: How can StatCrunch, a Web-Based Social Data Analysis Site, be
Used to Support Meaningful Learning?
The concept of technology being part of the statistics curriculum was reinforced
when Moore (1997) recommended the reform of statistics education in terms of content,
pedagogy, and technology. Being proficient in using technology has now become a
required skill when learning statistics. The concern was which statistical package to
choose. One of the reasons that StatCrunch was selected to facilitate the instruction in the
present case study was its capability of setting up user groups that allowed the sharing
with one another within the groups (West, 2009). Prior to the start of the semester, a class
group was set up where common data files used in the modules and discussion forums
were shared among the group members. Students were required to join the class group
and learn how to navigate the site for future sharing of their own data and charts. The
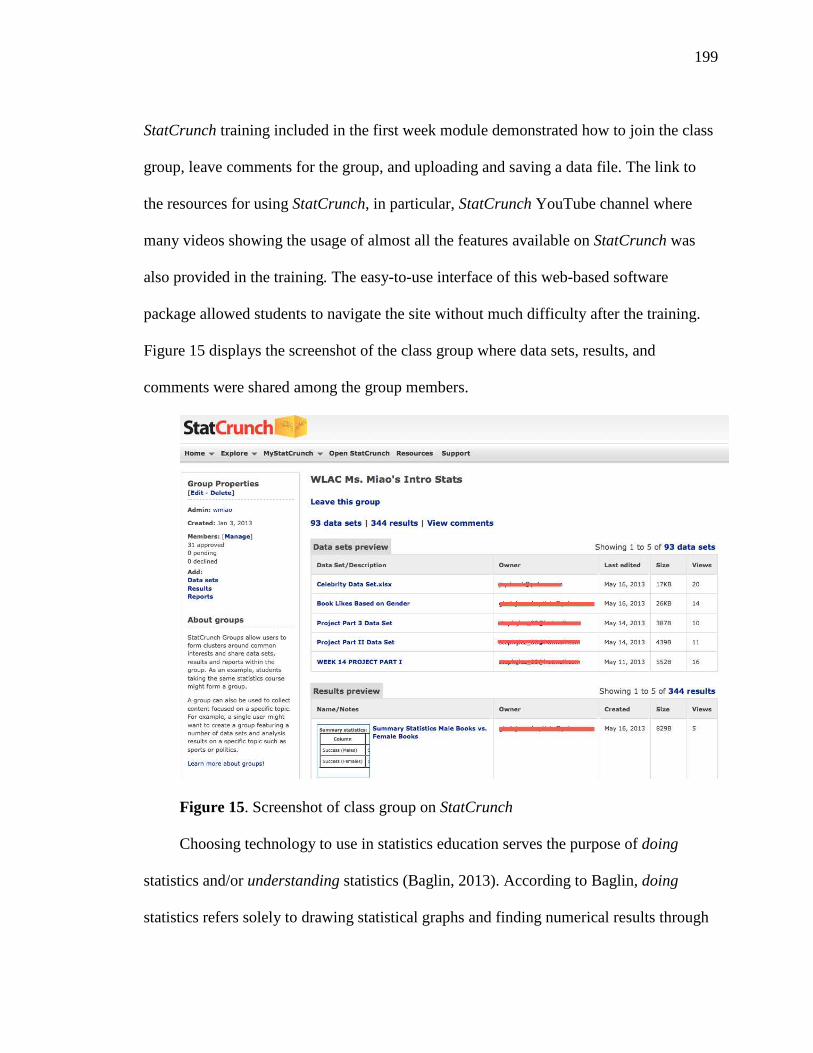
199
StatCrunch training included in the first week module demonstrated how to join the class
group, leave comments for the group, and uploading and saving a data file. The link to
the resources for using StatCrunch, in particular, StatCrunch YouTube channel where
many videos showing the usage of almost all the features available on StatCrunch was
also provided in the training. The easy-to-use interface of this web-based software
package allowed students to navigate the site without much difficulty after the training.
Figure 15 displays the screenshot of the class group where data sets, results, and
comments were shared among the group members.
Figure 15. Screenshot of class group on StatCrunch
Choosing technology to use in statistics education serves the purpose of doing
statistics and/or understanding statistics (Baglin, 2013). According to Baglin, doing
statistics refers solely to drawing statistical graphs and finding numerical results through
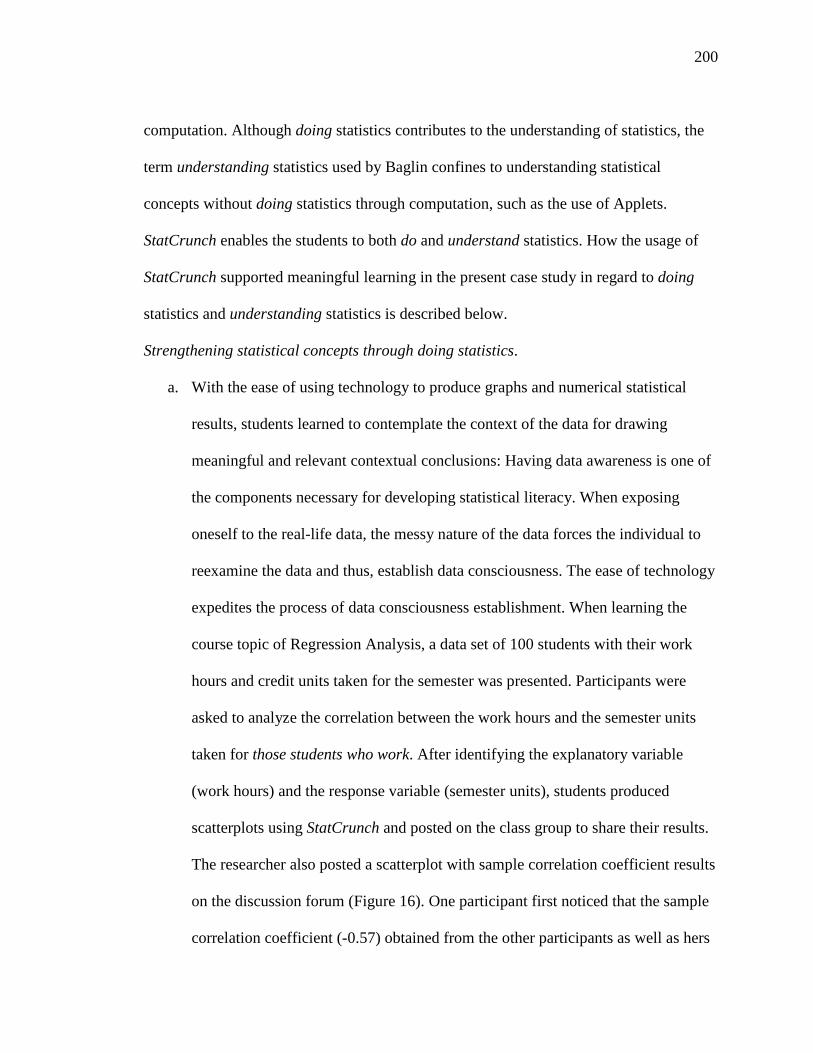
200
computation. Although doing statistics contributes to the understanding of statistics, the
term understanding statistics used by Baglin confines to understanding statistical
concepts without doing statistics through computation, such as the use of Applets.
StatCrunch enables the students to both do and understand statistics. How the usage of
StatCrunch supported meaningful learning in the present case study in regard to doing
statistics and understanding statistics is described below.
Strengthening statistical concepts through doing statistics.
a. With the ease of using technology to produce graphs and numerical statistical
results, students learned to contemplate the context of the data for drawing
meaningful and relevant contextual conclusions: Having data awareness is one of
the components necessary for developing statistical literacy. When exposing
oneself to the real-life data, the messy nature of the data forces the individual to
reexamine the data and thus, establish data consciousness. The ease of technology
expedites the process of data consciousness establishment. When learning the
course topic of Regression Analysis, a data set of 100 students with their work
hours and credit units taken for the semester was presented. Participants were
asked to analyze the correlation between the work hours and the semester units
taken for those students who work. After identifying the explanatory variable
(work hours) and the response variable (semester units), students produced
scatterplots using StatCrunch and posted on the class group to share their results.
The researcher also posted a scatterplot with sample correlation coefficient results
on the discussion forum (Figure 16). One participant first noticed that the sample
correlation coefficient (-0.57) obtained from the other participants as well as hers
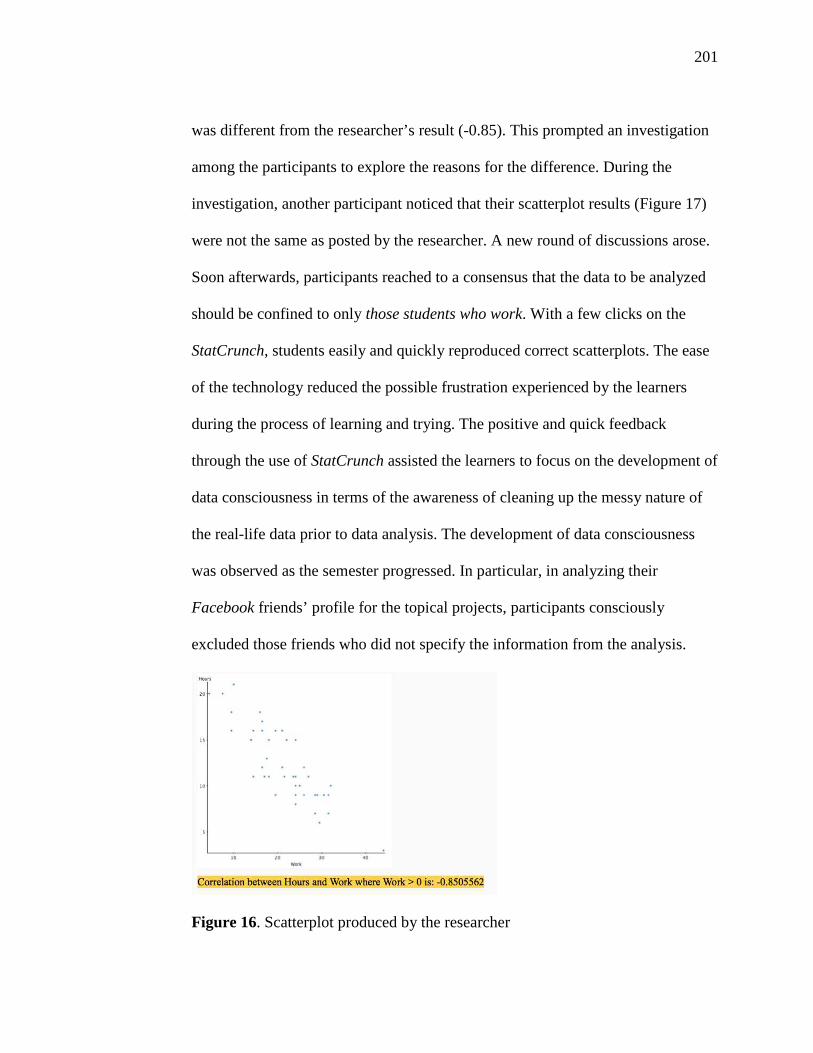
201
was different from the researcher’s result (-0.85). This prompted an investigation
among the participants to explore the reasons for the difference. During the
investigation, another participant noticed that their scatterplot results (Figure 17)
were not the same as posted by the researcher. A new round of discussions arose.
Soon afterwards, participants reached to a consensus that the data to be analyzed
should be confined to only those students who work. With a few clicks on the
StatCrunch, students easily and quickly reproduced correct scatterplots. The ease
of the technology reduced the possible frustration experienced by the learners
during the process of learning and trying. The positive and quick feedback
through the use of StatCrunch assisted the learners to focus on the development of
data consciousness in terms of the awareness of cleaning up the messy nature of
the real-life data prior to data analysis. The development of data consciousness
was observed as the semester progressed. In particular, in analyzing their
Facebook friends’ profile for the topical projects, participants consciously
excluded those friends who did not specify the information from the analysis.
Figure 16. Scatterplot produced by the researcher
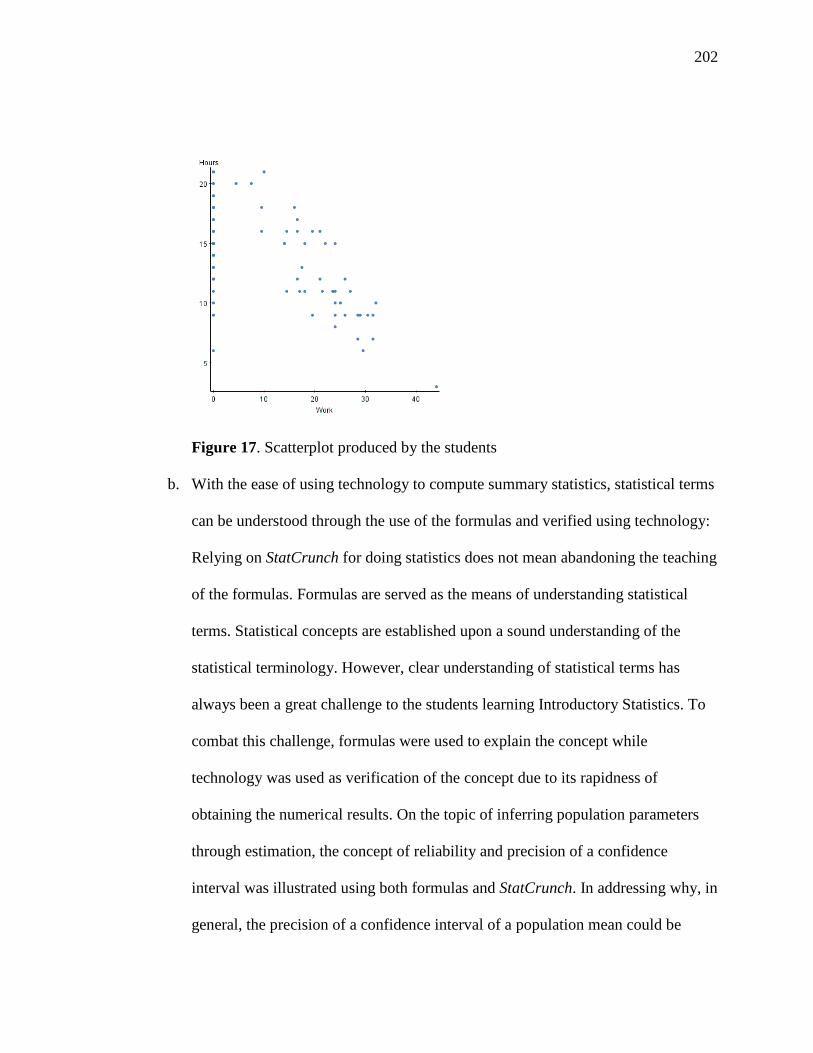
202
Figure 17. Scatterplot produced by the students
b. With the ease of using technology to compute summary statistics, statistical terms
can be understood through the use of the formulas and verified using technology:
Relying on StatCrunch for doing statistics does not mean abandoning the teaching
of the formulas. Formulas are served as the means of understanding statistical
terms. Statistical concepts are established upon a sound understanding of the
statistical terminology. However, clear understanding of statistical terms has
always been a great challenge to the students learning Introductory Statistics. To
combat this challenge, formulas were used to explain the concept while
technology was used as verification of the concept due to its rapidness of
obtaining the numerical results. On the topic of inferring population parameters
through estimation, the concept of reliability and precision of a confidence
interval was illustrated using both formulas and StatCrunch. In addressing why, in
general, the precision of a confidence interval of a population mean could be
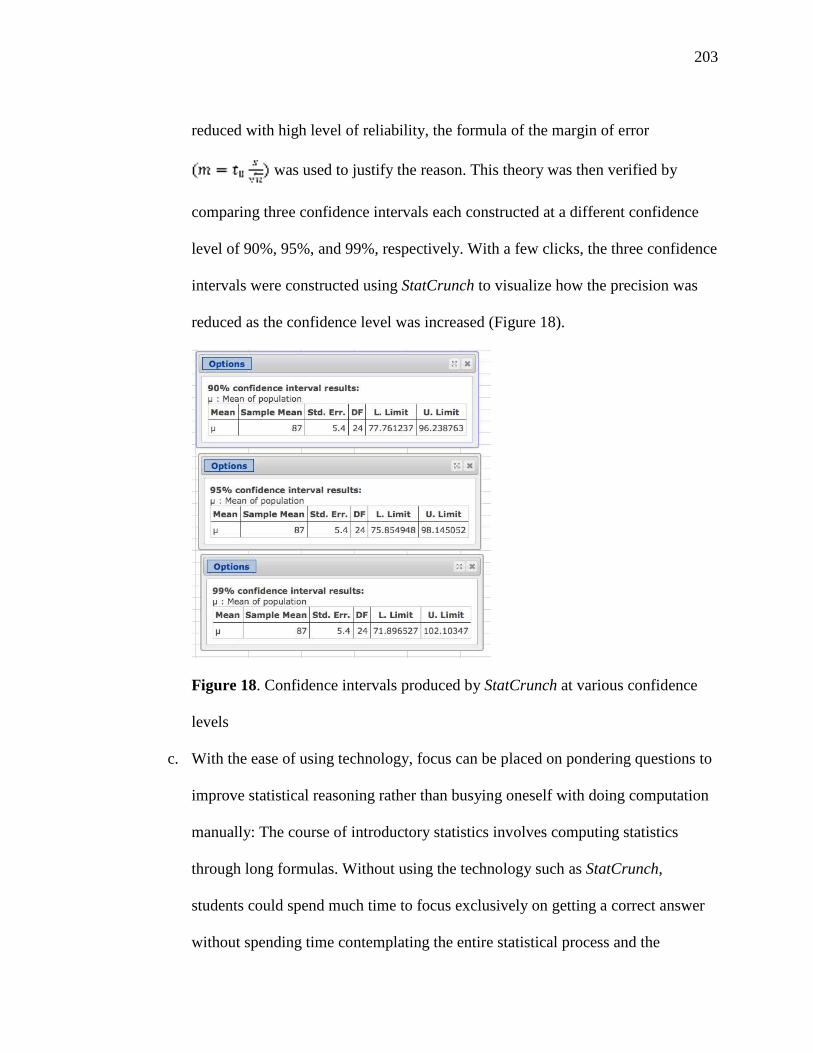
203
reduced with high level of reliability, the formula of the margin of error
was used to justify the reason. This theory was then verified by
comparing three confidence intervals each constructed at a different confidence
level of 90%, 95%, and 99%, respectively. With a few clicks, the three confidence
intervals were constructed using StatCrunch to visualize how the precision was
reduced as the confidence level was increased (Figure 18).
Figure 18. Confidence intervals produced by StatCrunch at various confidence
levels
c. With the ease of using technology, focus can be placed on pondering questions to
improve statistical reasoning rather than busying oneself with doing computation
manually: The course of introductory statistics involves computing statistics
through long formulas. Without using the technology such as StatCrunch,
students could spend much time to focus exclusively on getting a correct answer
without spending time contemplating the entire statistical process and the
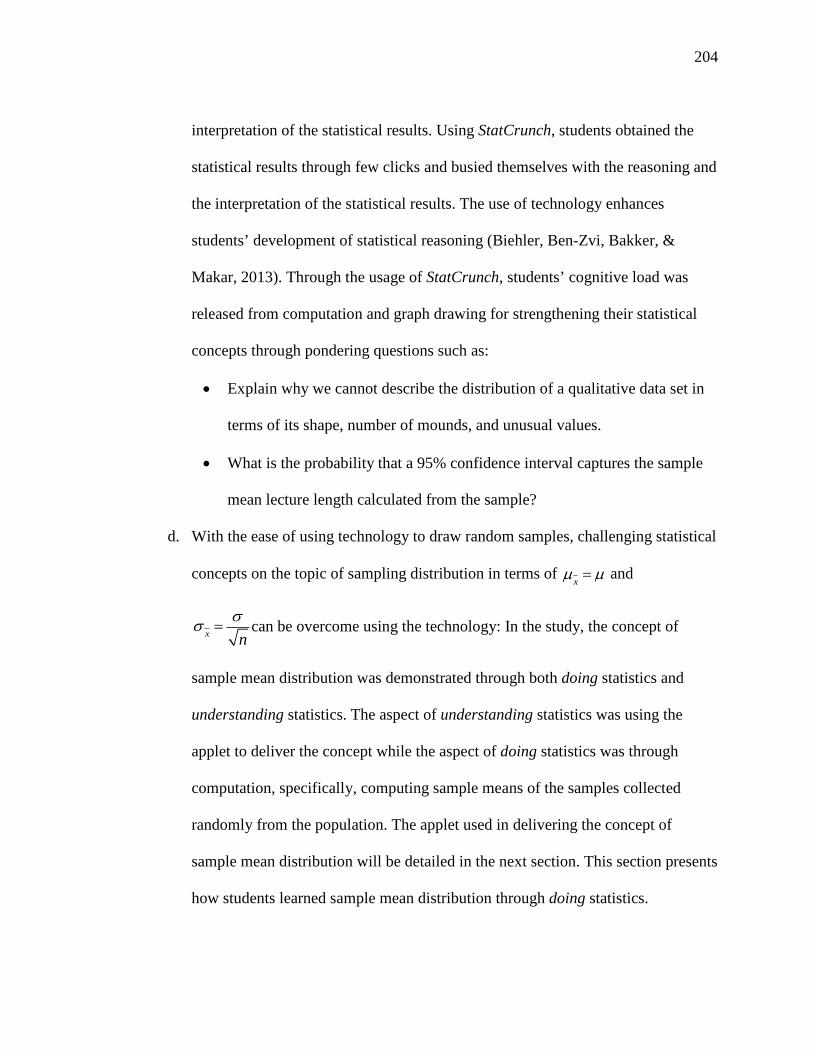
204
interpretation of the statistical results. Using StatCrunch, students obtained the
statistical results through few clicks and busied themselves with the reasoning and
the interpretation of the statistical results. The use of technology enhances
students’ development of statistical reasoning (Biehler, Ben-Zvi, Bakker, &
Makar, 2013). Through the usage of StatCrunch, students’ cognitive load was
released from computation and graph drawing for strengthening their statistical
concepts through pondering questions such as:
• Explain why we cannot describe the distribution of a qualitative data set in
terms of its shape, number of mounds, and unusual values.
• What is the probability that a 95% confidence interval captures the sample
mean lecture length calculated from the sample?
d. With the ease of using technology to draw random samples, challenging statistical
concepts on the topic of sampling distribution in terms of µx= µ and
σx=σ
ncan be overcome using the technology: In the study, the concept of
sample mean distribution was demonstrated through both doing statistics and
understanding statistics. The aspect of understanding statistics was using the
applet to deliver the concept while the aspect of doing statistics was through
computation, specifically, computing sample means of the samples collected
randomly from the population. The applet used in delivering the concept of
sample mean distribution will be detailed in the next section. This section presents
how students learned sample mean distribution through doing statistics.
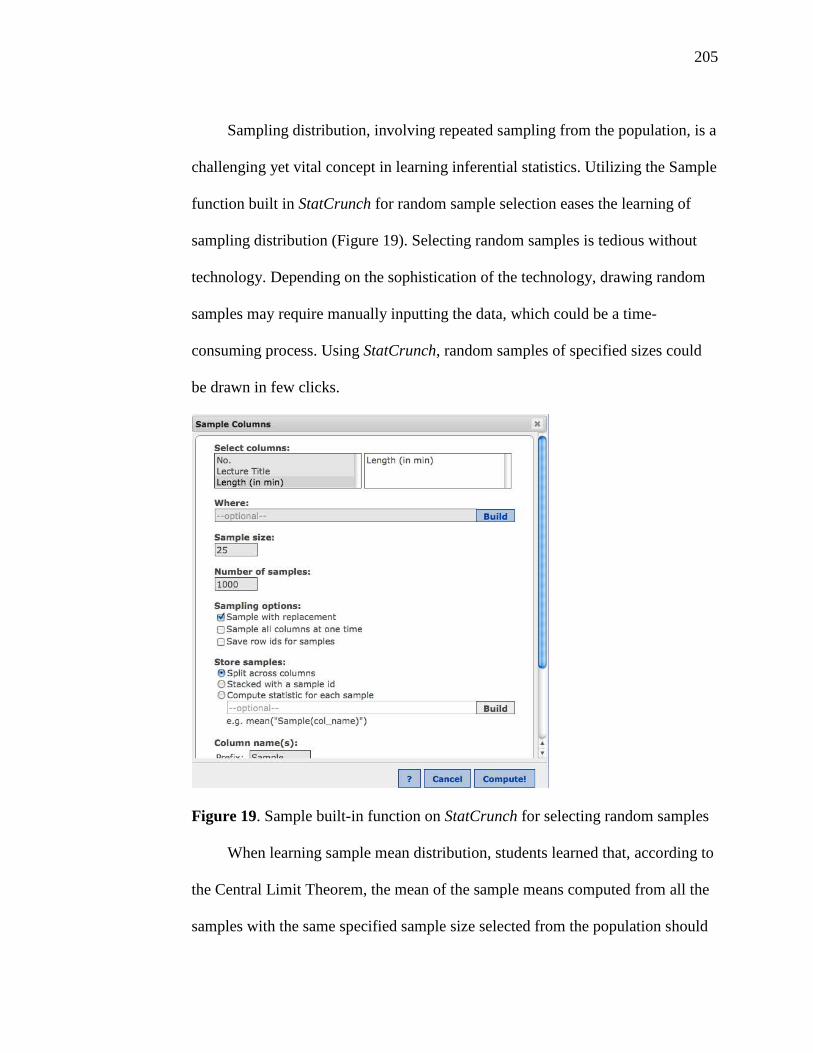
205
Sampling distribution, involving repeated sampling from the population, is a
challenging yet vital concept in learning inferential statistics. Utilizing the Sample
function built in StatCrunch for random sample selection eases the learning of
sampling distribution (Figure 19). Selecting random samples is tedious without
technology. Depending on the sophistication of the technology, drawing random
samples may require manually inputting the data, which could be a time-
consuming process. Using StatCrunch, random samples of specified sizes could
be drawn in few clicks.
Figure 19. Sample built-in function on StatCrunch for selecting random samples
When learning sample mean distribution, students learned that, according to
the Central Limit Theorem, the mean of the sample means computed from all the
samples with the same specified sample size selected from the population should

206
be the same as the population mean while the standard deviation of the sample
means computed from all the samples with the same specified sample size
selected from the population should be where is the population standard
deviation. To illustrate the concept, one thousand random samples of a sample
size of 25 each were drawn from the population of lectures collected in the
researcher’s iTunes library. Using the built-in Summary Stats on StatCrunch,
1000 sample means from the 1000 samples drawn were computed and displayed
in a list (Figure 20). The sample mean lecture lengths computed from 1000
samples varied from 72.96 minutes to a maximum of 107.23 minutes. Students
were asked to apply Central Limit Theorem to estimate the possible numerical
values of the mean and the standard deviation of the 1000 sample means given
that the population mean lecture length was 86.79 minutes with a population
standard deviation of lecture length of 25.77 minutes. Figure 21 displays that the
mean of the sample mean lecture lengths was 87.12 minutes with a standard
deviation of the sample mean lecture lengths of 5.12 minutes which verified
Central Limit Theorem that the mean of the sample means should be the same as
the population mean (approximately 87) and the standard deviation of the sample
means should be which was about 5.12. The differences
were expected due to the limitation of 1000 sample means used in the example
versus the many more times of sample means actually included in the Central
Limit Theorem.
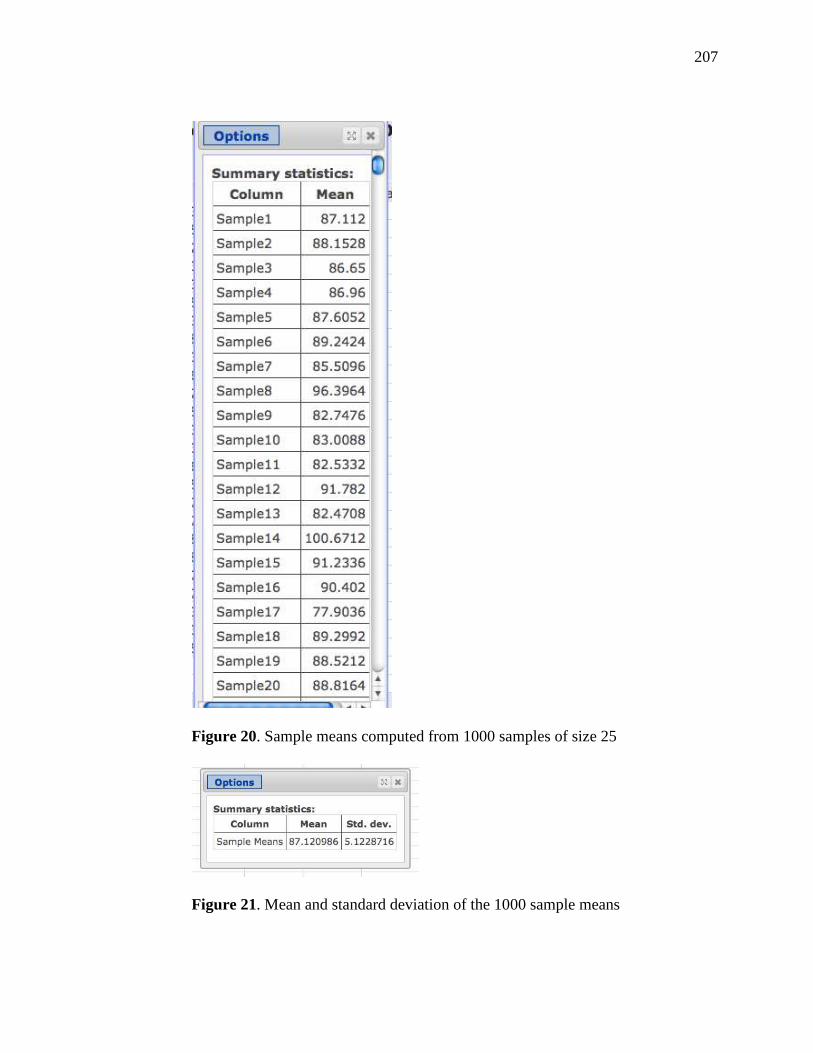
207
Figure 20. Sample means computed from 1000 samples of size 25
Figure 21. Mean and standard deviation of the 1000 sample means

208
Strengthening statistical concepts through understanding statistics.
a. The applets built into the StatCrunch package assisted in developing students’
statistical literacy and reasoning: Many applets are available on StatCrunch. For
example, Simulation on Die Rolling applet illustrates how probability is
understood through the Law of Large Numbers, and the Correlation by Eye applet
allows students to guess the sample correlation of a data set and to make sense of
the correlation between two variables. Two applets used in the course topic of
Sampling & Inference on Population Means are described here: Sampling
Distribution applet and Confidence Intervals applet. While Sampling
Distributions applet is for understanding Central Limit Theorem, Confidence
Intervals applet is for understanding the conceptual meaning of confidence level.
As mentioned in the previous section, the Sampling Distribution applet was
used to deliver the concept of sample mean distribution through the aspect of
understanding statistics. When population distribution follows a normal
distribution, sample mean distribution follows a normal distribution regardless of
the sample size being as small as 2 (Figure 22), or as large as 100 (Figure 23).
However, the larger the sample size is, the smaller the standard error of the
sample mean distribution. When population distribution is skewed, sample mean
distribution is skewed with a small sample size (Figure 24). However, the shape
of the sample mean distribution could be improved and tended to be more
symmetric as the sample size increases to at least 25 (Figure 25). The Confidence
Intervals applet, on the other hand, provides a clear conceptual understanding
about the confidence level used in constructing confidence intervals. Rather than
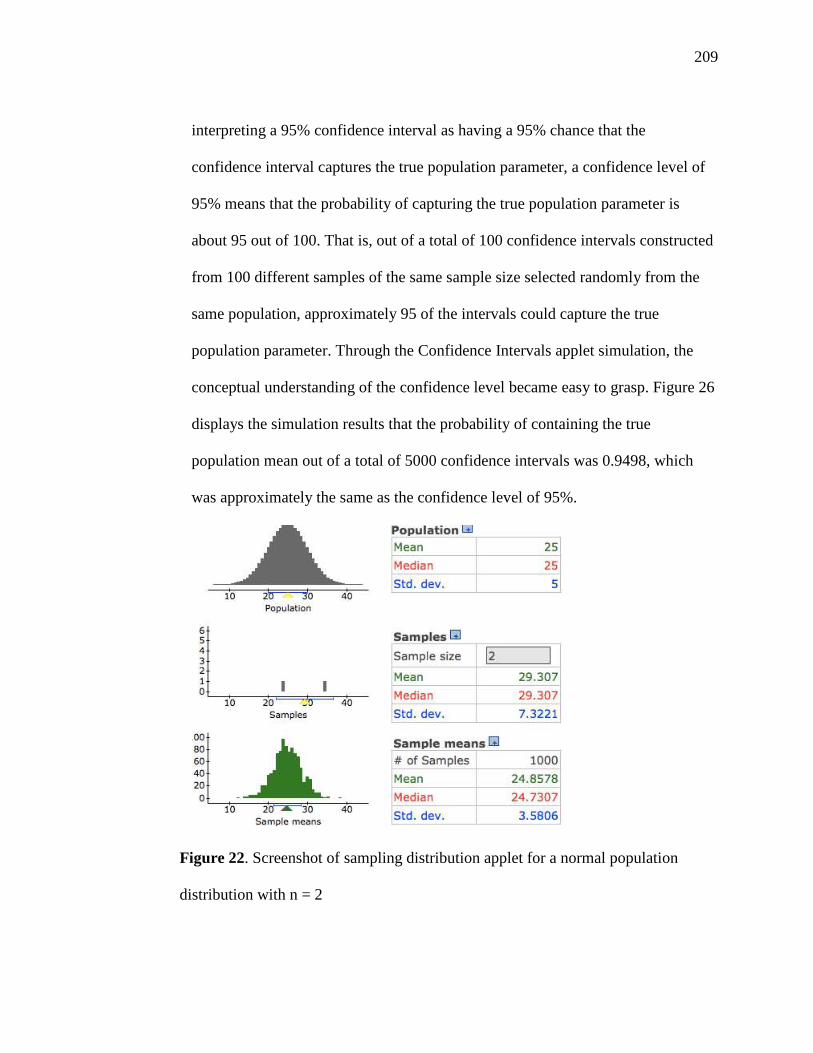
209
interpreting a 95% confidence interval as having a 95% chance that the
confidence interval captures the true population parameter, a confidence level of
95% means that the probability of capturing the true population parameter is
about 95 out of 100. That is, out of a total of 100 confidence intervals constructed
from 100 different samples of the same sample size selected randomly from the
same population, approximately 95 of the intervals could capture the true
population parameter. Through the Confidence Intervals applet simulation, the
conceptual understanding of the confidence level became easy to grasp. Figure 26
displays the simulation results that the probability of containing the true
population mean out of a total of 5000 confidence intervals was 0.9498, which
was approximately the same as the confidence level of 95%.
Figure 22. Screenshot of sampling distribution applet for a normal population
distribution with n = 2
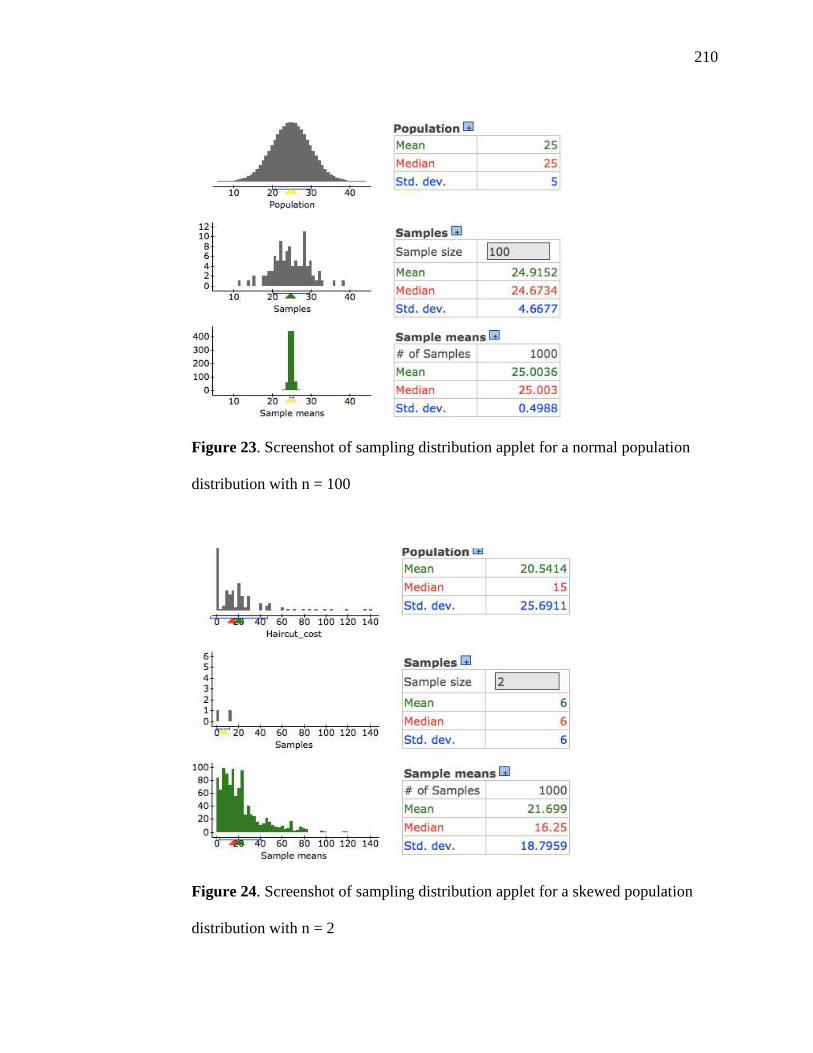
210
Figure 23. Screenshot of sampling distribution applet for a normal population
distribution with n = 100
Figure 24. Screenshot of sampling distribution applet for a skewed population
distribution with n = 2
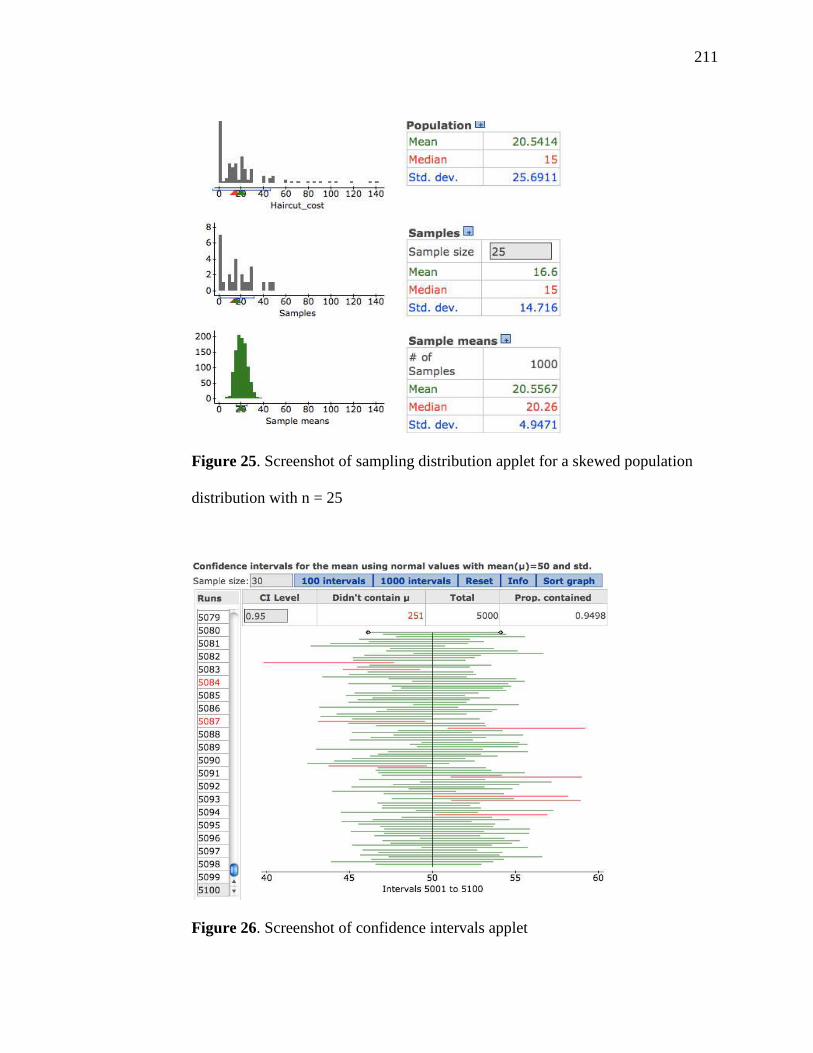
211
Figure 25. Screenshot of sampling distribution applet for a skewed population
distribution with n = 25
Figure 26. Screenshot of confidence intervals applet
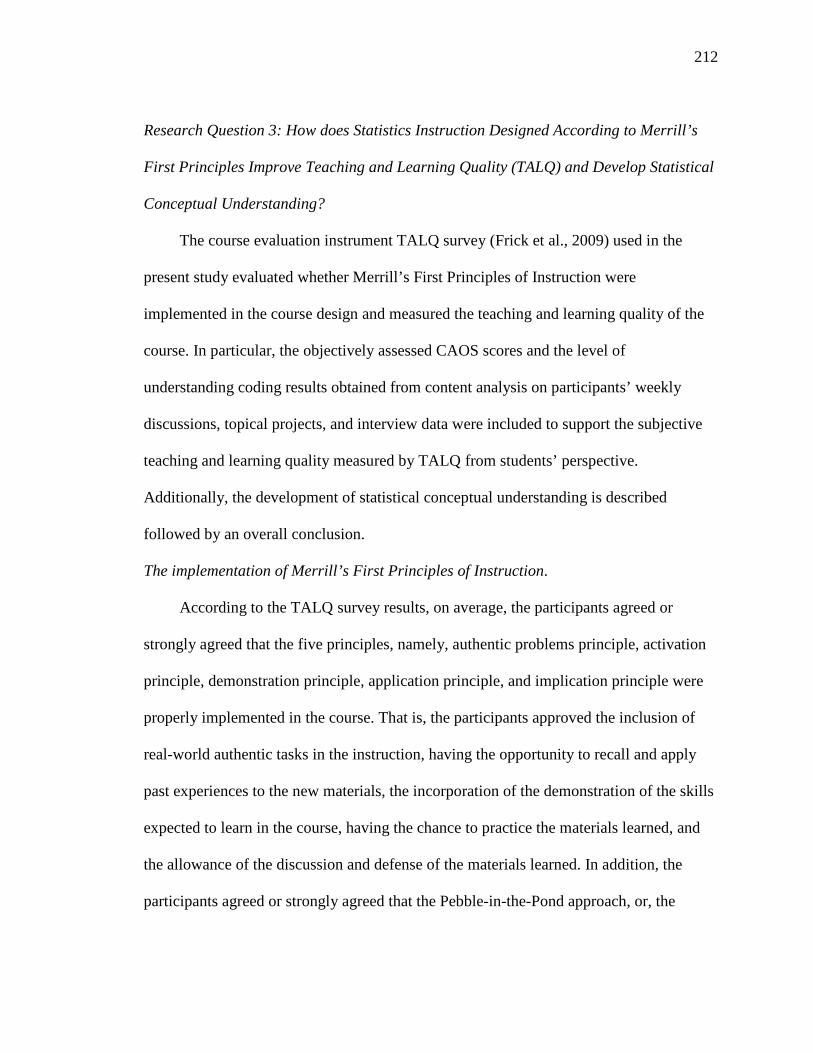
212
Research Question 3: How does Statistics Instruction Designed According to Merrill’s
First Principles Improve Teaching and Learning Quality (TALQ) and Develop Statistical
Conceptual Understanding?
The course evaluation instrument TALQ survey (Frick et al., 2009) used in the
present study evaluated whether Merrill’s First Principles of Instruction were
implemented in the course design and measured the teaching and learning quality of the
course. In particular, the objectively assessed CAOS scores and the level of
understanding coding results obtained from content analysis on participants’ weekly
discussions, topical projects, and interview data were included to support the subjective
teaching and learning quality measured by TALQ from students’ perspective.
Additionally, the development of statistical conceptual understanding is described
followed by an overall conclusion.
The implementation of Merrill’s First Principles of Instruction.
According to the TALQ survey results, on average, the participants agreed or
strongly agreed that the five principles, namely, authentic problems principle, activation
principle, demonstration principle, application principle, and implication principle were
properly implemented in the course. That is, the participants approved the inclusion of
real-world authentic tasks in the instruction, having the opportunity to recall and apply
past experiences to the new materials, the incorporation of the demonstration of the skills
expected to learn in the course, having the chance to practice the materials learned, and
the allowance of the discussion and defense of the materials learned. In addition, the
participants agreed or strongly agreed that the Pebble-in-the-Pond approach, or, the
213
gradual reduce on coaching and feedback approach, was experienced as the learning
continued.
Learning and teaching quality.
Participants, in general, agreed or strongly agreed that the overall quality of the
course and the instructor were outstanding and considered the class as a great class. They
agreed that the technology, including Etudes and StatCrunch, used in the course helped
the participants to learn. The survey also showed that the participants were satisfied with
the course and enjoyed learning about the subject matter. Moreover, participants
considered themselves as hard-working students in terms of the much effort and time
spent on learning the course materials. Not surprisingly, all but one agreed or strongly
agreed that they learned a lot in the course. As for the difficulty level of the course,
survey results showed that not all the participants surveyed considered this course as the
most difficult course they have taken.
Through regression analysis, significant correlations were found among Academic
Learning Scale (ALS), Learning Scale (LS), Self-reported course mastery, and
objectively assessed CAOS scores. In summary, on average, the more time and effort the
surveyed participants reported to spend in the course, the higher agreements on gaining
more knowledge from the course and achieving higher-level of self-reported mastery of
the course, and the higher objective CAOS scores in the final course assessment. Frick et
al. (2010) reported a similar result in their study that when the Academic Learning Scale
(ALS) was reported to occur during the learning process, students experienced positive
learning results.
214
Although no significant correlations were found between Merrill’s First Principles
of Instruction scales and the CAOS score, a significant association between the
implementation of Merrill’s First Principles of Instruction and participants’ level of
conceptual understanding was revealed. That is, the effectiveness of the implementation
of Merrill’s First Principles of Instruction was found when examining the association
between the assignment type (weekly discussions and topical projects) and the level of
understanding (no understanding, vague understanding, and clear understanding). In
particular, implementing Merrill’s First Principles of Instruction into the course design
when learning the topic of Inferring Population Means was found significantly related to
participants’ understanding with a significant increase of 13% of clear understanding
among the eight participants. Finally, the average level of clear conceptual understanding
was shown established and maintained at approximately the same level from during-the-
semester-training to the semester-end interviews.
Development of statistical conceptual understanding.
Four purposefully selected students’ cognitive development process was
qualitatively described in full detail to understand their development of conceptual
understanding in terms of statistical literacy, reasoning, and thinking. The content
analysis results show that all but one participant improved their statistical conceptual
development through the course design. Traditionally, students in introductory statistics
courses are challenged with data interpretation. The pre-requisite to the non-calculus
based introductory statistics course is intermediate algebra where students are
accustomed to working with questions without containing the context, for example,
solving the equations by finding the solutions. However, data analysis in statistics focuses
215
on the interpretation of statistical results. Therefore, the capability of interpreting
statistical results using context in non-technical terms in order to communicate with the
laymen is vital in learning statistics. In the beginning of the semester, the four selected
participants struggled with the inclusion of the context and the meaningful interpretation
of the results even when the context was included. However, with continuous training
and practicing through demonstration, application, and integration implemented in the
course design of the four course topics, satisfactory improvement on the interpretation of
statistical results using proper context in non-technical terms could be detected in the four
selected students as the semester proceeded.
The issue of having data consciousness prior to statistical analysis posed another
challenge for the four selected participants at the start of the semester. Due to the messy
nature of the real-world data, one has to develop the consciousness of ‘cleaning’ the data
by excluding the missing data or correcting the incorrectly recorded data. In addition to
the data cleanup process, being able to differentiate between qualitative data and
quantitative data is vital to avoid selecting an incorrect statistical analysis method. The
incorrect statistical analysis invalidates the entire statistical procedure and renders
meaningless statistical results. Through the repeated demonstration, application, and
integration phases, three of four selected participants successfully developed data
consciousness as the learning progressed.
Only one out of the four selected participants effectively developed reasoning and
thinking statistically as the learning progressed. The improvement of statistical literacy in
regard to statistical results interpretation and data consciousness described above were
also observed in the study. However, insufficient understanding of some statistical results
216
due to the confusion of statistical terminology was shown in all selected participants
except one at the semester-end interview results. That is, most of the participants did not
overcome the difficulties of fully understanding statistical terminology through the
reiterated process designed in the course. This qualitative content analysis finding was
supported by the quantitative analysis semester-end interview results that only 29% of the
items related to statistical literacy marked as clear understanding comparing with the
same 69% of clear understanding rates for the items related to statistical reasoning and
thinking. Moreover, the qualitative analysis pinpoints the real cause of the low statistical
literacy rate as being the lack of full understanding of statistical terminology.
In summary, when evaluating the course, participants acknowledged the
implementation of First Principles course design and responded positively regarding the
course as outstanding. Contrary to a general belief that the course of introductory
statistics is difficult and boring, not all the participants in the present study considered the
course as the most difficult. This result could be an indication that the course design of
implementing Merrill’s First Principles of Instruction helped some students in learning in
a positive way and reduced the difficulty level in the process of learning. A significant
association between the implementation of Merrill’s First Principles of Instruction and
participants’ level of conceptual understanding further supported the indication.
Furthermore, the overall conceptual understanding was established and maintained at the
same level as the course proceeded to the semester end. Taken together, the overall
effectiveness of implementing Merrill’s First Principles of Instruction into the course
design can be concluded as positive. That is, the tertiary-level introductory statistics
217
course designed with implementation of Merrill’s First Principles of Instruction does
promote students’ conceptual understanding.
Implications
As an original contribution to the field of computing technology in education, the
study sought to shed light on instructional design and technology’s role in the design and
implementation of a blended introductory statistics course at the tertiary level. The results
provide guidance to researchers and practitioners who seek instructional design
suggestions that incorporate real data, social networking tools, and technologies to
improve students’ statistical conceptual understanding. Specifically, the study makes the
following contributions:
• The study contributes to the field of instructional design through an intensive
evaluation of Merrill’s First Principles Instruction implemented into a tertiary
level introductory statistics course (Merrill, 2009).
• The study validates the efficiency and effectiveness of the instruction when
incorporating Merrill’s First Principles of Instruction into the instructional
design (Merrill, 2009).
• The study confirms the principles (demonstration principle, application
principle, task-centered principle, activation principle, and integration principle)
promoted by Merrill (2009) as a good starting point in building a common
knowledge base for instructional design (Merrill, 2009).
• The study contributes to the field of statistics education at the tertiary level
through originating innovated course design of a technology-enhanced learning
environment that incorporates real data generated from social networking sites
218
to engage students in developing conceptual understanding (Brown & Kass,
2009; Gould 2010).
• The study contributes to the field of statistics education by documenting
qualitatively the development of the conceptual understanding when learning a
blended online introductory statistics course designed with the implementation
of Merrill’s First Principles of Instruction.
• The study supports the ongoing reform in statistics education in promoting
students’ conceptual understanding of reasoning and thinking statistically
(Garfield, Hogg, Schau, & Whittinghill, 2002).
Although retention rates at the community college studied and the statistics course,
in particular, are relatively low due to the population it serves (i.e., students with
disadvantaged socioeconomic background), it is important to address the dropout rate in
this course in order to provide a clearer picture of the context within which to consider
the implementation of this course design in future instances. As noted in Chapters 3 and
4, ten students out of an initial 40 enrolled students completed the course and received a
course grade. This ratio translates to a dropout rate of 75%. To understand if the
implementation of the course design had an impact on the dropout rate, a significance test
comparing the dropout rate of the studied class (75%) with the typical dropout rate of
hybrid statistics classes (66%) offered in the studied college was conducted. The result of
the test was insignificant with a p-value of 0.2295 indicating that incorporating Merrill’s
First Principles of Instruction into the course design did not have the direct impact on the
dropout rate. Furthermore, from those who did not complete the course, an overwhelming
majority (78%) dropped within the first month. After conferring with the school’s
219
academic counselor, it was determined that many students “shop” courses to find an easy-
to-pass statistics course. The course began with 40 students but by the fifth week, only 15
students completed the online discussions and the first project. Of the 25 students who
dropped the course, nine (36%) never participated in the course and the remaining 16
students (64%) were dropped by the fifth week in accordance with the syllabus’
participation policy (stating that student who fails to participate in online discussions for
two weeks will be dropped from the course). After data analyses were completed on the
eight students who actively completed the course, five students who dropped out of the
course and two students who became inactive toward the end of the course were
contacted via email to find out why they dropped or became inactive, and what their
perceptions were of the course design. Given the explanation for early dropouts within
the first four weeks of the course, questions were targeted for the seven of the 15 students
who officially dropped out or became inactive later in the semester. The following two
questions were sent to the students:
1) Why did you drop the class/become inactive at the end of the semester?
2) What was your experience with the course design?
Responses were varied from those five responding to the post-course survey
questions. One student reported that he/she took too many credits and could not handle
the workload required from the course. Another student, who was doing well, dropped
the course because he/she had a personal issue, which caused him/her to miss the
assignments for one week and therefore felt he/she could not catch up. Another student
who was doing well in the discussions and project reported that he/she dropped the
course because he/she later found out that the course was not required for him/her to
220
transfer. The two inactive students reported that they were failing the course yet passed
the deadline of dropping the course. So, they stopped participating the discussions.
Among those who responded to the post-course survey questions, four students attributed
their dropping the course to their lack of time management and self-discipline.
Four out of the five made comments regarding the course design. All four students
reported a positive learning experience. One student said that although it required a lot of
work of reading and discussing online, the repetitive nature of learning the course
materials helped to reinforce the concepts.
Merrill's First Principles of Instruction was not implemented into the course design
until the second week. Although not directly impacted with the dropout rate, the course
designed with First Principles of Instruction requires effort and hard work, as does the
development of statistical reasoning and thinking in general. Students took the course to
fulfill their transfer requirements. It is possible that the rigor of the course design coupled
with the inherent difficulty of the course content presented a perceived difficulty level
that was too much for the non-traditional college students to handle. To alleviate the
potential stress caused by the perceived high difficulty level, perhaps Merrill’s First
Principles of Instruction could be implemented on fewer course topics or delayed until
the students have learned the basics in the beginning of the course. By gradually
increasing the workload, it might “save” the students from dropping and help them to
adapt into this new strategy of learning through conceptual understanding.
Recommendations
This research describes an embedded single-case study of how learners taking a
tertiary level introductory statistics course designed by applying Merrill’s First Principles
221
of Instruction with emphases on technology and real data developed their statistical
literacy, reasoning, and thinking skills. Although results from quantitative and qualitative
content analyses reveal that the course design is effective in developing students’
conceptual understanding, one cannot establish the analytic generalization from the
results of a single-case study. A multiple-case study design is required to generalize the
effectiveness of the course design (Yin, 2009). Therefore, replication of the study in
different cases (classes) of the same setting is recommended.
The instructional design developed in the study was tested in a small-scale class
setting. Merrill (2009) encouraged researchers from various academic settings with
different disciplines and fields verify the Principles of Instruction to wide variety of
audiences with various cultural backgrounds. It is, therefore, recommended for
examining the efficiency and effectiveness of the course design in various disciplines at
different and large-scale settings worldwide.
Overall, the study discloses a course design positively encouraging the development
of learners’ conceptual understanding. However, students’ statistical literacy, specifically,
the understanding of statistical terminology did not develop to a satisfactory level as
expected. Terminology involves rote memory of the statistical terms. While the emphasis
of statistics learning is on its conceptual understanding, there is a fundamental need to
clearly identify statistical terms when communicating with each other and to aid the
learning of the more complex course materials as the learning continues. Merrill’s First
Principles of Instruction calls for a structure for building up the new knowledge by
adding relevant and accurate information and deleting irrelevant and incorrect
information as the learning proceeds. The structure is served as the basis for guidance,
222
coaching, and reflection during the demonstration, application, and integration phase,
respectively (Merrill, 2009). To effectively achieve the learning results, Merrill suggests
a gradual decreasing on coaching and guidance while increasing on the complexity of the
whole task. While this is shown effective in grasping the conceptual understanding, on
the issue of statistical terminology, however, the results were unsatisfactory compared
with the standard achievement. To assist the learners in building up and adjusting the
structure for the very many similar terms yet very different in meanings and purposes
(e.g. sample distribution vs. sampling distribution; a sample mean vs. sample mean
distribution), frequent assessment on the statistical terminology alone during the
demonstration, application, and integration phases could be effective in assisting learners
to sort out and adjust the structure for the building of statistical terminology when more
terms are introduced and accumulated. Further research is recommended in modifying the
course design by including frequent assessment to promote students’ deep understanding
and reducing the confusion of statistical terminology.
Last, even though the course design assists learners’ development of conceptual
understanding in general, how much can the students remember what they have learned
after they leave the course? The integration principle of Merrill’s First Principles of
Instruction assures the retention of the new skills when they are integrated with the
existing knowledge through reflecting upon, defending via peer critique, and finding
opportunities for personal use. Even when not used immediately, a proper training of the
integration shortens the relearning time of the skills (Merrill, 2009). Future studies on
retention, transfer of learning to topics outside the classroom, and problem solving ability
of those students who successfully completed the course are also recommended.
223
Summary
Chapter one introduced Merrill’s (2002) First Principles of Instruction, including,
problem-centered, activation, demonstration, application, and integration. An explanation
of how these principles of instruction accommodate the six recommendations suggested
in the GAISE Project (Guidelines for Assessment and Instruction in Statistics Education)
(American Statistical Association, 2005) of teaching introductory statistics at the tertiary
level was provided. These six recommendations include: emphasizing statistical literacy
and develop statistical thinking, using real data, stressing conceptual understanding rather
than mere knowledge of procedures, fostering active learning in the classroom, using
technology for developing concepts and analyzing data, and using assessments to
improve and evaluate student learning. The goal was to examine how an innovative
pedagogical instruction designed following Merrill’s First Principles of Instruction
facilitated the development of tertiary-level students’ conceptual understanding when
learning introductory statistics in a technology-enhanced learning environment. The
following three research questions guided the investigation: 1) How do Merrill’s First
Principles of Instruction guide the development of an introductory, technology-enhanced,
statistics course? 2) How can StatCrunch, a web-based social data analysis site, be used
to support meaningful learning? 3) How does statistics instruction designed according to
Merrill’s First Principles improve teaching and learning quality (TALQ) and develop
statistical conceptual understanding? The relevance and significance derived from the
need to document real-world data exploration experience for the learners, the effects of
utilizing social networking sites in support of the teaching, and the impacts of First
Principles of Instruction on learners’ ability to think statistically were detailed. Chapter
224
two presented an overview of the research literature informing Merrill’s First Principles
of Instruction supported in course design, the strategies applied in the instructional design
when teaching introductory statistics at the tertiary level, and a review on social
networking services employed in academics.
Chapter three detailed the forming of a descriptive embedded single-case study
design for the purpose of being capable of qualitatively describing what happened to
students’ cognitive development when learning tertiary level introductory statistics.
Specifically, the case included the students enrolled in one section of a blended tertiary
level introductory statistics course at a two-year community college in Greater Los
Angeles area in Spring 2013 for duration of one semester. The teaching and learning
quality (TALQ) survey was embedded in the case study design to quantitatively evaluate
the implementation of Merrill’s First Principles of Instruction. Four sources of evidence
were used for data collection: postings from the online discussion forum, an end-of-
course comprehensive assessment (CAOS), open-ended interviews, and the TALQ
(teaching and learning quality) survey. Procedures of quantitative and qualitative data
analyses were described. In particular, detailed steps of performing qualitative content
analysis on online postings and interview data were depicted. The assurance of the
quality was also discussed through the description of construct validity, external validity,
and reliability.
Chapter four presented quantitative data analysis results of participants’ perception
of learning and teaching quality supported by objective assessment results. Data collected
from the final eight students who completed the entire course work were used for
analysis. Results revealed that on average, students who reported spending more time and
225
effort on studying and preparing for the course perceived gaining more knowledge from
the course with higher level of self-reported mastery of the course, and achieved higher
objective CAOS scores in the final course assessment. Furthermore, participants’ level of
clear understanding progressed from the time when participating in online discussions to
the time when topical projects were submitted. Finally, the quantitative results showed
that the level of conceptual understanding had been established during the semester
training and was maintained at the similar level at the semester-end interviews. A detailed
qualitative description of cognitive development toward conceptual understanding in
terms of statistical literacy, reasoning, and thinking was demonstrated through a selected
purposeful sample of participants.
Chapter five concluded the study by detailing how the course was designed based
on the framework of Merrill’s First Principles of Instruction. Specifically, the course
design of the weekly module of Part II – Significance Test for the Population Mean of the
course topic of Sampling & Inferences on Population Means delivered in the tenth week
of the semester was described in greater depth. The usage of StatCrunch in supporting
meaningful learning in terms of strengthening statistical concepts through doing statistics
and understanding statistics was next illustrated. Third, the improvement of teaching and
learning quality and the development of statistical conceptual understanding of the
statistics instruction designed according to First Principles were summarized. The
contributions the study makes to the fields of instructional design and statistics education
were described. Finally, recommendations for further research were discussed.
This research detailed how a blended tertiary-level introductory statistics course
was designed based on First Principles of Instruction with an emphasis on implementing
226
real data and technology. Results from both quantitative and qualitative data analyses
indicate that the course designed following Merrill’s First Principles of Instruction
contributes to a positive overall effectiveness of promoting students’ conceptual
understanding in terms of literacy, reasoning, and thinking statistically. However,
students’ statistical literacy, specifically, the understanding of statistical terminology did
not develop to a satisfactory level as expected.
227
Appendix A
Teaching and Learning Quality (TALQ) Survey
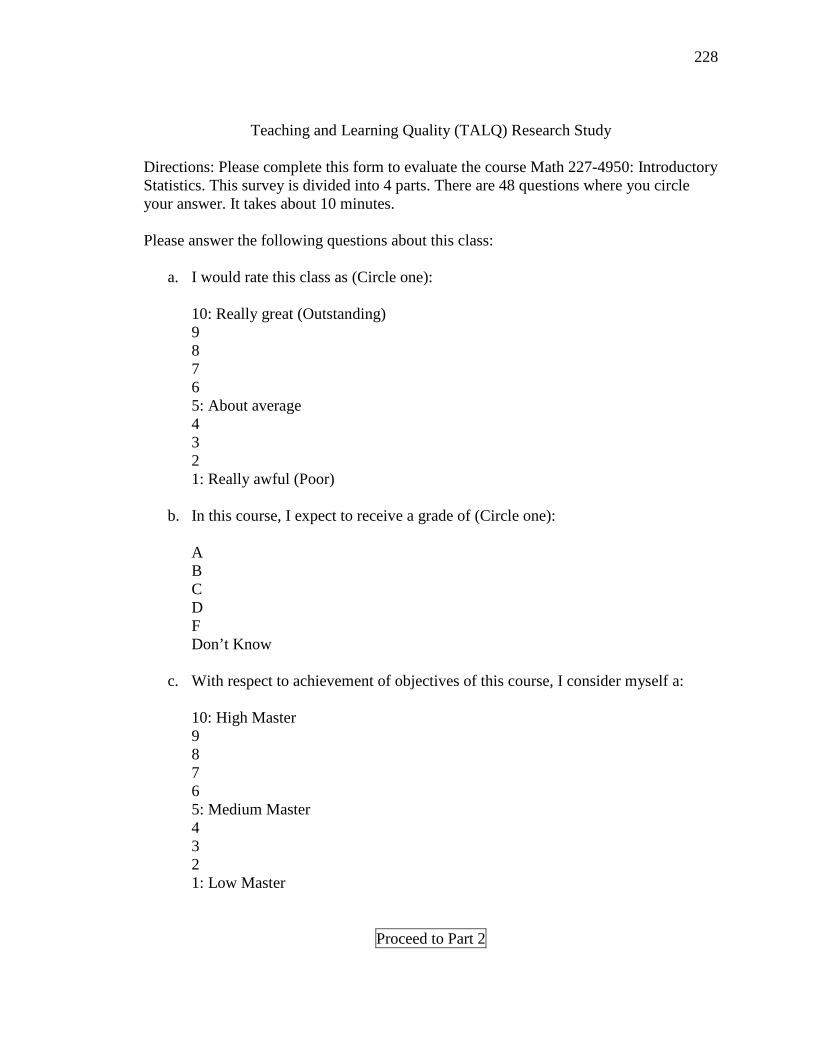
228
Teaching and Learning Quality (TALQ) Research Study Directions: Please complete this form to evaluate the course Math 227-4950: Introductory Statistics. This survey is divided into 4 parts. There are 48 questions where you circle your answer. It takes about 10 minutes. Please answer the following questions about this class:
a. I would rate this class as (Circle one):
10: Really great (Outstanding) 9 8 7 6 5: About average 4 3 2 1: Really awful (Poor)
b. In this course, I expect to receive a grade of (Circle one):
A B C D F Don’t Know
c. With respect to achievement of objectives of this course, I consider myself a:
10: High Master 9 8 7 6 5: Medium Master 4 3 2 1: Low Master
Proceed to Part 2
229
Teaching and Learning Quality (TALQ) Study: Part 2 Directions: For each statement below, rate how much you agree/disagree with the statement where 5 indicates “Strongly agree”, 4 indicates “Agree”, 3 indicates “Neutral”, 2 indicates “Disagree”, and 1 indicates “Strongly disagree”. Please circle a number for each statement. Note: In the items below, authentic problems or authentic tasks are meaningful learning activities that involved real-world data.
1. I did not do very well on most of the tasks in this course, according to my instructor’s judgment of the quality of my work.
5 4 3 2 1
2. I am very satisfied with how my instructor taught this class.
5 4 3 2 1
3. I performed a series of increasingly complex authentic tasks in this course.
5 4 3 2 1
4. Compared to what I knew before I took this course, I learned a lot.
5 4 3 2 1
5. My instructor demonstrated skills I was expected to learn in this course.
5 4 3 2 1
6. I am dissatisfied with this course.
5 4 3 2 1
7. My instructor detected and corrected errors I was making when solving problems,
doing learning tasks or completing assignments.
5 4 3 2 1
8. Overall, I would rate the quality of this course as outstanding.
5 4 3 2 1

230
9. I engaged in experiences that subsequently helped me learn ideas or skills that were new and unfamiliar to me.
5 4 3 2 1
10. I learned a lot in this course.
5 4 3 2 1
11. I had opportunities in this course to explore how I could personally use what I
have learned.
5 4 3 2 1
12. I frequently did very good work on projects, assignments, problems and/or learning activities for this course.
5 4 3 2 1
13. This course is one of the most difficult I have taken.
5 4 3 2 1
14. I spent a lot of time doing tasks, projects and/or assignments, and my instructor
judged my work as high quality.
5 4 3 2 1
15. Technology used in this course (online homework, online discussion platform, StatCrunch) helped me to learn instead of distracting me.
5 4 3 2 1
Proceed to Part 3
231
Teaching and Learning Quality (TALQ) Study: Part 3 Directions: For each statement below, rate how much you agree/disagree with the statement where 5 indicates “Strongly agree”, 4 indicates “Agree”, 3 indicates “Neutral”, 2 indicates “Disagree”, and 1 indicates “Strongly disagree”. Please circle a number for each statement.
16. Overall, I would rate this instructor as outstanding.
5 4 3 2 1
17. My instructor gave examples and counter-examples of concepts that I was expected to learn.
5 4 3 2 1
18. This course increased my interest in the subject matter.
5 4 3 2 1
19. My instructor directly compared problems or tasks that we did, so that I could see
how they were similar or different.
5 4 3 2 1
20. This course was a waste of time and money.
5 4 3 2 1
21. In this course I was able to recall, describe or apply my past experience so that I could connect it to what I was expected to learn.
5 4 3 2 1
22. Looking back to when this course began, I have made a big improvement in my
skills and knowledge in this subject.
5 4 3 2 1
23. My instructor gradually reduced coaching or feedback as my learning or performance improved during this course.
5 4 3 2 1

232
24. I put a great deal of effort and time into this course, and it has paid off – I believe that I have done very well overall.
5 4 3 2 1
25. I solved authentic problems or completed authentic tasks in this course.
5 4 3 2 1
26. Opportunities to practice what I learned during this course (e.g., assignments,
class activities, solving problems) were not consistent with how I was formally evaluated for my grade.
5 4 3 2 1
27. I learned very little in this course.
5 4 3 2 1
28. I see how I can apply what I learned in this course to real life situations.
5 4 3 2 1
29. I did a minimum amount of work and made little effort in this course.
5 4 3 2 1
30. My instructor provided a learning structure that helped me to mentally organize
new knowledge and skills.
5 4 3 2 1
Proceed to Part 4
233
Teaching and Learning Quality (TALQ) Study: Part 4 Directions: For each statement below, rate how much you agree/disagree with the statement where 5 indicates “Strongly agree”, 4 indicates “Agree”, 3 indicates “Neutral”, 2 indicates “Disagree”, and 1 indicates “Strongly disagree”. Please circle a number for each statement.
31. In this course I solved a variety of authentic problems that were organized from simple to complex.
5 4 3 2 1
32. I did not learn much as a result of taking this course.
5 4 3 2 1
33. Assignments, tasks, or problems I did in this course are helping me to develop the
skills of thinking statistically.
5 4 3 2 1
34. I was able to publicly demonstrate to others what I learned in this course.
5 4 3 2 1
35. My instructor did not demonstrate skills I was expected to learn.
5 4 3 2 1
36. I had opportunities to practice to try out what I learned in this course.
5 4 3 2 1
37. In this course I was able to reflect on, discuss with others, and defend what I learned.
5 4 3 2 1
38. Overall, I would recommend this instructor to others.
5 4 3 2 1
39. In this course I was able to connect my past experience to new ideas and skills I
was learning.
234
5 4 3 2 1
40. I enjoyed learning about this subject matter.
5 4 3 2 1
41. In this course I was not able to draw upon my past experience nor relate it to new things I was learning.
5 4 3 2 1
42. My course instructor gave me personal feedback or appropriate coaching on what
I was trying to learn.
5 4 3 2 1
43. My instructor provided alternative ways of understanding the same ideas or skills.
5 4 3 2 1
44. I do not expect to apply what I learned in this course to my chosen profession or field of work.
5 4 3 2 1
45. I am very satisfied with this course.
5 4 3 2 1
You’re done. Thank you for your participation.

235
Appendix B
Informed Consent Document
236
Consent Form for Participation in the Research Study Entitled: Designing for Statistical Reasoning and Thinking in a Technology-Enhanced Learning Environment Funding Source: None IRB protocol # 10311218Exp. Principal investigator Co-investigator Wendy Miao, M.A. Martha Snyder, Ph.D. 9000 Overland Ave. 3301 College Avenue Culver City, CA 90230 Fort Lauderdale, FL 33314 (310) 287-4200 (954) 262-2074 For questions/concerns about your research rights, contact: Human Research Oversight Board (Institutional Review Board or IRB) Nova Southeastern University (954) 262-5369/Toll Free: 866-499-0790 [email protected] Site Information West Los Angeles College Mathematics Department 9000 Overland Ave. Culver City, CA 90230 What is the study about? You are invited to participate in a research study. The goal of this study is to understand how the course design based on First Principles of Instruction can facilitate college-level students’ conceptual understanding when learning introductory statistics in a technology-enhanced learning environment. This research is important to shed light on instructional design and technology’s role in the design and implementation of a blended introduction to statistics course at the college level. Initials: ___________ Date: ____________ Page 1 of 4
237
Why are you asking me? We are inviting you to participate because you are currently enrolling in a blended online introductory statistics course at a higher education institution. There will be between 30 and 40 participants in this research study. What will I be doing if I agree to be in the study? You will be interviewed by the researcher and facilitator, Ms. Wendy Miao. You will be asked to describe an appropriate statistical analysis procedure when investigating a real-life scenario. You will answer a 48-question survey to evaluate the learning and teaching of the course. The survey should take you no more than 15 minutes to complete and the interview will last no more than 10 minutes. Is there any audio or video recording? This research project will include audio recording of the interview. This audio recording will be available to the researcher, Ms. Wendy Miao, the Institutional Review Board (IRB), and the dissertation chair, Dr. Martha Snyder. The recording will be transcribed by Ms. Wendy Miao and the digital audio file will be kept securely in Ms. Wendy Miao’s office in a locked drawer. The recording will be kept for 36 months from the end of the study. The recording will be destroyed after that time by deleting the digital file. Because your voice will be potentially identifiable by anyone who hears the recording, your confidentiality for things you say on the recording cannot be guaranteed although the researcher will try to limit access to the recording as described in this paragraph. What are the dangers to me? Risks to you are minimal, meaning they are not thought to be greater than other risks you experience every day. Being recorded means that confidentiality cannot be promised. The possible risk of losing confidentiality could occur during the entire period of study when data from online postings, online discussions, online peer critiques, final assessment, survey, and interviews are collected. If you have questions about the research, your research rights, or if you experience an injury because of the research please contact Ms. Miao at (310) 287-4200. You may also contact the IRB at the numbers indicated above with questions about your research rights. Are there any benefits for taking part in this research study? There are no direct benefits for participating in this study. Will I get paid for being in the study? Will it cost me anything? There are no costs to you or payments made for participating in this study. Initials: ___________ Date: ____________ Page 2 of 4
238
How will you keep my information private? The survey on course evaluation will be kept away from the course facilitator, Ms. Wendy Miao, until your course grade has been officially submitted. The transcripts of online postings, the interview data, final assessment results, and survey results will be linked for a better understanding of your conceptual learning. All the data will be linked through a coding key list, a list consisting of student ID’s along with the assigned pseudonyms. This coding key list will be securely stored separately from all other data in a sealed envelope in a locked drawer in Ms. Miao’s office. All the data collected from you along with the coding key list will be destroyed 36 months after the study ends. All information obtained in this study is strictly confidential unless disclosure is required by law. The IRB, regulatory agencies, or Dr. Martha Snyder may review research records. Use of Student/Academic Information: Your postings from online discussion forum including assignment postings and critique as well as your final assessment results will be used to understand how the course design based on First Principles of Instruction can affect college-level students’ conceptual understanding. What if I do not want to participate or I want to l eave the study? You have the right to leave this study at any time or refuse to participate. If you do decide to leave or you decide not to participate, you will not experience any penalty. If you choose to withdraw, any information collected about you before the date you leave the study will be kept in the research records for 36 months from the conclusion of the study and may be used as a part of the research. Other Considerations: If the researcher learns anything that might change your mind about being involved, you will be informed of this information. Initials: ___________ Date: ____________ Page 3 of 4

239
Voluntary Consent by Participant: By signing below, you indicate that
• this study has been explained to you • you have read this document or it has been read to you • your questions about this research study have been answered • you have been told that you may ask the researchers any study related questions in
the future or contact them in the vent of a research-related injury • you have been told that you may ask Institutional Review Board (IRB) personnel
questions about your study rights • you are entitled to a copy of this form after you have read and signed it
you voluntarily agree to participate in the study: “Designing for Statistical Reasoning and Thinking in a Technology-Enhanced Learning Environment”
Participant's Signature: ___________________________ Date: ________________ Participant’s Name: ______________________________ Date: ________________ Signature of Person Obtaining Consent: _____________________________ Date: _________________________________
Initials: ___________ Date: ____________ Page 4 of 4
240
Appendix C
Permission to use Comprehensive Assessment of Outcomes in a first Statistics Course (CAOS) test
From: Robert delMas [[email protected]] Sent: Tuesday, September 25, 2012 5:12 PM
To: MIAO_WENDY
Subject: Re: Seeking permission of using CAOS as an instrument in my study
Dear Wendy: Thank you for asking for permission to use the CAOS test in your research project. I am happy to grant you permission, especially since using the CAOS test in educational research was one of the main purposes for developing the test. I see that you registered to access and administer the ARTIST online tests, which includes CAOS, back in 2005. If you are intending to have the research participants take CAOS through the ARTIST online testing website (and I hope that you are), then I can provide you with data files of the participants' individual responses once they have completed the CAOS test if you provide me with evidence of Human Subjects IRB approval from your institution. And please let me know if you have additional questions. Best regards, Bob delMas ******************************* Robert C. delMas, Ph.D. Associate Professor Quantitative Methods in Education Director, APECS Minor Department of Educational Psychology University of Minnesota 250 Education Sciences Building 56 East River Road Minneapolis, MN 55455 Phone: (612) 625-2076 Fax: (612) 624-8241
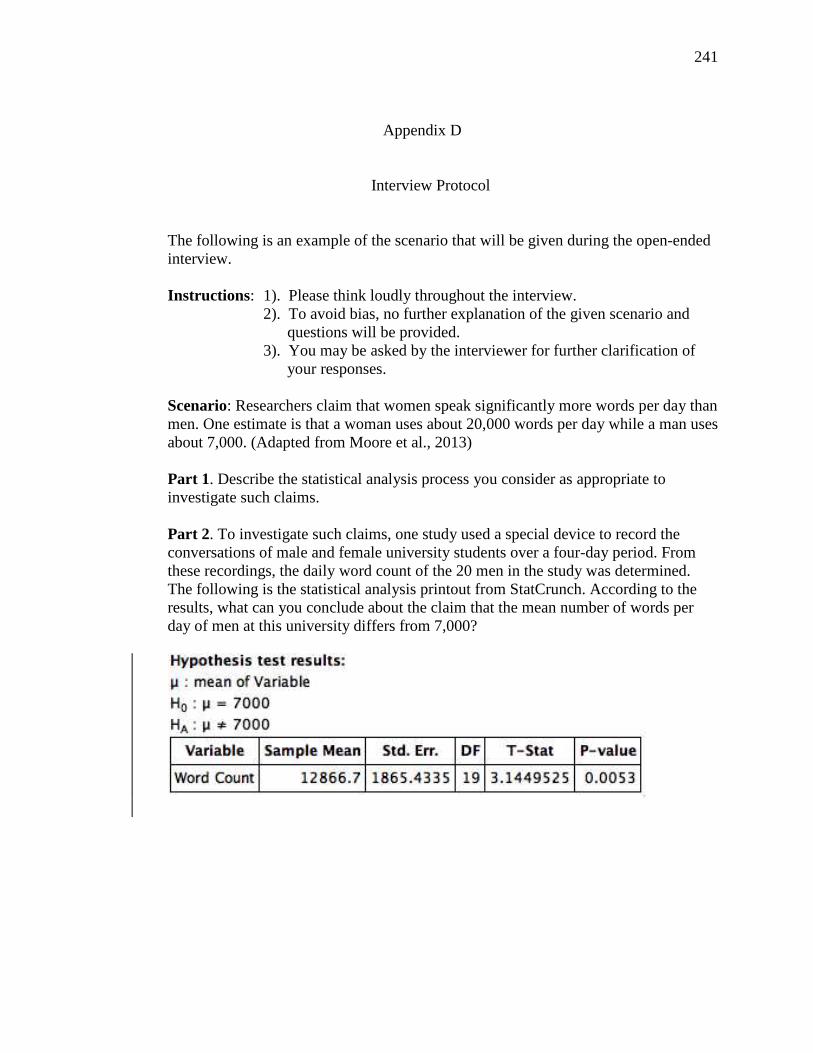
241
Appendix D
Interview Protocol
The following is an example of the scenario that will be given during the open-ended interview. Instructions: 1). Please think loudly throughout the interview.
2). To avoid bias, no further explanation of the given scenario and questions will be provided.
3). You may be asked by the interviewer for further clarification of your responses.
Scenario: Researchers claim that women speak significantly more words per day than men. One estimate is that a woman uses about 20,000 words per day while a man uses about 7,000. (Adapted from Moore et al., 2013) Part 1. Describe the statistical analysis process you consider as appropriate to investigate such claims. Part 2. To investigate such claims, one study used a special device to record the conversations of male and female university students over a four-day period. From these recordings, the daily word count of the 20 men in the study was determined. The following is the statistical analysis printout from StatCrunch. According to the results, what can you conclude about the claim that the mean number of words per day of men at this university differs from 7,000?
242
Appendix E
Teaching and Learning Quality (TALQ) Survey Items Arranged by TALQ Scales
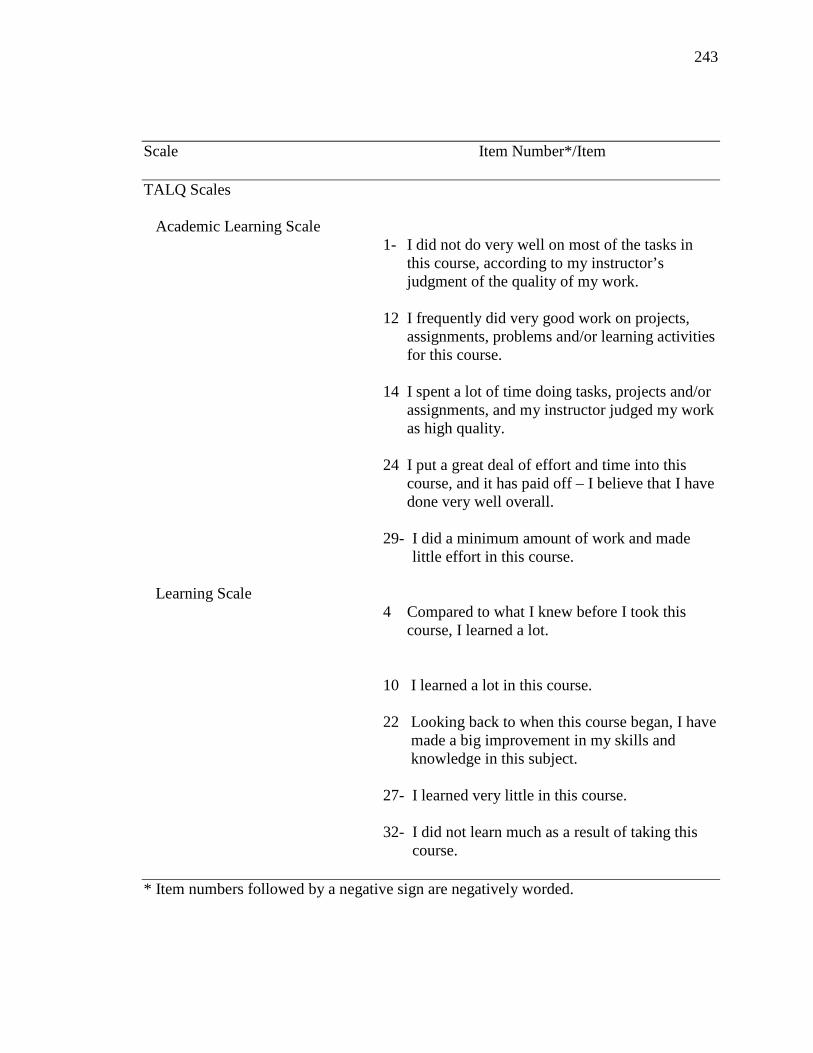
243
Scale Item Number*/Item
TALQ Scales
Academic Learning Scale 1- I did not do very well on most of the tasks in
this course, according to my instructor’s judgment of the quality of my work.
12 I frequently did very good work on projects,
assignments, problems and/or learning activities for this course.
14 I spent a lot of time doing tasks, projects and/or
assignments, and my instructor judged my work as high quality.
24 I put a great deal of effort and time into this
course, and it has paid off – I believe that I have done very well overall.
29- I did a minimum amount of work and made
little effort in this course. Learning Scale
4 Compared to what I knew before I took this course, I learned a lot.
10 I learned a lot in this course. 22 Looking back to when this course began, I have
made a big improvement in my skills and knowledge in this subject.
27- I learned very little in this course. 32- I did not learn much as a result of taking this
course. * Item numbers followed by a negative sign are negatively worded.
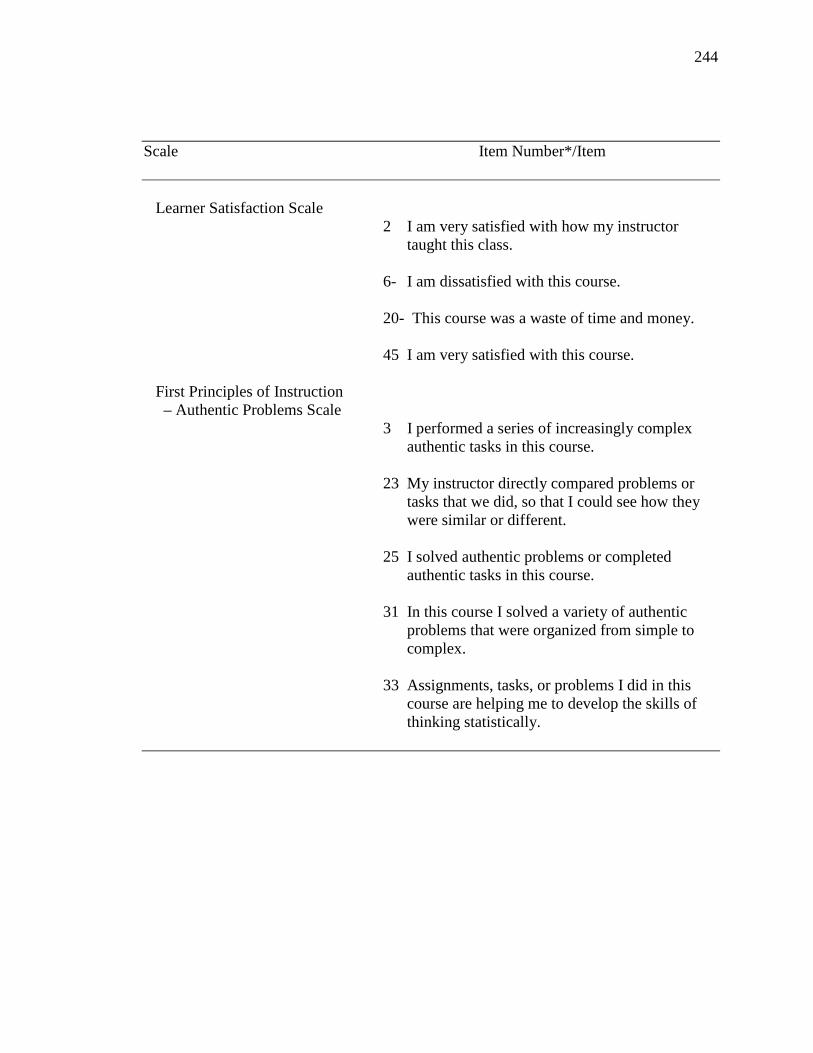
244
Scale Item Number*/Item
Learner Satisfaction Scale
2 I am very satisfied with how my instructor taught this class.
6- I am dissatisfied with this course. 20- This course was a waste of time and money. 45 I am very satisfied with this course.
First Principles of Instruction – Authentic Problems Scale
3 I performed a series of increasingly complex authentic tasks in this course.
23 My instructor directly compared problems or
tasks that we did, so that I could see how they were similar or different.
25 I solved authentic problems or completed
authentic tasks in this course. 31 In this course I solved a variety of authentic
problems that were organized from simple to complex.
33 Assignments, tasks, or problems I did in this
course are helping me to develop the skills of thinking statistically.
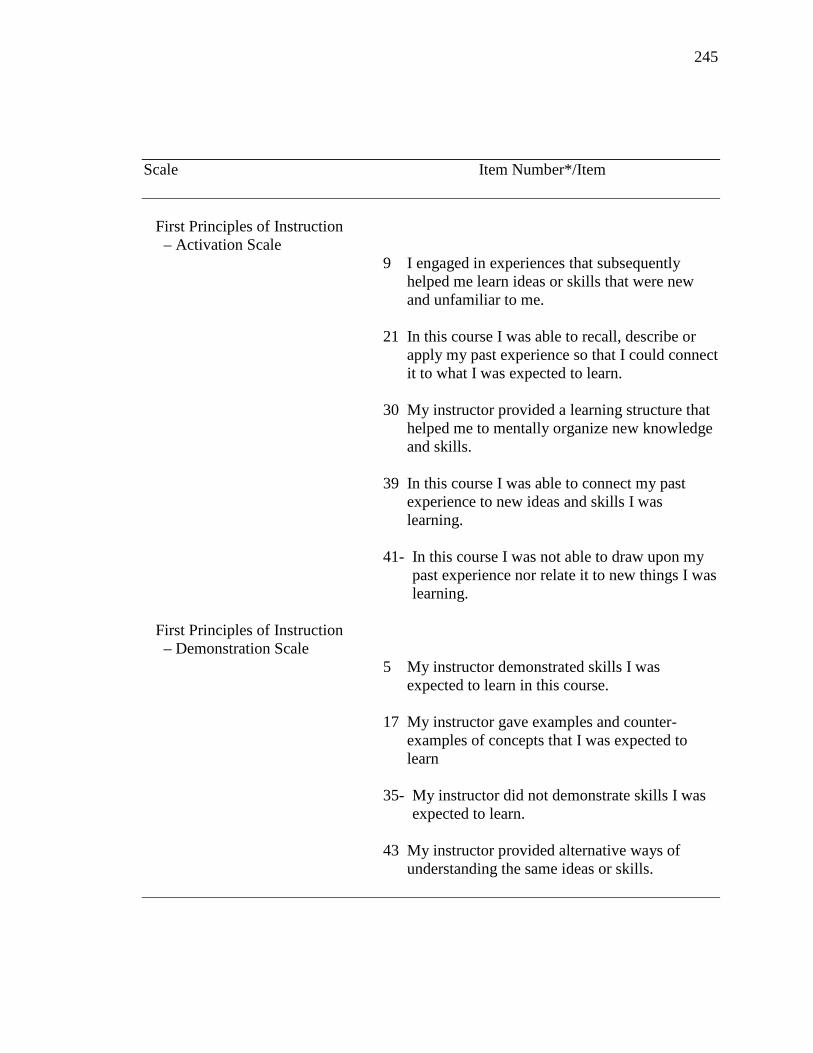
245
Scale Item Number*/Item
First Principles of Instruction – Activation Scale
9 I engaged in experiences that subsequently helped me learn ideas or skills that were new and unfamiliar to me.
21 In this course I was able to recall, describe or
apply my past experience so that I could connect it to what I was expected to learn.
30 My instructor provided a learning structure that
helped me to mentally organize new knowledge and skills.
39 In this course I was able to connect my past
experience to new ideas and skills I was learning.
41- In this course I was not able to draw upon my
past experience nor relate it to new things I was learning.
First Principles of Instruction – Demonstration Scale
5 My instructor demonstrated skills I was expected to learn in this course.
17 My instructor gave examples and counter-
examples of concepts that I was expected to learn
35- My instructor did not demonstrate skills I was
expected to learn. 43 My instructor provided alternative ways of
understanding the same ideas or skills.
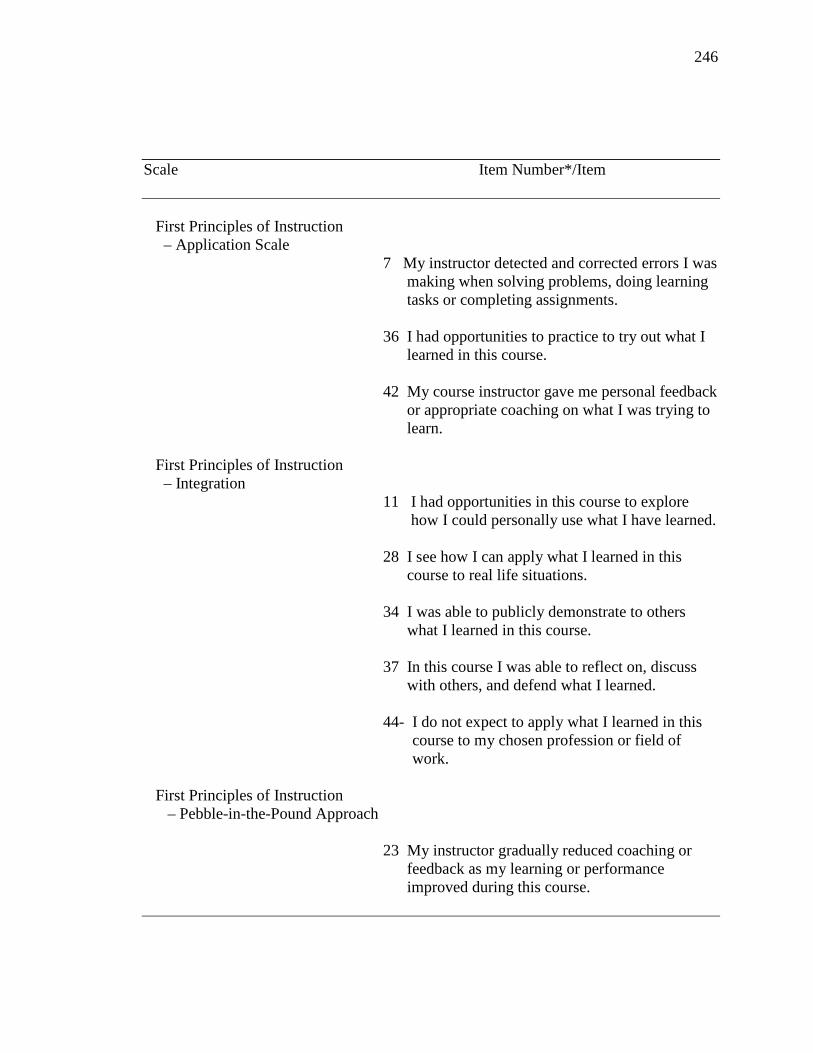
246
Scale Item Number*/Item
First Principles of Instruction – Application Scale
7 My instructor detected and corrected errors I was making when solving problems, doing learning tasks or completing assignments.
36 I had opportunities to practice to try out what I
learned in this course. 42 My course instructor gave me personal feedback
or appropriate coaching on what I was trying to learn.
First Principles of Instruction – Integration
11 I had opportunities in this course to explore how I could personally use what I have learned.
28 I see how I can apply what I learned in this
course to real life situations. 34 I was able to publicly demonstrate to others
what I learned in this course. 37 In this course I was able to reflect on, discuss
with others, and defend what I learned. 44- I do not expect to apply what I learned in this
course to my chosen profession or field of work.
First Principles of Instruction
– Pebble-in-the-Pound Approach 23 My instructor gradually reduced coaching or
feedback as my learning or performance improved during this course.
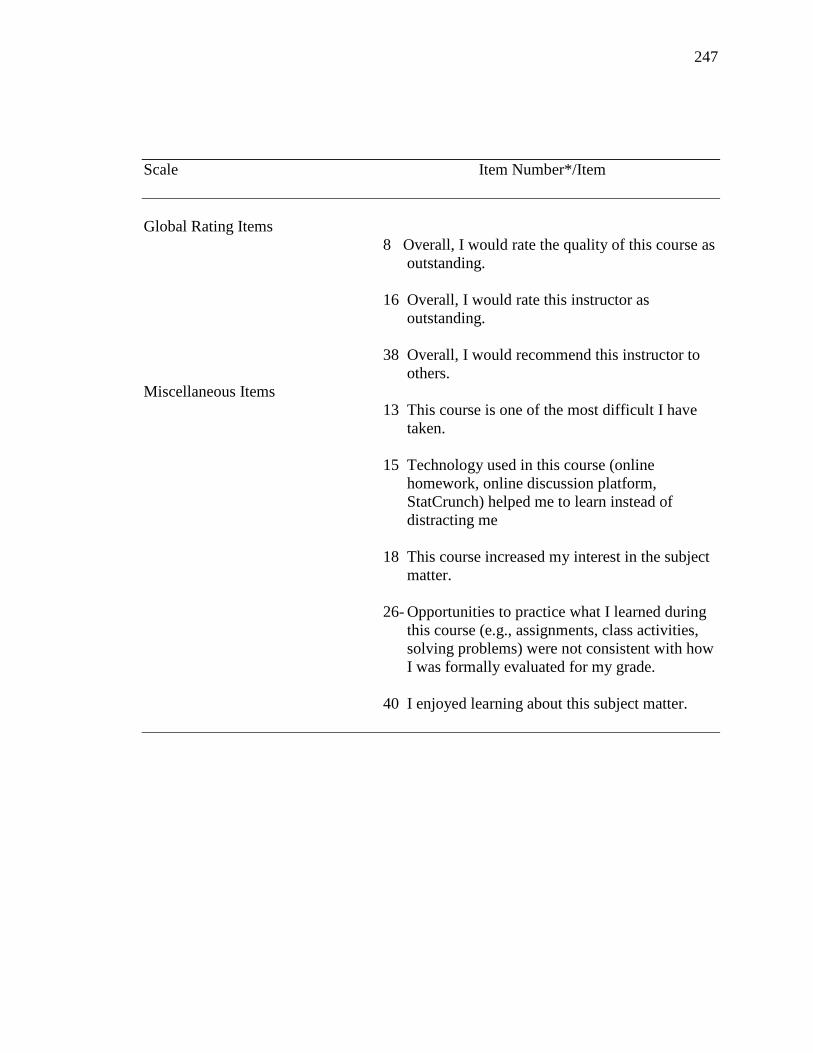
247
Scale Item Number*/Item
Global Rating Items
8 Overall, I would rate the quality of this course as outstanding.
16 Overall, I would rate this instructor as
outstanding. 38 Overall, I would recommend this instructor to
others. Miscellaneous Items
13 This course is one of the most difficult I have taken.
15 Technology used in this course (online
homework, online discussion platform, StatCrunch) helped me to learn instead of distracting me
18 This course increased my interest in the subject
matter.
26- Opportunities to practice what I learned during this course (e.g., assignments, class activities, solving problems) were not consistent with how I was formally evaluated for my grade.
40 I enjoyed learning about this subject matter.
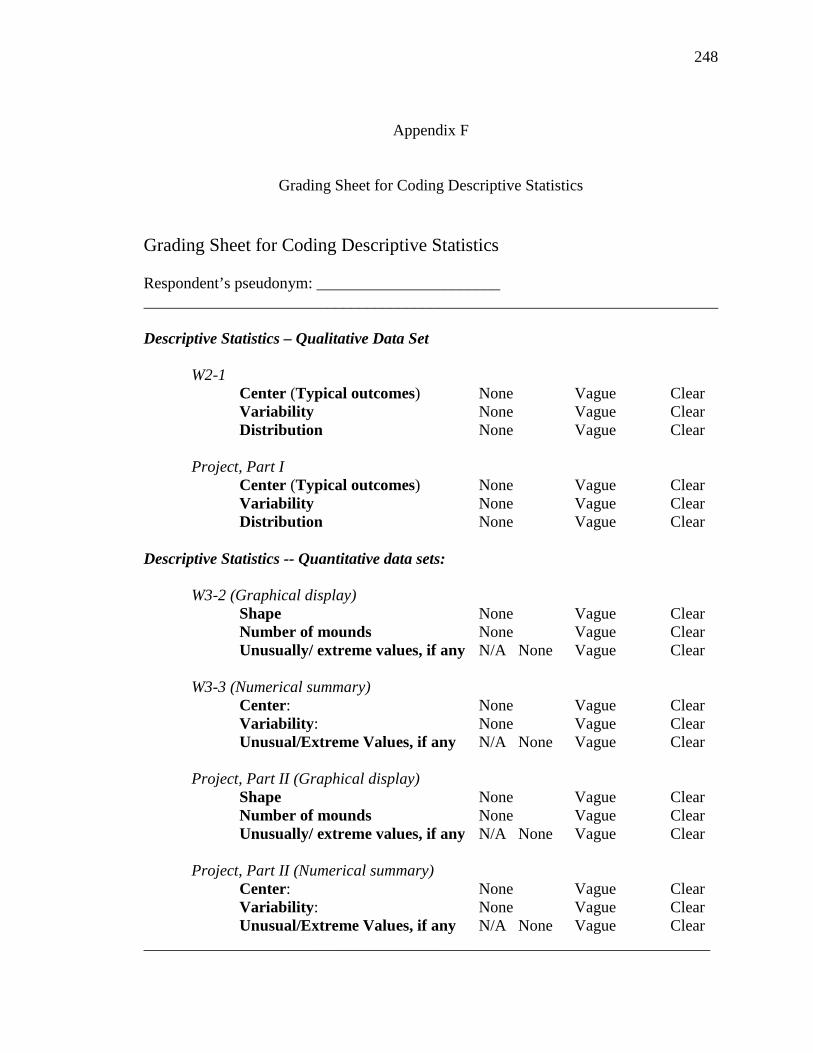
248
Appendix F
Grading Sheet for Coding Descriptive Statistics Grading Sheet for Coding Descriptive Statistics Respondent’s pseudonym: _______________________ ________________________________________________________________________ Descriptive Statistics – Qualitative Data Set
W2-1
Center (Typical outcomes) None Vague Clear Variability None Vague Clear Distribution None Vague Clear
Project, Part I
Center (Typical outcomes) None Vague Clear Variability None Vague Clear Distribution None Vague Clear
Descriptive Statistics -- Quantitative data sets:
W3-2 (Graphical display)
Shape None Vague Clear Number of mounds None Vague Clear Unusually/ extreme values, if any N/A None Vague Clear
W3-3 (Numerical summary)
Center: None Vague Clear Variability : None Vague Clear Unusual/Extreme Values, if any N/A None Vague Clear
Project, Part II (Graphical display)
Shape None Vague Clear Number of mounds None Vague Clear Unusually/ extreme values, if any N/A None Vague Clear
Project, Part II (Numerical summary)
Center: None Vague Clear Variability : None Vague Clear Unusual/Extreme Values, if any N/A None Vague Clear
_______________________________________________________________________

249
Appendix G
Nova Southeastern University IRB Approval
250

251
Appendix H
West Los Angeles College Approval
252
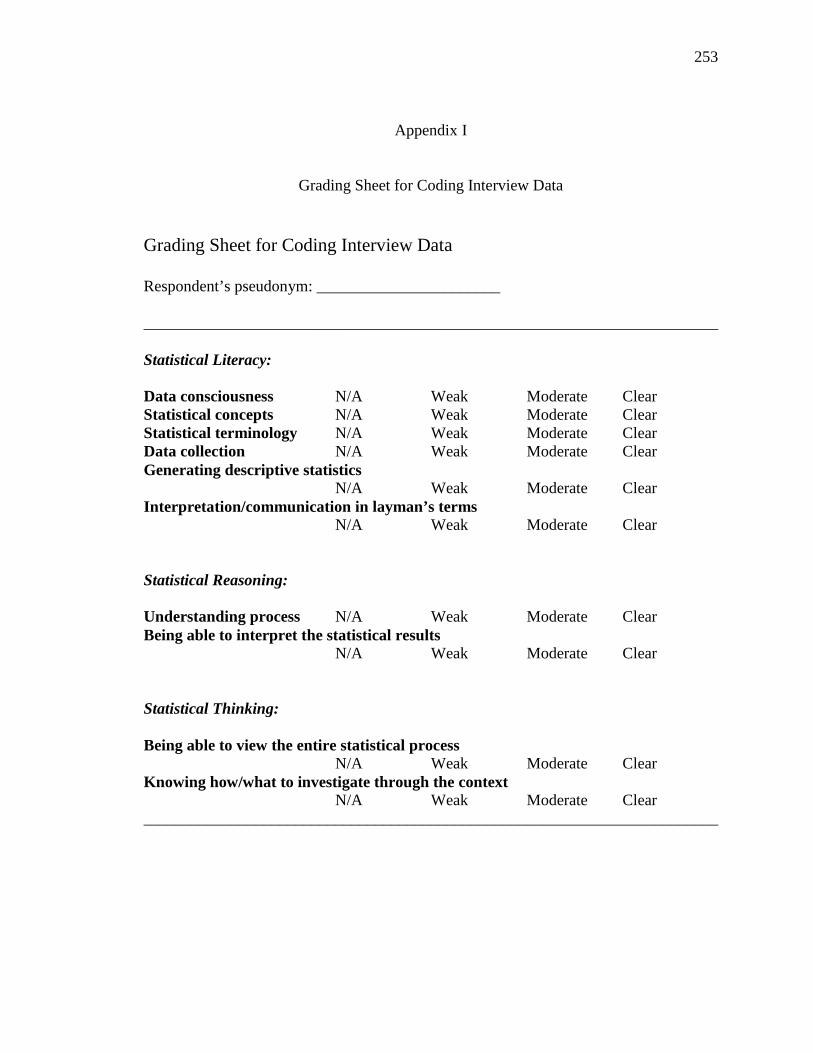
253
Appendix I
Grading Sheet for Coding Interview Data Grading Sheet for Coding Interview Data Respondent’s pseudonym: _______________________ ________________________________________________________________________ Statistical Literacy:
Data consciousness N/A Weak Moderate Clear Statistical concepts N/A Weak Moderate Clear Statistical terminology N/A Weak Moderate Clear Data collection N/A Weak Moderate Clear Generating descriptive statistics N/A Weak Moderate Clear Interpretation/communication in layman’s terms N/A Weak Moderate Clear Statistical Reasoning:
Understanding process N/A Weak Moderate Clear Being able to interpret the statistical results N/A Weak Moderate Clear Statistical Thinking:
Being able to view the entire statistical process N/A Weak Moderate Clear Knowing how/what to investigate through the context N/A Weak Moderate Clear ________________________________________________________________________

254
Appendix J
Amelia’s Interview Question
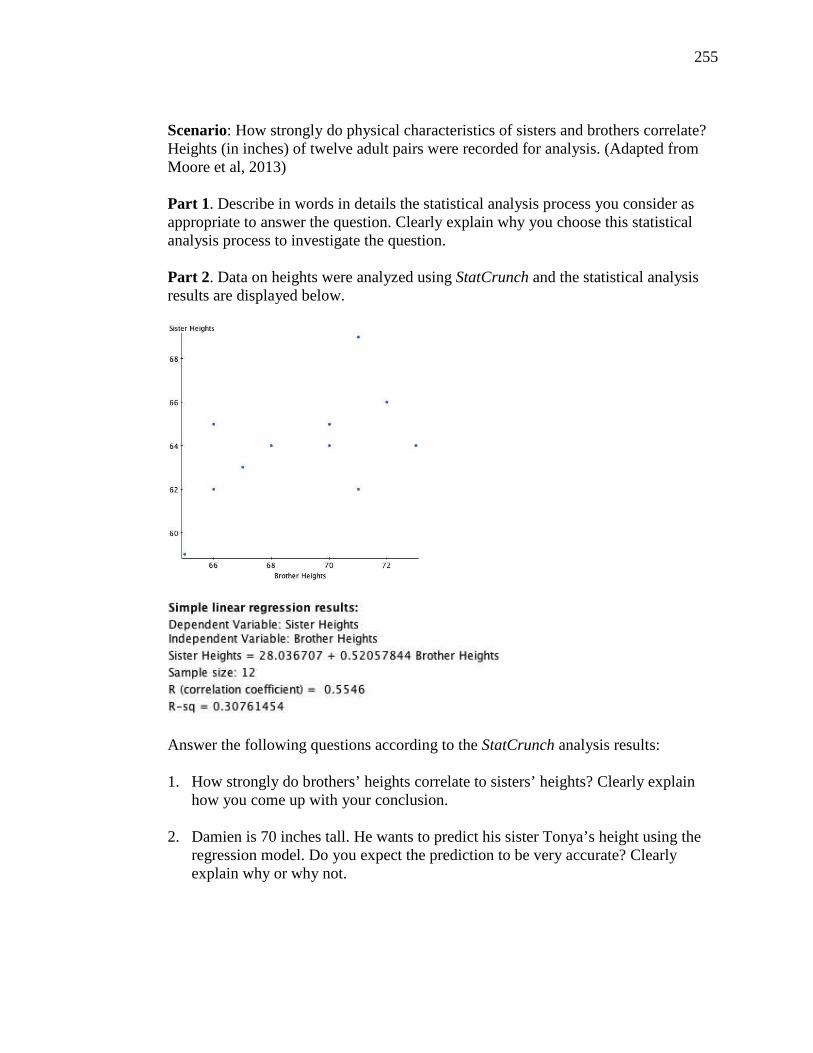
255
Scenario: How strongly do physical characteristics of sisters and brothers correlate? Heights (in inches) of twelve adult pairs were recorded for analysis. (Adapted from Moore et al, 2013) Part 1. Describe in words in details the statistical analysis process you consider as appropriate to answer the question. Clearly explain why you choose this statistical analysis process to investigate the question. Part 2. Data on heights were analyzed using StatCrunch and the statistical analysis results are displayed below.
Answer the following questions according to the StatCrunch analysis results: 1. How strongly do brothers’ heights correlate to sisters’ heights? Clearly explain
how you come up with your conclusion. 2. Damien is 70 inches tall. He wants to predict his sister Tonya’s height using the
regression model. Do you expect the prediction to be very accurate? Clearly explain why or why not.

256
Appendix K
Charlie’s Interview Question
257
Scenario: Do online male daters overstate their heights in online dating profiles? A researcher wants to investigate if the online male daters report their heights in online dating profiles more than their actual heights. (Adapted from Peck, 2014) Part 1. Describe in words in details the statistical analysis process you consider as the most appropriate to answer the researcher’s question. Clearly explain why you choose this statistical analysis process to investigate the question.
Part 2. Forty men with online dating profiles agreed to participate in the study. Each participant’s height (in inches) was measured and the height given in that person’s online profile was also recorded. A 95% confidence interval on mean difference of heights between the heights reported in online dating profiles and the actual heights is found to be (0.31, 0.83) with a sample mean difference in height of 0.57 inches and sample standard deviation of difference in height of 0.81 inches. Answer the following questions according to the StatCrunch analysis results: 1. Is there convincing evidence that, on average, male online daters overstate their
height in online dating profiles? Report all the conclusions you can draw from the confidence interval results in context. Clearly explain how you get your conclusions.
27. Can the researcher generalize his conclusion to all the online male daters? Justify
your answer in details.

258
Appendix L
Harry’s Interview Question
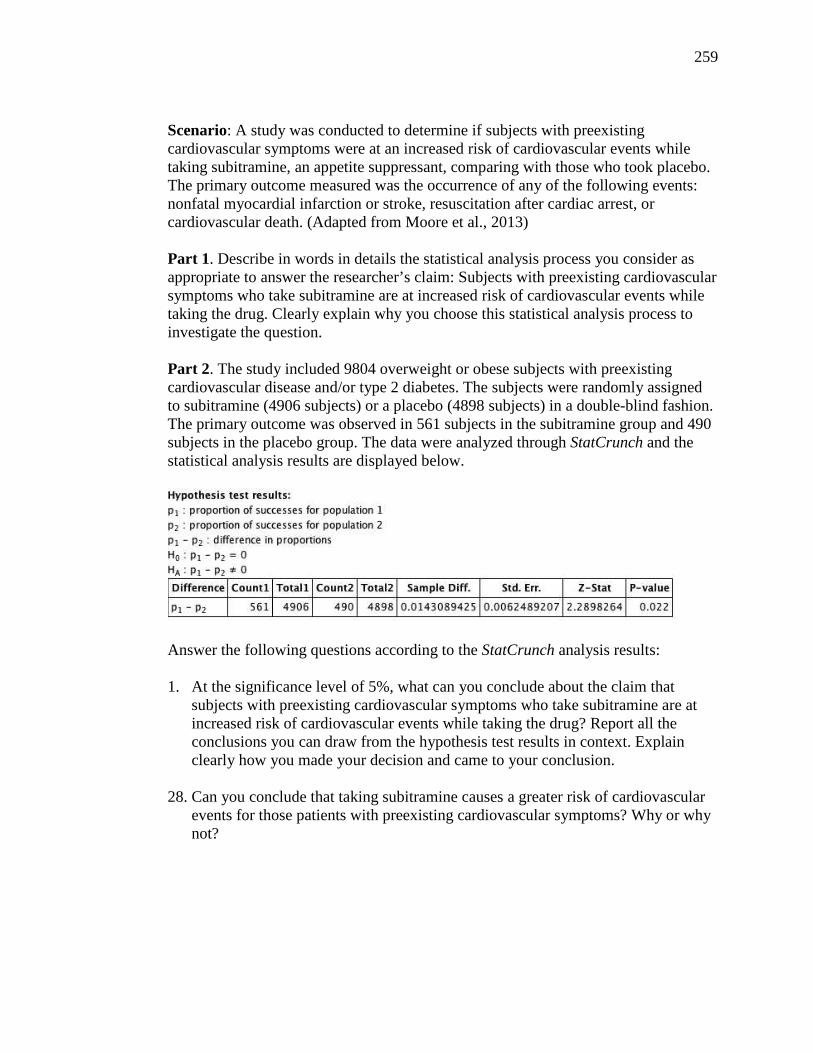
259
Scenario: A study was conducted to determine if subjects with preexisting cardiovascular symptoms were at an increased risk of cardiovascular events while taking subitramine, an appetite suppressant, comparing with those who took placebo. The primary outcome measured was the occurrence of any of the following events: nonfatal myocardial infarction or stroke, resuscitation after cardiac arrest, or cardiovascular death. (Adapted from Moore et al., 2013) Part 1. Describe in words in details the statistical analysis process you consider as appropriate to answer the researcher’s claim: Subjects with preexisting cardiovascular symptoms who take subitramine are at increased risk of cardiovascular events while taking the drug. Clearly explain why you choose this statistical analysis process to investigate the question. Part 2. The study included 9804 overweight or obese subjects with preexisting cardiovascular disease and/or type 2 diabetes. The subjects were randomly assigned to subitramine (4906 subjects) or a placebo (4898 subjects) in a double-blind fashion. The primary outcome was observed in 561 subjects in the subitramine group and 490 subjects in the placebo group. The data were analyzed through StatCrunch and the statistical analysis results are displayed below.
Answer the following questions according to the StatCrunch analysis results: 1. At the significance level of 5%, what can you conclude about the claim that
subjects with preexisting cardiovascular symptoms who take subitramine are at increased risk of cardiovascular events while taking the drug? Report all the conclusions you can draw from the hypothesis test results in context. Explain clearly how you made your decision and came to your conclusion.
28. Can you conclude that taking subitramine causes a greater risk of cardiovascular
events for those patients with preexisting cardiovascular symptoms? Why or why not?

260
Appendix M
Jessica’s Interview Question
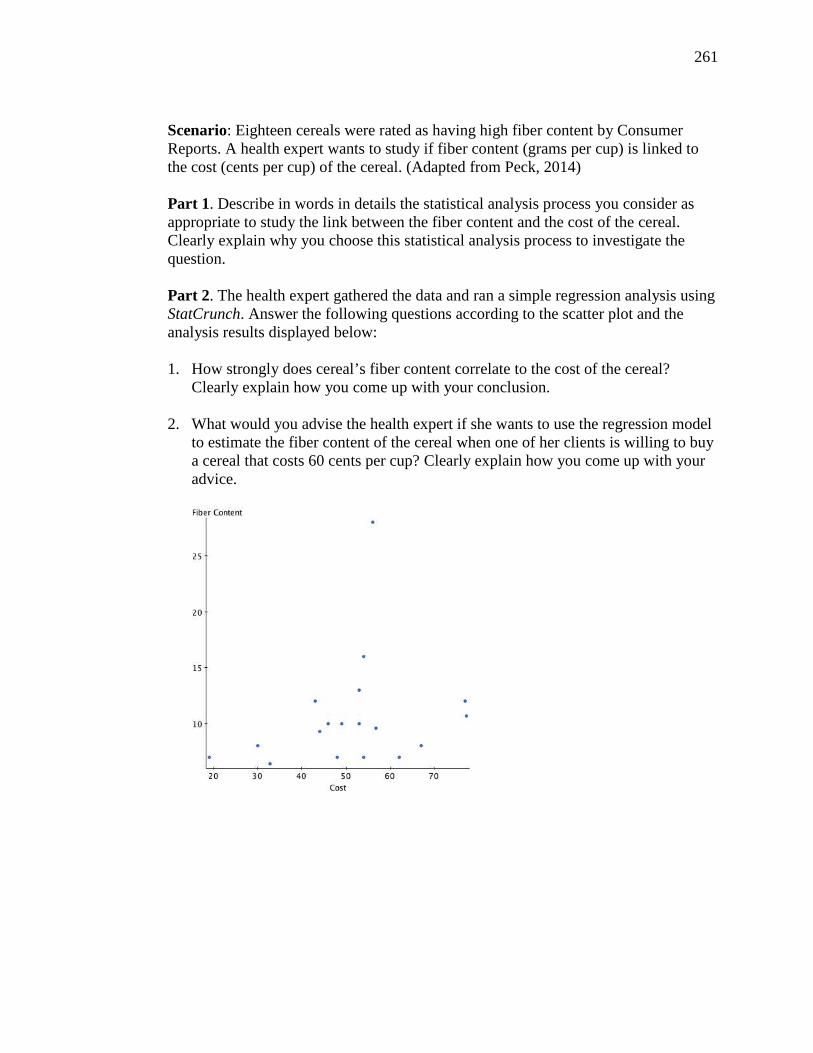
261
Scenario: Eighteen cereals were rated as having high fiber content by Consumer Reports. A health expert wants to study if fiber content (grams per cup) is linked to the cost (cents per cup) of the cereal. (Adapted from Peck, 2014) Part 1. Describe in words in details the statistical analysis process you consider as appropriate to study the link between the fiber content and the cost of the cereal. Clearly explain why you choose this statistical analysis process to investigate the question. Part 2. The health expert gathered the data and ran a simple regression analysis using StatCrunch. Answer the following questions according to the scatter plot and the analysis results displayed below: 1. How strongly does cereal’s fiber content correlate to the cost of the cereal?
Clearly explain how you come up with your conclusion. 2. What would you advise the health expert if she wants to use the regression model
to estimate the fiber content of the cereal when one of her clients is willing to buy a cereal that costs 60 cents per cup? Clearly explain how you come up with your advice.
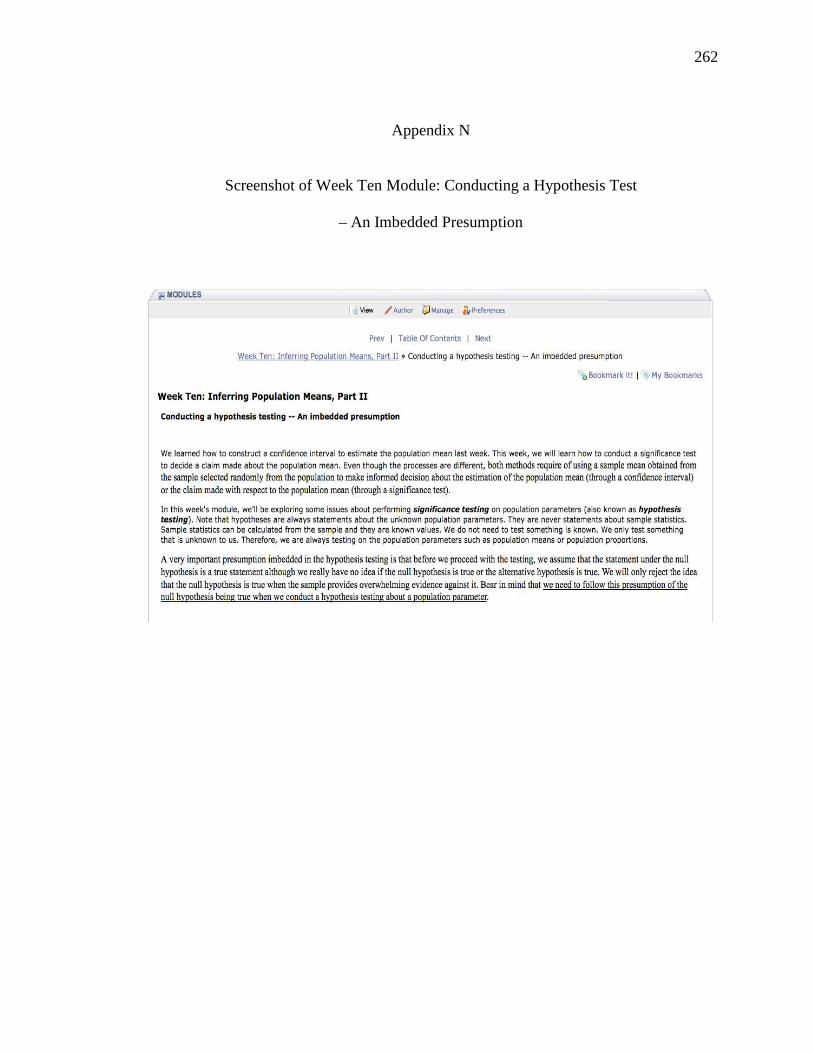
262
Appendix N
Screenshot of Week Ten Module: Conducting a Hypothesis Test
– An Imbedded Presumption
263
Appendix O
Weekly Module: Conducting a Hypothesis Testing, A Four-Step Process

264
We’ll use the following four-step process to conduct the significance test: (adopted from Gould & Ryan, 2013).
1. Hypothesize: Set up the null hypothesis and the alternative hypothesis about the population parameter.
2. Prepare & get ready to test: Choose a significance level (a). Choose a test statistic appropriate for the test. Check and see if all the requirements needed are satisfied.
3. Compute to compare: Compute the test statistic. Find the p-value based on the test statistic.
4. Make decision and Interpret: Reject or not to reject the null hypothesis? What does this mean in context?
Example (iTunes Library ): We will continue with the iTunes lectures collection example. Recall that a random sample of 25 lectures was selected from the entire collection of a total of 59 Islamic lectures given by Shaykh Riyadh in Ms. Miao’s iTunes library with a sample mean lecture length of 87.47 minutes and a sample standard deviation of 26.58 minutes. Conduct a hypothesis test that the population mean lecture length of the entire collection is longer than 60 minutes.
We’ll follow the four-step process described above and fill in the details for each step.
1. Hypothesize: The null hypothesis indicates ‘no difference than the claimed 60 minutes’ while the alternative hypothesis states that the mean lecture length of the entire collection is longer than 60 minutes.
Ho: µ = 60
Ha: µ > 60
Where m represents the mean lecture length of all the lectures collected in Ms. Miao’s iTune library.
2. Prepare and get ready to test: The process of conducting a significance test always begins with a presumption that the statement under the null hypothesis is true. We then proceed with the test, using the sample evidence in a hope to reach to a decision that we could reject the presumption that the null hypothesis is true (reject Ho).
Putting in context, we begin with an assumption that the population mean lecture length is 60 minutes. Next, we’ll use the sample mean of 87.47 minutes as evidence in a hope to reach to a decision that we could reject the presumption. If this happens, we say that the sample mean is significant to conclude that the population mean lecture length is longer than 60 minutes. On the other hand, if we
265
fail to reject that the presumption is true then we say that the sample evidence is insignificant to conclude that the population mean lecture length is longer than 60 minutes.
Note that we use the sample mean as evidence in testing the claim of a population mean. Again, as mentioned before, this is because sample mean is an unbiased estimator to the population mean.
Choosing the significance level (a)
If we boil down the process of significance test, we see that the goal of conducting a significance test is to reject the null hypothesis (after we assume it is true). One issue comes up: What if we reject the null hypothesis while the null hypothesis is actually true? Don’t we make a mistake? Yes, and we call this mistake a Type I error.
We certainly don’t want to make any mistakes during the hypothesis testing process. However, it is inevitable since we do not know whether the null hypothesis is true or not true. (Hint: The statements under the hypotheses are always about a population parameter. If we know the true value of a population parameter, there is no need to test it in the first place.) In fact, we have even no idea if we’ve made a mistake because we do not know the value of the parameter.
Even though we have no control over the truth-value of a parameter, we can certainly discuss the probability of making such a mistake. Fortunately, we can maintain the probability of making such a mistake (rejecting Ho when Ho is true) to as low as possible without compromising the quality of the test. The significance level (a) is the term we use to describe the probability of making such a mistake: Rejecting the null hypothesis when in fact the null hypothesis is true.
The significance level is prescribed prior to conducting the test to maintain the probability of making such a mistake (rejecting Ho when Ho is true, or simply, Type I error) to a low level possible without compromising the quality of the test. This can usually be achieved at a = 5%. Putting in context, a significance level at 5% means the following:
The probability of making a false conclusion that the mean lecture length of all the lectures collected in Ms. Miao’s iTunes library is longer than 60 minutes while in fact it is not is maintained at no more than 5%.
You might ask: Why not keep the probability of making a false conclusion about the null hypothesis at a level even lower than 5%? This is certainly a good suggestion. Unfortunately, a low probability of making a Type I error always leads to a high probability of making a Type II error (fail to reject the null
266
hypothesis when in fact the null hypothesis is false). If you recall, we mentioned that we would like to keep the probability of making a Type I error at a reasonably low level without compromising the quality of the test. The quality of the test is measured by the power of the test: 1 -βwhere β is the probability of making a Type II error.
When we decrease the probability of making a Type I error (α ), the probability of making a Type II error (β ) would go up, which leads to a decrease in 1 - β (the power of the test). As such, a researcher, generally, would not prescribe a low a, such as at 1%, unless he cannot afford making a Type I error. (That is, making a Type I error is considered to be so devastating that the researcher tries every possible way to avoid.)
Choose an appropriate test statistic
In addition to choosing a significance level (a), we need to choose an appropriate test statistic. To choose an appropriate test statistic means that we need to choose the correct sample estimator (that is, an unbiased estimator) and its sampling distribution. In testing the population mean, the sample estimator is the sample mean and the sampling distribution of the sample mean is a Z distribution. However, the standard error of the sample mean distribution requires the knowledge of population standard deviation, which, in most cases, is unknown. There is a need to use sample standard deviation to estimate the population standard deviation when calculating the standard error. Therefore, a modified t distribution would be used instead of the Z distribution.
In summary, the test statistic for testing the population mean when population standard deviation is unknown is
Checking the requirements
The last step in preparation for a hypothesis testing is to check the requirements needed for testing. As with the construction of confidence intervals, two requirements need to be checked:
a) Randomization: It is mainly about checking the sample selection. If the sample is selected randomly as a random sample, then the conclusion drawn from the hypothesis testing could be implied to the entire population. If the sample is not a random sample, then we cannot imply the conclusion to the entire population. Rather, the conclusion can only be made to that specific group of subjects.
b) Normality assumption: According to Central Limit Theorem, unless the population distribution of the variable is a symmetric distribution, our sample size needs to be large enough (usually at least 25) to ensure a symmetric
267
sample mean distribution. This normality assumption guarantees the acceptance of finding the test statistic: test t and use this result to continue the testing process.
In our example, the variable of lecture length of the entire collection does follow a normal distribution. Thus, the normality assumption is satisfied. This validates the choice of test t as a test statistic for conducting the test. As for the randomization assumption, the sample is selected at random. Therefore, later we could imply the hypothesis test results to Ms. Miao’s entire collection of a total of 59 Islamic lectures given by Shaykh Riyadh.
3. Compute to compare: The validation of using test t as the test statistic has been established through the checking of the normality assumption. StatCrunch one sample t test gives the following test results:
Hypothesis test results: µ : population mean H0 : µ = 60 HA : µ > 60
4. Make decision and interpret: From the displayed test results, we see that the hypothesis test is conducted to test that the population mean lecture length of the total 59 lectures given by Shaykh Riyadh is longer than 60 minutes (a right-tailed test). The standard error of 5.316 is calculated by dividing the sample standard deviation of 26.58 minutes by the square root of the sample size of 25. The degrees of freedom for the sample is the sample size minus one, or, 25 – 1 = 24. The test t is 5.17 and the p-value is less than 0.0001, which indicates a statistically significant result to reject the null hypothesis. That is, the sample mean lecture length of 87.47 minutes can be used as a significant piece of evidence that the mean lecture length of all the lectures given by Shaykh Riyadh in Ms. Miao’s iTunes collection is longer than 60 minutes.
Justification of the rejection rule: Reject the null hypothesis if p-value is less than or equal to α
Let’s understand the meaning of the p-value: p-value is similar to α in that they are both probabilities of making a Type I error (rejecting the null hypothesis when the null hypothesis is true). Whileα is a prescribed probability of making a Type I error, p-value is the actual probability of making a Type I error computed from the sample estimator. We use αas a guideline to decide if we could reject the null hypothesis by comparing the p-value with theα . So long as the probability of
Mean Sample Mean Std. Err. DF T-Stat P-value
µ 87.47 5.316 24 5.167419 <0.0001
268
making a Type I error computed from the sample evidence (p-value) is not greater than (less than or equal to) the prescribed probability of making a Type I error (α ), we feel safe to reject the null hypothesis. This is because a Type I error is only made when we reject the null hypothesis.
On the other hand, if the computed probability of making a Type I error (p-value) is greater than the prescribed probability of making a Type I error (α ), we feel that the chance of making a Type I error is too high if we still want to reject the null hypothesis. By not rejecting the null hypothesis, we avoid making a Type I error. Again, this is because a Type I error is only made when we reject the null hypothesis. However, by not rejecting the null hypothesis, we risk making a Type II error.
With a result of a p-value being less than 0.0001, we understand that the computed probability of making a Type I error using the sample mean lecture length of 87.47 minutes is almost 0. That is, the probability of rejecting that the mean lecture length is 60 minutes (the null hypothesis) when the mean lecture length is actually 60 minutes is almost 0. Knowing that the chance of making a Type I error is almost 0 (almost doesn’t exist), we feel quite secure to reject the null hypothesis.
269
Appendix P
Weekly Discussion: Testing on a Population Mean
1. Select a random sample of 30 lectures from Shaykh Riyadh iTunes lecture list (as of 2/10/13). (Refer to the instructions given in last week’s discussion forum to select your sample.) Share your sample data file with our StatCrunch class group.
2. Apply the four-step process as described in this module to conduct a hypothesis test that the population mean lecture length of the entire collection is longer than 80 minutes. Clearly describe each step in context. Post your StatCrunch one sample t test results on Etudes.
Hypothesize:
a) Set up two hypotheses and explain the meaning in context.
b) Describe the Type I error and Type II error in context.
Prepare & get ready to test:
a) Select level of significance: What level of significance would you use? Why? Describe your alpha in context.
b) Choose an appropriate test statistic: What is the appropriate test statistic for your test? Briefly explain why you choose this test statistic.
c) Check the requirements: What are the requirements to check to conduct the test? Do they satisfy? Explain.
Compute to compare:
a) Conduct the appropriate test on StatCrunch and post the results here.
b) Describe p-value in context.
Make decision & Interpret:
a) According to the statistical analysis results from StatCrunch, do you reject Ho? Why or why not? Explain in context.
b) Is the sample evidence significant?
c) Interpret your test decision in context.

270
Appendix Q
Project for Inferring Population Means
271
Instructions: There are three parts in this project. Each part of the project is described below. Please label each part of the project properly for readability. Include all the necessary graphs/charts in your response. Be sure the graphs and charts are displayed properly on the discussion forum. Please comment/critique at least two students' projects by providing meaningful and constructive suggestions. Respond to all the comments you receive.
Project Description:
Part I: Estimation through a Confidence Interval
[Refer to W9-1 & W9-2 discussions if needed.]
From your own data collection (data collected for Week 5 Project), select a quantitative variable on which you wish to estimate its population mean. (For example, from my Facebook data, I wish to estimate the mean number of mutual friends between all my friends and me on my Facebook. Therefore, I select the variable Mutual Friends for Part I of the project.)
1. Clearly describe the population parameter you wish to estimate in context. Based on the parameter you wish to estimate, define the variable in context. [The variable in context should be a short phrase (e.g. waiting time, distance, weight, etc.), not a question.]
2. According to the population parameter you wish to estimate, describe your population in context. Be as specific as possible.
3. Select a random sample of at least 30 observations from your data collection. Post your sample collection as a chart on Etudes. [Your chart should include the following two columns: Random numbers and the variable of interest.]
4. Describe the sample distribution of your sample selected in 3) in terms of the shape, center, and variation in context. Post the necessary charts/graphs produced from StatCrunch on Etudes.
5. Describe the sampling distribution of the sample mean based on your sample selection in terms of the shape, center, and variation in context. Justify your answer with a sound theorem.
6. Set up and carry out an appropriate statistical analysis procedure to estimate the population parameter you mentioned that you wish to estimate in 1). Discuss in as much detail as possible, including checking all the required conditions, to carry out the analysis procedure. Interpret the results obtained from the analysis procedure in context. Post StatCrunch statistical analysis results on Etudes.
272
Part II: Testing a Claim through Hypothesis Testing
[Refer to W10-1 discussion if needed.]
From your own data collection (data collected for Week 5 Project), select a quantitative variable (different than the variable selected as in Part I) on which you wish to make a claim on its population mean. (For example, from my Facebook data, I wish to claim that the age of all my friends on Facebook is older than 40 years on average. Therefore, I select the variable Age for Part II of the project.)
7. Clearly describe your claim in context. Based on your claim, define your variable in context.
8. According to your claim, describe your population in context. Be as specific as possible.
9. Select a random sample of at least 30 observations from your data collection. Post your sample collection as a chart on Etudes. [Your chart should include the following two columns: Random numbers and the variable of interest.]
10. Set up and carry out an appropriate statistical analysis procedure to test the claim of the population parameter you mentioned that you wish to test in 7). Discuss in as much detail as possible, including checking all the required conditions, to carry out the analysis procedure. Interpret the results obtained from the analysis procedure in context. Post StatCrunch statistical analysis results on Etudes.
11. Based on your statistical analysis design, describe Type I error, Type II error, and p-value in context.
Part III: Comparing Two Population Means (Independent Samples)
[Refer to W11-1 & W11-2 discussions if needed.]
From your own data collection (data collected for Week 5 Project), select a quantitative variable on which you wish to compare the population means between two independent groups based on a qualitative variable collected in your data. (For example, from my Facebook data, I wish to compare the mean ages of all my friends on Facebook based on the gender. Therefore, I select the quantitative variable Age as the response variable and the qualitative variable Gender as the explanatory variable for Part III of the project.)
12. Clearly describe the population parameters you wish to compare in context. Be sure that the parameters are from two independent data sets. Based on what you wish to compare, define your variables in context.
273
13. According to the parameters you wish to compare, describe your populations in context. Be as specific as possible.
14. Select two independent random samples of at least 30 observations each from your data collection. Post your sample collections as a chart on Etudes. [Your chart should include the following four columns: Random numbers for Sample 1, variable of interest for Sample 1, random numbers for Sample 2, and variable of interest for Sample 2.]
15. Set up and carry out an appropriate statistical analysis procedure of your choice (constructing a confidence interval or conducting a hypothesis test) to compare the population parameters you mentioned that you wish to compare in 12). Discuss in as much detail as possible, including checking all the required conditions, to carry out the analysis procedure. Interpret the results obtained from the analysis procedure in context. Elaborate your interpretation by reflecting the benefits you get from the results. Post StatCrunch statistical analysis results on Etudes.
16. Explain to us why you chose the statistical analysis method over the other method in 15) to compare the population parameters.
274
References
American Statistical Association. (2005, February). GAISE college report. Retrieved September 8, 2009, from http://www.amstat.org/education/gaise
Arnold, N., & Paulus, T. (2010). Using a social networking site for experiential learning:
Appropriating, lurking, modeling and community building. Internet and Higher Education, 13(4), p. 188-196. doi:10.1016/j.iheduc.2010.04.002
Baglin, J. (2013). Applying a theoretical model for explaining the development of
technological skills in statistics education. Technology Innovations in Statistics Education, 7(2). Retrieved April 5, 2014, from http://escholarship.org/uc/item/8w97p75s
Ben-Zvi, D. (2007, October). Using Wiki to promote collaborative learning in statistics
education. Technology Innovations in Statistics Education, 1(1). Retrieved March 26, 2010, from http://www.escholarship.org/uc/item/6jv107c7
Biehler, R., Ben-Zvi, D., Bakker, A., & Makar, K. (2013). Technology for enhancing
statistical reasoning at the school level. In A. Bishop, K. Clement, C. Keitel, J. Kilpatrick, & A. Y. L. Leung (Eds.), Third International handbook on mathematics education, New York: Springer.
Brown, E. N., & Kass, R. E. (2009). What is statistics? American Statistician, 63(2), 105-
110. doi: 10.1198/tast.2009.0019 Burnard, P. (1996). Teaching the analysis of textual data: An experiential approach.
Nurse Education Today, 16(4), 278-281. Chance, B.L. (2002, November). Components of statistical thinking and implications for
instruction and assessment. Journal of Statistics Education, 10(3). Retrieved March 26 2010, from www.amstat.org/publications/jse/v10n3/chance.html
Chance, B., Ben-Zvi, D., Garfield, J., & Medina, E. (2007, October). The role of
technology in improving student learning of statistics. Technology Innovations in Statistics Education, 1(1). Retrieved March 26, 2010, from http://www.escholarship.org/uc/item/8sd2t4rr
Chick, H., & Pierce, R. (2010). Helping teachers to make effective use of real-world
examples in statistics. In C. Reading (Ed.), Data and context in statistics education: Towards an evidence-based society. Proceedings of the Eighth International Conference on Teaching Statistics (ICOTS8, July, 2010), Ljubljana, Slovenia. Voorburg, The Netherlands: International Statistical Institute. www.stat.auckland.ac.nz/~iase/publications.php
275
Cobb, G. (1992). Teaching Statistics. In L. A. Steen (Ed.), Heeding the Call for Change (MAA Notes No. 22, pp. 3-46). The Mathematical Association of America.
Cobb, P., & McClain, K. (2004). Principles of Instructional Design for Supporting the
Development of Students’ Statistical Reasoning. In D. Ben-Zvi and J. Garfield (Eds.), The Challenge of Developing Statistical Literacy, Reasoning, and Thinking (pp. 375-396). Dordrecht, The Netherlands: Kluwer Academic Publishers.
Collis, B., & Margarkyan, A. (2005). Merrill Plus: Blending corporate strategy and
instructional design. Educational Technology, 45(3), 54-59. Creswell, J. W. (2008). Educational Research: Planning, conducting, and evaluating
quantitative and qualitative research (3rd ed.). Upper Saddle River, NJ: Pearson, Merrill, Prentice Hall.
Dabbagh, N., & Kitsantas, A. (2012). Personal learning environments, social media, and
self-regulated learning: A natural formula for connecting formal and informal learning. Internet and Higher Education, 15(1), 3-8. doi: 10.1016/j.iheduc.2011.06.002
David, I. & Brown, J. (2010). Implementing the change: Teaching statistical thinking not just methods. In C. Reading (Ed.), Data and context in statistics education: Towards an evidence-based society. Proceedings of the Eighth International Conference on Teaching Statistics (ICOTS8, July, 2010), Ljublijana, Slovenia. Voorburg, The Netherlands: International Statistical Institute.
DeAndrea, D. C., Ellison, N. B., LaRose, R., Steinfield, C., & Fiore, A. (2012). Serious
social media: On the use of social media for improving students’ adjustment to college. Internet and Higher Education, 15(1), 15-23. doi: 10.1016/j.iheduc.2011.05.009
De Wever, B., Schellens, T., Valcke, M., & Van Keer, H. (2006). Content analysis
schemes to analyze transcripts of online asynchronous discussion groups: A review. Computers & Education, 46(1), 6-28.
delMas, R.C. (2002, November). Statistical literacy, reasoning, and learning: A
commentary. Journal of Statistics Education, 10(3). Retrieved March 26 2010, from www.amstat.org/publications/jse/v10n3/delmas_discussion.html
delMas, R.C., Garfield, J., Ooms, A., & Chance, B. (2007). Assessing students’
conceptual understanding after a first course in statistics. Statistics Education Research Journal, 6(2), 28-58. Retrieved September 30, 2012 from http://www.stat.auckland.ac.nz/~iase/serj/SERJ6(2)_delMas.pdf
276
DePaolo, C. A., & Robinson, D. F. (2011). Cafe data. Journal of Statistics Education, 19(1). Retrieved January 8, 2011 from www.amstat.org/publications/jse/v19n1/depaolo.pdf
Dhand N. K. & Thomson, P. C. (2009). Scenario-based approach for teaching
biostatistics to veterinary students. Paper presented at the meeting of IASE Satellites on Next Steps in Statistics Education, Durban, South Africa. Retrieved March 11, 2012, from http://www.stat.auckland.ac.nz/~iase/publications/sat09/8_3.pdf
Easterling, R. G. (2010). Passion-driven statistics. The American Statistician, 64(1), 1-5.
doi: 10.1198/tast.2010.09180 Elo, S., & Kyngäs, H. (2007). The qualitative content analysis process. Journal of
Advanced Nursing, 62(1), 107-115. doi: 10.1111/j.1365-2648.2007.04569.x Evans, S.R., Wang, R., Yeh, T., Anderson, J., Haija, R., McBratney-Owen, P.M., et al.
(2007, November). Evaluation of distance learning in an “introduction to biostatistics” class: A case study. Statistics Education Research Journal, 6(2), 59-77. Retrieved March 26, 2010, from http://www.stat.auckland.ac.nz/~iase/serj/SERJ6(2)_Evans.pdf
Finzer, W., Erickson, T., Swenson, K., & Litwin, M. (2007). On getting more and better
data into the classroom. Technology Innovations in Statistics Education, 1(1). Retrieved January 3, 2011, from http://www.escholarship.org/uc/item/09w7699f
Forkosh-Baruch, A., & Hershkovitz, A. (2012). A case study of Israeli higher-education
institutes sharing scholarly information with the community via social networks. Internet and Higher Education, 15(1), 58-68. doi:10.1016/j.iheduc.2011.08.003
Francom, G., Bybee, D., Wolfersberger, M., Merrill, M. D. (2009). Biology 100: A task-
centered, peer-interactive redesign. TechTrends, 53(3), 35-42. Franklin, C., & Garfield, J. B. (2006). The GAISE Project: Developing statistics
education guidelines for pre K-12 and college courses. In G. Burrill (Ed.), Thinking and reasoning with data and chance: 2006 NCTM yearbook (pp. 435-375). Reston, VA: National Council of Teachers of Mathematics.
Frick, T. W., Chadha, R., Watson, C., Wang, Y., & Green P. (2009). College student
perceptions of teaching and learning quality. Educational Technology Research and Development, 57(5), 705-720. doi:10.1007/s11423-007-9079-9
Frick, T. W., Chadha, R., Watson, C. & Zlatkovska, E. (2010). Improving course
evaluations to improve instruction and complex learning in higher education.
277
Educational Technology Research and Development, 58(2): 115-136. doi:10.1007/s11423-009-9131-z
Gal, I., & Ograjensek, I. (2010). Qualitative research in the service of understanding
learners and users of statistics. International Statitical Review, 78(2), 287-296. doi: 10.1111/j.1751-5823.2010.00104x
Gardner, J., & Jeon, T. (2009). Creative task-centered instruction for web-based
instruction: Obstacles and solutions. Journal of Educational Technology Systems, 38(1), 21-34. doi.10.2190/ET.38.1.c
Garfield, J. (2002, November). The challenge of developing statistical reasoning. Journal
of Statistics Education, 10(3). Retrieved March 26 2010, from www.amstat.org/publications/jse/v10n3/garfield.html
Garfield, J., & Ben-Zvi, D. (2007). How students learn statistics revisited: A current
review of research on teaching and learning statistics. International Statistical Review, 75(3), 372-396.
Garfield, J., & Ben-Zvi, D. (2008). Developing Students’ Statistical Reasoning:
Connecting Research and Teaching Practice. Dordrecht: Springer. Garfield, J., & Ben-Zvi, D. (2009). Helping students develop statistical reasoning:
Implementing a statistical reasoning learning environment. Teaching Statistics, 31(3), 72 -77.
Garfield, J.B. & Gal, I. (1999). Teaching and assessing statistical reasoning. In L. Stiff
(Ed.), Developing mathematical reasoning in grades K-12: 1999 NCTM yearbook (pp. 207-219). Reston, VA: National Council Teachers of Mathematics.
Garfield, J.B., Hogg, B., Schau, C., & Whittinghill, D. (2002). First courses in statistical
science: The status of educational reform efforts. Journal of Statistics Education, 10 (2).
Gerbic, P., & Stacey, E. (2005). A purposive approach to content analysis: Designing
analytical frameworks. Internet and Higher Education, 8(1), 45-59. doi: 10.1016/j.iheduc.2004.12.003
Gordon, I, & Finch, S. (2010). How we can all learn to think critically about data. In C.
reading (Ed.), Data and context in statistics education: Towards an evidence-based society. Proceedings of the Eighth International Conference on Teaching Statistics (ICOTS8, July, 2010), Ljublijana, Slovenia. Voorburg, The Netherlands: International Statistical Institute. www.stat.auckland.ac.nz/~iase/publications.php
278
Gould, R. (2010). Statistics and modern student. Internal Statistical Review, 78(2), 297-315. doi:10.1111/j.1751-5823.2010.00117.x
Gould, R. & Ryan, C. (2013). Introductory Statistics: Exploring the World through Data.
Boston, MA: Pearson. Graneheim, U. H., & Lundman, B. (2004). Qualitative content analysis in nursing
research: Concepts, procedures and measures to achieve trustworthiness. Nurse Education Today, 24(2), 105-112.
Greenhow, C. & Robelia, B. (2009). Informal learning and identity formation in online
social networks. Learning, Media and Technology, 34(2), 119-140. Groth, R. E. (2010). Interactions among knowledge, beliefs, and goals in framing a
qualitative study in statistics education. Journal of Statistics Education, 18(1). Retrieved April 25, 2010, from www.amstat.org/publications/jse/v18n1/groth.pdf
Harwood, T.G., & Garry, T. (2003). An overview of content analysis. The Marketing
Review, 3(4), 479-498. Hiedemann, B. & Jones, S. M. (2010). Learning statistics at the farmers’ market? A
comparison of academic service learning and case studies in an introductory statistics course. Journal of Statistics Education, 18(3). Retrieved January 8, 2011 from www.amstat.org/publications/jse/v18n3/hiedemann.pdf
Hoerl, R. W., & Snee, R. D. (2010). Moving the statistics profession forward to the next
level. The American Statistician, 64(1), 10-13. doi: 10.1198/tast.2010.09240 Hogg, R. V. (1992). Towards lean and lively courses in statistics. In F. Gordon & S.
Gordon (Eds.), Statistics for the Twenty-First Century (MAA Notes, No. 26, pp. 3-13). The Mathematical Association of America.
Junco, R. (2012). The relationship between frequency of Facebook use, participation in
Facebook activities, and student engagement. Computers & Education, 58(1), 162-171. doi:10.1016/j.compedu.2011.08.004
Kaplan, J. J. (2011). Innovative activities: How clickers can facilitate the use of
simulations in large lecture classes. Technology Innovations in Statistics Education, 5(1). Retrieved December 22, 2011, from http://www.escholarship.org/uc/item/1jg0274b
Lee, C. (2010). Some issues of data production in teaching statistics. In C. Reading (Ed.),
Data and context in statistics education: Towards an evidence-based society. Proceedings of the Eighth International Conference on Teaching Statistics
279
(ICOTS8, July, 2010), Ljubljana, Slovenia. Voorburg, The Netherlands: International Statistical Institute.
Lesser, L. M., & Kephart, K. (2011). Setting the tone: A discursive case study of
problem-based inquiry learning to start a graduate statistics course for in-service teachers. Journal of Statistics Education, 19(3). Retrieved January 23, 2012, from http://www.amstat.org/publications/jse/v19n3/lesser.pdf
Libman, Z. (2010). Integrating real-life data analysis in teaching descriptive statistics: A
constructivist approach. Journal of Statistics Education, 18(1). Retrieved April 25, 2010, from www.amstat.org/publications/jse/v18n1/libman.pdf
Lovett, M. C., & Greenshouse, J. B. (2000). Applying cognitive theory to statistics
instruction. The American Statistician, 54(3), 196-206 Madge, C., Meek, J., Wellens, J., Hooley, T. (2009). Facebook, social integration and
informal learning at university: ‘It is more for socialising and talking to friends about work than for actually doing work’. Learning, Media and Technology, 34(2), 141-155. doi: 10.1080/17439880902923606
Marriott, J. & Davies, N. (2009). Helping undergraduates to contribute to an eidence
based world. Paper presented at the meeting of IASE Satellites on Next Steps in Statistics Education, Durban, South Africa. Retrieved March 11, 2012, from http://www.stat.auckland.ac.nz/~iase/publications/sat09/3_4.pdf
McGowan, H. M., & Gunderson, B. K. (2010). A randomized experiment exploring how
certain features of clicker use effect undergraduate students' engagement and learning in statistics. Technology Innovations in Statistics Education, 4(1). Retrieved December 22, 2011, from http://www.escholarship.org/uc/item/2503w2np
McLoughlin, C., & Lee, M. J. W. (2007). Social software and participatory learning:
Pedagogical choices with technology affordances in the Web 2.0 era. In ICT: Providing choices for learners and learning. Proceedings ascilite Singapore 2007. http://www.ascilite.org.au/conferences/singapore07/procs/mcloughlin.pdf
Meier, A., McCaa, R, & Lam, D. (2010). Creating statistically literate global citizens:
The use of integrated census microdata in teaching. In C. Reading (Ed.), Data and context in statistics education: Towards an evidence-based society. Proceedings of the Eighth International Conference on Teaching Statistics (ICOTS8, July, 2010), Ljubljana, Slovenia. Voorburg, The Netherlands: International Statistical Institute.
Mendenhall, A., Wu Buhanan, C., Suhaka, M., Mills, G., Gibson, G.V., & Merrill, M.D.
(2006). A task-centered approach to entrepreneurship. TechTrends, 50(4), 84-89.
280
Meng, X. (2009). Desired and feared – What do we do now and over the next 50 years? The American Statistician, 63(3), 202 – 210. doi: 10.1198/tast.2009.06045
Merrill, M. D. (2002). First principles of instruction. Educational Technology, Research
and Development, 50(3), 43-59. Merrill, M. D. (2007). A task-centered instructional strategy. Journal of Research on
Technology in Education, 40(1), 5-22. Merrill, M. D. (2008).Why basic principles of instruction must be present in the learning
landscape, whatever form it takes, for learning to be effective, efficient and engaging. In J. Visser & M. Visser-Valfrey (Eds.), Learners in a changing learning landscape: Reflections from a dialogue on new roles and expectations (pp. 267-275). London: Springer.
Merrill, M. D. (2009). First principles of instruction. In C. M. Reigeluth and A. A. Carr-
Chellman, (Eds.), Instructional-design Theories and Models: Vol. 3. Building a Common Knowledge Base (pp. 41 – 56). New York, NY: Routledge.
Merrill, M. D., & Gilbert, C. G. (2008). Effective peer interaction in a problem-centered
instructional strategy. Distance Education, 29(2), 199-206. doi:10.1080/01587910802154996
Mills, J.D. (2005). Learning abstract statistics concepts using simulation. Educational
Research Quarterly, 28(4), 18-33. Moore, D. S. (1997). New pedagogy and new content: The case of statistics.
International Statistical Review, 65, 123-137. Moore, D. S., Notz, W. I., & Fligner, M. A. (2013). The Basic Practice of Statistics (6th
ed.). New York: W. H. Freeman and Company. Neumann, D. L., Neumann, M. M., & Hood, M. (2010). The development and evaluation
of a survey that makes use of student data to teach statistics. Journal of Statistics Education, 18(1). Retrieved April 25, 2010, from www.amstat.org/publications/jse/v18n1/neumann.pdf
Nolan, D., & Temple Lang, D. (2009). Comment to “What is statistics?” American
Statistician, 63(2), 117-121. doi: 10.1198/tas.2009.0024 Nowacki, A. S. (2011). Using the 4MAT framework to design a problem-based lerning
biostatistics course. Journal of Statistics Education, 19(3). Retrieved March 11, 2012, from HYPERLINK http://www.amstat.org/publications/jse/v19n3/nowacki.pdf
281
Oncu, S., & Cakir, H. (2011). Research in online learning environments: Priorities and methodologies. Computers & Education, 57(1), 1098-1108. doi:10.1016/j.compedu.2010.12.009
Reigeluth, C. M., & Frick, T. W. (1999). Formative research: A methodology for creating
and improving design theories. In C. M. Reigeluth, (Ed.), Instructional-design theories and models: Vol. 2. A new paradigm of instructional theory (pp. 633-652). Mahwah, NJ: Erlbaum.
Richey, R. C., & Klein, J. D., (2009). Design and Development Research. New York,
NY: Routledge. Ridgway, J., & Nicholson, J. (2010). Pupils reasoning with information and
misinformation. In C. Reading (Ed.), Data and context in statistics education: Towards an evidence-based society. Proceedings of the Eighth International Conference on Teaching Statistics (ICOTS8, July, 2010), Ljubljana, Slovenia. Voorburg, The Netherlands: International Statistical Institute.
Roblyer, M. D., McDaniel, M., Webb, M., Herman, J., & Witty, J. V. (2010). Findings on
Facebook in higher education: A comparison of college faculty and student uses and perceptions of social networking sites. Internet and Higher Education, 13(2), 134-140. doi:10.1016/j.iheduc.2010.03.002
Rogal, S.M.M., & Snider, P.D. (2008). Rethinking the lecture: The application of
problem based learning methods to atypical contexts. Nurse Education in Practice, 8(3), 213-219. doi:10.1016/j.nepr.2007.09.001
Roseth, C. J., Garfield, J. B., & Ben-Zvi, D. (2008, March). Collaboration in learning and
teaching statistics. Journal of Statistics Education, 16 (1). Retrieved March 16, 2010, from www.amstat.org/publications/jse/v16n1/roseth.html
Rumsey, D.J. (2002, November). Statistical literacy as a goal for introductory statistics
courses. Journal of Statistics Education, 10(3). Retrieved March 26, 2010, from www.amstat.org/publications/jse/v10n3/rumsey2.html
Savery, J. R. (2009). Problem-based approach to instruction. In C. M. Reigeluth and A.
A. Carr-Chellman, (Eds.), Instructional-design Theories and Models: Vol. 3. Building a Common Knowledge Base (pp. 143 – 166). New York, NY: Routledge
Selwyn, N. (2009). Faceworking: Exploring students’ education-related use of Facebook.
Learning, Media and Technology, 34(2), 157-174. doi:10.1080/17439880902923622
282
Shaltayev, D. S., Hodges, H., & Hasbrouck, R. B. (2010). VISA: Reducing technological impact on student learning in an introductory statistics course. Technology Innovations in Statistics Education, 4(1). Retrieved December 22, 2011, from http://www.escholarship.org/uc/item/1gh2x5v5
Sisto, M. (2009, July). Can you explain that in plain English? Making statistics group
projects work in a multicultural setting. Journal of Statistics Education, 17(2). Retrieved March 26, 2010, from www.amstat.org/publications/jse/v17n2/sisto.html
Soler, F. P. (2010). Who is teaching introductory statistics? The American Statistician,
64(1), 19-20. doi: 10.1198/tast.2010.09183 Sullivan, M. (2010). Statistics -- Informed Decisions Using Data (3rd ed.). Upper Saddle
River, NJ: Pearson. Tan, C.K. (2012). Effects of the application of graphing calculator on students’
probability achievement. Computers & Education, 58(4), 1117-1126. doi:10.1016/j.compedu.2011.11.023
Tellis, W. (1997, July). Introduction to case study. The Qualitative Report, 3(2).
Retrieved September 29, 2011, from http://www.nova.edu/ssss/QR/QR3-2/tellis1.html
Trumpower, D. (2010). Mad libs statistics: A ‘Happy’ activity. Teaching Statistics, 32(1),
17 – 20. Vittrup, A.C., & Davey, A. (2010). Problem based learning – ‘Bringing everything
together’ – A strategy for graduate nurse programs. Nurse Education in Practice, 10(10), 88-95. doi:10.1016/j.nepr.2009.03.019
West, W. (2009). Social data analysis with StatCrunch: Potential benefits to statistical
education. Technology Innovations in Statistics Education, 3(1). Retrieved January 3, 2011, from http://escholarship.org/uc/item/67j8j18s
Wodzicki, K., Schwammlein, E., & Moskaliuk, J. (2012). “Actually, I wanted to learn”:
Study-related knowledge exchange on social networking sites. Internet and Higher Education, 15(1), 9-14
Yin, R. K. (2009). Case study research: Design and methods (4th ed.). Thousand Oaks,
CA: Sage. Yin, R. K. (2012). Applications of case study research (3rd ed.). Thousand Oaks, CA:
Sage.

283
Related Documents