1 Designing Effective Visualizations for Elementary School Science Yael Kali Technion – Israel Institute of Technology Haifa, 32000 [email protected] Marcia C. Linn University of California, Berkeley 4611 Tolman Hall, mc1670 Berkeley, CA 94720 [email protected] To appear in the Elementary School Journal, special issue edited by David Fortus.

Welcome message from author
This document is posted to help you gain knowledge. Please leave a comment to let me know what you think about it! Share it to your friends and learn new things together.
Transcript

1
Designing Effective Visualizations for Elementary School Science
Yael Kali Technion – Israel Institute of Technology
Haifa, 32000 [email protected]
Marcia C. Linn University of California, Berkeley
4611 Tolman Hall, mc1670 Berkeley, CA 94720
To appear in the Elementary School Journal, special issue edited by David Fortus.
2
Abstract
Research has shown that technology-enhanced visualizations can improve inquiry
learning in science when they are designed to support knowledge integration.
Visualizations play an especially important role in supporting science learning at
elementary and middle school levels because they can make unseen and complex
processes visible. We identify four principles that can help designers and teachers
incorporate visualizations into curriculum materials. These principles call for : (a)
reducing visual complexity to help learners recognize salient information, (b) scaffolding
the process of generating explanations, (c) supporting student-initiated modeling of
complex science, and (d) using multiple linked representations. We describe the
principles, discuss patterns combining the principles, and give examples from several
science disciplines.
3
Research shows that technology-enhanced visualizations have the potential to advance
learning in science disciplines such as physics (e.g., White & Frederiksen, 1998),
chemistry (e.g., Dori, Sasson, Kaberman, & Herscovitz, 2004), earth science (e.g.,
Edelson, Gordin, & Pea, 1999; Kolodner et al., 2003), or biology (e.g., Reiser et al.,
2001). However, too often, visualizations fail to realize this potential (e.g. Morrison,
Tversky, & Bétrancourt, 2002). Elementary textbooks often discourage interest in science
or provide experiments that lack coherence (American Association for the Advancement
of Science, 2002). To improve elementary science education curriculum developers need
to integrate new opportunities for student learning such as visualizations and encourage
coherent understanding to lay the groundwork for future learning (Roseman & Linn, in
press). Helping students visualize basic scientific processes such as food webs, electrical
circuits, or the rock cycle has great promise for elementary courses and takes advantage
of modern technologies.
This article synthesizes research showing how visualizations of scientific
phenomena can lead to integrated understanding. We define visualizations as any
interactive representation or animation of a scientific process that permits students some
form of manipulation. Examples include opportunities for students to combine virtual
batteries and bulbs and to determine what closes the circuit as well as student-controlled
animations of heat flow where students select the material and observe the rate of heat
propagation.
We show the benefit of synthesizing design knowledge, in the form of design
features, design patterns, and design principles, so that curriculum designers can use this
knowledge to develop effective visualizations. This research-synthesis method captures a
4
growing body of knowledge in this field (Kali, 2006; Kali & Linn, in press; Linn &
Eylon, 2006). We discuss how this knowledge can guide designers and how designers can
contribute their experiences to a publicly accessible database of design principles.
Design knowledge is also important to teachers, who play a crucial role in the
success of visualizations. Teachers can benefit from guidance about how to use
visualizations effectively. Design principles can make the rationale that stands behind the
design of visualizations visible to teachers, helping them think about ways to support
learners and adapt visualizations to meet their classes’ needs (Davis & Varma, in press).
We start by describing our view of learning in science as a process of knowledge
integration (Bransford, Brown, & Cocking, 1999, Linn, 1995; Linn, Davis, & Bell, 2004;
Linn & Hsi, 2000). We use this lens to describe the learning enhanced by various types of
visualizations. We show how productive visualizations play the role of ―pivotal cases‖
(Linn, 2005) to promote understanding, and how design knowledge is gathered in the
Design Principles Database (Kali, 2006) and becomes useful for designers.
To illustrate our viewpoint, we describe four design principles that can guide
designers of technology-enhanced curriculum as well as teachers in generating and using
visualizations effectively. We describe features of successful technologies that employ
each of these design principles and report research showing that these features have
helped elementary and middle school students establish a firm foundation for future
science learning. We discuss the importance of embedding visualizations in a full
curriculum to promote coherent understanding by describing work on effective design
patterns.

5
Learning as Knowledge Integration
Science learning involves comparing, contrasting, and integrating disparate ideas
(Bransford et al., 1999; Linn, 1995; Linn et al, 2004; Linn & Hsi, 2000). Learners
spontaneously develop a repertoire of varied, often contradictory scientific ideas about
any topic as they interact with the natural world (Linn, 1995). Students come to science
class with this repertoire of multiple normative and non-normative ideas that have
emerged from their experiences. In thermodynamics, for example, students may hold a
large group of ideas simultaneously. They may conclude that heat and temperature are the
same because the terms can be used interchangeably: "Turn up the heat," or "Turn up the
temperature." Students may rely on tactile information to decide that objects in the same
room have different temperatures, concluding that metals are colder than wood at room
temperature. They may assert that metal has the ability to impart cold and recommend
that people wrap picnic food in aluminum foil to prevent the growth of harmful bacteria.
They may decide that some materials form barriers and prevent heat flow. At the same
time, they may hold normative ideas and argue that heat flows quickly through metal
because using a metal spoon to stir pasta on the stove can burn one’s hand. Knowledge
integration is the process of coalescing, critiquing, augmenting, and organizing this
repertoire of ideas.
To help students integrate their repertoire of ideas, successful science
instruction should: (a) add powerful, durable, and generative examples to their repertoire
of ideas; and (b) enable students to grapple with their full repertoire of ideas to form a
more coherent perspective on the scientific domain. Technology-enhanced materials that
make scientific thinking visible can play an important role in both processes.
6
Visualizations as Pivotal Cases
Technology-enhanced inquiry curricula can take advantage of powerful visualizations to
make scientific thinking visible and improve learning outcomes (Linn, Lee, Tinker,
Husic, & Chiu, 2006). Technology features that contribute to knowledge integration have
been organized around four metaprinciples in the knowledge integration framework (Linn
et al., 2004; Linn & Hsi, 2000). These are: (a) help make thinking visible, (b) help make
the science accessible to students, (c) help learners learn from each other, and (d)
promote autonomous lifelong learning (Kali & Linn, in press).
In this article we focus on the make thinking visible metaprinciple. Scientific
animations and visualizations can make unseen and dynamic processes such as the
day/night cycle or plate tectonics visible. Students make their thinking visible, inspect
their own knowledge-integration processes, and deliberately guide their learning
(Bransford et al., 1999; Collins, Brown, & Holum, 1991; Linn, 1995). Designers have
created and explored visualization tools that students can use to map their ideas and
externalize their thoughts. Designers can also embed visualizations in inquiry
environments to make complex concepts and scientific phenomena visible and
understandable by young students.
Research has begun to capture the nature of visualizations that help students
compare and sort out their own ideas. The knowledge integration framework refers to
successful, new additions to a student repertoire of ideas as pivotal cases (Linn, 2005).
Pivotal cases are defined as examples that (a) make a compelling, scientifically valid
comparison between two situations, (b) draw on accessible, culturally relevant contexts,
such as everyday experiences, (c) provide feedback that supports students’ efforts to
7
develop criteria and monitor their progress, and (d) encourage students to create narrative
accounts of their ideas using precise vocabulary so they can discuss them with others
(Linn, 2005). In this article we discuss how visualizations can serve as pivotal cases.
Other research programs have identified knowledge elements that are similar to pivotal
cases. They call these benchmark lessons (diSessa & Minstrell, 1998), bridging analogies
(Clement, 1993), didactic objects (Thompson, 2002), and prototypes (Songer & Linn,
1992). Adding the right ideas to the mix students hold has the potential of dramatically
increasing the efficiency and effectiveness of instruction and visualizations offer a
promising opportunity (Linn et al., 2006).
Not all visualizations serve as pivotal cases. Indeed, some visualizations can
confuse students rather than assist them. Morrison et al. (2002) studied the use of
animations and found that many of them do not improve learning, in part because they
overload learners rather than help them sort out their ideas.
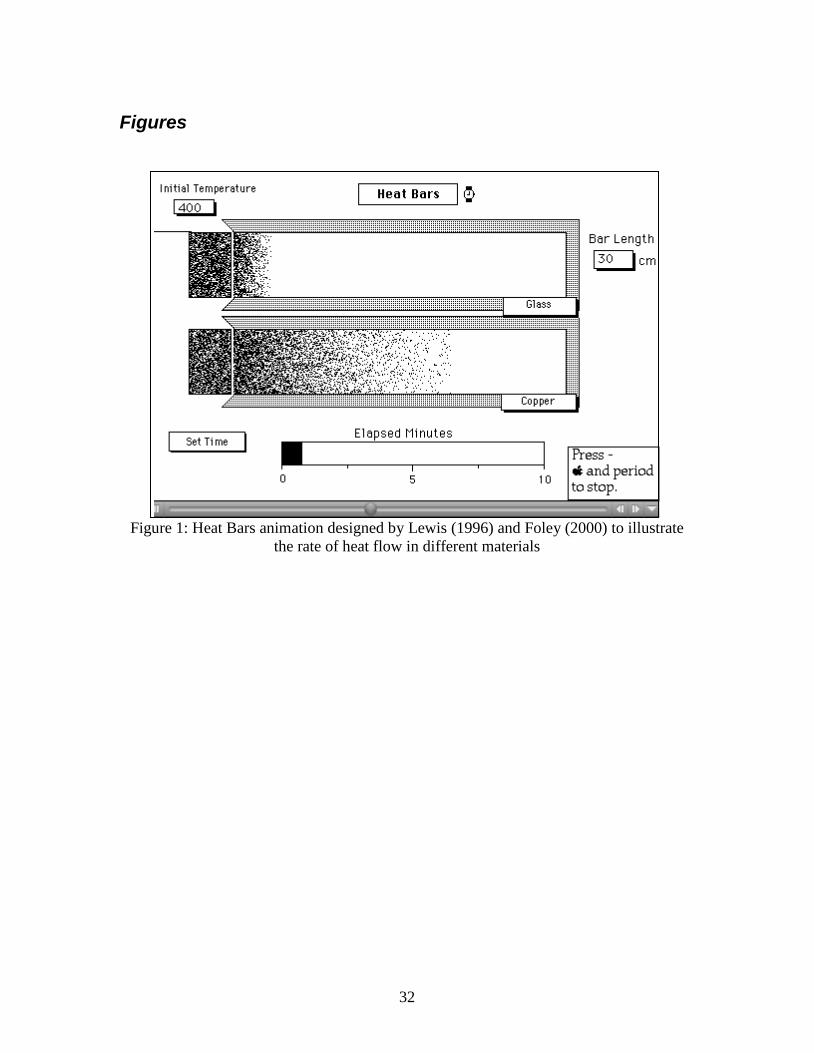
To illustrate the value of visualizations as pivotal cases, we describe how an
animation called heat bars helped students understand insulation and conduction (Foley,
2000; Lewis, 1996; Linn & Hsi, 2000). Heat bars allows learners to select among varied
materials of interest to them and to explore the rate of heat flow. Responding to research
on student ideas, heat bars shows the variation in rate of heat flow, helping students
distinguish among materials and providing feedback that helps clarify ideas about
materials as barriers, or views that heat flows at a constant rate in all materials (Fig. 1).
Heat bars meets all the criteria for a pivotal case (Linn, 2005).
------------------------
Figure1 about here
-------------------------
8
To test the effectiveness of heat bars, Lewis (1996) studied six classes learning
thermodynamics in a single school; half used the heat bars simulation for about 30
minutes, and half used real-time data collection. All classes were taught by the same
teacher. Lewis compared pre and posttest performance and found an effect for heat bars,
especially on questions about heat flow. On the delayed posttest administered 6 weeks
later, students in the heat bars condition outperformed the comparison group.
To illustrate the importance of design decisions, we report on efforts to improve
heat bars. Foley (2000) wondered whether the pivotal case would be more successful if it
showed heat flow in color rather than black and white. He devised several versions, one
using the colors commonly found in a weather map and another using red for hot and
blue for cold. He found that adding color reduced the effect of heat bars by confusing
students. The colors distracted students, making them think that heat could change color
rather than just flow from warmer to colder regions. Designers of climate software report
similar problems in helping learners interpret weather maps (Songer, 1996). These
examples illustrate how difficult it is to design effective visualizations and show the
advantage of iterative refinement. The color version did not meet the criteria of a pivotal
case because it was not accessible to learners.
Design Knowledge and the Design Principles Database
The example above illustrates the importance of understanding why visualizations
succeed or fail to promote learning. Such understanding is an example of a type of
knowledge referred to as design knowledge - knowledge about successes and failures of
using any curricular innovation in real classroom settings (Barab & Squire, 2004; Bell,
Hoadley & Linn, 2004; Collins, Joseph, & Bielaczyc, 2004; Design Based Research
9
Collective, 2003). Several frameworks were developed to synthesize design knowledge
and present it in formats that allow curriculum and technology designers to build on and
further develop this knowledge (e.g., Merrill, 2002; Mor & Winters, 2007; Quintana et
al., 2004; Reigeluth, 1999, van den Akker, 1999). In this article we build on the
knowledge-integration framework, which captures design knowledge from 20 years of
research (Linn et al., 2004; Linn & Hsi, 2000). The design knowledge in this framework
is represented by the four metaprinciples mentioned above (make thinking visible, make
science accessible, help learners learn form each other, and promote autonomous lifelong
learning), and 14 principles that are more narrowly focused and thus more pragmatic
(called pragmatic principles), that describe and illustrate how to use the metaprinciples.
To make the knowledge-integration framework more accessible and useful for
designers, a Design Principles Database (http://www.design-principles.org) was
developed (Kali, 2006, in press; Kali & Linn, in press). It contains a set of features, which
are examples from diverse classroom-tested science curriculum materials, connected to
the pragmatic and metaprinciples described above. Recent research has shown that the
database can (a) promote collaborative knowledge building for communities who design
and explore educational technologies (Kali, 2006), and (b) assist novice designers in
creating effective technology-based curriculum units (Kali & Ronen-Fuhrmann, 2007). In
this article we highlight the make thinking visible metaprinciple.
Make Thinking Visible
We elaborate the make thinking visible metaprinciple by discussing four
pragmatic design principles connected to this metaprinciple and by describing features
from successful visualizations that employ these principles. All features are embedded in

10
inquiry activity sequences in technology-based learning environments of various science
disciplines.
Pragmatic Principle 1: Reduce Visual Complexity to Help Learners
Recognize Salient Information
This principle calls for reducing the complexity of any type of visualization by
eliminating functionality and details that distract from the main concept. Earlier in this
article we showed how addition of colors to the successful heat bars animation reduced
the effect of the animation (Foley, 2000). Many animations do not improve learning
because they overload learners rather than pinpointing salient information (Morrison et
al., 2002). In the case of heat bars, the new information interfered with student
interpretation of feedback from the visualization.
When designing a visualization, designers need to carefully consider the sort of
feedback students need. To succeed, designers need to analyze both the student repertoire
of ideas and the nature of the visualization. Of course, visualizations can also
oversimplify and interfere with learning. To serve as pivotal cases (Linn, 2005),
visualizations need an optimal level of complexity appropriate for the specific learning
goal and target audience. Finding the right balance requires characterization of the
repertoire of ideas the target audience holds. In most cases, finding the right level of
complexity requires several design and enactment iterations.
We illustrate how the complexity principle works in visualizations from two
technology-based learning environments: BioKids (Gotwals & Songer, 2006), an
elementary school ecology curriculum, and Virtual Solar System (Yair, Mintz, & Litvak,
2001), a middle school earth science curriculum.
11
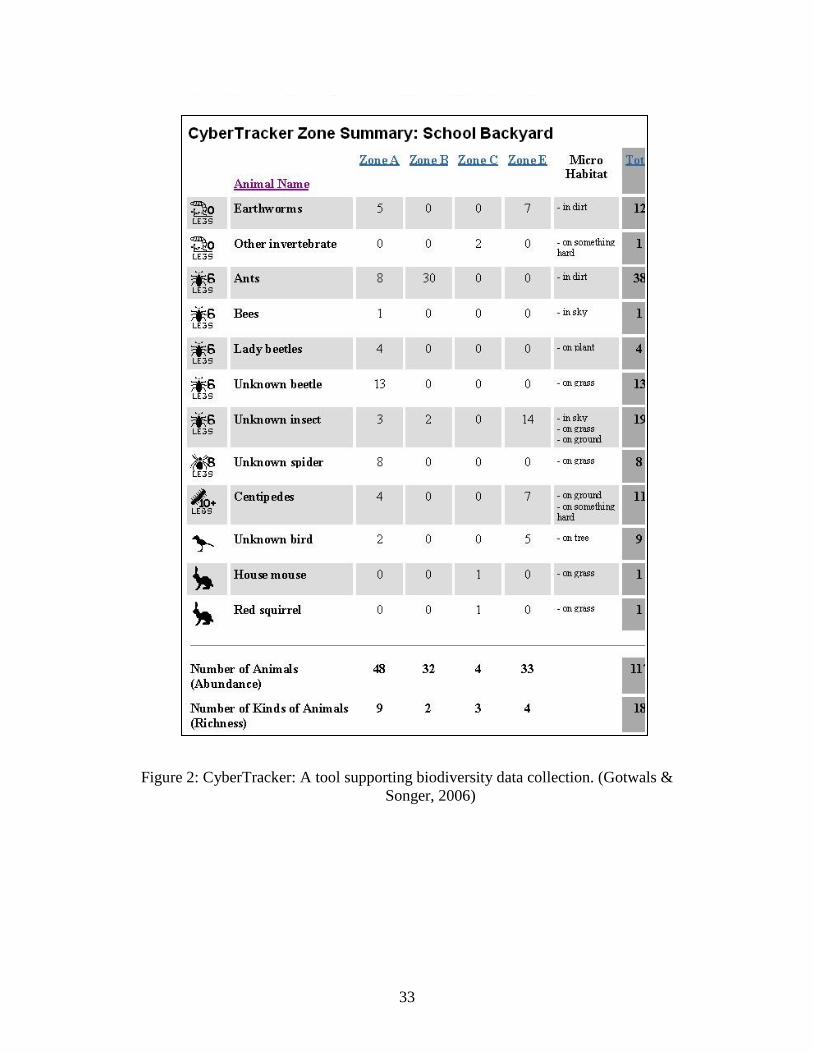
CyberTracker: A tool supporting biodiversity data collection in BioKids. In
this curriculum, students study biodiversity in their own schoolyard. Designed for fifth-
grade students in urban Detroit, CyberTracker responds to the difficulties students have in
identifying the salient features of their own empirical data. Students input various kinds
of animal data into CyberTracker based on observations in their schoolyard. By providing
simple icons, which point to the type of data students are required to focus on, this feature
streamlines their ability to locate and analyze relevant data. To support students’
exploration of the inquiry-fostering question, Which zone in my schoolyard has the
highest biodiversity?, CyberTracker provides students with a set of common
organizational visual elements representing factors such as animal abundance and animal
richness (Fig. 2). This common presentation format reduces complexity and allows
students to easily locate and analyze data relevant to the evaluation of the biodiversity in
their schoolyard. By enabling students to compare data in a culturally relevant context,
this visualization serves as a pivotal case. The use of CyberTracker helps upper-
elementary students develop important scientific practices such as collecting and
organizing their own data. This tool is especially effective when it is embedded in a series
of activities that follow a pattern of making predictions, gathering data, interpreting
results, and reconciling outcomes with predictions.
------------------------
Figure2 about here
-------------------------
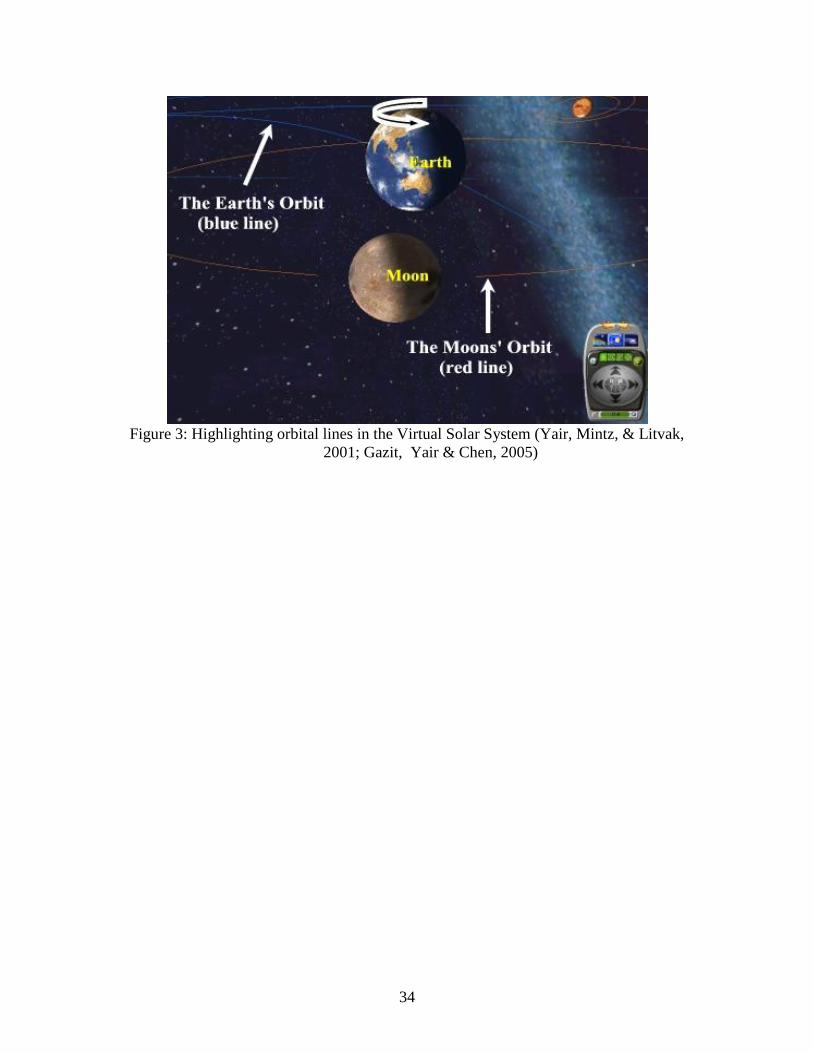
Highlighting orbital lines in the Virtual Solar System. Another feature that
illustrates the complexity principle is employed in the Virtual Solar System - a 3D virtual
reality environment for exploring the solar system (Yair et al., 2001). Using the mouse of
12
the computer, learners can ―fly‖ in the solar system to explore astronomic phenomena.
The environment supports four modes of observation, which enable learners to change
their point of view, zoom in or out, and fly around celestial objects in any direction.
Navigation in this environment requires learners to make sense of the dynamic spatial
information which they observe. Research that explored middle school students’ use of
this environment by showed that they often lose a sense of orientation and find it difficult
to navigate (Gazit & Chen, 2003; Gazit, Yair & Chen, 2005; Yair et al., 2001). To
facilitate this task, especially for young learners, features were added to the environment
that enable students to view entities of the solar system, such as orbital lines that show the
course of celestial objects (e.g., the course of the moon around the earth, or the course of
the earth around the sun); (Fig. 3). Although this graphic tool reduces the authenticity of
the virtual environment to some extent, it has a significant advantage in helping learners
overcome the loss of orientation and contributes to their understanding of the solar
system (Gazit & Chen, 2003; Gazit et al., 2005). In this case, complexity stemmed from
the spatial nature of the contents, which made it difficult for students to understand where
they were ―located‖ in the solar system. Adding the orbital lines provided cues for
visualizing the system and reduced the complex task of spatial orientation within the solar
system, which is the basic requirement for making valid comparisons among the planets.
In this sense these cues make the visualization serve as a pivotal case.
------------------------
Figure3 about here
-------------------------
13
Pragmatic Principle 2: Scaffold the Process of Generating Explanations
Generating explanations, raising conjectures, and asking questions are the essence of
science. Yet, in science classes, the main communication of scientific ideas often comes
from the text and the main rhetorical task involves clarification (Linn et al., 2004).
Scaffolds can enrich the explanations learners consider and help groups of learners
develop some shared criteria and standards for their explanations (McNeill, Lizotte,
Krajcik, & Marx, 2006). This principle is illustrated with two features: one that elicits
learners’ explanations and another than introduces a wide array of views held by learners
into a discussion.
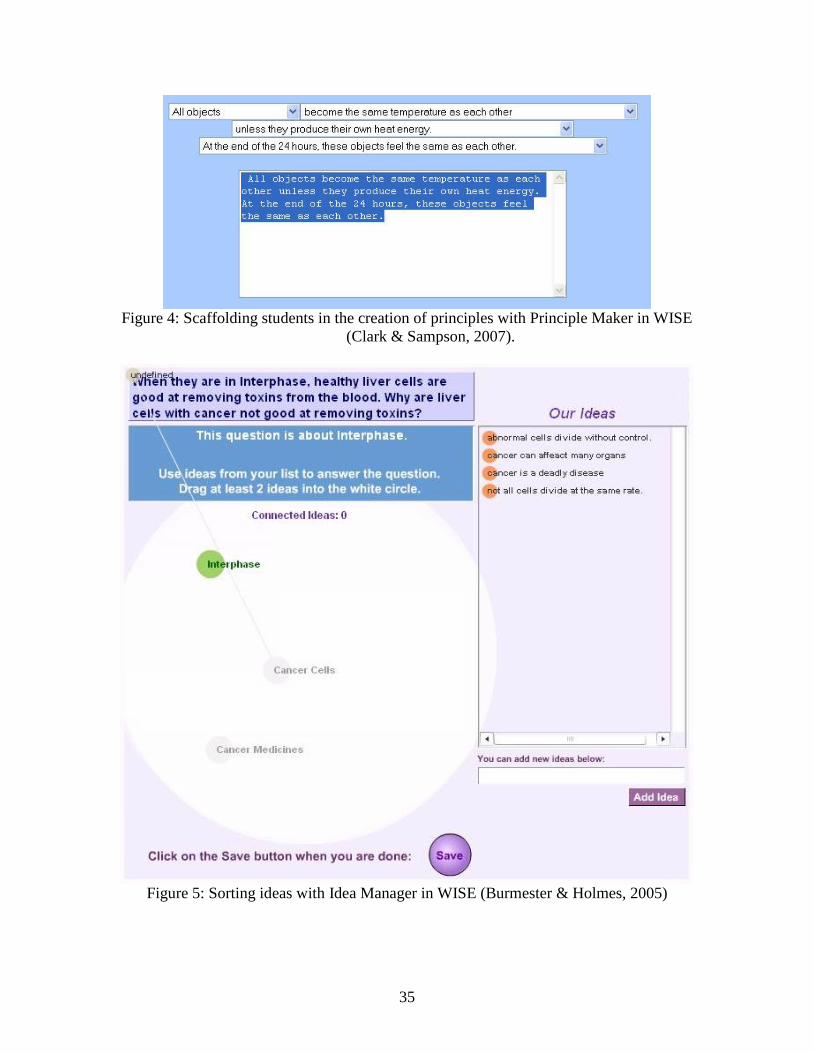
Generating explanations with Principle Maker in WISE. To scaffold
generation of explanations, the Principle Maker (Clark & Sampson, 2007) helps students
synthesize data they have collected or experienced into a principle. It was developed as
part of the ―Thermodynamics: Probing Your Surrounding‖ WISE project for 11-to 14-
year-old students (Clark & Sampson, 2007). The project uses the heat bars animation as
well to introduce thermal equilibrium.
Using the Principle Maker, students create general principles that summarize their
understanding of data collection and simulations from previous stages in the project.
Students use a series of pull-down menus to construct a principle. Each menu gives a list
of possible phrases from which to choose (Fig. 4). These predefined phrases represent
components of principles students typically use to describe heat flow and thermal
equilibrium, based on prior research.
Clark and Sampson (2007) found that scaffolding students in the creation of
principles helps make student ideas explicit. Clark and Sampson take advantage of the
14
principles students build to set up discussions that include groups with opposing ideas.
They argue that this process promotes dialogical argumentation–the process of
responding to ideas of others with evidence-based comments. By making student thinking
visible, the Principle Maker compels students to make precise statements and enables
others to formulate equally detailed reactions. Such discussions are rare in typical science
classrooms. As a result, students have a good sense of the views of their peers and can
spend their time supporting, evaluating, and critiquing ideas. The use of the Principle
Maker encourages students to create narrative accounts of their ideas using precise
vocabulary. It helps them appreciate the value of compelling explanations and gain
experience responding to critiques of their ideas. In this manner it serves as a pivotal
case. The Principle Maker enables learners to take advantage of the feedback from their
peers because it is embedded in a WISE activity that guides student interactions
following a promising pattern for collaboration. This form of argumentation prepares
students for more advanced science courses (Linn et al., 2004).
------------------------
Figure 4 about here
-------------------------
Sorting ideas with Idea Manager in WISE. The Idea Manager is another WISE
feature designed to guide students in making scientific explanations (Burmester &
Holmes, 2005). Idea Manager is used in the Mitosis & Cell Processes module. Idea
Manager has two elements. Your Ideas is an editing tool that enables students to keep
track of their ideas. Users record their ideas about various issues in mitosis as they
complete the activities. Ideas must be concise enough to fit on one line but students can
add as many ideas as they like. The second element, Connect Ideas is a drag and drop
workspace used to answer questions in a visually representative way. Students are asked

15
to explain their answers using ideas from their list. A student can drag and drop an idea
from the ideas list onto an idea workspace, producing a map of connected ideas. These
ideas, now connected to different concepts, are saved as the project continues, so that by
the end of the project, students have a map representing their ideas. The map of
interconnected ideas makes student thinking visible and enables class members to learn
how others have connected ideas. It also serves as a pivotal case because it enables them
to compare situations, monitor their progress, and describe, discuss, and critique their
own ideas with peers and the teacher (Fig. 5). Recording ideas during a learning process,
and then using these records to explain a phenomena, is an important metacognitive skill
that young learners can practice using this tool and employ in future science courses. The
Idea Manager includes not only the visual representation of ideas but also a sequence of
activities that jointly help learners use the map to integrate their ideas around complex
questions.
------------------------
Figure 5 about here
-------------------------
Pragmatic Principle 3: Support Student-Initiated Modeling of Complex
Science
When students can create their own models of a phenomenon, they make
decisions about how different elements of the phenomenon relate to each other. In this
process they reexamine their repertoire of ideas. A major component of doing science is
building computer-based models. Powerful modeling programs for students give learners
the opportunity to practice building models. Researchers are beginning to create such
opportunities for elementary and middle school students using tools such as NetLogo
16
(Colella, Klopfer, & Resnick 2001) and Boxer (diSessa, 2000). We highlight two
examples of such tools.
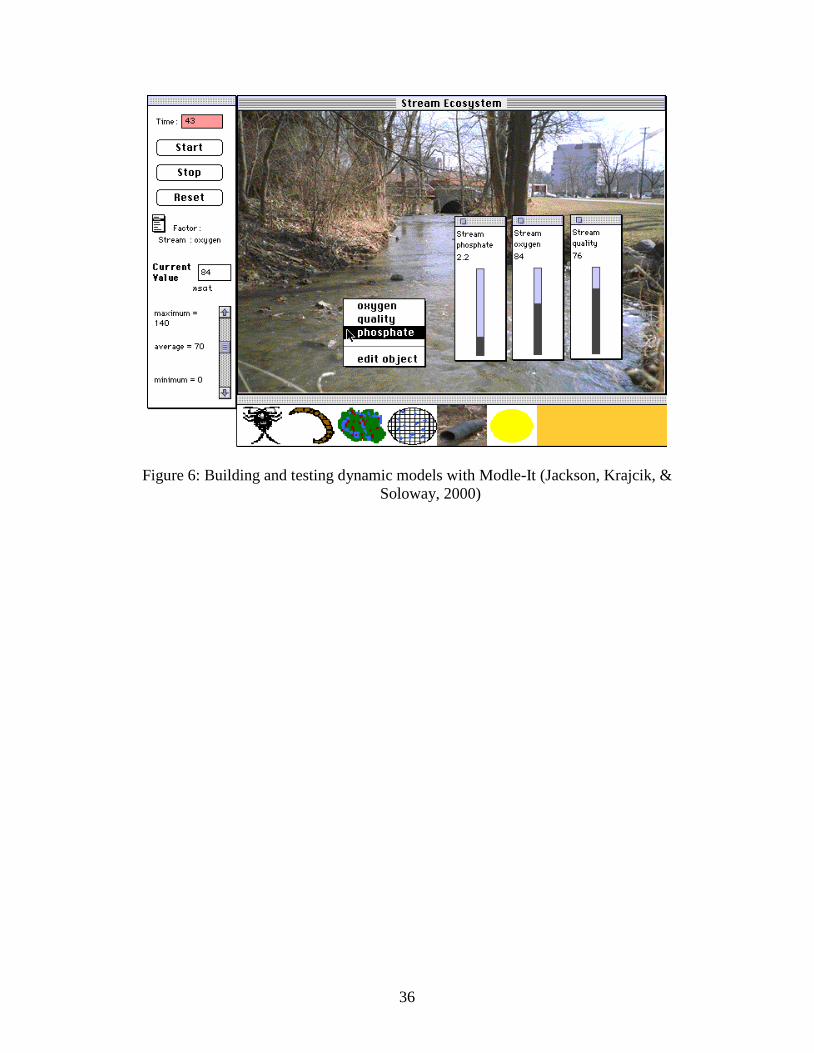
Building and testing dynamic models with Model-It. Model-It, developed at
the University of Michigan, is a learner-centered tool for building dynamic, qualitative
models. It was designed to support students, even those with only very basic
mathematical skills, in building dynamic models of scientific phenomena and running
simulations with their models to verify and analyze the results (Metcalf-Jackson, Krajcik,
& Soloway, 2000). Model-It provides an easy-to-use visual structure with which students
can plan, build, and test their models (Fig. 6). Model-It has been used with thousands of
students and their teachers in both urban and suburban areas. Research shows that when
properly integrated into the curriculum, Model-It allows students to take part in a variety
of scientific practices such as testing, debugging, building relationships, specifying
variables, and synthesis (Metcalf-Jackson et al., 2000).
For instance, in one unit on water quality designed around Model-It, middle
school students build models and test how pollutants would affect water quality.
Exploring connections among factors that affect water quality, including the geosphere,
hydrosphere, and atmosphere, can serve as a pivotal case for students and prepare them
for understanding the Earth as a complex system (Ben Zvi-Assraf & Orion, 2005). The
unit was especially effective because students were guided to use Model-It following
patterns such as predict-observe-explain. Additionally, such exploration can help students
appreciate the nature of computerized modeling and better understand how models work.
------------------------
Figure 6 about here
-------------------------

17
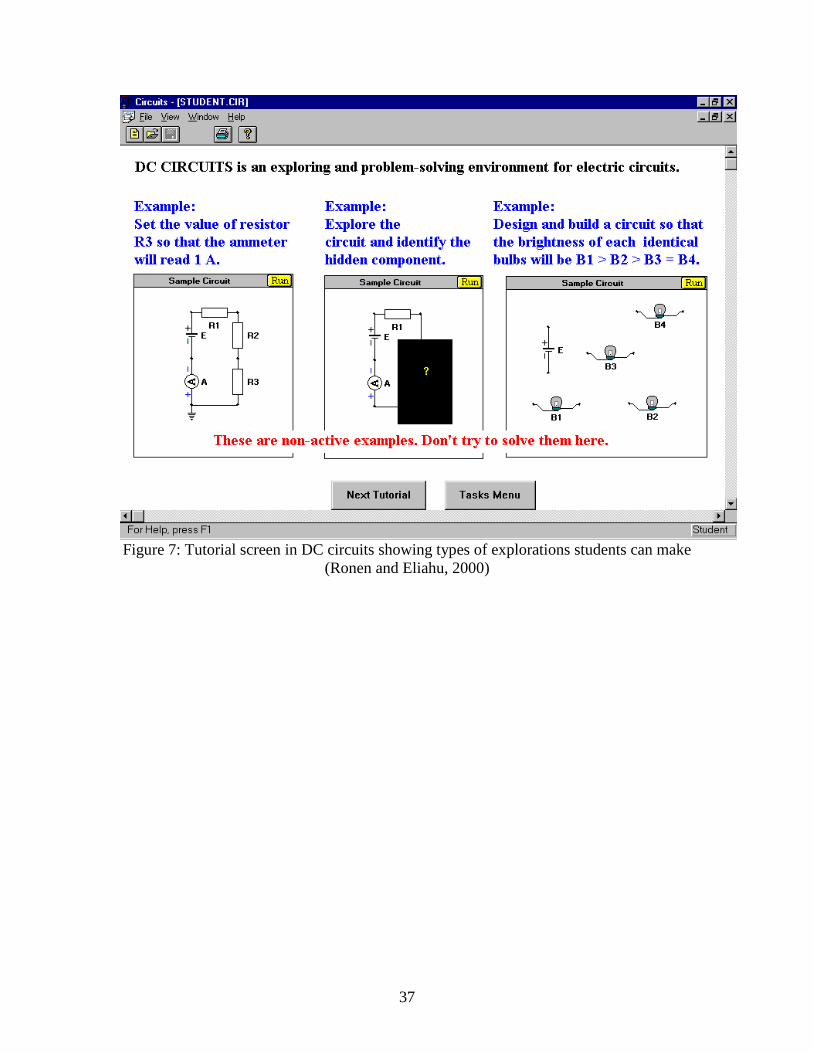
Building and testing electricity models in DC (Direct Current) Circuits. The
DC Circuits environment enables students to build and test circuit models by freely
manipulating symbolic representations of electrical components and the wires that
connect them (Fig. 7). Ronen and Eliahu (2000) found that the use of the simulation
contributed to middle school students' confidence and enhanced their motivation to stay
on task, compared to a group who used real circuits. They found that the simulation
provided a source of constructive feedback, helping students identify and correct
alternative conceptions and cope with the common difficulties of relating formal
representations to real circuits and vice versa. In this sense it acted as a pivotal case for
the students. This feature shows the value of enabling students to construct their own
models, as suggested by the pragmatic design principle, while embedding the activity in a
pattern that includes informative feedback.
------------------------
Figure 7 about here
-------------------------
Principle 4: Use Multiple Linked Representations
A powerful way to illustrate a complex phenomenon is to provide students with
multiple representations of the phenomenon. These can be of various types including
animations, graphs, symbolic illustrations, text, voice, and so on. Representations are not
necessarily interactive and therefore are not necessarily visualizations. Using multiple
representations enables diverse learners to find a representation that resonates with their
ideas. Multiple representations also allow students to identify connections that are salient
in one representation but not in another. Multiple representations become even more
powerful when they are dynamically linked to each other and synchronized, so that
18
changes in one representation cause appropriate changes in the other. In this manner,
students can better understand connections between the various types of representations
of a phenomenon and integrate ideas that each of these representations provokes and thus,
these multiple representations can serve as pivotal cases. We illustrate this principle with
two features from environments designed for upper-elementary and middle school earth
science: the Virtual Journey within the Rock Cycle (Kali, 2003), and WorldWatcher
(Edelson et al., 1999).
Multiple representations of the rock cycle. The Virtual Journey within the Rock
Cycle is a software game designed to promote middle school students’ systems thinking
in the context of the earth’s crust (Kali, 2003). Students are required to complete a
mission of collecting five types of rocks (randomly assigned from a list of 15 rocks) with
the least number of moves. To collect these rocks, they need to navigate to the area of
formation of the rocks (e.g., shallow sea, areas of high temperature and pressure beneath
the earth’s surface, etc.). Navigation is done via geological processes (e.g., weathering
and sedimentation, burial and metamorphism, volcanism, etc.). The interface of the
software provides learners with four interconnected views of the rock cycle system: (a) a
symbolic model of the system, in which arrows represent geological processes and boxes
represent their products; (b) a block diagram - a representation common in geology
showing all the areas of formation of each of the geological processes; (c) a ―zoom-in‖
view, where animation illustrates a specific geological process; and (d) a text box
explaining the geological process (Fig. 8). Each time a student navigates to a different
area of rock formation, the four views change simultaneously to illustrate various aspects
related to that area. To collect the five types of rocks, students need to pass through
19
several cycles of rock-forming processes. This type of activity has been shown to
promote students’ understanding of the earth’s crust as a cyclic system (Kali, 2003). Such
understanding is a crucial foundation for students’ further learning in earth science,
specifically, for understanding plate tectonics (Kali, Orion, & Eylon, 2003). Students
using the game are motivated not only to understand the location of the specific rocks but
the explanation for their formation. The game also guides students to hypothesize, test
their ideas, and combine their findings.
------------------------
Figure 8 about here
-------------------------
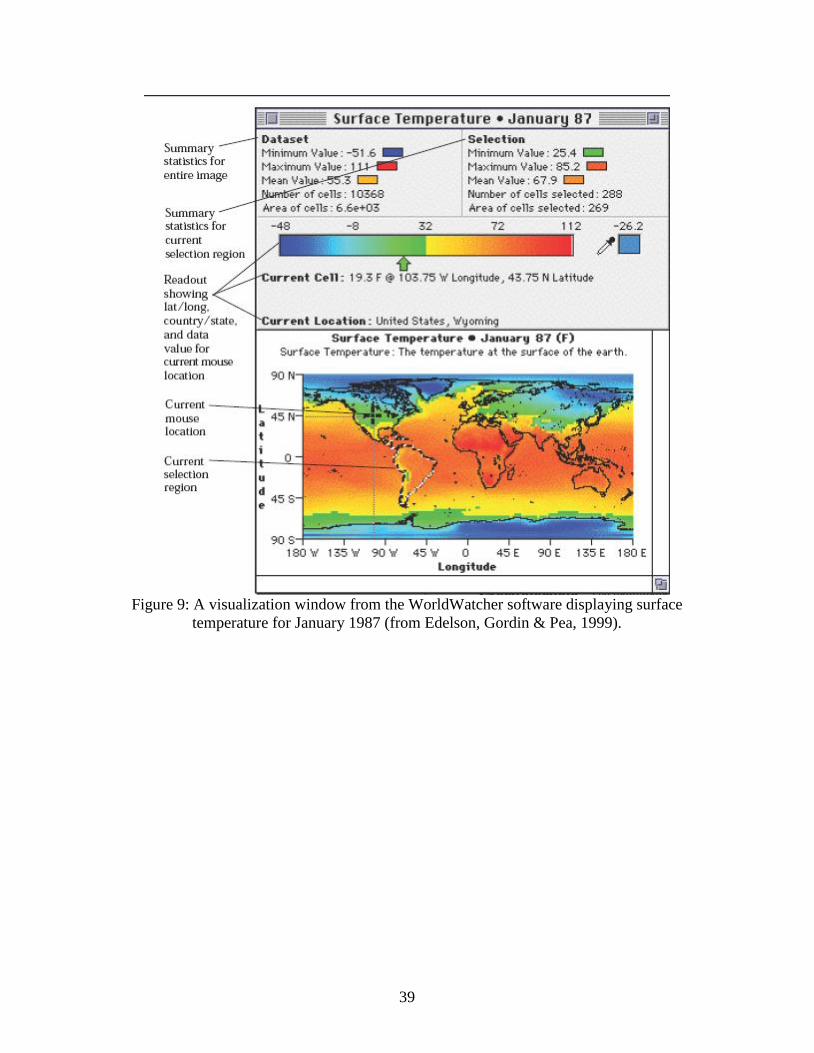
Multiple representations in WorldWatcher. WorldWatcher is a supportive
scientific visualization for the investigation of weather data. It is based on features used
in powerful, general-purpose tools for scientists, which were adapted for the use of
students (Edelson et al., 1999). WorldWatcher is used in the Planetary Forecaster Project
(grades 6 to 8) where students explore the major factors that lead to variations in
temperature around the globe. The project places students in the role of research scientists
who must investigate the causes of temperature variation on Earth in order to make
temperature predictions (and in turn, identify habitable areas) on a fictional, newly
discovered planet.
WorldWatcher displays two-dimensional global data in the form of color maps.
To provide geographical context, it displays them with latitude and longitude markings
and an optional continent outline overlay. A constantly updated readout follows the user's
mouse as it travels over an image, displaying the current latitude, longitude, country or
state/province, and temperature data value (Fig. 9). In this manner, the different types of

20
representations of the data (i.e., textual representation of the temperature, color scheme
representing temperature, location of mouse on the continent outline, and the textual
representation of the location as latitude and longitude) are linked and change
synchronously with the mouse location movements. Using WorldWatcher helps students
understand the complex interactions that affect weather patterns.
------------------------
Figure 9 about here
-------------------------
Discussion
The examples we have presented show how visualizations can help students integrate
their ideas. Visualizations often serve as pivotal cases, illustrating an idea that stimulates
learners to reconsider their prior knowledge. As we have illustrated, successful
visualizations are typically embedded in promising instructional patterns that highlight
salient information and guide knowledge-integration. For example, patterns prompt
learners to generate explanations, compare their results to those of peers, design a model,
link varied representations, or reflect on alternatives. The principles guide the design of
the visualizations, but the visualizations succeed because they are implemented as part of
powerful patterns.
To support designers as they create such sequences and embed visualizations in
such sequences, Linn and Eylon (2006) have identified design patterns to complement the
design principles approach. A design pattern is a sequence of activities teachers and
students in a classroom follow. Linn and Eylon (2006) synthesized a broad range of

21
research on inquiry science to identify patterns that employ knowledge-integration
processes in productive ways.
An example of using visualizations within a sequence of activities can be found in
the work of Clark and Sampson (2007). In their ―Thermodynamics: Probing Your
Surrounding‖ unit, they used two of the features we described - a revised version of Heat
Bars called Heat Flow Simulation, and the Principle Maker, in a sequence of activities
that was guided by a design pattern called predict, observe, explain (Linn & Eylon, 2006;
initially described by White & Gunstone, 1992).
The predict, observe, explain pattern involves providing students with a
demonstration of a scientific phenomenon. The pattern starts with eliciting students’
predictions, then, running the demonstration, and finally, asking students to reconcile
contradictions (White & Gunstone, 1992). To contribute to knowledge integration, the
predict, observe, explain pattern engages students in testing conjectures. The use of the
pattern strips away some of the complexities of a scientific phenomenon by providing a
demonstration and encouraging careful observation. Research has shown that observing a
demonstration is less effective than interaction with it (Crouch & Mazur, 2001). The
explain step in the pattern compensates by encouraging learners to articulate any
discrepancies between their prediction and the outcome.
Guided by this design pattern, Clark and Sampson (2007) developed the
thermodynamics unit starting with a driving question that elicits students’ ideas about
thermodynamics: People talk about objects being ‖naturally hot‖ or ‖naturally cold‖ -
What do they mean?. Then, students make predictions about the temperature of various
objects in the room and measure the temperature of these objects to compare with their
22
predictions. To explain their findings, they explore the heat flow simulation that shows
heat transfer between a hot cup and a warm table at both the observable and molecular
levels. Students then use the lenses of rate of cooling as a basis for understanding the
concepts of insulators and conductors. The culminating activities engage students in
developing principles that explain everyday phenomena related with heat transfer and in
critiquing principles created by their peers.
The use of the predict, observe, explain pattern assisted the designers in tailoring a
sequence of activities that embeds the heat flow simulation within other features that
employ, in addition to the make thinking visible meta-principle, other metaprinciples as
well (i.e. the make science accessible, the help learners learn from each other, and the
promote autonomous lifelong learning metaprinciples). Asking students to make
predictions about the temperature of various objects in the room helps make science
accessible by building on student knowledge and using examples that are familiar to
students from their everyday experiences. The peer critiquing of the principles created by
other students in the culminating activity enables students to learn from each other, as
well as to develop critiquing skills. These skills might encourage students to continue to
critique any information they encounter in their future schooling and everyday life.
Conclusions
Visualizations offer great promise for designing technology-based environments that
support students’ learning of science. They can provide students with powerful new ideas
that can help them sort out their existing views of a scientific phenomenon and promote a
more coherent generative view of this phenomenon. They can also provide a robust basis
for further science learning by diverse learners in higher grades. However, for

23
visualizations to serve as pivotal cases, they need to be carefully designed based on
design knowledge such as design principles and design patterns. Design principles can
guide designers in creating innovative visualizations that build on past failure and success
stories, and design patterns can assist designers in embedding these innovations in
appropriate activity sequences, tailored for specific needs and requirements of the field.
As we discussed earlier, to enhance their effectiveness, the rationales considered when
designing any feature in a learning environment should be made visible to teachers, who
need this knowledge to help their students maximize the benefit from learning
environments.

24
Note
This article is based on work supported by the National Science Foundation under grant
numbers. REC-0311835, ESI-0334199, and ESI-0455877. Any opinions, findings, and
conclusions or recommendations expressed are ours and do not necessarily reflect the
views of the National Science Foundation. We benefited from helpful conversations with
the Technology-Enhanced Learning in Science Group and the Design Group at the
department of Education in Technology and Science at the Technion – Israel Institute of
Technology. We appreciate help in production of this article from Jonathan Breitbart.

25
References
American Association for the Advancement of Science. (2002). Middle grades science
textbooks: A benchmarks-based evaluation. [on-line].
http://www.project2061.org/publications/textbook/mgsci/report/Prentice/PREN_ps3.htm
Barab, S. A., & Squire, K. D. (2004). Design-based research: Putting our stake in the
ground. Journal of the Learning Sciences, 13(1), 1-14.
Bell, P., Hoadley, C., & Linn, M. (2004). Design-based research in education. In M. C.
Linn, E. A. Davis, & P. Bell (Eds.), Internet Environments for Science Education
(pp. 73-88). Mahwah, NJ: Erlbaum.
Ben-zvi-Assraf, O., & Orion, N. (2005). A study of junior high students' perceptions of
the water cycle. Journal of Geoscience Education, 53(4), 366-373.
Bransford, J. D., Brown, A. L., & Cocking, R. R. (Eds.). (1999). How people learn:
Brain, mind, experience, and school. Washington, DC: National Research
Council.
Burmester, K., & Holmes, J. (2005, April). Mitosis and Cell Processes. Poster presented
at the annual meeting of the American Educational Research Association,
Montreal, Canada.
Clark, D.B., & Sampson, V. (2007). Personally-seeded discussions to scaffold online
argumentation. International Journal of Science Education, 29, 253-277.
Clement, J. (1993). Using bridging analogies and anchoring intuitions to deal with
students' preconceptions in physics. Journal of Research in Science Teaching,
30(10), 1241 - 1257.
26
Colella, V. S., Klopfer, E. & Resnick, M. (2001). Adventures in modelling. Exploring
complex, dynamic systems with starlogo. New York: Teachers College Press.
Collins, A., Brown, J.S., & Holum, A. (1991). Cognitive apprenticeship: Making thinking
visible. American Educator, 15(3), 6-11, 38-39.
Collins, A., Joseph, D., & Bielaczyc, K. (2004). Design research: Theoretical and
methodological issues. Journal of the Learning Sciences, 13(1), 15-42.
Crouch, C. H., & Mazur, E. (2001). Peer instruction: ten years of experience and results.
American Journal of Physics, 69, 970-977.
Davis, E. A.. & Varma, K. (in press). Supporting teachers in productive adaptation, in Y.
Kali, M. C. Linn, M. Koppal, & J. E. Roseman (Eds.) Designing coherent science
education. New York: Teachers College Press.
Design-Based Research Collective (2003). Design-based research: An emerging
paradigm for educational inquiry. Educational Researcher, 32 (1), 5-8.
diSessa, A. A., & Minstrell, J. (1998). Cultivating conceptual change with benchmark
lessons. In J. G. Greeno & S. Goldman (Eds.), Thinking practices. Mahwah, NJ:
Erlbaum.
diSessa, A. A. (2000). Changing minds: Computers, learning and literacy. Cambridge,
MA: MIT Press.
Dori, Y.J., Sasson, I., Kaberman, Z & Herscovitz, O. (2004). Integrating case-based
computerized laboratories into high school chemistry. Chemical Educator, 9, 1-5.
Edelson, D., Gordin, D., & Pea, R. (1999). Addressing the challenges of inquiry-based
learning through technology and curriculum design. Journal of the Learning
Sciences, 8 (3&4), 391-450.
27
Foley, B. (2000). Visualization tools: Models, representations and knowledge Integration.
Unpublished doctoral dissertation, University of California, Berkeley.
Gazit, E., & Chen, D. (2003). Using the observer to explore learning within virtual
worlds. Behavior Research Methods, Instruments and Computers, 35 (3), 400-
407.
Gazit E., Yair, Y., & Chen, D., (2005). Emerging conceptual understanding of complex
astronomical phenomena by using a virtual solar system, Journal of Science
Education and Technology, 14 (5-6), 459-470.
Gotwals, A., & Songer, N.B. (2006). Measuring students’ scientific content and inquiry
reasoning. In S. Barab, K. Hay, & D. Hickey (Eds.), Proceedings of the Seventh
International Conference of the Learning Sciences (pp. 196-202). Bloomington,
IN: ICLS.
Kali, Y. (2003). A virtual journey within the rock-cycle: A software kit for the
development of systems-thinking in the context of the earth’s crust. Journal of
GeoScience Education, 51(2), 165-170.
Kali, Y., (2006). Collaborative knowledge-building using the Design Principles Database.
International Journal of Computer Support for Collaborative Learning, 1(2), 187-
201.
Kali, Y. (in press). The Design Principles Database as means for promoting design-based
research, in A. E. Kelly, & R. Lesh, (Eds.), Handbook of design research methods
in education. Mahwah, NJ: Lawrence Erlbaum Associates.
Kali, Y., & Linn, M.C. (in press). Technology-enhanced support strategies for inquiry
learning, in J. M. Spector, M. D. Merrill, J. J. G. van Merriënboer, & M. P.
28
Driscoll (Eds.), Handbook of research on educational communications and
technology (3d ed.). Mahwah, NJ: Erlbaum.
Kali, Y., Orion, N., & Eylon, B. (2003). The effect of knowledge integration activities on
students’ perception of the earth’s crust as a cyclic system. Journal of Research in
Science Teaching, 40(6), 545-565.
Kali, Y., & Ronen-Fuhrmann, T. (2007). Engaging graduate students in design as means
for enhancing their epistemological understanding of learning. Paper presented at
the annual meeting of the American Educational Research Association, Chicago,
IL.
Kolodner, J.L., Camp, P.J., Crismond, D., Fasse, B., Gray, J., Holbrook, J., Puntambekar,
S., & Ryan, M. (2003). Problem-based learning meets case-based reasoning in the
middle-school science classroom: Putting Learning by Design TM into practice.
Journal of the Learning Sciences, 12(4), 495-547.
Lewis, E. L., (1996). Conceptual change among middle school students studying
elementary thermodynamics. Journal of Science Education and Technology, 5(1),
3-31.
Linn, M.C. (1995). Designing computer learning environments for engineering and
computer science: The Scaffolded Knowledge Integration framework. Journal of
Science Education and Technology , 4(2), 103-126.
Linn, M. C. (2005). WISE design for lifelong learning—Pivotal Cases. In P. Gärdenfors
& P. Johansson (Eds.), Cognition, education, and communication technology (pp.
223-256). Mahwah, NJ: Erlbaum.
29
Linn, M. C., Davis, E.A., & Bell, P. (Eds.). (2004). Internet environments for science
education. Mahwah, NJ: Erlbaum.
Linn, M. C., & Eylon, B.-S. (2006). Science education: Integrating views of learning and
instruction. In P. A. Alexander & P. H. Winne (Eds.), Handbook of educational
psychology (2d ed. pp. 511-544). Mahwah, NJ: Erlbaum.
Linn, M. C., & Hsi, S. (2000). Computers, teachers, peers: Science learning partners.
Hillsdale, NJ: Erlbaum.
Linn, M. C., Lee, H.–S., Tinker, R., Husic, F., & Chiu, J. L. (2006). Teaching and
assessing knowledge integration. Science, 313, 1049-1050.
McNeill, K.L., Lizotte, D.J., Krajcik, J., & Marx, R. W. (2006). Supporting students'
construction of scientific explanations by fading scaffolds in instructional
materials. Journal of the Learning Sciences, 15(2), 153 – 191.
Merrill, M. D. (2002). First principles of instruction. Educational Technology Research
and Development, 50(3), 43-59.
Metcalf-Jackson, S., Krajcik, J., Soloway, E. (2000). Model-It: A design retrospective. In
J. M. Jacobson, & R. B. Kozma (Eds.), Advanced designs for the technologies of
learning: Innovations in science and mathematics education (pp. 77-115).
Hillsdale, NJ: Erlbaum.
Mor, Y. and Winters, N. (2007). Design approaches in technology enhanced learning.
Interactive Learning Environments, 15, 61-75.
Morrison, J.B., Tversky, B., & Betrancourt, M. (2002). Animation: Does it facilitate?
International Journal of Human-Computer Studies, 57, 247-262.
30
Quintana, C., Reiser, B.J., Davis, E.A., Krajcik, J., Fretz, E., Golan-Duncan R., et al.
(2004). A scaffolding design framework for software to support science inquiry,
Journal of the Learning Sciences, 13(3), 337-386.
Reigeluth, C. M. (1999). Instructional design theories and models: A new paradigm of
instructional theory (Vol. II). Mahwah, NJ: Erlbaum.
Reiser, B. J., Tabak, I., Sandoval, W. A., Smith, B., Steinmuller, F., & Leone, T. J.,
(2001) BGuILE: Strategic and conceptual scaffolds for scientific inquiry in
biology classrooms. In S.M. Carver & D. Klahr (Eds.), Cognition and instruction:
Twenty-five years of progress (pp. 263-305). Mahwah, NJ: Erlbaum.
Ronen, M., & Eliahu, M. (2000). Simulation - A bridge between theory and reality: the
case of electric circuits, Journal of Computer-Assisted Learning, 16, 14-26.
Roseman, J. E. & Linn, M. C. (in press). Characterizing curriculum coherence. In Y.
Kali, J. E. Roseman & M.C. Linn (Eds.), Designing coherent science education.
Slotta, J.D (2004). The Web-based Inquiry Science Environment (WISE): Scaffolding
teachers to adopt inquiry and technology. In M.C. Linn, P. Bell & E. Davis
(Eds.), Internet environments for science education (pp. 203-232). Mahwah, NJ:
Erlbaum.
Songer, N. (1996). Exploring learning opportunities in coordinated network-enhanced
classrooms - A case of kids as global scientists. Journal of the Learning Sciences,
5(4), 297-327.
Songer, N. B., & Linn, M. C. (1992). How do students' views of science influence
knowledge integration? In M. K. Pearsall (Ed.), Scope, sequence and coordination
31
of secondary school science, Volume I: Relevant research (pp. 197-219).
Washington, DC: The National Science Teachers Association.
Thompson, P. W. (2002). Didactic objects and didactic models in radical constructivism.
In K. Gravemeijer, R. Lehrer, B. v. Oers & L. Verschaffel (Eds.), Symbolizing
and modeling in mathematics education (pp. 191-212). Dordrecth, The
Netherlands: Kluwer.
van den Akker, J. (1999). Principles and methods of development research. In J. van den
Akker, N. Nieveen, R. M. Branch, K. L. Gustafson, & T. Plomp (Eds.), Design
methodology and developmental research in education and training (pp. 1-14).
The Netherlands: Kluwer.
White, B. Y., & Frederiksen, J. R. (1998). Inquiry, modeling, and metacognition: Making
science accessible to all students. Cognition and Instruction, 16(1), 3-118.
White, R., & Gunstone, R. (1992). Probing understanding. New York: Falmer.
Yair, Y., Mintz, R., & Litvak, S. (2001). 3D-virtual reality in science education: An
implication for astronomy teaching. Journal of Computers in Mathematics and
Science Teaching, 20(3), 293-305.
32
Figures
Figure 1: Heat Bars animation designed by Lewis (1996) and Foley (2000) to illustrate
the rate of heat flow in different materials
33
Figure 2: CyberTracker: A tool supporting biodiversity data collection. (Gotwals &
Songer, 2006)
34
Figure 3: Highlighting orbital lines in the Virtual Solar System (Yair, Mintz, & Litvak,
2001; Gazit, Yair & Chen, 2005)
35
Figure 4: Scaffolding students in the creation of principles with Principle Maker in WISE
(Clark & Sampson, 2007).
Figure 5: Sorting ideas with Idea Manager in WISE (Burmester & Holmes, 2005)
36
Figure 6: Building and testing dynamic models with Modle-It (Jackson, Krajcik, &
Soloway, 2000)
37
Figure 7: Tutorial screen in DC circuits showing types of explorations students can make
(Ronen and Eliahu, 2000)

38
Figure 8: Multiple representations of the rock cycle in the Virtual Journey Within the
Rock Cycle (Kali, 2003)
39
Figure 9: A visualization window from the WorldWatcher software displaying surface
temperature for January 1987 (from Edelson, Gordin & Pea, 1999).
Related Documents