Designing Effective Graphics Using MATLAB The Cain Project in Engineering and Professional Communication ENGINEERING SERIES

Welcome message from author
This document is posted to help you gain knowledge. Please leave a comment to let me know what you think about it! Share it to your friends and learn new things together.
Transcript

Designing Effective Graphics Using MATLAB
The Cain Project in Engineering and Professional Communication
ENGINEERING SERIES

The Purpose of Using Graphics
• In your own problem solving– As part of design– As analysis of operating data
• For persuasion and interpretation– Dramatize relationships– Promote identification– Make complex information accessible

Criteria for Good Graphics
• Purpose clear?
• Pattern and arrangement lead eye without distraction?
• Similar items grouped and indicated?
• Graphic hierarchy consistent?
• Fonts legible?
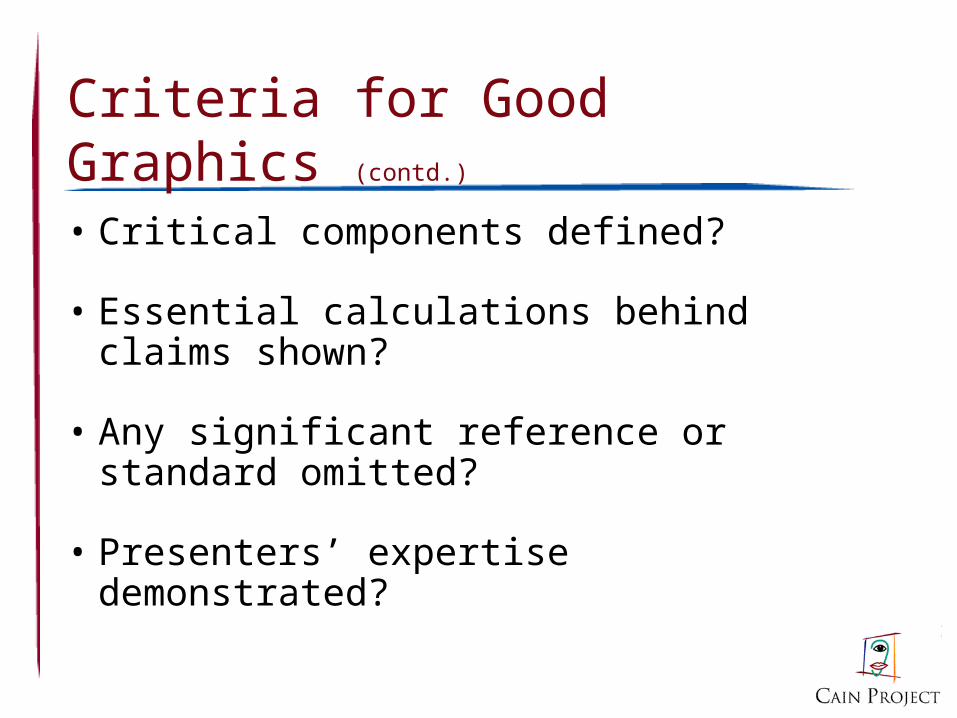
Criteria for Good Graphics (contd.)
• Critical components defined?
• Essential calculations behind claims shown?
• Any significant reference or standard omitted?
• Presenters’ expertise demonstrated?
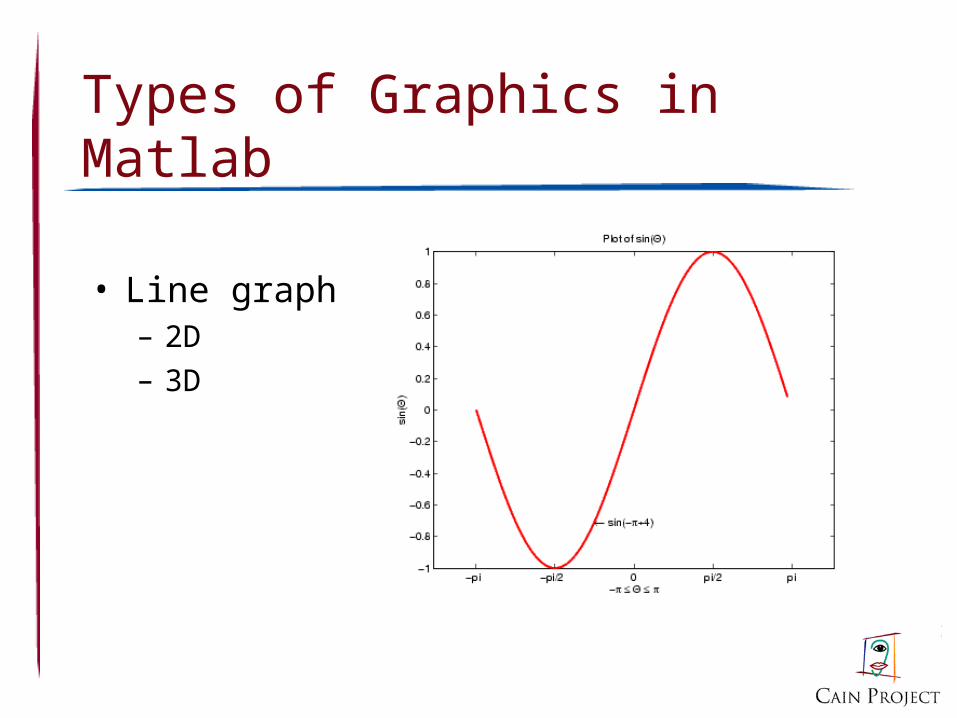
Types of Graphics in Matlab
• Line graph– 2D– 3D

Types of Graphics in Matlab
• Column or
bar graph

Types of Graphics in Matlab
• Pie graph– Shows “whole to
part” relationships

Types of Graphics in Matlab
• Ribbon graph

Select Right Type of Graphic
• What Is Your Purpose?– Problem solving?– Persuasion and interpretation?
• Who Is the Audience?– What are their backgrounds?– What do they want to know?
• What Is the Context?– Presentation?– Report/Paper?
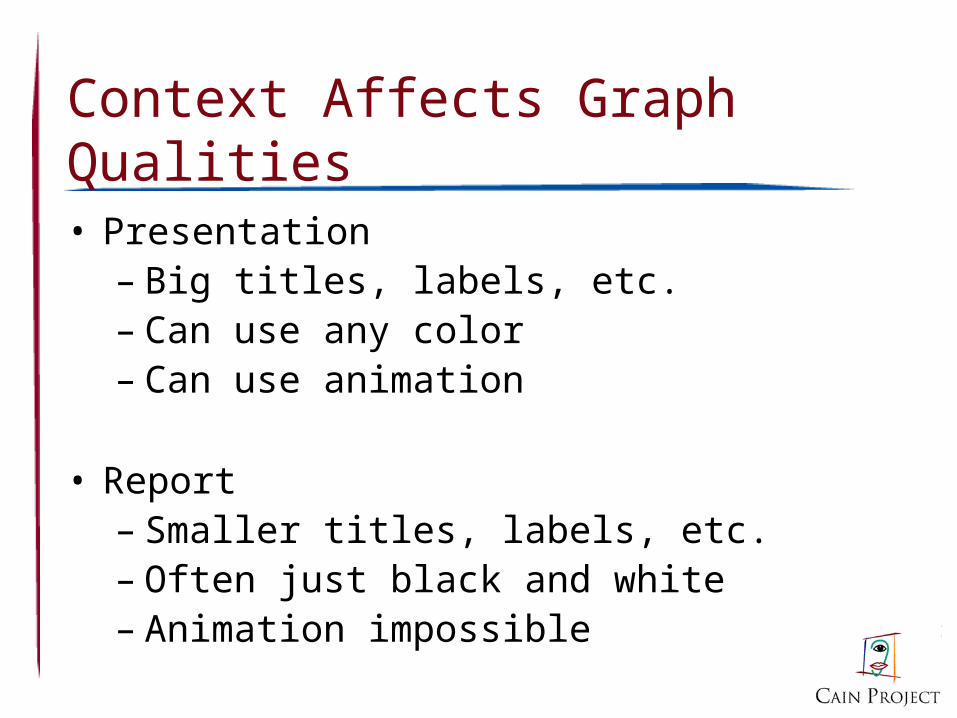
Context Affects Graph Qualities
• Presentation– Big titles, labels, etc.– Can use any color– Can use animation
• Report– Smaller titles, labels, etc.– Often just black and white– Animation impossible

2D Plot Tips
• Use the best line style/size for the situation.
• Think about the best placement of legend/key.
• Incorporate error bars, if necessary.
• Use gridlines sparingly.

An Example
• You have:– Vector 1: x(0:0.2:10);– Vector 2: sin(x);– Vector 3: cos(x);
• You are asked to:
– Plot sin(x) vs. x and cos(x) vs. x in the same figure.
– Customize the figure so that it is suitable for presentation.

A Simple Matlab Program
clear all;X=[0:0.2:10];sinx=sin(x);cosx=cos(x);plot(x,sinx,x,cosx);xlabel('x');ylabel('y');title([‘sin and cos Functions']);

Default Plot Given by Matlab
0 1 2 3 4 5 6 7 8 9 10-1
-0.8
-0.6
-0.4
-0.2
0
0.2
0.4
0.6
0.8
1
x
y
sin and cos Functions

We Want …
• Titles and labels bigger
• Lines thicker
• Colors more contrasting
• Key data points visible
• Legend or labels close to lines

How to Get What We Want

Open the Property Editor
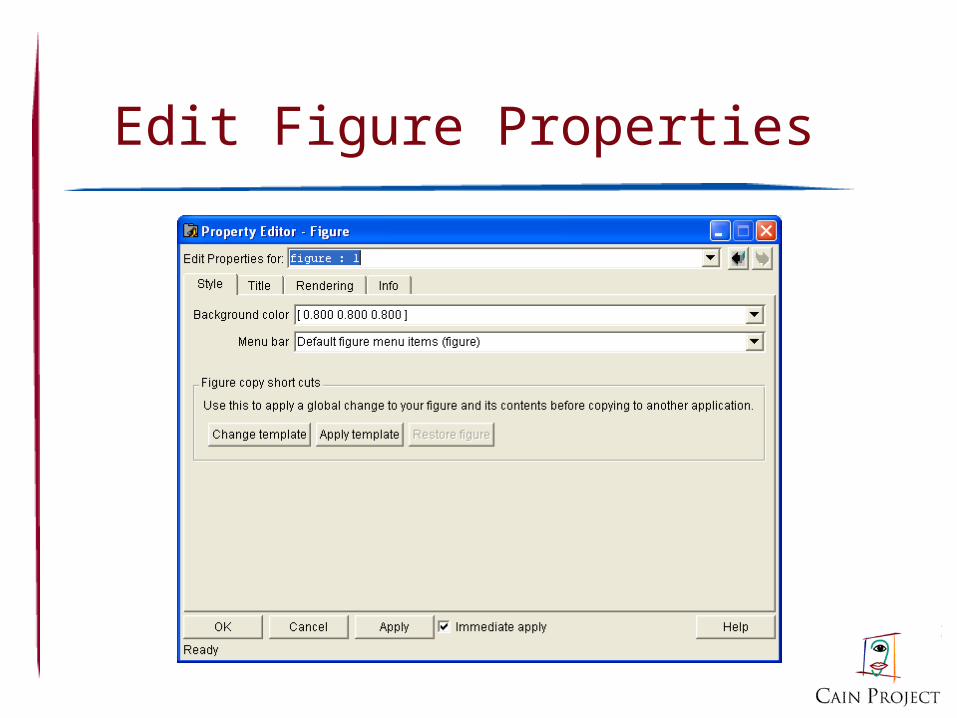
Edit Figure Properties

Edit Axes Properties

Edit Line Properties

So Far, A Better-Looking Figure
0 2 4 6 8 10-1
-0.5
0
0.5
1
x
y
sin and cos Functions

Insert Legend

Edit Legend Properties

Insert Y Grid Line

Final Version!
0 2 4 6 8 10-1.5
-1
-0.5
0
0.5
1
1.5
x
y
sin and cos Functionssin(x)cos(x)

Frequently Used Functions
• “plot”• “xlabel”, “ylabel”• “title”• “xlim”, “ylim”• “axis”• “legend”• “errorbar”
Type “help xxx” in Matlab command window for detailed information on the usage of the function xxx.

Other 2D Plotting Commands
• “loglog”: graph with logarithmic scales for both axes.• “semilogx”: graph with a logarithmic scale for x-axis
and a linear scale for y-axis.• “semilogy”: graph with a logarithmic scale for y-axis
and a linear scale for x-axis.• “plotyy”: graph with y-tick labels on the left and right
side.

A Whole Lot More …
• 2D contour– “contour”– “contourslice”
• 3D plots– “plot3”– “mesh”– “surf”
• Movie– “getframe”– “movie”

Plotting in Excel

Selecting Chart Type and Inputting Data

Adding Labels and Selecting Location

What do we need to change?
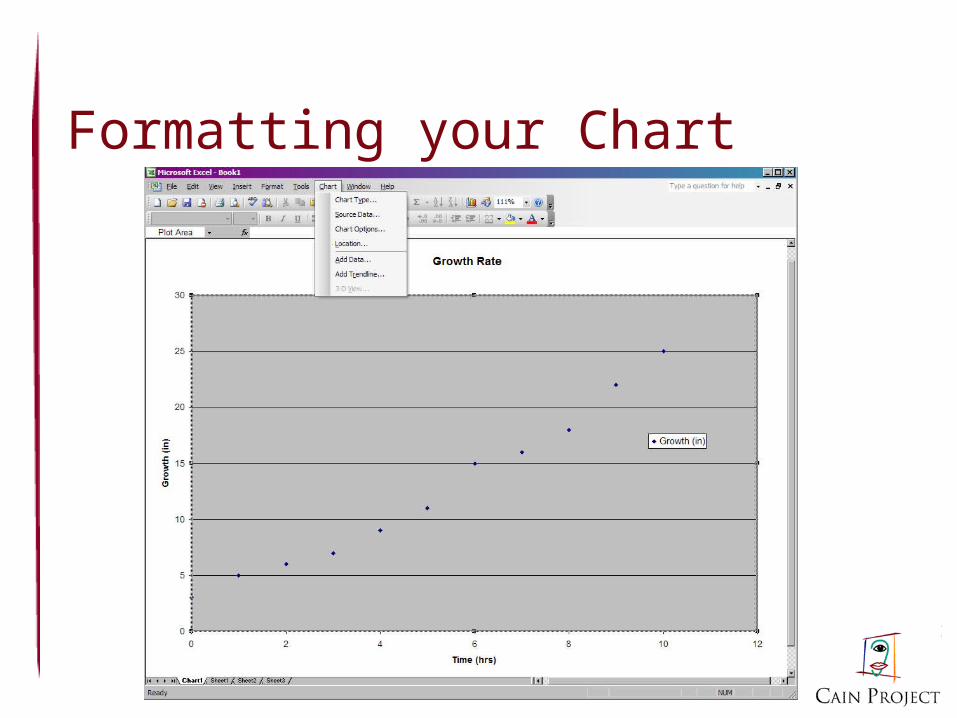
Formatting your Chart

Adding a Trendline
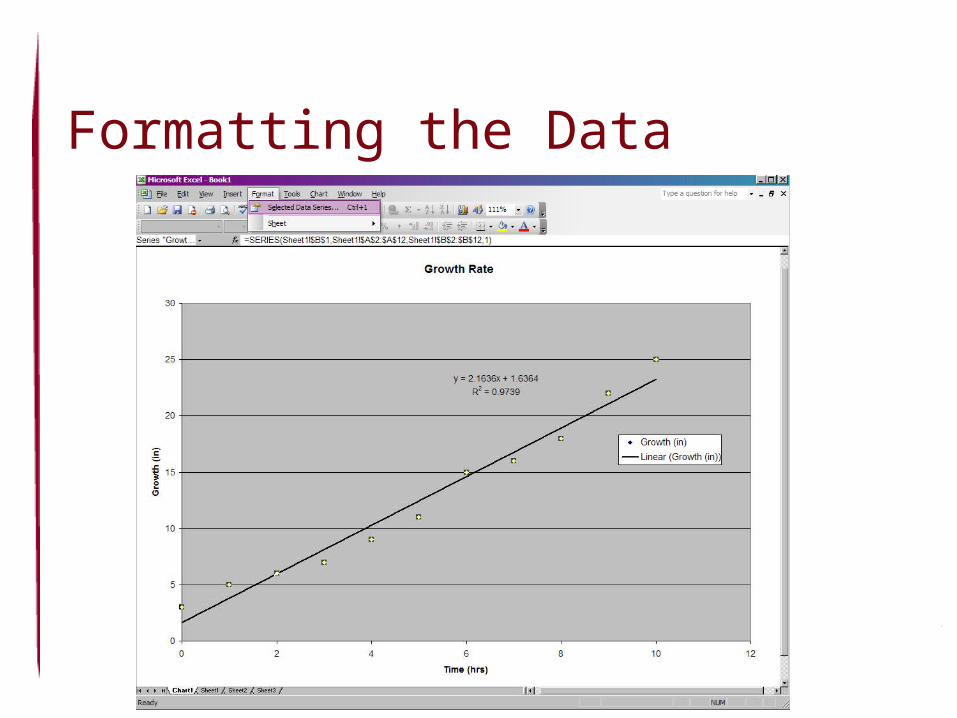
Formatting the Data

Editing the Line and Markers
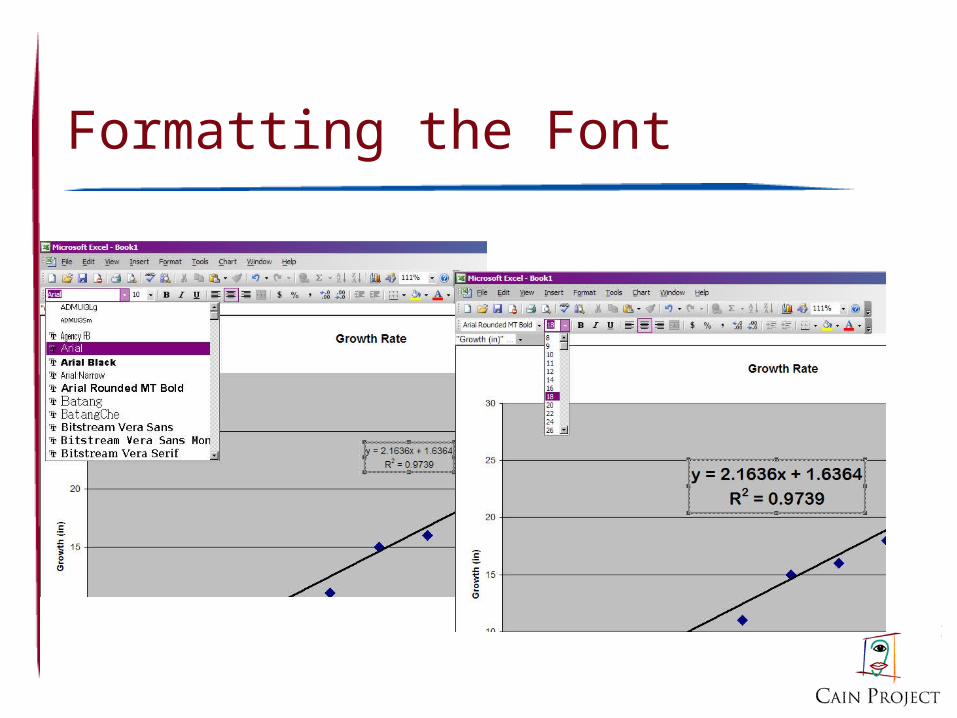
Formatting the Font

Final Product!

Other Features
• Logarithmic axis– Select the axis you want to change– Right click or select the “Format” option in
your toolbar and select “Format Axis”– Click on the “Scale” tab– Check the box marked “Logarithmic
Scale”

More resources are available for you
• under “Engineering Communication” at Connexions at http://cnx.org
• at the Cain Project site at http://www.owlnet.rice.edu/~cainproj
• in your course Communication Folder in OWLSPACE.
Lead through Excellence in Engineering Communication
Related Documents