1 | Page

Welcome message from author
This document is posted to help you gain knowledge. Please leave a comment to let me know what you think about it! Share it to your friends and learn new things together.
Transcript
1 | P a g e

© 2010, Calvin College and Chris Crock, Aaron Lammers, Brent Long, Aaron Raak.

Abstract
Carabuela is a small village located in northern Ecuador that currently has a flawed wastewater treatment
system. Working alongside the organization Heralding Christ Jesus Blessings (HCJB), WasteWatchers
designed a new wastewater treatment system for Carabuela. Throughout the project, the team considered
three design norms: cultural appropriateness, stewardship and transparency. Using these norms as a guide,
the team designed a bar rack system, grit chamber, Imhoff Tank, lagoon system, and drying beds as part
of the new wastewater treatment system. The amount of BOD, TSS and pathogens removed were
acceptable to standards for irrigation. Effluent BOD levels were reduced by 97% down to 2.6 mg/L. The
faecal coliform levels were reduced by 4 log removal (~99.995%) to 915 faecal coliforms per 100 mL.
The helminth egg levels were reduced by 4 log removal down to 0.1 eggs per liter.
The estimated total construction cost for the project would be $31,000. Operations and maintenance
would cost approximately $14,000 per year. We hope to obtain some grant funds for the initial
construction and ongoing operations and maintenance. It is the intention of this project that the system be
constructed in the village once the people approve it.
i | P a g e
Table of Contents
1. Introduction ............................................................................................................................................... 7
1.1 The Team ...................................................................................................................................... 7
1.2 The Project .................................................................................................................................... 7
1.3 Project Background ....................................................................................................................... 8
2 Project Management ............................................................................................................................. 9
2.1 Team Organization ........................................................................................................................ 9
2.2 Schedule ...................................................................................................................................... 10
2.3 Budget ......................................................................................................................................... 11
2.4 Method of Approach ................................................................................................................... 11
3 Requirements ...................................................................................................................................... 11
3.1 Performance Requirements ......................................................................................................... 11
3.1.1 Water Effluent ..................................................................................................................... 11
3.1.2 Sludge Effluent ................................................................................................................... 12
3.2 Functional Requirements ............................................................................................................ 12
3.3 Team Deliverables ...................................................................................................................... 13
4 Task Specifications and Schedule ....................................................................................................... 13
5 System Architecture ............................................................................................................................ 15
6 Design Criteria .................................................................................................................................... 17
6.1 Bar Rack...................................................................................................................................... 17
6.2 Grit Chamber .............................................................................................................................. 18
6.3 Imhoff tank .................................................................................................................................. 18
6.4 Lagoon System ............................................................................................................................ 19
6.5 Sludge Treatment ........................................................................................................................ 19
7 Design Alternatives ............................................................................................................................. 19
7.1 Bar racks ..................................................................................................................................... 19
ii | P a g e
7.1.1 Introduction: ........................................................................................................................ 19
7.1.2 Design Considerations for Inclined Bar Racks ................................................................... 20
7.2 Grit Chamber .............................................................................................................................. 25
7.2.1 Introduction: ........................................................................................................................ 25
7.2.2 Vortex Grit Chamber .......................................................................................................... 25
7.2.3 Modified Vortex Chamber .................................................................................................. 25
7.2.4 Old Septic Tank .................................................................................................................. 26
7.2.5 Rectangular Open Channel ................................................................................................. 26
7.2.6 Design Considerations: (Vesilind, 2003) ............................................................................ 27
7.3 Imhoff Tank ................................................................................................................................ 28
7.3.1 Septic Tank ......................................................................................................................... 28
7.3.2 Imhoff Tank ........................................................................................................................ 30
7.3.3 Primary Lagoon System ...................................................................................................... 31
7.4 Lagoon System ............................................................................................................................ 31
7.4.1 Aerated Ponds ..................................................................................................................... 31
7.4.2 Anaerobic Ponds ................................................................................................................. 32
7.4.3 Aerobic Ponds ..................................................................................................................... 32
7.5 Sludge Treatment Design Alternatives ....................................................................................... 32
7.5.1 Mechanical Alternatives ..................................................................................................... 33
7.5.2 Drying Lagoons................................................................................................................... 33
7.5.3 Drying Beds ........................................................................................................................ 33
8 Design Decisions ................................................................................................................................ 35
8.1 Bar racks ..................................................................................................................................... 35
8.2 Grit Chamber .............................................................................................................................. 37
8.3 Imhoff Tank ................................................................................................................................ 39
8.4 Lagoon System ............................................................................................................................ 40
8.5 Sludge Drying Beds .................................................................................................................... 41
iii | P a g e
9 Hydraulic Analysis .............................................................................................................................. 42
10 Environmental Design..................................................................................................................... 44
10.1 Bar Racks and Grit Chamber ...................................................................................................... 44
10.2 Imhoff Tank ................................................................................................................................ 45
10.3 Waste Stabilization Lagoons ....................................................................................................... 48
10.4 Sludge Drying Beds .................................................................................................................... 50
11 Structural Design ............................................................................................................................ 50
11.1 Bar Racks .................................................................................................................................... 50
11.2 Grit Chamber .............................................................................................................................. 51
11.3 Imhoff Tank ................................................................................................................................ 53
11.4 Waste Stabilization Lagoons ....................................................................................................... 54
11.5 Sludge Drying Beds .................................................................................................................... 55
12 Grant Proposal ................................................................................................................................ 56
12.1 Executive Summary .................................................................................................................... 56
12.2 Background Information ............................................................................................................. 57
12.3 Problem Statement ...................................................................................................................... 57
12.4 Project Detail .............................................................................................................................. 59
12.4.1 Goals and Objectives .......................................................................................................... 59
12.4.2 Clientele .............................................................................................................................. 60
12.4.3 Methods ............................................................................................................................... 60
12.5 Staff/Administration ................................................................................................................. 60
12.6 Needed Resources ....................................................................................................................... 61
12.7 Goal #1—Design a wastewater treatment system ....................................................................... 62
12.8 Goal #2—Plan with cultural appropriateness ............................................................................. 62
12.9 Strategy for evaluation of effectiveness ...................................................................................... 63
13 Conclusion ...................................................................................................................................... 63
14 Future Work to be Completed ......................................................................................................... 64

iv | P a g e
15 Works Cited .................................................................................................................................... 66
16 Acknowledgements ......................................................................................................................... 68
17 Appendices ...................................................................................................................................... 69
v | P a g e
Table of Figures
Figure 1: Wastewater Treatment Process ...................................................................................................... 8
Figure 2: Organization Chart ...................................................................................................................... 10
Figure 3: Task Specifications and Schedule ............................................................................................... 14
Figure 4: System Architecture .................................................................................................................... 16
Figure 5: Example of Manually Raked Bar Screen .................................................................................... 24
Figure 6: Sutro Weir ................................................................................................................................... 26
Figure 7: Long narrow grit chamber where heavier inorganics are removed ............................................. 28
Figure 8: Septic Tank Schematic ................................................................................................................ 29
Figure 9: Imhoff Tank Schematic ............................................................................................................... 30
Figure 10: Several Lagoon System Schematics .......................................................................................... 31
Figure 11: System Flow Rate during Rainfall ............................................................................................ 43
Figure 12: Weir Design ............................................................................................................................... 45
Figure 13: Imhoff Cone Depth .................................................................................................................... 47
Figure 14: General Bar Rack Design .......................................................................................................... 50
Figure 15: Grit Chamber General Design ................................................................................................... 51
Figure 16: Plan View .................................................................................................................................. 55
Figure 17: Side View .................................................................................................................................. 56
vi | P a g e
Table of Tables
Table 1: Channel Width Calculations ......................................................................................................... 22
Table 2: Typical Design Criteria for Coarse Screening Equipment............................................................ 23
Table 3: Typical Design Properties for coarse Screenings ......................................................................... 23
Table 4: Table of bar types and their respective shape factors ................................................................... 24
Table 5: Grit Chamber Calculations and Dimensions ................................................................................. 28
Table 6: Estimated grit quantities for a Detritus tank ................................................................................. 28
Table 7: Drying Bed Materials.................................................................................................................... 34
Table 8: Drying Bed Costs .......................................................................................................................... 35
Table 9: Bar Rack Decision Matrix ............................................................................................................ 36
Table 10: Grit Chamber Decision Matrix ................................................................................................... 37
Table 11: Lagoon Decision Matrix ............................................................................................................. 41
Table 12: Sludge Drying Decision Matrix .................................................................................................. 41
Table 13: Side Overflow Weir flows .......................................................................................................... 44
Table 14: Design Criteria for Unheated Imhoff Tanks ............................................................................... 46
Table 15: Bar rack and grit chamber cost estimate ..................................................................................... 53
Table 16: Imhoff Tank Cost Estimate ......................................................................................................... 54
7 | P a g e
1. Introduction
1.1 The Team
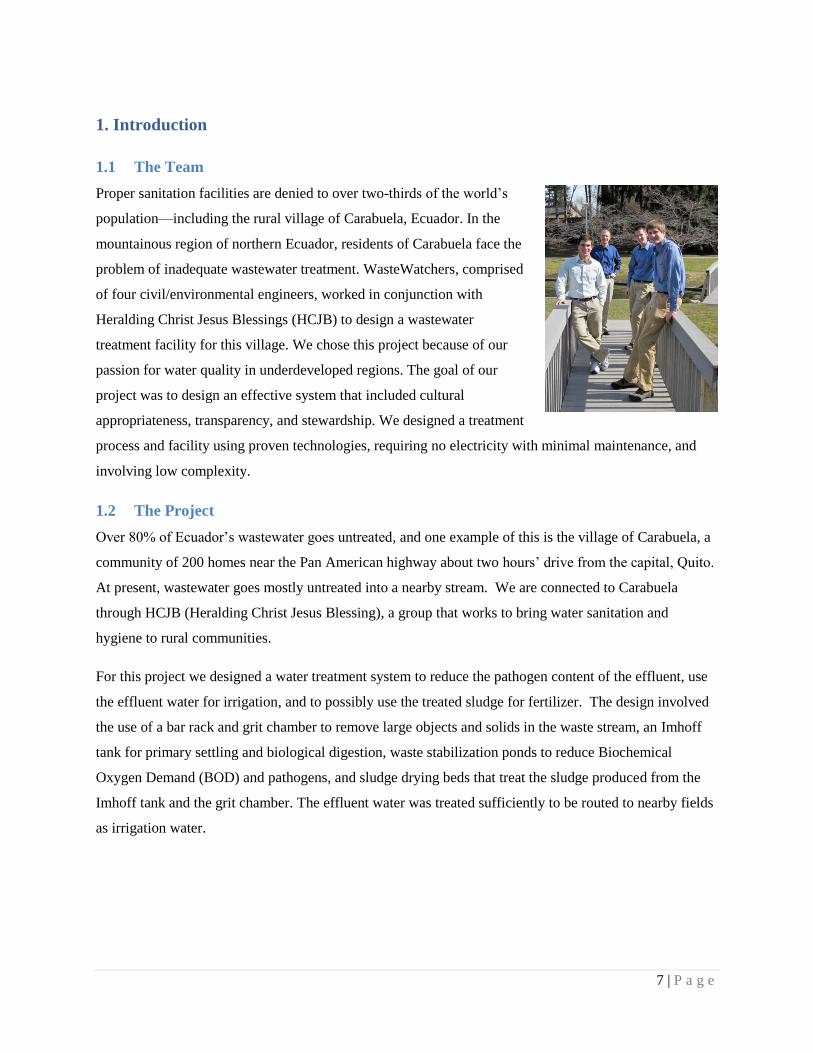
Proper sanitation facilities are denied to over two-thirds of the world‘s
population—including the rural village of Carabuela, Ecuador. In the
mountainous region of northern Ecuador, residents of Carabuela face the
problem of inadequate wastewater treatment. WasteWatchers, comprised
of four civil/environmental engineers, worked in conjunction with
Heralding Christ Jesus Blessings (HCJB) to design a wastewater
treatment facility for this village. We chose this project because of our
passion for water quality in underdeveloped regions. The goal of our
project was to design an effective system that included cultural
appropriateness, transparency, and stewardship. We designed a treatment
process and facility using proven technologies, requiring no electricity with minimal maintenance, and
involving low complexity.
1.2 The Project
Over 80% of Ecuador‘s wastewater goes untreated, and one example of this is the village of Carabuela, a
community of 200 homes near the Pan American highway about two hours‘ drive from the capital, Quito.
At present, wastewater goes mostly untreated into a nearby stream. We are connected to Carabuela
through HCJB (Heralding Christ Jesus Blessing), a group that works to bring water sanitation and
hygiene to rural communities.
For this project we designed a water treatment system to reduce the pathogen content of the effluent, use
the effluent water for irrigation, and to possibly use the treated sludge for fertilizer. The design involved
the use of a bar rack and grit chamber to remove large objects and solids in the waste stream, an Imhoff
tank for primary settling and biological digestion, waste stabilization ponds to reduce Biochemical
Oxygen Demand (BOD) and pathogens, and sludge drying beds that treat the sludge produced from the
Imhoff tank and the grit chamber. The effluent water was treated sufficiently to be routed to nearby fields
as irrigation water.
8 | P a g e
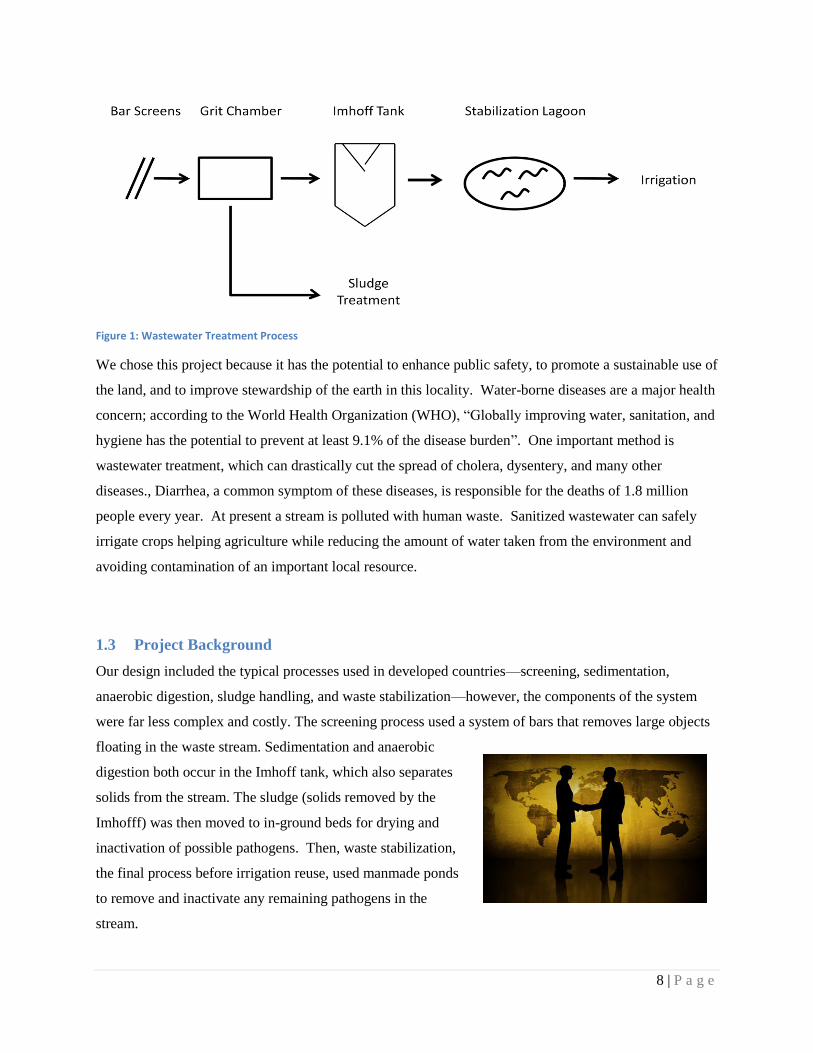
Figure 1: Wastewater Treatment Process
We chose this project because it has the potential to enhance public safety, to promote a sustainable use of
the land, and to improve stewardship of the earth in this locality. Water-borne diseases are a major health
concern; according to the World Health Organization (WHO), ―Globally improving water, sanitation, and
hygiene has the potential to prevent at least 9.1% of the disease burden‖. One important method is
wastewater treatment, which can drastically cut the spread of cholera, dysentery, and many other
diseases., Diarrhea, a common symptom of these diseases, is responsible for the deaths of 1.8 million
people every year. At present a stream is polluted with human waste. Sanitized wastewater can safely
irrigate crops helping agriculture while reducing the amount of water taken from the environment and
avoiding contamination of an important local resource.
1.3 Project Background
Our design included the typical processes used in developed countries—screening, sedimentation,
anaerobic digestion, sludge handling, and waste stabilization—however, the components of the system
were far less complex and costly. The screening process used a system of bars that removes large objects
floating in the waste stream. Sedimentation and anaerobic
digestion both occur in the Imhoff tank, which also separates
solids from the stream. The sludge (solids removed by the
Imhofff) was then moved to in-ground beds for drying and
inactivation of possible pathogens. Then, waste stabilization,
the final process before irrigation reuse, used manmade ponds
to remove and inactivate any remaining pathogens in the
stream.
9 | P a g e
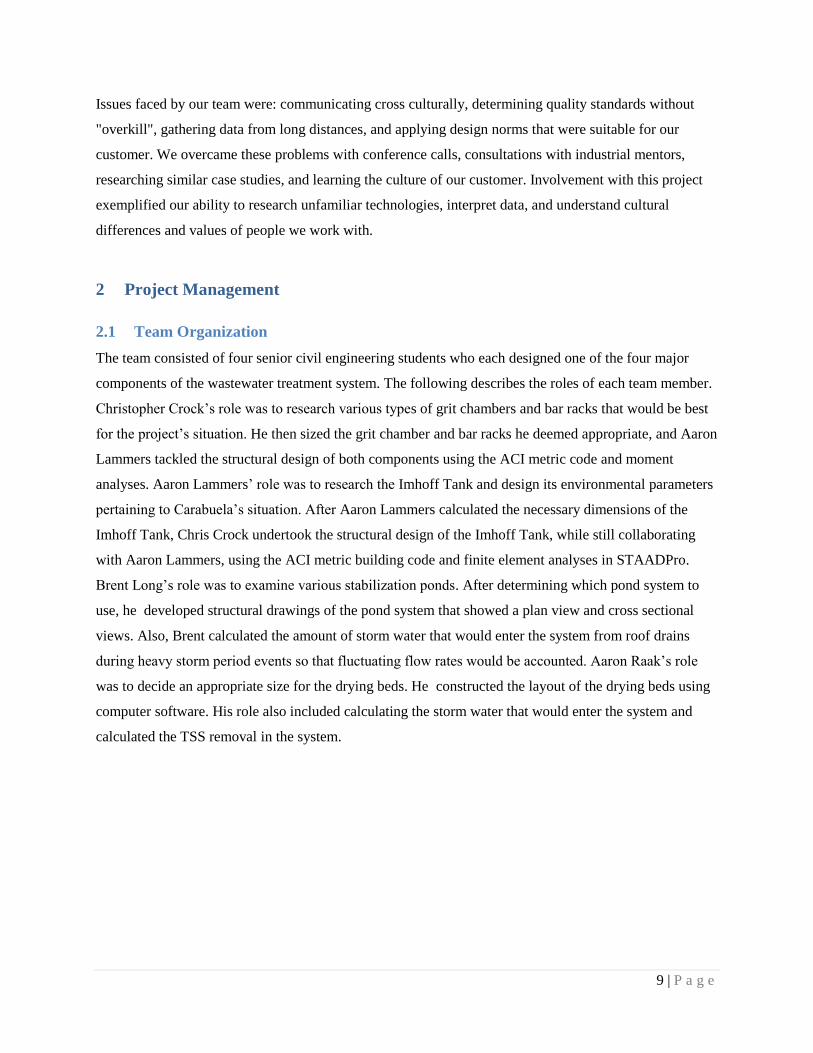
Issues faced by our team were: communicating cross culturally, determining quality standards without
"overkill", gathering data from long distances, and applying design norms that were suitable for our
customer. We overcame these problems with conference calls, consultations with industrial mentors,
researching similar case studies, and learning the culture of our customer. Involvement with this project
exemplified our ability to research unfamiliar technologies, interpret data, and understand cultural
differences and values of people we work with.
2 Project Management
2.1 Team Organization
The team consisted of four senior civil engineering students who each designed one of the four major
components of the wastewater treatment system. The following describes the roles of each team member.
Christopher Crock‘s role was to research various types of grit chambers and bar racks that would be best
for the project‘s situation. He then sized the grit chamber and bar racks he deemed appropriate, and Aaron
Lammers tackled the structural design of both components using the ACI metric code and moment
analyses. Aaron Lammers‘ role was to research the Imhoff Tank and design its environmental parameters
pertaining to Carabuela‘s situation. After Aaron Lammers calculated the necessary dimensions of the
Imhoff Tank, Chris Crock undertook the structural design of the Imhoff Tank, while still collaborating
with Aaron Lammers, using the ACI metric building code and finite element analyses in STAADPro.
Brent Long‘s role was to examine various stabilization ponds. After determining which pond system to
use, he developed structural drawings of the pond system that showed a plan view and cross sectional
views. Also, Brent calculated the amount of storm water that would enter the system from roof drains
during heavy storm period events so that fluctuating flow rates would be accounted. Aaron Raak‘s role
was to decide an appropriate size for the drying beds. He constructed the layout of the drying beds using
computer software. His role also included calculating the storm water that would enter the system and
calculated the TSS removal in the system.
10 | P a g e
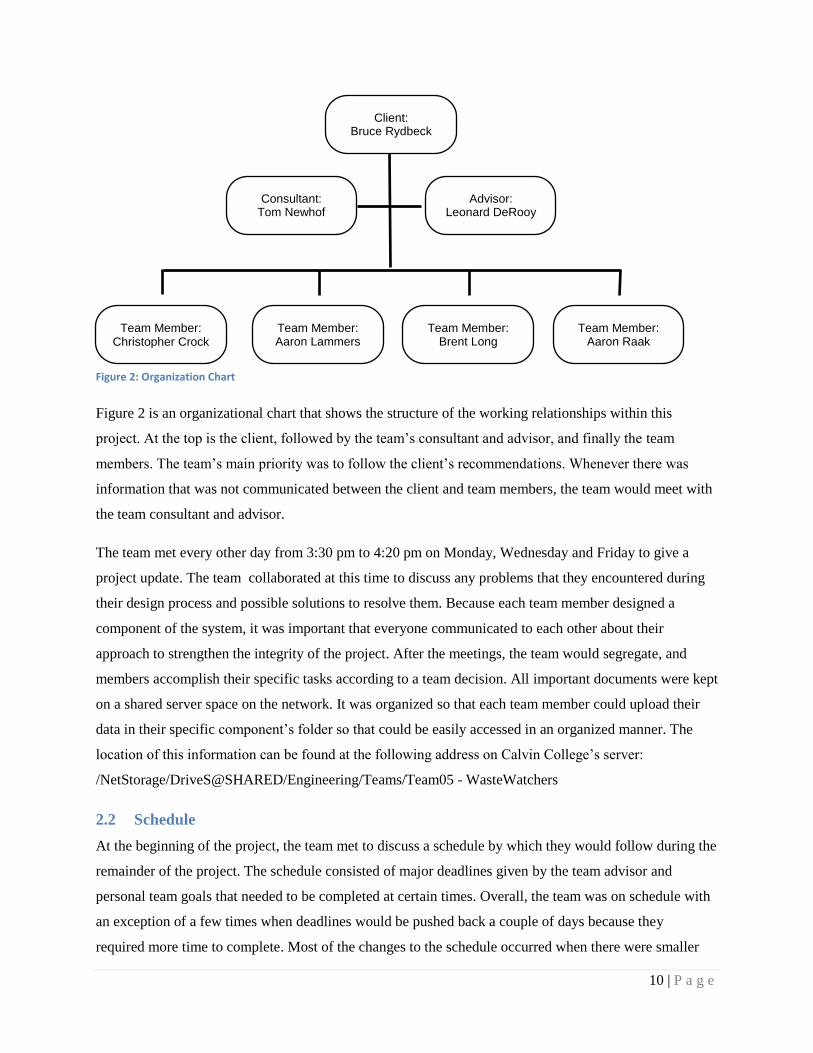
Figure 2 is an organizational chart that shows the structure of the working relationships within this
project. At the top is the client, followed by the team‘s consultant and advisor, and finally the team
members. The team‘s main priority was to follow the client‘s recommendations. Whenever there was
information that was not communicated between the client and team members, the team would meet with
the team consultant and advisor.
The team met every other day from 3:30 pm to 4:20 pm on Monday, Wednesday and Friday to give a
project update. The team collaborated at this time to discuss any problems that they encountered during
their design process and possible solutions to resolve them. Because each team member designed a
component of the system, it was important that everyone communicated to each other about their
approach to strengthen the integrity of the project. After the meetings, the team would segregate, and
members accomplish their specific tasks according to a team decision. All important documents were kept
on a shared server space on the network. It was organized so that each team member could upload their
data in their specific component‘s folder so that could be easily accessed in an organized manner. The
location of this information can be found at the following address on Calvin College‘s server:
/NetStorage/DriveS@SHARED/Engineering/Teams/Team05 - WasteWatchers
2.2 Schedule
At the beginning of the project, the team met to discuss a schedule by which they would follow during the
remainder of the project. The schedule consisted of major deadlines given by the team advisor and
personal team goals that needed to be completed at certain times. Overall, the team was on schedule with
an exception of a few times when deadlines would be pushed back a couple of days because they
required more time to complete. Most of the changes to the schedule occurred when there were smaller
Team Member: Christopher Crock
Team Member: Aaron Lammers
Team Member: Brent Long
Team Member: Aaron Raak
Consultant: Tom Newhof
Client: Bruce Rydbeck
Advisor: Leonard DeRooy
Figure 2: Organization Chart
11 | P a g e
tasks that needed to be completed prior to the week or weeks they were to be delivered. Everyone
adjusted to the schedule well and the team never fell behind. No single person was in charge of the
schedule, but instead the team as a whole decided the schedule and kept everyone accountable. The
average amount of work each person put into the project was 10-15 hours a week. More work was put
into the project during the end of the semester and less at the beginning.
2.3 Budget
For this project there was not a budget specified by the customer. The, but HCJB did request the
wastewater treatment system to be economically feasible. See the section 3 Requirements for full details.
For every design decision, cost was a major factor. Although there was not a budget to follow, the team
addressed the necessity for a low cost system as much as possible.
2.4 Method of Approach
One of the requirements mentioned in section 3 Requirements is that the wastewater treatment system
must be a proven technology. That is to say, the design could not be created from scratch but based off
technologies that have already been implemented in the real world. The team approached the design by
researching various wastewater treatment systems in the world. There are several different constituents to
a wastewater system, so the team decided which ones were appropriate for the village of Carabuela. After
deciding which constituents were necessary, each team member took a specific part and researched
various types of units for their constituent. Remembering the design norms, the team agreed uponwhich
element would be used in the system. After all parts were decided, the next phase was to design a way to
unify the components as one complete system
3 Requirements
3.1 Performance Requirements
3.1.1 Water Effluent
The wastewater produced and discarded by the community needs to be treated to acceptable
levels. The effluent was treated to be used to irrigate a field of alfalfa, a crop not consumed
by humans. The relevant standards of the Ecuadorian government for wastewater effluents
used for agricultural purposes are zero helminth eggs and a coliform count of 1,000/100 mL.
The World Health Organization (WHO) sets the E. coli limit for leafy crops at 104 E. coli/
100mL; at this level of treatment, other pathogens are assumed to be treated as well (World
Health Organization, 2006).
12 | P a g e
1. Coliform count of <1000/100mL
2. BOD under 2.0 mg/L
3. <1 helminth eggs/100mL
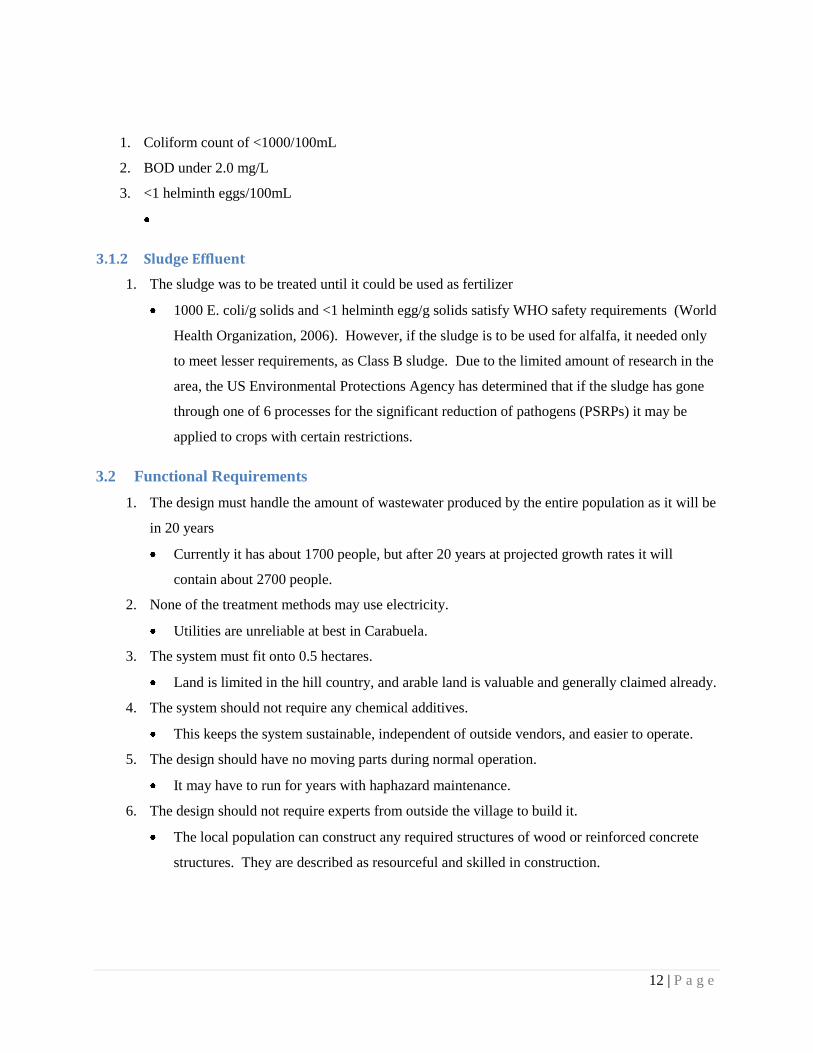
3.1.2 Sludge Effluent
1. The sludge was to be treated until it could be used as fertilizer
1000 E. coli/g solids and <1 helminth egg/g solids satisfy WHO safety requirements (World
Health Organization, 2006). However, if the sludge is to be used for alfalfa, it needed only
to meet lesser requirements, as Class B sludge. Due to the limited amount of research in the
area, the US Environmental Protections Agency has determined that if the sludge has gone
through one of 6 processes for the significant reduction of pathogens (PSRPs) it may be
applied to crops with certain restrictions.
3.2 Functional Requirements
1. The design must handle the amount of wastewater produced by the entire population as it will be
in 20 years
Currently it has about 1700 people, but after 20 years at projected growth rates it will
contain about 2700 people.
2. None of the treatment methods may use electricity.
Utilities are unreliable at best in Carabuela.
3. The system must fit onto 0.5 hectares.
Land is limited in the hill country, and arable land is valuable and generally claimed already.
4. The system should not require any chemical additives.
This keeps the system sustainable, independent of outside vendors, and easier to operate.
5. The design should have no moving parts during normal operation.
It may have to run for years with haphazard maintenance.
6. The design should not require experts from outside the village to build it.
The local population can construct any required structures of wood or reinforced concrete
structures. They are described as resourceful and skilled in construction.
13 | P a g e
3.3 Team Deliverables
PPFS
Final Report
Design notebooks
Team website
Operations and maintenance manual
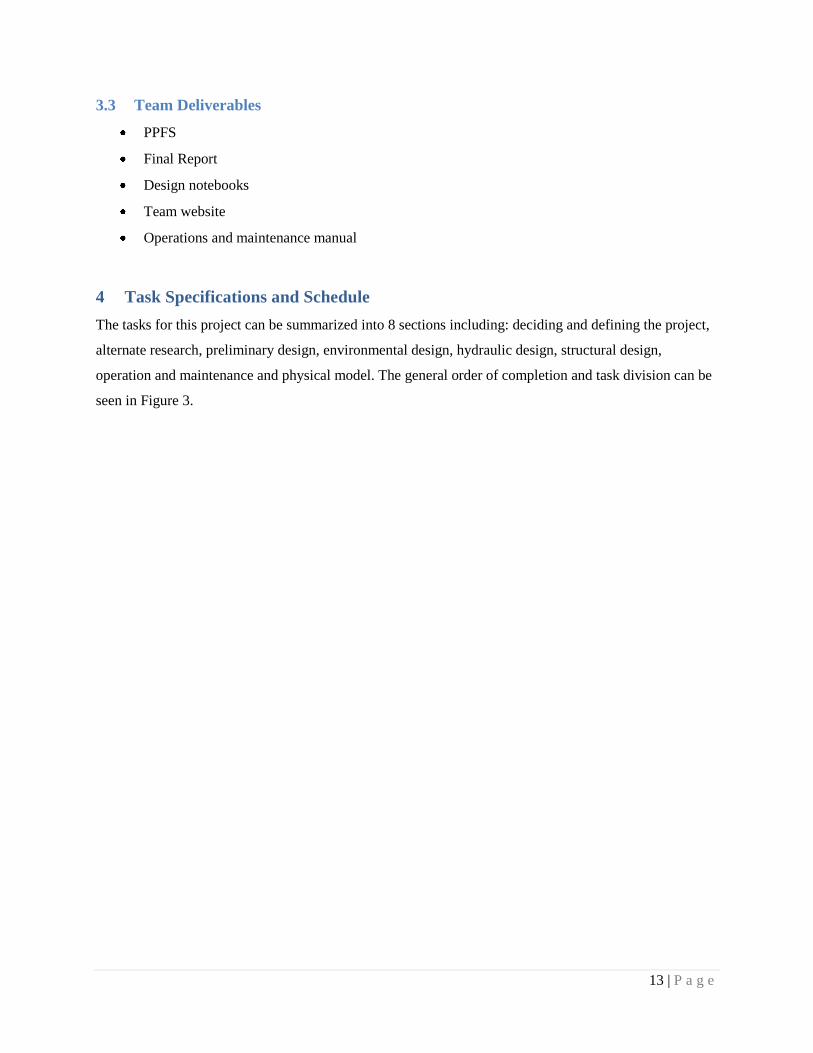
4 Task Specifications and Schedule
The tasks for this project can be summarized into 8 sections including: deciding and defining the project,
alternate research, preliminary design, environmental design, hydraulic design, structural design,
operation and maintenance and physical model. The general order of completion and task division can be
seen in Figure 3.
14 | P a g e
Figure 3: Task Specifications and Schedule
The task of deciding and defining the project was a full group task. Each member initially contacted
different non-profit organizations and gathered potential projects. The team met and decided on the most
feasible project. From that point the team was in contact with Bruce Rydbeck with HCJB to define what
15 | P a g e
the project entailed. The team was able to define the general plan for treatment. With this plan, the team
was then able to divide the process into four components that each member began to research. Chris
Crock worked on preliminary treatment, Aaron Lammers worked on primary treatment Brent Long
worked on tertiary treatment and Aaron Raak worked on sludge treatment. After much research, the team
met again and discussed the alternatives and chose components for the preliminary design. Each member
then started the preliminary design on the component they researched. The combination of the alternative
research and the preliminary design culminated in the Project Plan and Feasibility Study (PPFS). The
PPFS summarized all of the research and made recommendations as to the proposed components.
Directly following the PPFS, the team wrote a design memo that outlined how the project was going to be
completed in the next semester.
The next step in the design process was to complete the environmental designs and hydraulic analysis.
For this task the team broke into two sub-teams to better utilize time a resources. Chris Crock and Aaron
Lammers worked on the environmental design while Brent Long and Aaron Raak worked on the
hydraulic analysis. Out of this environmental work, the sizes for all environmental components were
completed along with a detailed hydraulic analysis of the impact of rainfall on the influent flows. Next the
group once again divided up the components to complete the structural designs and drawings for each
component. Chris Crock worked on the Imhoff tank (with help from Aaron Lammers), Aaron Lammers
worked on the bar racks and grit chamber, Brent Long worked on the lagoon system and Aaron Raak
worked on the sludge drying beds. To complete the wastewater system, it was necessary to create a
maintenance and operations manual to be given to the residents of Carabuela. This task was divided into
each component, and each member wrote the section that they had initially researched. The final
component of this project was the physical model. This model was constructed to increase the
understanding about the design and to test simple hydraulics. This task was completed at various times
throughout the spring semester. A final design report and plan set was sent to Bruce Rydbeck at HCJB to
be presented to the residents of Carabuela as an alternative solution to their current wastewater problem.
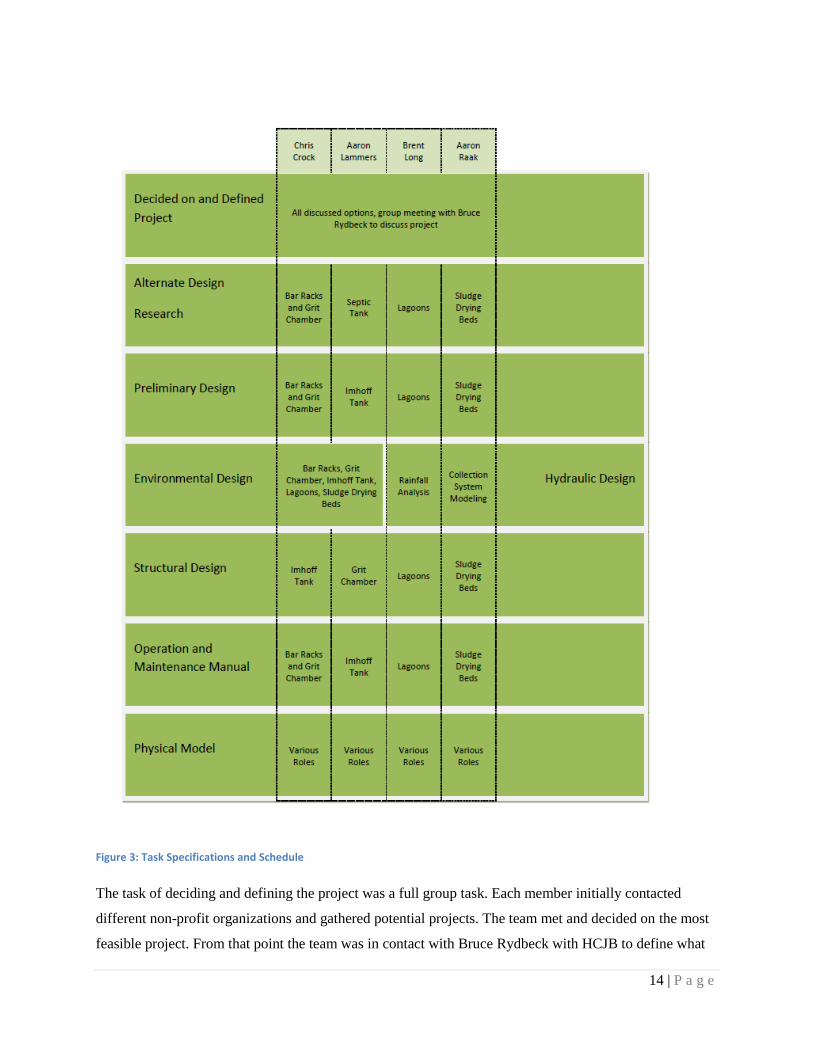
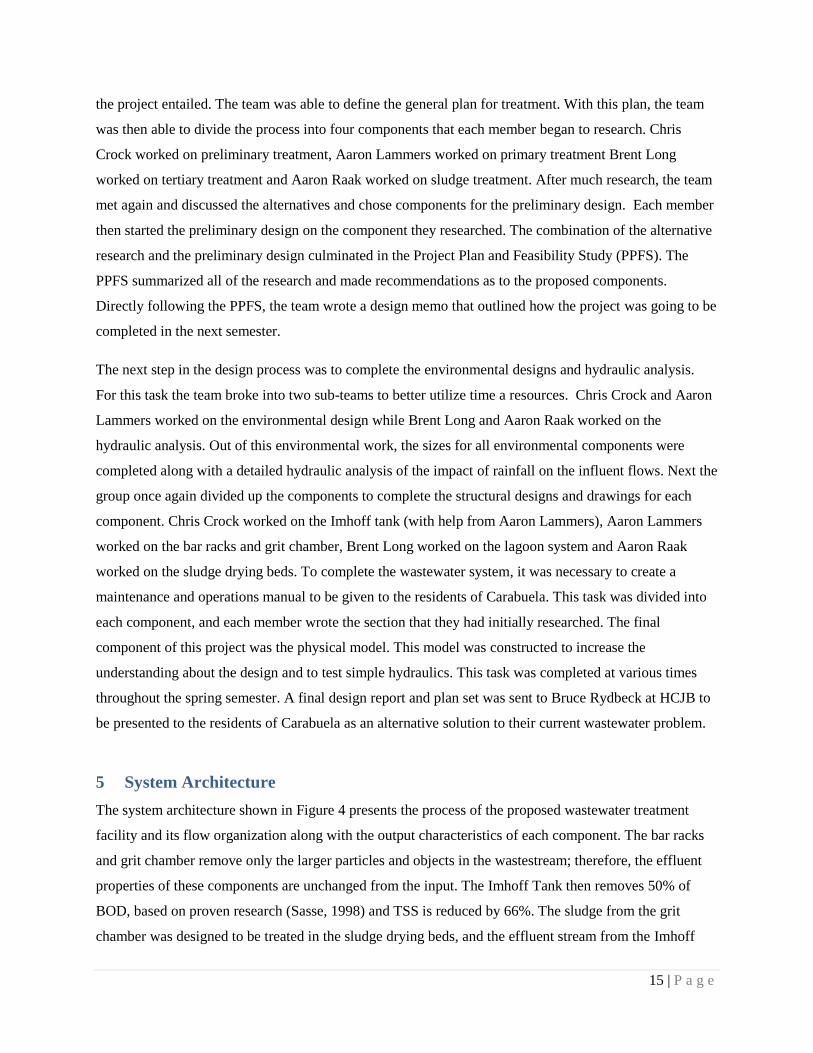
5 System Architecture
The system architecture shown in Figure 4 presents the process of the proposed wastewater treatment
facility and its flow organization along with the output characteristics of each component. The bar racks
and grit chamber remove only the larger particles and objects in the wastestream; therefore, the effluent
properties of these components are unchanged from the input. The Imhoff Tank then removes 50% of
BOD, based on proven research (Sasse, 1998) and TSS is reduced by 66%. The sludge from the grit
chamber was designed to be treated in the sludge drying beds, and the effluent stream from the Imhoff
16 | P a g e
Tank was routed to stabilization lagoons where pathogen and BOD levels are further reduced to levels
acceptable for irrigation reuse. The final effluent from the stabilization ponds was treated for irrigation of
a nearby alfalfa field for animal consumption.
Figure 4: System Architecture
17 | P a g e
6 Design Criteria
Carabuela, Ecuador required a specific wastewater treatment system that appropriately treated their
wastewater with the effluent to be used for irrigation. For Carabuela, the approach for design followed
specific design norms that fit with the customer. WasteWatchers developed seven criteria that resolve the
challenges in the design of the wastewater treatment facility:
1. Effective Treatment
a. Appropriate BOD levels
b. Reduction in TSS
c. Appropriate pathogen removal for irrigation reuse
2. Culturally Appropriate
a. Local materials used for construction
b. Local construction methods and practices
c. Proven Technology - similar wastewater treatment cases
3. Sustainability
a. No electricity
b. Lower levels of sophistication
4. Site Appropriate
a. Plan view footprint
b. Required equipment for construction
5. Low Cost
a. Cost of construction
b. Cost of maintenance
6. User Friendliness
a. Transparency
b. Trustworthiness
c. Simplicity in operation
7. Life of Design
6.1 Bar Rack
Although the screening process of wastewater treatment is fairly simple (even more so for manually
cleaned screens), the design norms and criteria of WasteWatchers heavily affected the design of this unit
process because of the importance in removal of screenings in the waste stream. Design norms were the
same for each unit process, but the details within each norm and criteria differ for each component.
18 | P a g e
Within the bar rack component, certain criteria were weighted heavier than others, these being: cultural
appropriateness, user-friendliness, and effective treatment. Cultural appropriateness was important
because of the simplicity of a bar rack. The user-friendliness of the bar rack was important, as
maintenance for this component should be simple and easy to maintain. As with all components, the
effective treatment was also important for the design.
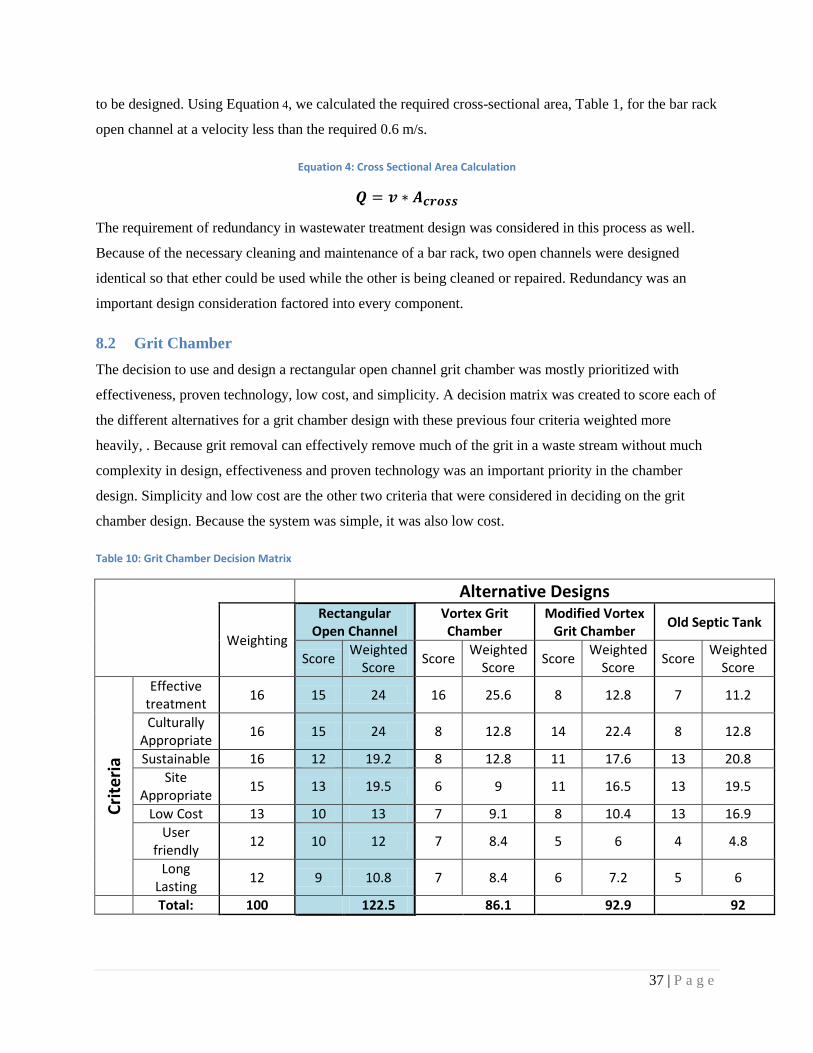
6.2 Grit Chamber
As the second unit process in the treatment facility, the grit chamber is crucial for removing settleable
solids, yet scouring organics so that they will continue downstream. This stage of the process was
designed using the same criteria as the screening but with changes in the scoring and alternatives. Again,
the system was designed with the customer in mind, and the design norms were a major component in the
design of the grit chamber.
Because the grit chamber is important in preliminary treatment, the design decisions were heavily
weighted by the effectiveness of the design, user-friendliness, and low cost. With these criteria most
heavily weighted, the design decisions were influenced.
6.3 Imhoff tank
The essential design criteria for choosing a primary treatment method for this location were effective
treatment, cultural appropriateness, sustainability, and site appropriateness. Effective treatment was
crucial because if the system does not effectively treat the water its benefit would not outweigh the
necessary cost to construct. Cultural appropriateness was crucial to the decision of a primary treatment
method because of the capital cost associated with its construction and the necessity of a proven
technology. Primary treatment alternatives were typically expensive and required intricate construction.
It was necessary to design a component that can be built by the local people with materials that are also
local. Local workers and materials would lower the construction cost significantly as compared to the
alternative. Sustainability is vital because of the remoteness of the location. The design must not require
electricity because of the limited access to electrical power. Because of the rural nature of the location,
there are no major electrical sources near enough to provide constant power to a wastewater treatment
facility. The design must also have a low level of sophistication so that the local residents can be easily
trained to operate and maintain the system. Site appropriateness is crucial because some alternatives for
primary treatment are very effective and lower costs but would not be possible to construct based on land
19 | P a g e
availability and terrain. These four design criteria were the most crucial but all design criteria were
considered when deciding the optimal alternative.
6.4 Lagoon System
The criteria that were used in selecting the lagoon system consists the following: effective treatment,
cultural appropriateness, sustainability, site appropriateness, low cost, user friendliness and its length of
life. Out of these criteria, the most important ones that were considered were effective treatment and
cultural appropriateness. Because this is the last step in the treatment process before wastewater is
discharged, it is important that the waste is well treated. Cultural appropriateness plays in when deciding
the sophistication of the system. The lagoon system should not comprise any electrical equipment as this
would conflict with the culture of the people.
6.5 Sludge Treatment
For sludge treatment, sustainability and cultural appropriateness took precedence because in Carabuela
the largest danger of poor treatment comes from not having any treatment system in place. If the design
was not appropriate to the site, it could not be built, so all systems must fit onto the land available for
water treatment and be constructed with local materials. Effective treatment was also one of the most
important criteria; in this case, treatment means drying the sludge out until it can be handled like a solid,
and preferably used as fertilizer. Low cost was important to a relatively poor village, but if HCJB or the
government of Ecuador can be persuaded to fund the project in part or in whole then cost becomes
slightly less important. It is important that the sludge treatment be simple to use, but transparency was
less than vital. All the systems feasible for sludge treatment in rural use will easily last through the design
life of the overall system.
7 Design Alternatives
7.1 Bar racks
7.1.1 Introduction:
The first unit process in the treatment of wastewater is screening. In this unit process, larger, coarse solids
are removed through a system of bars or screens, and units that use parallel bars or rods are usually called
bar racks or bar screens. Because screening is the first unit process in wastewater treatment, it is
important that the system works properly, so processes further downstream are not inhibited by
screenings that would otherwise be allowed through the system. Screening helps to prevent the systems
20 | P a g e
downstream from being corrupted by ―rags and floatables‖ (wood, trash, large rocks, plastic, etc.), or
screenings, and help to produce the most effective treatment of wastewater. The screening process uses
either coarse or fine bar screens that can be mechanically or manually raked. Because mechanically raked
bar screens require power, the recommended technology for Carabuela, Ecuador would be a manually
raked, coarse bar screen, which would remove ―rags and floatables‖ in the range of 25-50 mm (Vesilind,
2003).
Three different components were considered in the design of the bar racks. These components were a
mesh screen fitted to the inlet of the grit chamber, a mesh cage that would lie on the bottom of the grit
chamber to catch ‗rags and floatables‘, and finally a set of racks made from rebar in a separate chamber
from the grit chamber. The decision matrix, , shows that the open channel with rebar bar racks as the
selected component.
7.1.2 Design Considerations for Inclined Bar Racks
The design of bar screens does not involve complex equations, but the understanding of the factors and
considerations are important to a design which requires little maintenance, no power, and long life. Listed
below are considerations that need to be thoroughly accounted for in the design of bar screens.
Manually cleaned screens demand frequent cleaning, so as to prevent clogging and the possibility
of flow surges when debris is removed.
A flow surge could cause ineffective grit removal and organics downstream.
The angle of incline is important as to provide effective area that minimizes headloss, while
maximizing the ease of cleaning.
Maximum approach velocities must be within the range 0.3 - 0.6 m/s for maximum flows in order
to prevent dislodgment or disintegration of larger particles.
Maximum velocities through the bar screen should be < 1 m/s to prevent dislodgment or
disintegration of larger particles.
Clear openings between bars are the most important factor in the design for removal quantities.
The purpose of screening is not to remove the organic matter, rather the large inorganics, wood,
trash, etc. because processes downstream will perform the organic removal process.
Accepted practice calls for a minimum headloss through a manually cleaned bar screen of 150
mm (fairly clean) and a maximum of 760 mm (clogged).
A drainage area for screenings is needed before shoveling and burial or delivery to the drying
beds.

21 | P a g e
o Nonslip platforms deserve special attention for cleaning and removal of screenings for
the workers.
o The drainage area must provide enough volume to store screenings long enough for
dewatering. (Vesilind, 2003)
Manually cleaned screens require frequent cleaning to prevent any clogging and excessive headloss, and
the frequency of cleaning will depend on the flows and also the quantity of screenings that are present in
the raw wastewater. The clear space of the bar rack was important in determining the amount of
screenings that will be removed and the characteristics of the screenings. Table 2 provides that the
openings between parallel bars would be 20 - 50 mm. The screening of excreta may create hygiene issues
with workers who must manually rake the rack and in the disposal of the screenings, therefore a proper
size that allows excreta to flow through but stops ―rags and floatables‖ should be considered. Quantities
and characteristics of coarse screenings can be seen in Table 2, and these values would be used to
calculate volume needs for treatment beds of sludge and also for the short-term storage on the drainage
area for screening.
Table 2 shows that the velocities through the screens should be limited to 0.6 m/s to prevent deposition or
displacement of any grit or rags and floatables (Mara, 2004), and due to the low flow system of Carabuela
(8 m3/person/month) this velocity was met with a minimum cross-section area of the influent channel of
only a couple centimeters. Because of the small required cross-sectional area of the channel, it was
suggested to use the designed channel height with a freeboard, the distance between the maximum water
surface elevation (WSE) and the top edge of the channel, of 0.5 meter, 0.76 meters for headloss, 0.037
meters for required minimum height of the wetted perimeter. The total height of the channel is suggested
to be 1.3 m. The channel width requires a total of 0.3 m, which includes the clear space and the bar
widths. The calculations used for determining the width of the channel can be seen in Table 1.
22 | P a g e
Table 1: Channel Width Calculations
98 m3/day Flow Rate (est.)
196 m3/day Max. Flow (est.)
0.00269 m3/s Max Flow
0.579 m/s Maximum approach velocity
207.6 cm^2 Flow Area for Approaching Channel (bars not accounted)
10.38 cm Channel Height (headloss and freeboard not accounted)
20.0 cm Channel Width (bars not accounted)
11.13 mm Bar thickness (#3 rebar)
20.0 mm Clear Spacing
6 #3 Rebar Required number of bars
155 mm Appropriate headloss for clean screens
760 mm Appropriate headloss for clogged screens
0.50 m Freeboarding
0.60 m Channel Height (w/ freeboard and headloss)
0.20 m Channel Width (bars accounted for)
207.6 cm^2 Cross Sectional Area of Approaching Channel
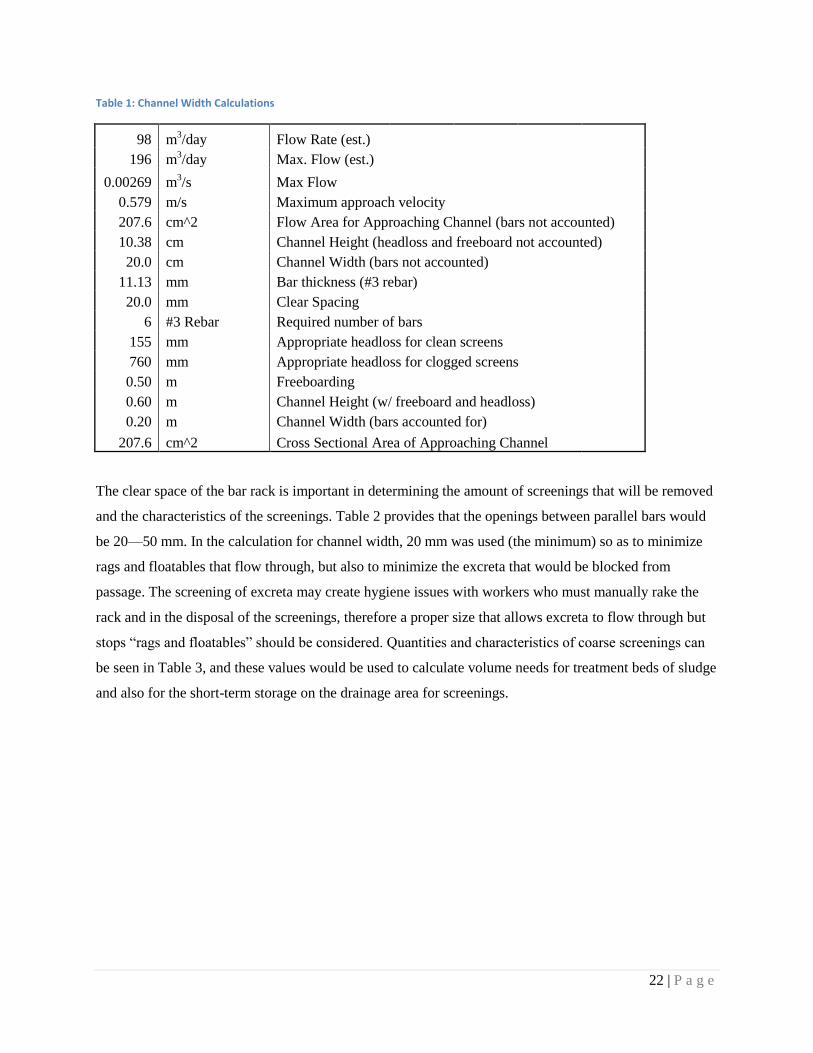
The clear space of the bar rack is important in determining the amount of screenings that will be removed
and the characteristics of the screenings. Table 2 provides that the openings between parallel bars would
be 20—50 mm. In the calculation for channel width, 20 mm was used (the minimum) so as to minimize
rags and floatables that flow through, but also to minimize the excreta that would be blocked from
passage. The screening of excreta may create hygiene issues with workers who must manually rake the
rack and in the disposal of the screenings, therefore a proper size that allows excreta to flow through but
stops ―rags and floatables‖ should be considered. Quantities and characteristics of coarse screenings can
be seen in Table 3, and these values would be used to calculate volume needs for treatment beds of sludge
and also for the short-term storage on the drainage area for screenings.
23 | P a g e
Table 2: Typical Design Criteria for Coarse Screening Equipment
Item Range* Comment
Trash Rack Commonly used with a combined
sewer system Openings 38—150
Manually Cleaned Screen Used in small plants and bypass
channels Openings 20-50 mm
Approach Velocity 0.3—0.6 m/s
Mechanically Cleaned
Openings 25—50 mm
Approach Velocity, Maximum 0.6—1.2 m/s
Approach Velocity, Minimum 0.3—0.6 m/s
Continuous Screen
Openings 6—38 mm Ineffective in the 6—18 mm
range
Approach Velocity, Maximum 0.6—1.2 m/s
Approach Velocity, Minimum 0.3—0.6 m/s
Allowable Headloss 0.15—0.6 m *Values from US EPA 1979, 1987; WPCF, 1989
Table 3: Typical Design Properties for coarse Screenings
Item Range* Comment
Quantities
Separate Sewers
Average screenings per
1000 m3 wastewater
3.5—35L/1000m3 Function of the screen opening
space
Peaking Factor (hourly flow) 1:1—5:1
Combined Sewers
Average screenings per
1000 m3 wastewater
3.5—84L/1000m3 Function of the screen opening
space
Peaking Factor (hourly flow) 2:1-- > 20:1
Solids Content 10-20 %
Bulk Density 640—1100 kg/m3
Volatile Content 70-95 %
Fuel Value 12,600 kJ/kg *Values from US EPA 1979, 1987; WPCF, 1989
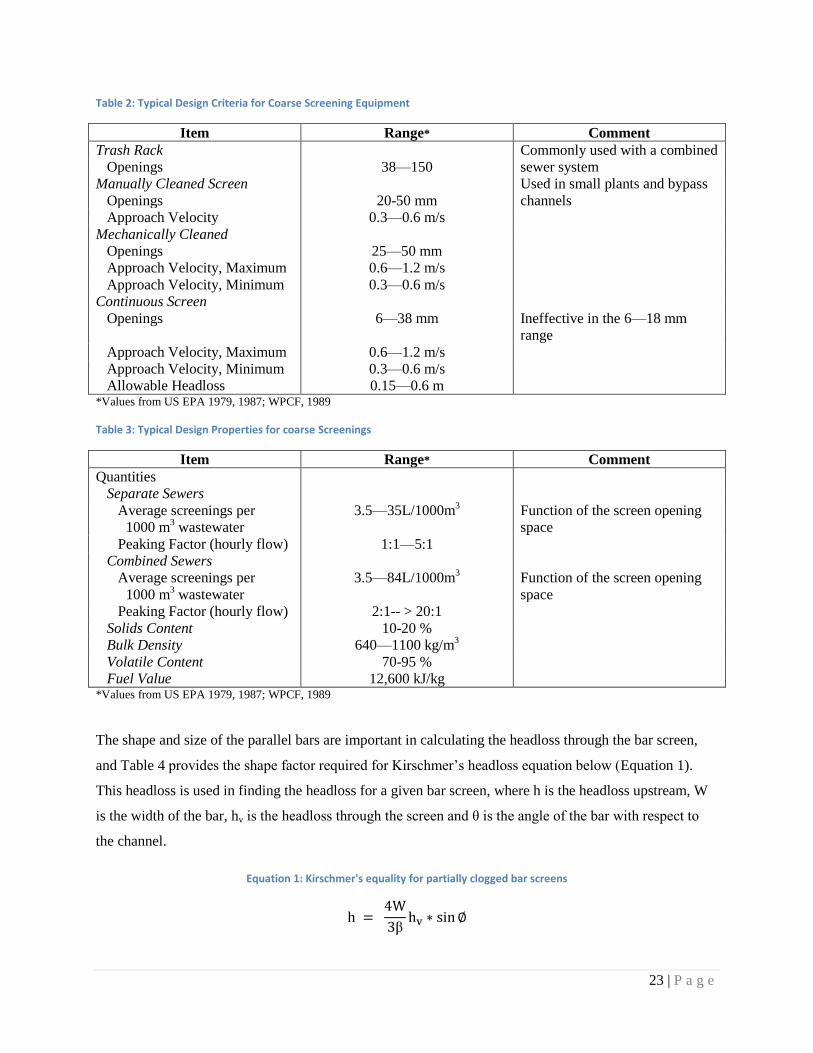
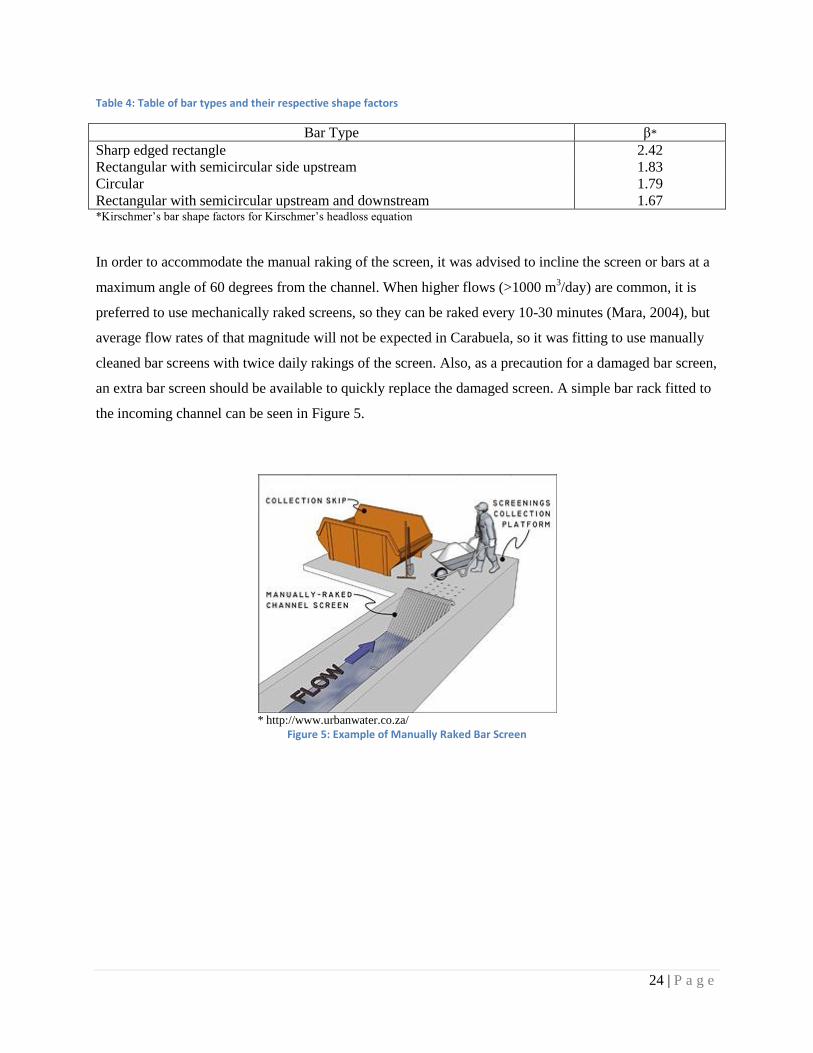
The shape and size of the parallel bars are important in calculating the headloss through the bar screen,
and Table 4 provides the shape factor required for Kirschmer‘s headloss equation below (Equation 1).
This headloss is used in finding the headloss for a given bar screen, where h is the headloss upstream, W
is the width of the bar, hv is the headloss through the screen and θ is the angle of the bar with respect to
the channel.
Equation 1: Kirschmer's equality for partially clogged bar screens
24 | P a g e
Table 4: Table of bar types and their respective shape factors
Bar Type β*
Sharp edged rectangle 2.42
Rectangular with semicircular side upstream 1.83
Circular 1.79
Rectangular with semicircular upstream and downstream 1.67 *Kirschmer‘s bar shape factors for Kirschmer‘s headloss equation
In order to accommodate the manual raking of the screen, it was advised to incline the screen or bars at a
maximum angle of 60 degrees from the channel. When higher flows (>1000 m3/day) are common, it is
preferred to use mechanically raked screens, so they can be raked every 10-30 minutes (Mara, 2004), but
average flow rates of that magnitude will not be expected in Carabuela, so it was fitting to use manually
cleaned bar screens with twice daily rakings of the screen. Also, as a precaution for a damaged bar screen,
an extra bar screen should be available to quickly replace the damaged screen. A simple bar rack fitted to
the incoming channel can be seen in Figure 5.
* http://www.urbanwater.co.za/
Figure 5: Example of Manually Raked Bar Screen
25 | P a g e
7.2 Grit Chamber
7.2.1 Introduction:
Grit Removal follows the unit process of screening and removes grit (heavy metals and sand) as to
prevent any unnecessary abrasion of equipment downstream and accumulation of grit in the biological
processes downstream. With the high presence of grit in combined sewer, it is necessary to achieve the
appropriate levels of removal for our customer (Vesilind, 2003). Grit materials have a greater settling
velocity than do organic materials and therefore can be removed without removing organics, which are
needed for the digestion process downstream in the Imhoff tank or waste stabilization lagoons.
Grit quantities and attributes are important considerations in design to have minimum negative effects on
processes downstream. Because attributes differ among treatment facilities and other requirements such
as: headloss, space, removal efficiency, organic content, and economics, a number of processes exist.
Some of these are: Aerated grit chambers, Vortex-type, Detritus tank, and Hydroclonic (Vesilind, 2003).
The alternatives that were considered are the vortex grit chamber, a modified vortex grit chamber, the old
septic tank, and a rectangular grit chamber.
7.2.2 Vortex Grit Chamber
A vortex grit chamber uses the similar principles of a cyclonic air filter used in coal burning plants; the
similarity is how the vortex facilitates the settling of heavier grit particles to a sump, while returning the
lighter organic matter to the effluent flow. The benefits of this design would be a low headloss in the
system and an efficient removal of grit from the stream. However, the design would not be sufficient
unless electricity was used because of the need for pumps to remove the grit and also to create a vortex.
7.2.3 Modified Vortex Chamber
Using the same principle of the electrically powered vortex chamber, the modified chamber would
function without the need of electricity. Multiple fifty gallon drum barrels could be used to create a grit
chamber that manipulates the in-flow stream to create a low flow vortex without the need of pumps.
Baffles would be used to control the geometry of the flow into a circular, vortex pattern. The hope would
be to provide enough scour to allow organic material to continue suspended, while providing enough
residence time for grit to settle and be collected in a sump. The grit could then be removed by opening a
valve connected to the sump. This design allowed for the use of a vortex grit chamber with slight
modifications; however, this chamber has not been used and is not ‗proven‘.
26 | P a g e
7.2.4 Old Septic Tank
With sustainability being an important criterion, recycling the old septic tank was attractive to
WasteWatchers‘ design; otherwise, the septic tank would be left unused. The length to width ratio was
already appropriate for a grit chamber, but the cross sectional area was larger than needed. The design of
a grit chamber from a recycled septic tank would involve removing the top concrete so that access to the
chamber would be easier, allowing maintenance of the chamber. The principles for grit removal in a
septic tank is similar to that of an open channel used to remove grit, large particles settle because of
decreased velocity of the water, while leaving organics in the stream because of scour. WasteWatchers
concluded that the septic tank was too large to function as a grit chamber (scour could not be provided to
create lift and allow organic matter to remain in the flow stream).
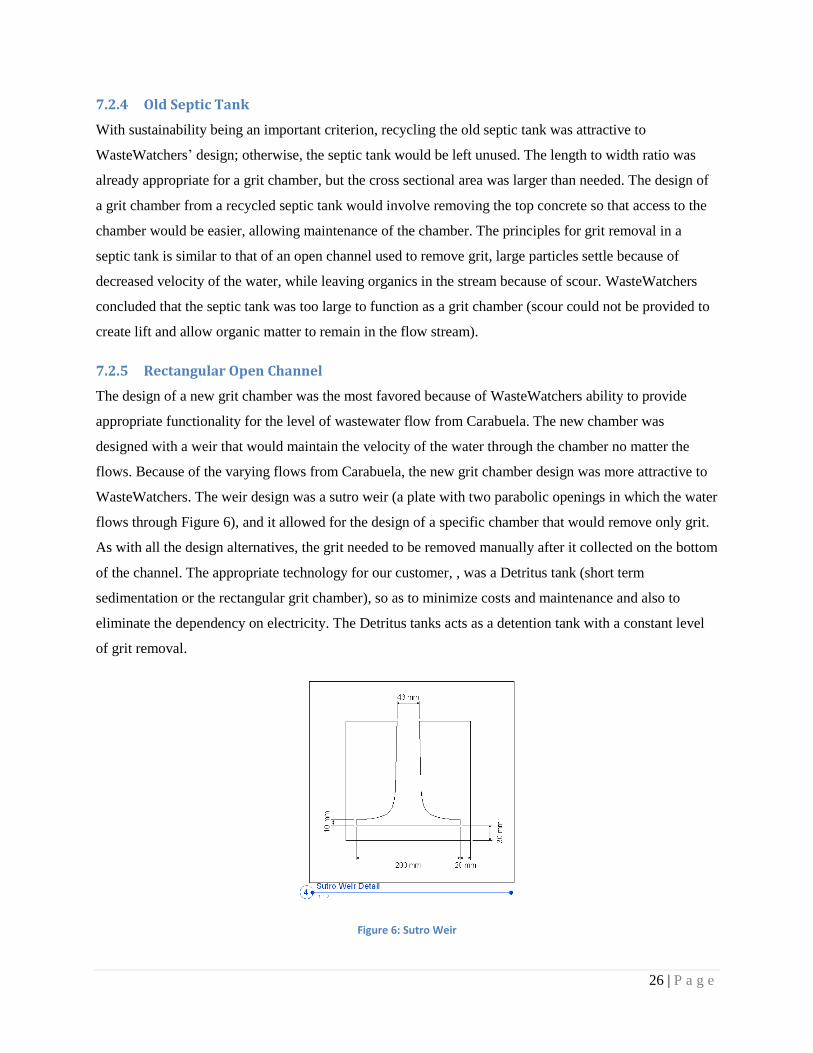
7.2.5 Rectangular Open Channel
The design of a new grit chamber was the most favored because of WasteWatchers ability to provide
appropriate functionality for the level of wastewater flow from Carabuela. The new chamber was
designed with a weir that would maintain the velocity of the water through the chamber no matter the
flows. Because of the varying flows from Carabuela, the new grit chamber design was more attractive to
WasteWatchers. The weir design was a sutro weir (a plate with two parabolic openings in which the water
flows through Figure 6), and it allowed for the design of a specific chamber that would remove only grit.
As with all the design alternatives, the grit needed to be removed manually after it collected on the bottom
of the channel. The appropriate technology for our customer, , was a Detritus tank (short term
sedimentation or the rectangular grit chamber), so as to minimize costs and maintenance and also to
eliminate the dependency on electricity. The Detritus tanks acts as a detention tank with a constant level
of grit removal.
Figure 6: Sutro Weir
27 | P a g e
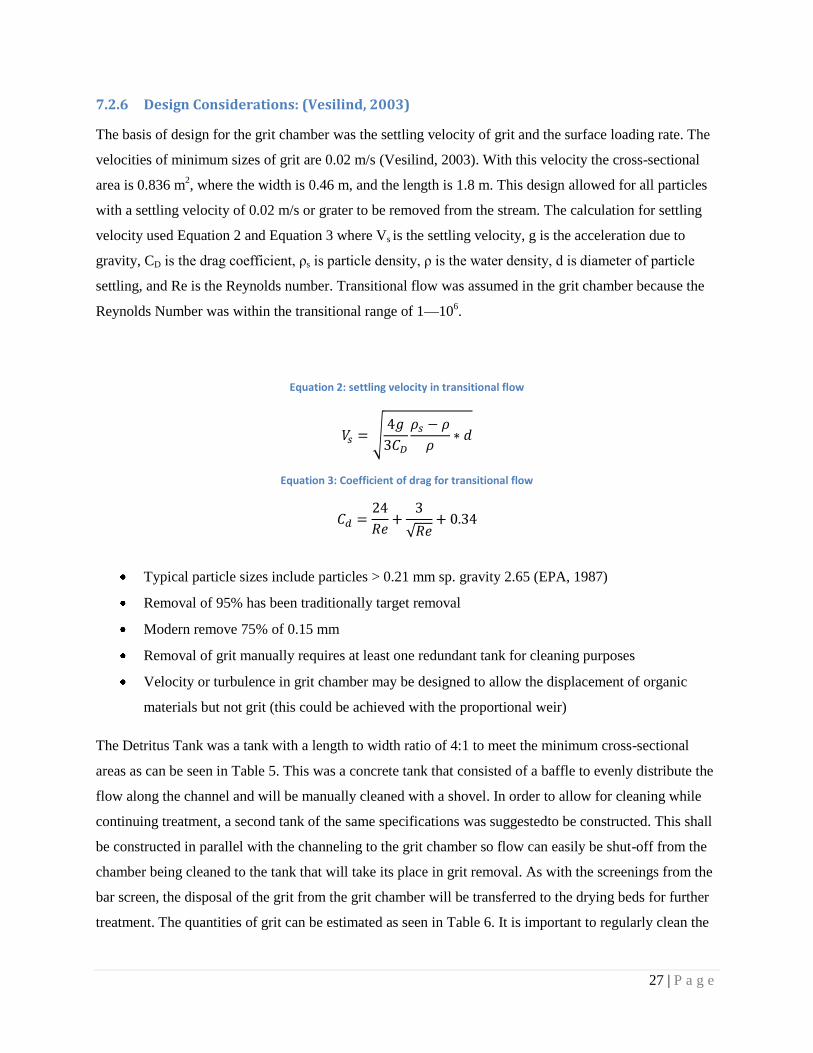
7.2.6 Design Considerations: (Vesilind, 2003)
The basis of design for the grit chamber was the settling velocity of grit and the surface loading rate. The
velocities of minimum sizes of grit are 0.02 m/s (Vesilind, 2003). With this velocity the cross-sectional
area is 0.836 m2, where the width is 0.46 m, and the length is 1.8 m. This design allowed for all particles
with a settling velocity of 0.02 m/s or grater to be removed from the stream. The calculation for settling
velocity used Equation 2 and Equation 3 where Vs is the settling velocity, g is the acceleration due to
gravity, CD is the drag coefficient, ρs is particle density, ρ is the water density, d is diameter of particle
settling, and Re is the Reynolds number. Transitional flow was assumed in the grit chamber because the
Reynolds Number was within the transitional range of 1—106.
Equation 2: settling velocity in transitional flow
Equation 3: Coefficient of drag for transitional flow
Typical particle sizes include particles > 0.21 mm sp. gravity 2.65 (EPA, 1987)
Removal of 95% has been traditionally target removal
Modern remove 75% of 0.15 mm
Removal of grit manually requires at least one redundant tank for cleaning purposes
Velocity or turbulence in grit chamber may be designed to allow the displacement of organic
materials but not grit (this could be achieved with the proportional weir)
The Detritus Tank was a tank with a length to width ratio of 4:1 to meet the minimum cross-sectional
areas as can be seen in Table 5. This was a concrete tank that consisted of a baffle to evenly distribute the
flow along the channel and will be manually cleaned with a shovel. In order to allow for cleaning while
continuing treatment, a second tank of the same specifications was suggestedto be constructed. This shall
be constructed in parallel with the channeling to the grit chamber so flow can easily be shut-off from the
chamber being cleaned to the tank that will take its place in grit removal. As with the screenings from the
bar screen, the disposal of the grit from the grit chamber will be transferred to the drying beds for further
treatment. The quantities of grit can be estimated as seen in Table 6. It is important to regularly clean the
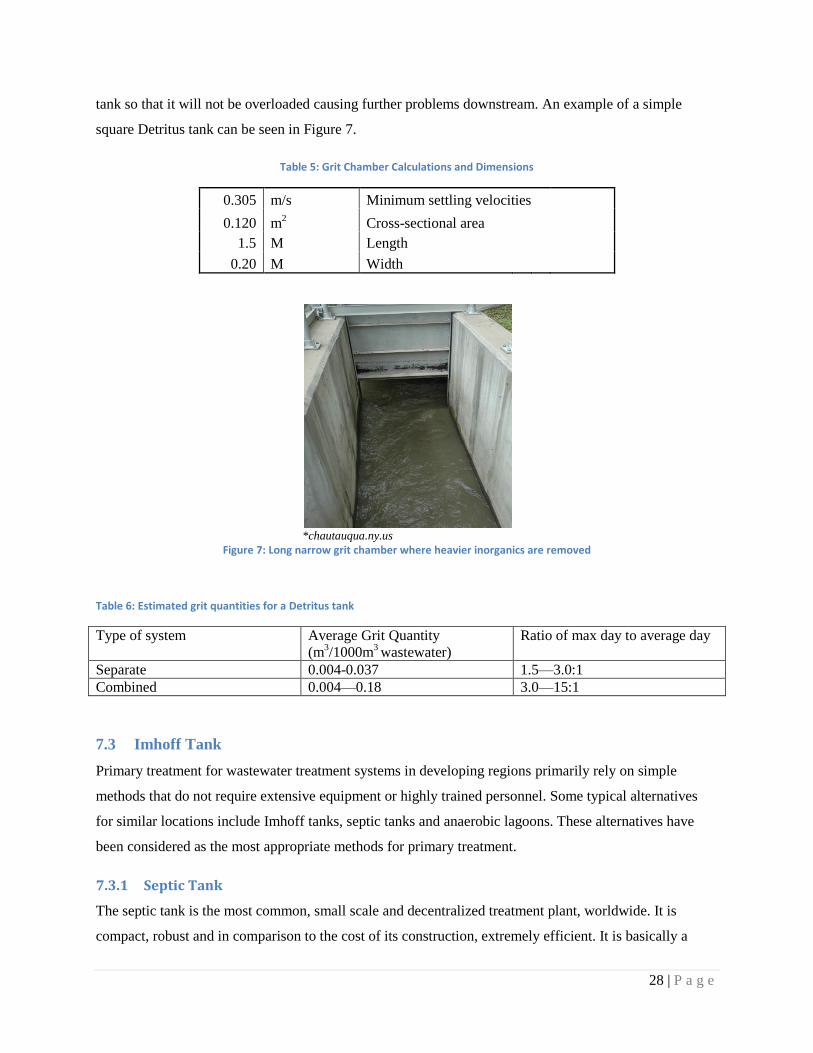
28 | P a g e
tank so that it will not be overloaded causing further problems downstream. An example of a simple
square Detritus tank can be seen in Figure 7.
Table 5: Grit Chamber Calculations and Dimensions
0.305 m/s Minimum settling velocities
0.120 m2 Cross-sectional area
1.5 M Length
0.20 M Width
*chautauqua.ny.us
Figure 7: Long narrow grit chamber where heavier inorganics are removed
Table 6: Estimated grit quantities for a Detritus tank
Type of system Average Grit Quantity
(m3/1000m
3 wastewater)
Ratio of max day to average day
Separate 0.004-0.037 1.5—3.0:1
Combined 0.004—0.18 3.0—15:1
7.3 Imhoff Tank
Primary treatment for wastewater treatment systems in developing regions primarily rely on simple
methods that do not require extensive equipment or highly trained personnel. Some typical alternatives
for similar locations include Imhoff tanks, septic tanks and anaerobic lagoons. These alternatives have
been considered as the most appropriate methods for primary treatment.
7.3.1 Septic Tank
The septic tank is the most common, small scale and decentralized treatment plant, worldwide. It is
compact, robust and in comparison to the cost of its construction, extremely efficient. It is basically a
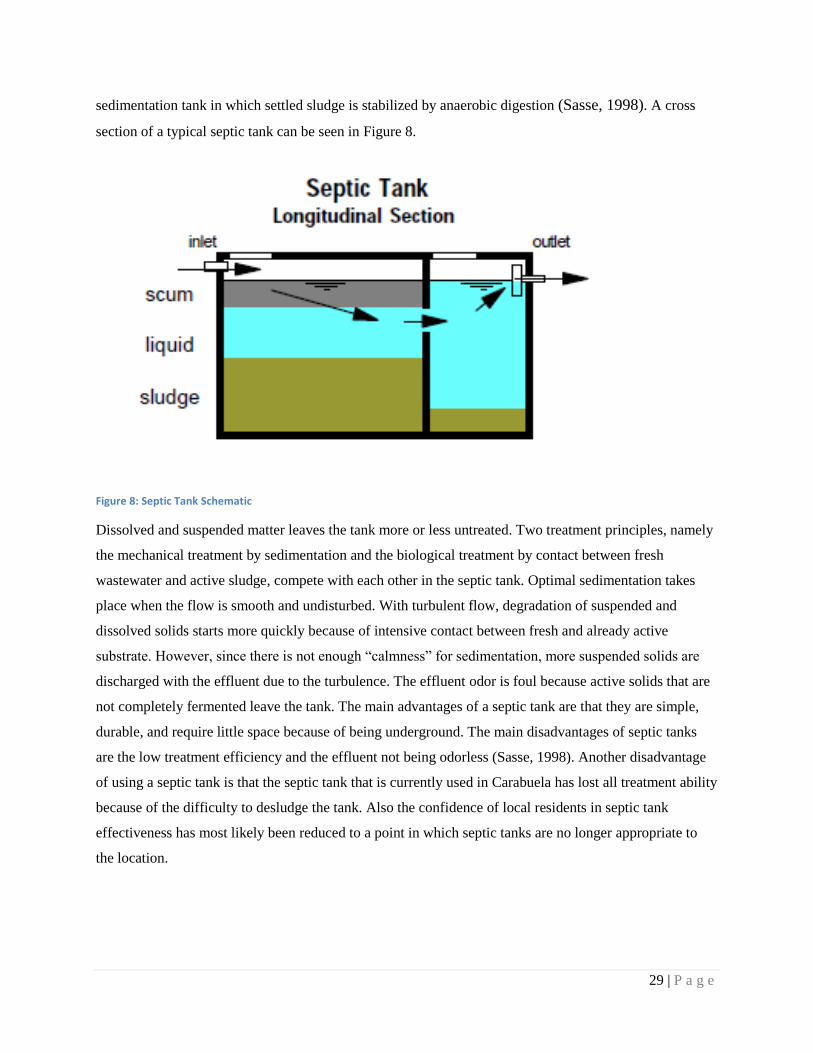
29 | P a g e
sedimentation tank in which settled sludge is stabilized by anaerobic digestion (Sasse, 1998). A cross
section of a typical septic tank can be seen in Figure 8.
Figure 8: Septic Tank Schematic
Dissolved and suspended matter leaves the tank more or less untreated. Two treatment principles, namely
the mechanical treatment by sedimentation and the biological treatment by contact between fresh
wastewater and active sludge, compete with each other in the septic tank. Optimal sedimentation takes
place when the flow is smooth and undisturbed. With turbulent flow, degradation of suspended and
dissolved solids starts more quickly because of intensive contact between fresh and already active
substrate. However, since there is not enough ―calmness‖ for sedimentation, more suspended solids are
discharged with the effluent due to the turbulence. The effluent odor is foul because active solids that are
not completely fermented leave the tank. The main advantages of a septic tank are that they are simple,
durable, and require little space because of being underground. The main disadvantages of septic tanks
are the low treatment efficiency and the effluent not being odorless (Sasse, 1998). Another disadvantage
of using a septic tank is that the septic tank that is currently used in Carabuela has lost all treatment ability
because of the difficulty to desludge the tank. Also the confidence of local residents in septic tank
effectiveness has most likely been reduced to a point in which septic tanks are no longer appropriate to
the location.
30 | P a g e
7.3.2 Imhoff Tank
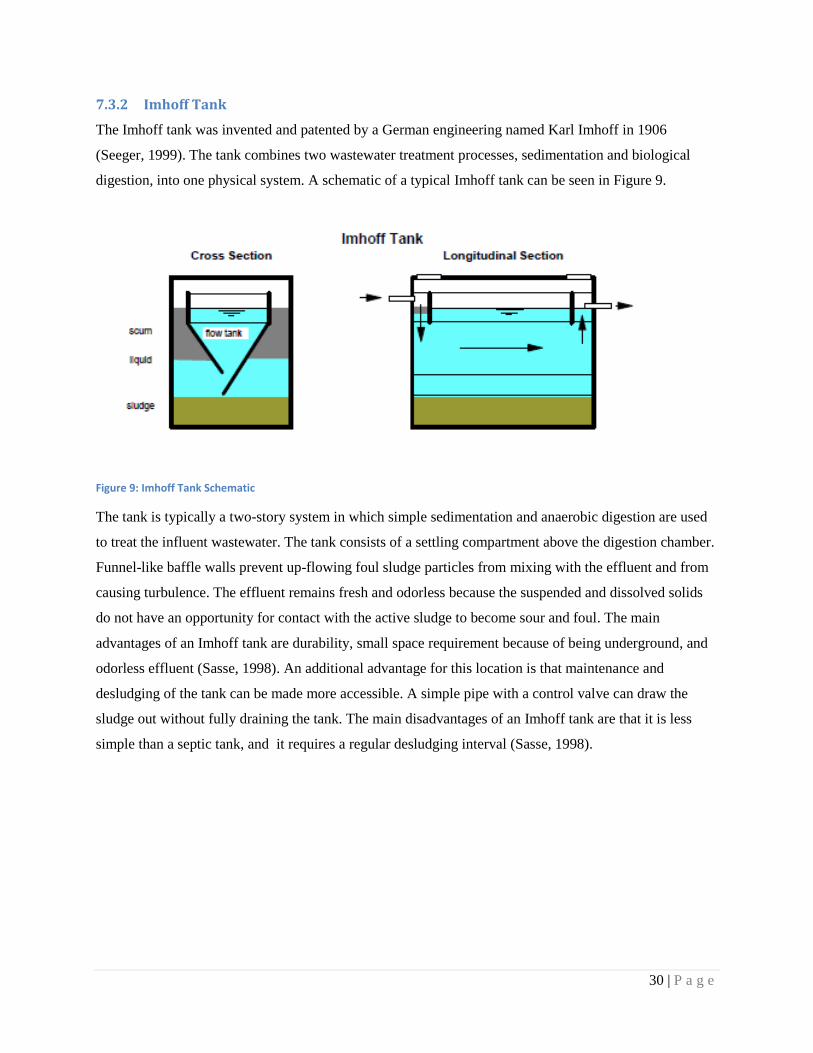
The Imhoff tank was invented and patented by a German engineering named Karl Imhoff in 1906
(Seeger, 1999). The tank combines two wastewater treatment processes, sedimentation and biological
digestion, into one physical system. A schematic of a typical Imhoff tank can be seen in Figure 9.
Figure 9: Imhoff Tank Schematic
The tank is typically a two-story system in which simple sedimentation and anaerobic digestion are used
to treat the influent wastewater. The tank consists of a settling compartment above the digestion chamber.
Funnel-like baffle walls prevent up-flowing foul sludge particles from mixing with the effluent and from
causing turbulence. The effluent remains fresh and odorless because the suspended and dissolved solids
do not have an opportunity for contact with the active sludge to become sour and foul. The main
advantages of an Imhoff tank are durability, small space requirement because of being underground, and
odorless effluent (Sasse, 1998). An additional advantage for this location is that maintenance and
desludging of the tank can be made more accessible. A simple pipe with a control valve can draw the
sludge out without fully draining the tank. The main disadvantages of an Imhoff tank are that it is less
simple than a septic tank, and it requires a regular desludging interval (Sasse, 1998).
31 | P a g e
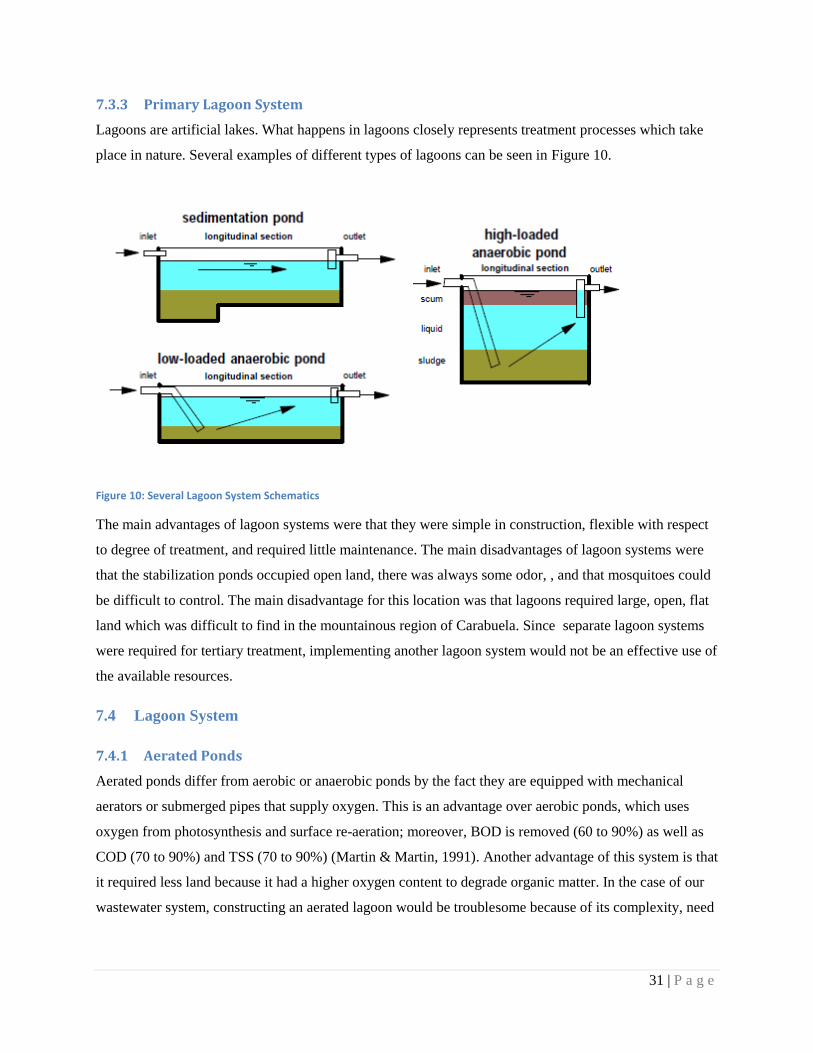
7.3.3 Primary Lagoon System
Lagoons are artificial lakes. What happens in lagoons closely represents treatment processes which take
place in nature. Several examples of different types of lagoons can be seen in Figure 10.
Figure 10: Several Lagoon System Schematics
The main advantages of lagoon systems were that they were simple in construction, flexible with respect
to degree of treatment, and required little maintenance. The main disadvantages of lagoon systems were
that the stabilization ponds occupied open land, there was always some odor, , and that mosquitoes could
be difficult to control. The main disadvantage for this location was that lagoons required large, open, flat
land which was difficult to find in the mountainous region of Carabuela. Since separate lagoon systems
were required for tertiary treatment, implementing another lagoon system would not be an effective use of
the available resources.
7.4 Lagoon System
7.4.1 Aerated Ponds
Aerated ponds differ from aerobic or anaerobic ponds by the fact they are equipped with mechanical
aerators or submerged pipes that supply oxygen. This is an advantage over aerobic ponds, which uses
oxygen from photosynthesis and surface re-aeration; moreover, BOD is removed (60 to 90%) as well as
COD (70 to 90%) and TSS (70 to 90%) (Martin & Martin, 1991). Another advantage of this system is that
it required less land because it had a higher oxygen content to degrade organic matter. In the case of our
wastewater system, constructing an aerated lagoon would be troublesome because of its complexity, need
32 | P a g e
for electricity, and cost. The people of Carabuela do not have the necessary resources or funds to operate
such a design. They are more interested in a design that is simpler and easier to operate and maintain.
7.4.2 Anaerobic Ponds
Anaerobic ponds are deeper than aerobic ponds, heavily loaded with strong organic waste, and contain
large amounts of anaerobic microorganisms that quickly deplete any oxygen that might be available in the
influent (Okun, 1975). These ponds are often used to treat strong organic industrial wastes. We would not
be interested in this type of stabilization pond because it is not as efficient as the other two. You would
see this types of pond used to convert methane gas into energy, which is a highly sophisticated process.
7.4.3 Aerobic Ponds
Aerobic ponds operate off microbial reactions. Organic materials are bio-oxidized, giving off CO2, NH3
and inorganic radicals. Algae use CO2, inorganic radicals and sunlight to produce dissolved oxygen in a
cyclic-symbiotic relationship (Reynolds & Richards, 1996). The principle advantage of this pond was that
it removed pathogens at a much lower cost than any other forms of treatment (Martin & Martin, 1991).
The deeper the lagoon, the less oxygen there will be at the bottom; therefore, designing a lagoon with a
shallow depth is optimal because more sunlight can penetrate throughout the pond creating a stronger
photosynthesis reaction. Carabuela is located high up in the mountains and achieves warm climate year-
round (50 – 72 degrees Fahrenheit). This is a great place to use an aerobic lagoon, which thrives off warm
temperature climates. There are two types of aerobic ponds. They differ by the total depth with one being
approximately 15 to 46 cm and the other being 1.5 meters deep. The shallow depth pond contains high
populations of algal growth and the other contains a high population of bacteria (Martin & Martin, 1991).
Aerobic ponds should be cleaned periodically. It is important to remove grass and other plant growth
from the surrounding area and in the pond itself. Floating scum on top of the lagoons should be removed,
or oxygen transfer is impaired. If large amounts of scum are either black or brown, this is an indication
that the lagoon is being overloaded (Martin & Martin, 1991).
7.5 Sludge Treatment Design Alternatives
After each treatment process, the sludge produced will need to be treated. Often this involves aerobic or
anaerobic digestion, but with an Imhoff tank this is done during the settling stage. The sludge will be
piped to the dewatering stage. This decreased the volume by up to three-quarters and makes the sludge
handle as a solid, ready for disposal. Dewatering can be done in dewatering beds, in drying lagoons, or
with mechanical systems including belt filters, centrifuges, and heat drying.
33 | P a g e
7.5.1 Mechanical Alternatives
The mechanical choices include belt filters, centrifuges, and heat drying. Belt filters use two moving
belts to squeeze water out of the sludge. Centrifuges use rotating chambers to separate the solid mass
from water. The various forms of heat drying use heat from electrical systems to dry the sludge. All of
these required complex machinery with trained operators, frequent maintenance, and electrical power.
They were thus not appropriate to Carabuela‘s situation.
7.5.2 Drying Lagoons
Drying lagoons operate simply, with little maintenance or operator input required. Sludge from the
primary treatment and digestion flows down into a lagoon 60-120 cm deep, and then dries by drainage
and evaporation. This can take from 1-3 years, with 10 years recommended by one source. Relatively
little research has been done into drying lagoons. The long drying time, with its requirement for new
lagoons, and the comparative lack of research disqualified this option, though otherwise it could be
suitable for decentralized wastewater operations such as the one in Carabuela.
7.5.3 Drying Beds
There are several types of dewatering beds: open-air sand beds, covered sand beds, and several more
recent types such as vacuum-assisted beds, paved drying beds, and wedge wire or plastic-bottomed beds.
Vacuum-assisted drying, wedge wire-bottomed beds, and plastic-bottomed beds all require substantial
energy inputs, chemical inputs, sophisticated equipment, and trained operators. They were therefore not
appropriate to the situation. This left open-air sand beds and covered sand beds as the practical choices.
Sand drying beds typically consist of a layer of gravel with underdrains, a layer of sand, and vertical
partitions. The gravel layer is typically 20-35 cm thick. The sand layer on top of it is typically 15-25 cm
thick. The pipes are no less than 10 cm in diameter and no more than six meters apart. The walls should
be watertight and extend at least 40 cm above and 15 cm below the sludge. Drying occurs by way of two
processes: percolation and evaporation. During percolation water from the sludge drains through the sand
and gravel layers and is carried out by the underdrains to the treatment lagoons. Percolation is complete
after one to three days, while evaporation takes from weeks to months, depending on the climate. The
sludge dries until it is approximately thirty-five percent solids, at which point it handles like a solid; it is
then manually removed and transported to land disposal or incineration. Covered drying beds have glass
over the beds, protecting them from rain and quickening evaporation. According to one older source,
covered drying beds generally cost about twice as much as open beds. This is only an approximation, and
the data comes from the 1930s, but construction methods have not significantly changed since then.
34 | P a g e
Relative prices of construction materials may have changed, but it gave a general view of the relative
costs of the alternatives.
The land area required by drying beds varied based on temperature and humidity. One academic source
contained a rational method for determining land area, but for most agencies (WHO, EPA, Mississippi
DEQ, Bremen Overseas Research and Development Agency, United States Army and Air Force) and
textbooks (Wastewater Treatment by Liu and Liptak, Unit Operations and Processes in Environmental
Engineering, 2nd
edition by Reynold and Richards) the required area is usually determined by a rule of
thumb based on the population to be served. These rules vary somewhat by the agency involved; the
areas range from 0.10-0.20 m2 per capita for open beds, and 0.075-0.15 m
2 per capita for covered beds.
Because Carabuela has a relatively cool climate with moderate rainfall, this team uses a conservative
number. The equations used follow the EPA guidelines of 0.20 m2 per capita for open beds and 0.15 m
2
for closed beds, so if Aopen is the required land area for open beds, Aclosed is area for covered beds, and P is
the population,
Aopen (m2) = 0.2P
Acovered (m2) = 0.15P
Planning for a sand layer 20 cm thick and a gravel layer 25 cm thick gives the equations
Vsand (m3) = 0.2A
and
Vgravel (m3) = 0.25A
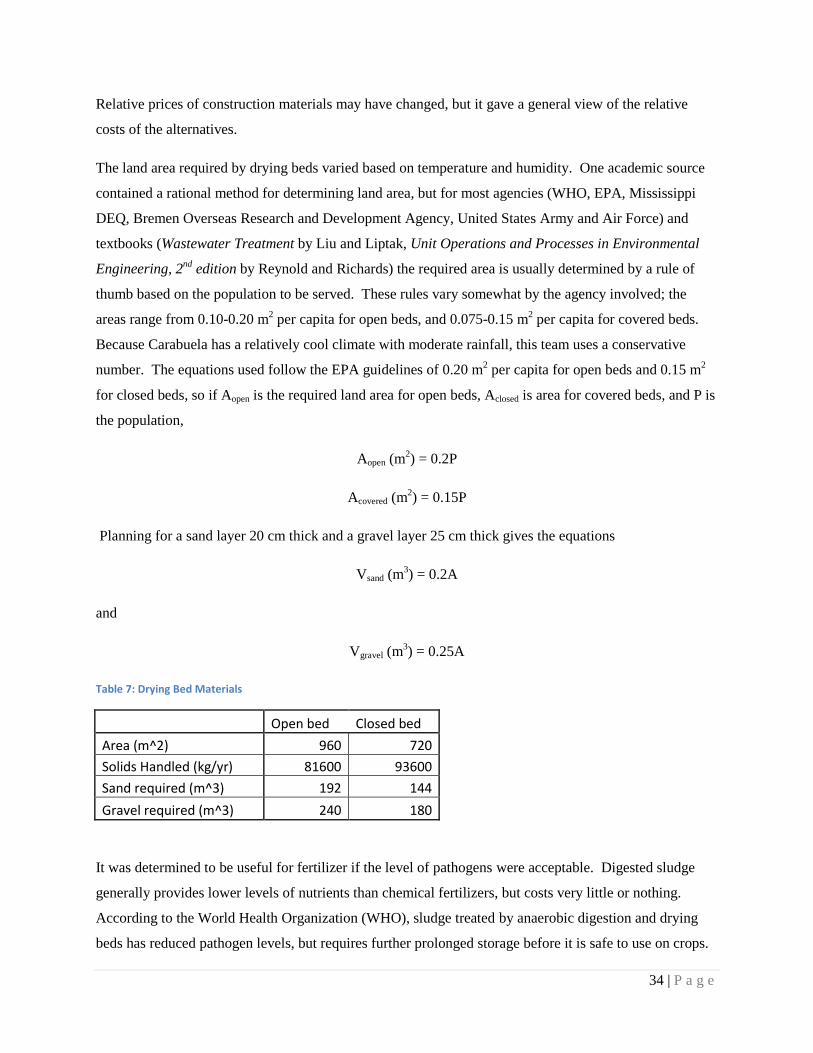
Table 7: Drying Bed Materials
Open bed Closed bed
Area (m^2) 960 720
Solids Handled (kg/yr) 81600 93600
Sand required (m^3) 192 144
Gravel required (m^3) 240 180
It was determined to be useful for fertilizer if the level of pathogens were acceptable. Digested sludge
generally provides lower levels of nutrients than chemical fertilizers, but costs very little or nothing.
According to the World Health Organization (WHO), sludge treated by anaerobic digestion and drying
beds has reduced pathogen levels, but requires further prolonged storage before it is safe to use on crops.
35 | P a g e
According to the US Environmental Protection Agency, the sludge should qualify as Class B sludge ready
for restricted application after a process to significantly reduce pathogens, such as anaerobic digestion or
air drying for more than 3 months. This team recommended that if the sludge is to be used as fertilizer, it
should be left on the bed for as long as feasible before use. This will probably mean six months, the
typical digestion period of the Imhoff tank. To qualify as Class B, the crops should not be harvested less
than thirty days after fertilizer application. If the sludge cannot be applied to alfalfa or another feed crop,
it should not be applied to human food crops, though it could be applied to fallow fields. Alternatively,
the waste could be sent to a landfill or incinerator, if one is feasibly close.
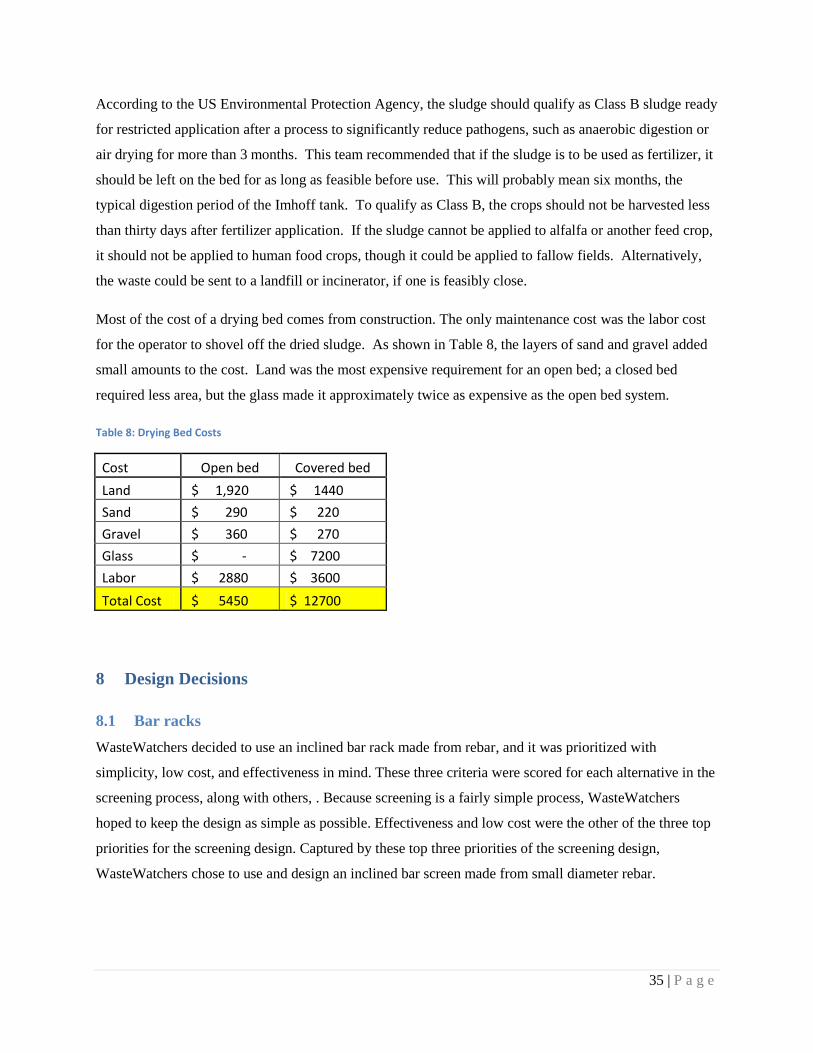
Most of the cost of a drying bed comes from construction. The only maintenance cost was the labor cost
for the operator to shovel off the dried sludge. As shown in Table 8, the layers of sand and gravel added
small amounts to the cost. Land was the most expensive requirement for an open bed; a closed bed
required less area, but the glass made it approximately twice as expensive as the open bed system.
Table 8: Drying Bed Costs
Cost Open bed Covered bed
Land $ 1,920 $ 1440
Sand $ 290 $ 220
Gravel $ 360 $ 270
Glass $ - $ 7200
Labor $ 2880 $ 3600
Total Cost $ 5450 $ 12700
8 Design Decisions
8.1 Bar racks
WasteWatchers decided to use an inclined bar rack made from rebar, and it was prioritized with
simplicity, low cost, and effectiveness in mind. These three criteria were scored for each alternative in the
screening process, along with others, . Because screening is a fairly simple process, WasteWatchers
hoped to keep the design as simple as possible. Effectiveness and low cost were the other of the three top
priorities for the screening design. Captured by these top three priorities of the screening design,
WasteWatchers chose to use and design an inclined bar screen made from small diameter rebar.
36 | P a g e
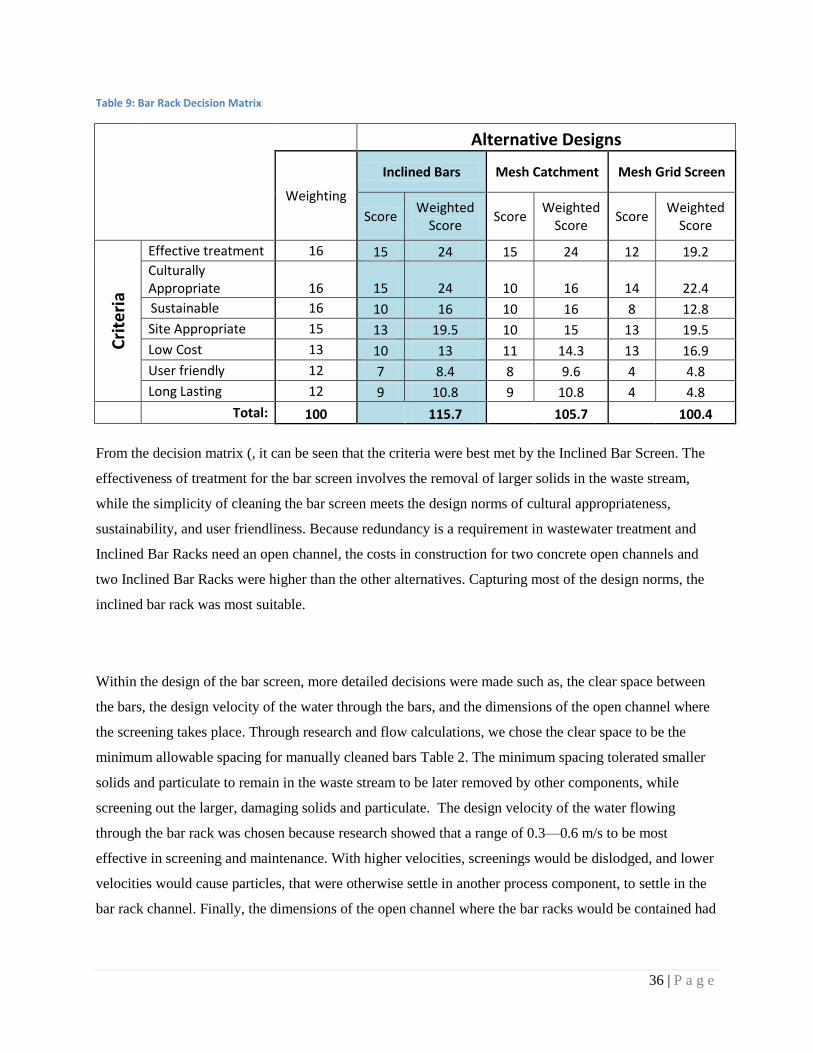
Table 9: Bar Rack Decision Matrix
Alternative Designs
Weighting
Inclined Bars Mesh Catchment Mesh Grid Screen
Score
Weighted Score
Score Weighted
Score Score
Weighted Score
Cri
teri
a
Effective treatment 16 15 24 15 24 12 19.2
Culturally Appropriate 16 15 24 10 16 14 22.4
Sustainable 16 10 16 10 16 8 12.8
Site Appropriate 15 13 19.5 10 15 13 19.5
Low Cost 13 10 13 11 14.3 13 16.9
User friendly 12 7 8.4 8 9.6 4 4.8
Long Lasting 12 9 10.8 9 10.8 4 4.8
Total: 100
115.7
105.7
100.4
From the decision matrix (, it can be seen that the criteria were best met by the Inclined Bar Screen. The
effectiveness of treatment for the bar screen involves the removal of larger solids in the waste stream,
while the simplicity of cleaning the bar screen meets the design norms of cultural appropriateness,
sustainability, and user friendliness. Because redundancy is a requirement in wastewater treatment and
Inclined Bar Racks need an open channel, the costs in construction for two concrete open channels and
two Inclined Bar Racks were higher than the other alternatives. Capturing most of the design norms, the
inclined bar rack was most suitable.
Within the design of the bar screen, more detailed decisions were made such as, the clear space between
the bars, the design velocity of the water through the bars, and the dimensions of the open channel where
the screening takes place. Through research and flow calculations, we chose the clear space to be the
minimum allowable spacing for manually cleaned bars Table 2. The minimum spacing tolerated smaller
solids and particulate to remain in the waste stream to be later removed by other components, while
screening out the larger, damaging solids and particulate. The design velocity of the water flowing
through the bar rack was chosen because research showed that a range of 0.3—0.6 m/s to be most
effective in screening and maintenance. With higher velocities, screenings would be dislodged, and lower
velocities would cause particles, that were otherwise settle in another process component, to settle in the
bar rack channel. Finally, the dimensions of the open channel where the bar racks would be contained had
37 | P a g e
to be designed. Using Equation 4, we calculated the required cross-sectional area, Table 1, for the bar rack
open channel at a velocity less than the required 0.6 m/s.
Equation 4: Cross Sectional Area Calculation
The requirement of redundancy in wastewater treatment design was considered in this process as well.
Because of the necessary cleaning and maintenance of a bar rack, two open channels were designed
identical so that ether could be used while the other is being cleaned or repaired. Redundancy was an
important design consideration factored into every component.
8.2 Grit Chamber
The decision to use and design a rectangular open channel grit chamber was mostly prioritized with
effectiveness, proven technology, low cost, and simplicity. A decision matrix was created to score each of
the different alternatives for a grit chamber design with these previous four criteria weighted more
heavily, . Because grit removal can effectively remove much of the grit in a waste stream without much
complexity in design, effectiveness and proven technology was an important priority in the chamber
design. Simplicity and low cost are the other two criteria that were considered in deciding on the grit
chamber design. Because the system was simple, it was also low cost.
Table 10: Grit Chamber Decision Matrix
Alternative Designs
Weighting
Rectangular Open Channel
Vortex Grit Chamber
Modified Vortex Grit Chamber
Old Septic Tank
Score
Weighted Score
Score Weighted
Score Score
Weighted Score
Score Weighted
Score
Cri
teri
a
Effective treatment
16 15 24 16 25.6 8 12.8 7 11.2
Culturally Appropriate
16 15 24 8 12.8 14 22.4 8 12.8
Sustainable 16 12 19.2 8 12.8 11 17.6 13 20.8
Site Appropriate
15 13 19.5 6 9 11 16.5 13 19.5
Low Cost 13 10 13 7 9.1 8 10.4 13 16.9
User friendly
12 10 12 7 8.4 5 6 4 4.8
Long Lasting
12 9 10.8 7 8.4 6 7.2 5 6
Total: 100
122.5
86.1
92.9
92
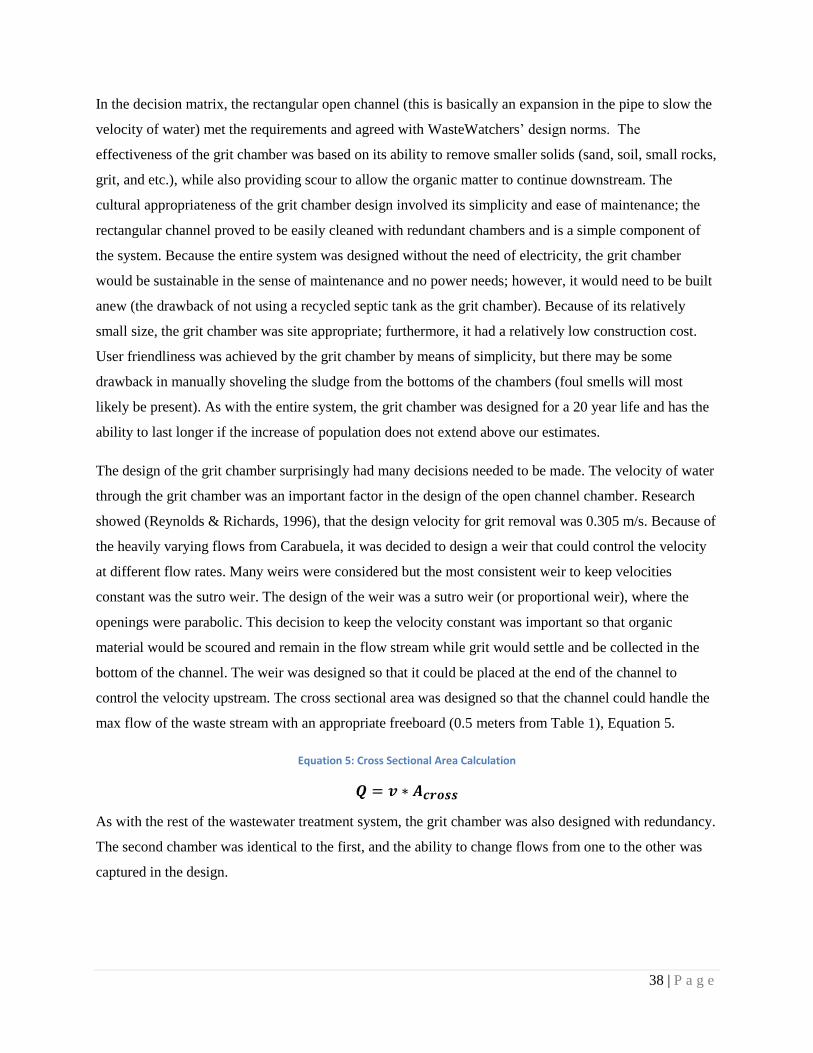
38 | P a g e
In the decision matrix, the rectangular open channel (this is basically an expansion in the pipe to slow the
velocity of water) met the requirements and agreed with WasteWatchers‘ design norms. The
effectiveness of the grit chamber was based on its ability to remove smaller solids (sand, soil, small rocks,
grit, and etc.), while also providing scour to allow the organic matter to continue downstream. The
cultural appropriateness of the grit chamber design involved its simplicity and ease of maintenance; the
rectangular channel proved to be easily cleaned with redundant chambers and is a simple component of
the system. Because the entire system was designed without the need of electricity, the grit chamber
would be sustainable in the sense of maintenance and no power needs; however, it would need to be built
anew (the drawback of not using a recycled septic tank as the grit chamber). Because of its relatively
small size, the grit chamber was site appropriate; furthermore, it had a relatively low construction cost.
User friendliness was achieved by the grit chamber by means of simplicity, but there may be some
drawback in manually shoveling the sludge from the bottoms of the chambers (foul smells will most
likely be present). As with the entire system, the grit chamber was designed for a 20 year life and has the
ability to last longer if the increase of population does not extend above our estimates.
The design of the grit chamber surprisingly had many decisions needed to be made. The velocity of water
through the grit chamber was an important factor in the design of the open channel chamber. Research
showed (Reynolds & Richards, 1996), that the design velocity for grit removal was 0.305 m/s. Because of
the heavily varying flows from Carabuela, it was decided to design a weir that could control the velocity
at different flow rates. Many weirs were considered but the most consistent weir to keep velocities
constant was the sutro weir. The design of the weir was a sutro weir (or proportional weir), where the
openings were parabolic. This decision to keep the velocity constant was important so that organic
material would be scoured and remain in the flow stream while grit would settle and be collected in the
bottom of the channel. The weir was designed so that it could be placed at the end of the channel to
control the velocity upstream. The cross sectional area was designed so that the channel could handle the
max flow of the waste stream with an appropriate freeboard (0.5 meters from Table 1), Equation 5.
Equation 5: Cross Sectional Area Calculation
As with the rest of the wastewater treatment system, the grit chamber was also designed with redundancy.
The second chamber was identical to the first, and the ability to change flows from one to the other was
captured in the design.
39 | P a g e
8.3 Imhoff Tank
For the primary treatment of the wastewater, several alternatives including an Imhoff tank, a septic tank,
an anaerobic lagoon and conventional sedimentation were considered.
The Imhoff tank scored highly because it was culturally appropriate in that it is abundantly used in many
developing nations and regions, site appropriate in that it does not take excessive land space, sustainable
in that it has a low level of sophistication and requires no electricity. The main drawbacks of the Imhoff
tank are the high level of maintenance, the high capital cost, and the possible limited lifespan. Overall the
Imhoff tank was the best option for this situation. With the Imhoff tank several options were considered
for construction methods. The Imhoff tank could be built and designed several ways. Two construction
alternatives are possible and vary in construction materials used. A new tank made of typical concrete
could be built or a new tank made of ferrocement could be used.
Building a typical concrete tank could pose some problems when it comes to construction. Forming the
tank could be a problem because the walls of the tank would be high and would require concrete to be
pumped up to the top of the forms. Concrete pumps and cranes which would typically be used in
construction in the United States might not be available in the remote regions of Ecuador. Construction of
the tank could be difficult depending on the availability of skilled concrete workers. Also the tank would
require a significant number of reinforcing steel bars which would add to the construction cost. The main
advantage of using typical concrete for the construction is that it is a very proven and well known
technology that is durable and dependable. The alternative to typical concrete construction is using
ferrocement.
Ferrocement is a type of thin wall reinforced concrete commonly constructed of hydraulic cement mortar
reinforced with closely spaced layers of continuous and relatively small size wire mesh (Naaman, 2000).
The main advantages of using ferrocement as compared to typical reinforced concrete are as follows:
Thinner material
Ferrocement has a high reinforcement ratio in both tension and compression
Smaller crack widths which provide excellent leakage characteristics for water tanks
Good durability under various environmental exposure
Can accommodate lower levels of technology because it requires less mechanization and
less heavy equipment
Easy to repair and maintain
40 | P a g e
A decision on the construction method was made after research into the village of Carabuela and typical
construction methods to the area. According to many images of the village, typical concrete construction
is standard to their major structures. Also some of the younger generation of the village has spent time in
the capital city of Quito working as construction workers (Meier & Villalobos, 1996). This expertise can
be utilized in the construction of typical concrete. Because of this familiarity with concrete and the
standard nature of concrete construction to the area, typical concrete construction will be used for all
structures to be built.
8.4 Lagoon System
In below, there is a design matrix that lists each of these criteria along with possible alternatives.The
facultative pond was selected over the other alternatives for a number of reasons. It best suited the design
norms for this project: cultural appropriateness, stewardship and transparency. The facultative pond was
considered better than the aerated pond because it does not require a power source such as electricity or
gas that would provide extra costs to the system and complexity. Aerated ponds need power to provide
more oxygen to the pond by the use of blowers or mechanical paddles. This power would not be easily
accessible to its location and would drain the energy resources in that area. The people of Carabuela want
a system that is easy to operate. The aerated pond would be hard to operate. Another reason why aerated
ponds were not considered appropriate was because they are not very transparent. An aerated pond
requires mechanical equipment that is not easily understood. The team wants the people of Carabuela to
be able to operate their system and be able to fix problems when they occur. It would be very hard to fix
an aerated system without the proper education about them. Besides the aerated pond, the anaerobic pond
was not selected. The anaerobic pond was not selected because they are generally used to capture
methane gas from anaerobic microbial reactions, a byproduct that the people are not interested about. Its
depth is much deeper, which would add to construction costs. It does not treat the waste as efficiently as
facultative ponds because not enough sunlight is able to penetrate through the entire pond. Overall, as
shown in the decision matix, the facultative pond is the best decision. It provides the best treatment at the
lowest cost and it is culturally appropriate and transparent.
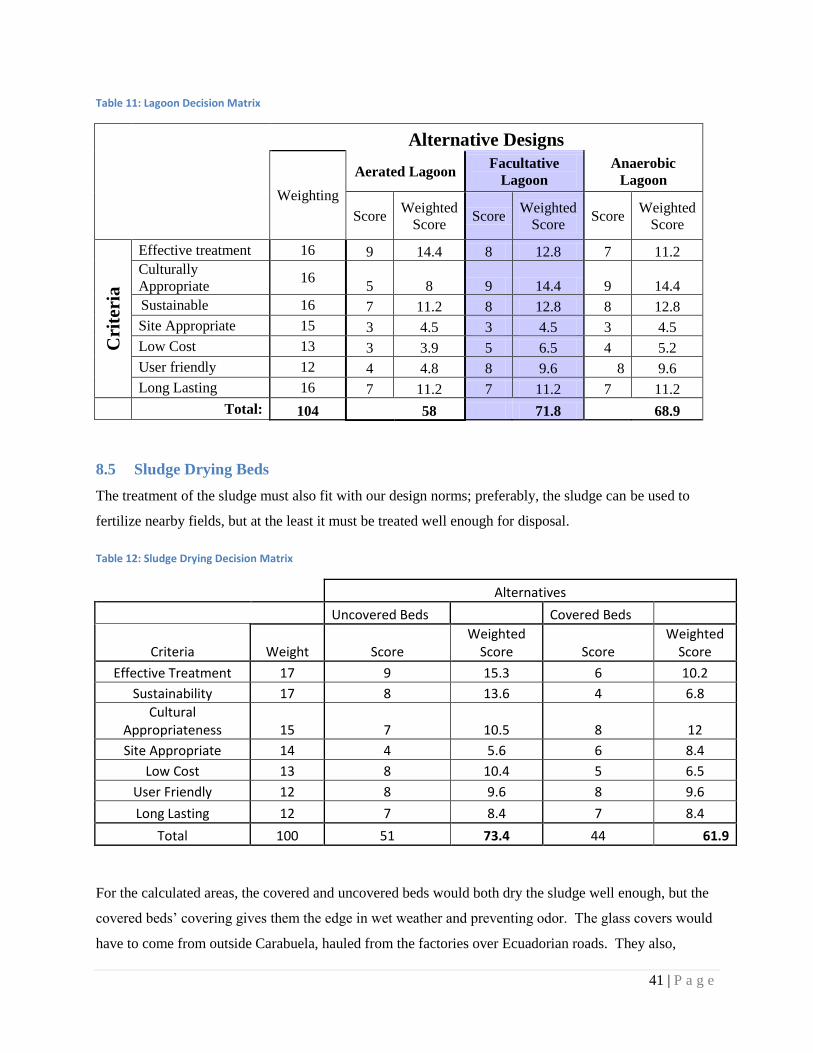
41 | P a g e
Table 11: Lagoon Decision Matrix
Alternative Designs
Weighting
Aerated Lagoon Facultative
Lagoon
Anaerobic
Lagoon
Score
Weighted
Score Score
Weighted
Score Score
Weighted
Score
Cri
teri
a
Effective treatment 16 9 14.4 8 12.8 7 11.2
Culturally
Appropriate 16
5 8 9 14.4 9 14.4
Sustainable 16 7 11.2 8 12.8 8 12.8
Site Appropriate 15 3 4.5 3 4.5 3 4.5
Low Cost 13 3 3.9 5 6.5 4 5.2
User friendly 12 4 4.8 8 9.6 8 9.6
Long Lasting 16 7 11.2 7 11.2 7 11.2
Total: 104 58 71.8 68.9
8.5 Sludge Drying Beds
The treatment of the sludge must also fit with our design norms; preferably, the sludge can be used to
fertilize nearby fields, but at the least it must be treated well enough for disposal.
Table 12: Sludge Drying Decision Matrix
Alternatives
Uncovered Beds Covered Beds
Criteria Weight Score Weighted
Score Score Weighted
Score
Effective Treatment 17 9 15.3 6 10.2
Sustainability 17 8 13.6 4 6.8
Cultural Appropriateness 15 7 10.5 8 12
Site Appropriate 14 4 5.6 6 8.4
Low Cost 13 8 10.4 5 6.5
User Friendly 12 8 9.6 8 9.6
Long Lasting 12 7 8.4 7 8.4
Total 100 51 73.4 44 61.9
For the calculated areas, the covered and uncovered beds would both dry the sludge well enough, but the
covered beds‘ covering gives them the edge in wet weather and preventing odor. The glass covers would
have to come from outside Carabuela, hauled from the factories over Ecuadorian roads. They also,
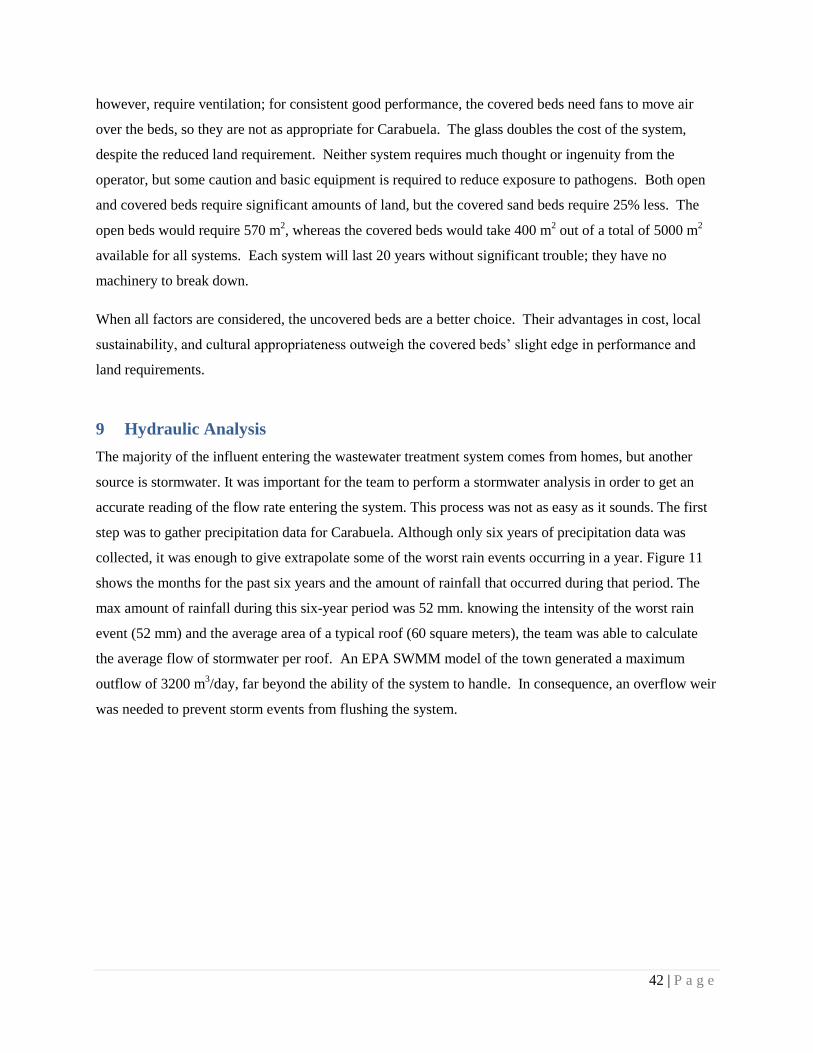
42 | P a g e
however, require ventilation; for consistent good performance, the covered beds need fans to move air
over the beds, so they are not as appropriate for Carabuela. The glass doubles the cost of the system,
despite the reduced land requirement. Neither system requires much thought or ingenuity from the
operator, but some caution and basic equipment is required to reduce exposure to pathogens. Both open
and covered beds require significant amounts of land, but the covered sand beds require 25% less. The
open beds would require 570 m2, whereas the covered beds would take 400 m
2 out of a total of 5000 m
2
available for all systems. Each system will last 20 years without significant trouble; they have no
machinery to break down.
When all factors are considered, the uncovered beds are a better choice. Their advantages in cost, local
sustainability, and cultural appropriateness outweigh the covered beds‘ slight edge in performance and
land requirements.
9 Hydraulic Analysis
The majority of the influent entering the wastewater treatment system comes from homes, but another
source is stormwater. It was important for the team to perform a stormwater analysis in order to get an
accurate reading of the flow rate entering the system. This process was not as easy as it sounds. The first
step was to gather precipitation data for Carabuela. Although only six years of precipitation data was
collected, it was enough to give extrapolate some of the worst rain events occurring in a year. Figure 11
shows the months for the past six years and the amount of rainfall that occurred during that period. The
max amount of rainfall during this six-year period was 52 mm. knowing the intensity of the worst rain
event (52 mm) and the average area of a typical roof (60 square meters), the team was able to calculate
the average flow of stormwater per roof. An EPA SWMM model of the town generated a maximum
outflow of 3200 m3/day, far beyond the ability of the system to handle. In consequence, an overflow weir
was needed to prevent storm events from flushing the system.
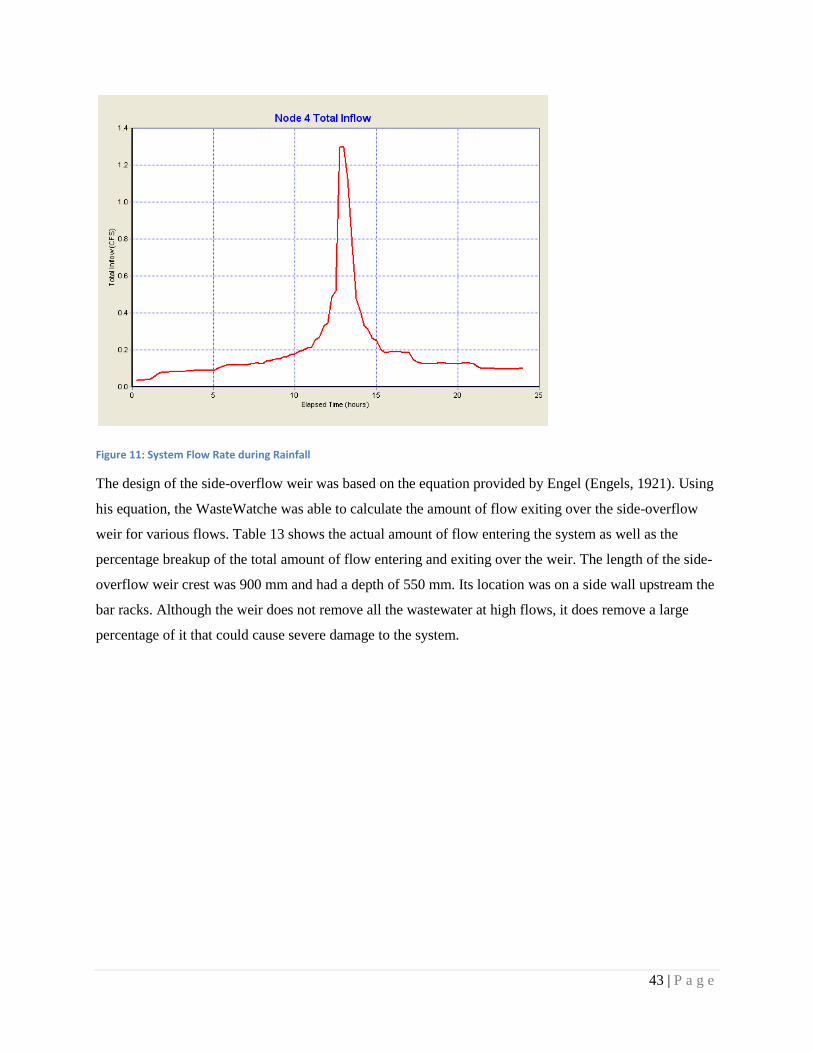
43 | P a g e
Figure 11: System Flow Rate during Rainfall
The design of the side-overflow weir was based on the equation provided by Engel (Engels, 1921). Using
his equation, the WasteWatche was able to calculate the amount of flow exiting over the side-overflow
weir for various flows. Table 13 shows the actual amount of flow entering the system as well as the
percentage breakup of the total amount of flow entering and exiting over the weir. The length of the side-
overflow weir crest was 900 mm and had a depth of 550 mm. Its location was on a side wall upstream the
bar racks. Although the weir does not remove all the wastewater at high flows, it does remove a large
percentage of it that could cause severe damage to the system.
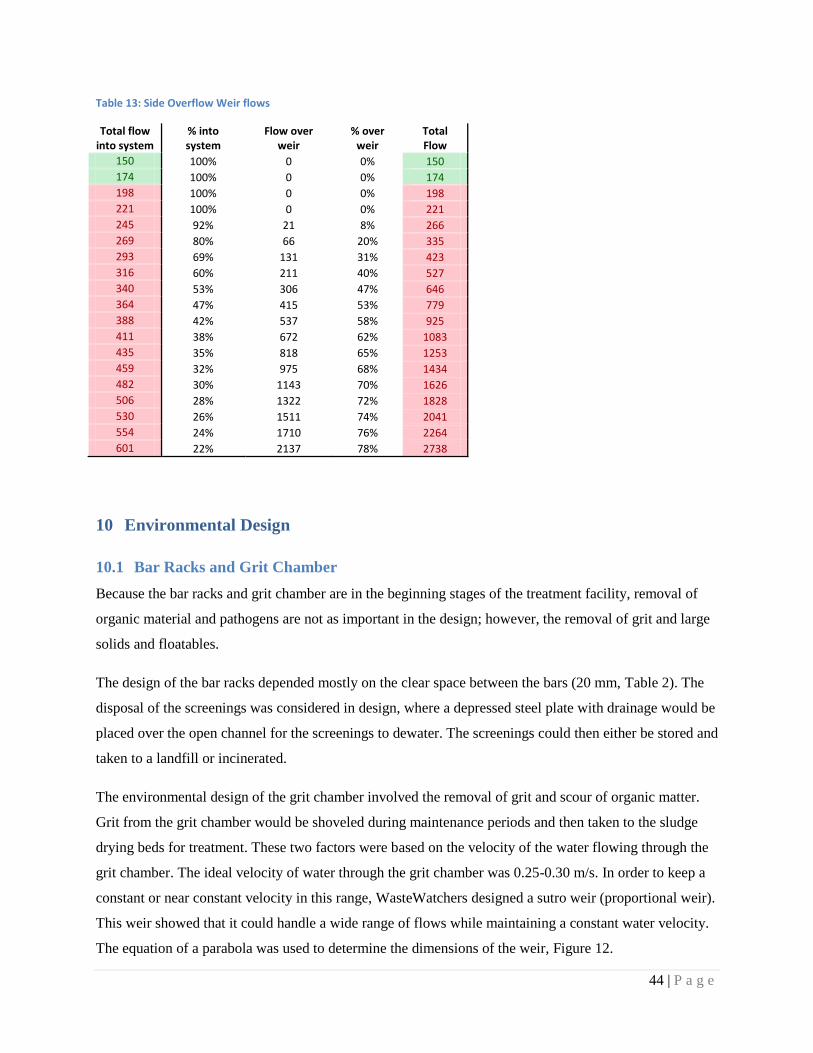
44 | P a g e
Table 13: Side Overflow Weir flows
Total flow into system
% into system
Flow over weir
% over weir
Total Flow
150 100% 0 0% 150
174 100% 0 0% 174
198 100% 0 0% 198
221 100% 0 0% 221
245 92% 21 8% 266
269 80% 66 20% 335
293 69% 131 31% 423
316 60% 211 40% 527
340 53% 306 47% 646
364 47% 415 53% 779
388 42% 537 58% 925
411 38% 672 62% 1083
435 35% 818 65% 1253
459 32% 975 68% 1434
482 30% 1143 70% 1626
506 28% 1322 72% 1828
530 26% 1511 74% 2041
554 24% 1710 76% 2264
601 22% 2137 78% 2738
10 Environmental Design
10.1 Bar Racks and Grit Chamber
Because the bar racks and grit chamber are in the beginning stages of the treatment facility, removal of
organic material and pathogens are not as important in the design; however, the removal of grit and large
solids and floatables.
The design of the bar racks depended mostly on the clear space between the bars (20 mm, Table 2). The
disposal of the screenings was considered in design, where a depressed steel plate with drainage would be
placed over the open channel for the screenings to dewater. The screenings could then either be stored and
taken to a landfill or incinerated.
The environmental design of the grit chamber involved the removal of grit and scour of organic matter.
Grit from the grit chamber would be shoveled during maintenance periods and then taken to the sludge
drying beds for treatment. These two factors were based on the velocity of the water flowing through the
grit chamber. The ideal velocity of water through the grit chamber was 0.25-0.30 m/s. In order to keep a
constant or near constant velocity in this range, WasteWatchers designed a sutro weir (proportional weir).
This weir showed that it could handle a wide range of flows while maintaining a constant water velocity.
The equation of a parabola was used to determine the dimensions of the weir, Figure 12.
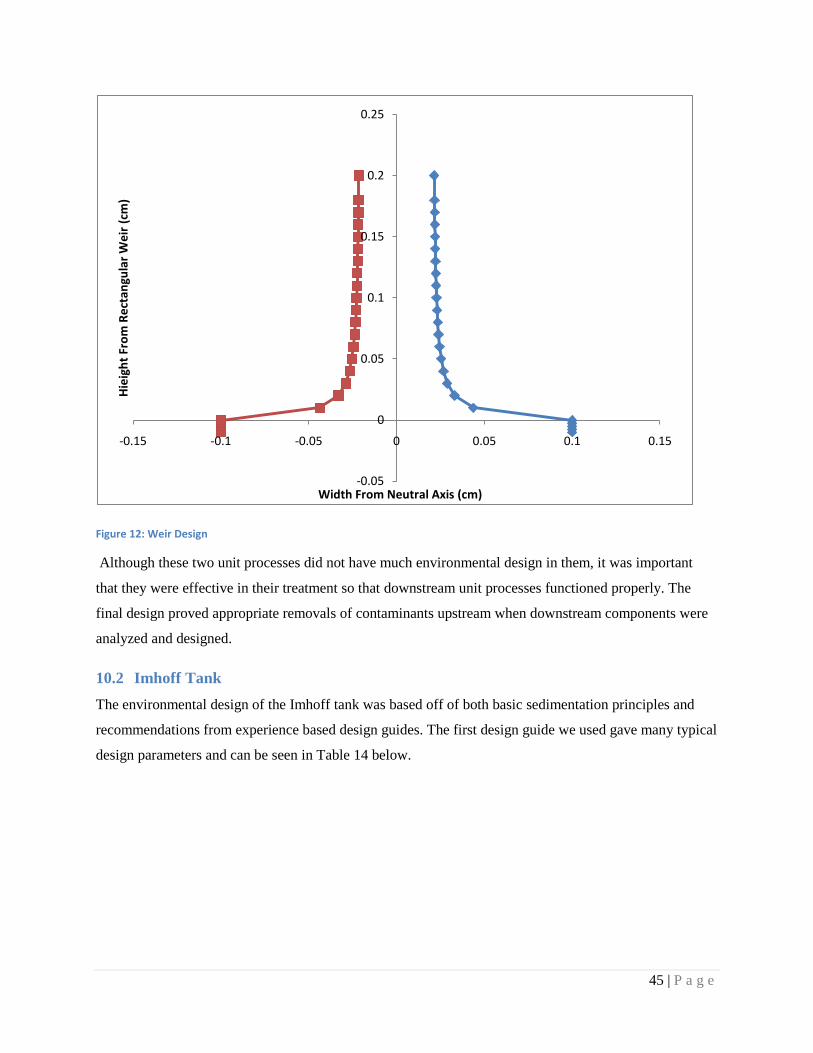
45 | P a g e
Figure 12: Weir Design
Although these two unit processes did not have much environmental design in them, it was important
that they were effective in their treatment so that downstream unit processes functioned properly. The
final design proved appropriate removals of contaminants upstream when downstream components were
analyzed and designed.
10.2 Imhoff Tank
The environmental design of the Imhoff tank was based off of both basic sedimentation principles and
recommendations from experience based design guides. The first design guide we used gave many typical
design parameters and can be seen in Table 14 below.
-0.05
0
0.05
0.1
0.15
0.2
0.25
-0.15 -0.1 -0.05 0 0.05 0.1 0.15
Hie
igh
t Fr
om
Re
ctan
gula
r W
eir
(cm
)
Width From Neutral Axis (cm)
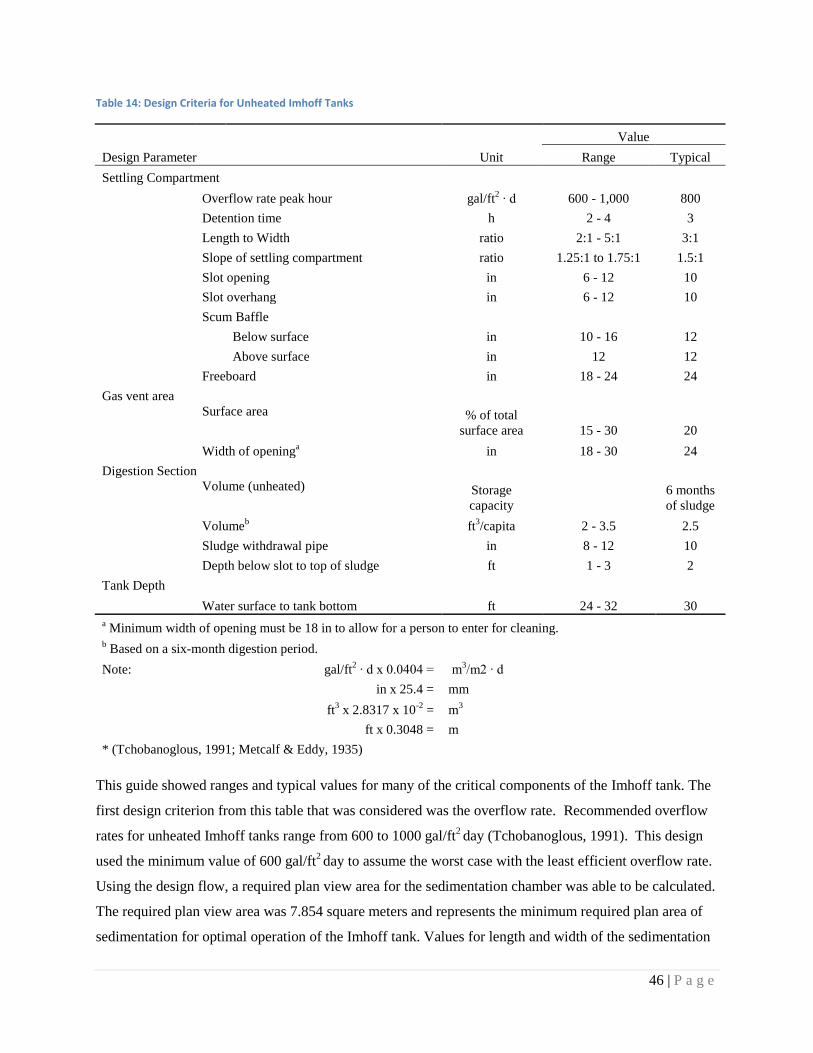
46 | P a g e
Table 14: Design Criteria for Unheated Imhoff Tanks
Value
Design Parameter Unit Range Typical
Settling Compartment
Overflow rate peak hour gal/ft2 ∙ d 600 - 1,000 800
Detention time h 2 - 4 3
Length to Width ratio 2:1 - 5:1 3:1
Slope of settling compartment ratio 1.25:1 to 1.75:1 1.5:1
Slot opening in 6 - 12 10
Slot overhang in 6 - 12 10
Scum Baffle
Below surface in 10 - 16 12
Above surface in 12 12
Freeboard in 18 - 24 24
Gas vent area
Surface area % of total
surface area 15 - 30 20
Width of openinga in 18 - 30 24
Digestion Section
Volume (unheated) Storage
capacity
6 months
of sludge
Volumeb ft
3/capita 2 - 3.5 2.5
Sludge withdrawal pipe in 8 - 12 10
Depth below slot to top of sludge ft 1 - 3 2
Tank Depth
Water surface to tank bottom ft 24 - 32 30
a Minimum width of opening must be 18 in to allow for a person to enter for cleaning.
b Based on a six-month digestion period.
Note: gal/ft2 ∙ d x 0.0404 = m
3/m2 ∙ d
in x 25.4 = mm
ft3 x 2.8317 x 10
-2 = m
3
ft x 0.3048 = m
* (Tchobanoglous, 1991; Metcalf & Eddy, 1935)
This guide showed ranges and typical values for many of the critical components of the Imhoff tank. The
first design criterion from this table that was considered was the overflow rate. Recommended overflow
rates for unheated Imhoff tanks range from 600 to 1000 gal/ft2 day (Tchobanoglous, 1991). This design
used the minimum value of 600 gal/ft2 day to assume the worst case with the least efficient overflow rate.
Using the design flow, a required plan view area for the sedimentation chamber was able to be calculated.
The required plan view area was 7.854 square meters and represents the minimum required plan area of
sedimentation for optimal operation of the Imhoff tank. Values for length and width of the sedimentation
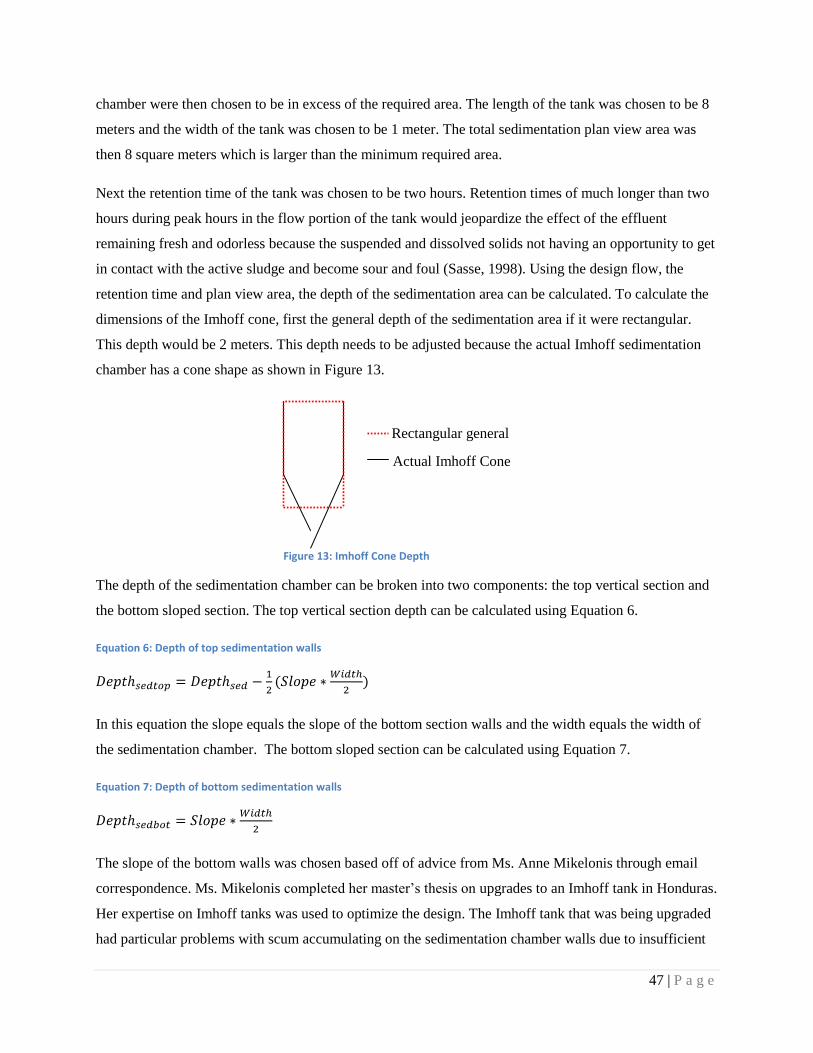
47 | P a g e
chamber were then chosen to be in excess of the required area. The length of the tank was chosen to be 8
meters and the width of the tank was chosen to be 1 meter. The total sedimentation plan view area was
then 8 square meters which is larger than the minimum required area.
Next the retention time of the tank was chosen to be two hours. Retention times of much longer than two
hours during peak hours in the flow portion of the tank would jeopardize the effect of the effluent
remaining fresh and odorless because the suspended and dissolved solids not having an opportunity to get
in contact with the active sludge and become sour and foul (Sasse, 1998). Using the design flow, the
retention time and plan view area, the depth of the sedimentation area can be calculated. To calculate the
dimensions of the Imhoff cone, first the general depth of the sedimentation area if it were rectangular.
This depth would be 2 meters. This depth needs to be adjusted because the actual Imhoff sedimentation
chamber has a cone shape as shown in Figure 13.
The depth of the sedimentation chamber can be broken into two components: the top vertical section and
the bottom sloped section. The top vertical section depth can be calculated using Equation 6.
Equation 6: Depth of top sedimentation walls
In this equation the slope equals the slope of the bottom section walls and the width equals the width of
the sedimentation chamber. The bottom sloped section can be calculated using Equation 7.
Equation 7: Depth of bottom sedimentation walls
The slope of the bottom walls was chosen based off of advice from Ms. Anne Mikelonis through email
correspondence. Ms. Mikelonis completed her master‘s thesis on upgrades to an Imhoff tank in Honduras.
Her expertise on Imhoff tanks was used to optimize the design. The Imhoff tank that was being upgraded
had particular problems with scum accumulating on the sedimentation chamber walls due to insufficient
Rectangular general
Actual Imhoff Cone
Figure 13: Imhoff Cone Depth

48 | P a g e
slope of the bottom walls. For this design, the bottom wall slope was chosen to be 2:1 to reduce this
possibility.
Another safety consideration that was used was a horizontal overlap of the bottom sedimentation walls.
This overlap was chosen to be 0.5 meters and keeps the cleaned water untainted by reducing the
possibility of tainted water, carried upward by gas bubbles or other conditions, to enter the sedimentation
chamber. This horizontal overlap translates to a depth increase of 1 meter because of the 2:1 slope. To
further separate the settled sludge and cleaned water, the vertical clearance between the bottom of the
sedimentation chamber and the maximum depth of settled sludge was chosen to be 0.5 meters.
The anaerobic nature of the digestion in the sludge compartment creates significant levels of methane gas.
This methane gas moves from the sludge upward and requires an open space to exit into the air. On both
sides of the sedimentation chamber a 1 meter wide gas vent was added to accommodate for this gas
release. A width of 1 meter was chosen to allow for passage of a person for maintenance purposes.
The sludge storage compartment was designed to hold 0.053m3 of sludge per resident. This value was
derived based on the dimensions of a similar Imhoff tank currently in operation in Honduras (Mikelonis,
2007). Since the Imhoff tank is designed for redundancy and there are two tanks in the one structure, each
tank only is required to hold half of the total sludge volume. The volume of sludge that each tank is
designed to hold is 47.7 cubic meters. This volume corresponds to a maximum sludge depth of 2 meters.
Now that each section of the Imhoff tank has been constrained and dimensioned the total tank dimensions
can be calculated. The total redundant Imhoff tank has a length of 8 meters, a width of 6 meters and a
depth of 6 meters. The full calculations for the design of the Imhoff tank can be seen in entirety in
Appendix A.
10.3 Waste Stabilization Lagoons
As the fourth component of the wastewater treatment facility, the waste stabilization lagoons were
designed to reduce the BOD and pathogens in the waste stream. WasteWatchers used various case studies
and sources for research on wastewater treatment in developing countries to complete the environmental
design of the wastewater treatment facility for Carabuela, Ecuador. Many standards for BOD, E. coli,
TSS, Giardia, and Helminth eggs were either not found in Ecuadorian government agencies or they were
unattainable for any Ecuadorian treatment system.
In order to meet requirements for unrestricted irrigation, three waste stabilization ponds were designed
(two being maturation ponds and one being a facultative ponds). Using kinetics, temperature factors, and
hydraulic residence times, WasteWatchers designed and sized the ponds. The facultative pond is partly
49 | P a g e
anaerobic and partly aerobic. This digestion will heavily reduce the BOD levels in the waste stream. The
last two maturation ponds mostly reduce the pathogen content through inactivation with high residence
times.
The calculations of the lagoons assume a max flow of wastewater to be twice the average flow of
wastewater. WasteWatchers assumed (through help of HCJB contact, Bruce Rydbeck) the flow to be 8
m3/month/household with the average of five people per household. The assumed BOD concentration for
the beginning of the system was 200 mg/l (32 kg/day), and it was reduced by the Imhoff tank to 100 mg/l
(19.6 kg/day) before the flow entered the facultative pond. The assumed concentration of Helminth eggs
in the flow was 1000/L and the E. coli coliforms were assumed to be 2x10⁷ coliforms per 100 mL (Mara,
2004).
The BOD loading rate was calculated to be 167 kg/(hectare-day) with temperature effects accounted for
(Mara, 2004). The inflow for using the BOD loading rate, max flow rate, and the BOD concentration, the
area of the facultative pond was calculated to be 0.115 hectares. Because temperature was a factor in the
amount of BOD removed, the worst case temperature was used for the calculation of the BOD loading
rate. The depth of the pond was suggested to be 1.5 meters (Mara, 2004). The final BOD concentration
from the facultative pond was calculated to be 2.7 mg/l (0.52 kg/day), showing a 1.6 log removal of BOD.
The Helminth eggs and E. coli removal rates were also calculated for the facultative pond, being 9.93
eggs/L and 3.5x10⁵ E. coli coliforms. Because these concentrations did not yet meet unrestricted
irrigation standards, two maturation ponds were designed to further reduce Helminth eggs and fecal
coliforms.
As with the facultative pond, the two maturation ponds were designed using hydraulic residence times
and biokinetics (Mara, 2004). The effluent concentrations of pathogens and BOD were used for the
influent of the two maturation ponds in series. Temperature was a factor with the maturation ponds, and
the worst case temperature for pathogen removal was used. Assumed hydraulic residence time was 3 days
for both maturation ponds. The removal of Helminth eggs and E. coli were the only pollutants taken into
consideration into the design of the maturation ponds, since BOD was reduced to already acceptable
levels.
The final results of BOD, Helminth eggs, and E coli concentrations were 2.7 mg/L, 0.10 eggs/L, and
915 Fecal Coliforms/100 mL, respectively. The removal rates are 1.6 log removed, 4.0 log removed, and
4.3 log removed respectively. These results were produced in order for the effluent water to be used for
unrestricted irrigation; however, the actual use of the effluent will depend on cultural values and actual
test data of the effluent water.
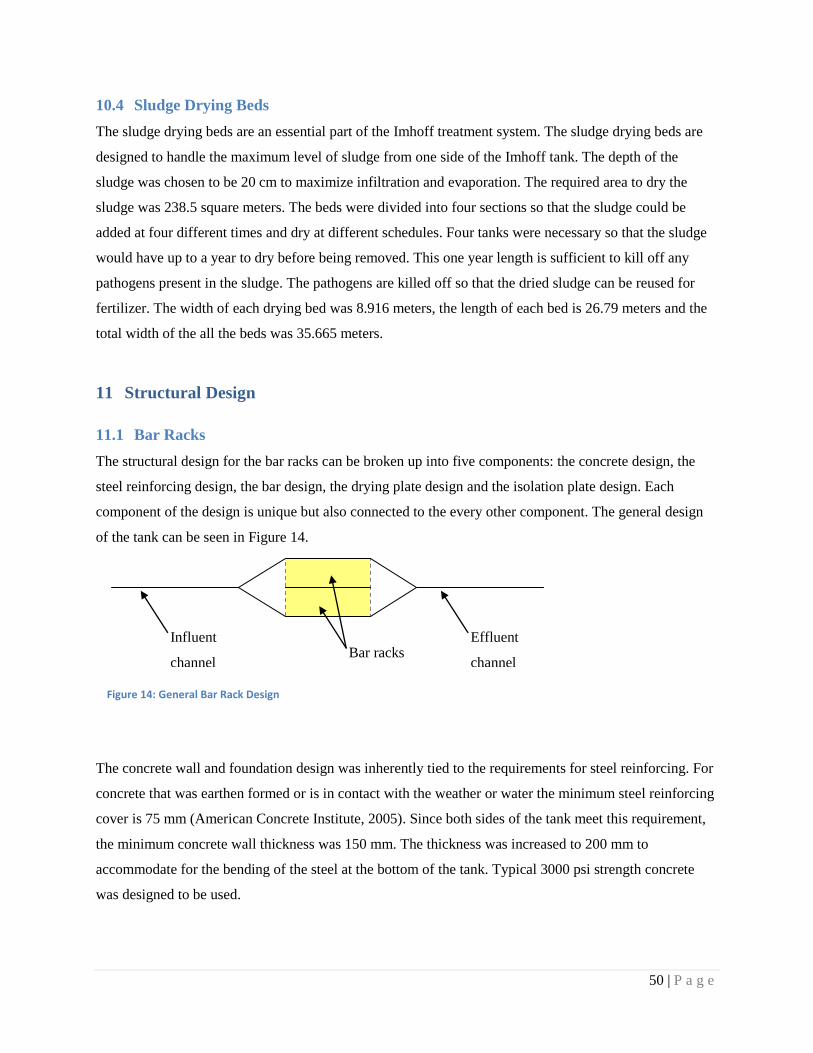
50 | P a g e
10.4 Sludge Drying Beds
The sludge drying beds are an essential part of the Imhoff treatment system. The sludge drying beds are
designed to handle the maximum level of sludge from one side of the Imhoff tank. The depth of the
sludge was chosen to be 20 cm to maximize infiltration and evaporation. The required area to dry the
sludge was 238.5 square meters. The beds were divided into four sections so that the sludge could be
added at four different times and dry at different schedules. Four tanks were necessary so that the sludge
would have up to a year to dry before being removed. This one year length is sufficient to kill off any
pathogens present in the sludge. The pathogens are killed off so that the dried sludge can be reused for
fertilizer. The width of each drying bed was 8.916 meters, the length of each bed is 26.79 meters and the
total width of the all the beds was 35.665 meters.
11 Structural Design
11.1 Bar Racks
The structural design for the bar racks can be broken up into five components: the concrete design, the
steel reinforcing design, the bar design, the drying plate design and the isolation plate design. Each
component of the design is unique but also connected to the every other component. The general design
of the tank can be seen in Figure 14.
The concrete wall and foundation design was inherently tied to the requirements for steel reinforcing. For
concrete that was earthen formed or is in contact with the weather or water the minimum steel reinforcing
cover is 75 mm (American Concrete Institute, 2005). Since both sides of the tank meet this requirement,
the minimum concrete wall thickness was 150 mm. The thickness was increased to 200 mm to
accommodate for the bending of the steel at the bottom of the tank. Typical 3000 psi strength concrete
was designed to be used.
Bar racks Influent
channel
Effluent
channel
Figure 14: General Bar Rack Design
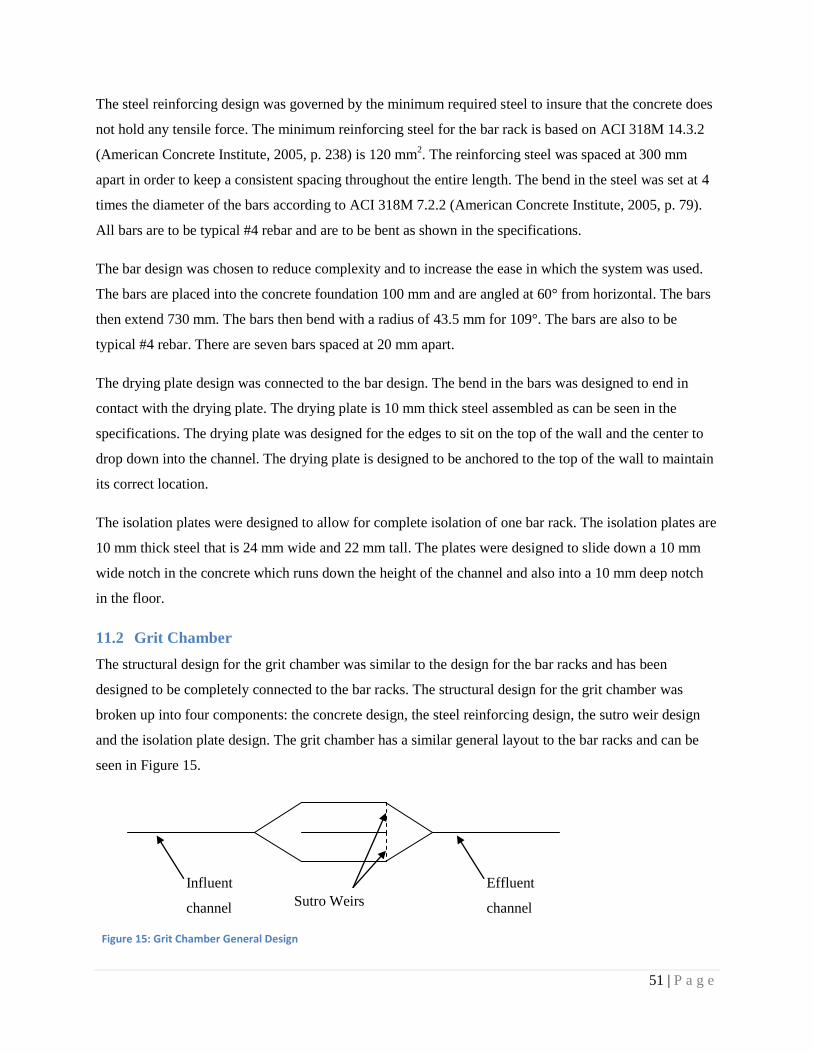
51 | P a g e
The steel reinforcing design was governed by the minimum required steel to insure that the concrete does
not hold any tensile force. The minimum reinforcing steel for the bar rack is based on ACI 318M 14.3.2
(American Concrete Institute, 2005, p. 238) is 120 mm2. The reinforcing steel was spaced at 300 mm
apart in order to keep a consistent spacing throughout the entire length. The bend in the steel was set at 4
times the diameter of the bars according to ACI 318M 7.2.2 (American Concrete Institute, 2005, p. 79).
All bars are to be typical #4 rebar and are to be bent as shown in the specifications.
The bar design was chosen to reduce complexity and to increase the ease in which the system was used.
The bars are placed into the concrete foundation 100 mm and are angled at 60° from horizontal. The bars
then extend 730 mm. The bars then bend with a radius of 43.5 mm for 109°. The bars are also to be
typical #4 rebar. There are seven bars spaced at 20 mm apart.
The drying plate design was connected to the bar design. The bend in the bars was designed to end in
contact with the drying plate. The drying plate is 10 mm thick steel assembled as can be seen in the
specifications. The drying plate was designed for the edges to sit on the top of the wall and the center to
drop down into the channel. The drying plate is designed to be anchored to the top of the wall to maintain
its correct location.
The isolation plates were designed to allow for complete isolation of one bar rack. The isolation plates are
10 mm thick steel that is 24 mm wide and 22 mm tall. The plates were designed to slide down a 10 mm
wide notch in the concrete which runs down the height of the channel and also into a 10 mm deep notch
in the floor.
11.2 Grit Chamber
The structural design for the grit chamber was similar to the design for the bar racks and has been
designed to be completely connected to the bar racks. The structural design for the grit chamber was
broken up into four components: the concrete design, the steel reinforcing design, the sutro weir design
and the isolation plate design. The grit chamber has a similar general layout to the bar racks and can be
seen in Figure 15.
Sutro Weirs
Influent
channel
Effluent
channel
Figure 15: Grit Chamber General Design
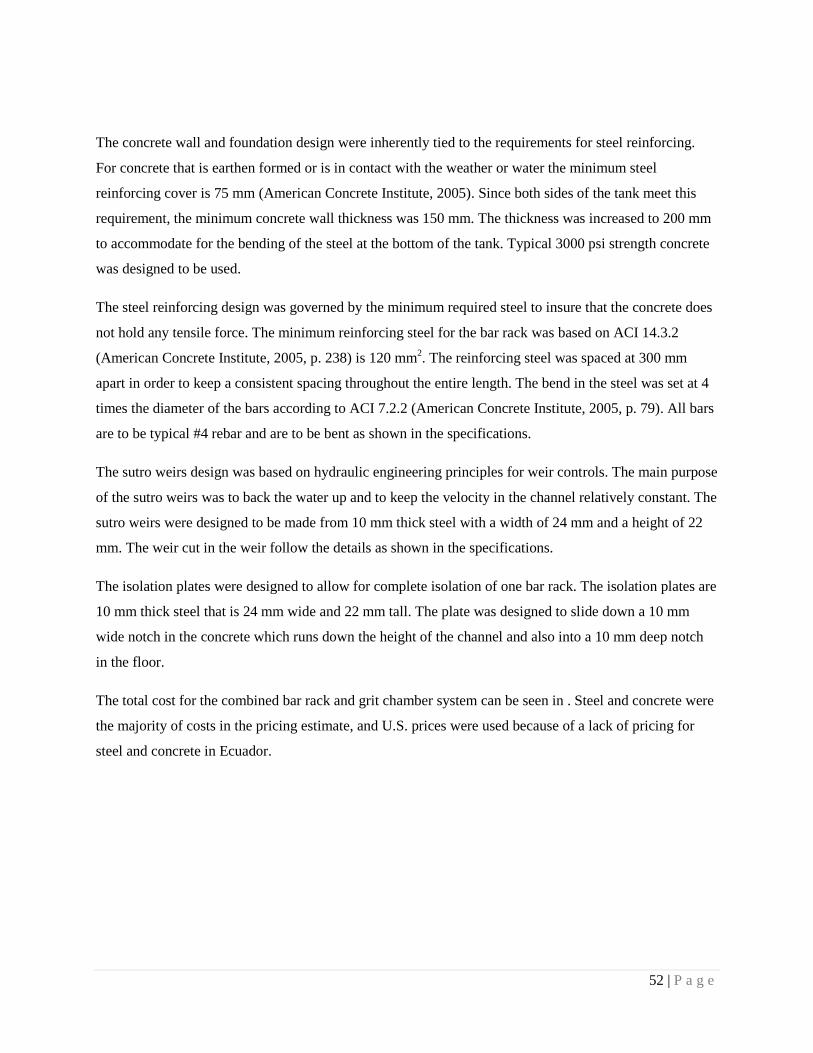
52 | P a g e
The concrete wall and foundation design were inherently tied to the requirements for steel reinforcing.
For concrete that is earthen formed or is in contact with the weather or water the minimum steel
reinforcing cover is 75 mm (American Concrete Institute, 2005). Since both sides of the tank meet this
requirement, the minimum concrete wall thickness was 150 mm. The thickness was increased to 200 mm
to accommodate for the bending of the steel at the bottom of the tank. Typical 3000 psi strength concrete
was designed to be used.
The steel reinforcing design was governed by the minimum required steel to insure that the concrete does
not hold any tensile force. The minimum reinforcing steel for the bar rack was based on ACI 14.3.2
(American Concrete Institute, 2005, p. 238) is 120 mm2. The reinforcing steel was spaced at 300 mm
apart in order to keep a consistent spacing throughout the entire length. The bend in the steel was set at 4
times the diameter of the bars according to ACI 7.2.2 (American Concrete Institute, 2005, p. 79). All bars
are to be typical #4 rebar and are to be bent as shown in the specifications.
The sutro weirs design was based on hydraulic engineering principles for weir controls. The main purpose
of the sutro weirs was to back the water up and to keep the velocity in the channel relatively constant. The
sutro weirs were designed to be made from 10 mm thick steel with a width of 24 mm and a height of 22
mm. The weir cut in the weir follow the details as shown in the specifications.
The isolation plates were designed to allow for complete isolation of one bar rack. The isolation plates are
10 mm thick steel that is 24 mm wide and 22 mm tall. The plate was designed to slide down a 10 mm
wide notch in the concrete which runs down the height of the channel and also into a 10 mm deep notch
in the floor.
The total cost for the combined bar rack and grit chamber system can be seen in . Steel and concrete were
the majority of costs in the pricing estimate, and U.S. prices were used because of a lack of pricing for
steel and concrete in Ecuador.
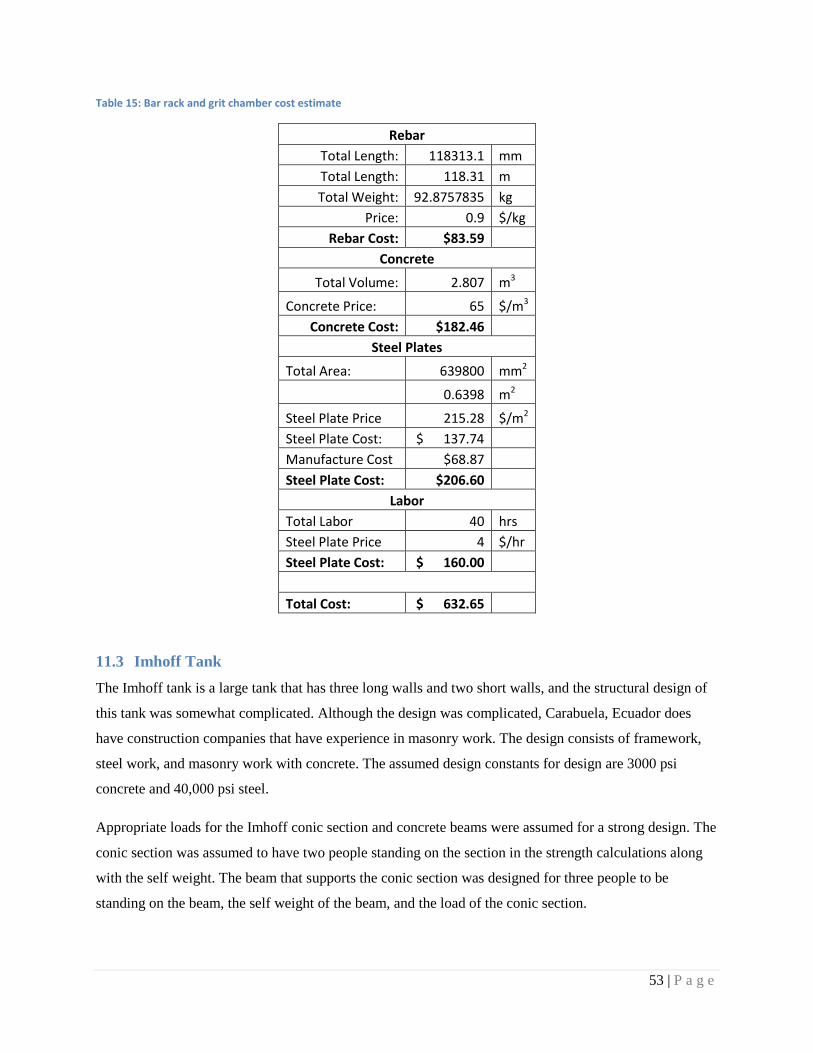
53 | P a g e
Table 15: Bar rack and grit chamber cost estimate
Rebar
Total Length: 118313.1 mm
Total Length: 118.31 m
Total Weight: 92.8757835 kg
Price: 0.9 $/kg
Rebar Cost: $83.59 Concrete
Total Volume: 2.807 m3
Concrete Price: 65 $/m3
Concrete Cost: $182.46 Steel Plates
Total Area: 639800 mm2
0.6398 m2
Steel Plate Price 215.28 $/m2
Steel Plate Cost: $ 137.74 Manufacture Cost $68.87 Steel Plate Cost: $206.60 Labor
Total Labor 40 hrs
Steel Plate Price 4 $/hr
Steel Plate Cost: $ 160.00
Total Cost: $ 632.65
11.3 Imhoff Tank
The Imhoff tank is a large tank that has three long walls and two short walls, and the structural design of
this tank was somewhat complicated. Although the design was complicated, Carabuela, Ecuador does
have construction companies that have experience in masonry work. The design consists of framework,
steel work, and masonry work with concrete. The assumed design constants for design are 3000 psi
concrete and 40,000 psi steel.
Appropriate loads for the Imhoff conic section and concrete beams were assumed for a strong design. The
conic section was assumed to have two people standing on the section in the strength calculations along
with the self weight. The beam that supports the conic section was designed for three people to be
standing on the beam, the self weight of the beam, and the load of the conic section.
54 | P a g e
The loads from the beam were then transferred to the side walls, where both vertical spans were used to
design the walls. The water pressure and earth pressure were designed for worst case moments within the
wall, and calculations were based on the ACI manual for construction. A finite element analysis was run
on the various load cases to look at the worst case stress points within the design. Reinforcing steel
spanned only one direction in the walls because of the ratio of length to width (also to help optimize the
cost and strength of the tank), and a horizontal span was designed for the steel in the conic sections of the
tank. Calculations for steel and concrete were completed using both the finite element analysis and
normal structural design with ultimate moments.
Accompanying the design calculations was the completion of structural drawings and a . A cost estimate
was also calculated give a final cost estimate on the entire system, Table 16. Steel and concrete were the
majority of costs in the pricing estimate, and U.S. prices were used because of a lack of pricing for steel
and concrete in Ecuador.
Table 16: Imhoff Tank Cost Estimate
Amount Costs
Concrete (m^3) Steel (m) Labor (hr) Concrete Steel Labor
Interior Wall 19.2 1160 50 $1,027.56 $719.20 $150.00
Exterior Walls 38.4 2320 50 $2,055.11 $1,438.40 $150.00
Front and Back Walls 28.8 1740 50 $1,541.33 $1,078.80 $150.00
Floor Slab 28.8 1160 40 $1,541.33 $719.20 $120.00
Conic Section 24 536 40 $1,284.44 $332.15 $120.00
Total 139.2 6916 230 $7,449.78 $4,287.75 $690.00
Total Cost $12,427.53
Pricing
Labor ($/hr)
Concrete ($/m3)
Steel ($/m)
$3.00 $53.52 $0.62
11.4 Waste Stabilization Lagoons
The pond system includes one secondary facultative pond and two maturation ponds. The facultative
pond is 1.5 meters in depth with 0.5 meters of freeboard. The maturation ponds are 0.5 meters in depth
with 0.5 meters of freeboard. The influent enters each pond through an 8‖ PVC pipe to the center of the
pond. An outlet pipe is located 1 foot below the surface of the water in each pond. For redundancy, there
are two ponds for each type of pond. Gate valves are placed before and in-between ponds for the purpose
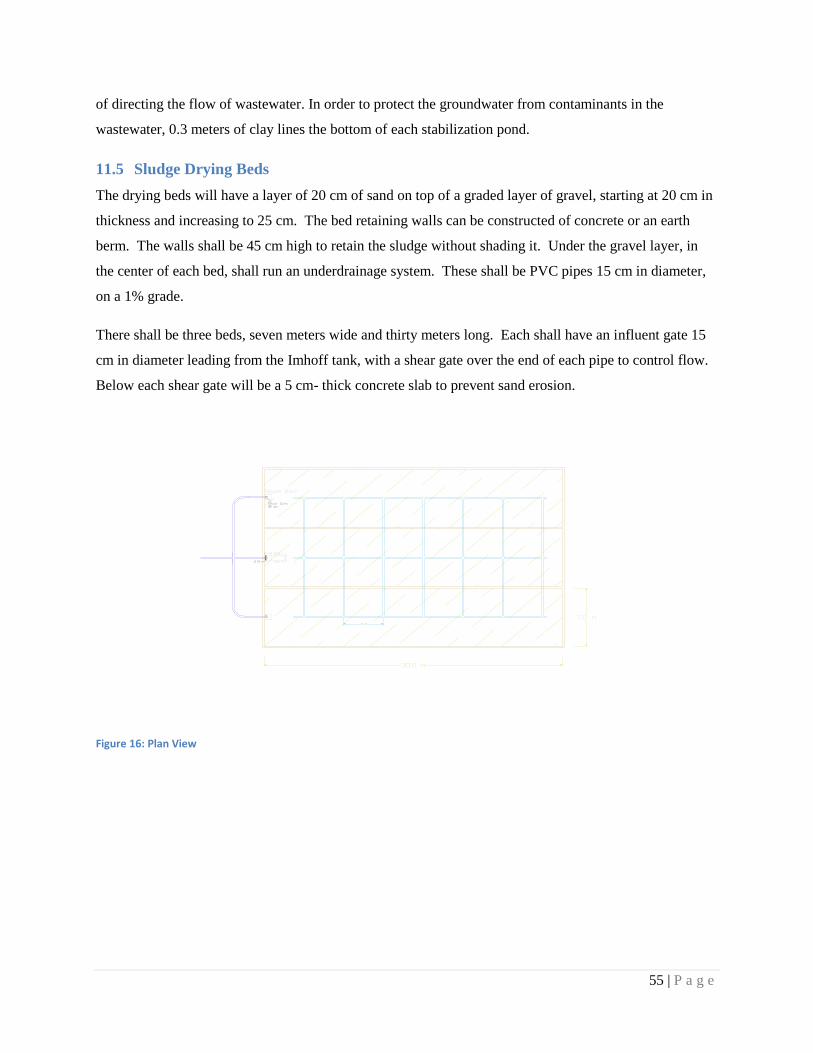
55 | P a g e
of directing the flow of wastewater. In order to protect the groundwater from contaminants in the
wastewater, 0.3 meters of clay lines the bottom of each stabilization pond.
11.5 Sludge Drying Beds
The drying beds will have a layer of 20 cm of sand on top of a graded layer of gravel, starting at 20 cm in
thickness and increasing to 25 cm. The bed retaining walls can be constructed of concrete or an earth
berm. The walls shall be 45 cm high to retain the sludge without shading it. Under the gravel layer, in
the center of each bed, shall run an underdrainage system. These shall be PVC pipes 15 cm in diameter,
on a 1% grade.
There shall be three beds, seven meters wide and thirty meters long. Each shall have an influent gate 15
cm in diameter leading from the Imhoff tank, with a shear gate over the end of each pipe to control flow.
Below each shear gate will be a 5 cm- thick concrete slab to prevent sand erosion.
Figure 16: Plan View
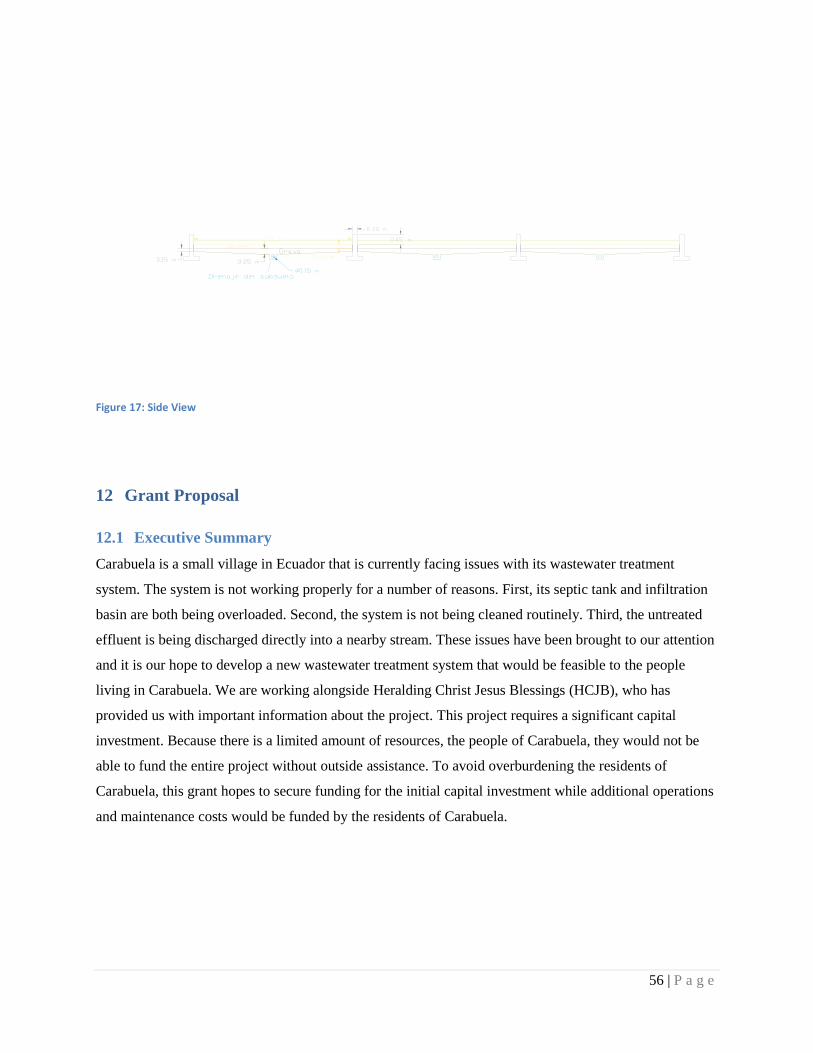
56 | P a g e
Figure 17: Side View
12 Grant Proposal
12.1 Executive Summary
Carabuela is a small village in Ecuador that is currently facing issues with its wastewater treatment
system. The system is not working properly for a number of reasons. First, its septic tank and infiltration
basin are both being overloaded. Second, the system is not being cleaned routinely. Third, the untreated
effluent is being discharged directly into a nearby stream. These issues have been brought to our attention
and it is our hope to develop a new wastewater treatment system that would be feasible to the people
living in Carabuela. We are working alongside Heralding Christ Jesus Blessings (HCJB), who has
provided us with important information about the project. This project requires a significant capital
investment. Because there is a limited amount of resources, the people of Carabuela, they would not be
able to fund the entire project without outside assistance. To avoid overburdening the residents of
Carabuela, this grant hopes to secure funding for the initial capital investment while additional operations
and maintenance costs would be funded by the residents of Carabuela.

57 | P a g e
12.2 Background Information
Carabuela is a small village located in the northern part of Ecuador outside Otavalo. Currently, the village
consists of approximately five hundred homes with an average of five people living per residence. Only
two huindred of these homes are currently connected to the wastewater system. Obviously population
growth will continue to expand so our design must meet future demands. Based on a recent analysis of the
village, the population of Carabuela is expected to reach 2700 occupants through the year 2029. Of this
total population only 1800 occupants would be connected into our system. This is the target population
that our design will be based upon. The village has recently constructed a drinking water system that
provides clean water to the majority of the residents. Not every residency that connects into the drinking
water system is currently connected into the wastewater system. To create a system that the village can
rely on, the design accounts for every residency connected into the system.
The residents of Carabuela are creative people who work in occupations such as weaving, knitting, dyeing
or farming with weaving and knitting being the primary occupations. The people rely on the quality of
their hand woven products in order to compete against cheaper woven products that are mass-produced.
The village‘s proximity to Otavalo, a larger economic city, allows for significantly higher financial
opportunities.
The geography of the area consists of a large knoll, which divides the village into two: one side being
farmland and the other side being the main village. The effluent wastewater will need to be routed around
this knoll to the farmland where it will be released. Since no energy sources such as pumps will be used,
gravity will be the only force that will move the wastewater.
12.3 Problem Statement
Contamination of water supplies is an important issue that affects many developing countries and regions.
In Latin America, for example, less than 15 percent of wastewater collected in sewered cities and towns is
treated prior to discharge1. Initially, Carabuela was one of the 15% who treated their collected wastewater
but as their system deteriorated, no longer adequately treated the water. Contaminated water supplies
impact public health by releasing pathogens which cause many diseases which will fall in the range of
excreted infections: non-bacterial faeco-oral diseases (category I), bacterial faeco-oral diseases (category
II), geohelminthiases (category III), taeniases (category IV), water based heliminthiases (category V), and
excreta rodent-vector diseases (category VI) (Mara, 2004).
Category I infections should consider the removal of Rotoviruses, which cause 350,000 to 600,000 deaths
per year. Category II infections are non-latent, have a medium-high persistence, have the ability to

58 | P a g e
multiply, and have a medium-low infectivity. E coli, Salmonella, Shigella and Vibrio Cholera are some
of the infections that are found in Category II infections. Category III infections are latent, very persistent,
unable to multiply, and have a high infectivity. Common infections can be caused by the Roundworm
(200,000 eggs/day), Hookworm (200,000 eggs/day), and Whipworm (5,000-20,000 eggs/day). Category
IV infections are latent, persistent, have the ability to multiply, have a very large infectivity, and have
either a cow or pig intermediate host. One parasite has the ability to produce 106—10
5 eggs/day. Some of
the common examples of parasites in Category IV are the Beef tapeworm and the Pork tapeworm.
Category V infections can be caused by the Trematode worms. Category VI infections can either be
insect-vector or rodent-vector diseases. Insect-vector diseases result from poorly maintained systems and
are transmitted by mosquitoes. Elephantitis is often a result of diseases transmitted by mosquitoes.
Rodent-vector diseases are usually spread by brown rats and result from the rat‘s contact with urine. A
common disease from brown rats is Leptospirosis, which is fatal if not treated. All these emerging
diseases need to be considered for the design of a wastewater treatment system in a developing country
(World Health Organization, 2006).
Engineers must also consider essential microbiology that involves the treatment for certain viruses and
Archaea. Viruses are parasitic microbes that have a DNA or RNA protein coating and range from 20—
200 nm. Archaea are usually a few micrometers and must grow in a 15—40 degree Celsius environment.
They thrive in near neutral or slightly alkaline environments. The design of Carabuela‘s wastewater
system must consider the environment and chemical properties of waste being delivered into the system.
The above considerations are needed for an appropriate design for Carabuela, and effluent qualities are
needed to set at an appropriate removal level to have an effective system while reducing the possibility of
―over kill‖ in the system.
As of now, the current system consists of sewage pipes that lead to a main manhole and a septic tank and
infiltration basin, which are both being overloaded. Storm water and wastewater both enter the system. It
is possible to separate the two but for now the original intent is to design with consideration of a
combination of both streams. The current system has deteriorated due to lack of maintenance to the level
that the septic tank no longer adequately treats the water and the infiltration basin has been clogged. The
effluent of the septic was rerouted to discharge straight into a nearby stream. The effluent water has
serious negative impacts on water quality in the receiving stream. The water from this stream is used for
later downstream irrigation.
59 | P a g e
Implementation of a wastewater treatment system can provide a vast increase in the health and safety of
both the residents of Carabuela and also any inhabitants downstream. The system rural nature of the
community brings about a different set of design standards and design requirements.
Some requirements of the system are that it must not be highly sophisticated and it must be proven. Any
design that is developed must be simple enough that persons in Carabuela can operate it easily. It should
be simple because there will be no one there to guide them in case any sudden problems should arise.
Along these lines the system should only have components that have already been tested. A system that is
based on developing theories should not be implemented. The system must be designed with cultural
appropriateness in mind. For example, the system should not operate using any energy sources because
the people would not be able to finance it for an extended period of time without outside funding.
12.4 Project Detail
12.4.1 Goals and Objectives
There are two major goals for the ―Carabuela Wastewater Treatment‖ Project and specific objectives
within each of the goals.
Goal #1 – To design a wastewater treatment system
Objective #1.1 – To analyze the amount of waste that will flow into the system
Objective #1.2 – To determine the amount of storm water that will enter the system from
roof drains
Objective #1.3 – To size the elements of the system
Goal #2 – To plan with cultural appropriateness
Objective #2.1 – To devise a system that is low cost, requires little maintenance, and
needs no electrical components
Objective #2.2 – To build a wastewater treatment system that can be easily operated
Objective #2.3 – To design according to Carabuela‘s culture
60 | P a g e
The primary goal is to design a wastewater treatment system. Along with this goal it has to be culturally
appropriate. The people of Carabuela are not interested in a sophisticated system, but more so a system
that has been proven. The wastewater treatment standards in the United States are not the same for
Carabuela, so the design will be based off their cultural standards.
12.4.2 Clientele
There is one clientele group for this project.
The clientele are the people of Carabuela. They anticipate a new wastewater treatment system
that will effectively treat their waste to acceptable standards. The people are sponsored by an
organization called Heralding Christ Jesus Blessings (HCJB) whom we have contacted for the
past six months. HCJB has given us the data necessary to design a wastewater treatment system
and has given feedback to a few of our designs. It is up to the governing agency of Carabuela to
decide if our design will be implemented. That is why it is in our best interest to be as culturaly
appropriate with all design decisions.
12.4.3 Methods
The primary methods for achieving the goals and objectives of the ―Carabuela Wastewater Treatment‖
Project will be:
• The development of calculations that will prove the system‘s effectiveness in
treating the waste, and the creation of a bench scale prototype to demonstrate
the system‘s hydraulics
• The writing of a manual guide that will help the people of Carabuela to operate the
system
12.5 Staff/Administration
The ―Carabuela Wastewater Treatment‖ Project will employ three full-time staff members.
• Environmental Systems Director (ESD) - responsible for the overall operation of the
wastewater system. The ESD consults with the chief operator to set the treatment parameters for
process control and general operation of the department
• Chief Operator - responsible for the day-to-day operation of the wastewater department. He
assigns the daily work tasks and insures that the normal, routine tasks are performed
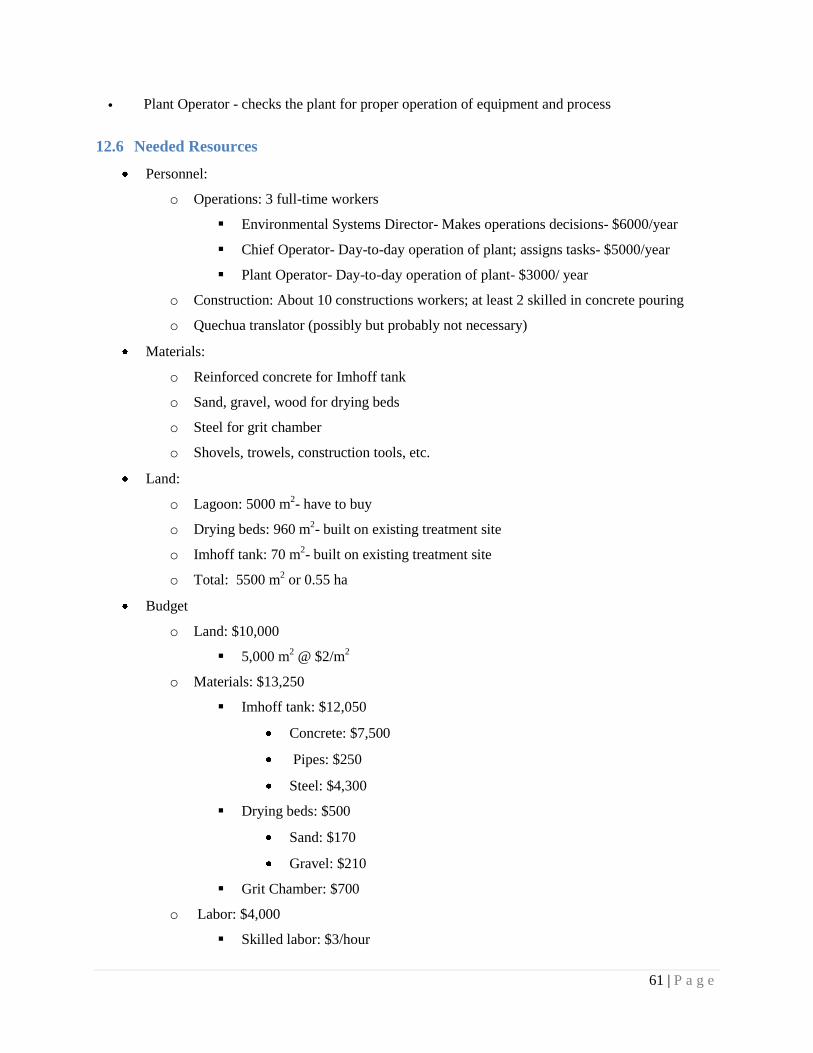
61 | P a g e
• Plant Operator - checks the plant for proper operation of equipment and process
12.6 Needed Resources
Personnel:
o Operations: 3 full-time workers
Environmental Systems Director- Makes operations decisions- $6000/year
Chief Operator- Day-to-day operation of plant; assigns tasks- $5000/year
Plant Operator- Day-to-day operation of plant- $3000/ year
o Construction: About 10 constructions workers; at least 2 skilled in concrete pouring
o Quechua translator (possibly but probably not necessary)
Materials:
o Reinforced concrete for Imhoff tank
o Sand, gravel, wood for drying beds
o Steel for grit chamber
o Shovels, trowels, construction tools, etc.
Land:
o Lagoon: 5000 m2- have to buy
o Drying beds: 960 m2- built on existing treatment site
o Imhoff tank: 70 m2- built on existing treatment site
o Total: 5500 m2 or 0.55 ha
Budget
o Land: $10,000
5,000 m2 @ $2/m
2
o Materials: $13,250
Imhoff tank: $12,050
Concrete: $7,500
Pipes: $250
Steel: $4,300
Drying beds: $500
Sand: $170
Gravel: $210
Grit Chamber: $700
o Labor: $4,000
Skilled labor: $3/hour

62 | P a g e
Unskilled labor: $2/hour
Imhoff tank: $690
230 hours skilled labor
Drying beds: $5,450
Lagoon: $2,000
o Construction Total: $31,000
o Operation:
Labor: 3 full-time workers: $14,000/year
Test effluent quality 2x/ month for first year
Test quality every other year thereafter
Total: $14,000/year
12.7 Goal #1—Design a wastewater treatment system
Designing a wastewater treatment system involves complicated calculations, lengthy research, and
knowledge of how wastewater is properly treated. To ensure a proper design, a certified engineer will
guide and supervise the design, while signing off on all final plans to ensure correct standards are met. A
group of four senior engineering students have developed models of the system that show the necessary
levels of contaminants that are removed by the proposed system, and are being advised and consulted by
two professional engineers.
The method of designing an appropriate system uses engineering software and research of similar case
studies to develop sizes for the components of the wastewater system. The proposed system also uses
technology that has been proven to work by many communities that have a similar situation to Carabuela.
12.8 Goal #2—Plan with cultural appropriateness
Within the proposed design, cultural appropriateness is a major factor in choosing the components of the
system. The system will be inexpensive, require minimal maintenance and no electrical components. Ease
of operation was also considered in order to empower the people of Carabuela to operate the system
without outside resources. This strategy of having a culturally appropriate design will allow for the
citizens of Carabuela to take pride and ownership in their wastewater facility, increasing the community
involvement of maintenance and operation.
The ease of operation and maintenance will be accomplished by the creation of a manual for the entire
system. This manual will include structural drawings for construction, maintenance and operations
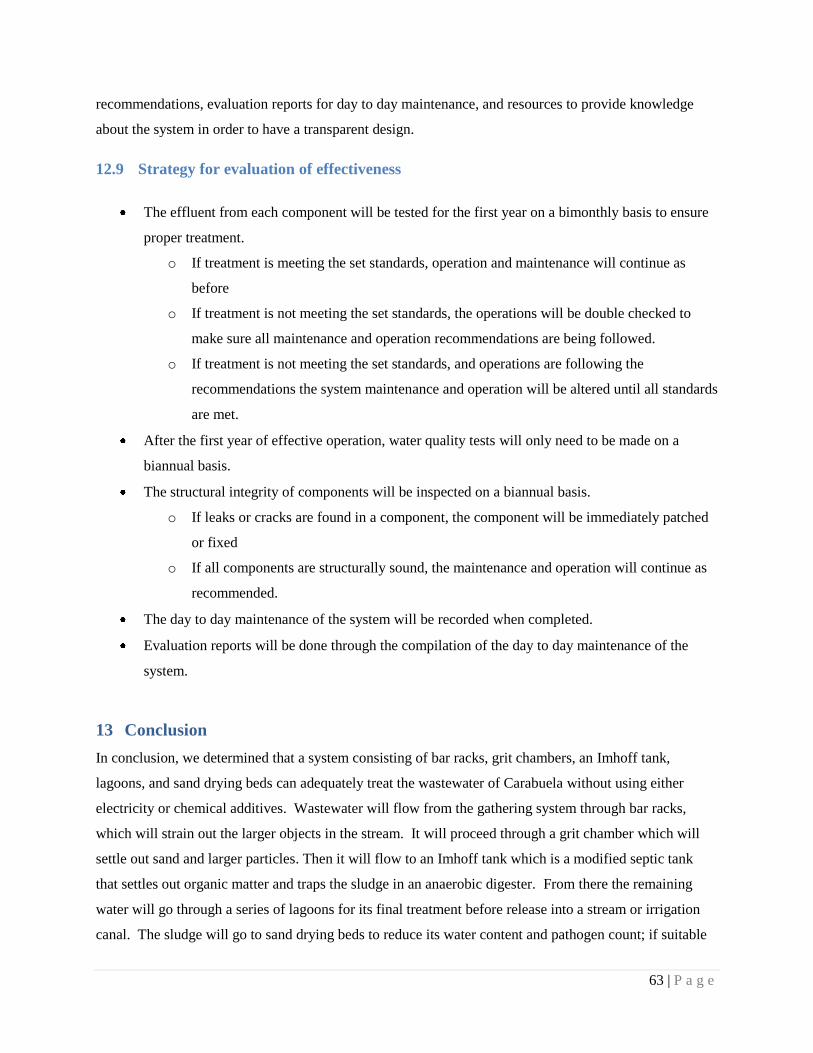
63 | P a g e
recommendations, evaluation reports for day to day maintenance, and resources to provide knowledge
about the system in order to have a transparent design.
12.9 Strategy for evaluation of effectiveness
The effluent from each component will be tested for the first year on a bimonthly basis to ensure
proper treatment.
o If treatment is meeting the set standards, operation and maintenance will continue as
before
o If treatment is not meeting the set standards, the operations will be double checked to
make sure all maintenance and operation recommendations are being followed.
o If treatment is not meeting the set standards, and operations are following the
recommendations the system maintenance and operation will be altered until all standards
are met.
After the first year of effective operation, water quality tests will only need to be made on a
biannual basis.
The structural integrity of components will be inspected on a biannual basis.
o If leaks or cracks are found in a component, the component will be immediately patched
or fixed
o If all components are structurally sound, the maintenance and operation will continue as
recommended.
The day to day maintenance of the system will be recorded when completed.
Evaluation reports will be done through the compilation of the day to day maintenance of the
system.
13 Conclusion
In conclusion, we determined that a system consisting of bar racks, grit chambers, an Imhoff tank,
lagoons, and sand drying beds can adequately treat the wastewater of Carabuela without using either
electricity or chemical additives. Wastewater will flow from the gathering system through bar racks,
which will strain out the larger objects in the stream. It will proceed through a grit chamber which will
settle out sand and larger particles. Then it will flow to an Imhoff tank which is a modified septic tank
that settles out organic matter and traps the sludge in an anaerobic digester. From there the remaining
water will go through a series of lagoons for its final treatment before release into a stream or irrigation
canal. The sludge will go to sand drying beds to reduce its water content and pathogen count; if suitable
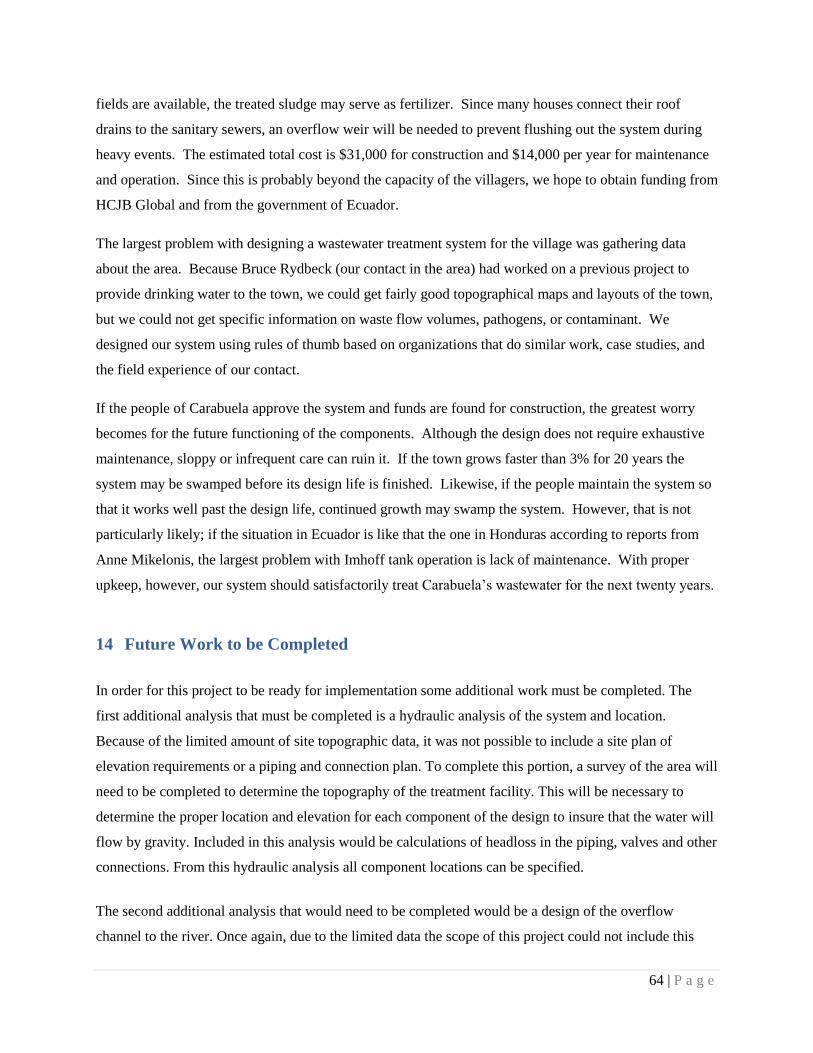
64 | P a g e
fields are available, the treated sludge may serve as fertilizer. Since many houses connect their roof
drains to the sanitary sewers, an overflow weir will be needed to prevent flushing out the system during
heavy events. The estimated total cost is $31,000 for construction and $14,000 per year for maintenance
and operation. Since this is probably beyond the capacity of the villagers, we hope to obtain funding from
HCJB Global and from the government of Ecuador.
The largest problem with designing a wastewater treatment system for the village was gathering data
about the area. Because Bruce Rydbeck (our contact in the area) had worked on a previous project to
provide drinking water to the town, we could get fairly good topographical maps and layouts of the town,
but we could not get specific information on waste flow volumes, pathogens, or contaminant. We
designed our system using rules of thumb based on organizations that do similar work, case studies, and
the field experience of our contact.
If the people of Carabuela approve the system and funds are found for construction, the greatest worry
becomes for the future functioning of the components. Although the design does not require exhaustive
maintenance, sloppy or infrequent care can ruin it. If the town grows faster than 3% for 20 years the
system may be swamped before its design life is finished. Likewise, if the people maintain the system so
that it works well past the design life, continued growth may swamp the system. However, that is not
particularly likely; if the situation in Ecuador is like that the one in Honduras according to reports from
Anne Mikelonis, the largest problem with Imhoff tank operation is lack of maintenance. With proper
upkeep, however, our system should satisfactorily treat Carabuela‘s wastewater for the next twenty years.
14 Future Work to be Completed
In order for this project to be ready for implementation some additional work must be completed. The
first additional analysis that must be completed is a hydraulic analysis of the system and location.
Because of the limited amount of site topographic data, it was not possible to include a site plan of
elevation requirements or a piping and connection plan. To complete this portion, a survey of the area will
need to be completed to determine the topography of the treatment facility. This will be necessary to
determine the proper location and elevation for each component of the design to insure that the water will
flow by gravity. Included in this analysis would be calculations of headloss in the piping, valves and other
connections. From this hydraulic analysis all component locations can be specified.
The second additional analysis that would need to be completed would be a design of the overflow
channel to the river. Once again, due to the limited data the scope of this project could not include this

65 | P a g e
part of the system. A channel would need to be designed to safely convey the overflow water from the
preliminary treatment structure to the river.
The final additional analysis that would need to be completed would be a review of the work that
WasteWatchers has completed. Because of the sensitive nature of the project and its potential impacts on
the residents of Carabuela and the surrounding environment it is highly recommended that professional
engineers in the fields of environmental and structural engineering review the entirety of the project
including the assumptions and design guide material used. It is also recommended that an engineer
familiar with the location reviews the system to insure the accuracy of the assumptions and to adjust the
system based on the experience and input of the people of Carabuela.
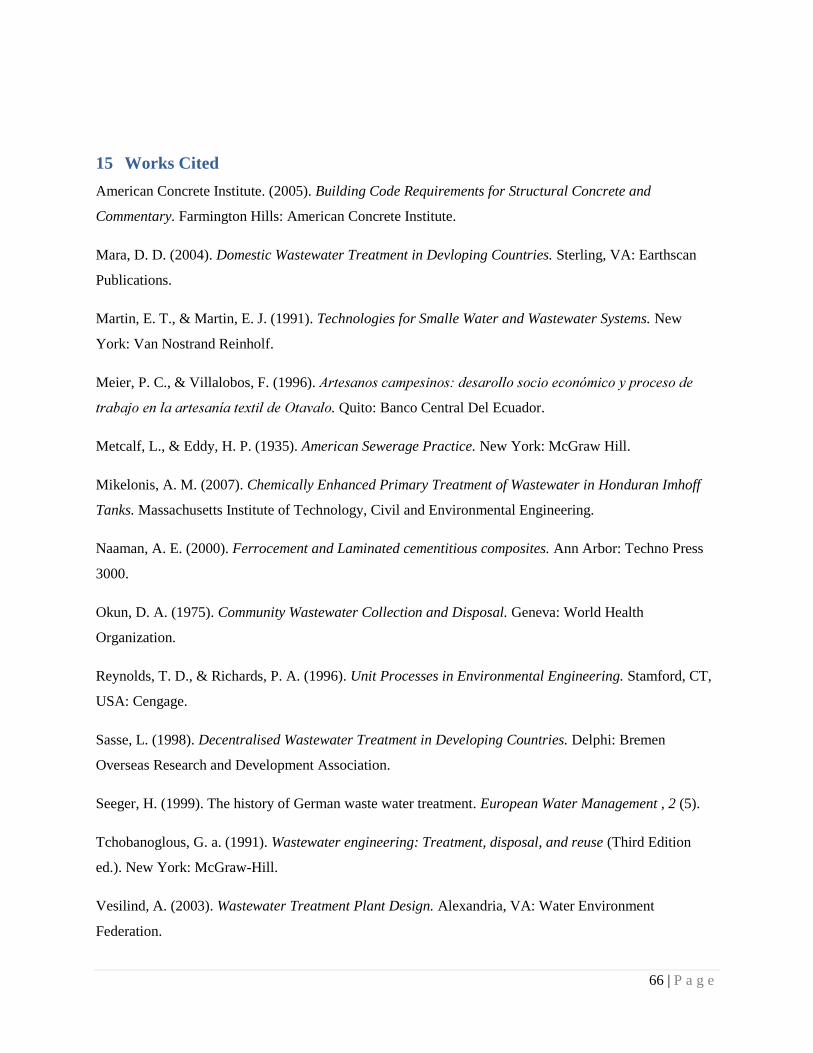
66 | P a g e
15 Works Cited
American Concrete Institute. (2005). Building Code Requirements for Structural Concrete and
Commentary. Farmington Hills: American Concrete Institute.
Mara, D. D. (2004). Domestic Wastewater Treatment in Devloping Countries. Sterling, VA: Earthscan
Publications.
Martin, E. T., & Martin, E. J. (1991). Technologies for Smalle Water and Wastewater Systems. New
York: Van Nostrand Reinholf.
Meier, P. C., & Villalobos, F. (1996).
. Quito: Banco Central Del Ecuador.
Metcalf, L., & Eddy, H. P. (1935). American Sewerage Practice. New York: McGraw Hill.
Mikelonis, A. M. (2007). Chemically Enhanced Primary Treatment of Wastewater in Honduran Imhoff
Tanks. Massachusetts Institute of Technology, Civil and Environmental Engineering.
Naaman, A. E. (2000). Ferrocement and Laminated cementitious composites. Ann Arbor: Techno Press
3000.
Okun, D. A. (1975). Community Wastewater Collection and Disposal. Geneva: World Health
Organization.
Reynolds, T. D., & Richards, P. A. (1996). Unit Processes in Environmental Engineering. Stamford, CT,
USA: Cengage.
Sasse, L. (1998). Decentralised Wastewater Treatment in Developing Countries. Delphi: Bremen
Overseas Research and Development Association.
Seeger, H. (1999). The history of German waste water treatment. European Water Management , 2 (5).
Tchobanoglous, G. a. (1991). Wastewater engineering: Treatment, disposal, and reuse (Third Edition
ed.). New York: McGraw-Hill.
Vesilind, A. (2003). Wastewater Treatment Plant Design. Alexandria, VA: Water Environment
Federation.

67 | P a g e
World Health Organization. (2006). Guidelines for the Safe Use of Wastewater, Excreta and Greywater
(Vol. Volume 2: Wastewater Use in Agriculture). World Health Orgainization.
World Health Organization. (2006). Guidelines for the Safe Use of Wastewater, Excreta and Greywater
(Vol. Volume 4: Excreta and Greywater Use in Agriculture). World Health Organization.

68 | P a g e
16 Acknowledgements
We would like to take this time to express our thanks to all those who helped us, and without whom we
could not have completed this project.
Professor Leonard De Rooy, was our team advisor, monitored our project and gave us suggestions where
our design fell short. Mr. Thomas Newhof, of Prein & Newhof,Inc. was our industrial consultant and
provided us with advice and direction at several key points. Professor David Wunder provided us with
advice and manuals on wastewater treatment.
Bruce Rydbeck of HCJB International was our contact in Ecuador. He connected us with the project, and
sent us the data from Carabuela. Anne Mikelonis and Janice Skadsen, contacts of Mr. Rydbeck with
wastewater experience in Latin America, also contributed suggestions to our project.
Phil Jasperse contributed time, expertise, and materials for our model, and Christie Pasek sacrificed part
of her weekend to help build it. Sandra Chang Garcia translated our Operations & Maintenance Manual
into Spanish.
Thanks again, and God bless you all.

69 | P a g e
17. Appendices
Appendix A: Calculations
Appendix B: Operations and Maintenance Manual
Appendix C: Structural Drawings
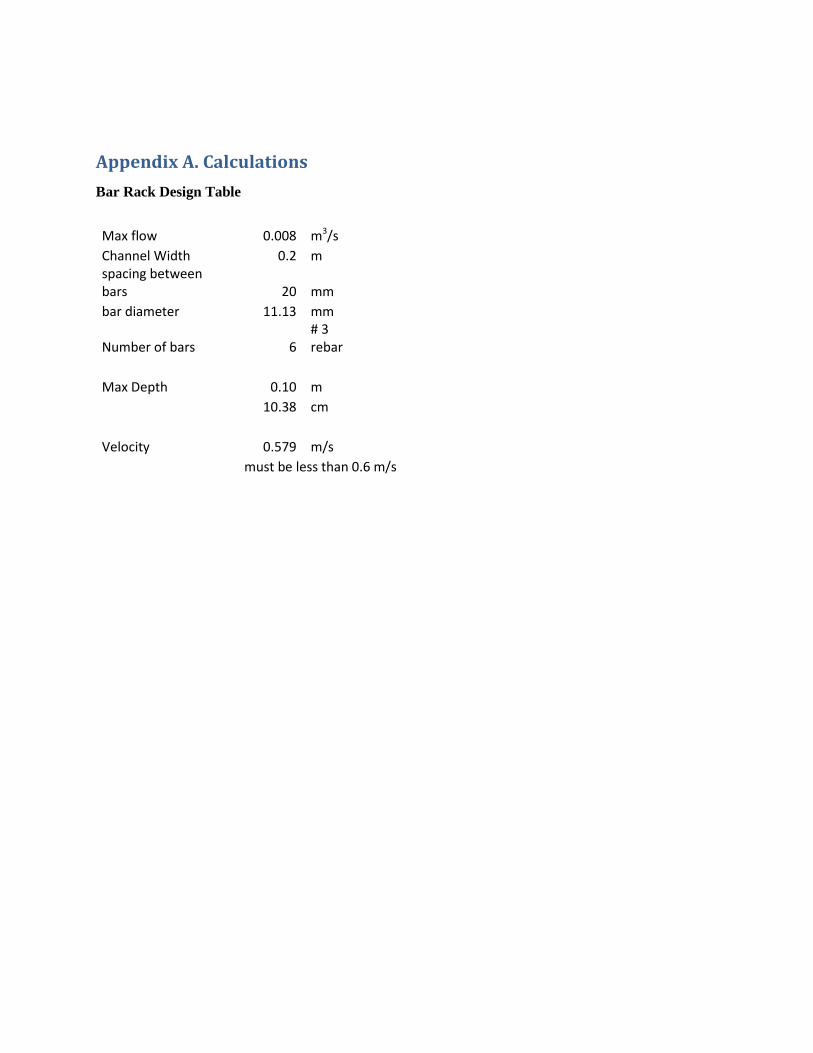
Appendix A. Calculations
Bar Rack Design Table
Max flow 0.008 m3/s Channel Width 0.2 m spacing between
bars 20 mm bar diameter 11.13 mm
Number of bars 6 # 3 rebar
Max Depth 0.10 m
10.38 cm
Velocity 0.579 m/s
must be less than 0.6 m/s
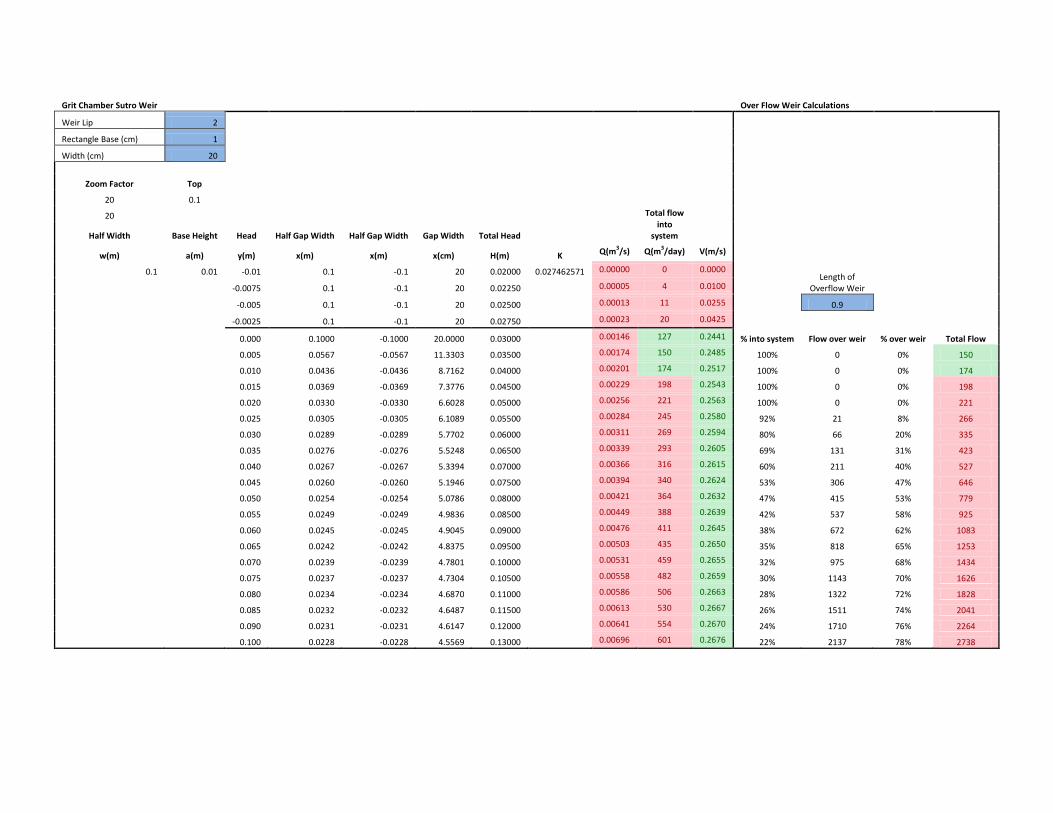
Grit Chamber Sutro Weir
Over Flow Weir Calculations
Weir Lip 2
Rectangle Base (cm) 1
Width (cm) 20
Zoom Factor Top
20 0.1
20
Total flow into
system
Half Width Base Height Head Half Gap Width Half Gap Width Gap Width Total Head
w(m) a(m) y(m) x(m) x(m) x(cm) H(m) K Q(m3/s) Q(m3/day) V(m/s)
0.1 0.01 -0.01 0.1 -0.1 20 0.02000 0.027462571 0.00000 0 0.0000 Length of
Overflow Weir
-0.0075 0.1 -0.1 20 0.02250
0.00005 4 0.0100
-0.005 0.1 -0.1 20 0.02500
0.00013 11 0.0255 0.9
-0.0025 0.1 -0.1 20 0.02750 0.00023 20 0.0425
0.000 0.1000 -0.1000 20.0000 0.03000
0.00146 127 0.2441 % into system Flow over weir % over weir Total Flow
0.005 0.0567 -0.0567 11.3303 0.03500
0.00174 150 0.2485 100% 0 0% 150
0.010 0.0436 -0.0436 8.7162 0.04000
0.00201 174 0.2517 100% 0 0% 174
0.015 0.0369 -0.0369 7.3776 0.04500
0.00229 198 0.2543 100% 0 0% 198
0.020 0.0330 -0.0330 6.6028 0.05000
0.00256 221 0.2563 100% 0 0% 221
0.025 0.0305 -0.0305 6.1089 0.05500
0.00284 245 0.2580 92% 21 8% 266
0.030 0.0289 -0.0289 5.7702 0.06000
0.00311 269 0.2594 80% 66 20% 335
0.035 0.0276 -0.0276 5.5248 0.06500
0.00339 293 0.2605 69% 131 31% 423
0.040 0.0267 -0.0267 5.3394 0.07000
0.00366 316 0.2615 60% 211 40% 527
0.045 0.0260 -0.0260 5.1946 0.07500
0.00394 340 0.2624 53% 306 47% 646
0.050 0.0254 -0.0254 5.0786 0.08000
0.00421 364 0.2632 47% 415 53% 779
0.055 0.0249 -0.0249 4.9836 0.08500
0.00449 388 0.2639 42% 537 58% 925
0.060 0.0245 -0.0245 4.9045 0.09000
0.00476 411 0.2645 38% 672 62% 1083
0.065 0.0242 -0.0242 4.8375 0.09500
0.00503 435 0.2650 35% 818 65% 1253
0.070 0.0239 -0.0239 4.7801 0.10000
0.00531 459 0.2655 32% 975 68% 1434
0.075 0.0237 -0.0237 4.7304 0.10500
0.00558 482 0.2659 30% 1143 70% 1626
0.080 0.0234 -0.0234 4.6870 0.11000
0.00586 506 0.2663 28% 1322 72% 1828
0.085 0.0232 -0.0232 4.6487 0.11500
0.00613 530 0.2667 26% 1511 74% 2041
0.090 0.0231 -0.0231 4.6147 0.12000
0.00641 554 0.2670 24% 1710 76% 2264
0.100 0.0228 -0.0228 4.5569 0.13000 0.00696 601 0.2676 22% 2137 78% 2738
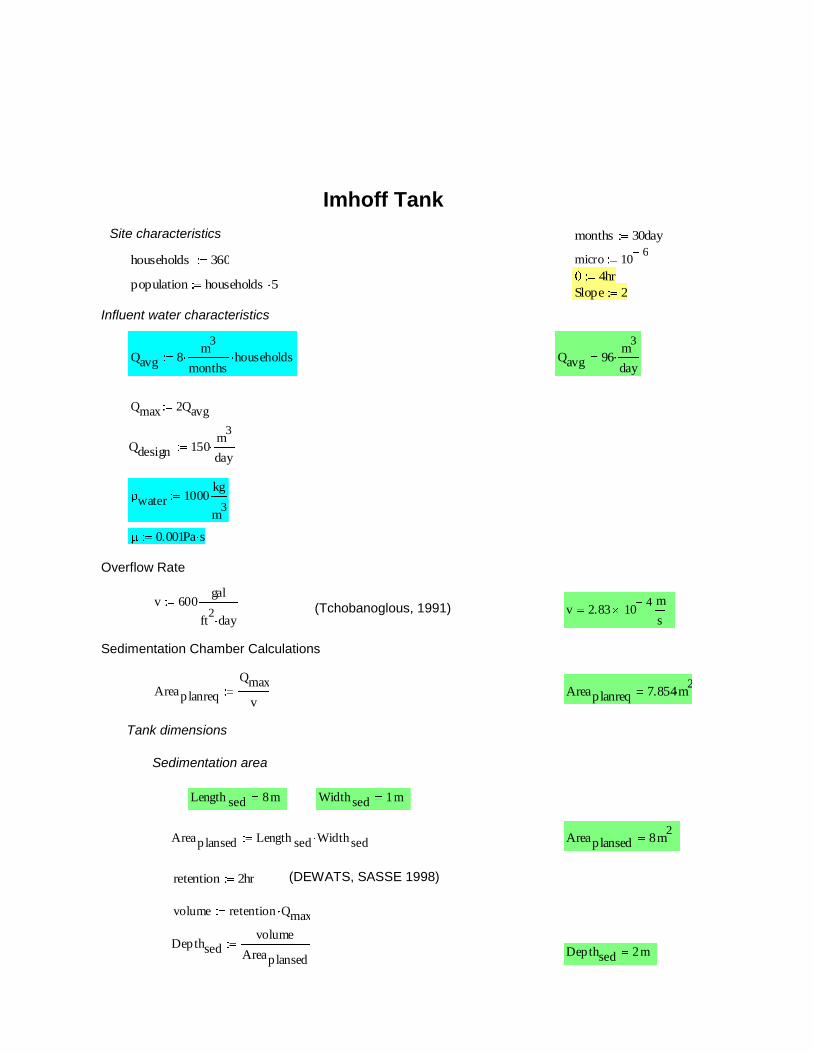
Imhoff Tank
Site characteristics
Influent water characteristics
Overflow Rate
(Tchobanoglous, 1991)
Sedimentation Chamber Calculations
Tank dimensions
Sedimentation area
(DEWATS, SASSE 1998)
months 30day
households 360 micro 106
4hrpopulation households 5
Slope 2
Qavg 8m
3
monthshouseholds Qavg 96
m3
day
Qmax 2Qavg
Qdesign 150m
3
day
water 1000kg
m3
0.001Pa s
v 600gal
ft2
dayv 2.83 10
4 m
s
Areaplanreq
Qmax
vAreaplanreq 7.854m
2
Length sed 8m Widthsed 1m
Areap lansed Length sed Widthsed Areaplansed 8m2
retention 2hr
volume retention Qmax
Depthsedvolume
AreaplansedDepthsed 2m
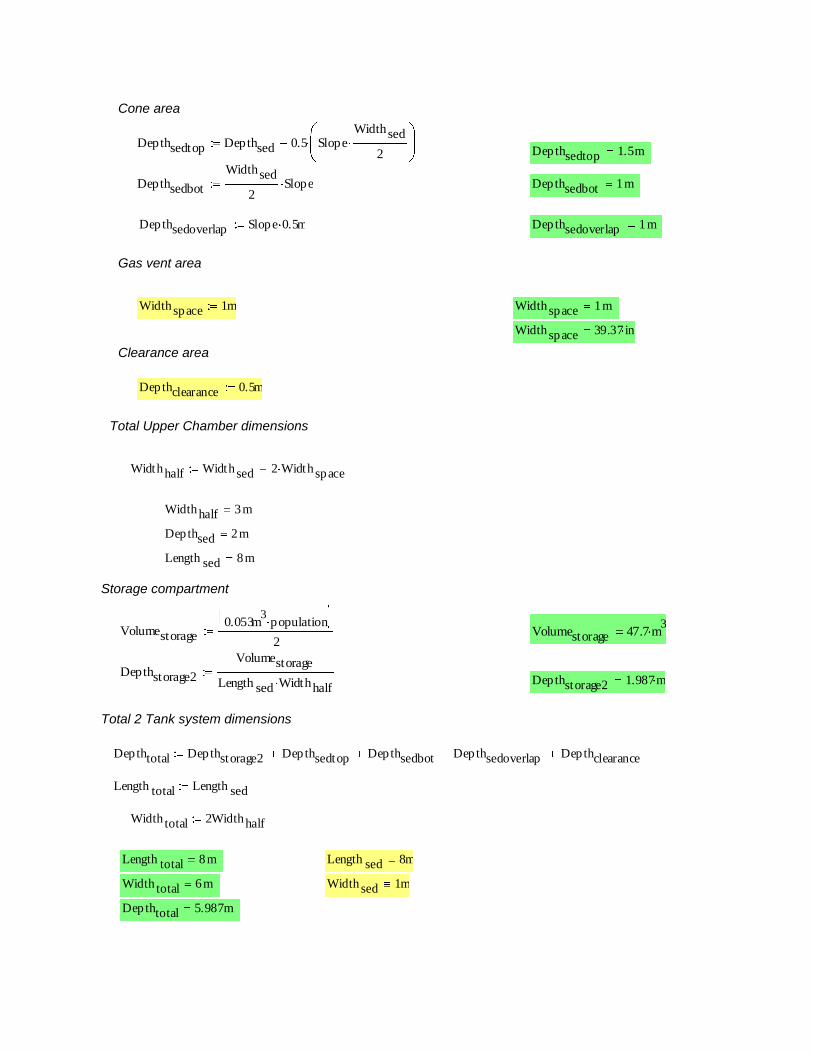
Cone area
Gas vent area
Clearance area
Total Upper Chamber dimensions
Storage compartment
Total 2 Tank system dimensions
Depthsedtop Depthsed 0.5 SlopeWidthsed
2 Dep thsedtop 1.5m
Depthsedbot
Widthsed
2Slope Depthsedbot 1m
Depthsedoverlap Slope 0.5m Dep thsedoverlap 1m
Widthspace 1m Widthspace 1m
Widthspace 39.37 in
Depthclearance 0.5m
Widthhalf Widthsed 2 Widthspace
Widthhalf 3m
Depthsed 2m
Length sed 8m
Volumestorage0.053m
3population
2Volumestorage 47.7 m
3
Depthstorage2
Volumestorage
Length sed WidthhalfDepthstorage2 1.987m
Depthtotal Depthstorage2 Depthsedtop Depthsedbot Depthsedoverlap Depthclearance
Length total Length sed
Width total 2Widthhalf
Length total 8m Length sed 8m
Width total 6m Widthsed 1m
Dep thtotal 5.987m
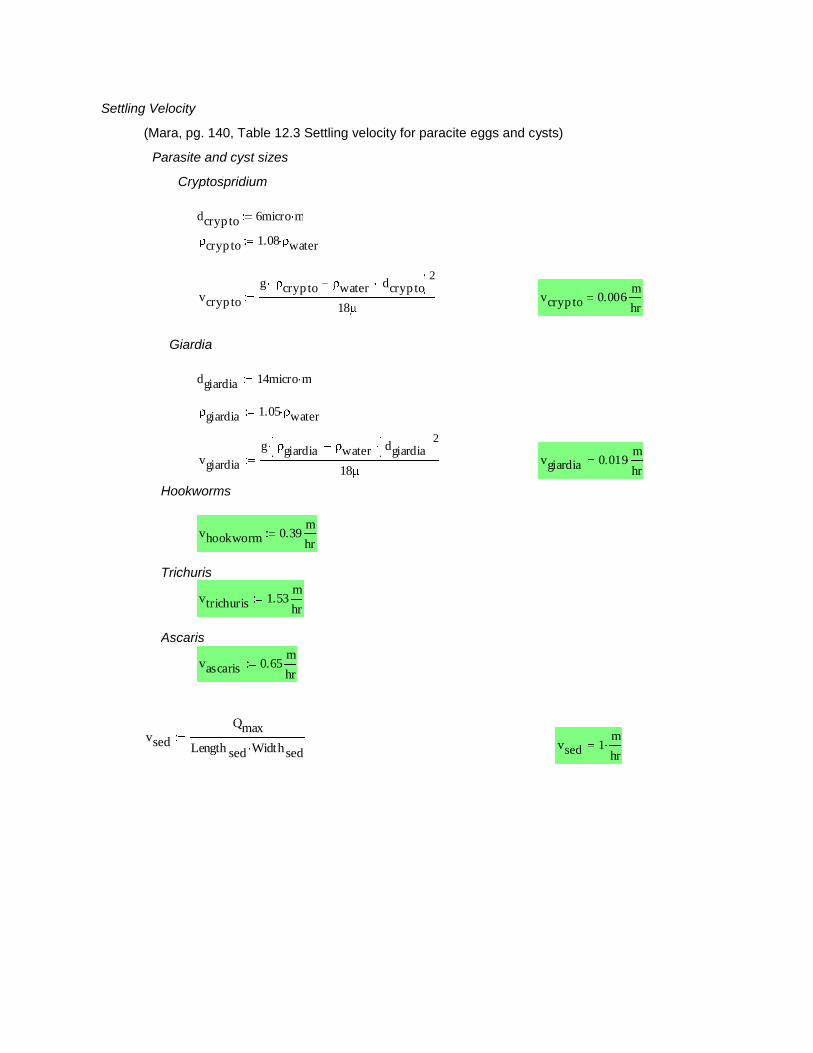
Settling Velocity
(Mara, pg. 140, Table 12.3 Settling velocity for paracite eggs and cysts)
Parasite and cyst sizes
Cryptospridium
Giardia
Hookworms
Trichuris
Ascaris
dcryp to 6micro m
crypto 1.08 water
vcryp to
g cryp to water dcryp to2
18vcryp to 0.006
m
hr
dgiardia 14micro m
giardia 1.05 water
vgiardia
g giardia water dgiardia2
18vgiardia 0.019
m
hr
vhookworm 0.39m
hr
vtrichuris 1.53m
hr
vascaris 0.65m
hr
vsed
Qmax
Length sed Widthsedvsed 1
m
hr
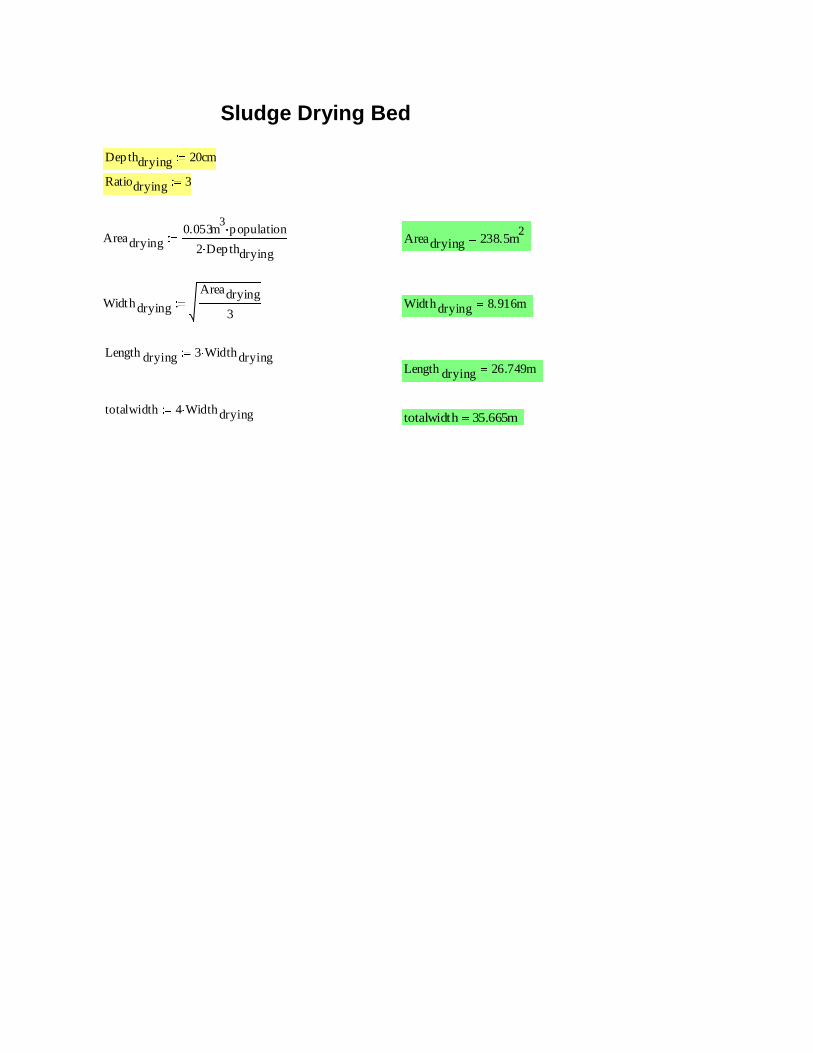
Sludge Drying Bed
Depthdrying 20cm
Ratiodrying 3
Areadrying0.053m
3population
2 Depthdrying
Areadrying 238.5m2
Widthdrying
Areadrying
3Widthdrying 8.916m
Length drying 3 WidthdryingLength drying 26.749m
totalwidth 4 Widthdrying totalwidth 35.665m
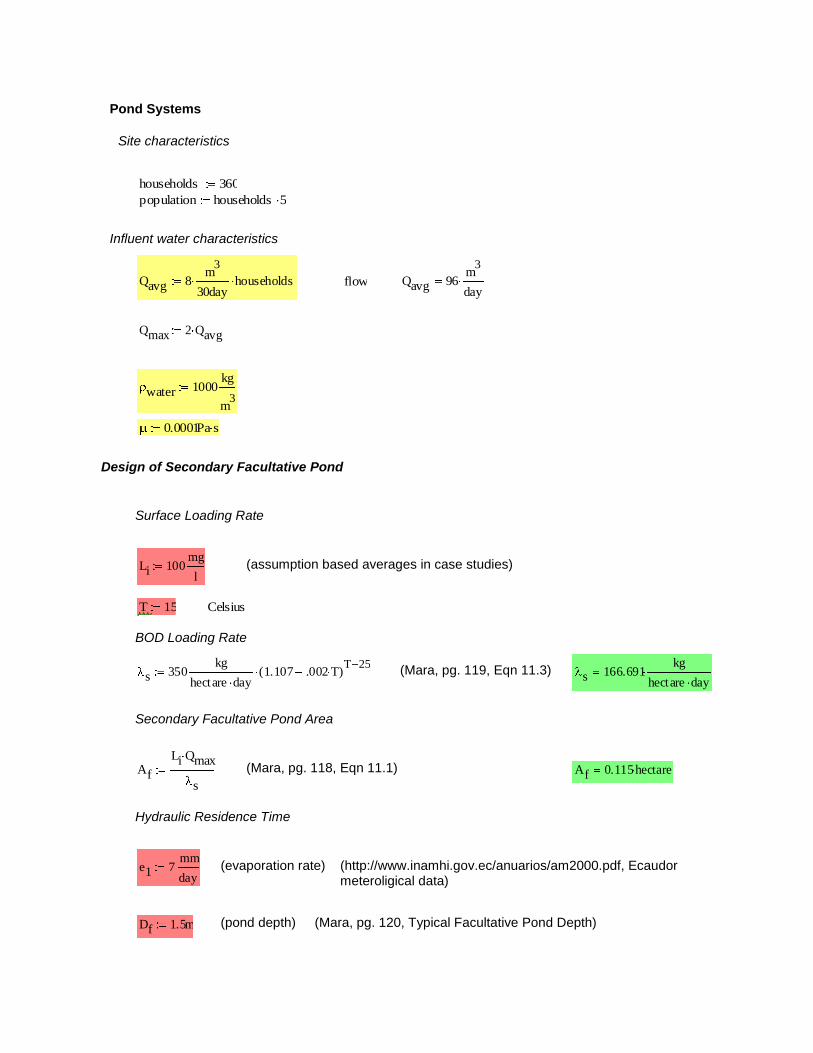
Pond Systems
Site characteristics
Influent water characteristics
Design of Secondary Facultative Pond
Surface Loading Rate
(assumption based averages in case studies)
BOD Loading Rate
(Mara, pg. 119, Eqn 11.3)
Secondary Facultative Pond Area
(Mara, pg. 118, Eqn 11.1)
Hydraulic Residence Time
(evaporation rate) (http://www.inamhi.gov.ec/anuarios/am2000.pdf, Ecaudor meteroligical data)
(pond depth) (Mara, pg. 120, Typical Facultative Pond Depth)
households 360
population households 5
Qavg 8m
3
30dayhouseholds flow Qavg 96
m3
day
Qmax 2 Qavg
water 1000kg
m3
0.0001Pa s
Li 100mg
l
T 15 Celsius
s 350kg
hectare day1.107 .002 T( )
T 25s 166.691
kg
hectare day
Af
Li Qmax
s
Af 0.115hectare
e1 7mm
day
Df 1.5m
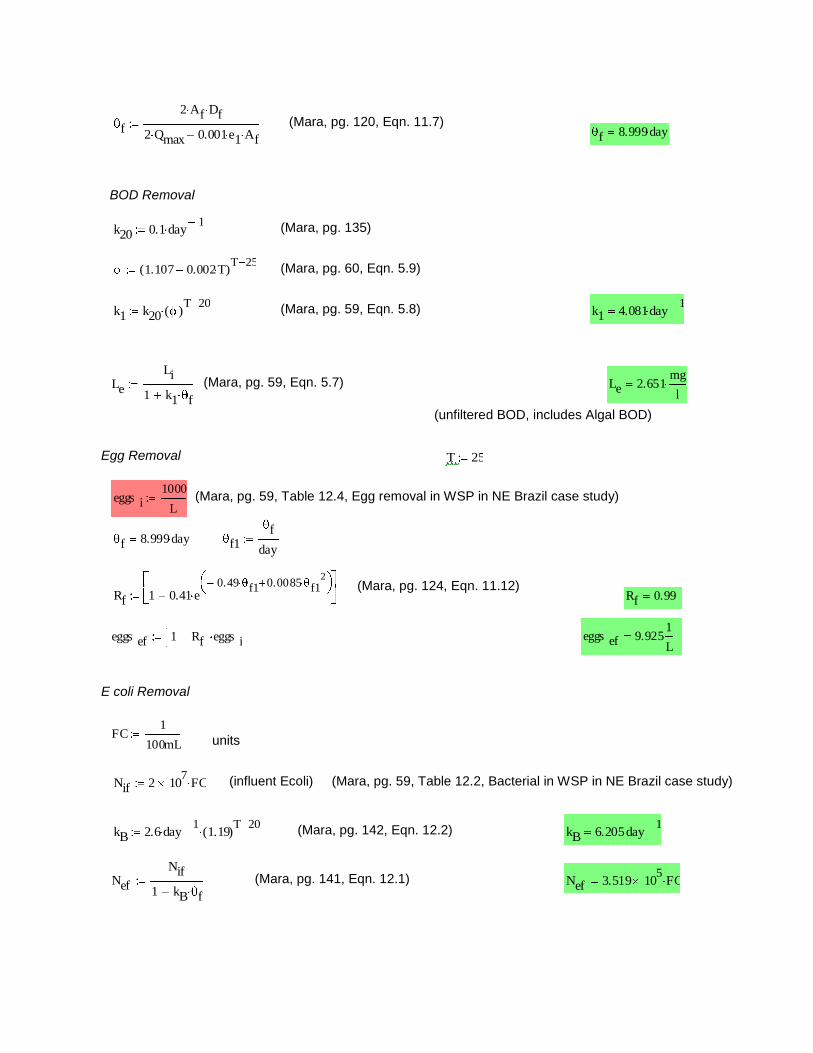
(Mara, pg. 120, Eqn. 11.7)
BOD Removal
(Mara, pg. 135)
(Mara, pg. 60, Eqn. 5.9)
(Mara, pg. 59, Eqn. 5.8)
(Mara, pg. 59, Eqn. 5.7)
(unfiltered BOD, includes Algal BOD)
Egg Removal
(Mara, pg. 59, Table 12.4, Egg removal in WSP in NE Brazil case study)
(Mara, pg. 124, Eqn. 11.12)
E coli Removal
units
(influent Ecoli) (Mara, pg. 59, Table 12.2, Bacterial in WSP in NE Brazil case study)
(Mara, pg. 142, Eqn. 12.2)
(Mara, pg. 141, Eqn. 12.1)
f
2 Af Df
2 Qmax 0.001e1 Af f 8.999day
k20 0.1 day1
1.107 0.002T( )T 25
k1 k20 ( )T 20
k1 4.081day1
Le
Li
1 k1 f
Le 2.651mg
l
T 25
eggs i1000
L
f 8.999day f1f
day
Rf 1 0.41 e0.49 f1 0.0085 f1
2
Rf 0.99
eggs ef 1 Rf eggs i eggs ef 9.9251
L
FC1
100mL
Nif 2 107
FC
kB 2.6 day1
1.19( )T 20
kB 6.205day1
Nef
Nif
1 kB f
Nef 3.519 105
FC
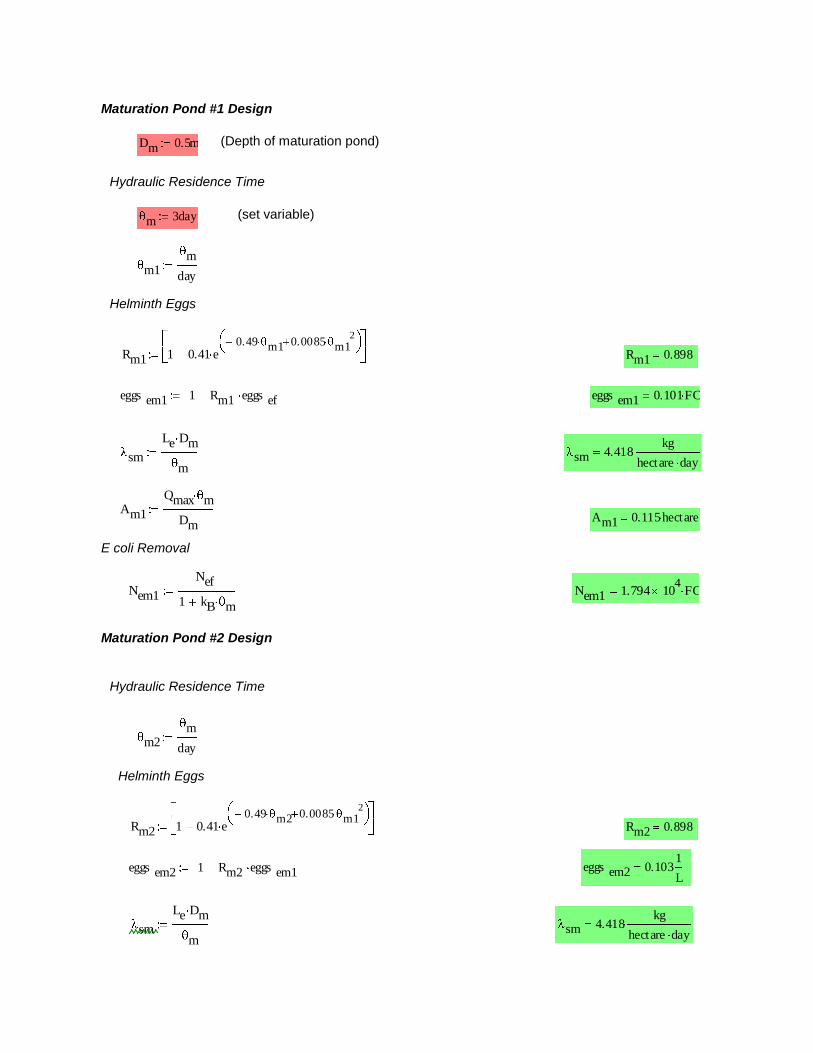
Maturation Pond #1 Design
(Depth of maturation pond)
Hydraulic Residence Time
(set variable)
Helminth Eggs
E coli Removal
Maturation Pond #2 Design
Hydraulic Residence Time
Helminth Eggs
Dm 0.5m
m 3day
m1m
day
Rm1 1 0.41 e0.49 m1 0.0085 m1
2
Rm1 0.898
eggs em1 1 Rm1 eggs ef eggs em1 0.101FC
sm
Le Dm
msm 4.418
kg
hectare day
Am1
Qmax m
DmAm1 0.115hectare
Nem1
Nef
1 kB m
Nem1 1.794 104
FC
m2m
day
Rm2 1 0.41 e0.49 m2 0.0085 m1
2
Rm2 0.898
eggs em2 1 Rm2 eggs em1 eggs em2 0.1031
L
sm
Le Dm
msm 4.418
kg
hectare day
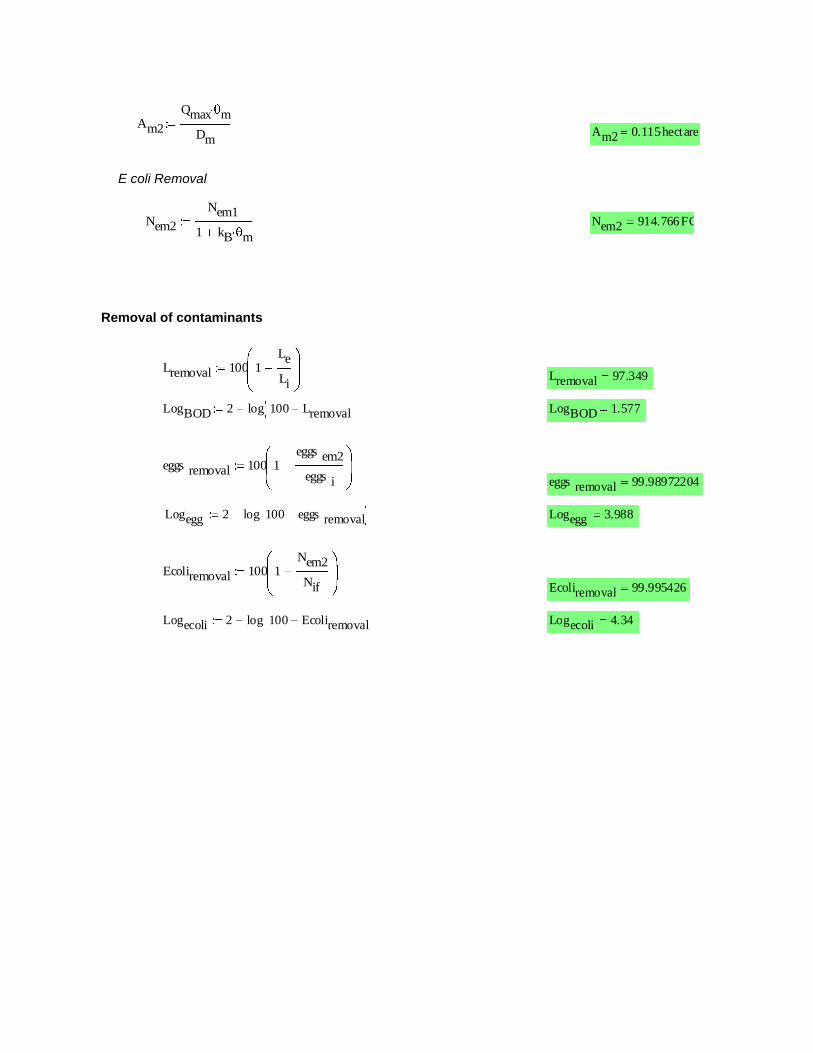
E coli Removal
Removal of contaminants
Am2
Qmax m
DmAm2 0.115hectare
Nem2
Nem1
1 kB m
Nem2 914.766FC
Lremoval 100 1Le
LiLremoval 97.349
LogBOD 2 log 100 Lremoval LogBOD 1.577
eggs removal 100 1eggs em2
eggs i eggs removal 99.98972204
Logegg 2 log 100 eggs removal Logegg 3.988
Ecoliremoval 100 1Nem2
Nif Ecoliremoval 99.995426
Logecoli 2 log 100 Ecoliremoval Logecoli 4.34
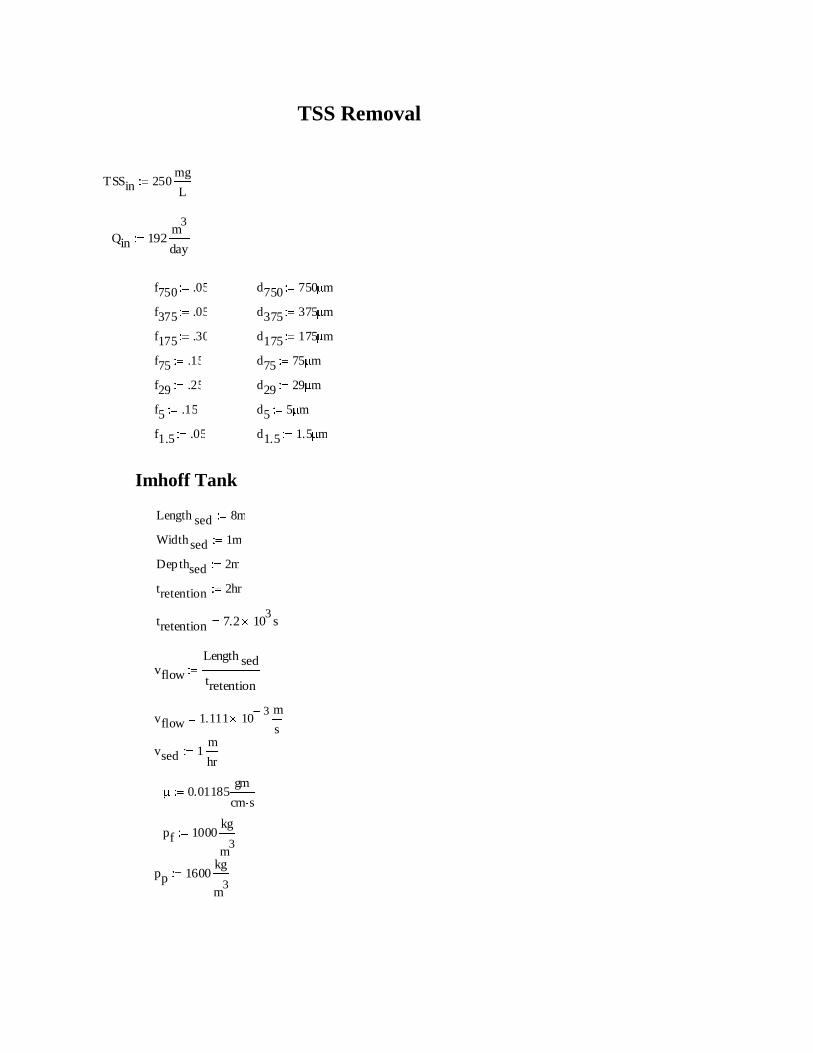
TSS Removal
Imhoff Tank
TSSin 250mg
L
Qin 192m
3
day
f750 .05 d750 750 m
f375 .05 d375 375 m
f175 .30 d175 175 m
f75 .15 d75 75 m
f29 .25 d29 29 m
f5 .15 d5 5 m
f1.5 .05 d1.5 1.5 m
Length sed 8m
Width sed 1m
Dep thsed 2m
tretention 2hr
tretention 7.2 103
s
vflow
Length sed
tretention
vflow 1.111 103 m
s
vsed 1m
hr
0.01185gm
cm s
pf 1000kg
m3
pp 1600kg
m3
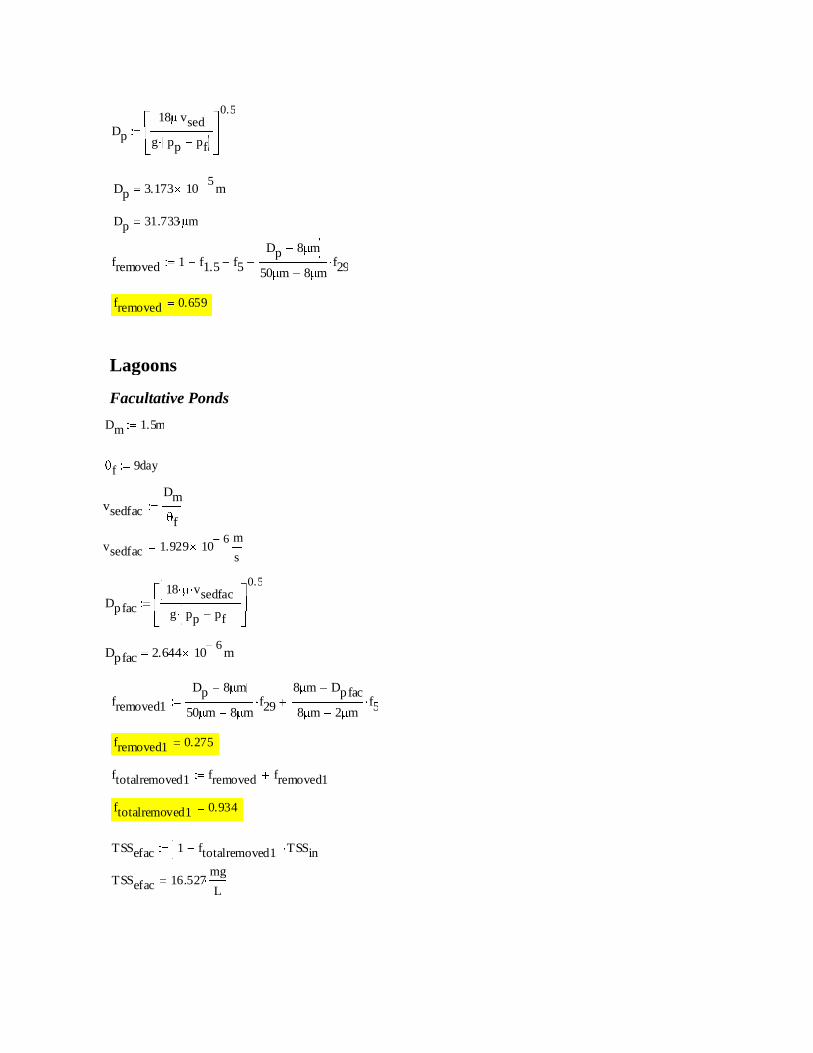
Lagoons
Facultative Ponds
Dp
18 vsed
g pp pf
0.5
Dp 3.173 105
m
Dp 31.733 m
fremoved 1 f1.5 f5
Dp 8 m
50 m 8 mf29
fremoved 0.659
Dm 1.5m
f 9day
vsedfac
Dm
f
vsedfac 1.929 106 m
s
Dpfac
18 vsedfac
g pp pf
0.5
Dpfac 2.644 106
m
fremoved1
Dp 8 m
50 m 8 mf29
8 m Dpfac
8 m 2 mf5
fremoved1 0.275
ftotalremoved1 fremoved fremoved1
ftotalremoved1 0.934
TSSefac 1 ftotalremoved1 TSSin
TSSefac 16.527mg
L
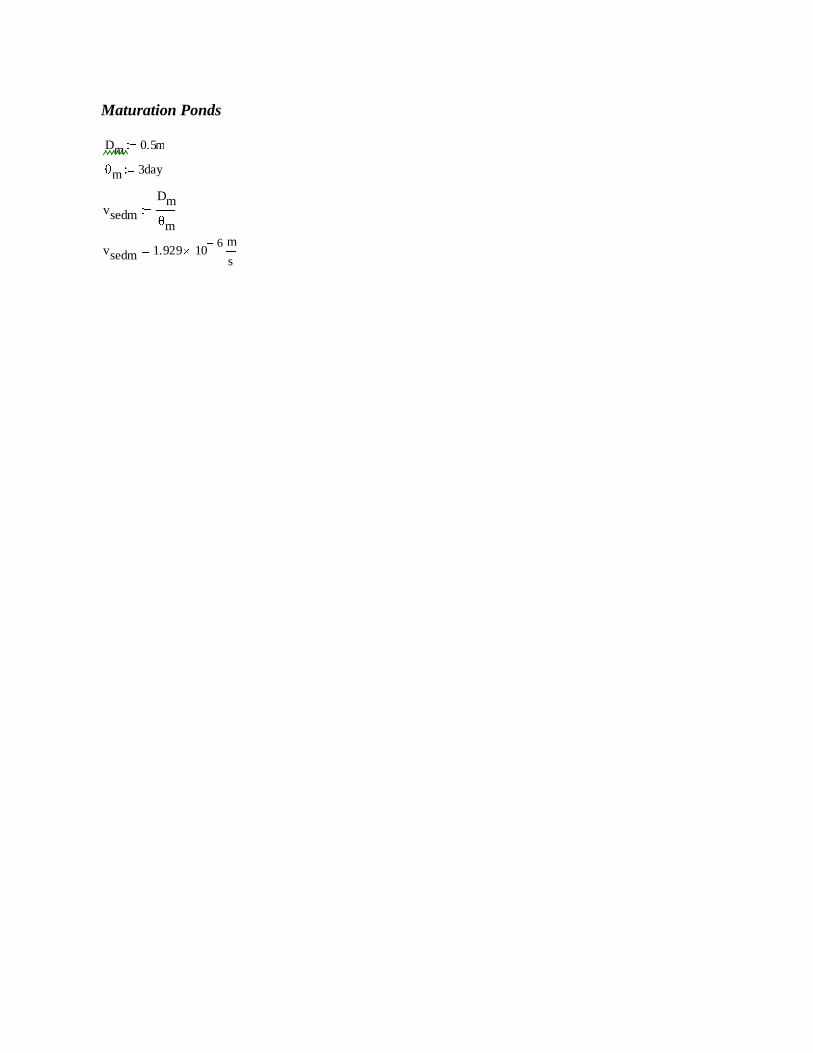
Maturation Ponds
Dm 0.5m
m 3day
vsedm
Dm
m
vsedm 1.929 106 m
s
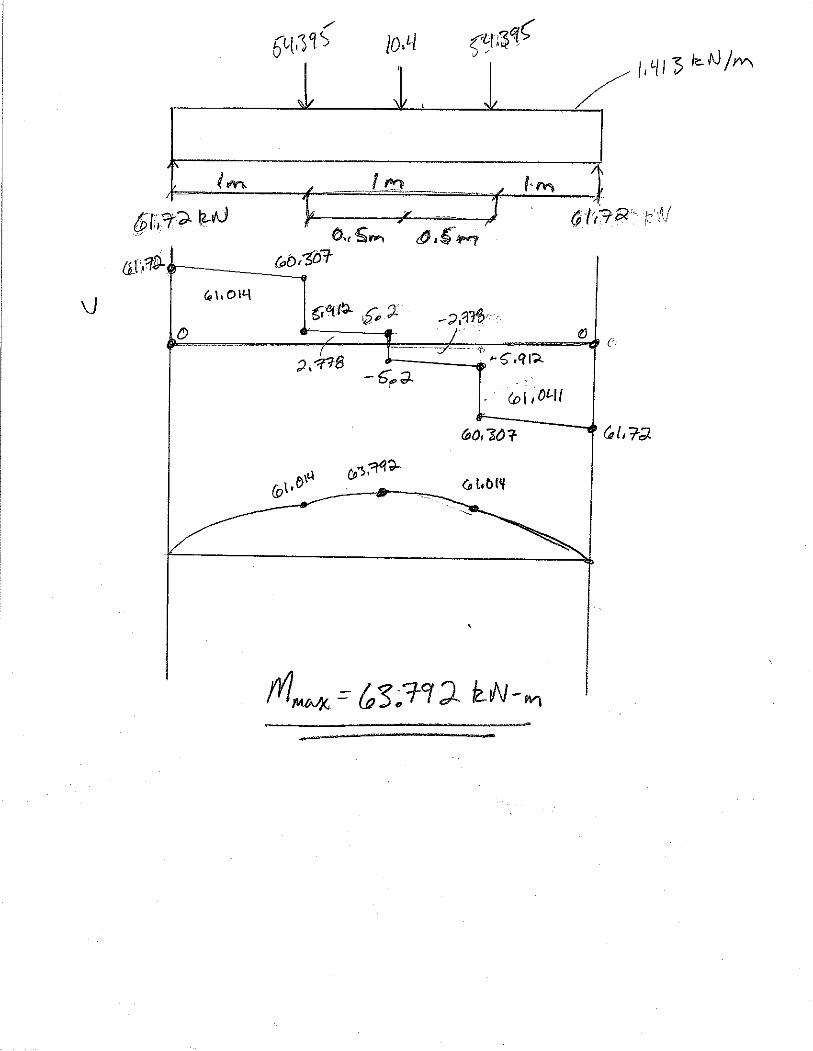
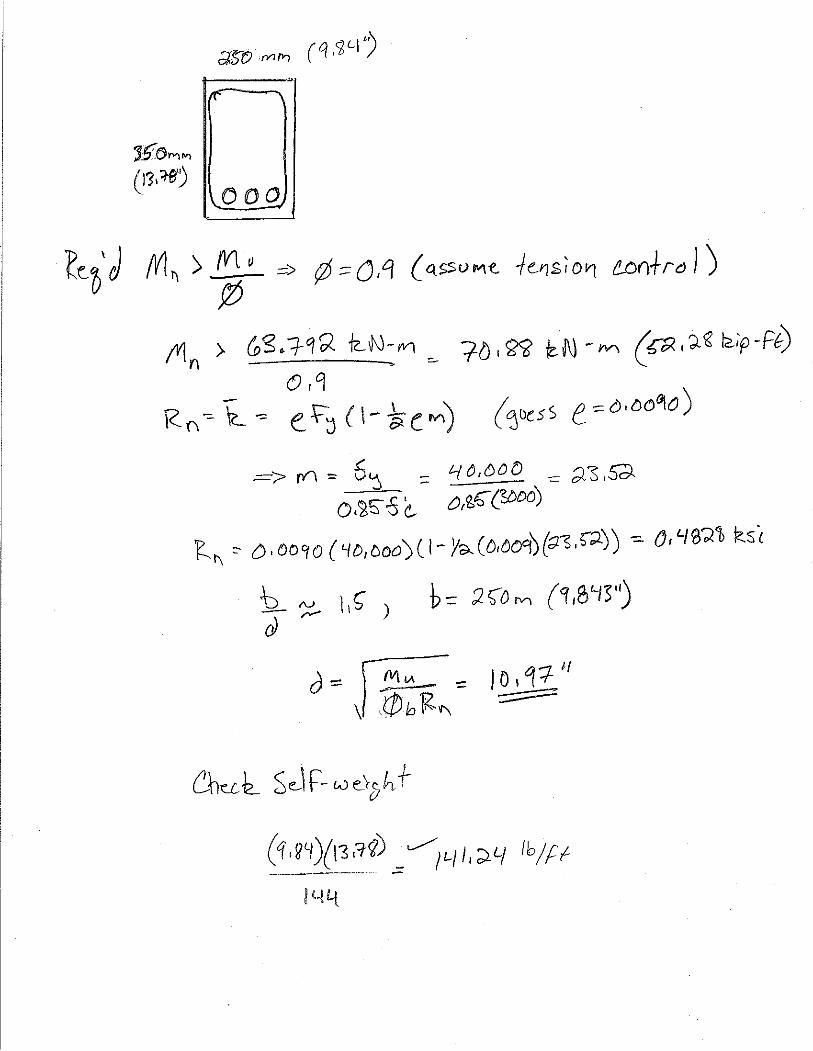
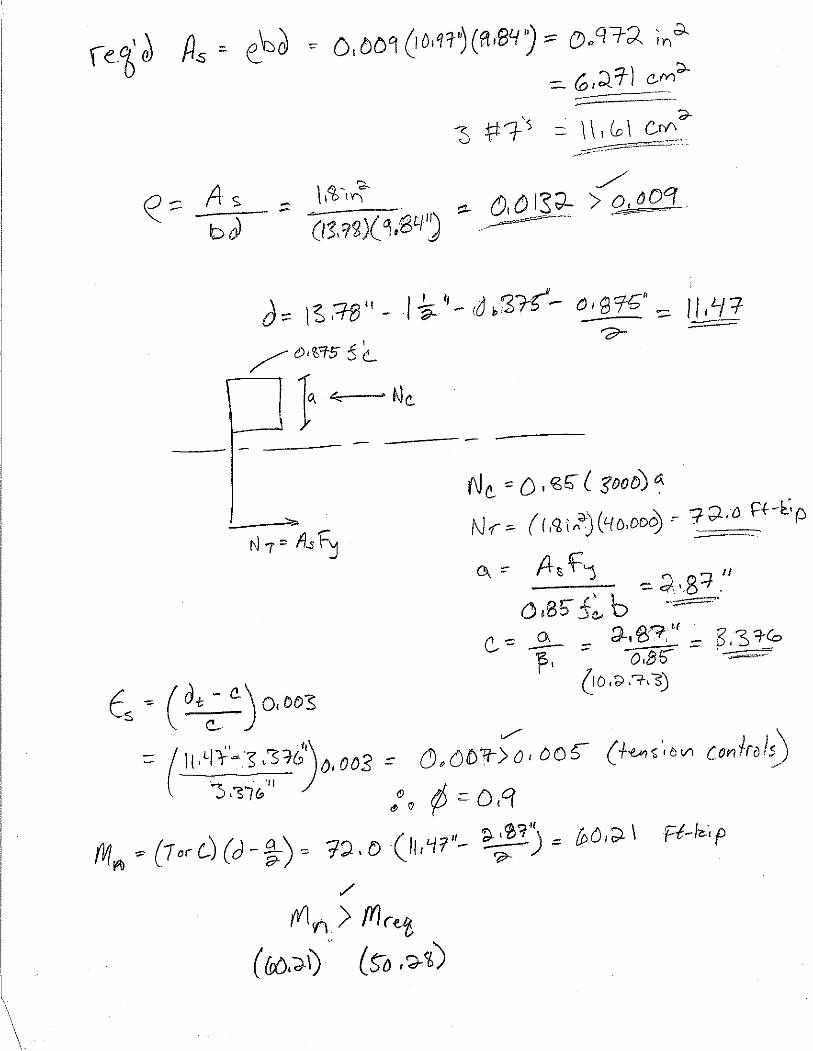
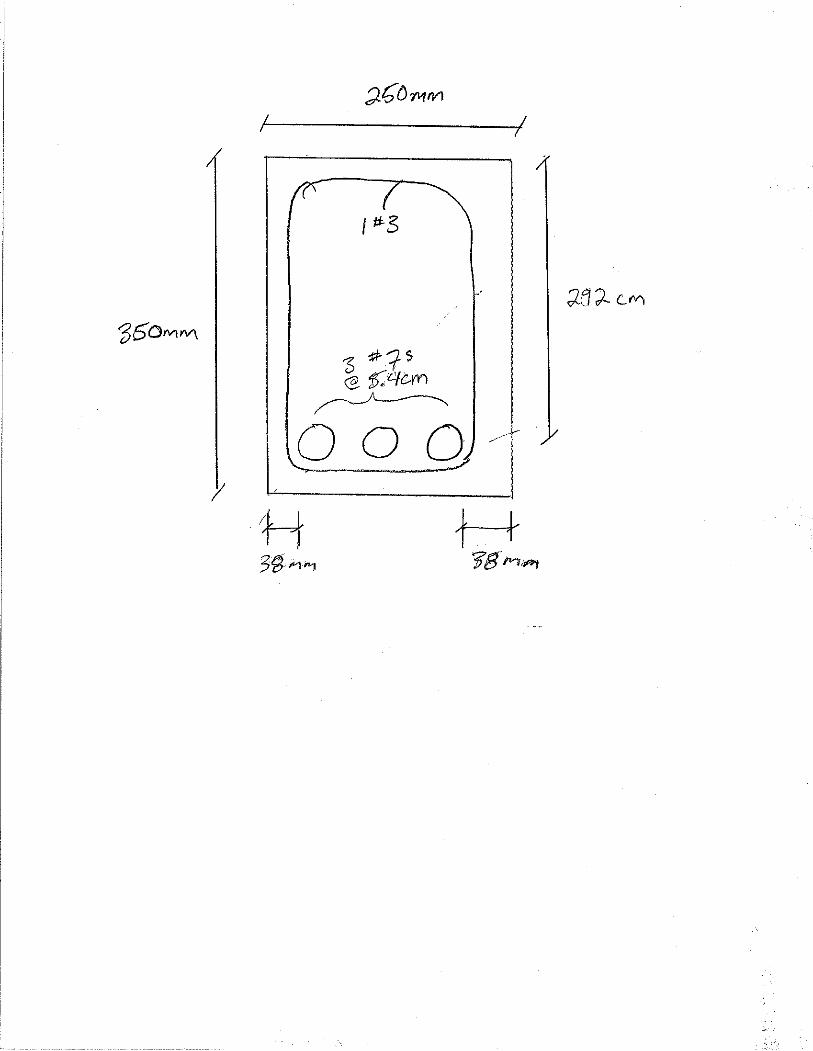
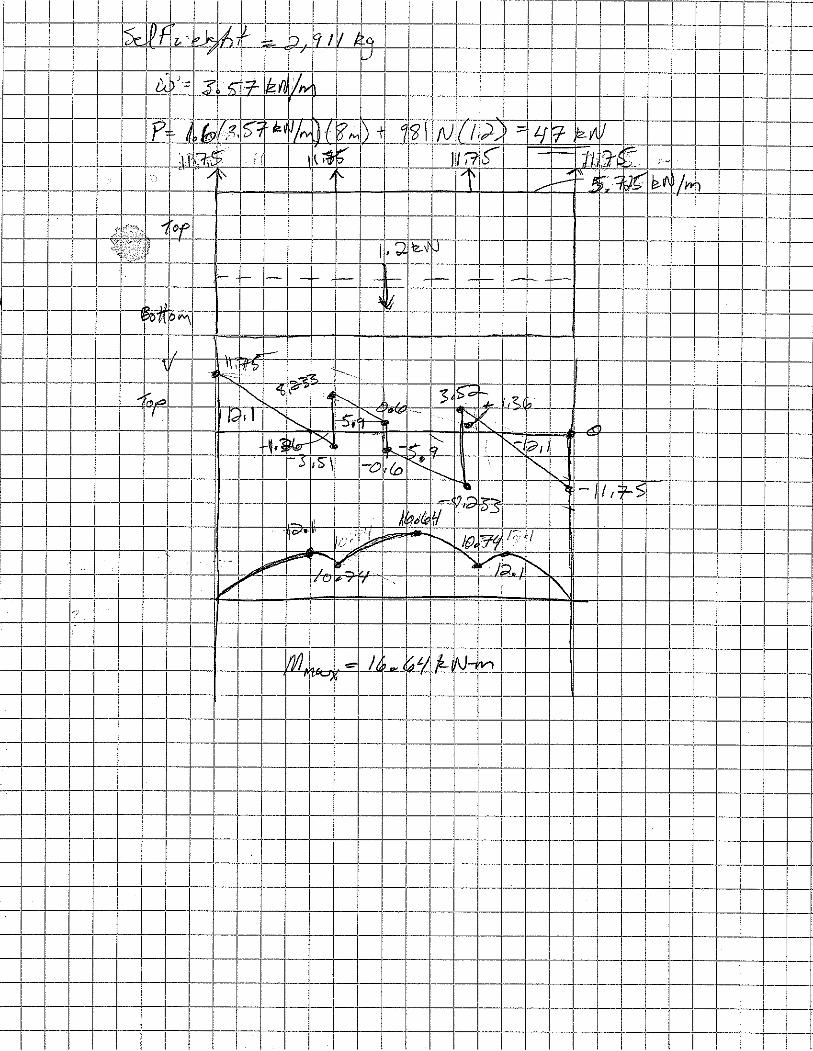
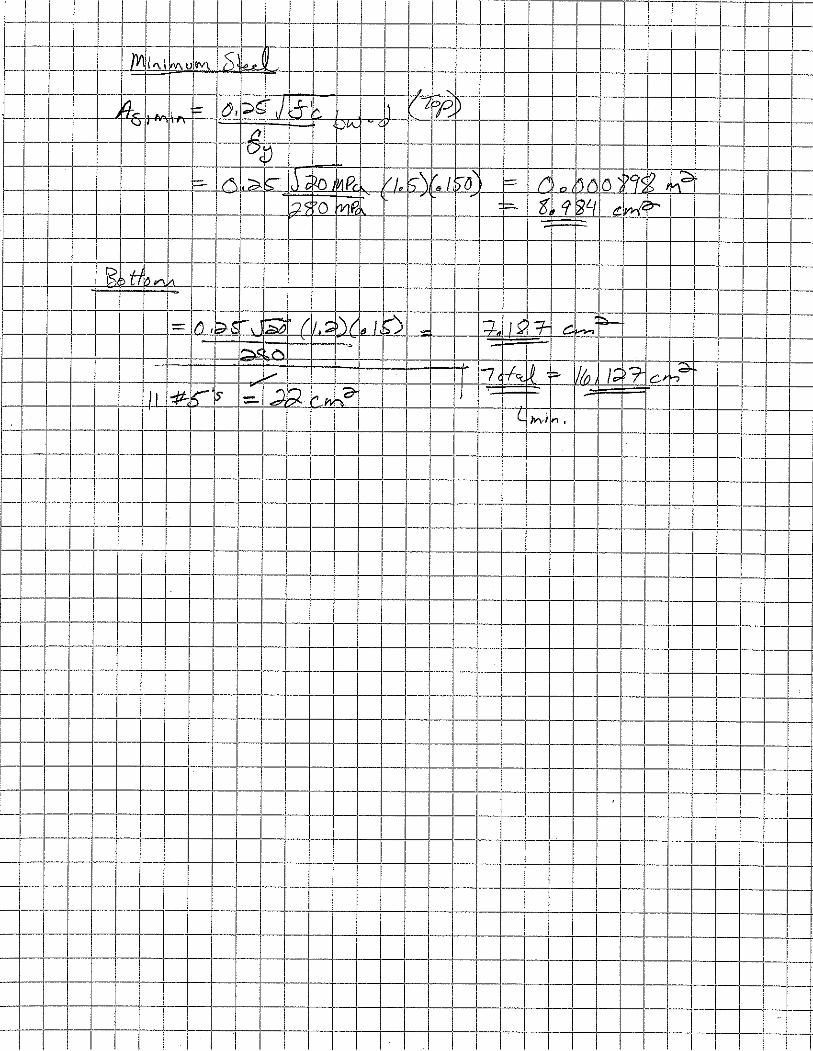
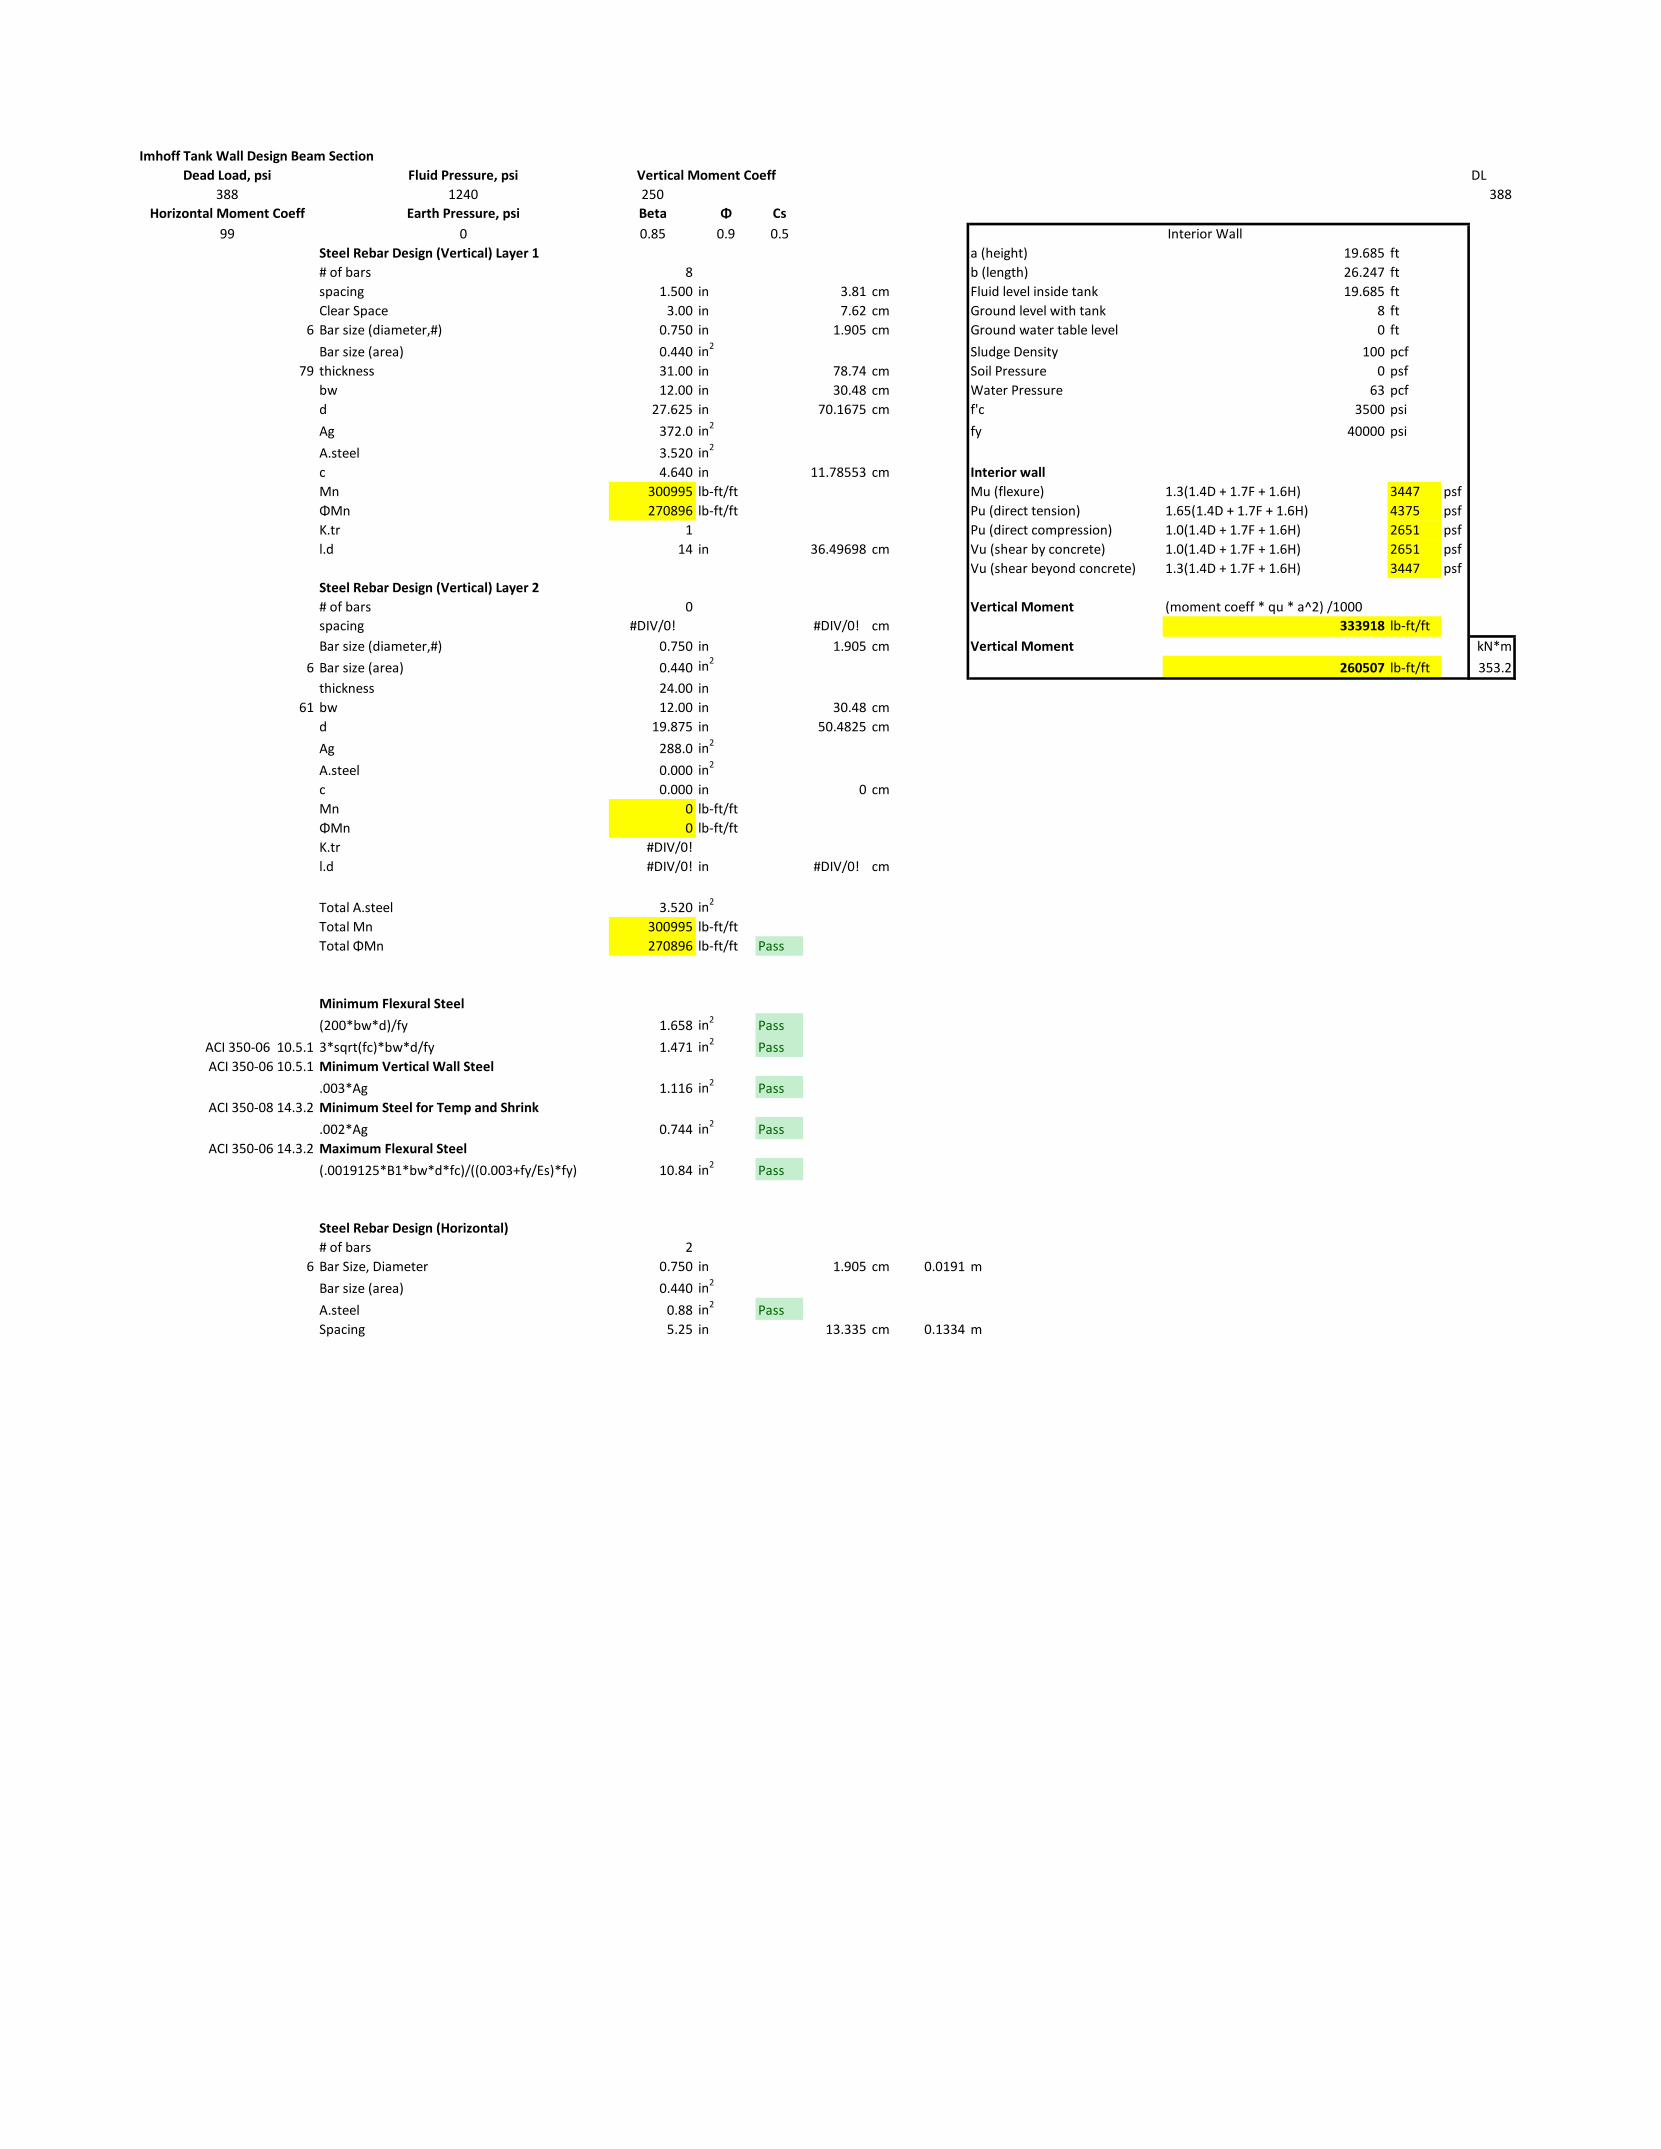
Imhoff Tank Wall Design Beam Section
Dead Load, psi Fluid Pressure, psi DL
388 1240 250 388
Horizontal Moment Coeff Earth Pressure, psi Beta Φ Cs
99 0 0.85 0.9 0.5
Steel Rebar Design (Vertical) Layer 1 a (height) 19.685 ft
# of bars 8 b (length) 26.247 ft
spacing 1.500 in 3.81 cm Fluid level inside tank 19.685 ft
Clear Space 3.00 in 7.62 cm Ground level with tank 8 ft
6 Bar size (diameter,#) 0.750 in 1.905 cm Ground water table level 0 ft
Bar size (area) 0.440 in2Sludge Density 100 pcf
79 thickness 31.00 in 78.74 cm Soil Pressure 0 psf
bw 12.00 in 30.48 cm Water Pressure 63 pcf
d 27.625 in 70.1675 cm f'c 3500 psi
Ag 372.0 in2fy 40000 psi
A.steel 3.520 in2
c 4.640 in 11.78553 cm Interior wall
Mn 300995 lb-ft/ft Mu (flexure) 1.3(1.4D + 1.7F + 1.6H) 3447 psf
ΦMn 270896 lb-ft/ft Pu (direct tension) 1.65(1.4D + 1.7F + 1.6H) 4375 psf
K.tr 1 Pu (direct compression) 1.0(1.4D + 1.7F + 1.6H) 2651 psf
l.d 14 in 36.49698 cm Vu (shear by concrete) 1.0(1.4D + 1.7F + 1.6H) 2651 psf
Vu (shear beyond concrete) 1.3(1.4D + 1.7F + 1.6H) 3447 psf
Steel Rebar Design (Vertical) Layer 2
# of bars 0 Vertical Moment (moment coeff * qu * a^2) /1000
spacing #DIV/0! #DIV/0! cm 333918 lb-ft/ft
Bar size (diameter,#) 0.750 in 1.905 cm Vertical Moment kN*m
6 Bar size (area) 0.440 in2260507 lb-ft/ft 353.2
thickness 24.00 in
61 bw 12.00 in 30.48 cm
d 19.875 in 50.4825 cm
Ag 288.0 in2
A.steel 0.000 in2
c 0.000 in 0 cm
Mn 0 lb-ft/ft
ΦMn 0 lb-ft/ft
K.tr #DIV/0!
l.d #DIV/0! in #DIV/0! cm
Total A.steel 3.520 in2
Total Mn 300995 lb-ft/ft
Total ΦMn 270896 lb-ft/ft Pass
Minimum Flexural Steel
(200*bw*d)/fy 1.658 in2Pass
ACI 350-06 10.5.1 3*sqrt(fc)*bw*d/fy 1.471 in2Pass
ACI 350-06 10.5.1 Minimum Vertical Wall Steel
.003*Ag 1.116 in2Pass
ACI 350-08 14.3.2 Minimum Steel for Temp and Shrink
.002*Ag 0.744 in2Pass
ACI 350-06 14.3.2 Maximum Flexural Steel
(.0019125*B1*bw*d*fc)/((0.003+fy/Es)*fy) 10.84 in2Pass
Steel Rebar Design (Horizontal)
# of bars 2
6 Bar Size, Diameter 0.750 in 1.905 cm 0.0191 m
Bar size (area) 0.440 in2
A.steel 0.88 in2Pass
Spacing 5.25 in 13.335 cm 0.1334 m
Vertical Moment Coeff
Interior Wall
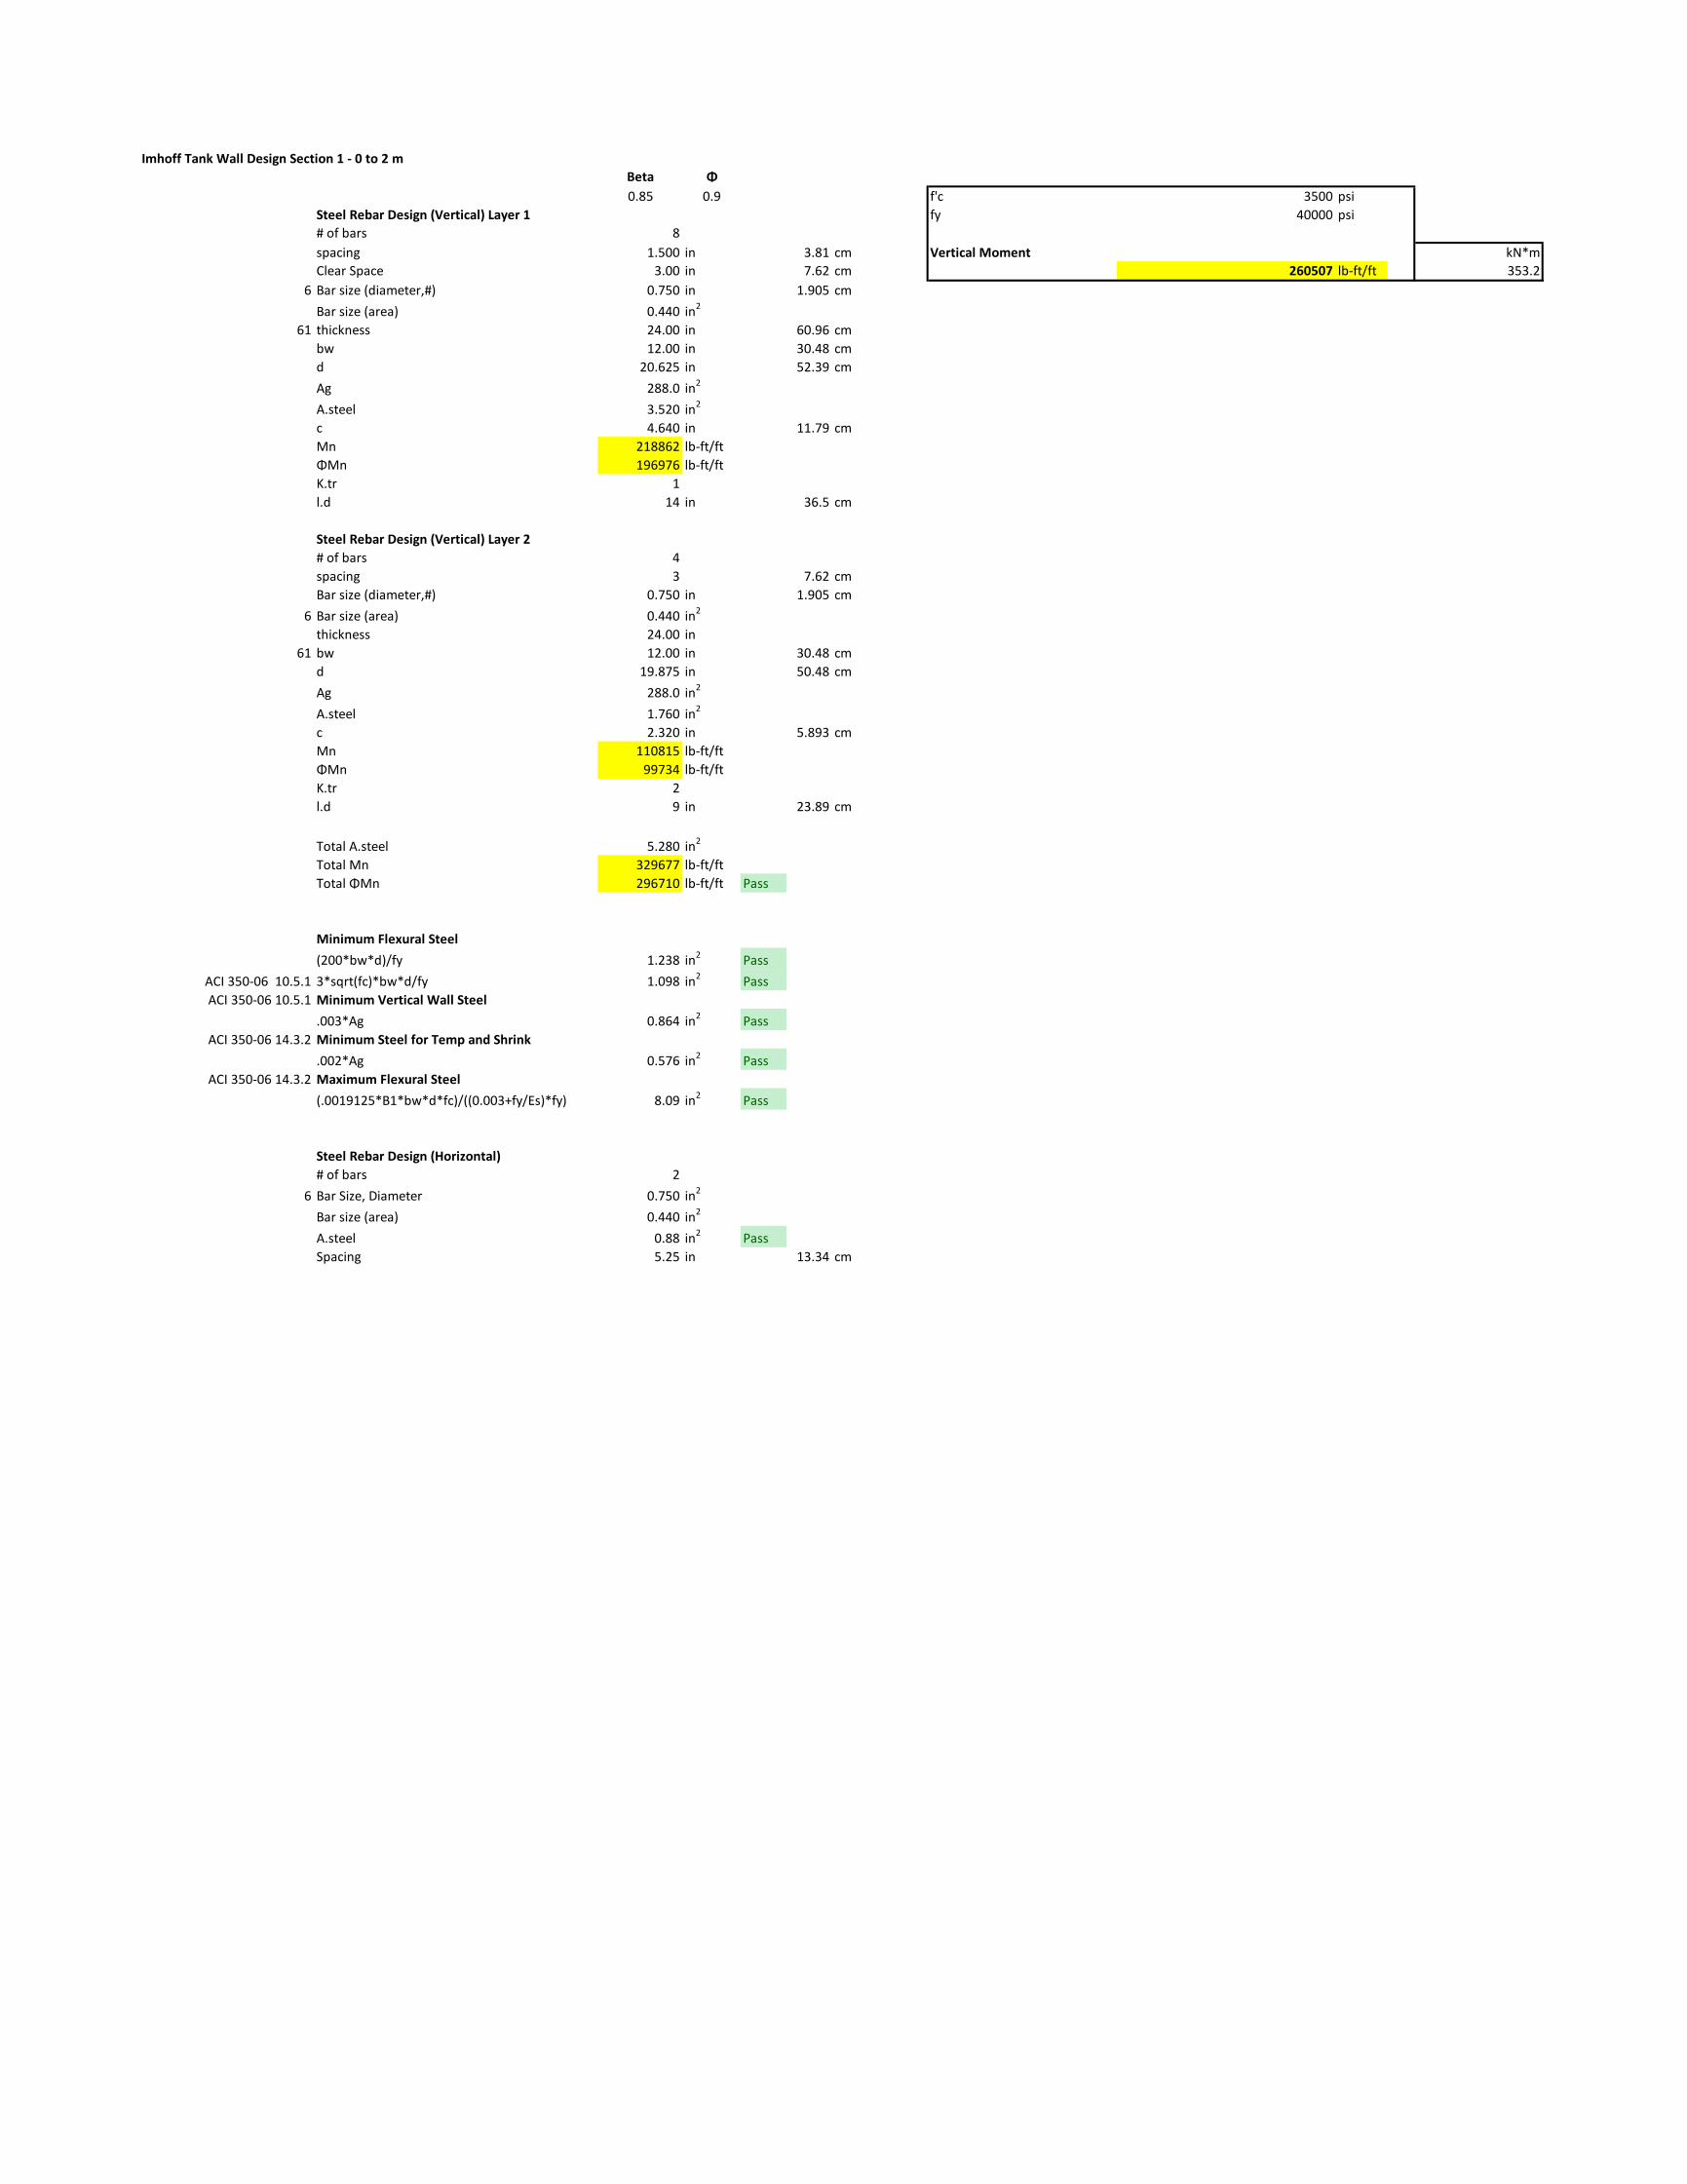
Imhoff Tank Wall Design Section 1 - 0 to 2 m
Beta Φ
0.85 0.9 f'c 3500 psi
Steel Rebar Design (Vertical) Layer 1 fy 40000 psi
# of bars 8
spacing 1.500 in 3.81 cm Vertical Moment kN*m
Clear Space 3.00 in 7.62 cm 260507 lb-ft/ft 353.2
6 Bar size (diameter,#) 0.750 in 1.905 cm
Bar size (area) 0.440 in2
61 thickness 24.00 in 60.96 cm
bw 12.00 in 30.48 cm
d 20.625 in 52.39 cm
Ag 288.0 in2
A.steel 3.520 in2
c 4.640 in 11.79 cm
Mn 218862 lb-ft/ft
ΦMn 196976 lb-ft/ft
K.tr 1
l.d 14 in 36.5 cm
Steel Rebar Design (Vertical) Layer 2
# of bars 4
spacing 3 7.62 cm
Bar size (diameter,#) 0.750 in 1.905 cm
6 Bar size (area) 0.440 in2
thickness 24.00 in
61 bw 12.00 in 30.48 cm
d 19.875 in 50.48 cm
Ag 288.0 in2
A.steel 1.760 in2
c 2.320 in 5.893 cm
Mn 110815 lb-ft/ft
ΦMn 99734 lb-ft/ft
K.tr 2
l.d 9 in 23.89 cm
Total A.steel 5.280 in2
Total Mn 329677 lb-ft/ft
Total ΦMn 296710 lb-ft/ft Pass
Minimum Flexural Steel
(200*bw*d)/fy 1.238 in2 Pass
ACI 350-06 10.5.1 3*sqrt(fc)*bw*d/fy 1.098 in2 Pass
ACI 350-06 10.5.1 Minimum Vertical Wall Steel
.003*Ag 0.864 in2 Pass
ACI 350-06 14.3.2 Minimum Steel for Temp and Shrink
.002*Ag 0.576 in2 Pass
ACI 350-06 14.3.2 Maximum Flexural Steel
(.0019125*B1*bw*d*fc)/((0.003+fy/Es)*fy) 8.09 in2 Pass
Steel Rebar Design (Horizontal)
# of bars 2
6 Bar Size, Diameter 0.750 in2
Bar size (area) 0.440 in2
A.steel 0.88 in2 Pass
Spacing 5.25 in 13.34 cm

Imhoff Tank Wall Design Section 2 - 2 to 4 m
Beta Φ
0.85 0.9 f'c 3500 psi
Steel Rebar Design (Vertical) Layer 1 fy 40000 psi
# of bars 8
Clear Space 3.00 in Vertical Moment kN*m
6 Bar size (diameter,#) 0.750 in 173652 lb-ft/ft 235.44
Bar size (area) 0.440 in2
61 thickness 24.00 in
bw 12.00 in
d 20.625 in
Ag 288.0 in2
A.steel 3.520 in2
c 4.640 in
Mn 218862 lb-ft/ft
ΦMn 196976 lb-ft/ft
K.tr 1
l.d 14 in
Steel Rebar Design (Vertical) Layer 2
# of bars 0
Bar size (diameter,#) 0.750 in
6 Bar size (area) 0.440 in2
thickness 24.00 in
61 bw 12.00 in
d 19.875 in
Ag 288.0 in2
A.steel 0.000 in2
c 0.000 in
Mn 0 lb-ft/ft
ΦMn 0 lb-ft/ft
K.tr #DIV/0!
l.d #DIV/0! in
Total A.steel 3.520 in2
Total Mn 218862 lb-ft/ft
Total ΦMn 196976 lb-ft/ft Pass
Minimum Flexural Steel
(200*bw*d)/fy 1.238 in2Pass
ACI 350-06 10.5.1 3*sqrt(fc)*bw*d/fy 1.098 in2Pass
ACI 350-06 10.5.1 Minimum Vertical Wall Steel
.003*Ag 0.864 in2Pass
ACI 350-06 14.3.2 Minimum Steel for Temp and Shrink
.002*Ag 0.576 in2Pass
ACI 350-06 14.3.2 Maximum Flexural Steel
(.0019125*B1*bw*d*fc)/((0.003+fy/Es)*fy) 8.09 in2Pass
Steel Rebar Design (Horizontal)
# of bars 2
6 Bar Size, Diameter 0.750 in2
Bar size (area) 0.440 in2
A.steel 0.88 in3Pass
Spacing 5.25 in
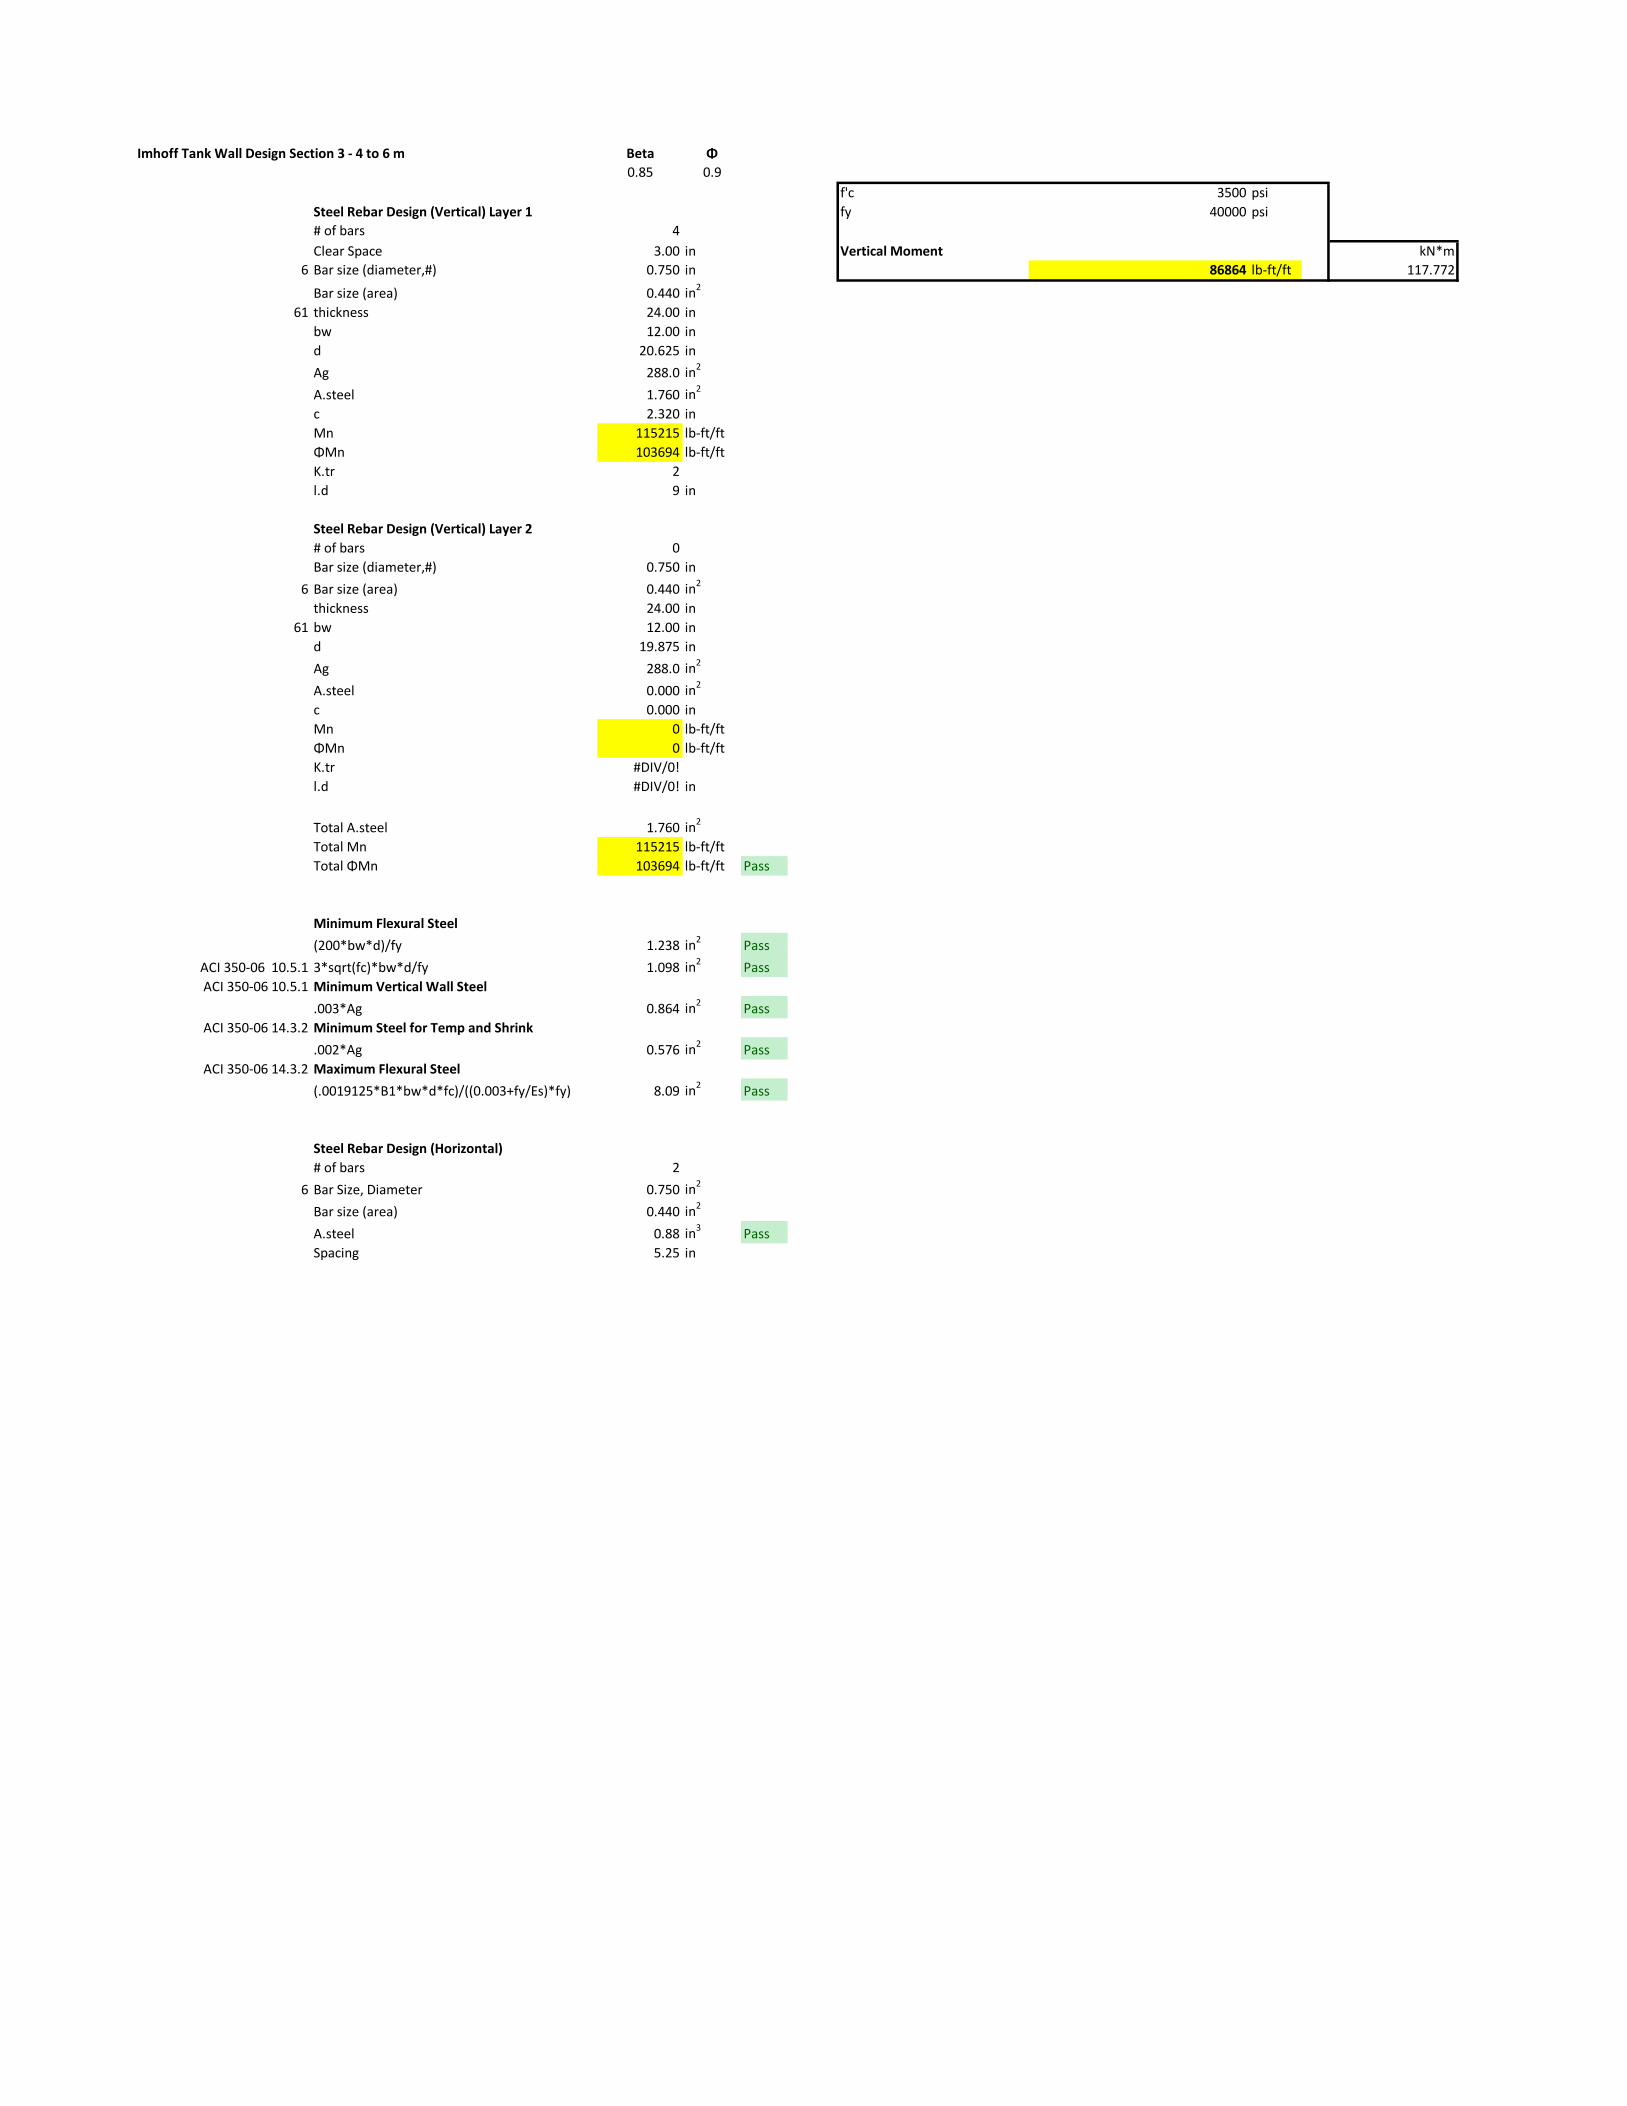
Imhoff Tank Wall Design Section 3 - 4 to 6 m Beta Φ
0.85 0.9
f'c 3500 psi
Steel Rebar Design (Vertical) Layer 1 fy 40000 psi
# of bars 4
Clear Space 3.00 in Vertical Moment kN*m
6 Bar size (diameter,#) 0.750 in 86864 lb-ft/ft 117.772
Bar size (area) 0.440 in2
61 thickness 24.00 in
bw 12.00 in
d 20.625 in
Ag 288.0 in2
A.steel 1.760 in2
c 2.320 in
Mn 115215 lb-ft/ft
ΦMn 103694 lb-ft/ft
K.tr 2
l.d 9 in
Steel Rebar Design (Vertical) Layer 2
# of bars 0
Bar size (diameter,#) 0.750 in
6 Bar size (area) 0.440 in2
thickness 24.00 in
61 bw 12.00 in
d 19.875 in
Ag 288.0 in2
A.steel 0.000 in2
c 0.000 in
Mn 0 lb-ft/ft
ΦMn 0 lb-ft/ft
K.tr #DIV/0!
l.d #DIV/0! in
Total A.steel 1.760 in2
Total Mn 115215 lb-ft/ft
Total ΦMn 103694 lb-ft/ft Pass
Minimum Flexural Steel
(200*bw*d)/fy 1.238 in2Pass
ACI 350-06 10.5.1 3*sqrt(fc)*bw*d/fy 1.098 in2Pass
ACI 350-06 10.5.1 Minimum Vertical Wall Steel
.003*Ag 0.864 in2Pass
ACI 350-06 14.3.2 Minimum Steel for Temp and Shrink
.002*Ag 0.576 in2Pass
ACI 350-06 14.3.2 Maximum Flexural Steel
(.0019125*B1*bw*d*fc)/((0.003+fy/Es)*fy) 8.09 in2Pass
Steel Rebar Design (Horizontal)
# of bars 2
6 Bar Size, Diameter 0.750 in2
Bar size (area) 0.440 in2
A.steel 0.88 in3Pass
Spacing 5.25 in
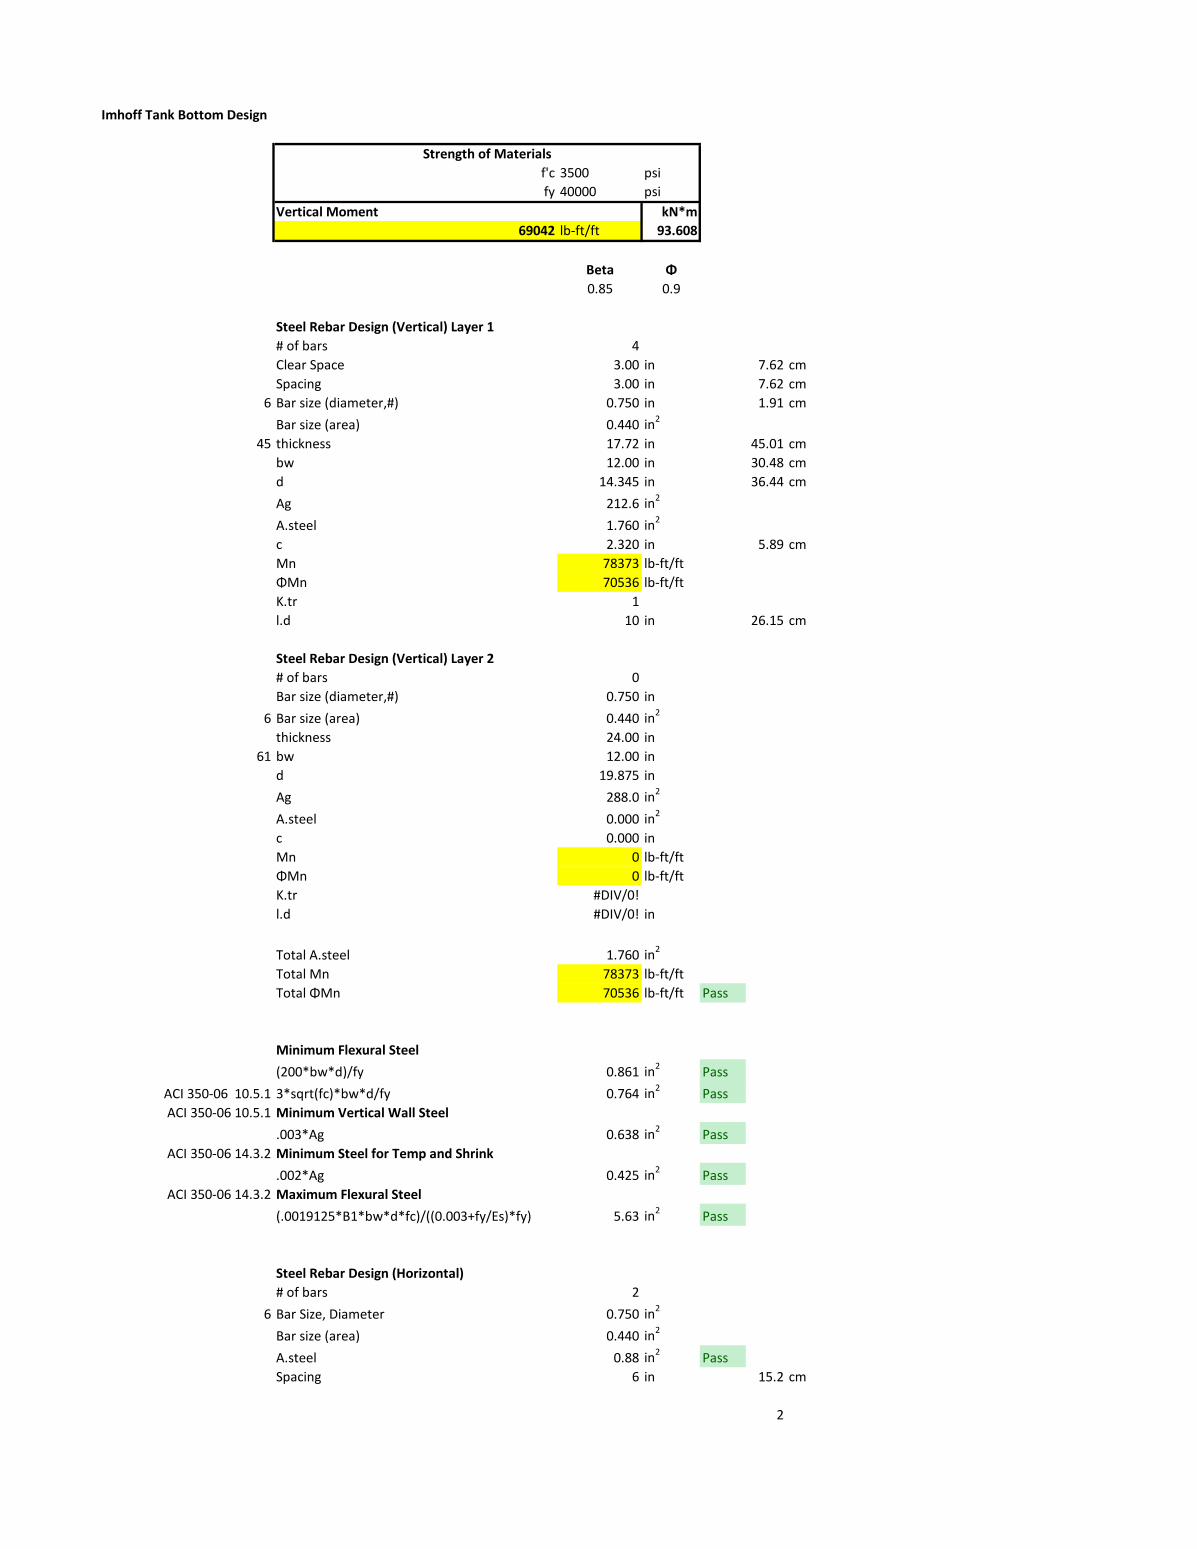
Imhoff Tank Bottom Design
f'c 3500 psi
fy 40000 psi
Vertical Moment kN*m
69042 lb-ft/ft 93.608
Beta Φ
0.85 0.9
Steel Rebar Design (Vertical) Layer 1
# of bars 4
Clear Space 3.00 in 7.62 cm
Spacing 3.00 in 7.62 cm
6 Bar size (diameter,#) 0.750 in 1.91 cm
Bar size (area) 0.440 in2
45 thickness 17.72 in 45.01 cm
bw 12.00 in 30.48 cm
d 14.345 in 36.44 cm
Ag 212.6 in2
A.steel 1.760 in2
c 2.320 in 5.89 cm
Mn 78373 lb-ft/ft
ΦMn 70536 lb-ft/ft
K.tr 1
l.d 10 in 26.15 cm
Steel Rebar Design (Vertical) Layer 2
# of bars 0
Bar size (diameter,#) 0.750 in
6 Bar size (area) 0.440 in2
thickness 24.00 in
61 bw 12.00 in
d 19.875 in
Ag 288.0 in2
A.steel 0.000 in2
c 0.000 in
Mn 0 lb-ft/ft
ΦMn 0 lb-ft/ft
K.tr #DIV/0!
l.d #DIV/0! in
Total A.steel 1.760 in2
Total Mn 78373 lb-ft/ft
Total ΦMn 70536 lb-ft/ft Pass
Minimum Flexural Steel
(200*bw*d)/fy 0.861 in2Pass
ACI 350-06 10.5.1 3*sqrt(fc)*bw*d/fy 0.764 in2Pass
ACI 350-06 10.5.1 Minimum Vertical Wall Steel
.003*Ag 0.638 in2Pass
ACI 350-06 14.3.2 Minimum Steel for Temp and Shrink
.002*Ag 0.425 in2Pass
ACI 350-06 14.3.2 Maximum Flexural Steel
(.0019125*B1*bw*d*fc)/((0.003+fy/Es)*fy) 5.63 in2Pass
Steel Rebar Design (Horizontal)
# of bars 2
6 Bar Size, Diameter 0.750 in2
Bar size (area) 0.440 in2
A.steel 0.88 in2Pass
Spacing 6 in 15.2 cm
2
Strength of Materials

Appendix B. Operations and Maintenance Manual
B-1 | P a g e
Wastewater Treatment System
Operations and Maintenance
Manual
B-2 | P a g e
Table of Contents Bar Rack and Screening Operations and Maintenance ................................................................................. 3
Typical Maintenance Required of the Operator ....................................................................................... 3
Grit Chamber Operations and Maintenance .................................................................................................. 4
Typical Maintenance Required of the Operator ....................................................................................... 4
Safety Measures ........................................................................................................................................ 4
Troubleshooting Certain Symptoms ..................................................................................................... 5
Quantity of Grit Removed ......................................................................................................................... 6
Volatile Solids Content .............................................................................................................................. 6
Imhoff Tank: ................................................................................................................................................. 7
Operation and Maintenance .......................................................................................................................... 7
Starting the Imhoff tank ............................................................................................................................ 8
Operating instructions .............................................................................................................................. 8
Troubleshooting ...................................................................................................................................... 10
Symptom A: Foaming .......................................................................................................................... 10
Symptom B: Sludge Does Not Flow through Draw-off ....................................................................... 11
Pond System Operation and Maintenance .................................................................................................. 19
Background ............................................................................................................................................. 19
The Pond System ..................................................................................................................................... 19
Maintenance ........................................................................................................................................... 20
Drying Beds Operations and Maintenance ................................................................................................. 21
B-3 | P a g e
Operations and Maintenance Manual
Bar Rack and Screening Operations and Maintenance
Typical Maintenance Required of the Operator Screening is one of the simplest processes in the treatment of wastewater; however, foul odor may be
involved because of its contact with the raw sewage in the early stages. To ensure proper operations,
debris in the wastewater stream trapped in the bar racks must be removed properly. Most often, repairs
are needed due to poor performance of the bar rack. Typical procedures to correct the maintenance
problems are seen below:
1. Obnoxious odors, flies, and other insects around the bar rack indicate prolonged storage of
screenings. The frequency of cleaning the screenings from the bar racks should be increased
2. Excessive screen clogging indicates one of the following: (a) an unusual amount of debris in the
wastewater, (b) too low of velocity through the bar racks, or (c) the bar racks are not frequently
cleaned enough.
3. Excessive grit in the chamber is due to low velocities in the channel. Some solutions are to re-
slope the channel bottom, decrease the cross-sectional area, rake the channel, or regularly flush
the channel with a hose.
4. Because screenings attract flies and other insects and are odorous, screenings should be emptied
daily and stored in covered containers. The screenings should then be properly disposed of.
5. The raking of the bar screen to clean the screenings from the racks should be done as follows:
rake the screen upwards until the screenings fall into the depression the steel plate, Allow for
dewatering, and then transfer the screenings into a sealed container for proper disposal.
B-4 | P a g e
Grit Chamber Operations and Maintenance
Typical Maintenance Required of the Operator Although the removal of grit is a fairly uncomplicated process in wastewater treatment, it will require
proper maintenance with ingenuity and resourcefulness. The ideal conditions for operation can be
achieved with two or more channels, but this grit chamber for Carabuela, Ecuador will need only two
channels because of the low capacity needed. The proper maintenance of the grit chamber will reduce any
unnecessary odors and combats corrosion. Below are procedures that will help to ensure proper grit
removal:
1. Measure the depth and location of grit in the collecting channels
2. When grit accumulates to half the water’s depth or two-thirds the channel’s length (whichever
comes first) bypass the channel in operation to the channel that is unused (the clean channel).
3. Dewater the ‘dirty’ channel with dewatering lines and allow the runoff to continue flowing
through the treatment system.
4. After dewatering, use shovels to remove the grit. Measure the amount of grit by estimating the
volume or weight and record this. Fill a wheelbarrow with the grit, and empty the grit into the
sludge drying beds, shallow trenches, or an appropriate landfill.
5. Flush out the channels after the grit is removed, and then the unit or channel is clean for full
service again.
6. If analyzed for volatile solids and a high percent is found, undertake corrective measures as seen
in Symptom A, excessive organic materials.
7. Check for unusual quantities of grit in the treatment units which follow the grit removal process.
8. Remove grit from other units in the system if found in substantial quantities and undertake
corrective measures as seen in Symptom B, carryover of grit.
Safety Measures Grit removal has the ability to produce and accumulate toxic gasses contained in the sewage, which could
possibly cause an explosive atmosphere when mixed with air. If the grit chamber is not fully exposed to
the atmosphere then the following precautions need to be taken:
1. The grit chamber and surrounding area should be thoroughly ventilated at all times.
2. The area should be considered as explosive and protected as such.
3. Consider the area as a toxic zone and protect it as such. Adequate measures should be taken to
protect the workers and operators from any such dangers of contamination while working with
the units.
B-5 | P a g e
Troubleshooting Certain Symptoms
Problems may occur in the grit channel and they should be corrected as soon as possible if they occur.
Some typical problems that occur are Excessive organic materials in the grit chamber and the carryover of
grit into other units downstream of the grit chamber. These are important to realize and correct if and
when present.
Symptom A—Excessive Organic Material in the Grit Chamber
Cause: The velocity of the water is too low or the detention time for the channel is too long.
Prevention and Cure:
Reduce the cross sectional area of the chamber occupied by the flowing sewage.
1. One may install bricks, planks, or tile along the sides of the channel.
2. One may reshape the outlet weir to proportionally reduce the depth of flow for all normal and
present flow rates.
3. Decrease the number of channels used.
4. Reduce the length of the channel by moving the outlet weir further upstream in the grit chamber.
Symptom B—Carryover of Grit
Cause: The velocity of the water is too high and the detention period is too short.
Prevention and Cure:
1. Remove the grit more frequently.
2. Increase the number of channels used. If only two channels are available construct another
channel for standby while the other two channels are in operations. This will allow for the sewage
to bypass to a clean channel while the ‘dirty’ channels shall be cleaned.
3. Increase the cross-sectional area of the channels.
It is important to keep an accurate record of the quality and quantity of grit removed from the chambers.
Fairly simple test may be done in order to detect any unwanted symptoms in the system. An accurate
tracking of records will help to warn the operator, through comparison of the history of quantities and
qualities, of any change in the source of grit and locating any troubles.

B-6 | P a g e
Quantity of Grit Removed Each time the grit chamber is manually clean, a record should be kept of the quantity of grit that is
removed. The quantity of grit should be calculated in terms of flow that has passed through the unit. For
example: if 550 L is removed and the total sewage flow has been 19,000 m3 since the last time the
chamber was cleaned then the grit removed should be recorded as 0.0289 liters of grit removed per 1
m3 of sewage flow.
Volatile Solids Content The percent of volatile solids should be determined regularly if laboratory facilities are available.
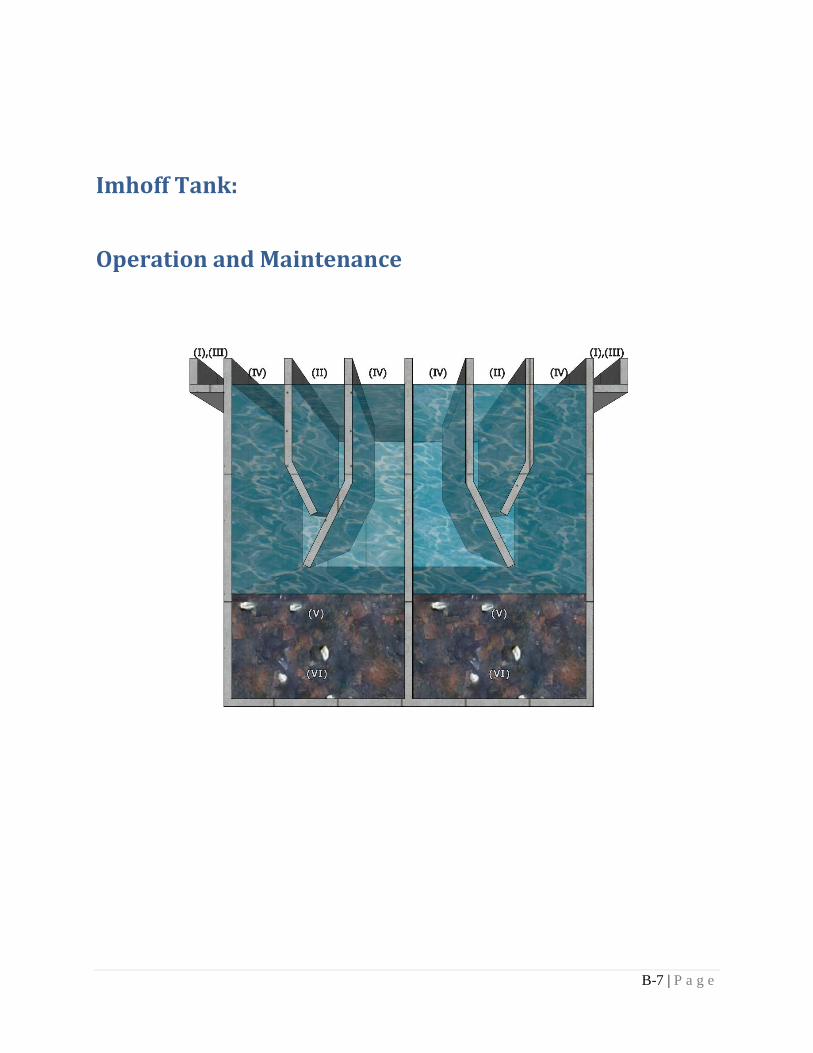
B-7 | P a g e
Imhoff Tank:
Operation and Maintenance
B-8 | P a g e
Starting the Imhoff tank
It is necessary to initially seed the Imhoff tank sludge chamber. If digested sludge is not available from
another plant, substitutes include rotted leaves, decomposed manure, cesspool cleanings or other
stabilized organic material (Martin, 1937, pp. 995-1000). Place the materials in the bottom of the Imhoff
tank before opening the tank to water flow. When starting the flow through the tank, make sure that the
seeding material does not move from the sludge chamber into the sedimentation chamber. If seeding
material starts to move into the sedimentation chamber, cease flow into that tank and wait to commence
flow until the material has settled to the bottom of the tank again.
Operating instructions (Daniels, 1945, pp. 105-107)
I. Care of Channels – 2 to 3 times a week
All channels should be kept open and free of solid material, such as grease, scum, grit, etc. Scrub
the channels with a broom or brush.
II. Care of Flowing-through Chambers 2-3 times a week
1. All floating material, such as matches, sticks, grease, etc., should be skimmed off daily and
thrown into the gas vents. Bottles, rags, and other large material should be removed and
buried. No scum or decomposing material should be allowed to accumulate in the flowing-
through chambers or offensive odors may result. As this material does not readily respond to
bacterial digestion, it should be burned or buried after skimming the tank(Beaumont, 1929).
The skimmer may be easily constructed from the attached plan seen in Figure 7.
2. The walls and sloping bottoms should be scraped down with the squeegee at least twice
weekly, and the solid material pushed through the slot. Scraping should be done carefully in
order that no solid material will be stirred up to pass on through the outlet. In case the
squeegee cannot be pushed through the slot it will be necessary to clean the slot by dragging a
chain through it, using a saw-like motion. The walls of the flowing-through chambers above
the water line should be washed or scrubbed down in order to remove any clinging material.
The squeegee and slot cleaner may be easily constructed from the attached plan seen in
Figure 7.
III. Reversing the Flow – 2 times a month or every other week
B-9 | P a g e
In some plants provision is made for reversing the flow of sewage through the tank. This is
necessary in order to permit even deposition of the sludge and to obtain sludge of more uniform
composition. The flow should be reversed at least once a month and preferably every 15 days.
Diagrams for how to reverse the flow can be seen in the following figures. Figure 1 shows
operation of both tanks in direction 1. Figure 2 shows operation of tank #1 only in direction 1. This
flow path is used for maintenance of tank #2. Figure 3 shows the operation of tank #2 only in
direction 1. This flow path is used for maintenance of tank #1. Figure 4 shows operation of both
tanks is direction 2. Figure 5 shows operation of tank #1 in direction 2. This flow path is used for
maintenance of tank #2. Figure 6 shows operation of tank #2 in direction 2. This flow path is used
for maintenance of tank #1.
IV. Care of Gas Vents – 2 to 3 times a week
The scum in the gas vents must be broken up with the churner. This is necessary in order that the
floating material, which has been raised by gas formed during sludge digestion, may settle to the
bottom. If this is not done consistently the scum will accumulate to a depth of several feet, resulting
in considerable odor nuisance. It may even be necessary to remove the material from the tank and
bury it, an expensive and disagreeable process.
V. Measurement of Sludge – 2 to 3 times a month
In order that the operator may know the rate at which sludge is being deposited, it is necessary that
the depth of sludge be measured at intervals not exceeding two weeks. This may be done by the use
of a sounder, constructed of a flat conical pan with a weight at the center. The depth of the sludge
may be measured from the top of the tank. In no case should the sludge be allowed to rise higher
than within two feet of the slots in the bottom of the flowing-through chamber.
VI. Removing Sludge – Once a month
Sludge should usually be drawn about once a month when the tank is operating about to capacity.
During the winter months it will probably not be necessary to remove sludge unless trouble is
experienced or the sludge rises to within two feet of the slot. Well-digested sludge is black and has
very little odor. Only this well digested sludge should be removed. It is better to draw a small
amount of sludge at frequent intervals than to draw a large amount in frequently. Undigested sludge
is gray and none of this material should be drawn. As soon as the first gray color appears no more
of the material should be removed. It is necessary that some digested sludge be left in the tank in
order to assist digestion of the remainder. Sludge should always be removed slowly or the heavier
B-10 | P a g e
undigested sludge may be forced out of the tank. Flow may be started by rodding the discharge
pipe.
VII. General – As necessary
The plant should be in closed within a suitable fence in order to pre vent accidents and
depredations. All valves, gates, and other appurtenances should be tested regularly to see that they
are in good operating condition.
Troubleshooting (Imhoff Tanks, 1961)
Symptom A: Foaming
Causes: Generally, foaming, as characterized by large amounts of fluffy scum rising from the gas vents
and overflowing the tank, is caused by a very high rate of digestion. There is too much undigested sludge
present compared with the well-digested material. This lack of balance may cause violent biological
activity in an acid stage, with high rates of gas production of high carbon dioxide content. Conditions
creating foaming include:
1. Starting a new plant with large quantities of raw sludge without sufficient quantities of "seed",
sludge;
2. Rising temperatures in the sludge digestion zone in spring or early summer following long, cold
winter periods with very slow digestion rates;
3. Large quantities of organic materials in the sewage, such as milk products, or cannery wastes; or
4. Insufficient sludge digestion capacity for the organic loading.
Prevention and Cure:
1. Start operation of a new Imhoff tank in spring or summer.
2. Reduce quantity of sludge in the tank to a safe minimum level during fall months to provide
sufficient space for sludge to be added during winter.
3. Withdraw sludge frequently in low quantities, but maintain a sufficient quantity of well-digested
sludge in the tank.
4. When foaming has started, it may be corrected by:
(a) Temporarily removing tank from service.

B-11 | P a g e
(b) High-pressure spraying to break up gas bubbles in the foam. The quantity of water should be
kept to minimum. Sometimes a gentle spray of either water or sludge liquor directed at the
foam is effective.
(c) Agitating scum mechanically or manually to help release gas bubbles.
(d) Adding hydrated lime to adjust pH to 7.0 or slightly higher. Samples of sludge should be
collected from several points in the tank to determine the quantity of lime to be added. The
total amount may be fed in a dissolved condition at slow rates and in a manner which will
distribute it uniformly to all portions of the digestion zone and gas vents. An alternate method
is to add it in dry form to the gas vents and thoroughly mix and distribute it by plunging and
hosing. Usually, adjustment of the pH is effective in preventing continuance of foaming, once
addition of lime has been discontinued. Correction of the condition causing the foaming is
generally necessary.
Symptom B: Sludge Does Not Flow through Draw-off
Causes:
1. Sludge too viscous; or
2. Obstruction at end of pipe, such as sand, consolidated sludge, rags, sticks, etc.
Prevention and Cure:
1. Rod-out draw-off hole using long pole;
2. Repair valve if broken;
3. When large quantities of grit have accumulated, it may be necessary to dewater tank and remove
grit through gas vents.
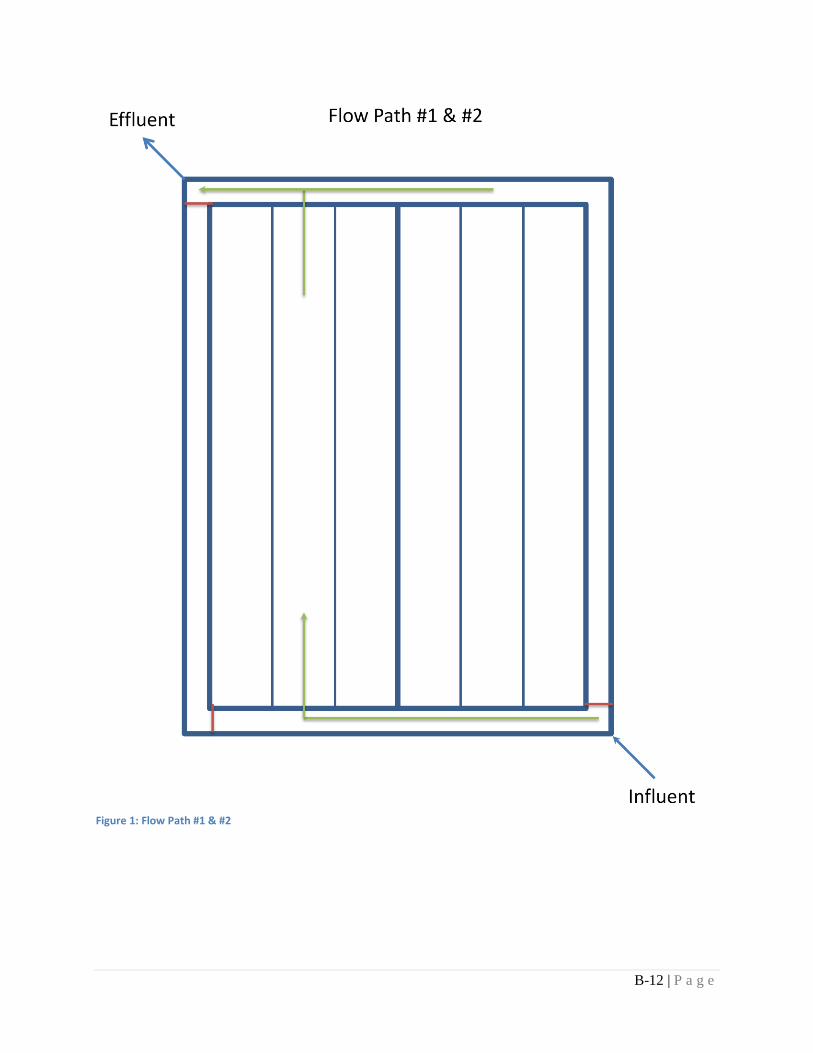
B-12 | P a g e
Figure 1: Flow Path #1 & #2
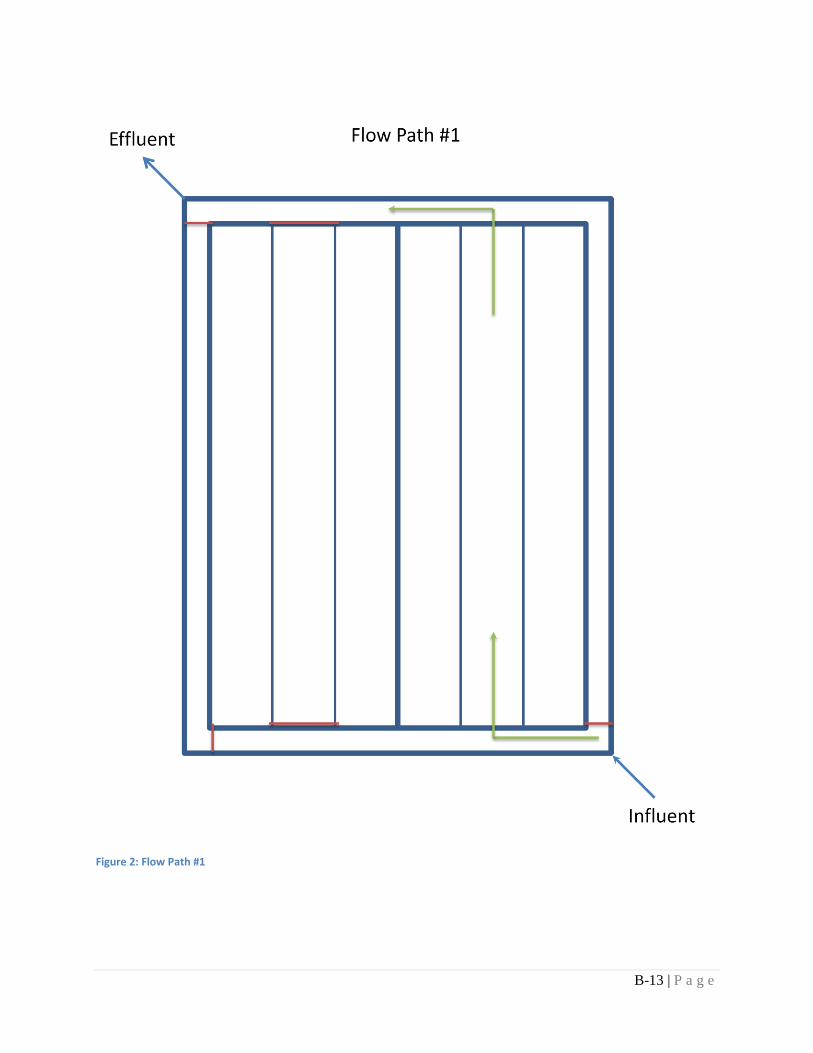
B-13 | P a g e
Figure 2: Flow Path #1
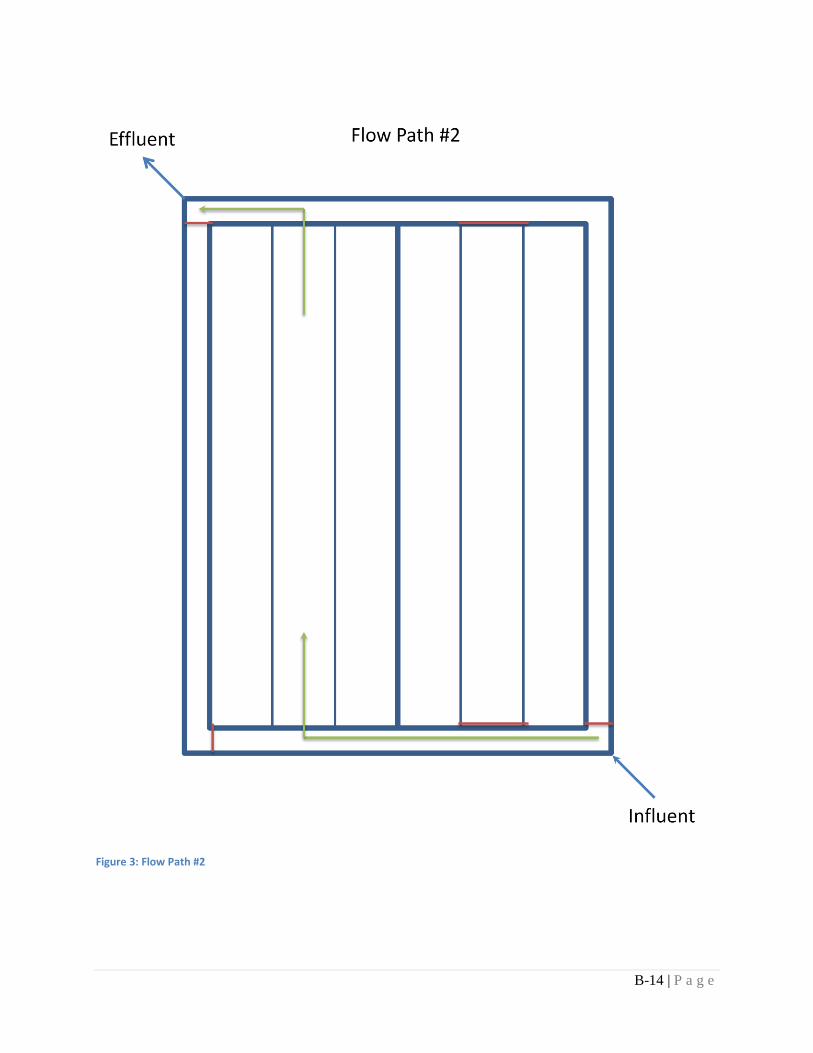
B-14 | P a g e
Figure 3: Flow Path #2
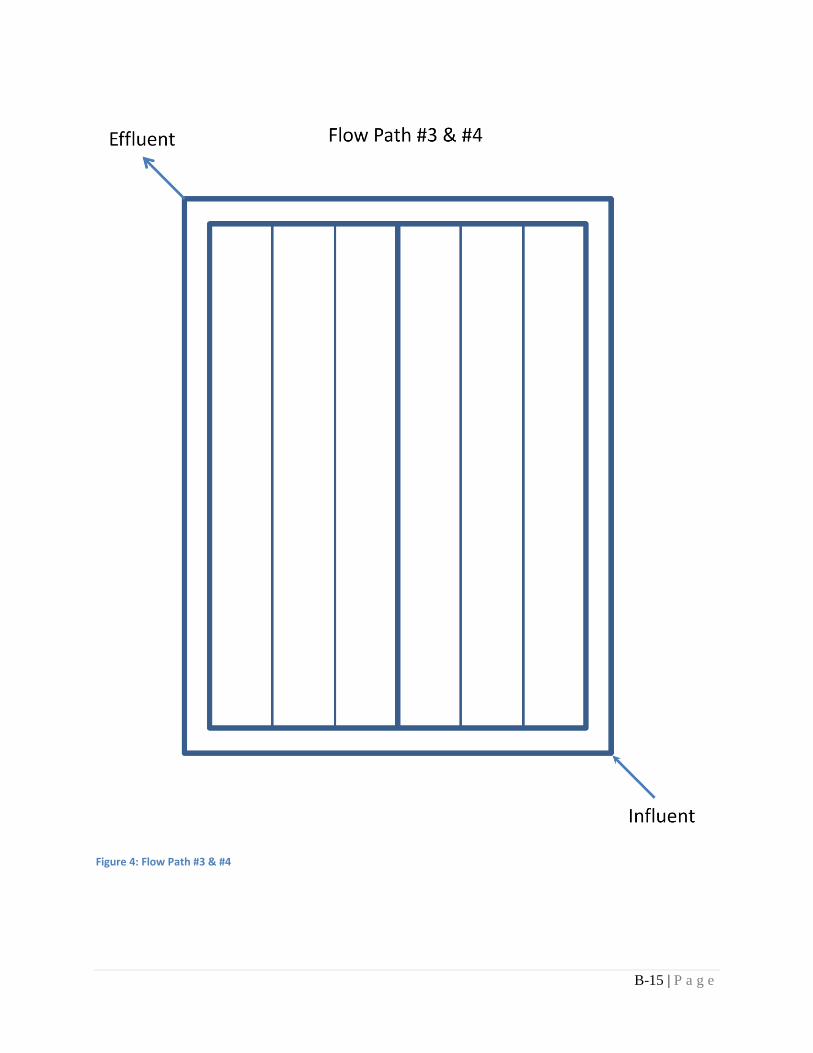
B-15 | P a g e
Figure 4: Flow Path #3 & #4
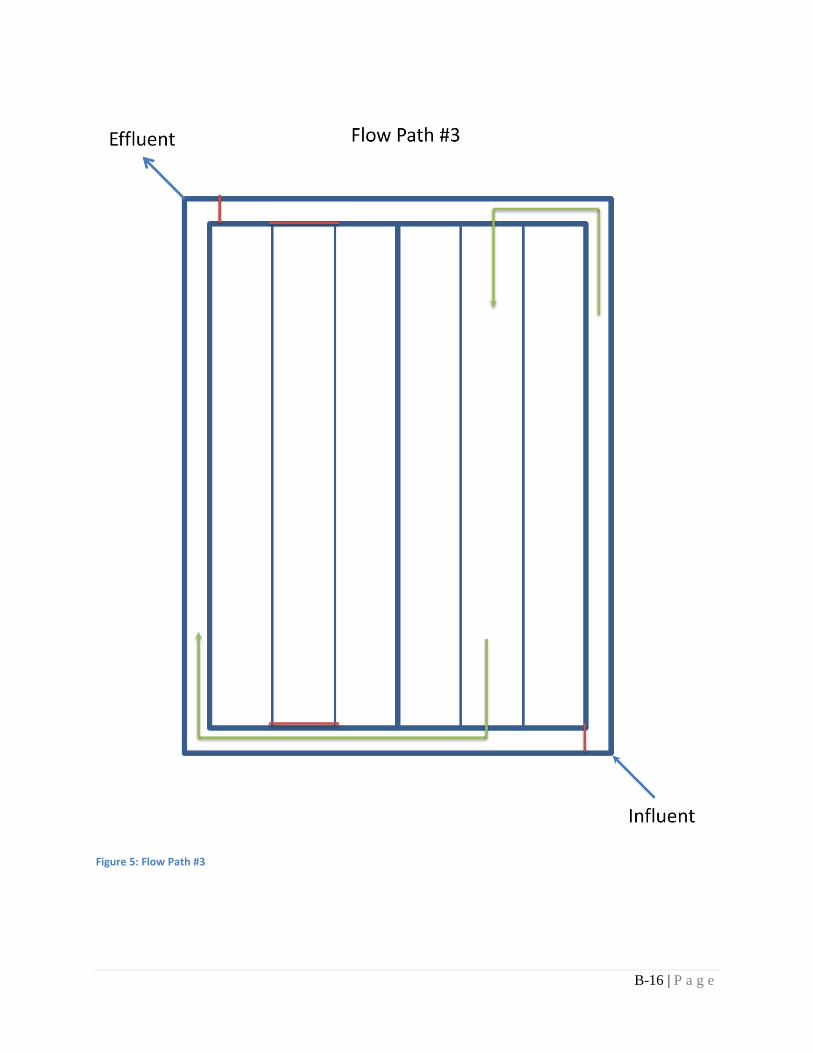
B-16 | P a g e
Figure 5: Flow Path #3

B-17 | P a g e
Figure 6: Flow Path #4
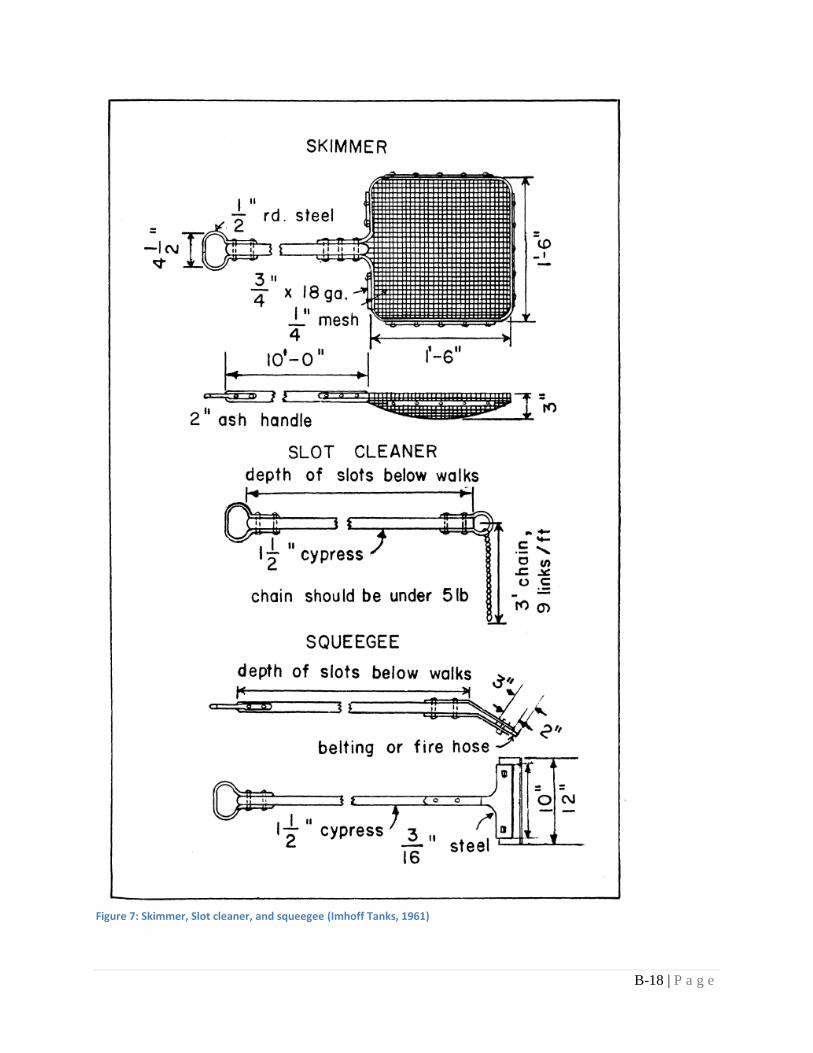
B-18 | P a g e
Figure 7: Skimmer, Slot cleaner, and squeegee (Imhoff Tanks, 1961)
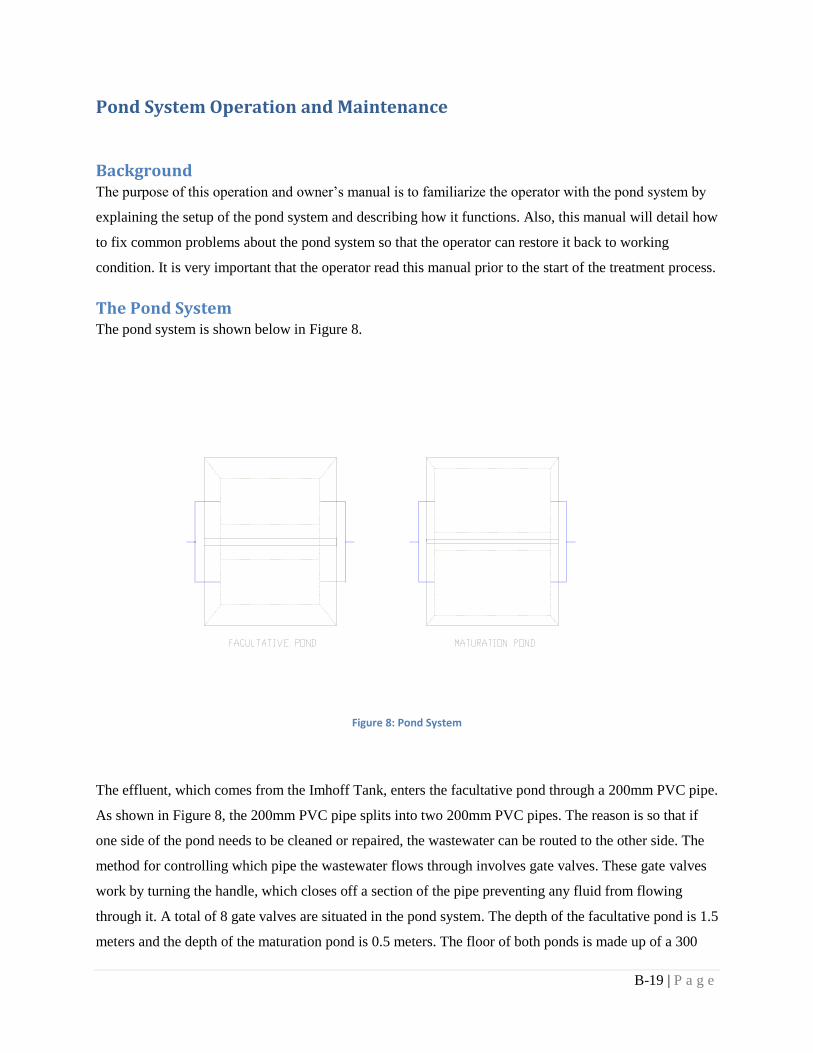
B-19 | P a g e
Pond System Operation and Maintenance
Background The purpose of this operation and owner’s manual is to familiarize the operator with the pond system by
explaining the setup of the pond system and describing how it functions. Also, this manual will detail how
to fix common problems about the pond system so that the operator can restore it back to working
condition. It is very important that the operator read this manual prior to the start of the treatment process.
The Pond System The pond system is shown below in Figure 8.
Figure 8: Pond System
The effluent, which comes from the Imhoff Tank, enters the facultative pond through a 200mm PVC pipe.
As shown in Figure 8, the 200mm PVC pipe splits into two 200mm PVC pipes. The reason is so that if
one side of the pond needs to be cleaned or repaired, the wastewater can be routed to the other side. The
method for controlling which pipe the wastewater flows through involves gate valves. These gate valves
work by turning the handle, which closes off a section of the pipe preventing any fluid from flowing
through it. A total of 8 gate valves are situated in the pond system. The depth of the facultative pond is 1.5
meters and the depth of the maturation pond is 0.5 meters. The floor of both ponds is made up of a 300
B-20 | P a g e
mm layer of clay soil. The clay soil prevents the wastewater from seeping into the water table, which can
cause negative environmental impacts. In addition to these depths there is an additional 0.5 meters of
freeboard. This freeboard is needed in case there is any extra substantial amount of wastewater that enters
both ponds. In addition to the freeboard, a weir is constructed for both ponds on the side parallel to the
Rio Carabuela for the purpose of directing the flow of wastewater should there be any overflowing.
Maintenance This section discusses the maintenance involved while taking care of the pond system. If the pond system
is not taken care of, the efficiency of the system declines. The pond should be monitored on a regular
basis in order for the treatment process to go properly.
One of the most important things to monitor is the amount of scum buildup on top of the pond. A buildup
of scum will prevent the penetration of sunlight into the pond creating a deficiency in oxygen transfer
between algae and organic materials. Organic materials are bio-oxidized, giving off CO2, NH3 and
inorganic radicals. Algae use CO2, inorganic radicals and sunlight to produce dissolved oxygen in a
cyclic-symbiotic relationship. If there is a strong odor coming from the ponds, check to see if there is
enough sunlight penetration into the ponds.
It is important to monitor the amount of sludge buildup on the bottom of both ponds. At some point there
will be too much sludge and dredging will be required. Dredging involves scooping the bottom of the
pond either by hand or machine and removing any settled sludge after the pond has been drained.
Dredging will have to be performed every 20 years, but may be earlier depending on the quantity of
sludge entering the pond system.
For safety, be sure to fence off the lagoon to prevent livestock and humans from entering the pond area.
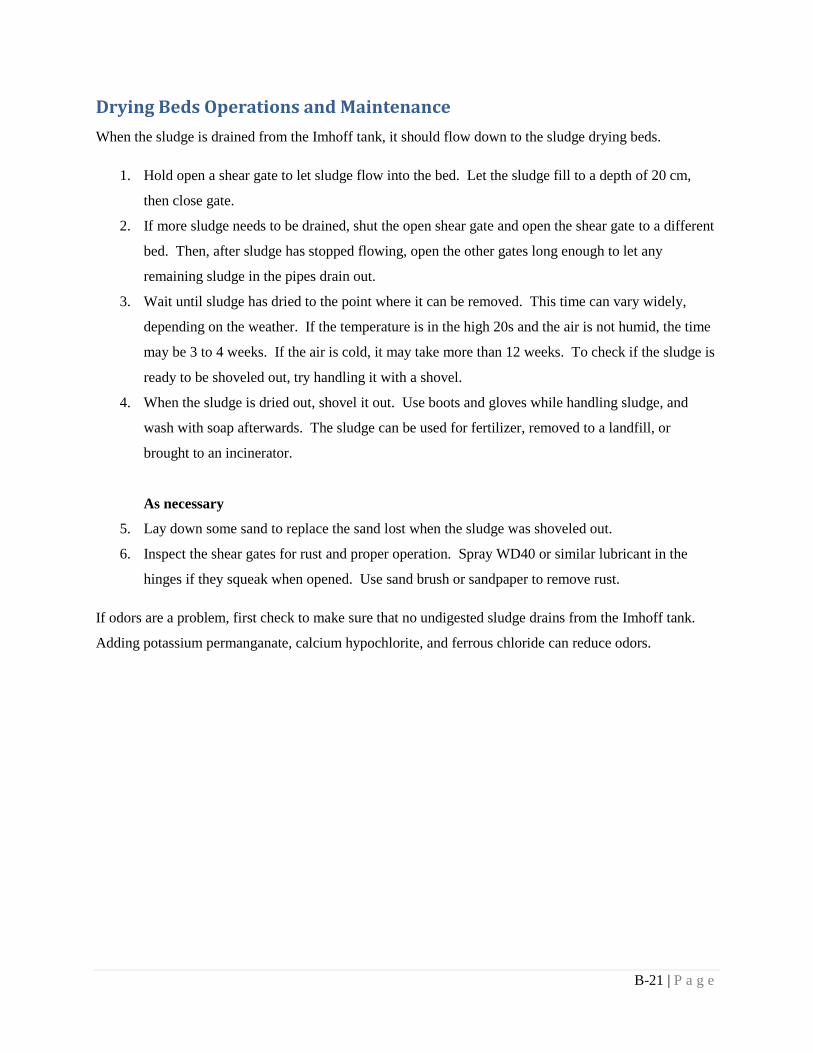
B-21 | P a g e
Drying Beds Operations and Maintenance
When the sludge is drained from the Imhoff tank, it should flow down to the sludge drying beds.
1. Hold open a shear gate to let sludge flow into the bed. Let the sludge fill to a depth of 20 cm,
then close gate.
2. If more sludge needs to be drained, shut the open shear gate and open the shear gate to a different
bed. Then, after sludge has stopped flowing, open the other gates long enough to let any
remaining sludge in the pipes drain out.
3. Wait until sludge has dried to the point where it can be removed. This time can vary widely,
depending on the weather. If the temperature is in the high 20s and the air is not humid, the time
may be 3 to 4 weeks. If the air is cold, it may take more than 12 weeks. To check if the sludge is
ready to be shoveled out, try handling it with a shovel.
4. When the sludge is dried out, shovel it out. Use boots and gloves while handling sludge, and
wash with soap afterwards. The sludge can be used for fertilizer, removed to a landfill, or
brought to an incinerator.
As necessary
5. Lay down some sand to replace the sand lost when the sludge was shoveled out.
6. Inspect the shear gates for rust and proper operation. Spray WD40 or similar lubricant in the
hinges if they squeak when opened. Use sand brush or sandpaper to remove rust.
If odors are a problem, first check to make sure that no undigested sludge drains from the Imhoff tank.
Adding potassium permanganate, calcium hypochlorite, and ferrous chloride can reduce odors.

Appendix C. Structural Drawings
Title Page
System Layout
Bar Rack and Grit Chamber Structural Drawings
Imhoff Tank Structural Drawings
Lagoon System Structural Design and Layout
Drying Bed Structural Drawing and Layout
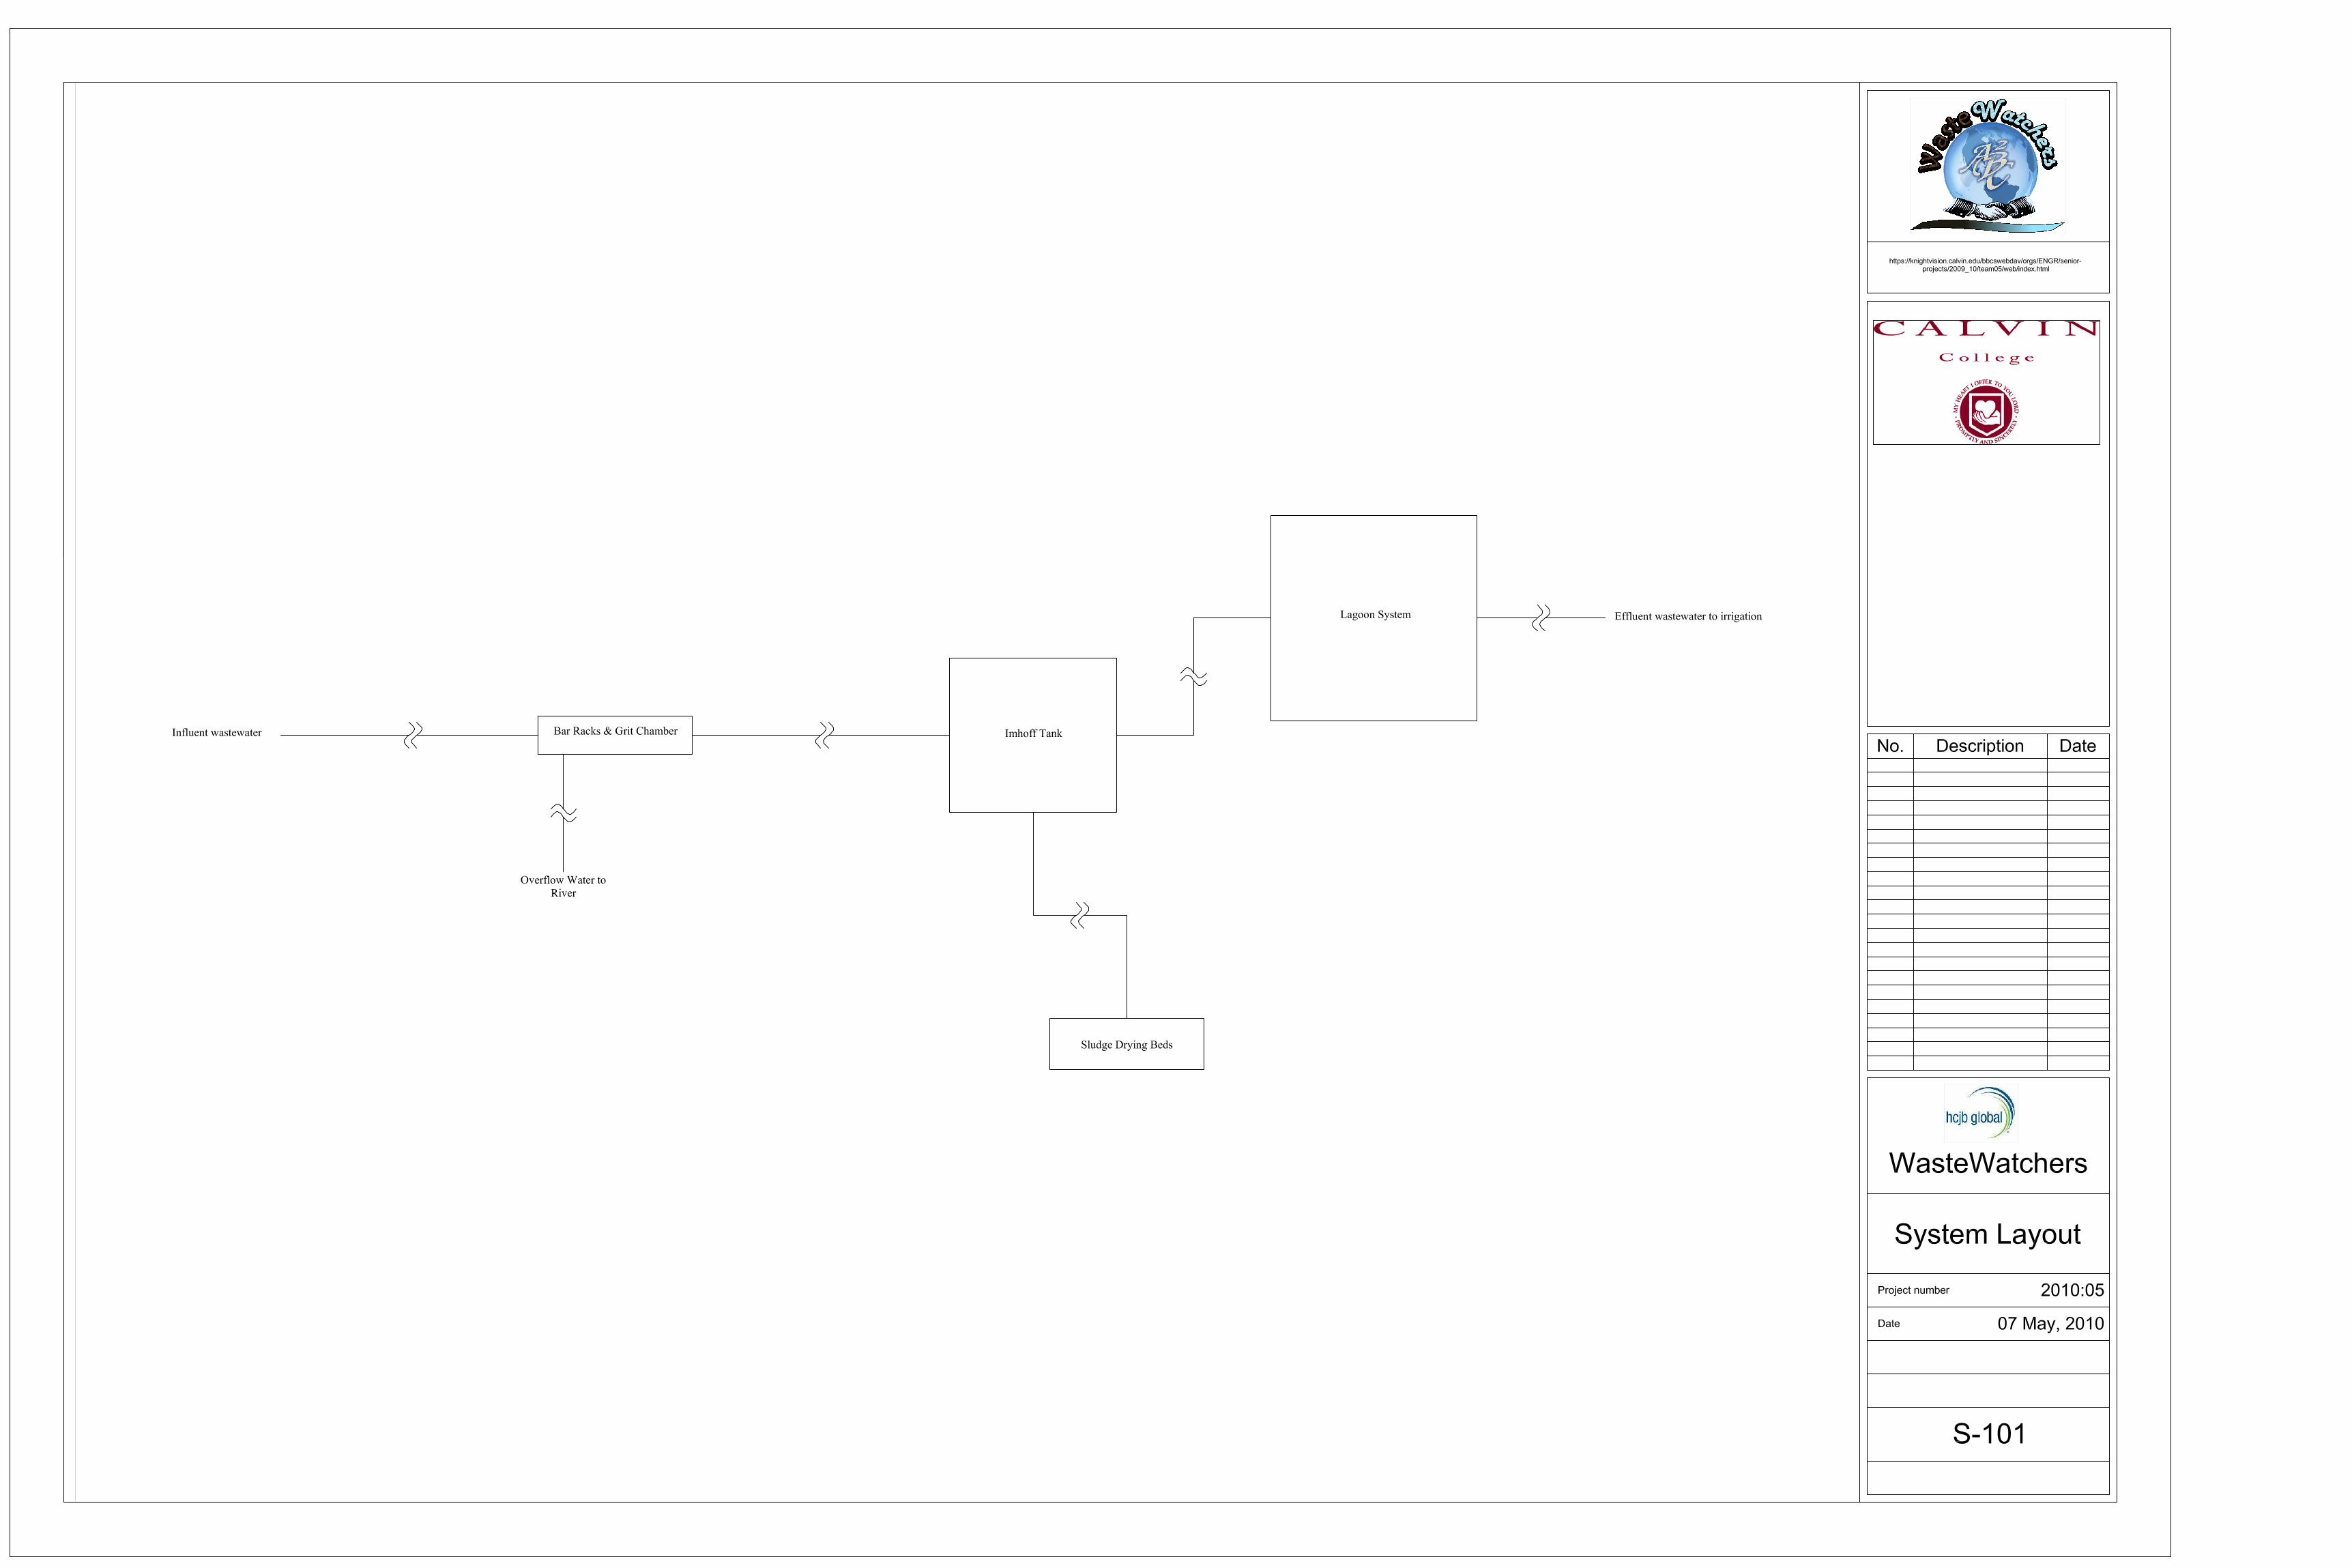
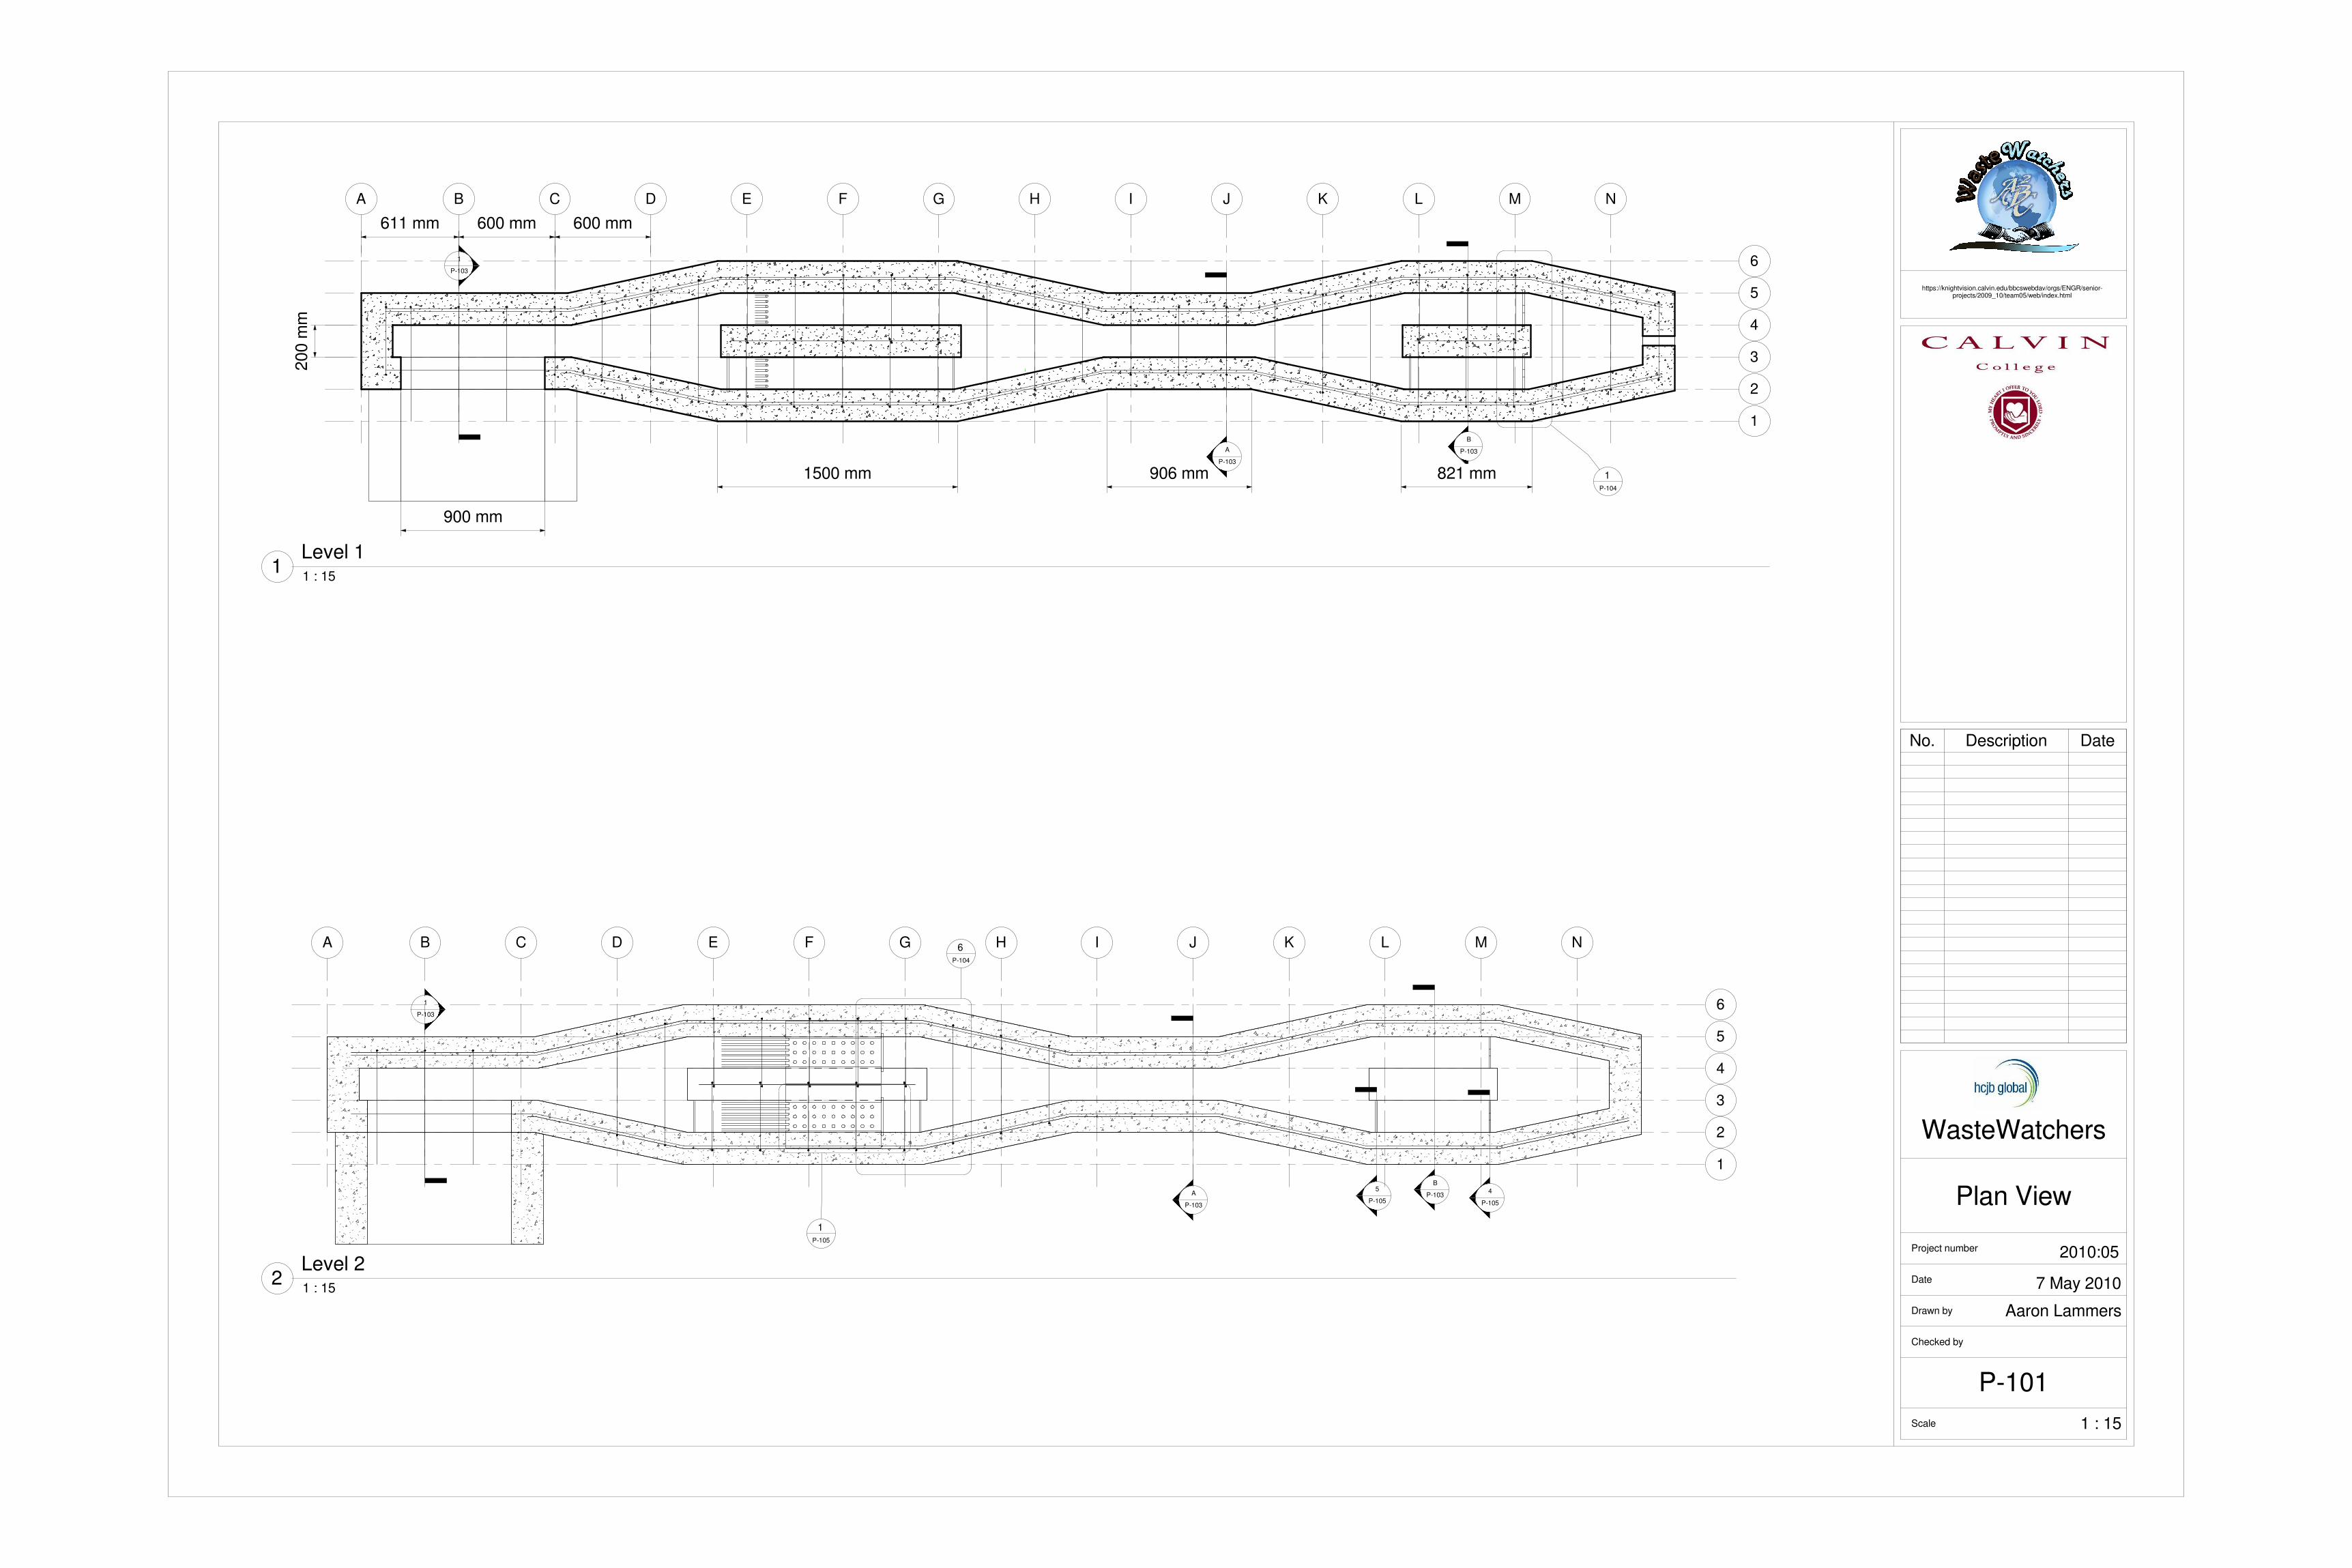
2
3
4
1
5
6
H I J K L M N
A
P-103
B
P-1034
P-105
5
P-105
1P-105
F GD E 6P-104
CBA
1
P-103
2
3
4
1
5
6
1P-104
H I J K L M N
A
P-103
B
P-103
F GD ECBA
611 mm 600 mm600 mm
200 m
m
1500 mm 906 mm 821 mm
1
P-103
900 mm
https://knightvision.calvin.edu/bbcswebdav/orgs/ENGR/senior-projects/2009_10/team05/web/index.html
Scale
Checked by
Drawn by
Date
Project number 2010:05
7 May 2010
1 : 15
Plan View
WasteWatchers
Aaron Lammers
P-101
1 : 15
Level 22
No. Description Date
1 : 15
Level 11
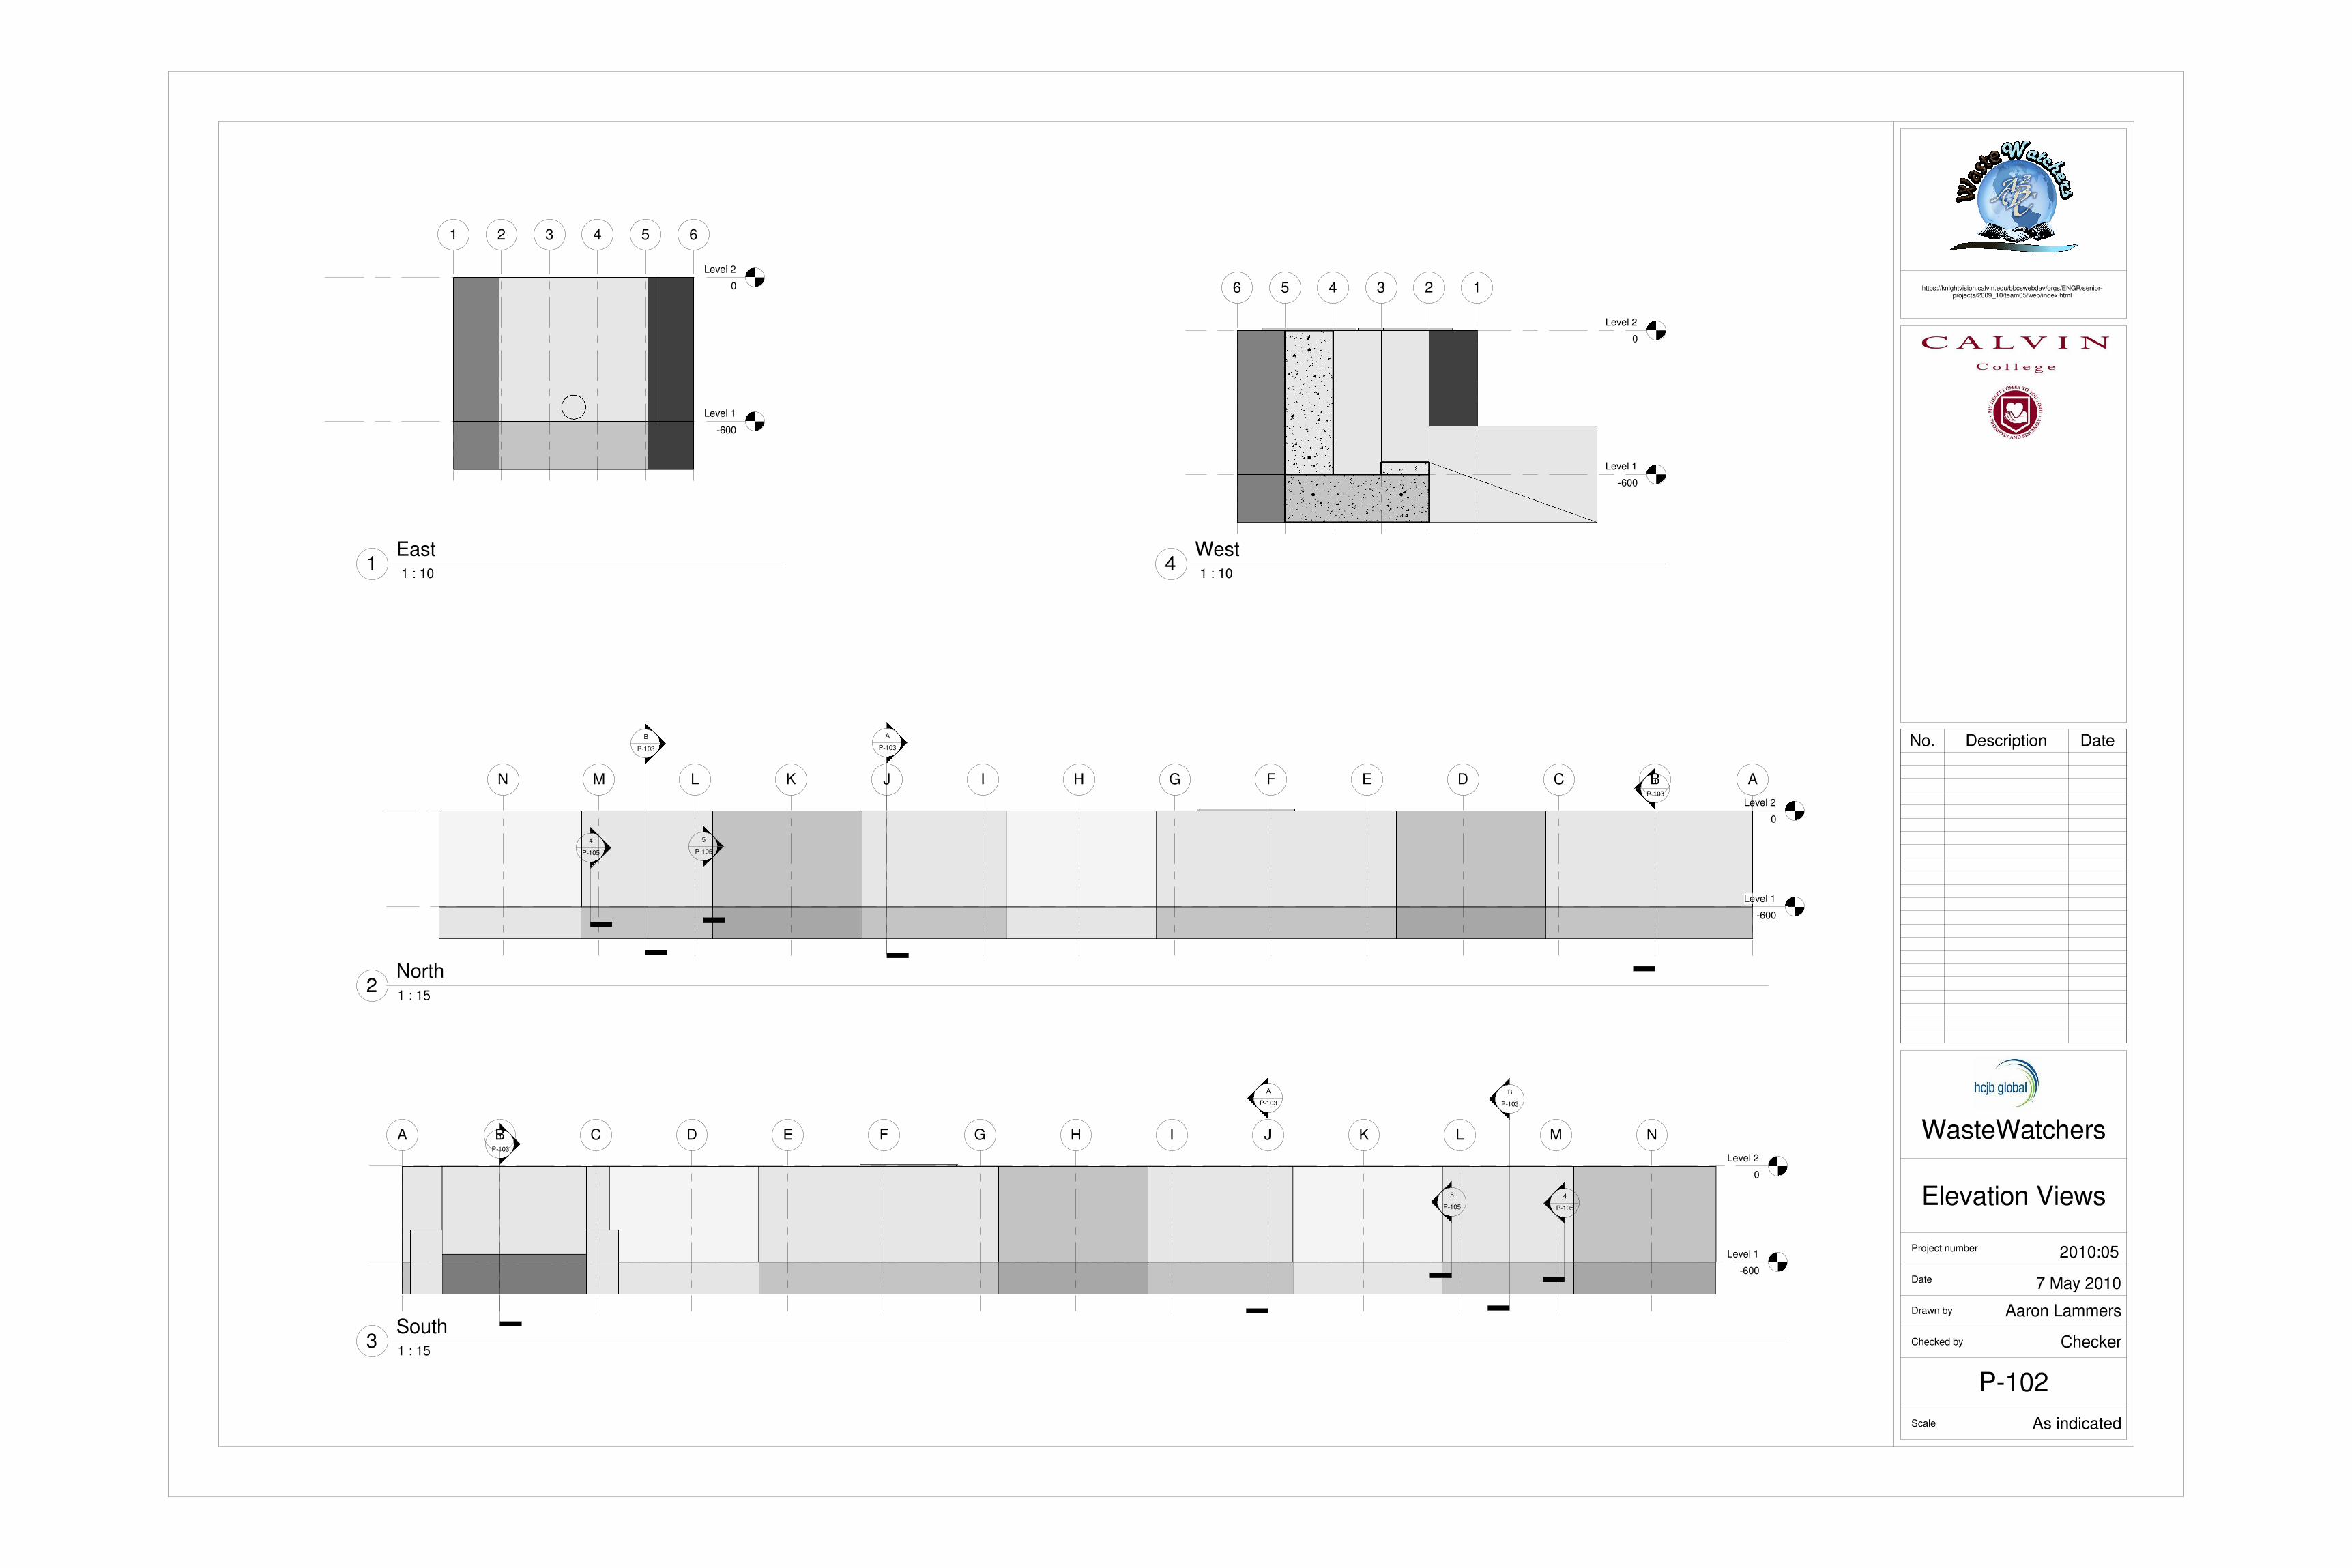
Level 1
-600
Level 2
0
2 3 41 5 6
Level 1
-600
Level 2
0
HIJKLMN
A
P-103
B
P-103
4
P-105
5
P-105
FG DE C B A1
P-103
Level 1
-600
Level 2
0
H I J K L M N
A
P-103
B
P-103
4
P-105
5
P-105
F GD ECBA 1
P-103
Level 1
-600
Level 2
0
234 156 https://knightvision.calvin.edu/bbcswebdav/orgs/ENGR/senior-projects/2009_10/team05/web/index.html
Scale
Checked by
Drawn by
Date
Project number 2010:05
7 May 2010
As indicated
Elevation Views
WasteWatchers
Aaron Lammers
Checker
P-102
1 : 10
East1
1 : 15
North2
1 : 15
South3
No. Description Date
1 : 10
West4
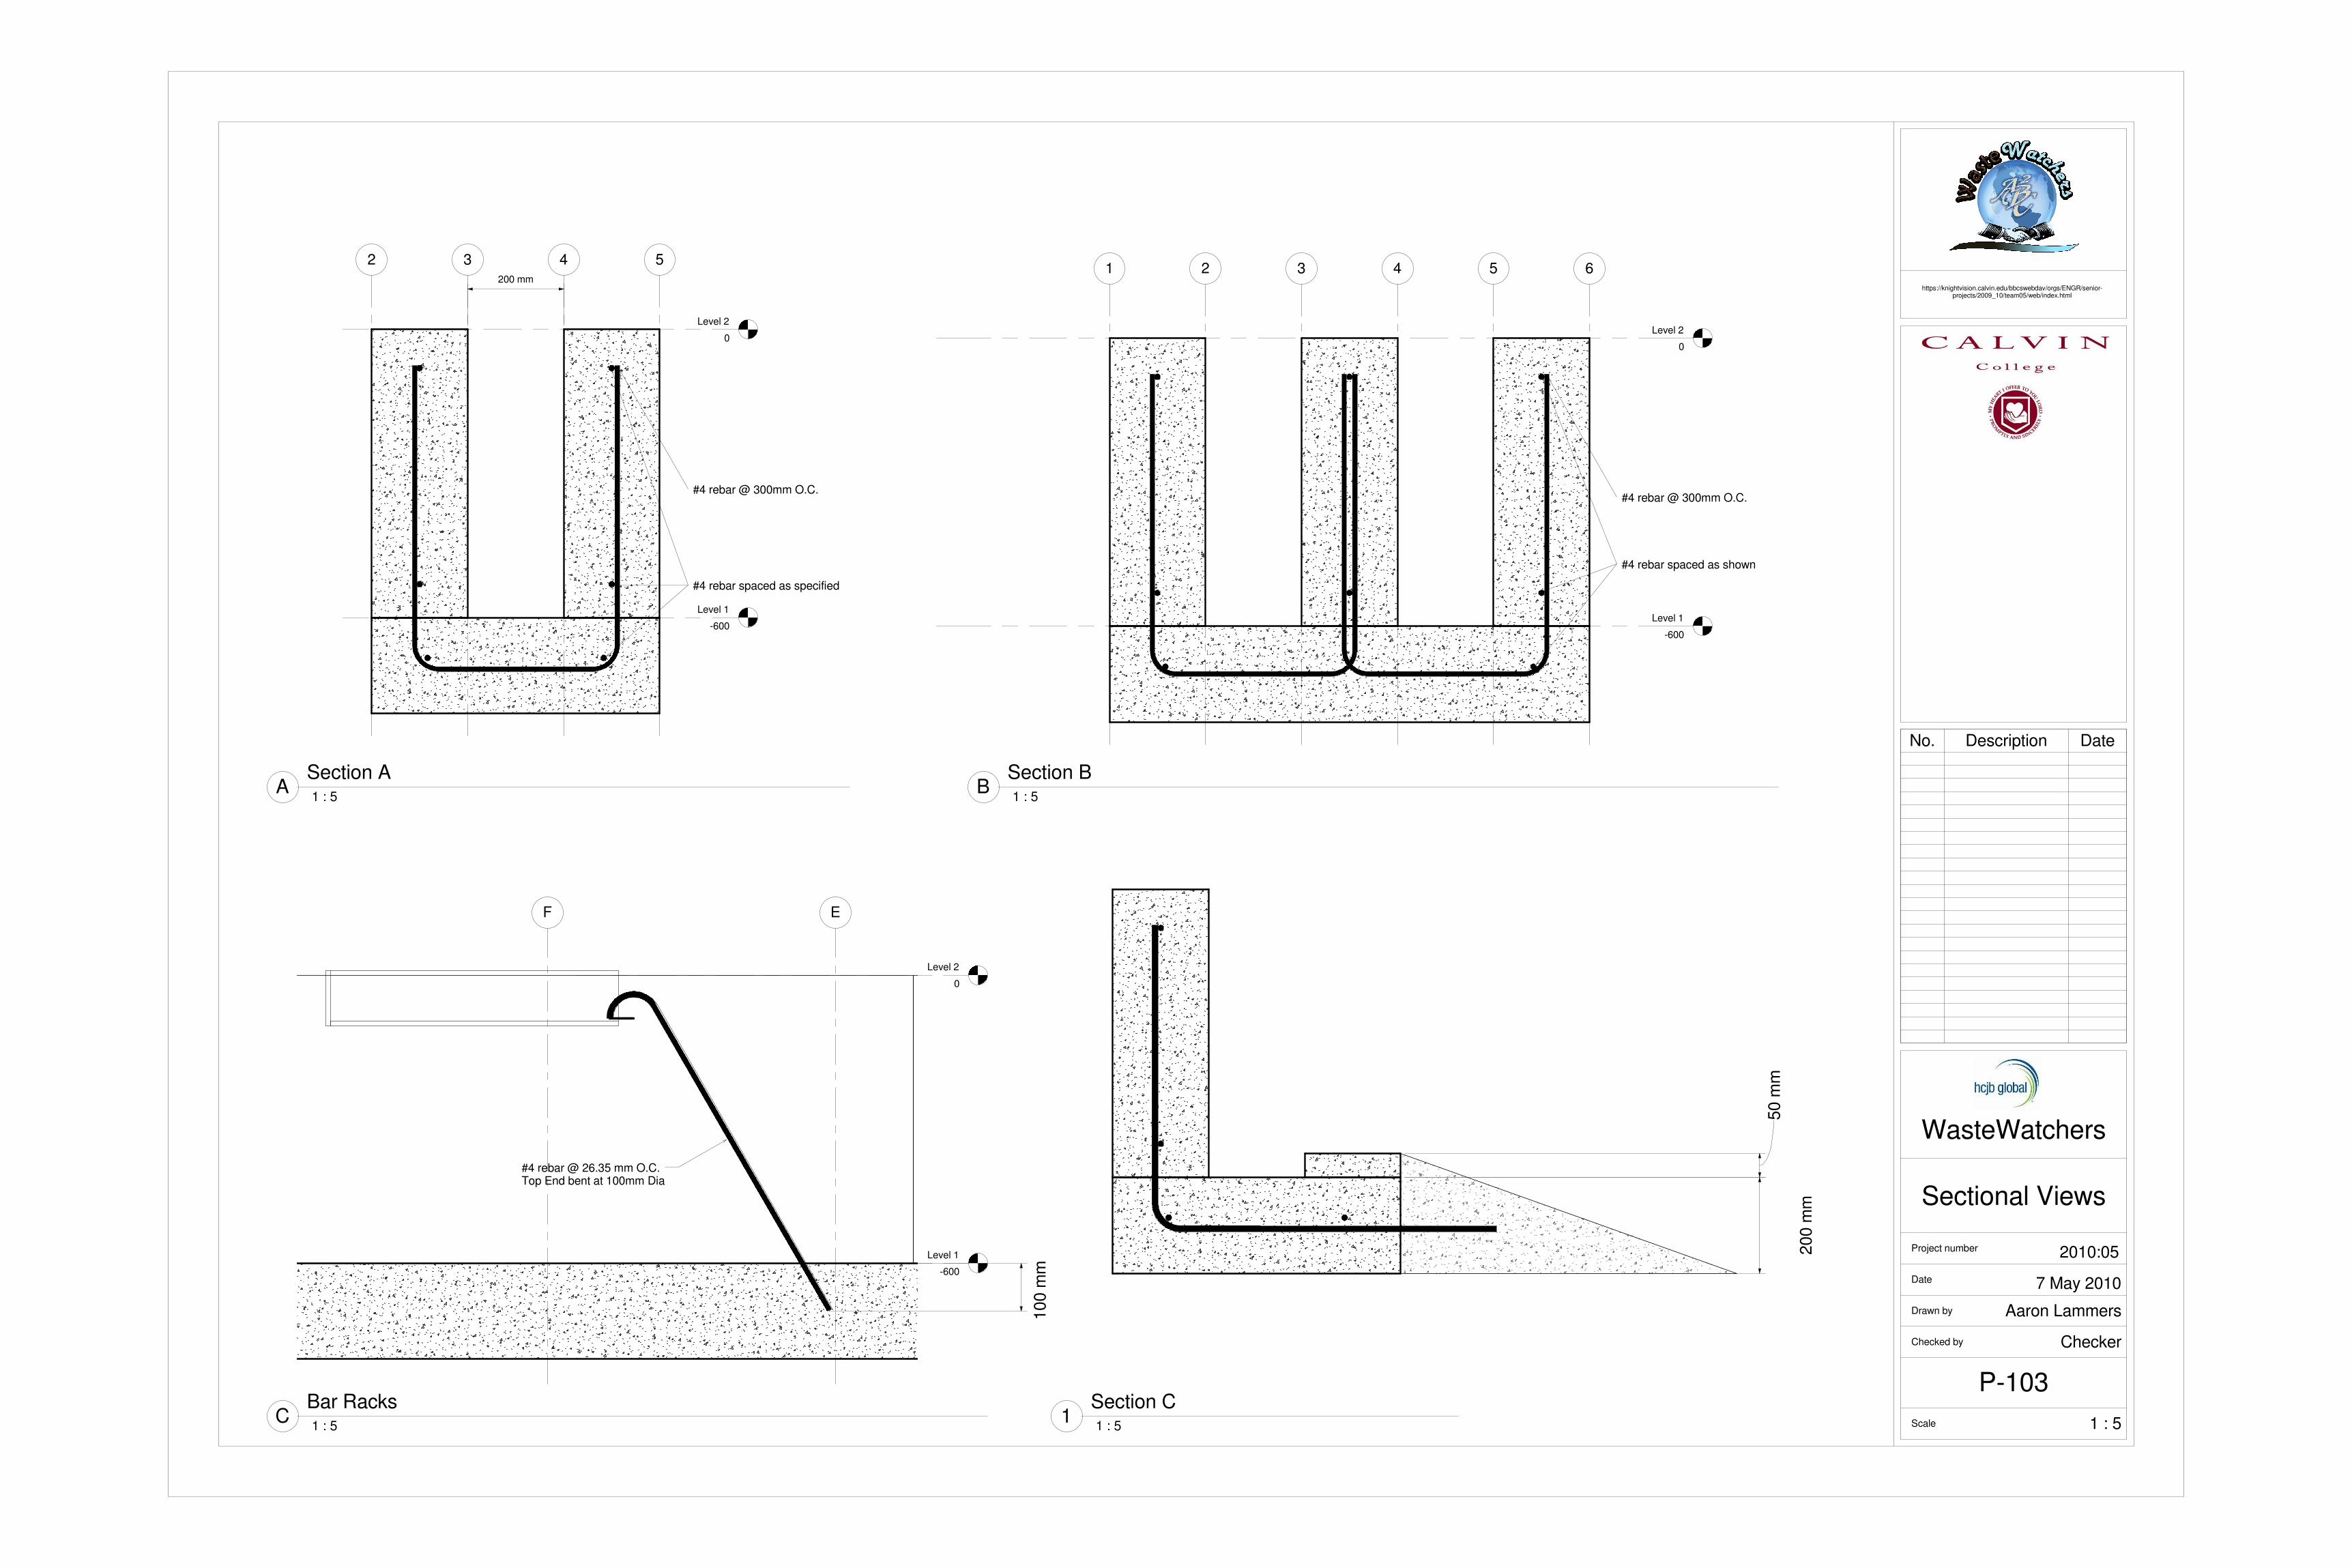
Level 1
-600
Level 2
0
#4 rebar @ 26.35 mm O.C.Top End bent at 100mm Dia
F E
100 m
m
Level 1
-600
Level 2
0
2 3 4 5
200 mm
#4 rebar @ 300mm O.C.
#4 rebar spaced as specified
Level 1
-600
Level 2
0
2 3 41 5 6
#4 rebar @ 300mm O.C.
#4 rebar spaced as shown
50 m
m
200 m
m
https://knightvision.calvin.edu/bbcswebdav/orgs/ENGR/senior-projects/2009_10/team05/web/index.html
Scale
Checked by
Drawn by
Date
Project number 2010:05
7 May 2010
1 : 5
Sectional Views
WasteWatchers
Aaron Lammers
Checker
P-103
1 : 5
Bar RacksC
1 : 5
Section AA
1 : 5
Section BB
1 : 5
Section C1
No. Description Date
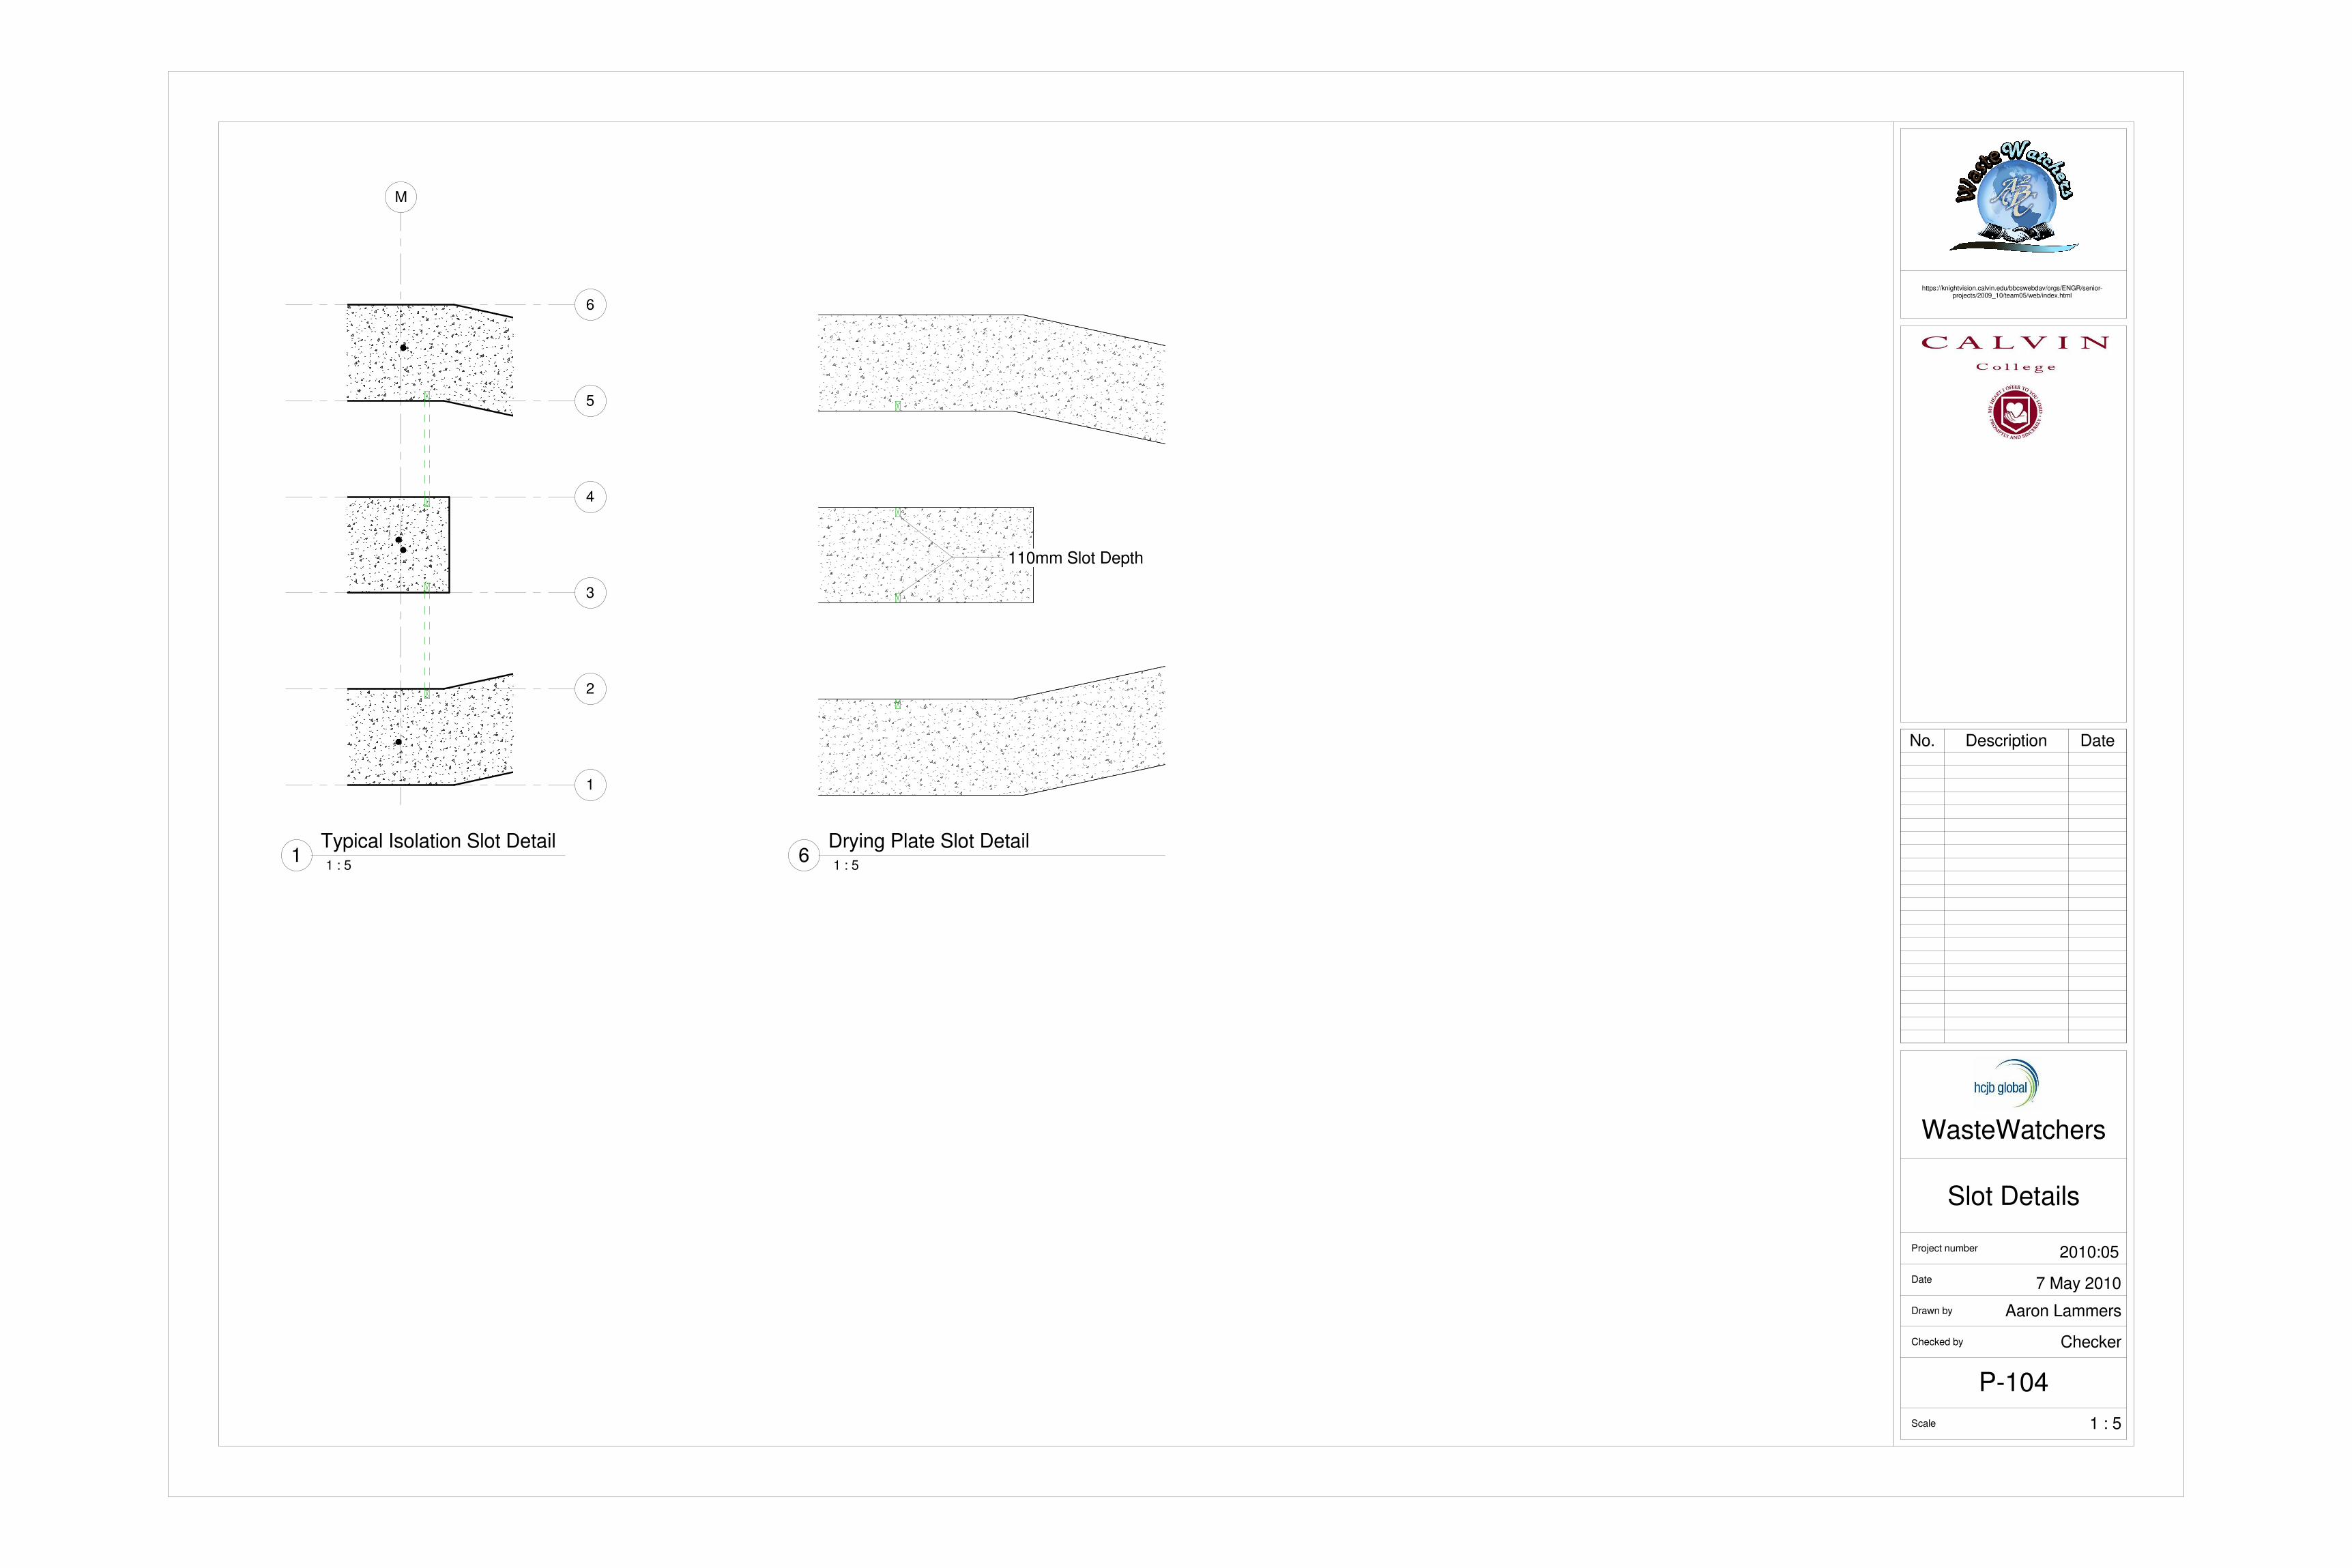
2
3
4
1
5
6
M
110mm Slot Depth
https://knightvision.calvin.edu/bbcswebdav/orgs/ENGR/senior-projects/2009_10/team05/web/index.html
Scale
Checked by
Drawn by
Date
Project number 2010:05
7 May 2010
1 : 5
Slot Details
WasteWatchers
Aaron Lammers
Checker
P-104
1 : 5
Typical Isolation Slot Detail1
1 : 5
Drying Plate Slot Detail6
No. Description Date
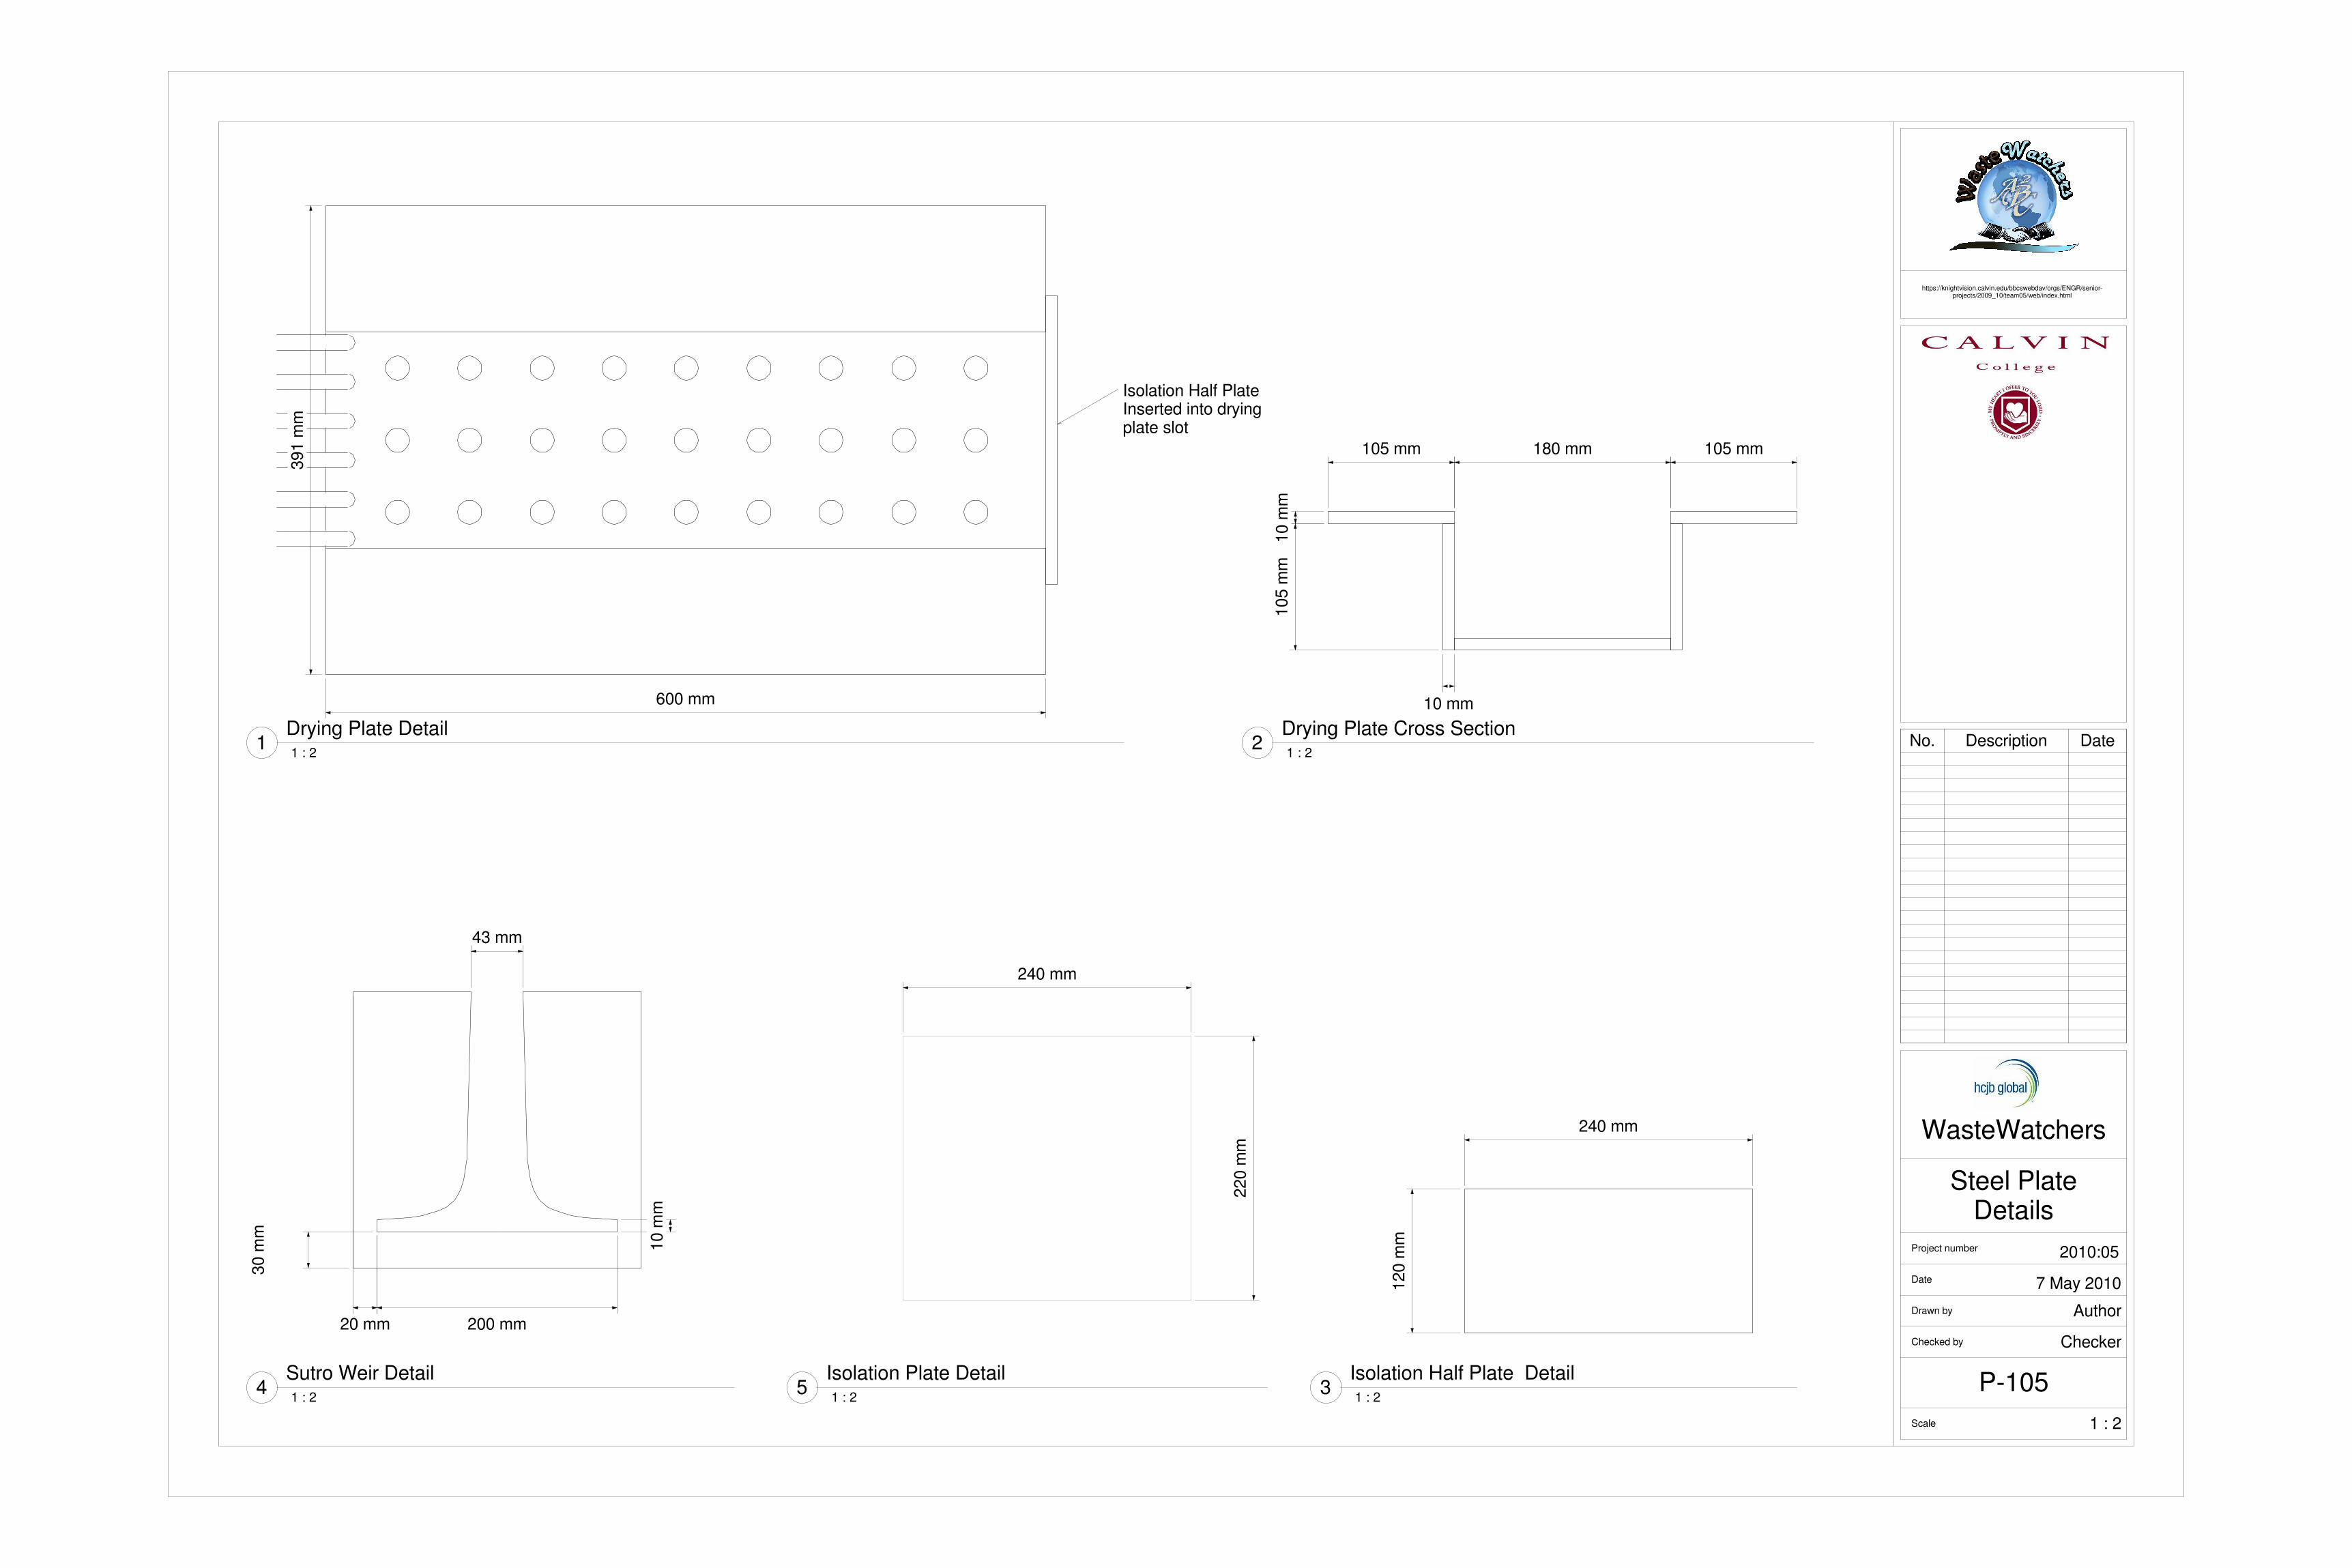
600 mm
391 m
m
Isolation Half PlateInserted into dryingplate slot
105 m
m10 m
m
105 mm 180 mm
10 mm
105 mm
240 mm
120 m
m
200 mm
10 m
m
43 mm
30 m
m
20 mm
240 mm
220 m
m
https://knightvision.calvin.edu/bbcswebdav/orgs/ENGR/senior-projects/2009_10/team05/web/index.html
Scale
Checked by
Drawn by
Date
Project number 2010:05
7 May 2010
1 : 2
Steel PlateDetails
WasteWatchers
Author
Checker
P-105
1 : 2
Drying Plate Detail1
1 : 2
Drying Plate Cross Section2
1 : 2
Isolation Half Plate Detail3
1 : 2
Sutro Weir Detail4
1 : 2
Isolation Plate Detail5
No. Description Date
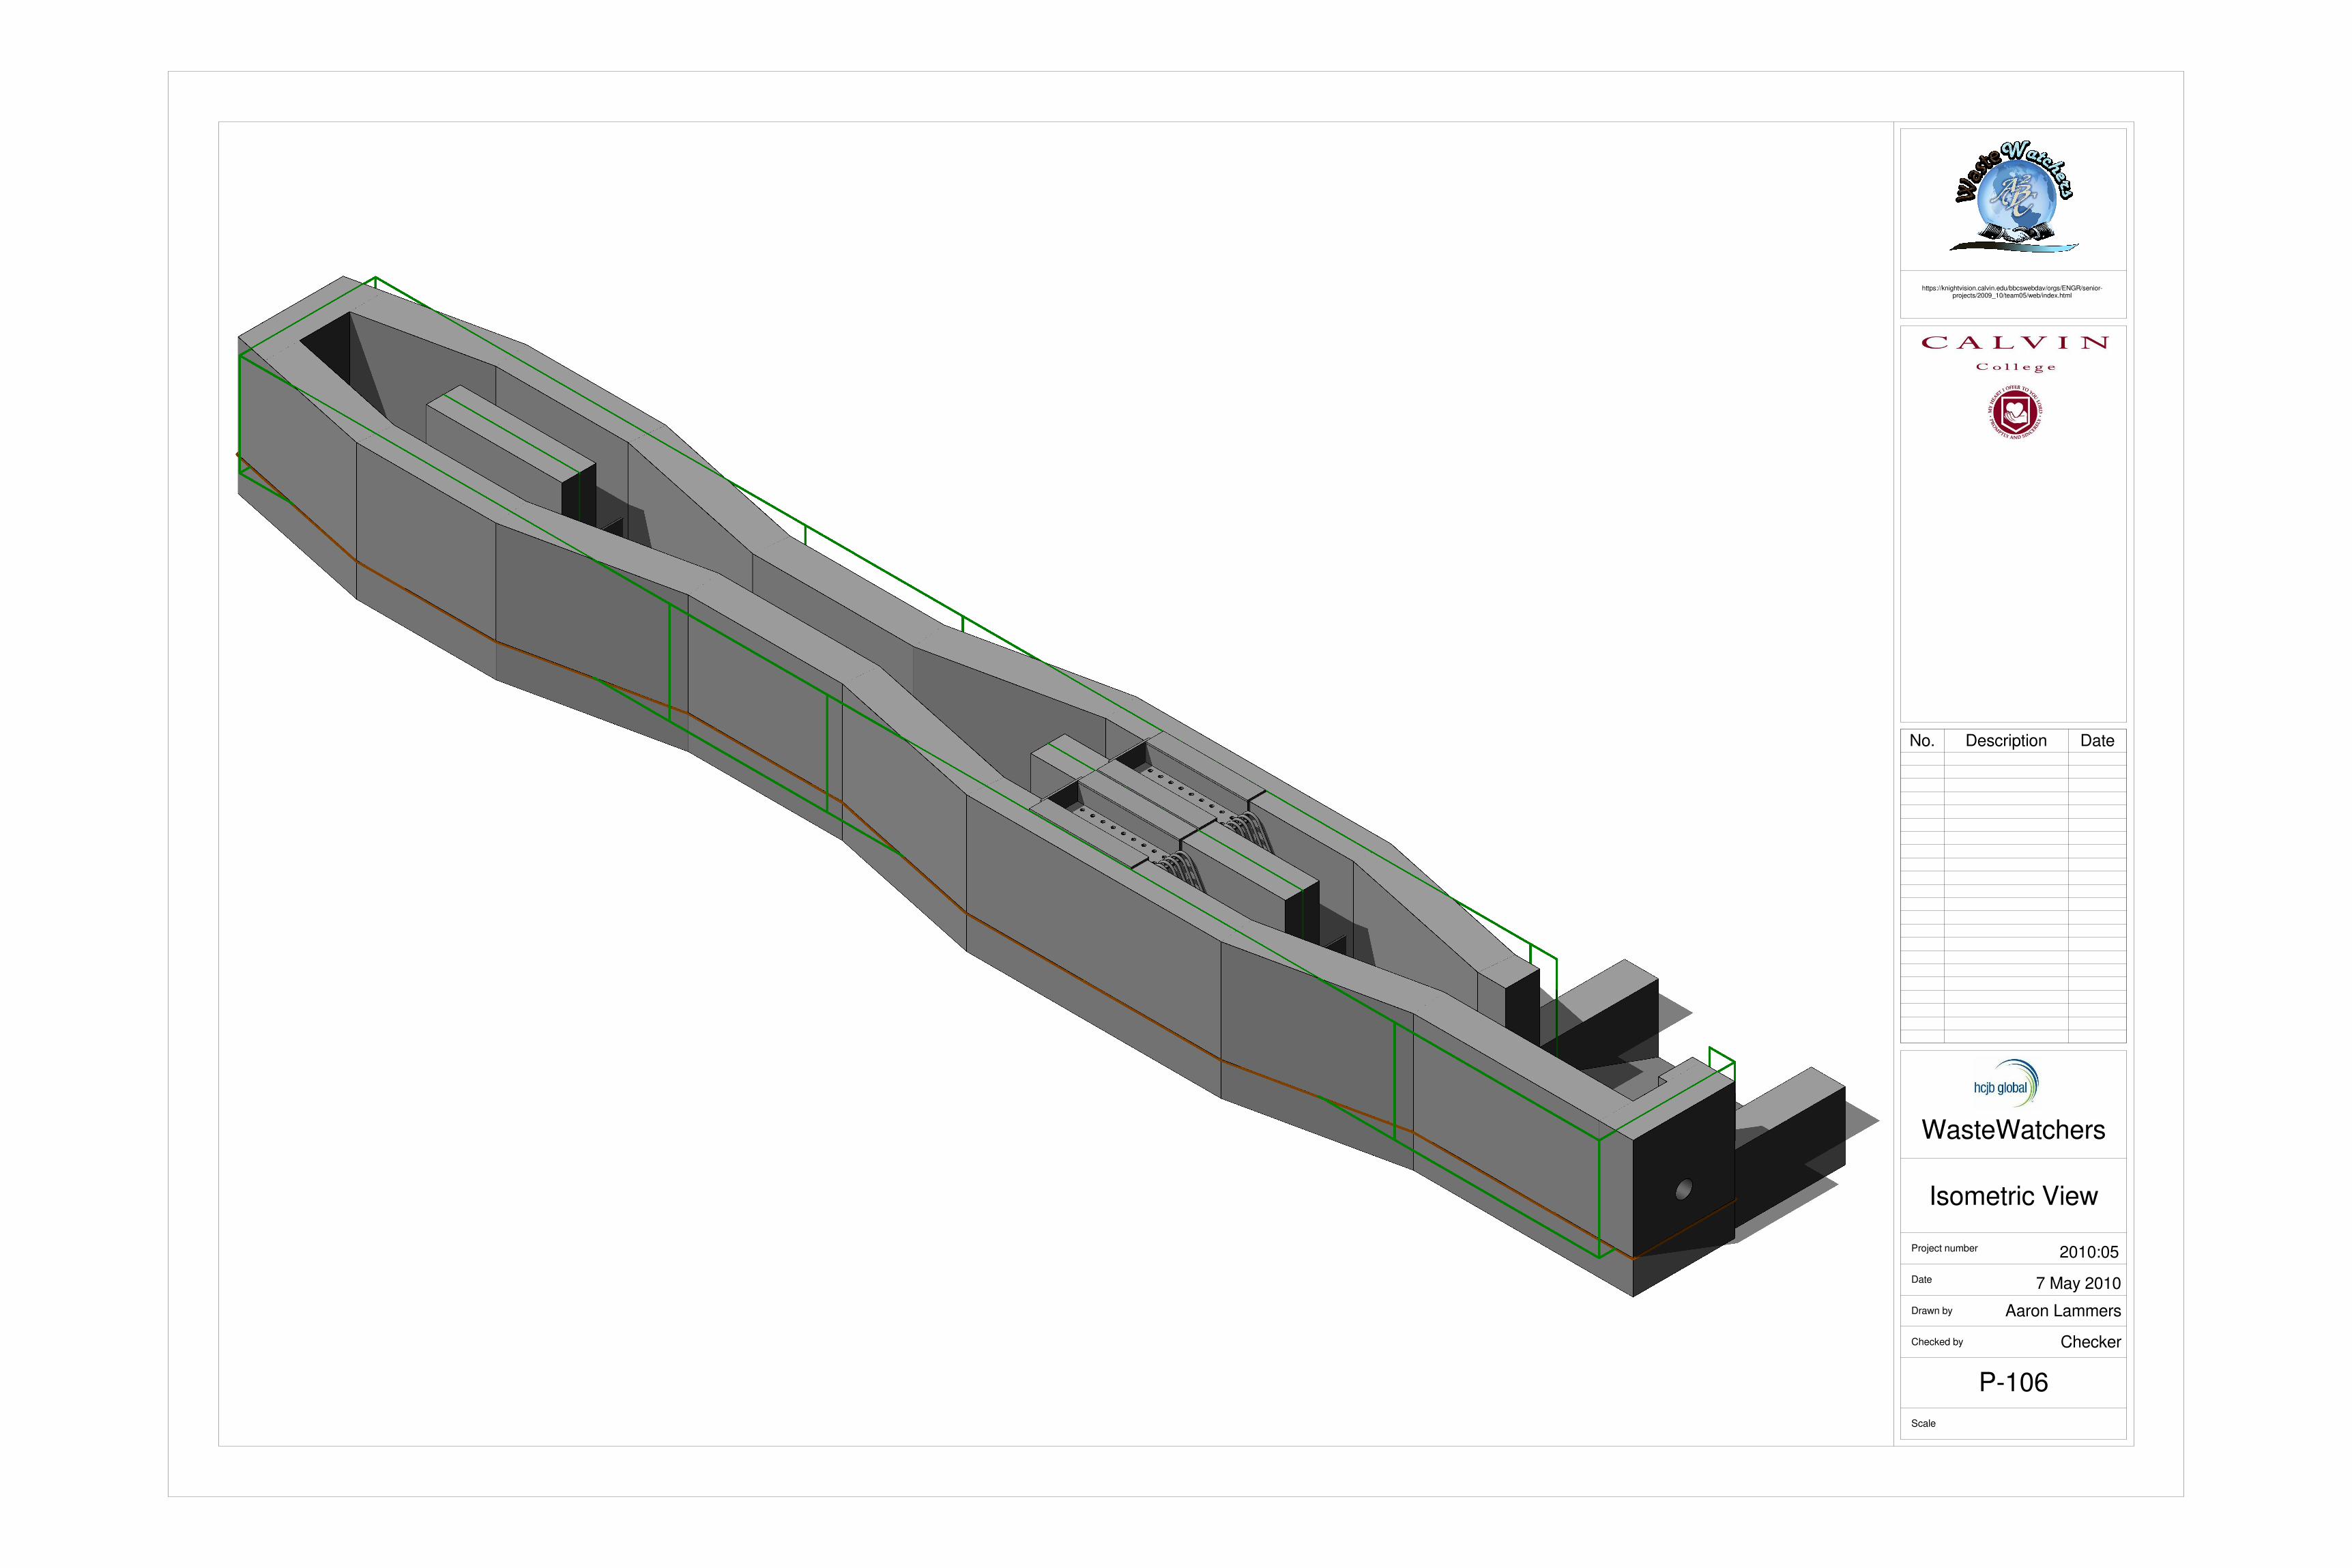
https://knightvision.calvin.edu/bbcswebdav/orgs/ENGR/senior-projects/2009_10/team05/web/index.html
Scale
Checked by
Drawn by
Date
Project number 2010:05
7 May 2010
Isometric View
WasteWatchers
Aaron Lammers
Checker
P-106
No. Description Date
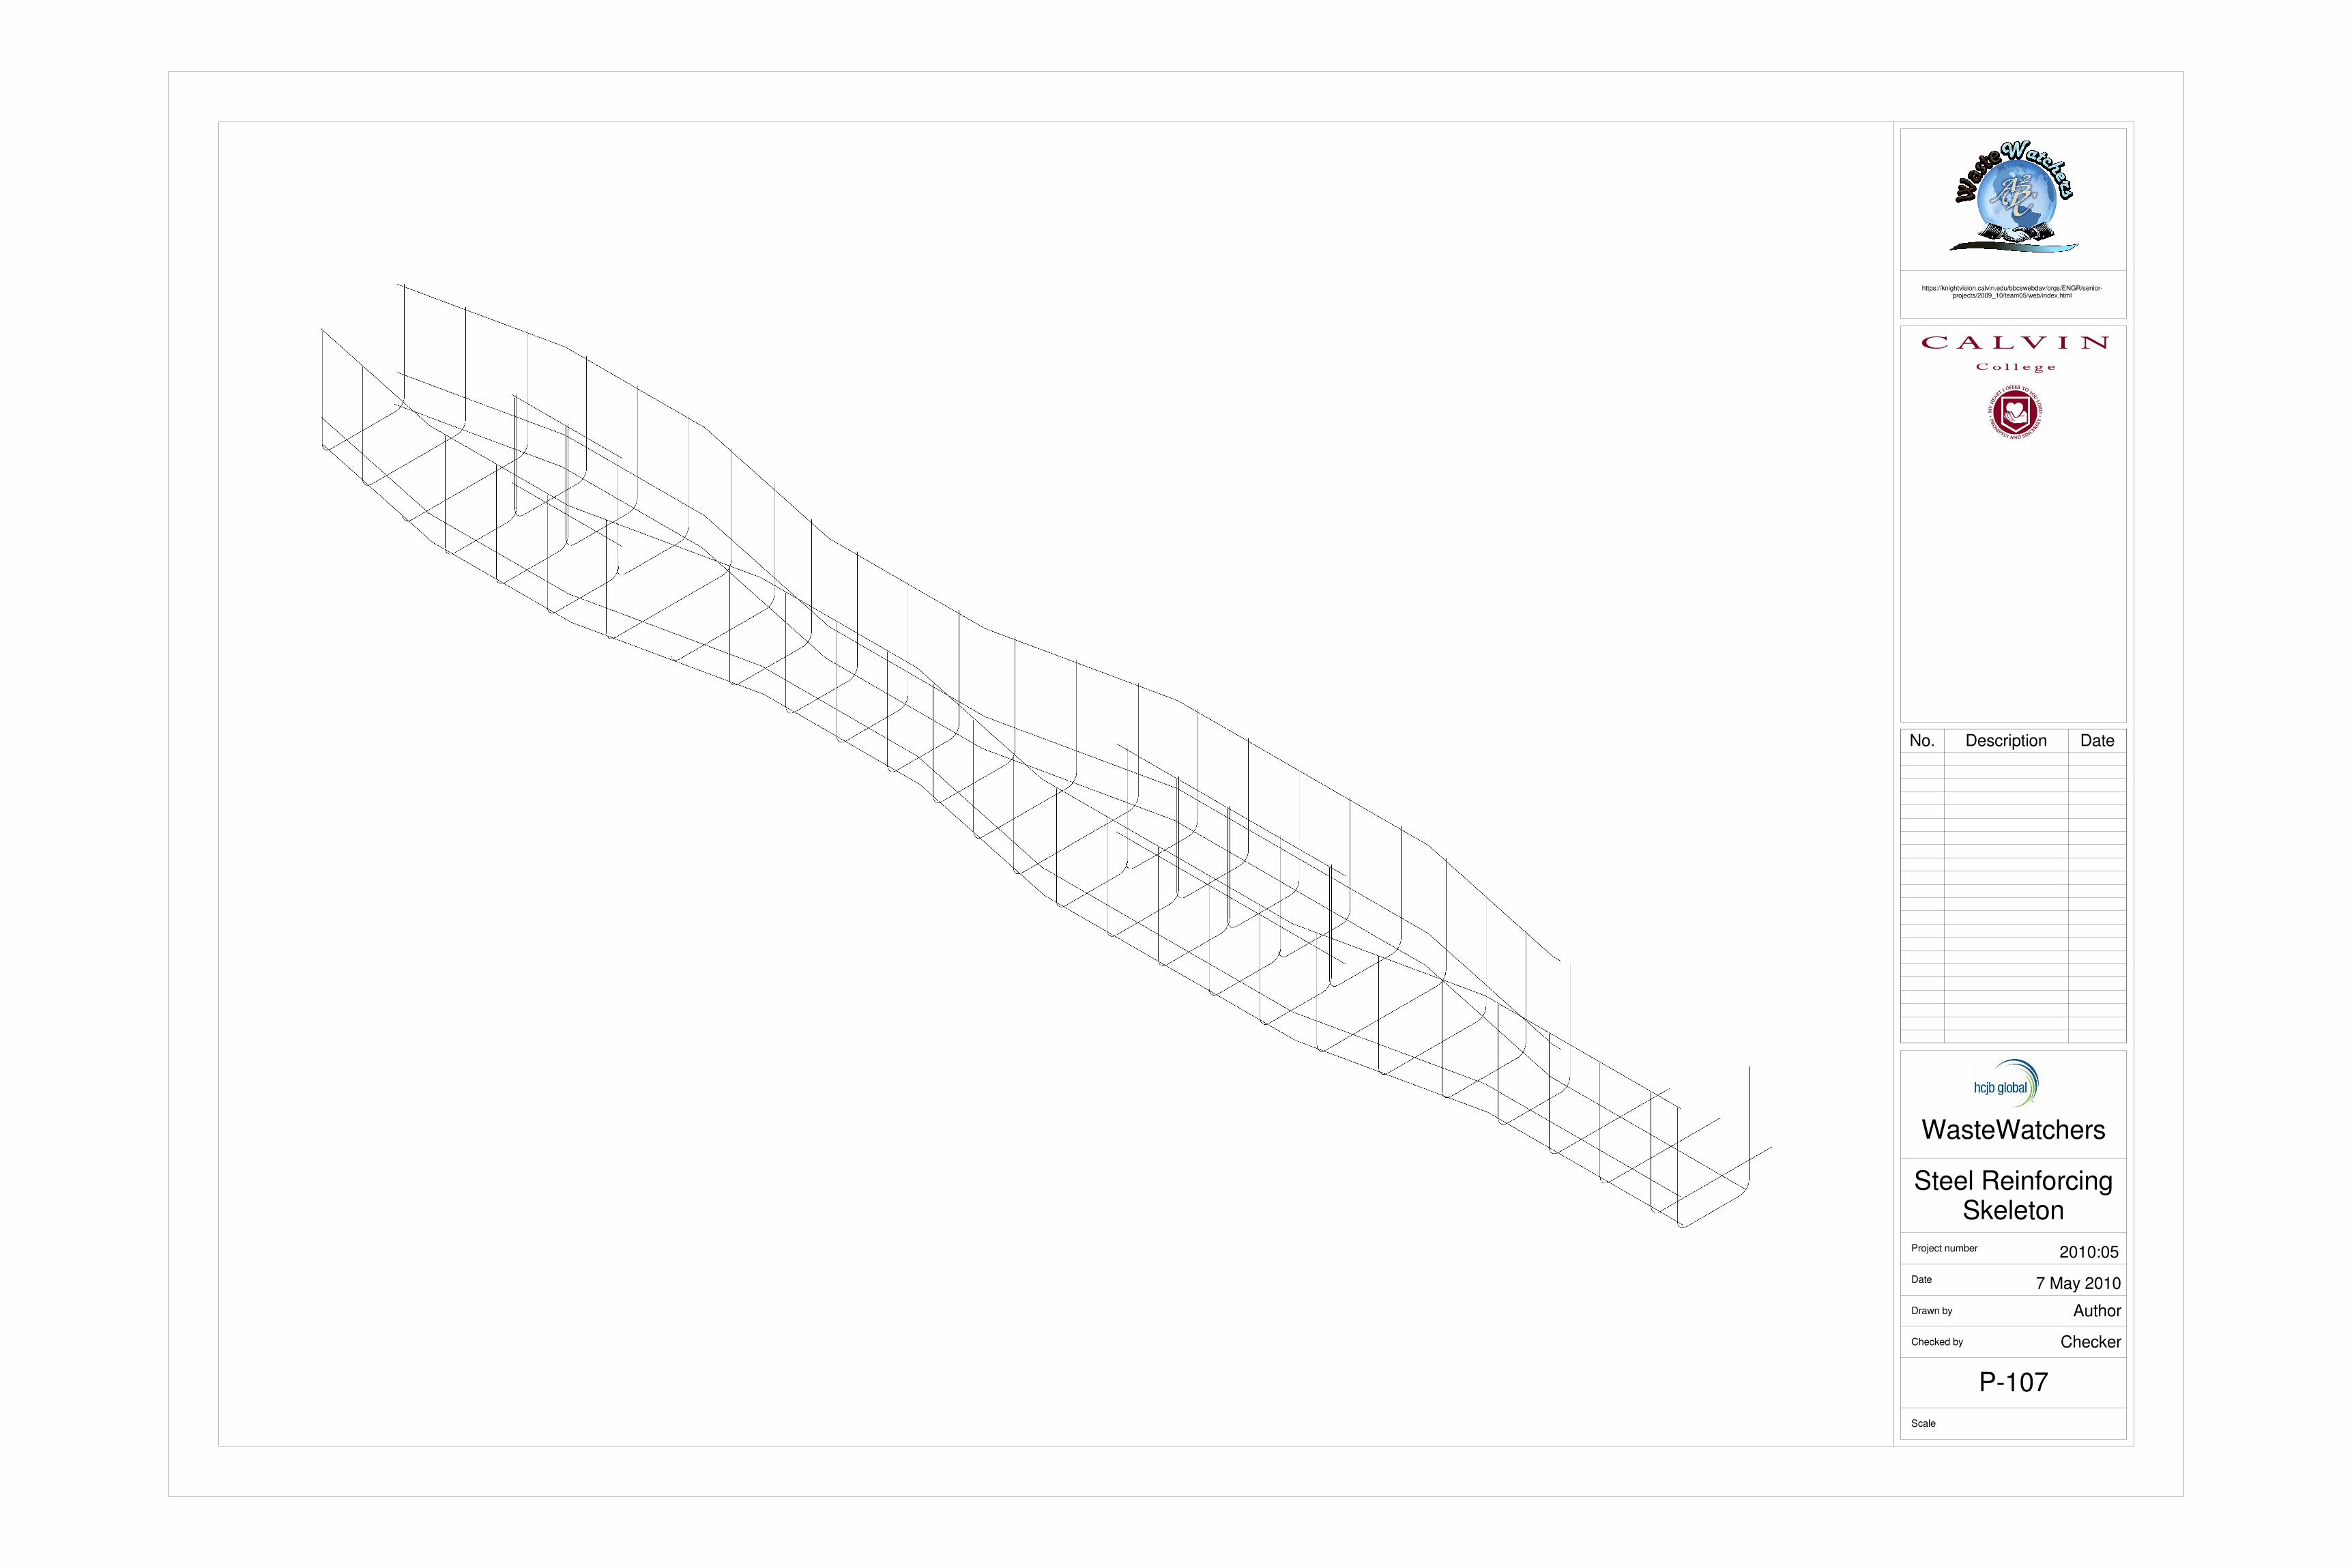
https://knightvision.calvin.edu/bbcswebdav/orgs/ENGR/senior-projects/2009_10/team05/web/index.html
Scale
Checked by
Drawn by
Date
Project number 2010:05
7 May 2010
Steel ReinforcingSkeleton
WasteWatchers
Author
Checker
P-107
No. Description Date
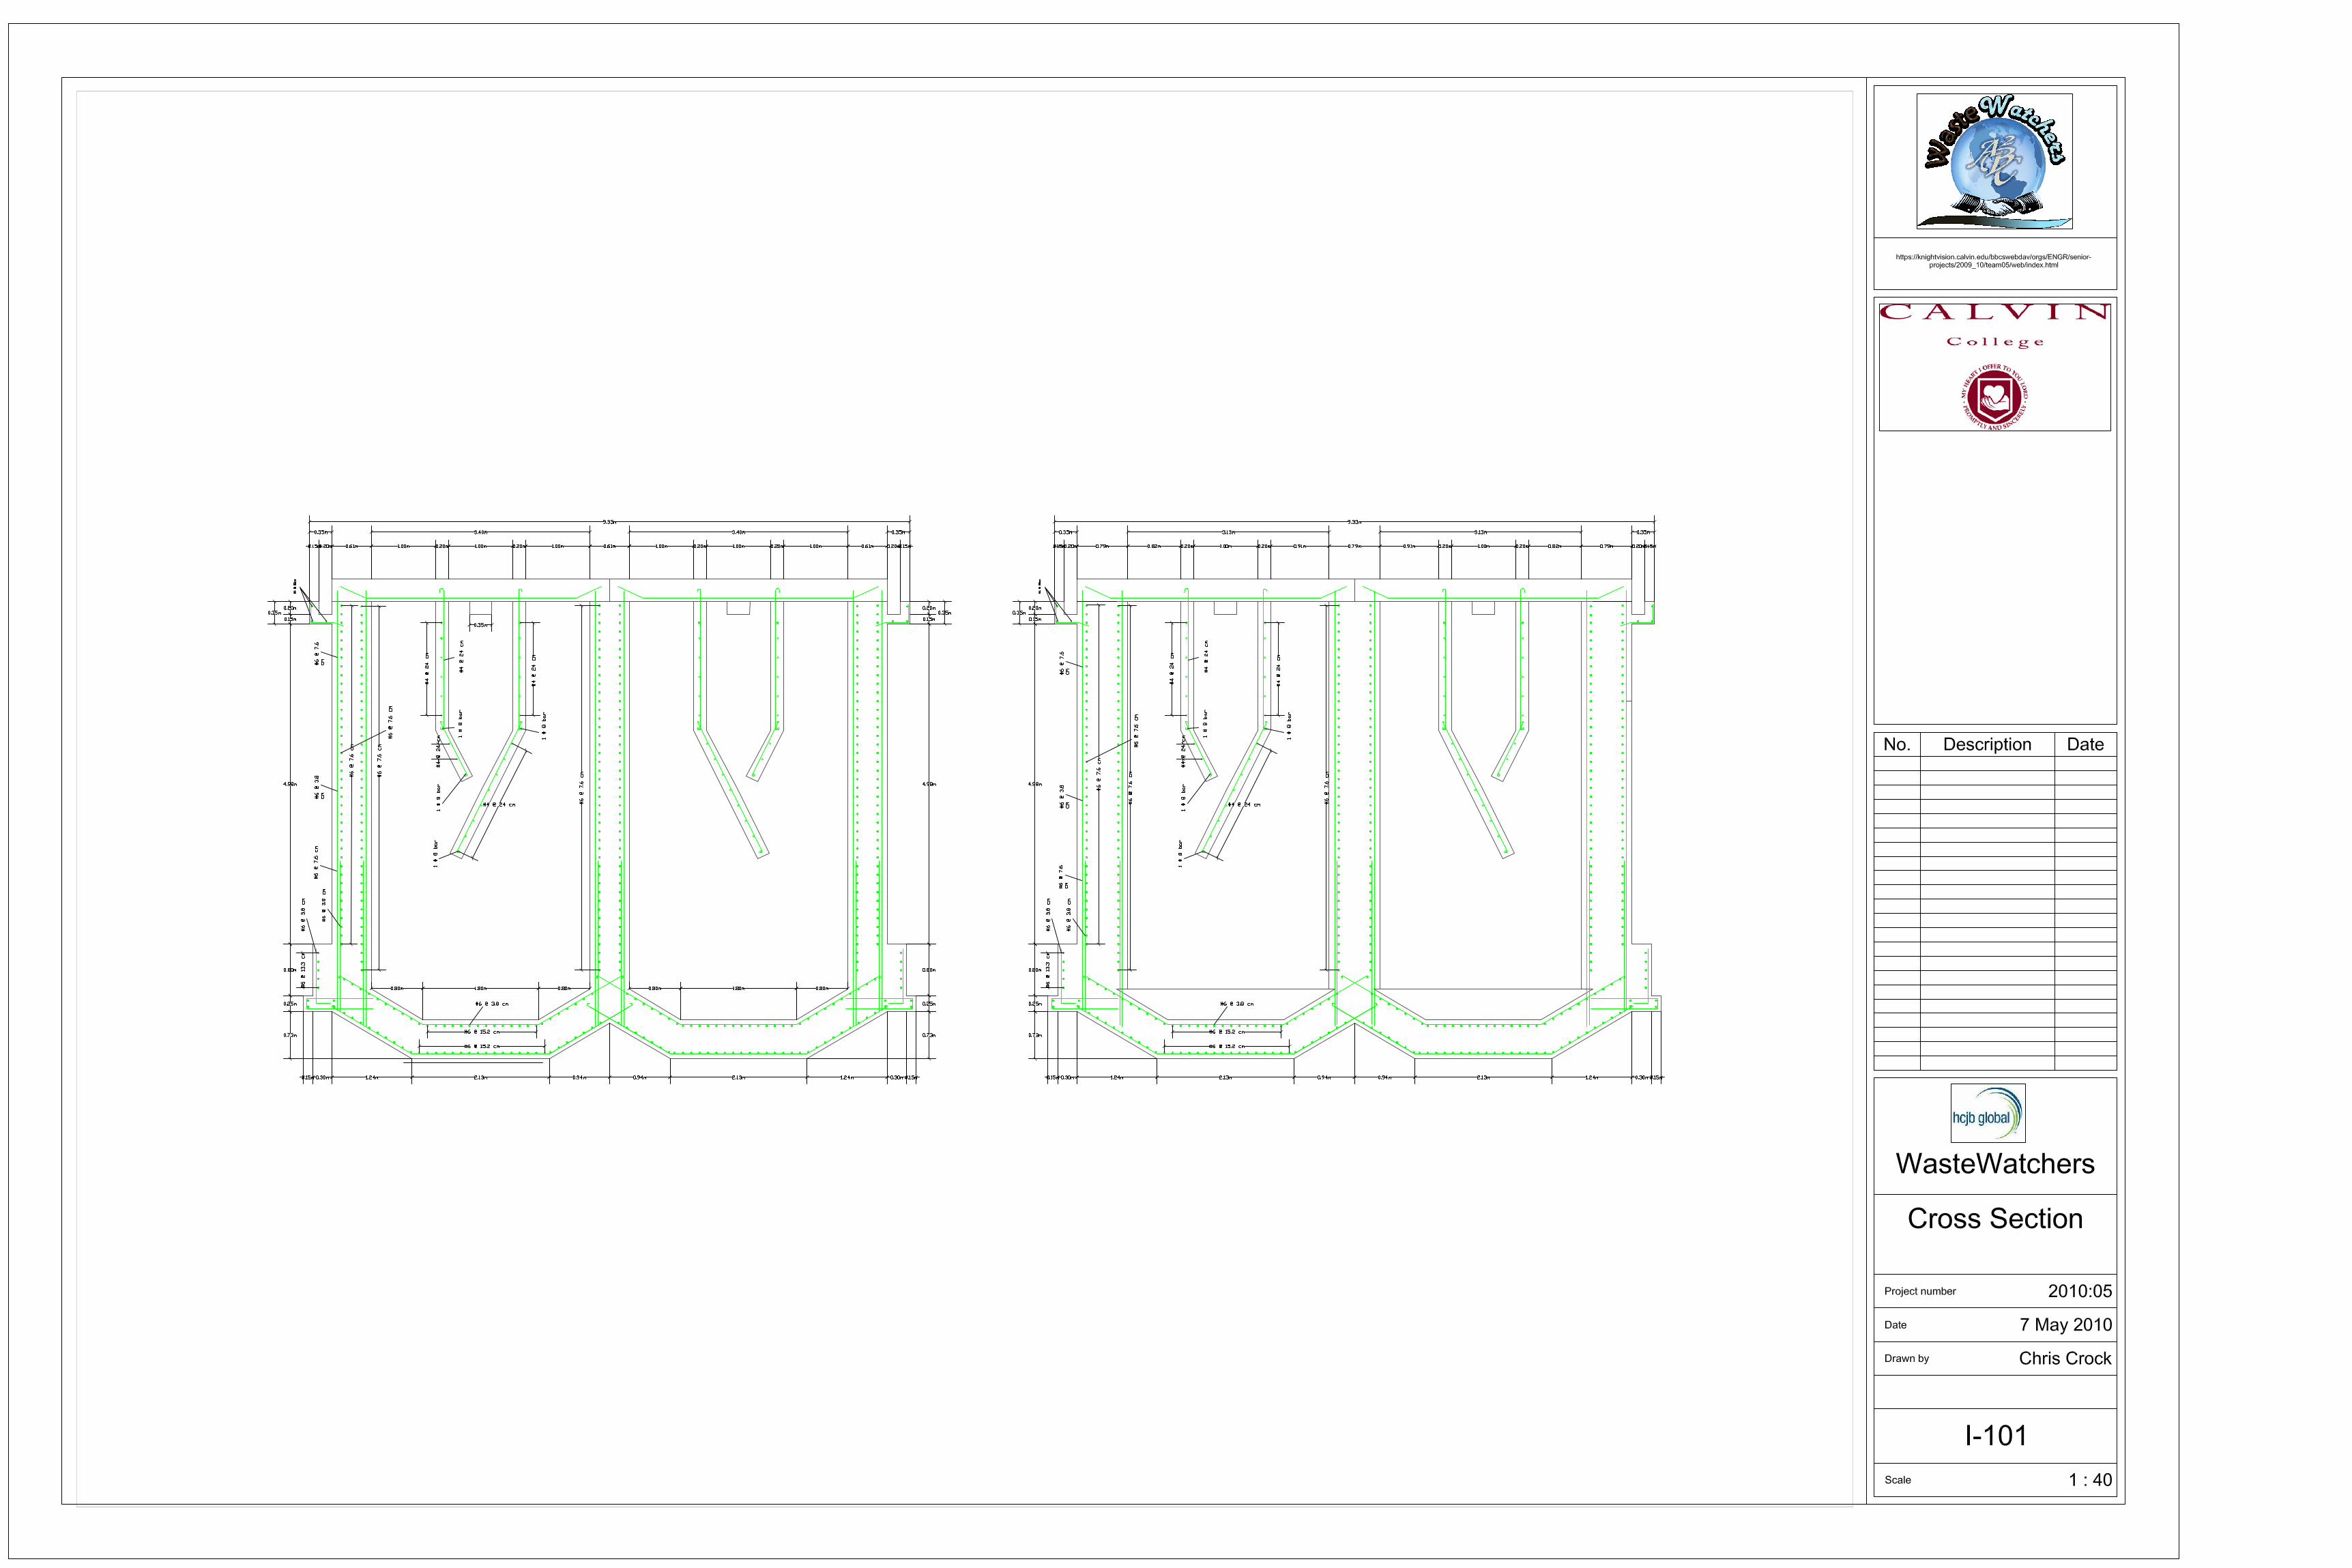
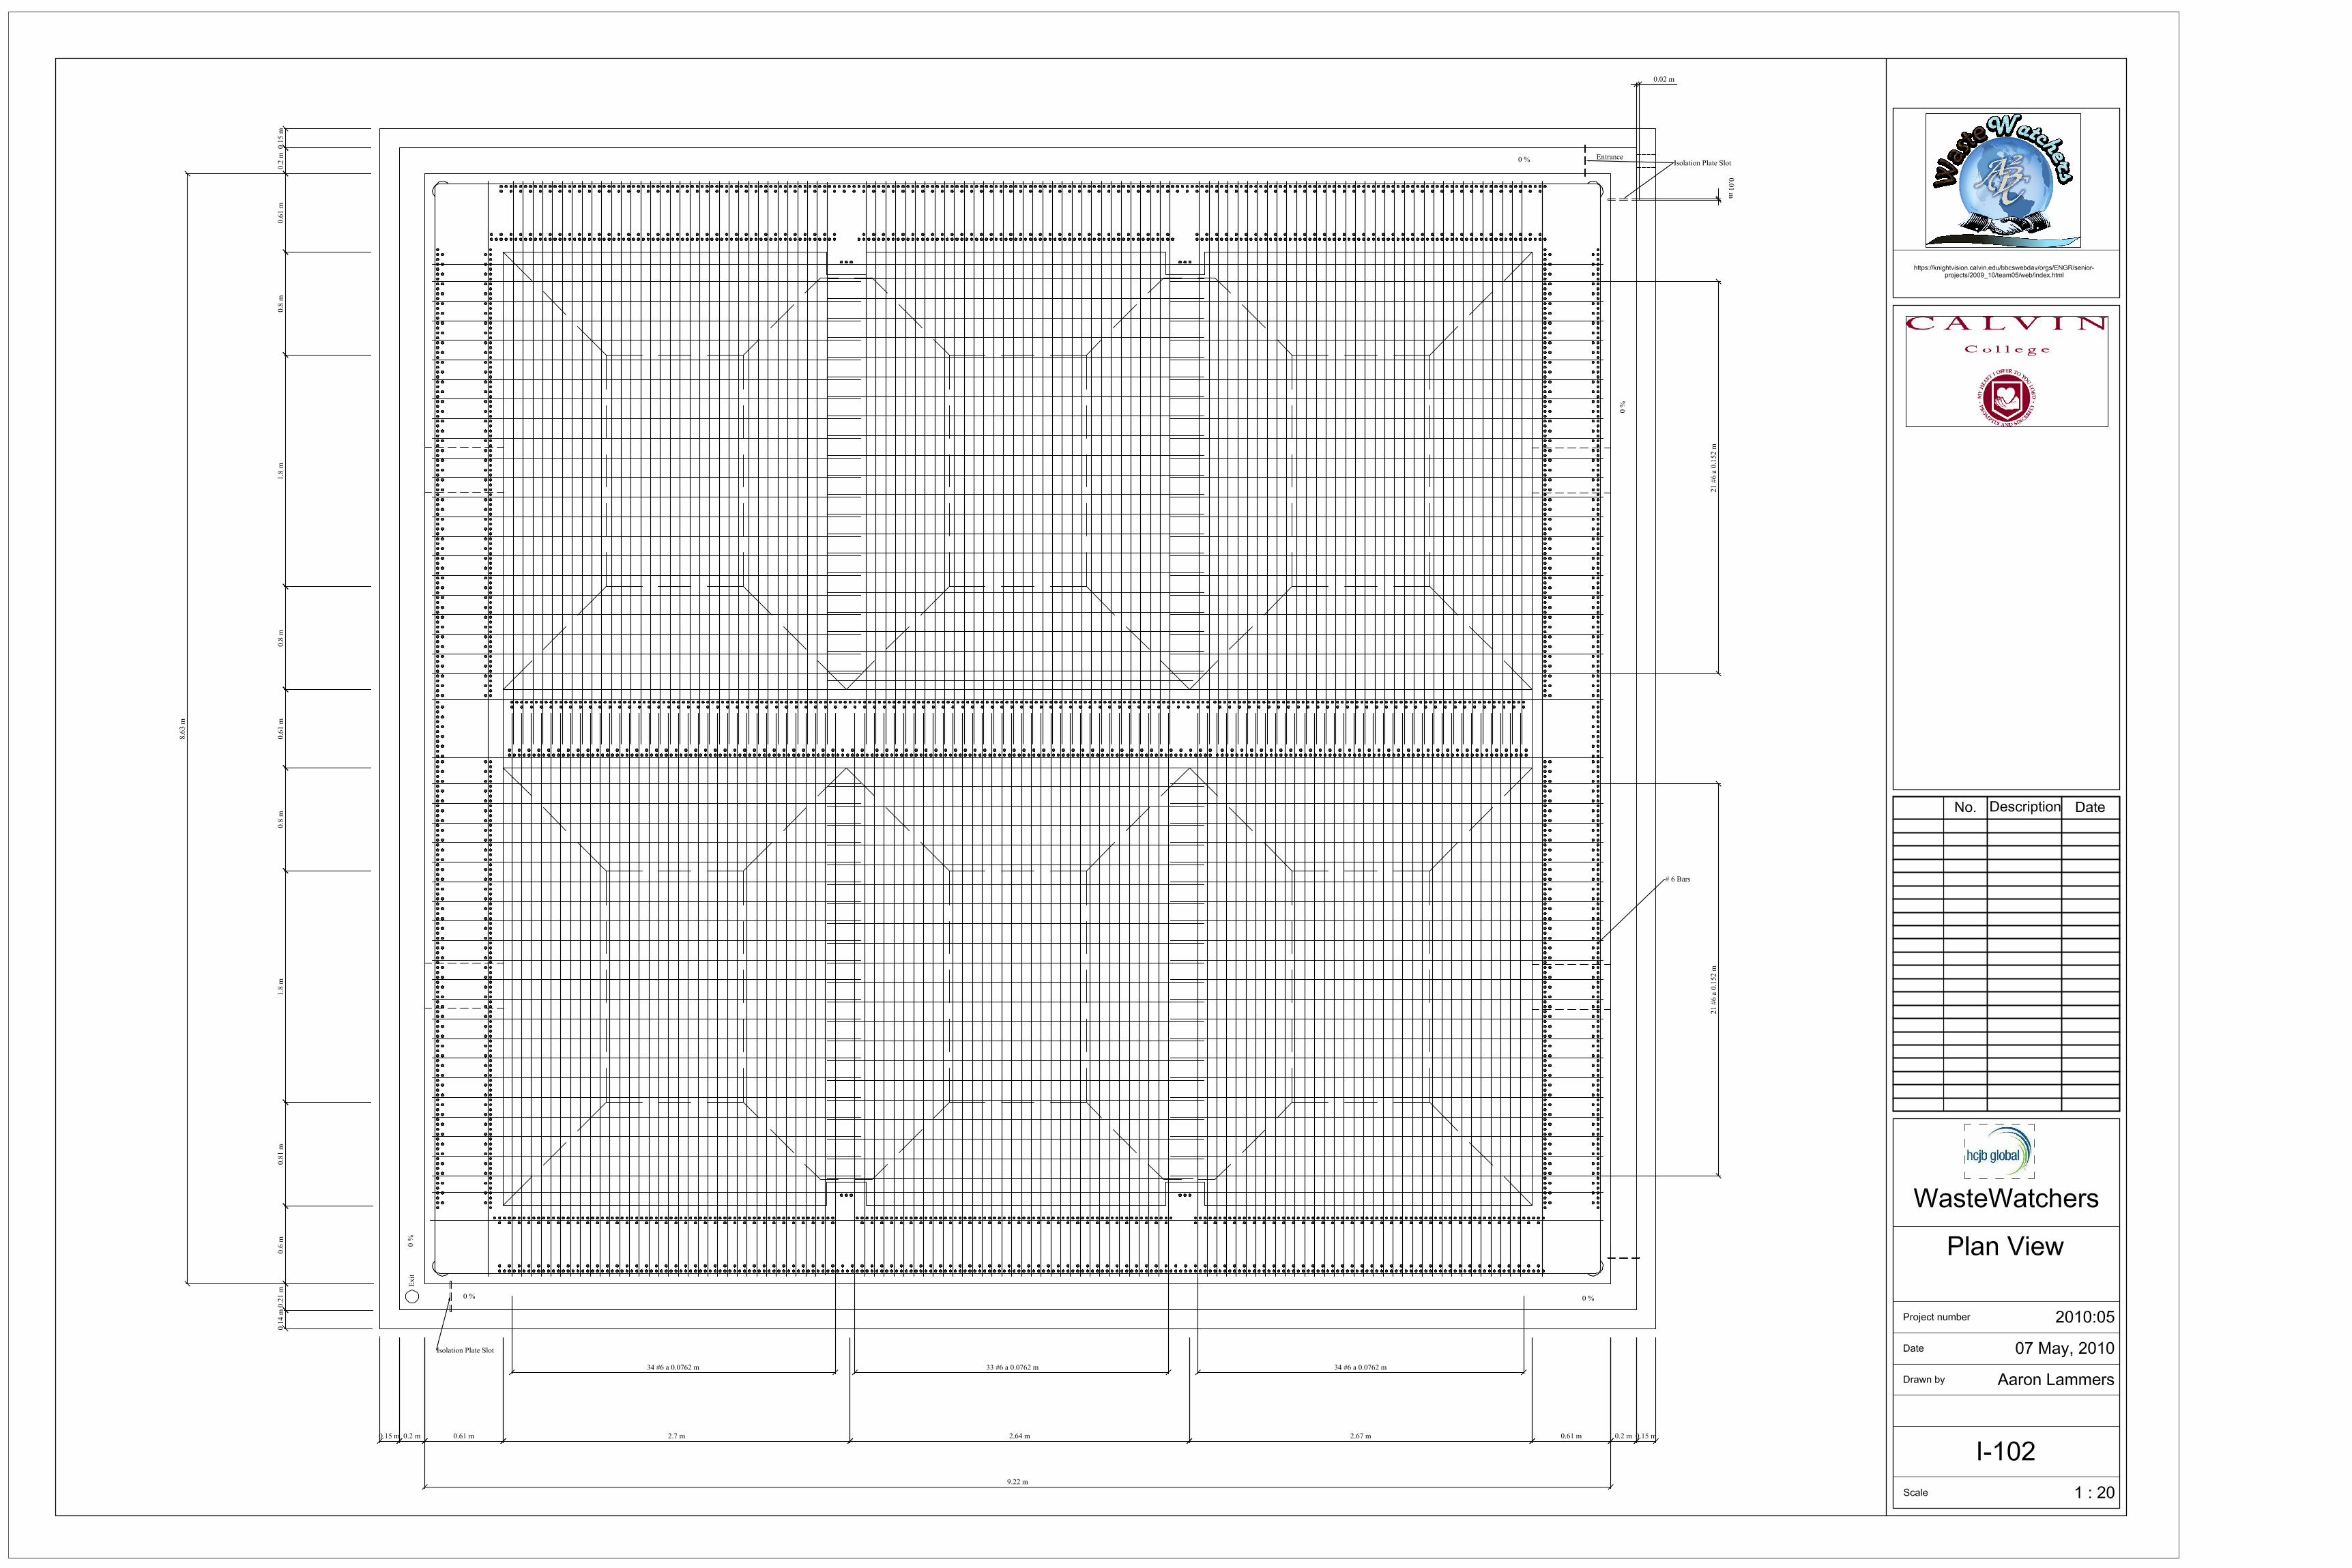
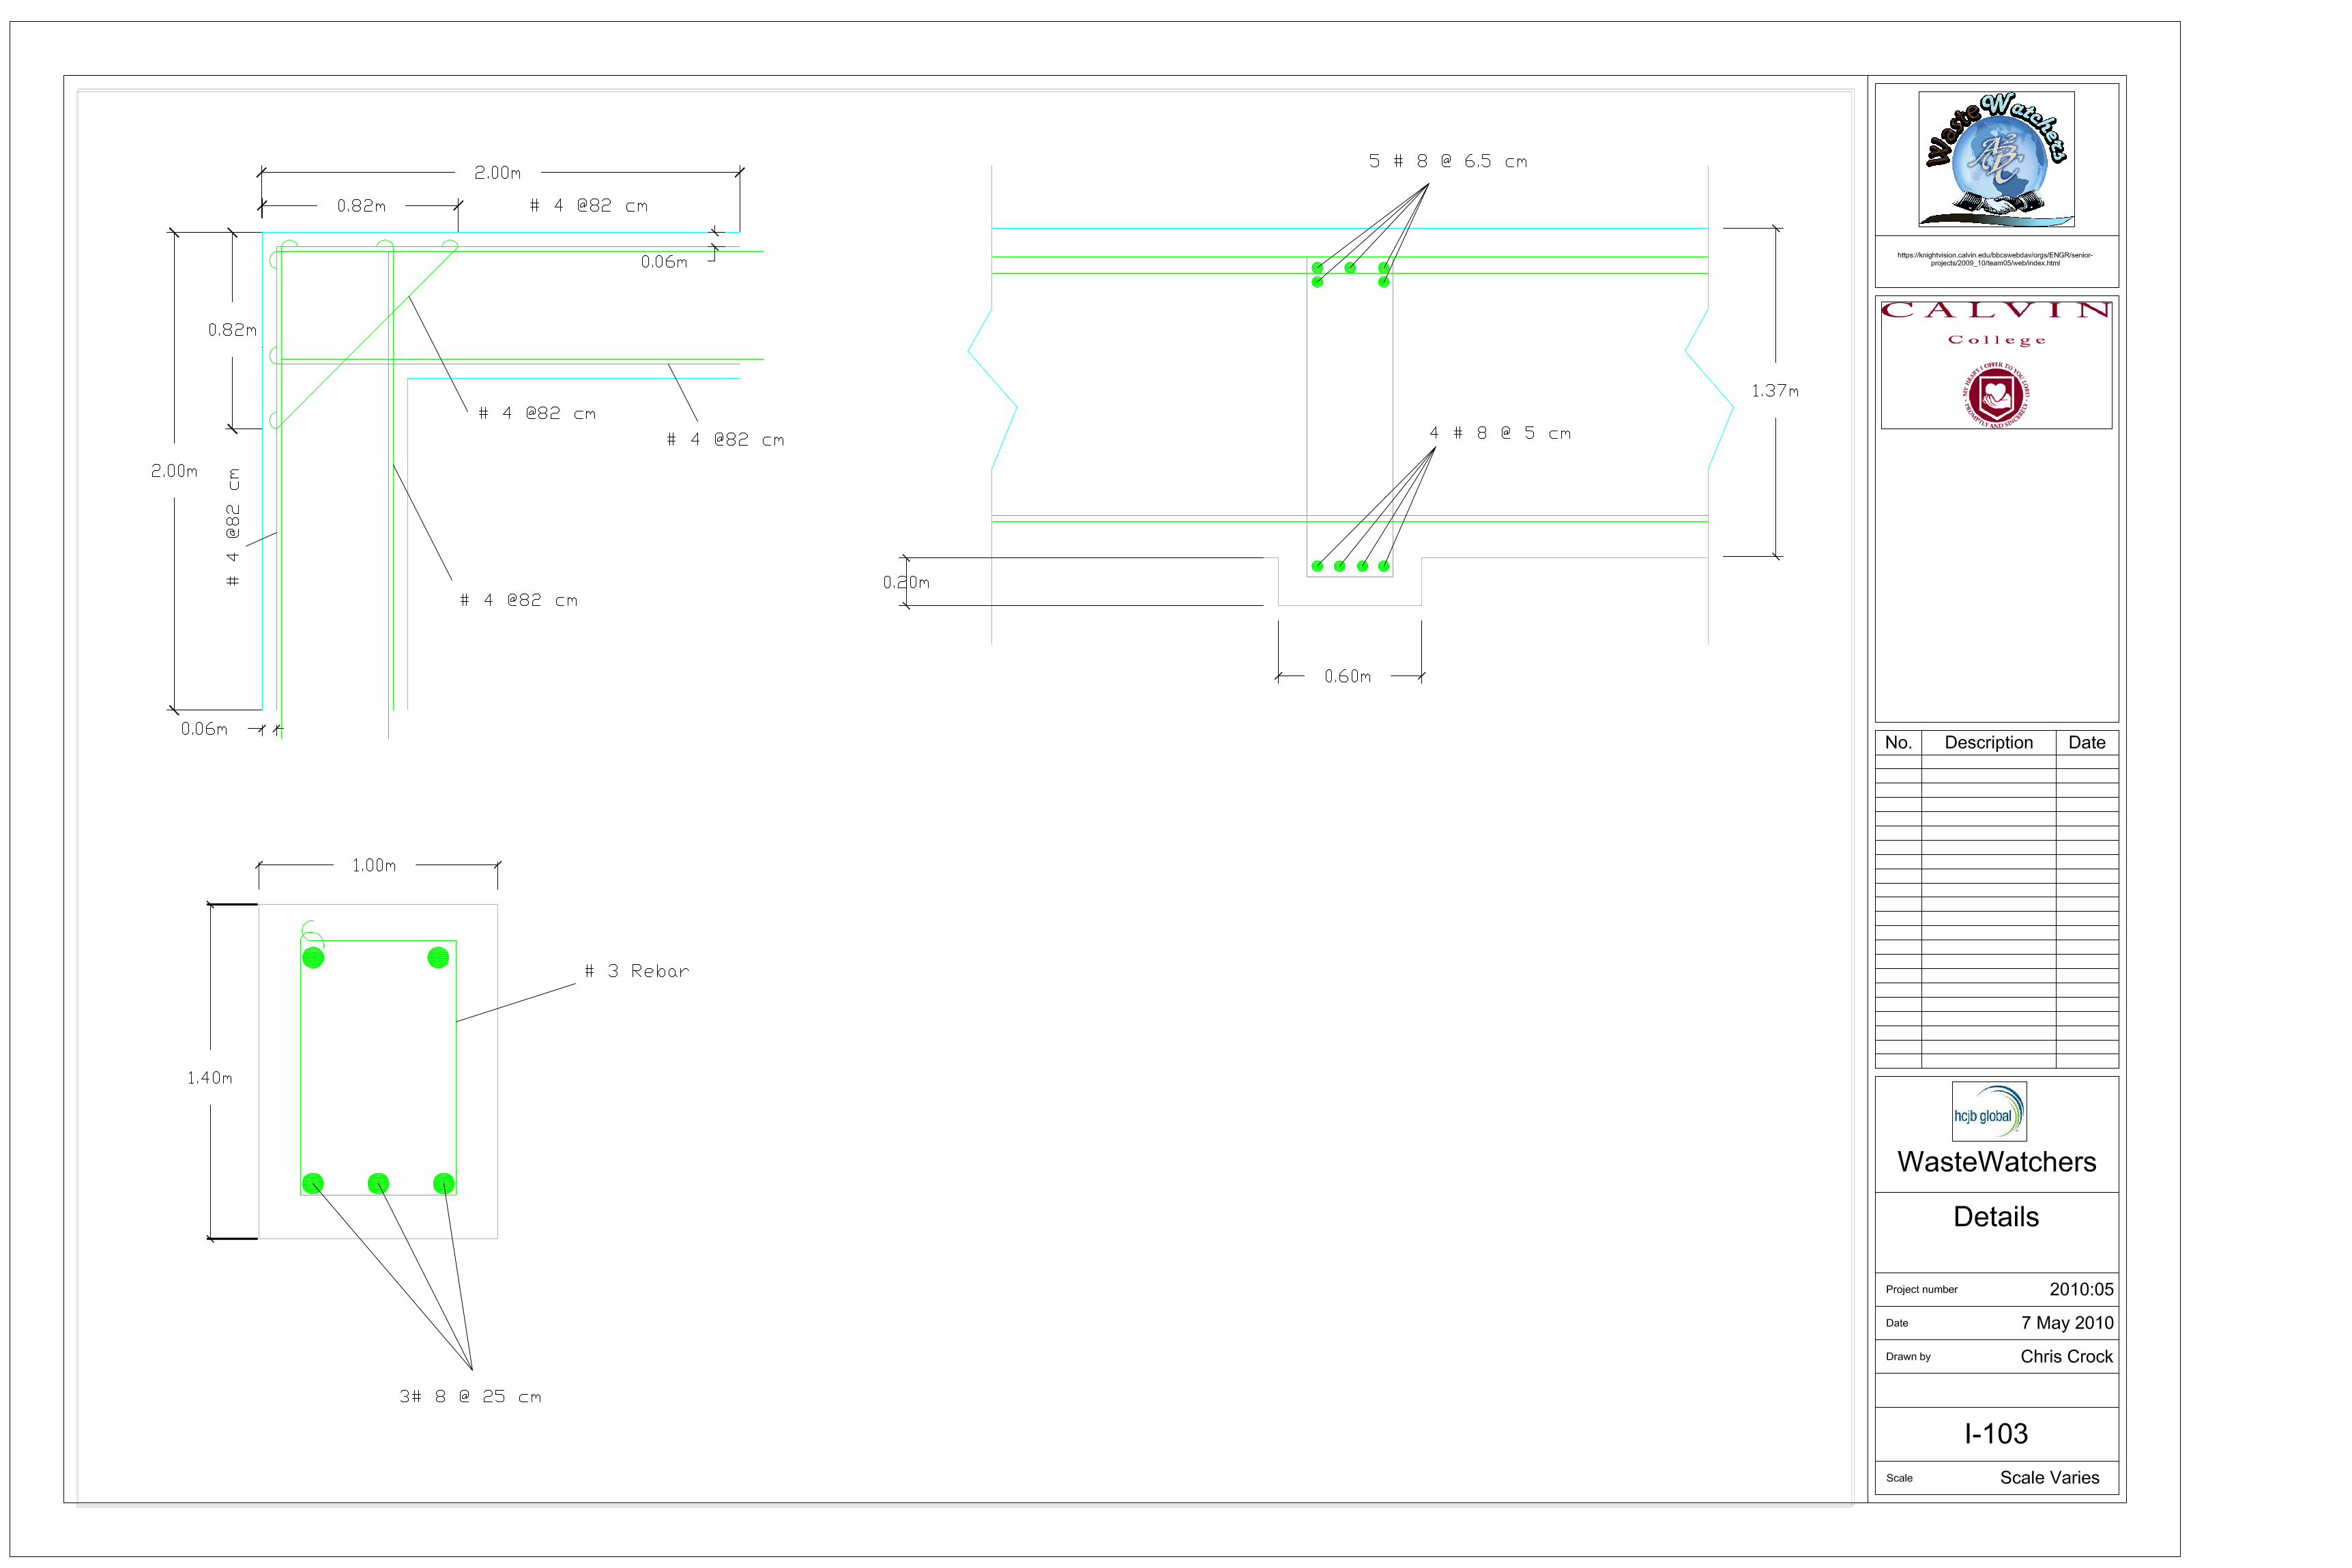
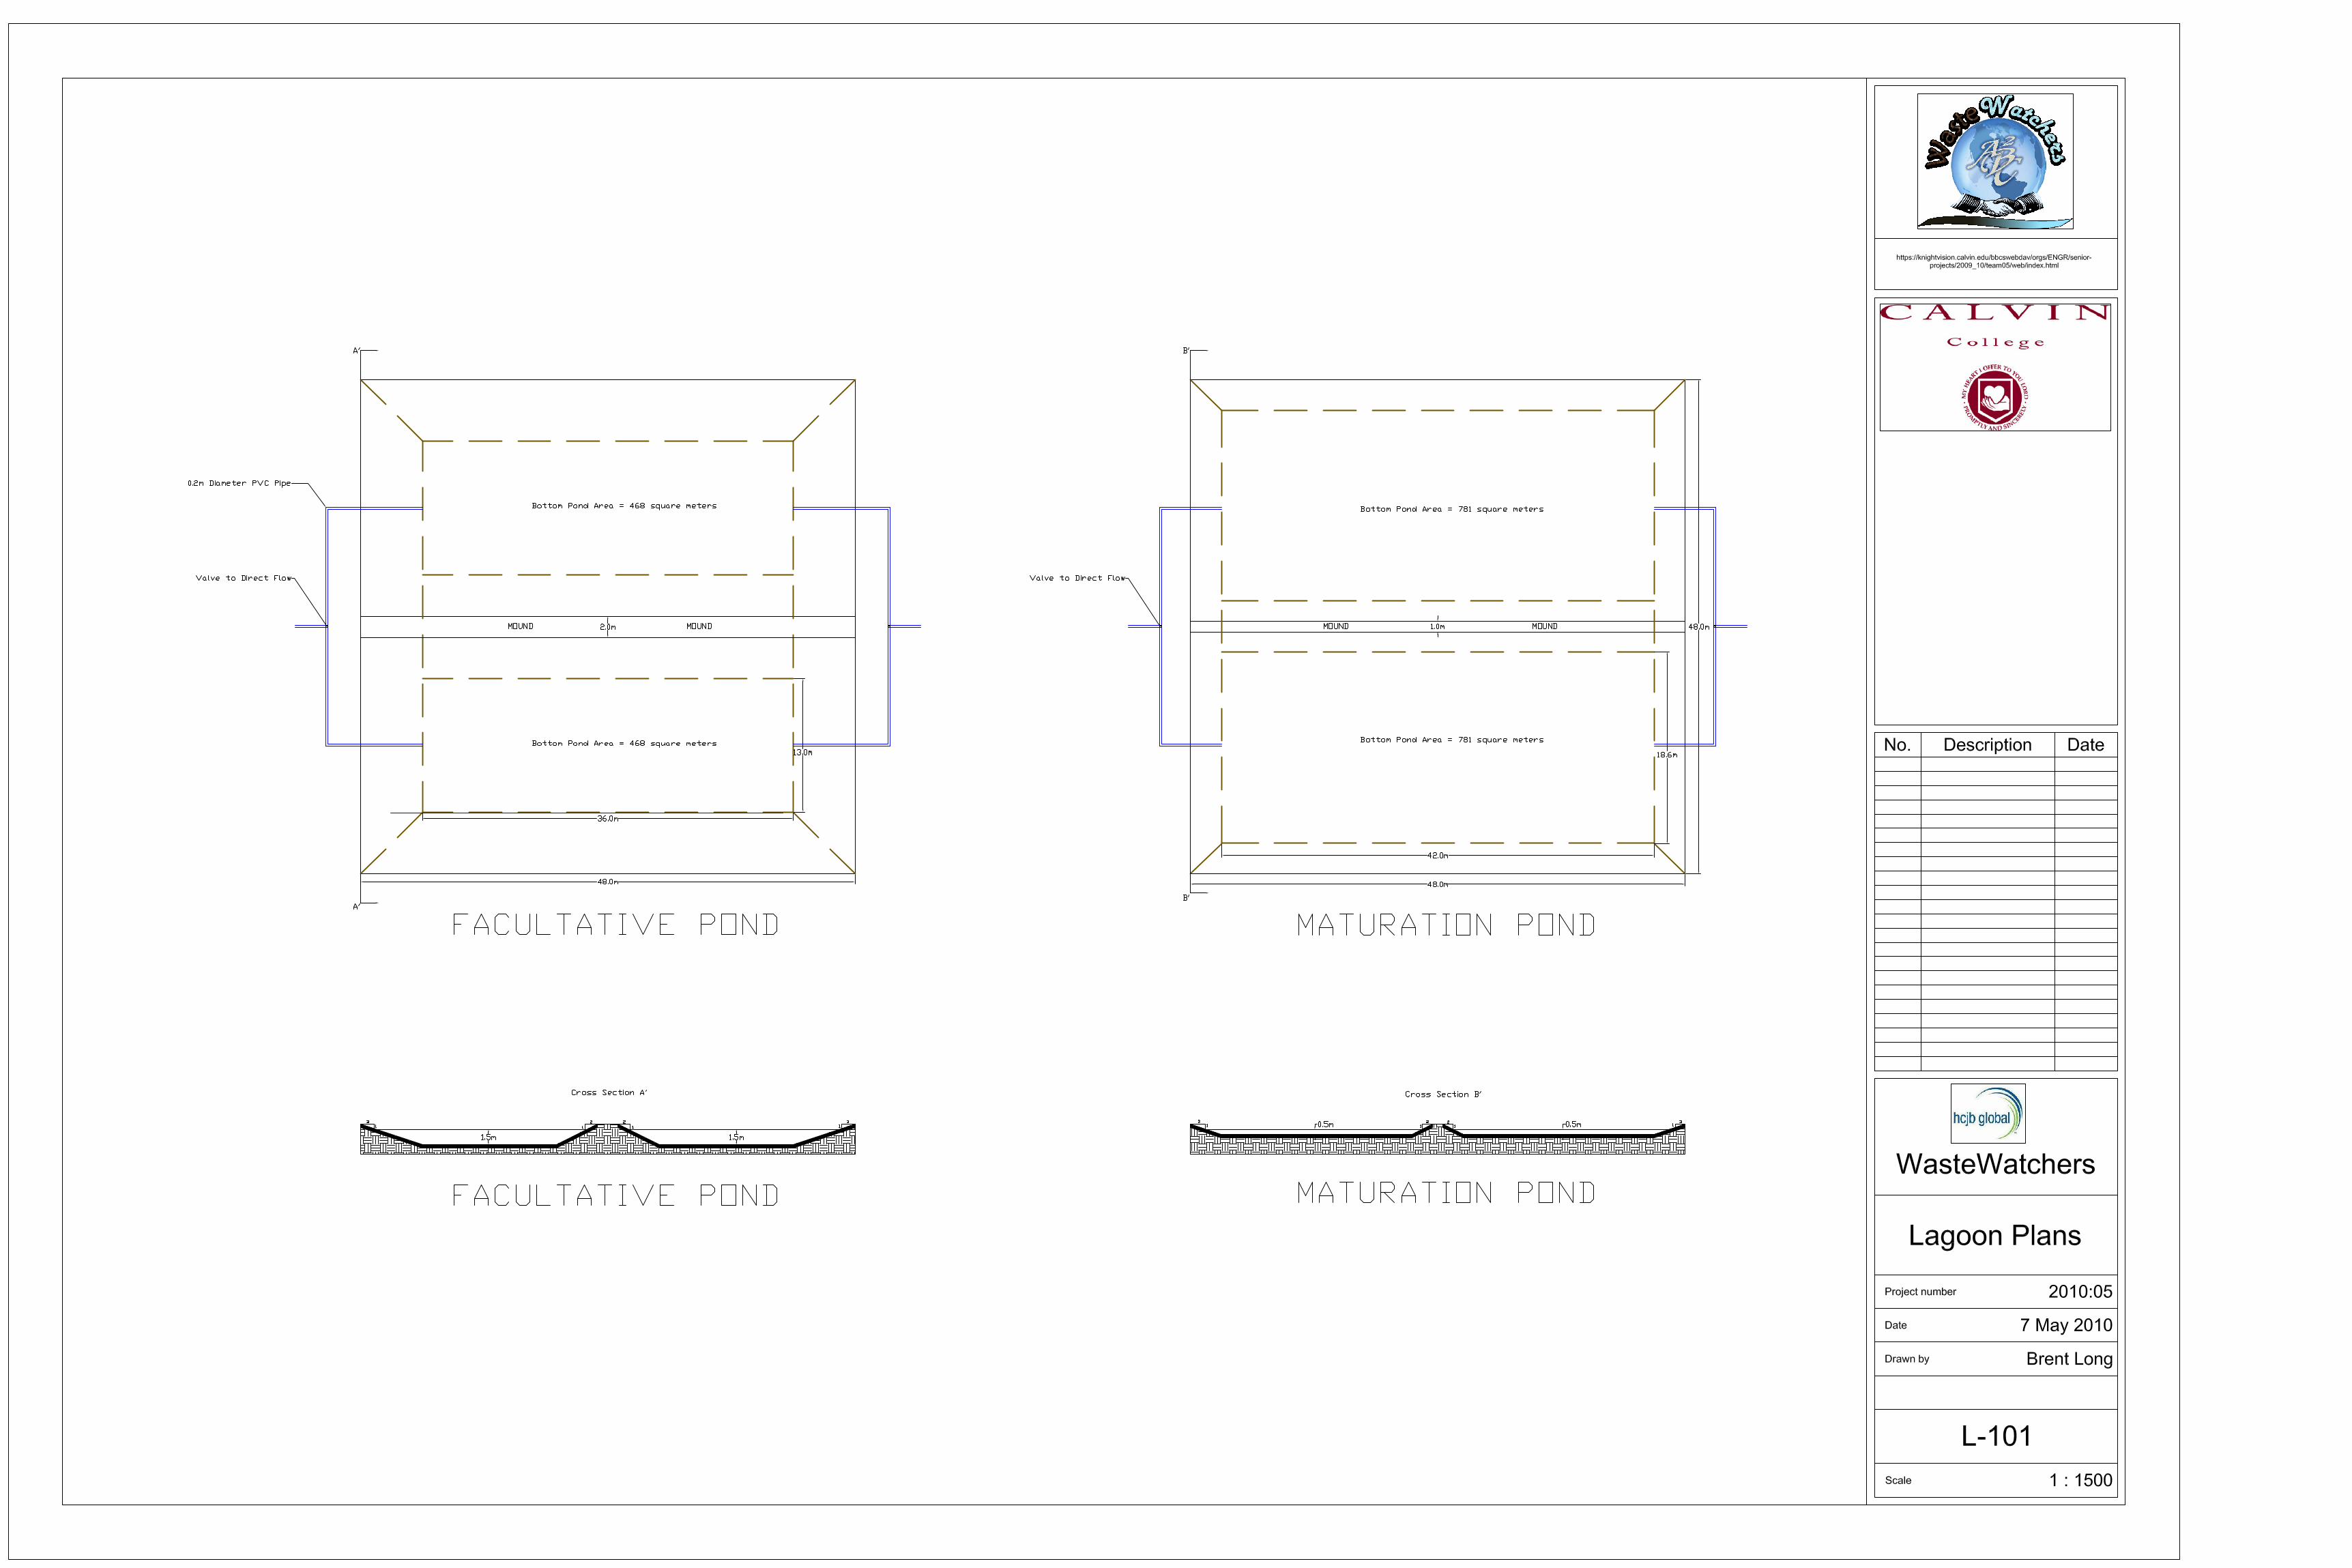
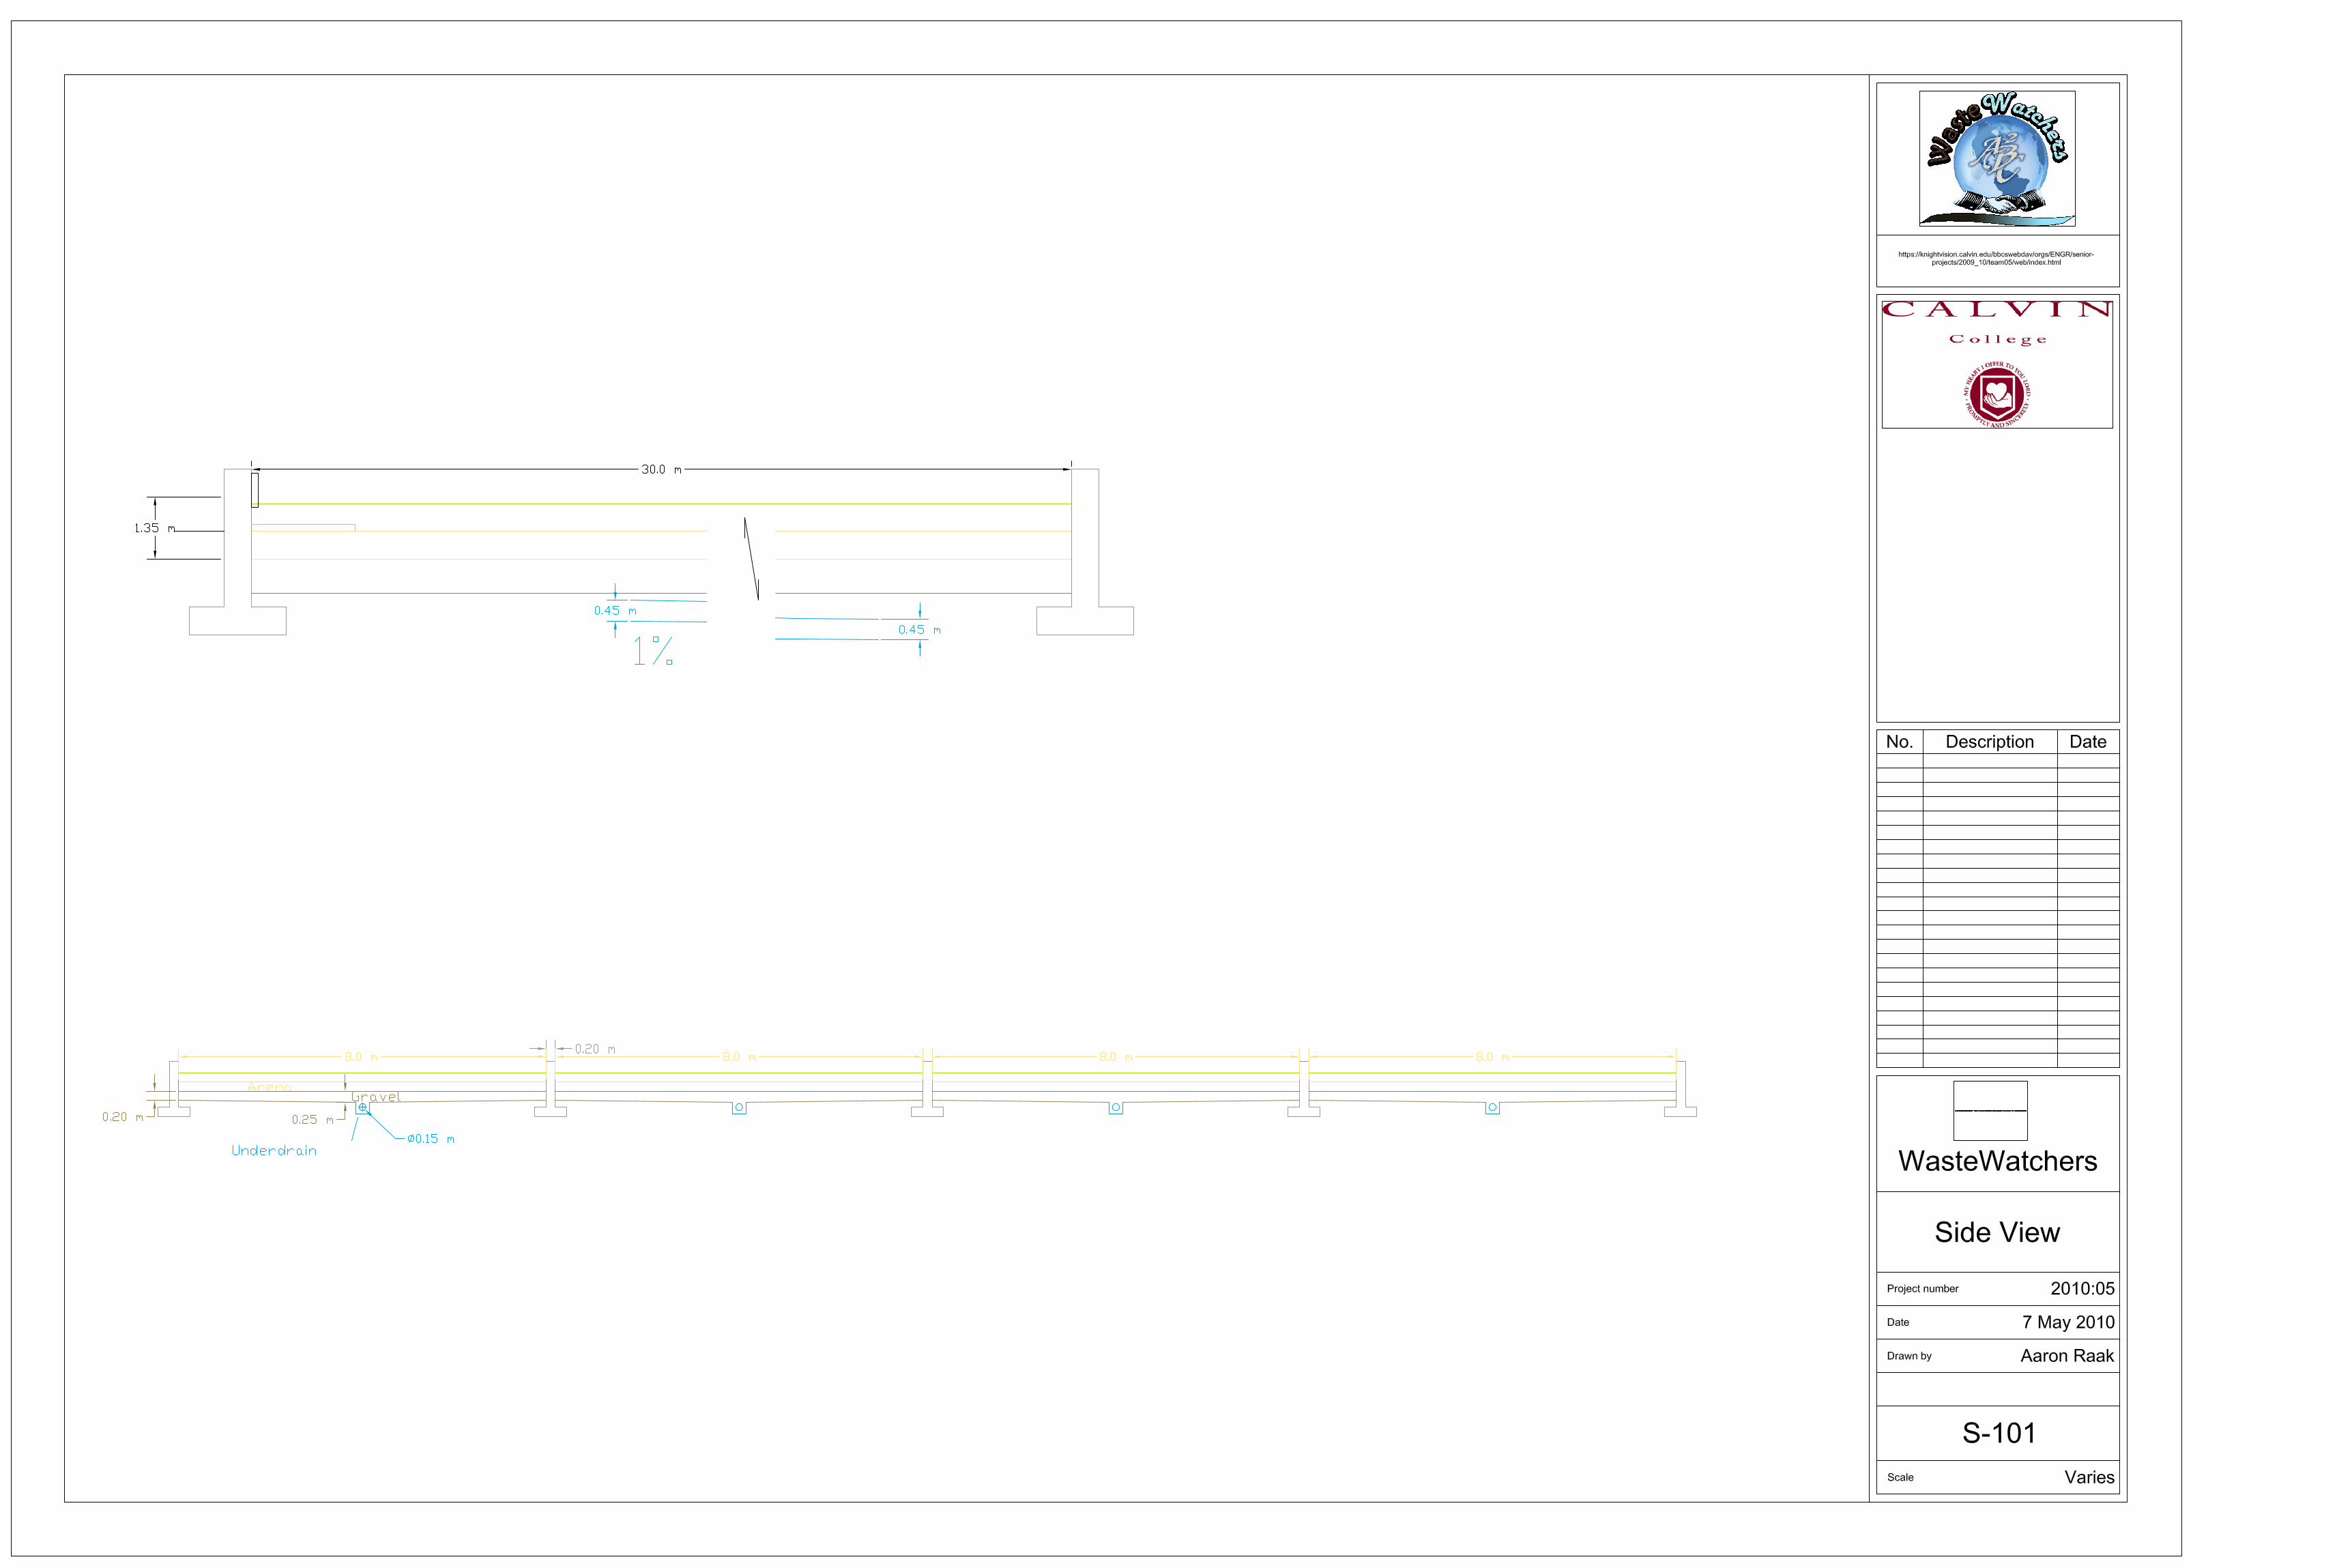
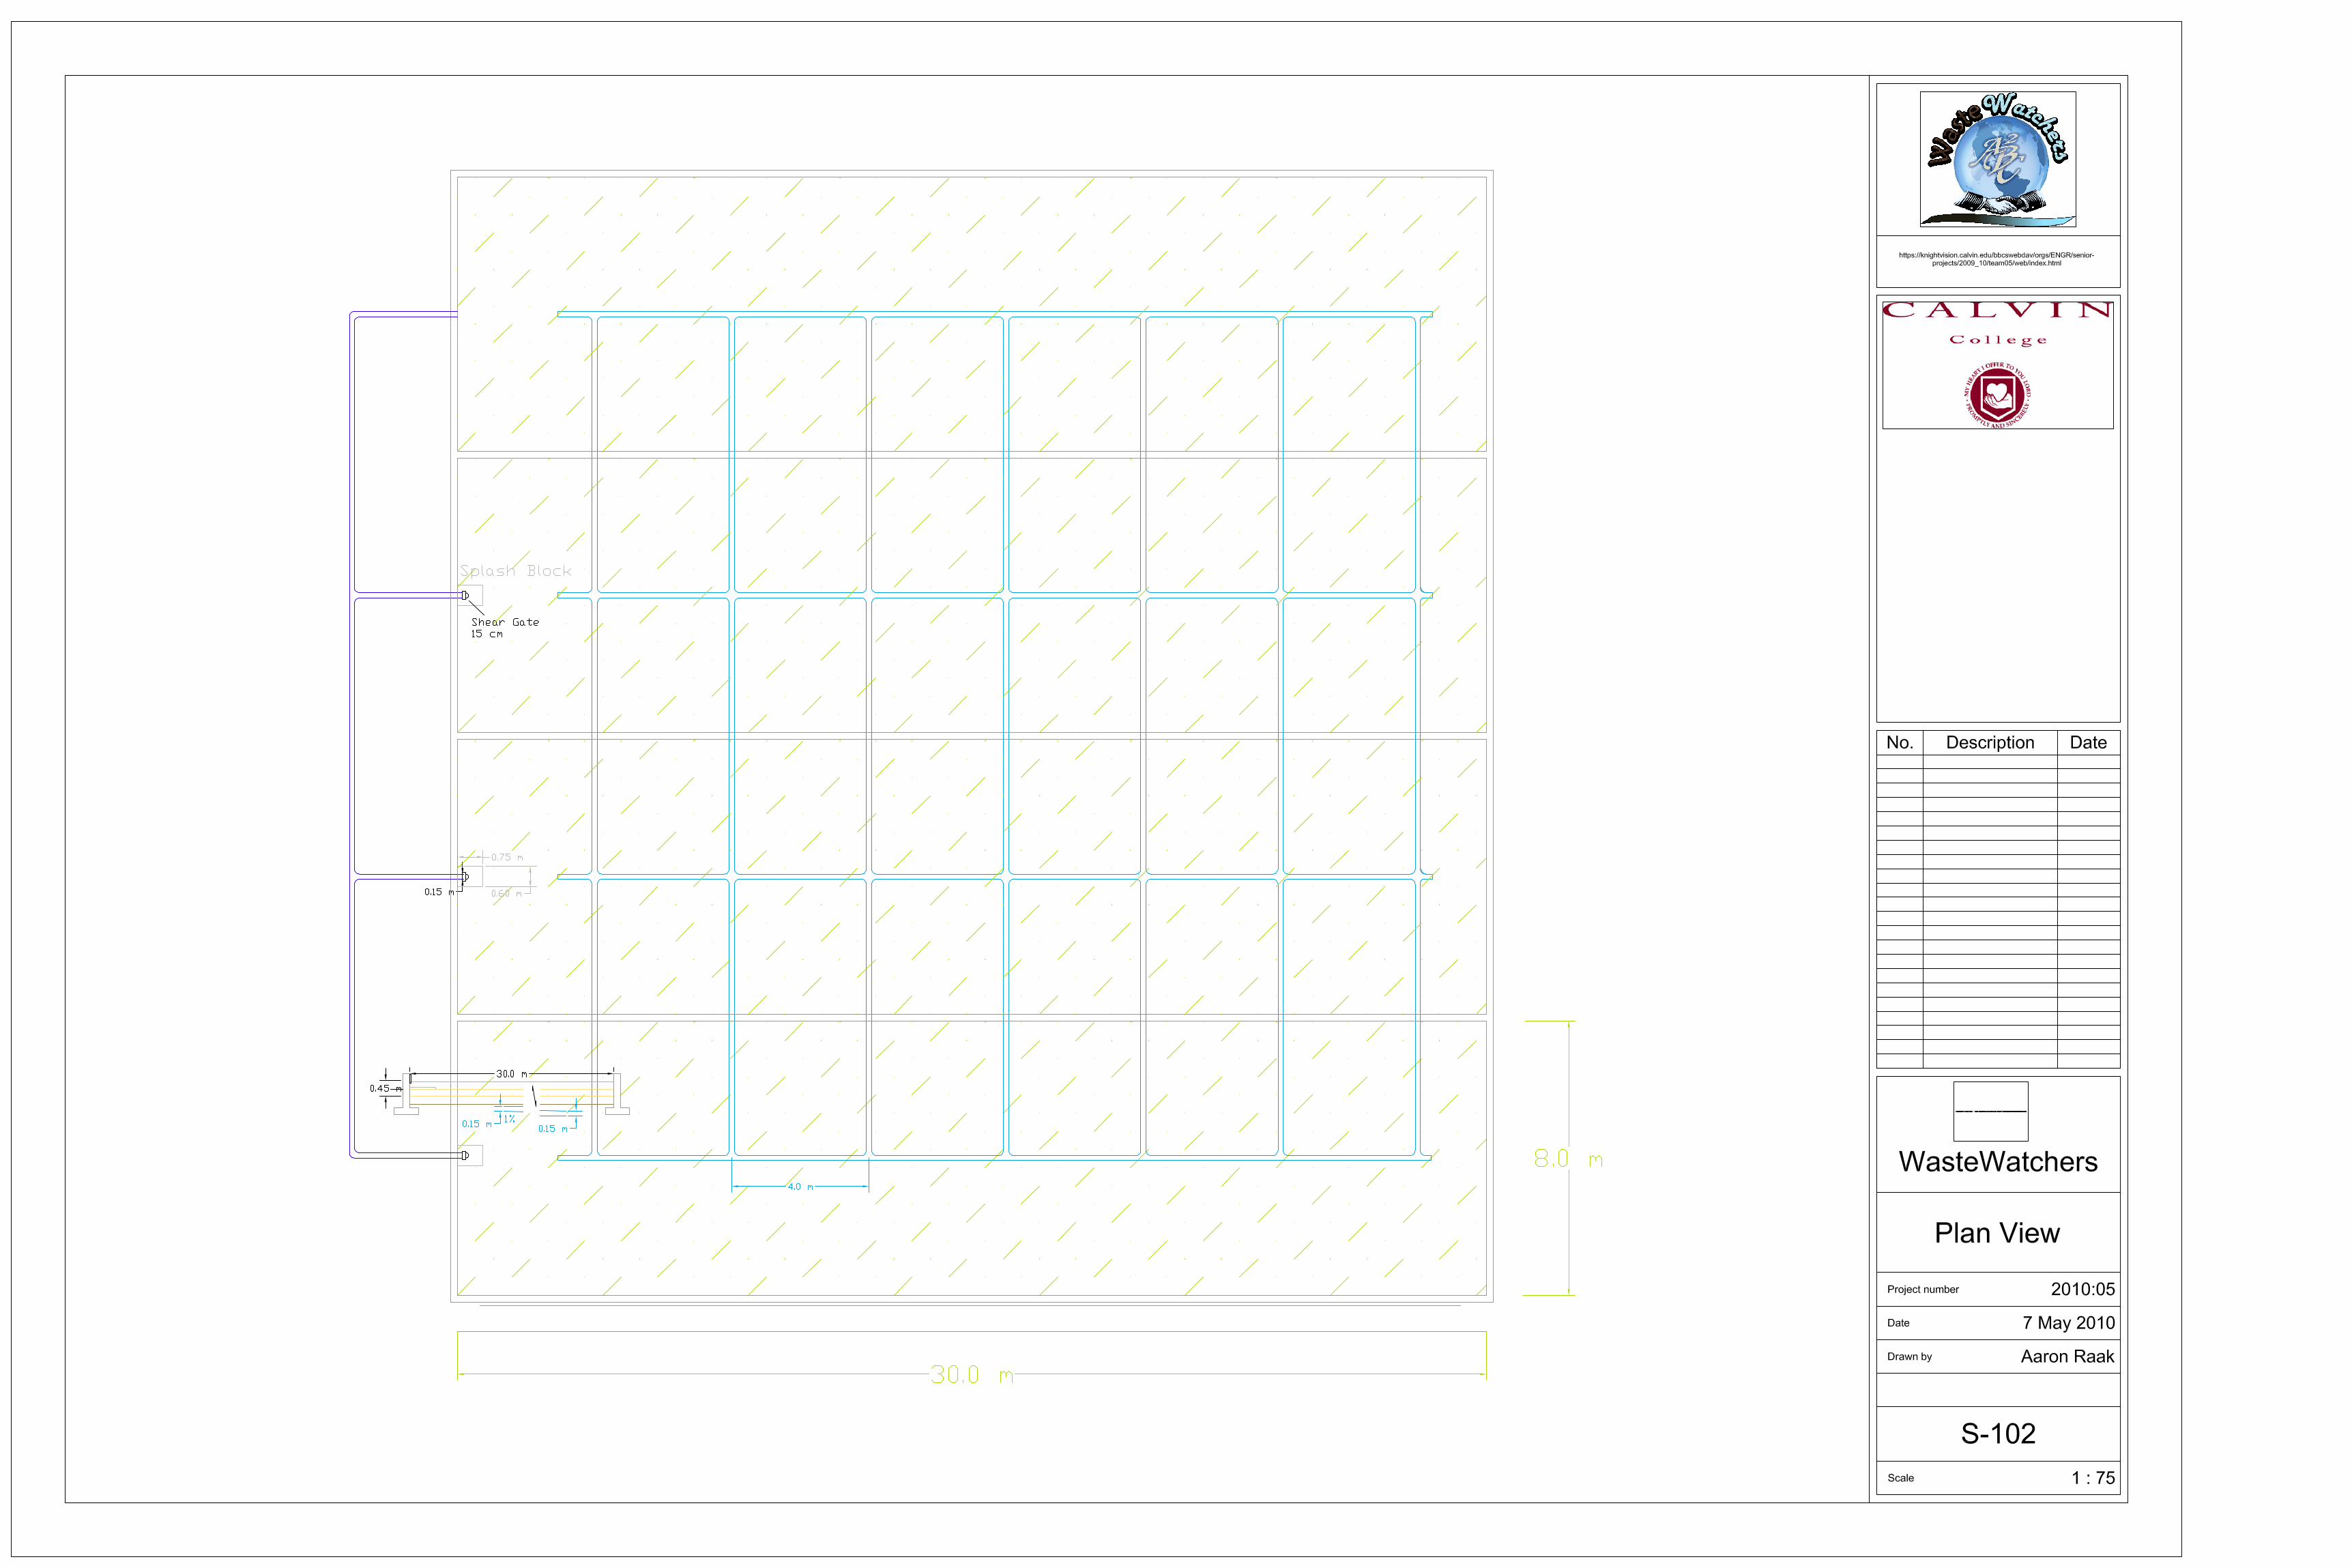
Related Documents