DESIGN, OPTIMIZATION AND ECONOMIC ANALYSIS OF PHOTOVOLTAIC WATER PUMPING TECHNOLOGIES, CASE RWANDA PIE BASALIKE School of Business, Society and Engineering Course: Degree Project Course code: ERA 401 Subject: Energy Engineering HE credits: 30 credits Programme: M.Sc. programme in Energy Systems Supervisor: Pietro Elia Campana Examiner: Jinyue Yan Date: 2015-06-25 Email: [email protected]

Welcome message from author
This document is posted to help you gain knowledge. Please leave a comment to let me know what you think about it! Share it to your friends and learn new things together.
Transcript

DESIGN, OPTIMIZATION AND ECONOMIC ANALYSIS OF PHOTOVOLTAIC WATER PUMPING TECHNOLOGIES, CASE RWANDA
PIE BASALIKE
School of Business, Society and Engineering Course: Degree Project Course code: ERA 401 Subject: Energy Engineering HE credits: 30 credits Programme: M.Sc. programme in Energy Systems
Supervisor: Pietro Elia Campana Examiner: Jinyue Yan Date: 2015-06-25 Email: [email protected]

i
ABSTRACT
Today agriculture sector has a big contribution to the development of economy for many
countries. Irrigation is a method which supplies amount of water required in proper time to
the cropped land and contributes to the increases of agriculture productivity. Using diesel
pump to deliver water to the place of use causes problems both in terms of profitability and
environmental perspectives. Higher price of diesel increases operation costs of diesel water
pumping system thereby reducing the incomes. In addition the use of diesel pump emits a huge
amount of CO2 emissions which cause global warming. A possible solution to those problems
is to use solar energy, a source of energy which is environmental friend and available for free.
The main target of this thesis is to design and optimize a cost effective PVWPs considering
three alternatives with tank storage, battery storage and a system without storages medium.
The two areas in Eastern province of Rwanda were taken as case study to grow coffee and
cassava with five hectares each.
To run simulations, different tools have been used. Those includes CROPWAT to determine
water requirements for two crops; MS Excel to design a PVWPs directly connected to irrigation
system, make economic analysis, evaluate CO2 emissions and calculate other parameters.
Furthermore in PVsyst software the design and simulation for PVWPs with storages medium
has been carried out.
Results showed that using PVWPs directly connected to irrigation system is the most profitable
way when compared to the rest two alternatives. They also showed that systems designed to
irrigate coffee becomes the most profitable due to huge amount of electricity surplus and
higher price per kilogram of coffee. Finally fully replacement of DWPs results in annual
reduction of CO2 emissions by 6.6 tonnes.
Keywords: Photovoltaic system, storages medium, pumping system, economic analysis,
reduction in CO2 emissions.

ii
SUMMARY
This master thesis entitled “Design, optimization and economic analysis of photovoltaic water
pumping technologies” was done in a School of Business, Society and Engineering at
Mälardalen University to successfully complete the Master program of Sustainable Energy
Systems. The thesis work was focused on how to improve Rwanda irrigation system through
use of alternative source of solar energy to pump water from underground to two fields with
five hectares each and which are used to grow coffee and cassava. The areas selected were
Gashora and Ngugu located in eastern province of the country. Due to a landlocked of the
country, the price of diesel fuel mainly used in pumps becomes higher thereby making the
agriculture sector not to be as much profitable as expected. Moreover CO2 released from diesel
fuel cause problems on environment and on life of people in general.
To achieve higher agriculture profitability in a sustainable manner, solar energy has been
considered to replace diesel fuel. This was carried out by designing a complete PVWPs to
convert available sun energy into power requirement of the pump. Both technical and
economic aspects were taken into account in order to be able to choose the best configuration
among three PVWPs: with tank storage, with battery storage and PVWPs directly connected to
irrigation system without storage medium. Before designing a PVWPs the input parameters
such as water requirements, solar irradiation and total dynamic head were determined using
CROPWAT, PVsyst and Rwanda groundwater level respectively. The nearest station of
Kampala (Uganda) were taken into account due to the lack of meteorological data for Rwanda
in the PVsyst database. To ensure that energy and water are always available, PVWPs was
designed on worst case month, the month where the ratio between water requirements and
solar irradiations is the highest. The best Loss of Load (LOL) was obtained considering the
intersection of PV powers and pump powers for the worst case and best case. It has to be
reminded that the worst case is when groundwater level is at its maximum depth of 380m
whereas the best case considered is 1m depth. In PVsyst, the design and simulation of PVWPs
equipped with tank and battery storages medium was done while the design of PVWPs directly
connected to irrigation system was performed using MS Excel tool. Furthermore, all PVWPs,
in addition to DWPs, were compared in terms of economic perspective using MS Excel and the
mostly utilized technics were: Life Cycle Costs (LCCs), Net Present Values (NPVs) and Payback
Periods (PBPs). MS Excel was also used to determine the characteristics of the most efficient
method for drip irrigation system and also used to assess the CO2 emission reduction when
DWPs is utilized to replace PVWPs technologies.
The results of this thesis showed that energy produced and exceeded depend on size of PVWPs
and storage medium used. To this, higher energy was obtained for irrigation of coffee and when
battery storage is incorporated in the system. Even though the PVWPs directly connected to
irrigation system have to operate only when sun is available, it was selected to be the best
configuration due to its low initial investment costs, higher NPVs and short PBP.

iii
The CO2 emissions for coffee irrigation becomes higher than CO2 emitted when irrigation of
cassava is made due to huge amount of diesel fuel to meet water requirements of coffee and in
total 6.6tonnes are saved every year when both cropped lands are irrigated using PVWPs.
iv
TABLE OF CONTENTS
1 INTRODUCTION .............................................................................................................1
1.1 Overview and thesis outlines ................................................................................. 1
1.2 Background ............................................................................................................. 2
1.3 Problem statement .................................................................................................. 3
1.4 Limitations ............................................................................................................... 4
1.5 Scope ....................................................................................................................... 4
1.6 Purpose .................................................................................................................... 5
1.7 Objectives of thesis ................................................................................................. 5
2 LITERATURE STUDY .....................................................................................................6
2.1 Agricultural sector for Rwanda .............................................................................. 6
2.2 Rwanda irrigation system ....................................................................................... 7
2.3 Use of solar photovoltaic energy in the agriculture sector .................................. 9
3 METHODOLOGY .......................................................................................................... 11
4 DESCRIPTION AND DESIGN ....................................................................................... 12
4.1 Photovoltaic water pumping system (PVWPs) .....................................................12
4.1.1 Design and implementation .............................................................................13
4.1.1.1 Design and simulation of PVWPs with tank storage .................................. 13 4.1.1.2 Design and simulation of PVWPs with battery storage .............................. 14
4.1.2 Design of PVWPs directly connected to irrigation system ...............................14
4.2 Drip irrigation system.............................................................................................15
4.2.1 Design and implementation .............................................................................16
4.3 Environmental perspective ....................................................................................17
5 ECONOMIC EVALUATION ........................................................................................... 18
5.1 Economic assessment for PVWPs ........................................................................19
5.1.1 Costs of PV system .........................................................................................19
5.1.2 Costs of pump-motor unit ................................................................................19
5.1.3 Costs of storages ............................................................................................20
5.2 Economic assessment for DWPs ..........................................................................20
v
6 RESULTS AND DISCUSSIONS .................................................................................... 22
6.1 Meteorological data ................................................................................................22
6.2 Crop water requirements .......................................................................................23
6.3 Irrigation system design ........................................................................................23
6.4 Selected Loss of Load (LOL) .................................................................................24
6.5 Evaluation of systems energy production and systems energy for PVWPs
equipped with tank and battery storages .............................................................26
6.6 Analysis of energy production for PVWPs directly connected to irrigation
system .....................................................................................................................28
6.7 System profitability ................................................................................................33
6.8 Assessment of systems CO2 emissions ...............................................................38
7 CONCLUSIONS ............................................................................................................ 39
8 SUGGESTIONS FOR FURTHER WORK ...................................................................... 40
APPENDIX ........................................................................................................................... 45
Appendix 1. Rwanda groundwater level .......................................................................45

vi
LIST OF FIGURES
Figure 1. Rwanda map [15]. ........................................................................................................ 3
Figure 2. Layout of sprinkler irrigation system [20]. ................................................................ 7
Figure 3. Layout of drip irrigation system [23]. ......................................................................... 8
Figure 4. Meteorological characteristics of the region under study. ....................................... 22
Figure 5. Water requirements for coffee and cassava. ............................................................. 23
Figure 6. Required LOL to design PV water pumping system for coffee irrigation. ............... 25
Figure 7. Required LOL to design PV water pumping system for cassava irrigation. ............. 25
Figure 8. Solar irradiations for a PVWP system equipped with tank and battery storages to
satisfy water need for coffee plantation when a solar panel is mounted on fixed tilt
angle and tracking array, respectively. ...................................................................... 27
Figure 9. Unused energy of tank and battery for PV water pumping system designed to meet
electricity requirements for coffee plantation when solar panel is mounted on both
fixed tilted angle and tracking system array. ............................................................. 27
Figure 10. Unused energy of tank and battery for PV water pumping system designed to meet
requirements of cassava plantation when solar panel is mounted on both tilted angle
and tracking system. .................................................................................................. 28
Figure 11. Design month for coffee irrigation. ......................................................................... 30
Figure 12. Design month for cassava. ...................................................................................... 30
Figure 13. Power peak requirement for PVWPs directly connected to irrigation of coffee land
obtained by varying different parameters by 10 % from -30% to 30%. ...................... 31
Figure 14. Power peak requirement for a PVWPs directly connected to irrigation of cassava
land obtained by varying different parameters by 10% from -30% to 30%. .............. 31
Figure 15. Monthly electricity surplus obtained during irrigation of coffee land and cassava
land using PVWPs with tank, battery storages and PVWPs directly connected to
irrigation system. ....................................................................................................... 33
Figure 16. Comparison of NPVs for PVWPs with battery and tank, PVWPs directly connected
to irrigation and DWPs to meet water requirements of coffee and cassava. ............. 34
Figure 17. NPVs for PVWPs with storages medium, DWPs and PVWPs directly connected to
irrigation system when the actual production of both coffee and cassava is increased
by 20%. ....................................................................................................................... 35
Figure 18. NPVs for PVWPs with storages medium, DWPs and PVWPs directly connected to
irrigation system when the actual production of both coffee and cassava is increased
by 40%. ....................................................................................................................... 35
Figure 19. Comparison of LCCs for all the systems. ................................................................. 36
Figure 20. Impact of LCCs and NPVs on Payback period for different systems when actually
productivity is increased by 40%. .............................................................................. 37
Figure 21. CO2 emissions when DWP is used to irrigate both coffee and cassava. ................. 38

vii
LIST OF TABLES
Table 1. Agriculture seasons and crops grown ........................................................................... 6
Table 2. Characteristics of drip irrigation system. ................................................................... 24
Table 3. Summary of power produced by PV modules and power need by pump for PVWPs
equipped with tank and battery to irrigate both cassava and coffee. ........................ 26
Table 4. Reference case for coffee. ........................................................................................... 29
Table 5. Reference case for cassava. ......................................................................................... 29
Table 6. Total annual electricity surplus for PVWPs technologies. ......................................... 32
LIIST OF EQUATIONS
Equation 1.................................................................................................................................. 13
Equation 2 .................................................................................................................................14
Equation 3 .................................................................................................................................14
Equation 4 .................................................................................................................................14
Equation 5 ................................................................................................................................. 15
Equation 6 .................................................................................................................................16
Equation 7 .................................................................................................................................16
Equation 8 .................................................................................................................................16
Equation 9 .................................................................................................................................16
Equation 10 ...............................................................................................................................16
Equation 11 ................................................................................................................................ 17
Equation 12 ............................................................................................................................... 17
Equation 13................................................................................................................................ 17
Equation 14 .............................................................................................................................. 18
Equation 15 ............................................................................................................................... 18
Equation 16 .............................................................................................................................. 18
Equation 17 ............................................................................................................................... 20
Equation 18 ...............................................................................................................................21
Equation 19 ...............................................................................................................................21
Equation 20 ...............................................................................................................................21

viii
ABBREVIATIONS AND TERMS
PV Photovoltaic
CSP Concentrating Solar Power
LOL Loss of Load
GDP Gross Domestic Product
DC Direct Current
AC Alternative Current
BOS Balance of System
NPV Net Present Value ($)
PBP Payback Period (Year)
SRE Standard reference environment
kWh Kilowatt-hour
€ Euro
$ United State Dollar
Wp Watt Peak
kWp Kilowatt Peak
MWp Megawatt Peak
Optimum tilt angle (0)
Latitude angle facing south of location (0)
Hydraulic Power (kWh)
Total Dynamic Head (m)
Q Water flowrate (liter/sec)
IWRp Peak water requirement (m3/day ha)
Th Total hour of operation per day (hours)
PVWP Photovoltaic Water Pumping
Pp,pvwp Peak power of Photovoltaic Water Pumping System directly connected to irrigation system (kWp)
DWPs Diesel Water Pumping System
IWRt Total monthly average daily water (m3/ha day)
IWRt,m Water requirement at design month (m3/ha day)
fm Matching factor (0.9)
αC Photovoltaic temperature coefficient (0.45%/C)
T0 Reference temperature (250C)
Esm Monthly average daily irradiation hitting the array (kWh/m2 day)
Tcell Cell temperature (0C)
Pump efficiency
Ambient air temperature (200C)
G Global irradiation (1000W/m2)
ix
NOCT Nominal Operating Cell Temperature (0C)
Total number of emitters
Spacing between two emitter (m)
Number of lateral pipes
Length of lateral pipes (m)
Width of cropped land (m)
Number of sub-mains
Length of land (m)
Spacing between laterals pipes (m)
Total number of laterals pipes
Sub-main flowrate (liter/sec)
Lateral flowrate (liter/sec)
Friction head loss (m)
Total head pump (m)
Length of pipe (m)
Inside pipe diameter (mm)
Friction coefficient of the pipe
Constant equals to 1.21E10
Polyethylene
Pn Power pump considering friction losses (kW)
Life cycle costs ($)
Initial investment costs ($)
Present Worth costs for replacement ($)
Present Worth for operating and maintenance costs ($)
Present Worth of annual costs ($)
Cash flow registered from year 1 to year N ($)
Discount rate (%)
Annual income ($)
Percentage of annual operation and expenses (%)
Hydraulic energy (kWh)
Power rating for diesel engine (Kw)
Capital cost per installed kW ($/kW)
Total costs of pumping system ($)
Total number of annual running hours (hours)
Specific cost of fuel consumption ($/liter)
Specific fuel consumption (liters/$)
Annual fuel consumption (liters)
Total annual hydraulic energy (kWh)
x
ACKNOWLEDGEMENTS
This section is to give value and demonstrate my gratitude to all people who helped me,
motivated me and supported me in the best way during my studies at Mälardalen University
(MDH).
First, I want to thank the government of Rwanda through the Ministry of education for giving
this opportunity and providing me all the requirements in terms of financial support. To this
point, I can’t forget the everyday assistance of the Ambassador of the Republic of Rwanda here
in Sweden, Venancia Sebudandi and her coworker Taifae Eduard. I thank them so much.
Secondly I would like to express my sincere appreciation to my supervisor Dr. Pietro Elia
Campana and examiner Prof.Jinyue Yan for review of this thesis in detail and their important
feedback.
I would like also to thank all staff in Master program of Sustainable Energy Systems, especially
Program Coordinator, Elena Tomas Aparcio for her assistance.
Finally, none of this would have been possible without the love and support of my parents and
immediate family, who have always encouraged and believed in me, in all my endeavors.
1
1 INTRODUCTION
1.1 Overview and thesis outlines
In order to solve food security issue for rapid increases of population and make their economy
on higher level, agriculture is one of the sectors which needs to be developed. Water and energy
are the main drivers and form an engine to the development of agriculture. For total water and
energy consumption worldwide, agriculture occupies a big portion where about 70% of
freshwater withdrawals are utilized in that sector while energy used accounts 30% of energy
consumption [1]. However those figures will keep increasing with expected population growth
[2]. Water is provided to crops through irrigation to increase crops productivity up to 5 times
more than the crops harvested without application of irrigation [3]. In regions where available
rainfall is not able to meet the water requirements of irrigation or the water resource is mainly
underground water, pumps are needed to take water to the point of use [4]. The profitability
of two water pumping technologies using different sources of power to pump water to the
irrigation place can be evaluated both in terms of CO2 emissions saved and money saved. Two
systems such as DWPs and PVWPs can typically fulfil the irrigation water needs in off-grid
areas. However in long term, DWPs becomes less profitable due to higher operating and
maintenance costs [5]. In addition solar energy is environmental friend and a source which can
be found all over the world for free [6].
In term of environmental perspective, agriculture is among the sectors mostly causing global
warming due to the use of fossil fuels to power machines. Worldwide, the total energy
consumed by agriculture sector is estimated to 7.7*106 GWh per year. Only 29.6% of renewable
energy such wind, photovoltaic, hydroelectricity and biomass contribute to the total energy use
[7]. Solar when it is exploited at optimum level can replace fossil fuels and even produce more
energy than the actual energy needed in agriculture. Furthermore the production of solar
energy requires small land compared to the land of cultivation. [7].
In exception to the African countries located closer to equator which have low potential in solar
irradiation due to their climate, the rests have a huge potential in solar energy of about 4 to 6
kWh/m2/day [8, 9]. The cost of solar photovoltaic (PV) technology to convert solar energy into
usable power is declining day to day due to rapid improvement of technology and dramatic
reduction in price of PV modules products from China. The PV technology could produce
energy need for Africans and even exceeds demand by 2050 [6]. Those two factors, higher
insolation, and rapid reduction in price of solar PV technology play a key role in studying the
feasibility of harnessing solar energy in agriculture of Rwanda.
This master thesis seeks to determine the best PVWPs among three configurations. Those
include PVWPs with battery storage, PVWPs with water storage and PVWPs directly connected
2
to irrigation system. The design of irrigation system required and economic analysis are also
included. The work is briefly summarized in the following 8 chapters:
Chapter 1 provides a general overview of agriculture sector, water and energy consumption. It
also describes the background information of the country under investigation, sets the
objectives, formulation of problem statement, and gives limitations, scope of the study and
purpose.
In order to know the current state of art and knowledge gaps, the literatures study about
agriculture of Rwanda, irrigation system applied by the country and use of solar energy in
agriculture sector are presented in Chapter 2.
The main target of Chapter 3 is to describe and give detailed methods used to design three
different alternatives of PVWPs, their economic evaluations and provides some explanations
why the regions and irrigation system were selected.
In Chapter 4, the detailed description, design and implementation of all three PVWPs and
irrigation system to fulfill water needs are provided. The considerations for assessing CO2
emissions are also illustrated in this chapter.
Chapter 5 describes assumptions made to carry out economic analysis of three PVWPs
technologies, DWPs and drip irrigation system.
In Chapter 6, the technical and economic results are presented and discussed.
The conclusion of the thesis has been taken by summing up all the findings and summarize
them in Chapter 7.
Finally, further works is clarified in Chapter 8.
1.2 Background
Rwanda is a country located in central Africa and whose geographical coordinates are between
1004’ and 2051’ latitude South and between 28045’ and 31015’ longitude East [11], as it is shown
in Figure 1. The country has higher density of population where for a total area of 26338 km2,
376 residents live on only one km2 [12]. Agriculture sector has a significant impact on Rwanda’s
economy whereby 90% of the total population is practicing agriculture. Poor performance of
agriculture sector affects economic development in different angles as 91% of food
consumption, 36% GDP and 70% of the revenue are from national agriculture [13]. Rwanda
has three agricultural seasons namely, “A” which starts in September and ends in February of
the following calendar year, “B” which starts in March and ends in July of the same calendar
year, and last season “C” which starts in August and ends with September of the same calendar
year [3]. The annual average temperature is ranging between 160C and 200C with an annual
average rainfall of about 1,250 mm [14]. Due to its climate, Rwanda is known to have abundant
water resources however those resources are not shared in the same way for the entire country.
Water availability helps the farmers to irrigate their fields and hence obtaining higher crop

3
yields. The main water resources used for Rwanda irrigation system are runoff for small
reservoirs, runoff for dams, direct river and flood water, lake water resources, groundwater
resources and marshlands [12]. In order to take water from sources to the point of irrigation,
manual (human) power has a significant share, while centrifugal pumps are typically powered
by diesel fuels and in some case electricity. The researchers are being conducted to design a
small PVWPs to solve problem of potable water for people living in villages and also to provide
water for irrigation on small pieces of lands.
Figure 1. Rwanda map [15].
1.3 Problem statement
Currently, electricity shortage in Rwanda is a major barrier to the national development. The
agriculture is the most affected sector due to the fact that almost all Rwandan people depend
on it and irrigation system becomes expensive as result of lack of power powered pumps. The
country increases its energy need through imports of petroleum products from outside the
country. However due to a landlocked of the country, the price of diesel fuel mainly used in
pumps becomes higher. The use of diesel not only looked in term of cost but also in term of

4
environmental perspective whereby the CO2 emissions released have negative impact on
environment and life of people in general. Furthermore, selecting the best option among three
available configurations of PVWPs technologies, with tank storage, with battery storage and
PVWPs directly connected to irrigation is an issue which needs to be addressed.
1.4 Limitations
Most of Rwandan irrigable areas use surface irrigation to water their crops and this mode of
irrigation do not require pumps to take water from source to the field. However in some regions
method of gravity is practically impossible. Therefore water pumping mode is required to
deliver water where it is needed. In order to see the impact that the PVWPs could have on
Rwandan irrigation system, this master thesis focuses on the following regions: Gashora and
Ngugu, near Lake Rwampanga in Kirehe district. The two sites considered as case study have
five hectares each and are used to grow cassava and coffee. For the design and simulation of
PVWPs technologies, the nearest station of Kampala in Uganda have been used due to the lack
of meteorological data for Rwanda in the PVsyst database.
1.5 Scope
The research is intending to answer with clear facts to the following five questions:
Is solar energy suitable to replace diesel as main source of power powered pump in
Rwanda?
If solar energy is available enough, in which optimum way can this be converted into
usable power for pump?
Is the entire system, PVWPs economical viable?
What is the most efficient irrigation system to supply water to cropped land?
What are the environmental contributions associated with use PVWPs in place of
DWPs?

5
1.6 Purpose
The purpose of this Master thesis is to present the benefits of replacing DWPs by PVWPs in
irrigation system of Rwanda. The benefits are demonstrated both in terms of economic and
environmental perspectives to show how much earning and how much reduction in CO2
emissions is achievable when PVWP technologies are used to replace DWP technology. Due to
the fact that PVWPs could be used with different configurations, the purpose is also to select
the best configuration among three configurations available.
1.7 Objectives of thesis
The main objective of this thesis is to design and optimize a cost effective of PVWPs
technologies taking into account three different scenarios for:
PVWPs with storage tank
PVWPs with battery storage
PVWPs directly connected to irrigation
Those three different configurations have been compared both under a technical and
economic viewpoint. Moreover, the comparison between PVWPs technologies and DWPs for
irrigation has been conducted in this work.

6
2 LITERATURE STUDY
2.1 Agricultural sector for Rwanda
Reducing global poverty level thereby combating the problem of hunger is among the
Millennium Development Goals to be achieved by the year 2015. About one third of the world’s
total population gets their income and subsistence from agriculture sector. Rwanda has known
an improvement in its agriculture sector because of measures taken by the government to
increase national food production [16]. The main crops during pre-colonial time were
sorghum, finger millet, taro, peas, cowpeas and bananas. As the big part of country was covered
by grass and trees, method of cultivation applied was to burn the field before plantation. This
method had an advantage of rapid growth of grass pasture for the livestock on one hand but
on other hand it is disadvantageous due to reduction of soil’s fertility and soil’s wetness. During
colonial period, the focus was to fight against a serious famine which took place. The people
were forced to grow crops to face the starvation. Recently, the method which were introduced
by colonials are stopped and people got back to their original way of cultivation. Currently
Rwanda is seeking a way to transform its traditional agriculture sector to modern method in
order to have a sustainable management of natural resources, water and soil conservation.
Among the strategies in which an effort is being made to achieve the target include crop
diversification and intensification and irrigation development [17]. Crops do not consume the
same amount of water during irrigation and some need a huge amount of water requirement
whereas others need to absorb fewer amounts. In addition, availability of water depends on
the season. It is obviously understandable that the quantity of water during rainy season is
higher compared with that of summer. As presented in Table 1, Rwanda has three agriculture
seasons and each season has its specific crops grown in a certain proportion to the available
land.
Table 1. Agriculture seasons and crops grown
Season Crop
Percentage
(%)
Season A: starts in September of one year and
ends February of the following year
Beans 27
Bananas 19,7
Cassava 12,6
Maize 11,9
Season B: starts in Murch and ends in July of
the same year
Bananas 17,9
Beans 17,4
Cassava 15,9
Sorghun 14,6
Season C: starts in August and ends in
September of the same year
Irishpotatoes 71
Beans 14
Vegetables 12
7
2.2 Rwanda irrigation system
Irrigation has the role of taking water from source, conveying it to individual fields within the
farm and distribute it to each field in a controlled manner [18]. Depending on elevation and
water resources available, two methods of irrigation can be used. The case with which water
surface is situated on higher slope, the gravity method is used whilst when source of water is
underground the pumping mode which is also known as pressure method is required to take
water to the point of use. Alternatively, the pumping method is also used for surface water
resource located at low slope [18]. Pressure method in turn can be operated under two different
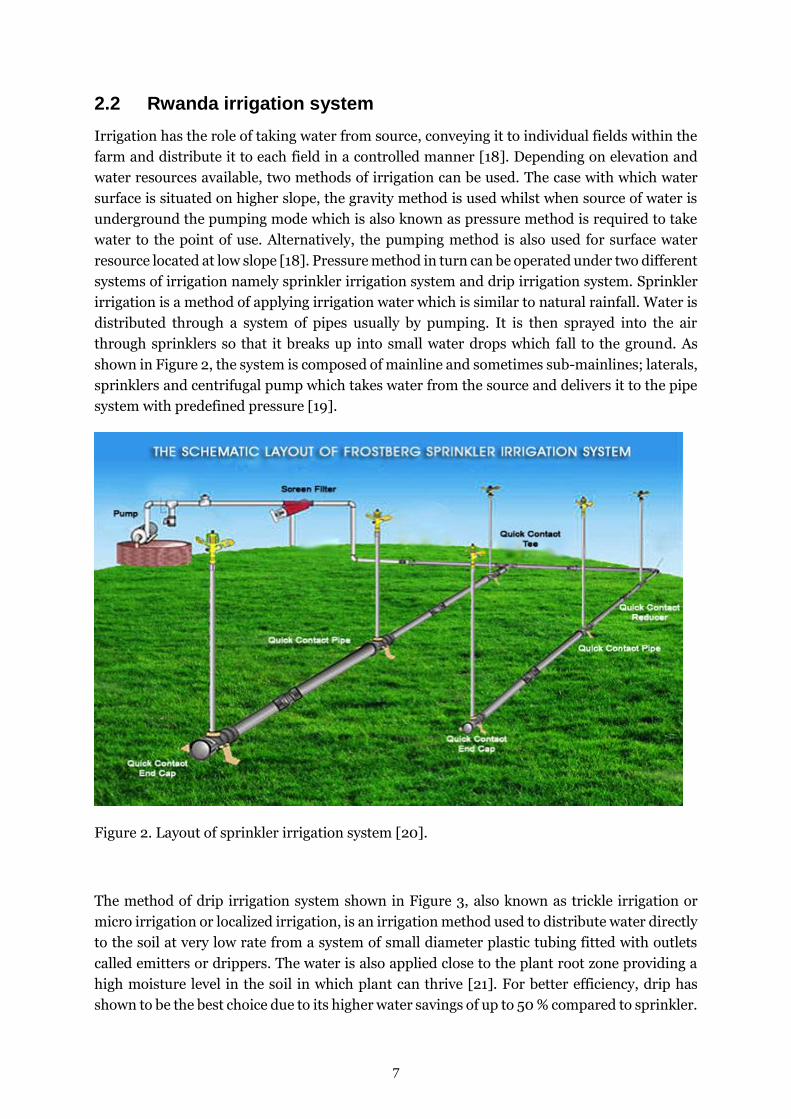
systems of irrigation namely sprinkler irrigation system and drip irrigation system. Sprinkler
irrigation is a method of applying irrigation water which is similar to natural rainfall. Water is
distributed through a system of pipes usually by pumping. It is then sprayed into the air
through sprinklers so that it breaks up into small water drops which fall to the ground. As
shown in Figure 2, the system is composed of mainline and sometimes sub-mainlines; laterals,
sprinklers and centrifugal pump which takes water from the source and delivers it to the pipe
system with predefined pressure [19].
Figure 2. Layout of sprinkler irrigation system [20].
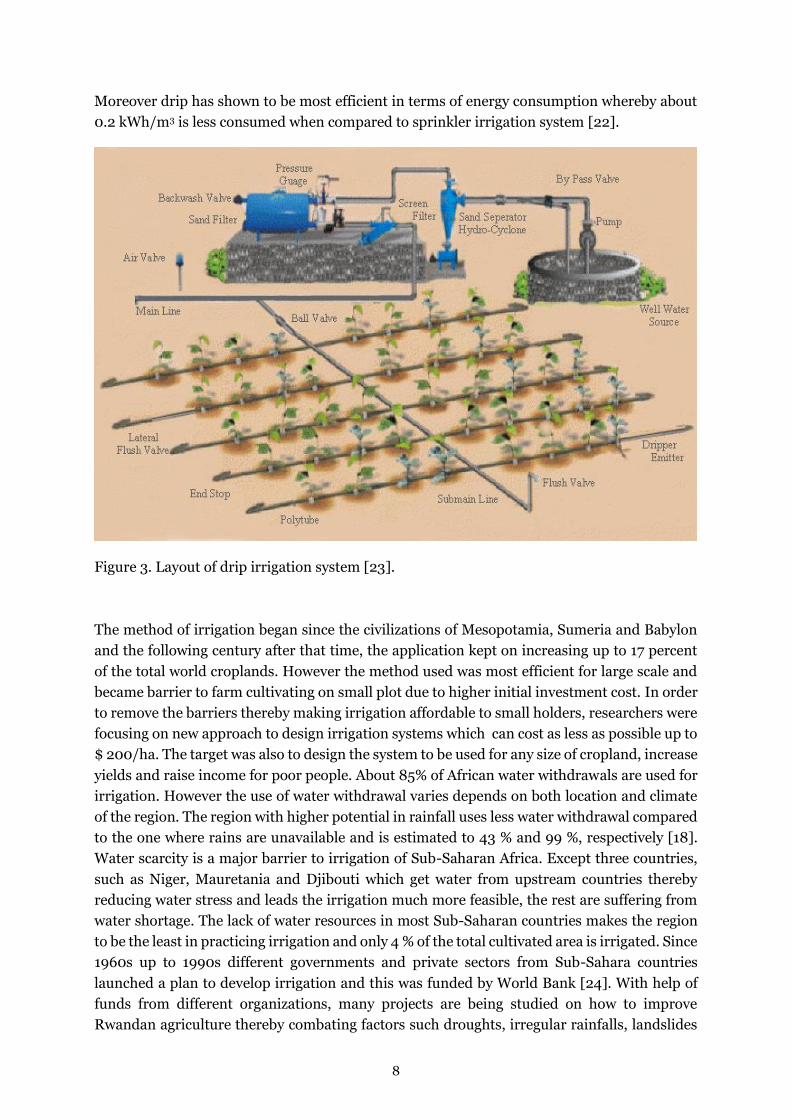
The method of drip irrigation system shown in Figure 3, also known as trickle irrigation or
micro irrigation or localized irrigation, is an irrigation method used to distribute water directly
to the soil at very low rate from a system of small diameter plastic tubing fitted with outlets
called emitters or drippers. The water is also applied close to the plant root zone providing a
high moisture level in the soil in which plant can thrive [21]. For better efficiency, drip has
shown to be the best choice due to its higher water savings of up to 50 % compared to sprinkler.
8
Moreover drip has shown to be most efficient in terms of energy consumption whereby about
0.2 kWh/m3 is less consumed when compared to sprinkler irrigation system [22].
Figure 3. Layout of drip irrigation system [23].
The method of irrigation began since the civilizations of Mesopotamia, Sumeria and Babylon
and the following century after that time, the application kept on increasing up to 17 percent
of the total world croplands. However the method used was most efficient for large scale and
became barrier to farm cultivating on small plot due to higher initial investment cost. In order
to remove the barriers thereby making irrigation affordable to small holders, researchers were
focusing on new approach to design irrigation systems which can cost as less as possible up to
$ 200/ha. The target was also to design the system to be used for any size of cropland, increase
yields and raise income for poor people. About 85% of African water withdrawals are used for
irrigation. However the use of water withdrawal varies depends on both location and climate
of the region. The region with higher potential in rainfall uses less water withdrawal compared
to the one where rains are unavailable and is estimated to 43 % and 99 %, respectively [18].
Water scarcity is a major barrier to irrigation of Sub-Saharan Africa. Except three countries,
such as Niger, Mauretania and Djibouti which get water from upstream countries thereby
reducing water stress and leads the irrigation much more feasible, the rest are suffering from
water shortage. The lack of water resources in most Sub-Saharan countries makes the region
to be the least in practicing irrigation and only 4 % of the total cultivated area is irrigated. Since
1960s up to 1990s different governments and private sectors from Sub-Sahara countries
launched a plan to develop irrigation and this was funded by World Bank [24]. With help of
funds from different organizations, many projects are being studied on how to improve
Rwandan agriculture thereby combating factors such droughts, irregular rainfalls, landslides
9
and climate change which could affect the productivity. The measures taken to handle the
problem are to put much effort on providing irrigation to hillside farms and increasing the
water retention capacity of watersheds [25]. Based on recent literatures, the country’s ambition
was to increase the irrigated areas up to 100000 ha by 2015. Two years before the set time only
one firth of targeted area was achieved with all required infrastructures and water management
facilities [21]. The irrigation is mainly used by large scale farmers who apply different methods
depending on region and water resources available. The availability of resources in turn
determines the kind of water supply system to be used to take water from source to the field of
irrigation. Moreover other considerations such as land contour/slope, soil permeability and
type, plot size and crops, required labor inputs and economic costs/benefit have to be analyzed
before carrying out irrigation. Almost all Rwandan cropped areas are irrigated using surface
water resources by method of gravity to direct water into furrows, basins or borders depending
on surface irrigation design adopted. However some regions of the country showed to have
higher slope and it is practically impossible to apply gravity method of irrigation instead
pressure method is used. Those areas include Gashora and Ngugu near Lake Rwampanga in
Kirehe district [12]. Due to abundant surface water resources of the country, water drainage
occupies the most applied method of irrigation with a proportion of 57.7%. Other method used
but with less proportion of 26.9% is pumps/tube wells irrigation machine [3]. The pumps are
mainly powered by diesel fuel and electricity when available. Diesel fuel consumed by pump
when taking water to the field is evaluated in terms of number of gallons. According to [26],
40 gallons of diesel per year are used in pumps to irrigate the area equivalent to 0.4 hectares.
This could result in 400 of gallons every year if considering that the entire irrigable area of
10hectares is to be irrigated using pumps powered by diesel.
2.3 Use of solar photovoltaic energy in the agriculture sector
In order to get higher yields and profit, energy is a primary input of the agriculture sector. In
agriculture, energy is consumed as results to develop technology and level of production from
a system. Energy is used in both direct ways to power pumps during irrigation and indirectly
to produce equipment, goods and services required on farm. Worldwide 15% of total energy
consumption in crop production is for pumping irrigation water [27]. A big contributor to this
figure comes from the countries such as India and US where the share was estimated up to 43
% and 23% of the total direct energy use respectively [27]. The amount of energy required
varies depends on method of irrigation applied. Flood irrigation method becomes less energy
consumptive when compared to pressure irrigation method and this is due to the fact that
much energy is needed to both lift water at certain height and achieve the level of operating
pressure of the irrigation. However the energy requirement can be minimized by reducing
operating pressure and pumping volumes in method of pressurized micro-irrigation [28].
Currently energy used to pump water for irrigation is mainly from fossil fuels and electric grid.
Those type of fuels have some drawbacks such rising their prices day to day, depletion of
resources in future and hazards that they cause on environment. Many researches have been
conducted about seeking other alternative sources to replace non-renewable energy resources
and one of the best option was solar energy, a source which is environmental friend and require
less maintenance costs during its production [28]. Solar is a source of energy which can be
10
found all over the world but the energy produced differs region by region depending on
meteorological condition and demand for energy service [29]. Rwanda has a huge potential in
solar energy compared to the countries of the same region. The average annual solar radiation
of 5.2Wh/m2/day is obtained whereas that for the neighboring countries, such as Tanzania,
Burundi and Democratic republic of Congo in cloudy season decreases even below
4.5Wh/m2/day. Even though it has higher potential, solar energy has very low contribution to
the national electricity use due to its highest initial costs. The total electricity produced from
solar energy accounts only 1 MWp [30]. The electricity produced from solar is mainly used in
lighting, TV and Radio and operating medical refrigerators [13]. Currently the use of solar
energy in pumping water for irrigation seems to be non-existing as the mostly method utilizes
diesel pump to lift water [26]. However different researches are being made with a focus to
design PVWPs which meets a lack of potable water for people living in isolated area to
electricity and also to apply it in irrigation on small pieces of lands of about 100m2. [26, 27].
In all researches being conducted, there is a lack of expanding the use of PVWPs in large scale.
Moreover economic assessment and CO2 emissions analysis are not considered. The increase
of oil price by 400% and a considerable reduction in price of PV modules, are the two important
factors which can accelerate the growth of solar power market in Rwanda [31]. The national
total electricity from different resources is estimated to 111.08 MW and this is not even enough
to serve 92% of the total population. Through donors, Rwanda’s ambition is to increase its
power production from solar energy up to 560MWp by 2017 [32]. With the solar electricity
production of five times that of the current available, this will undoubtedly push the planners
not only focusing on administrative units such as schools, hospitals and health centers but also
directing energy in agriculture sector.

11
3 METHODOLOGY
To design, optimize and simulate a cost effective of PVWPs and answer to the research
questions, there are some important input parameters which need to be known before carrying
out the study. Those include: solar irradiation of the region under investigation, source and
quantity of water required to irrigate crops; the source of water can be surface water or
subsurface water. In case of subsurface water, the total head through which water is to be
pumped from the deep well to the storage tank or directly to the point of use, is also another
input parameter and it has been assumed to 60m. The assumption of total dynamic was made
based on spatial variation of the underground water level of the country [33]. Before doing
design and simulation of PVWPs with tank and battery storages, LOL has been determined.
The loss of load (LOL) is the probability time fraction at which the battery is disconnected due
to low charge regulator security. In other hand it can be defined as probability time fraction at
which tank becomes empty due to low pump power [34]. The selection was carried out
considering best and worst case to determine the PV power and pump power. The design and
simulation of PVWPs with both tank storage and battery storage has been performed using
PVsyst software. Furthermore MS Excel was the main tool for conducting the economic
analysis, design of irrigation system, evaluation of CO2 emissions and also used to calculate
some important input parameters such as hydraulic energy and power of pump. The two
regions selected for irrigation are located in Eastern part of the country and are used to grow
coffee and cassava respectively. Those regions were adopted because there are situated on
higher slope and groundwater is the only source used to irrigate crops. In addition, the use of
pumping systems is the main method to take water from source to the cropped area or to the
water storage capacity. Using CROPWAT [35], water requirements for the two specific crops
for the two specific locations were obtained.
The pump design leads to the design of PV array capable of converting available sun energy
into hydraulic energy. The PV panel has to produce more power than the exact amount of
power needed by pump in order to overcome the losses occurred in the system. The energy
produced by PV modules is stored in two different forms [12, 36]. In the first case, the PV
system is directly connected to the direct current (DC) pump and the energy stored in tank in
form of water. Due to the fact that the energy of sun is changing time to time, converter is put
between motor and PV system to match the DC generator with DC required by pump. When
an alternative current (AC) pump is used, inverter is included to convert DC of PV modules to
the AC of the pump.
The design month has been determined as the month whereby the ratio between monthly water
requirement and monthly solar irradiation is the highest. To assure the water for irrigation is
available all the season, the tank was chosen to hold amount of water to be used for at least
three days to overcome the problems related to cloudy days. In the second case, the PVWPs
took into consideration the battery as mean to store electrical energy of PV generator and be
used later when water is needed. In this case a charge controller has to be installed between
the battery, the PV modules and the load in order to avoid overcharging or undercharging.
Different irrigation methods such as surface and localized methods can be utilized to water the
crops. With higher irrigation efficiency and lower power consumption compared to other
12
methods, localized method was selected as one of the best option [37]. Localized irrigation
approach can be achieved with micro-drip and sprinkler irrigation systems. Due to the fact that
drip irrigation is suitable to many different type of crops, any farmable crop and also suitable
to any type of soil, it has been chosen as the one to apply, also due to its high irrigation
efficiency [38]. There were two separate regions growing two different types of crops and the
water requirement is not the same. The thesis work was carried considering two different
scenarios: one for coffee plantation and another one for cassava plantation. The reasons for
having two scenarios are because the system design is affected by the crop irrigation
requirements that vary according to different crop. Accordingly, energy requirement to run the
two pumps will be different and hence the PV array.
For every project, there is need to perform economic evaluation to make sure that it is viable
or not. During economic investigation, the investment costs of standalone PVWPs have been
estimated considering initial investment costs, and maintenance and operating costs. The costs
of drip irrigation were determined taking into account initial investment cost per hectare, canal
and delivery maintenance cost per cubic meter of water and on farm operation and
maintenance cost per hectare. To see the impact that the PVWPs has on irrigation system of
the regions, the methods of the life cycle cost (LCC), net present value (NPV) and payback
period (PBP) have been applied. PVWPs were compared with DWPs which is currently used to
provide water for irrigation. The project was not looked only in term of economic perspective
but also in term of environmental perspective. The reduction of CO2 emissions when PVWPs
is used in place of DWPs were estimated per liter of diesel consumption.
4 DESCRIPTION AND DESIGN
4.1 Photovoltaic water pumping system (PVWPs)
A PVWPs is a combination of different components connected together to fulfill the water
requirement. The power from sun converted by PV module is transferred to the pump which
in turn deliver water to where it is needed. The main components of the system are PV array,
controller or inverter (s) and motor-pump unit. Depending on storage mode adopted, the
system can either use tank to store water or battery to store energy in form of chemical energy.
Both methods have the same purpose of storing energy for using it when sun is not available.
However, the system can also be designed without storages medium and water is directly
pumped through pipes into the irrigation system. The drawback for using this configuration is
that it operates only when there is sun. Environmental conditions in which the system is
installed and its configuration, are two factors affecting the performance and efficiency of the
system.

13
4.1.1 Design and implementation
Except for the PVWPs directly connected to irrigation which is designed in MS Excel to
determine the power needed, the two other PVWPs technologies equipped with tank and
battery were designed and simulated in PVsyst software. In PVsyst, the inputs parameters for
system equipped with water storage tank are the water requirement, tilt angle and hydraulic
head to which water should be lifted by the pump. Whereas, the tilt angle and electric load
requirements have to be defined to design and simulate the system equipped with battery
storage. The location of the area under investigation is also another important input parameter
to be defined first to assess the locally available solar irradiation and the potential electric
generation. The simulation were run on hourly basis and then aggregated on monthly basis.
4.1.1.1 Design and simulation of PVWPs with tank storage
In PVsyst, the primarily inputs parameters to design and simulate a PVWPs with tank storage
are: the location in which the project is to be carried out, crop water requirement and the tilt
angle to which the PV modules should be mounted to optimal convert available solar
irradiation into electric power. The tilt angle is the same for all PVWPs technologies and is
calculated according to the equation provided by [39]. The optimum tilt angle S*(0) for the
fixed plate collector is determined taking into account the latitude of the area under
consideration and is given the relationship:
𝑆∗ = 2.9489 + 1.4050∅ − 0.0190∅2, for4.858 < ∅ < 13.017 Equation 1
Where ∅ [0] is the latitude angle facing south of the location.
The amount of water required for irrigation depends on many factors. The type of crop is one
of important factor determining the irrigation water requirement. Moreover, the size of field
to be irrigated is another parameter that affect the water requirement. Two separate fields with
total size of 10hectares were selected whereby 5 hectares are for coffee plantation and the
remaining 5hectares are for cassava. The specific water requirement for each type of crop was
obtained on monthly basis using CROPWAT software.
The head requirement was assumed based on groundwater depth map taken from [35] and it
attached in Appendix 1
Once all the inputs are known, the design is done step by step as described below:
Definition of the user’s water needs, which may be constant during the year, or having
seasonal or monthly variation;
Characterization of the storage tank;
Dynamic behavior of the well;
Photovoltaic system;
Motor-pump device;
Power regulation method.

14
4.1.1.2 Design and simulation of PVWPs with battery storage
Before designing and simulating a system with battery storage, it is required to have
information about hydraulic power. According to [40], the hydraulic power (𝑃ℎ) is obtained
from the equation 2 below.
𝑃ℎ = 9.81𝑄𝑇𝐷𝐻 Equation 2
Where TDH is the total dynamic head (m) to which pump should take water from deep well to
the place of use and it is assumed taking reference to groundwater map.
Q is the flowrate (liters/sec) computed considering the peak crop water requirement (𝐼𝑊𝑅𝑃)
and total hours of operation per day (𝑇ℎ) in the equation 3
𝑄 =𝐼𝑊𝑅𝑃∗1000
𝑇ℎ∗3600 Equation 3
The size of battery is determined by its capacity to store energy when it is cloudy days. It is
obviously understandable that energy stored is that required by the pump to keep the system
operation when no sun is available.
In PVsyst, the following adjustments were made:
Define user’s needs: the user’s needs includes the monthly hydraulic power needs
System definition: both battery and PV modules types are selected. In addition the
arrangement in series and parallel is set in order to fulfill the electric requirement.
Regulator: the power produced by PV modules has to be controlled before entering the
battery. The same regulation need to be done for the power output of the battery to
pump motor.
4.1.2 Design of PVWPs directly connected to irrigation system
The choice of PV module to convert sun into required power used in irrigation system is
determined considering the worst month condition. The worst month in turns is evaluated
taking into account the highest ratio between monthly water requirement and monthly
available solar irradiation. Having known the worst month, available solar irradiation and crop
water requirement, the PV peak power Pp (kWp) is calculated using equation 4 [41]:
𝑃𝑝,𝑃𝑉𝑊𝑃 =0.0027 𝑇𝐷𝐻
𝑓𝑚[1−𝛼𝑐(𝑇𝑐𝑒𝑙𝑙−𝑇0)]𝜂𝑝𝑚𝑎𝑥
𝑚
𝐼𝑊𝑅𝑡,𝑚
𝐸𝑆𝑚
Equation 4
where, 0.0027 is a conversion factor that takes into account the density of water (1000 kg/m3),
the gravity acceleration (9.8 m/s2) and the conversion between Joule and kWh (1/(3.6*106))
to calculate the daily hydraulic energy; fm is the matching factor assumed equal to 0.9; αC is the
PV modules temperature coefficient equal to 0.45 %/°C; T0 is the reference temperature equal
to 25°C; ƞp is the efficiency of the pump; IWRt represents the total monthly average daily IWR
(m3/ha/day) given by the sum of the IWR of the n-th crops; TDH is the total dynamic head that
takes into account the contributions of the groundwater depth, drawdown, operational head of
the irrigation system and hydraulic losses (m); ES is the monthly average daily solar irradiation

15
hitting the array (kWh/m2/day); the function max indicates that the design of the PVWP
systems has to be conducted for the month m marked out by the highest ratio (design ratio)
between monthly average daily IWRt and monthly average daily solar irradiation energy. Tcell
is the cell temperature (°C) obtained using the following relationship [42]:
𝑇𝑐𝑒𝑙𝑙(𝐶) = 𝑇𝑎𝑖𝑟 +𝑁𝑂𝐶𝑇−20
800∗ 𝐺 Equation 5
Where 𝑇𝑎𝑖𝑟 is the ambient air temperature in 0C; G is the global irradiation of 1000W/m2 and
NOCT the nominal operating cell temperature. NOCT is the temperature of the cell at standard
reference environment (SRE). The standard parameters are: ambient temperature of 200C, an
irradiance of 800W/m2, a wind speed of 1m/s and an open near surface mounting (the module
is tilted at 45o).
4.2 Drip irrigation system
To ensure that the plants do not suffer from strain or stress of less and over watering it
necessary to design a suitable irrigation system which delivers a predefined amount of water
at the root zone of plant at regular time intervals. The design is made based on different factors
as input parameters. Those include water source and its availability, power source,
agronomical details such as crop, spacing, age, peak water requirement and row direction for
row crops. The design also considers climate data such as temperature, humidity, rainy fall and
evaporation. Moreover type of soil, water quality and existing resources such as pump and
main line are additional input parameters to be taken into account [43]. In chronological order
from source to the end user, the components of drip irrigation system are pump which take
water from source to the main line. The main line is connected to the sub-main pipe whose
number is directly the same as number of subsections created in the field. The sub-main pipe
is placed inside each subsection and then water of that pipe is shared across the rest of field
part by lateral pipes attached to it. To ensure the predefined water on root zone and uniformity
distribution, drippers with emitters are fixed on lateral pipes with a certain distance from one
another [44]. The knowledge of input parameters stated above helps to design each component
of the system starting backward, from emitter to pump. Based on type of crop, water
requirement, operating time, soil type and water quality, emitter suitable for irrigation is
selected. The length and size of lateral lines are determined based on the lateral line flow rate
and field size. Similarly, the size and length of the sub-main pipe is determined. Each sub-main
is an individual unit with its own control valve. The whole area is then divided into different
sub-main units and the number of sub-main units that can operate at any one time is based on
the existing pumping or water source capacity. Sections should be designed such that the
discharge provided is the same for each one. The appropriate length of the sub-main pipe is
determined taking reference in the predesigned allowable length. The main line is then
planned connecting all the sub-mains by taking the shortest possible route [45]. The length of
the main pipe can be determined based on the flow rate so that frictional head loss is within
specified limits and total pressure head required for the system is within pump or water source
capacity. Similarly to the determination of proper length of sub-main, the length of main line
is determined taking reference on allowable length of main line. When gravity is used, then the
16
pump requirement is worked out from total discharge and pressure head required for the
system. Depending on the flow rate and water quality, a suitable filtration device is selected.
4.2.1 Design and implementation
To insure that the system is operating with higher efficiency, the system components have to
be selected with proper sizes to meet the pressure and water required for irrigation. The
procedures used to design a drip irrigation system are common for the area and type of crops
to be irrigated. However the size can vary depending on type of crop which determines the
water requirement and cropping area. The two separate regions adopted are used to grow
different crops: coffee and cassava, but the irrigation areas have the same size. Common drip
emitters have discharge in range 1-15l/h at the standard pressure of 1bar. The purpose of those
emitters is to distribute the water uniformly. Moreover the variation of discharge between
emitters in whole field should not exceed 20%. The operating pressure of drip tube is 0.41 –
0.82bar whereas the spacing between two emitters (𝐷𝑒) varies from 0.15-0.91m. This
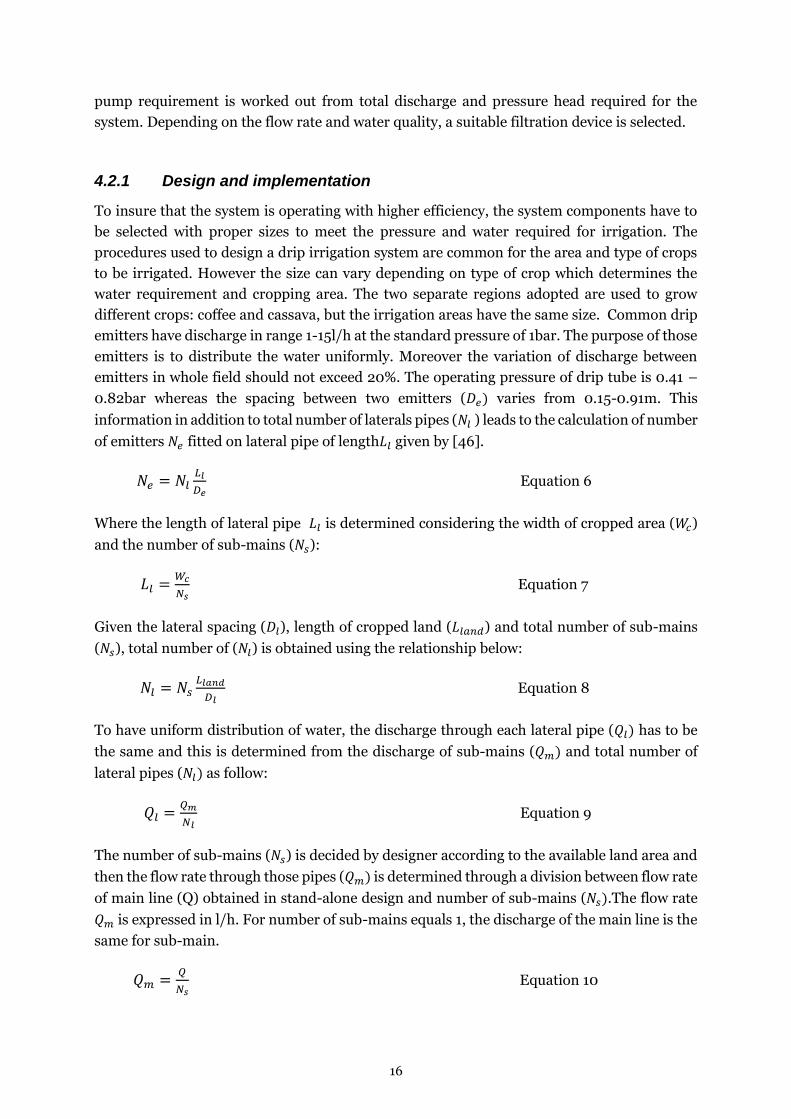
information in addition to total number of laterals pipes (𝑁𝑙 ) leads to the calculation of number
of emitters 𝑁𝑒 fitted on lateral pipe of length𝐿𝑙 given by [46].
𝑁𝑒 = 𝑁𝑙𝐿𝑙
𝐷𝑒 Equation 6
Where the length of lateral pipe 𝐿𝑙 is determined considering the width of cropped area (𝑊𝑐)
and the number of sub-mains (𝑁𝑠):
𝐿𝑙 =𝑊𝑐
𝑁𝑠 Equation 7
Given the lateral spacing (𝐷𝑙), length of cropped land (𝐿𝑙𝑎𝑛𝑑) and total number of sub-mains
(𝑁𝑠), total number of (𝑁𝑙) is obtained using the relationship below:
𝑁𝑙 = 𝑁𝑠𝐿𝑙𝑎𝑛𝑑
𝐷𝑙 Equation 8
To have uniform distribution of water, the discharge through each lateral pipe (𝑄𝑙) has to be
the same and this is determined from the discharge of sub-mains (𝑄𝑚) and total number of
lateral pipes (𝑁𝑙) as follow:
𝑄𝑙 =𝑄𝑚
𝑁𝑙 Equation 9
The number of sub-mains (𝑁𝑠) is decided by designer according to the available land area and
then the flow rate through those pipes (𝑄𝑚) is determined through a division between flow rate
of main line (Q) obtained in stand-alone design and number of sub-mains (𝑁𝑠).The flow rate
𝑄𝑚 is expressed in l/h. For number of sub-mains equals 1, the discharge of the main line is the
same for sub-main.
𝑄𝑚 =𝑄
𝑁𝑠 Equation 10
17
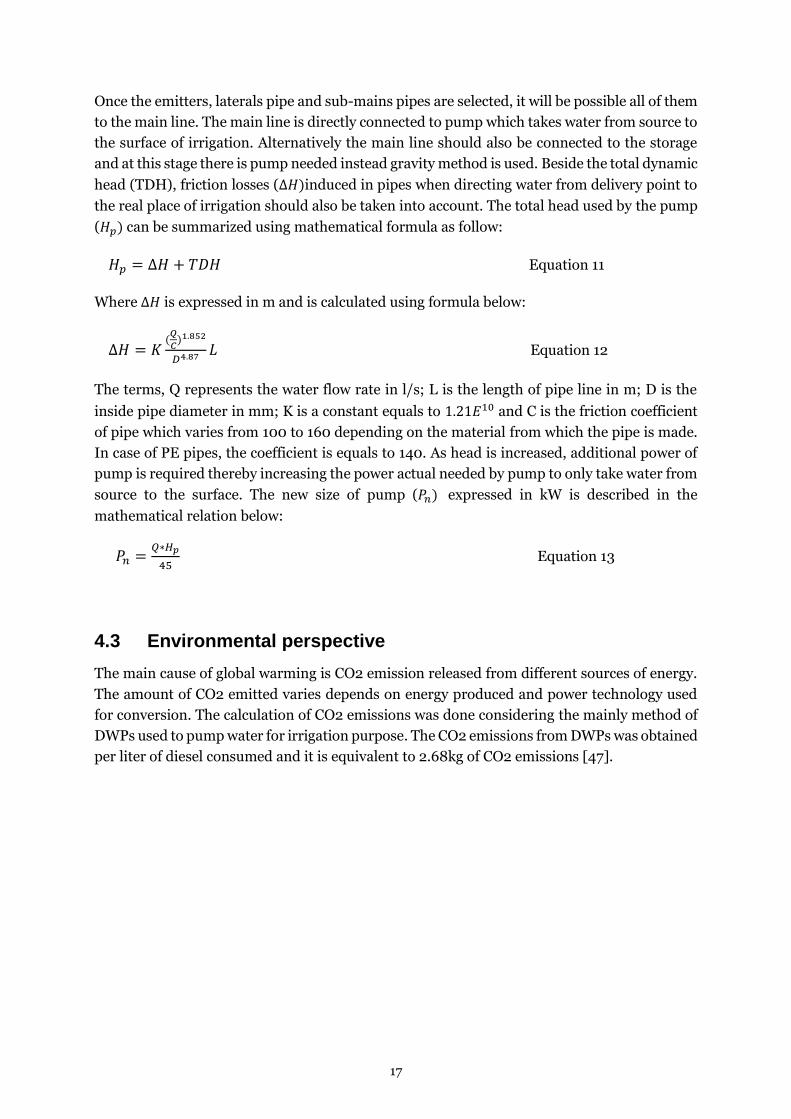
Once the emitters, laterals pipe and sub-mains pipes are selected, it will be possible all of them
to the main line. The main line is directly connected to pump which takes water from source to
the surface of irrigation. Alternatively the main line should also be connected to the storage
and at this stage there is pump needed instead gravity method is used. Beside the total dynamic
head (TDH), friction losses (∆𝐻)induced in pipes when directing water from delivery point to
the real place of irrigation should also be taken into account. The total head used by the pump
(𝐻𝑝) can be summarized using mathematical formula as follow:
𝐻𝑝 = ∆𝐻 + 𝑇𝐷𝐻 Equation 11
Where ∆𝐻 is expressed in m and is calculated using formula below:
∆𝐻 = 𝐾(
𝑄
𝐶)1.852
𝐷4.87 𝐿 Equation 12
The terms, Q represents the water flow rate in l/s; L is the length of pipe line in m; D is the
inside pipe diameter in mm; K is a constant equals to 1.21𝐸10 and C is the friction coefficient
of pipe which varies from 100 to 160 depending on the material from which the pipe is made.
In case of PE pipes, the coefficient is equals to 140. As head is increased, additional power of
pump is required thereby increasing the power actual needed by pump to only take water from
source to the surface. The new size of pump (𝑃𝑛) expressed in kW is described in the
mathematical relation below:
𝑃𝑛 =𝑄∗𝐻𝑝
45 Equation 13
4.3 Environmental perspective
The main cause of global warming is CO2 emission released from different sources of energy.
The amount of CO2 emitted varies depends on energy produced and power technology used
for conversion. The calculation of CO2 emissions was done considering the mainly method of
DWPs used to pump water for irrigation purpose. The CO2 emissions from DWPs was obtained
per liter of diesel consumed and it is equivalent to 2.68kg of CO2 emissions [47].
18
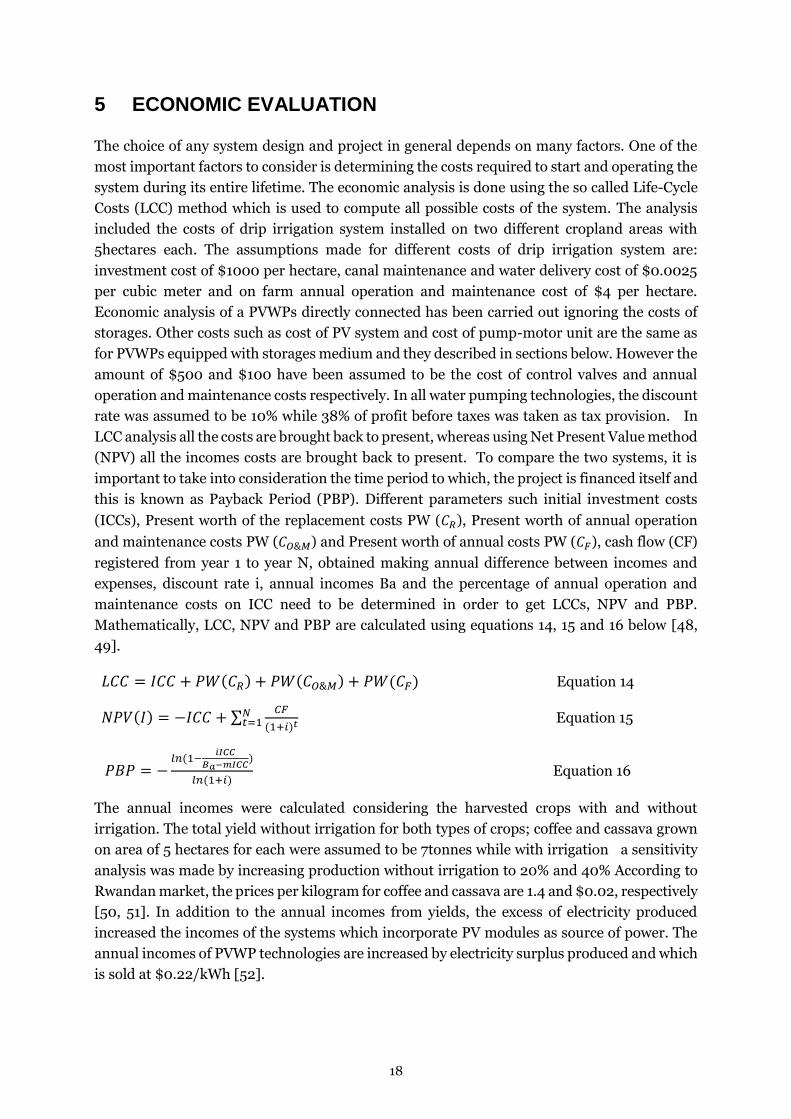
5 ECONOMIC EVALUATION
The choice of any system design and project in general depends on many factors. One of the
most important factors to consider is determining the costs required to start and operating the
system during its entire lifetime. The economic analysis is done using the so called Life-Cycle
Costs (LCC) method which is used to compute all possible costs of the system. The analysis
included the costs of drip irrigation system installed on two different cropland areas with
5hectares each. The assumptions made for different costs of drip irrigation system are:
investment cost of $1000 per hectare, canal maintenance and water delivery cost of $0.0025
per cubic meter and on farm annual operation and maintenance cost of $4 per hectare.
Economic analysis of a PVWPs directly connected has been carried out ignoring the costs of
storages. Other costs such as cost of PV system and cost of pump-motor unit are the same as
for PVWPs equipped with storages medium and they described in sections below. However the
amount of $500 and $100 have been assumed to be the cost of control valves and annual
operation and maintenance costs respectively. In all water pumping technologies, the discount
rate was assumed to be 10% while 38% of profit before taxes was taken as tax provision. In
LCC analysis all the costs are brought back to present, whereas using Net Present Value method
(NPV) all the incomes costs are brought back to present. To compare the two systems, it is
important to take into consideration the time period to which, the project is financed itself and
this is known as Payback Period (PBP). Different parameters such initial investment costs
(ICCs), Present worth of the replacement costs PW (𝐶𝑅), Present worth of annual operation
and maintenance costs PW (𝐶𝑂&𝑀) and Present worth of annual costs PW (𝐶𝐹), cash flow (CF)
registered from year 1 to year N, obtained making annual difference between incomes and
expenses, discount rate i, annual incomes Ba and the percentage of annual operation and
maintenance costs on ICC need to be determined in order to get LCCs, NPV and PBP.
Mathematically, LCC, NPV and PBP are calculated using equations 14, 15 and 16 below [48,
49].
𝐿𝐶𝐶 = 𝐼𝐶𝐶 + 𝑃𝑊(𝐶𝑅) + 𝑃𝑊(𝐶𝑂&𝑀) + 𝑃𝑊(𝐶𝐹) Equation 14
𝑁𝑃𝑉(𝐼) = −𝐼𝐶𝐶 + ∑𝐶𝐹
(1+𝑖)𝑡𝑁𝑡=1 Equation 15
𝑃𝐵𝑃 = −𝑙𝑛 (1−
𝑖𝐼𝐶𝐶
𝐵𝑎−𝑚𝐼𝐶𝐶)
𝑙𝑛 (1+𝑖) Equation 16
The annual incomes were calculated considering the harvested crops with and without
irrigation. The total yield without irrigation for both types of crops; coffee and cassava grown
on area of 5 hectares for each were assumed to be 7tonnes while with irrigation a sensitivity
analysis was made by increasing production without irrigation to 20% and 40% According to
Rwandan market, the prices per kilogram for coffee and cassava are 1.4 and $0.02, respectively
[50, 51]. In addition to the annual incomes from yields, the excess of electricity produced
increased the incomes of the systems which incorporate PV modules as source of power. The
annual incomes of PVWP technologies are increased by electricity surplus produced and which
is sold at $0.22/kWh [52].

19
5.1 Economic assessment for PVWPs
There are different factors which need to be known before carrying out the economic
assessment of PVWPs. Those include economic factors such as the system lifetime, discount
rate and differential inflation rates of certain items if there are. Another factor to consider is of
technical nature and connected to the lifetime of PVWPs main component. The life cycle of the
entire system is decided considering the component of system with longest replacement
interval. In PVWPs, PV system should last 20-30years, whereas the pump and inverter may
have to be replaced every 5-10 years [53]. Once the above two factors are known; the capital
costs for complete system, costs for replacement components, annual maintenance and repair
costs and installation costs are determined. In fact evaluation of capital and installations costs
of PVWPs is performed in details in the following subsections.
5.1.1 Costs of PV system
PV solar system is a combination of many modules grouped together to generate power. In
order to match the power generated by PV panel with the power needed by the user, additional
components are required for regulations. The components can be either converter when a
direct current (DC) pump is used or Balance of system (BOS) in case an alternative current
(AC) pump is required. To know how much does a PV system cost depends on many factors
such as PV system rating, manufacturer, retailer and installer but the most important factor is
the size of PV system. Moreover the cost of PV system is calculated per Watt Peak produced
and the bigger the size, the higher the costs of PV system [59]. According to [54], the cost per
Watt Peak of PV module has been dropped from $76.6 to $0.36 in the years 1997 to 2014 due
to rapid growth in use of solar energy as a source of renewable and many manufacturing
companies of PV plants entering the market. The total costs are broken into seven sub-costs
such as capital cost (29%), PV module (19%), Inverter (5%), Balance of systems (14%),
engineering& procurement and construction (12%), and operation and maintenance cost
(16%) and 5% for other miscellaneous costs [55]. The operating and maintenance costs for PV
pump were assumed to be 0.01$/Wp.
5.1.2 Costs of pump-motor unit
The costs of pump-motor depend on the amount of water required and head to which water is
to be pumped. The pumps required have to deliver the corresponding amounts of water for
irrigation of coffee and cassava. In the irrigation of the selected two crops, water is pumped
through the same head of 60m. A DC pump has been selected due to permanent magnet which
is created in DC motor and increases it’s efficient up to 100% more than AC motor [54]. The
pump is also selected considering optimum water requirement of the month. The pump which
needs to be bought to deliver water requirement for both cassava and coffee is of type Lorenz,
PS 20-HR-04-MPPT. Typically the total cost of pump system is $1650 and this includes $1000
20
of pump, $600 of pump controller and $50 of water level sensor for tank. Due to the fact that
components are imported from outside, extra cost of $1000 was assumed as cost for shipping
both solar and pump components. The amount of $15 in addition to 0.01$/Wp per year was
assumed to be the amount required to maintain the pump [56].
5.1.3 Costs of storages
Two types of storage capacity, tank and battery are used together with PVWPs to store energy
for later use when there is no sun available. Depending on choice, tank can be installed
underground or at certain height above ground level [56]. In this thesis, elevated water storage
tank was considered in order to obtain the pressure requirement for irrigation. The tank
required is mainly the one to store the water to be used for at least three days. The cost of tank
depends on its size and it is assumed to be $0.2/liter [57]. Battery is used to store energy of PV
module in chemical form. Depending on subtypes, both lead acid battery and Nickel cadmium
battery can be used in combination with PV systems. The economic evaluation took into
consideration the lead acid battery because of its lowest price when compared to Nickel
cadmium and it is 160-200€/kWh and 690-1590€/kWh, respectively. The time of operation
for this battery is ranging between 5 to 7 years [58].
5.2 Economic assessment for DWPs
As has been done in the previous section, economic evaluation of DWPs has to be investigated
taking into account the same lifetime of 20 years. In contrary to the PVWPs which can be either
underground or above, the diesel pump is always installed above ground. DWPs is made up
with four main components such as diesel engine, pump element, pump head and rising main.
However the detailed design of the system is not included in the scope of this thesis. The cost
of diesel pump depends on its size whereas the efficiency varies with the running condition of
the pump. The cost of diesel pump is estimated to be in range of 800 to 1000$ per kW and
7000 to 9150$ per kW for diesel pump size less or equal to 10kW and for larger scale,
respectively. The fuel efficiency of diesel generator per liter varies from 2.5 to 3kWh [59].
Moreover the maintenance and operating costs of diesel pump are higher and can even equal
or 50% more than the capital cost [60]. The most important factor to consider when computing
the costs of diesel pump is the required hydraulic energy (He). The required hydraulic energy
determines engine size and is obtained through equation (8) above. Due to larger scale of
diesel engines suitable for pumping, the minimum size starts at 2.5Kw. The required power
rating of the diesel engine (Pd) is then calculated and compared with the minimum size for
diesel engine which is 2.5 kW [61]. If the rating power (Pd) is less than the minimum power,
the power of 2.5kW is taken account. All the calculation have been made following the
approached used by [61]. The rating power is given by the following relationship:
Pd =Ph
4 Equation 17

21
Given the size of the diesel engine and the capital cost per installed kW (Cd), the total cost of
pumping system (Ct) can be determined.
Ct = Pd ∗ Cd Equation 18
During economic assessment of diesel powered pump, many assumptions have been made. It
was assumed that the pump operates 8 hours; the pump efficiency is 60%; and pump is
replaced every 7 years. The same discount rate as for PVWPs has been assumed to be 10%. It
was also assumed the maintenance cost for diesel pump to $125 per year.
Different factors such as total number of annual running hours (Td), power rating (Pd), the cost
of one liter diesel fuel (Cf/liter) and the average fuel consumption fd (liters/kW) of engine per
hour are used to determine the annual fuel consumption AFCd as given by:
AFCD = Td ∗ Cf ∗ Pd ∗ fd Equation 19
The number of running hours (Td) is obtained from the following equation:
Td = 2 ∗ He,tot/Pd Equation 20
Where He,tot is the total annual hydraulic energy requirement in kilowatt-hour obtained by
summing up the daily required hydraulic energy.

22
6 RESULTS AND DISCUSSIONS
The section presents the results for the site characteristics and simulation results of PVWPs
designed with both storage tank and battery to meet water requirements for coffee and cassava.
Moreover it includes the results for PVWPs directly connected to irrigation and irrigation
system to satisfy water needs. The LCCs, PBP and NPVs of all PV water pumping systems and
DWPs are also presented. Finally evaluation of CO2 emissions when DWPs is used is included
in this section.
6.1 Meteorological data
To design a PVWPs, it is required to know the climate characteristics of the region under
consideration. In PVsyst, the region of Kampala (Uganda) with latitude 0.30N, longitude
32.60E and altitude of 1146m has been taken into account due to the lack of climatic data for
Rwanda. Using PVsyst, meteorological characteristics of Kampala were obtained and are
presented in Figure 4. One of the most important characteristic is availability of solar resource
to be converted into usable power for pumping. To obtain higher efficiency of the system, the
solar irradiation hitting the collectors has to be maximized by minimizing the losses. This is
achieved by positioning the PV panels with the proper tilt angle to which the PV modules is
facing the south and it was calculated using equation 1. The efficiency of solar modules is
affected by the temperature of PV modules and it increases with lower temperature.
Figure 4. Meteorological characteristics of the region under study.
19.5
20
20.5
21
21.5
22
22.5
23
23.5
24
0
20
40
60
80
100
120
140
160
180
Jan Feb Mar Apr May Jun Jul Aug Sep Oct Nov Dec
Tem
per
atu
re (
°C)
So
lar
irra
dia
tio
n (
kW
h/m
²)
Month
solar irradiation Temperature

23
6.2 Crop water requirements
The Figure 5 below shows the monthly water requirements for both coffee and cassava. The
water consumption was obtained using CROPWAT software. The water needs differ depend on
season and type of crop being irrigated. Other factors such as such temperature, humidity, soil
type, wind velocity, growth stage, shade and sun also determine the water requirements.
During sunny period, the temperature increases whereas soil humidity decreases and hence a
huge amount of water is required to compensate the water evaporated and water for irrigation
of crop. As shown in Figure5, the irrigation of coffee plantation is performed almost the whole
year while that for cassava needs to be done only for 7months per year. Furthermore for the
same months of irrigation, coffee plantation presents higher amount of water consumption
compared to the amount consumed by cassava.
Figure 5. Water requirements for coffee and cassava.
6.3 Irrigation system design
The method of irrigation adopted was drip irrigation system due to its higher efficiency when
taking into account water and energy savings compared to other methods of irrigation. The
method was applied to both systems designed for irrigating coffee and cassava plantations. The
two crops are cultivated on two different fields with the same size of 5 hectares each. The
parameters of drip irrigation system were calculated in MS Excel sheet using equations 6, 7, 8,
9 and 10. The characteristics of drip irrigation system to water both coffee and cassava are
summarized in a Table 2. It was required to divide each field into sub-sections with a discharge
equals to the amount of the main feeder divided by total number of sub-mains decided. To
ensure that the entire field is irrigated, each cropped land has been divided into three equally
0
10
20
30
40
50
60
Jan Feb Mar Apr May Jun Jul Aug Sep Oct Nov Dec
Irr
iag
tio
n w
ate
r r
eq
uir
em
en
ts
(m³
/ha
/da
y)
Month
Coffee Cassava

24
sections with one sub-main pipe placed in the middle of each section. This was done assuming
a square shape of the field and then using square root method, the width was also obtained to
be 224m. Using equation 10, the discharge rate in each section has been determined to be
11l/sec and 0.1l/sec for irrigation system of coffee and cassava respectively. Due to the fact that
sub-mains pipes placed in middle of each sub-section are not capable of spreading the water
all around the rest of parts, additional pipes named laterals were attached to them. The length
of laterals of 75m was calculated dividing the width of sub-section by 3. Assuming the spacing
between two laterals pipes equals to 2m, the total number was obtained from equation 5 and
it is 335 pipes. In turn, the total number of lateral pipes designed for each sub-section are not
enough to make a uniform distribution of water. To achieve uniformity of water around the
sub-part, the total number of 47170 emitters was calculated using equation 6. Those have to
operate considering a mean value of spacing range to be 0.53m and a mean pressure value of
0.615bar. Finally the design has considered the friction head loss encountered in pipes. The
head loss was added to the total dynamic head and hence increasing the power requirement
for pump. Alternatively when the system uses water storage tank, the desired gravity should
be higher enough to meet pressure need.
Table 2. Characteristics of drip irrigation system.
Parameter Coffee Cassava
Surface area (m2) 5000 5000
Width, Wc (m) 224 224
Number of sub-mains,Ns 3 3
Length of lateral , Ll (m) 75 75
Spacing between laterals, Dl (m) 2 2
Number of laterals, Nl (m) 335 335
Spacing between emitters, De (m) 0,53 0,53
Number of emitters, Ne 47170 47170
Flow rate main, Qm (l/s) 11 0,101851852 Number of laterals on one main, Nls 112 112
Flow rate laterals, Ql (m3/s) 0,099380799 0,000910991
6.4 Selected Loss of Load (LOL)
During design and simulation of PVWPs equipped with tank and battery storage, a best loss of
load were determined. In PVsyst, the LOL were obtained considering the best and worst case
and by varying the LOL from 1% to 10 % to get both power of PV modules and its corresponding
power of pump. The worst case and best case were decided based on Rwanda groundwater
level shown in Appendix 1. The best case took into consideration the low level of 1m height
while the worst took the maximum level of 380m. The best LOL at which the PVWPs should
be designed has been determined by the intersection between PV power of the best and PV
power of the worst case. Alternatively LOL was selected based on intersection between the
power pump of the worst case and power of the best case. As shown in Figure 6 of LOL for
PVWPs to water coffee and Figure 7 of LOL for PVWPs to irrigate cassava, the best LOL were

25
found to be 6% and 5% for PVWPs to irrigate coffee and cassava respectively. Power of PV
modules and power of pump become higher for high level of water whereas power of PV
modules and power pump get decreased for low level of water. This due to the fact for higher
level much power is needed to meet both head and pressure of pump while in case of lower
height only pressure has to be achieved.
Figure 6. Required LOL to design PV water pumping system for coffee irrigation.
Figure 7. Required LOL to design PV water pumping system for cassava irrigation.
0
2
4
6
8
10
12
14
16
18
20
0 1 2 3 4 5 6 7 8 9 10 11 12
Po
we
r (
kW
)
LOL (%)
Pvbest PUMPbest
PV worst PUMP worst
0
1
2
3
0 1 2 3 4 5 6 7 8 9 10 11 12
Po
we
r (
kW
)
LOL (%)
Pvbest PUMPbest
PV worst PUMP worst
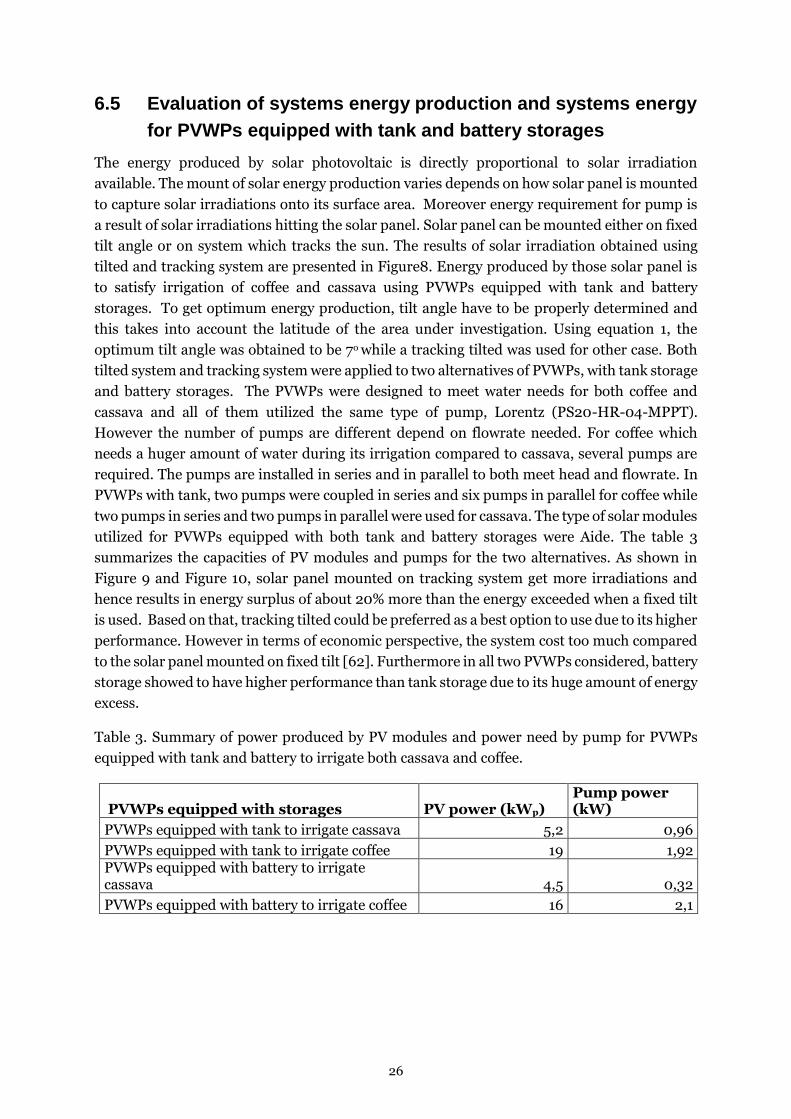
26
6.5 Evaluation of systems energy production and systems energy
for PVWPs equipped with tank and battery storages
The energy produced by solar photovoltaic is directly proportional to solar irradiation
available. The mount of solar energy production varies depends on how solar panel is mounted
to capture solar irradiations onto its surface area. Moreover energy requirement for pump is
a result of solar irradiations hitting the solar panel. Solar panel can be mounted either on fixed
tilt angle or on system which tracks the sun. The results of solar irradiation obtained using
tilted and tracking system are presented in Figure8. Energy produced by those solar panel is
to satisfy irrigation of coffee and cassava using PVWPs equipped with tank and battery
storages. To get optimum energy production, tilt angle have to be properly determined and
this takes into account the latitude of the area under investigation. Using equation 1, the
optimum tilt angle was obtained to be 7o while a tracking tilted was used for other case. Both
tilted system and tracking system were applied to two alternatives of PVWPs, with tank storage
and battery storages. The PVWPs were designed to meet water needs for both coffee and
cassava and all of them utilized the same type of pump, Lorentz (PS20-HR-04-MPPT).
However the number of pumps are different depend on flowrate needed. For coffee which
needs a huger amount of water during its irrigation compared to cassava, several pumps are
required. The pumps are installed in series and in parallel to both meet head and flowrate. In
PVWPs with tank, two pumps were coupled in series and six pumps in parallel for coffee while
two pumps in series and two pumps in parallel were used for cassava. The type of solar modules
utilized for PVWPs equipped with both tank and battery storages were Aide. The table 3
summarizes the capacities of PV modules and pumps for the two alternatives. As shown in
Figure 9 and Figure 10, solar panel mounted on tracking system get more irradiations and
hence results in energy surplus of about 20% more than the energy exceeded when a fixed tilt
is used. Based on that, tracking tilted could be preferred as a best option to use due to its higher
performance. However in terms of economic perspective, the system cost too much compared
to the solar panel mounted on fixed tilt [62]. Furthermore in all two PVWPs considered, battery
storage showed to have higher performance than tank storage due to its huge amount of energy
excess.
Table 3. Summary of power produced by PV modules and power need by pump for PVWPs
equipped with tank and battery to irrigate both cassava and coffee.
PVWPs equipped with storages PV power (kWp) Pump power (kW)
PVWPs equipped with tank to irrigate cassava 5,2 0,96
PVWPs equipped with tank to irrigate coffee 19 1,92 PVWPs equipped with battery to irrigate cassava 4,5 0,32
PVWPs equipped with battery to irrigate coffee 16 2,1

27
Figure 8. Solar irradiations for a PVWPs equipped with tank and battery storages to satisfy water need for coffee plantation when a solar panel is mounted on fixed tilt angle and tracking array, respectively.
Figure 9. Unused energy of tank and battery for PVWPs designed to meet electricity requirements for coffee plantation when solar panel is mounted on both fixed tilted angle and tracking system array.
0
50
100
150
200
250
Jan Feb Mar Apr May Jun Jul Aug Sep Oct Nov Dec
So
lar
irra
dia
tio
n (
kW
h/m
²)
Month
Irradiations at fixed tilt Irradiation at tracker
100
300
500
700
900
1100
1300
1500
Feb Mar Apr May Jun Jul Aug Sep Oct Nov Dec
Un
use
d e
ner
gy
(k
Wh
)
Month
PVWPS with tank at fixed tilt PVWPs with battery at fixed tilt
PVWPs with tank at tracking system PVWPs with battery at tracking system
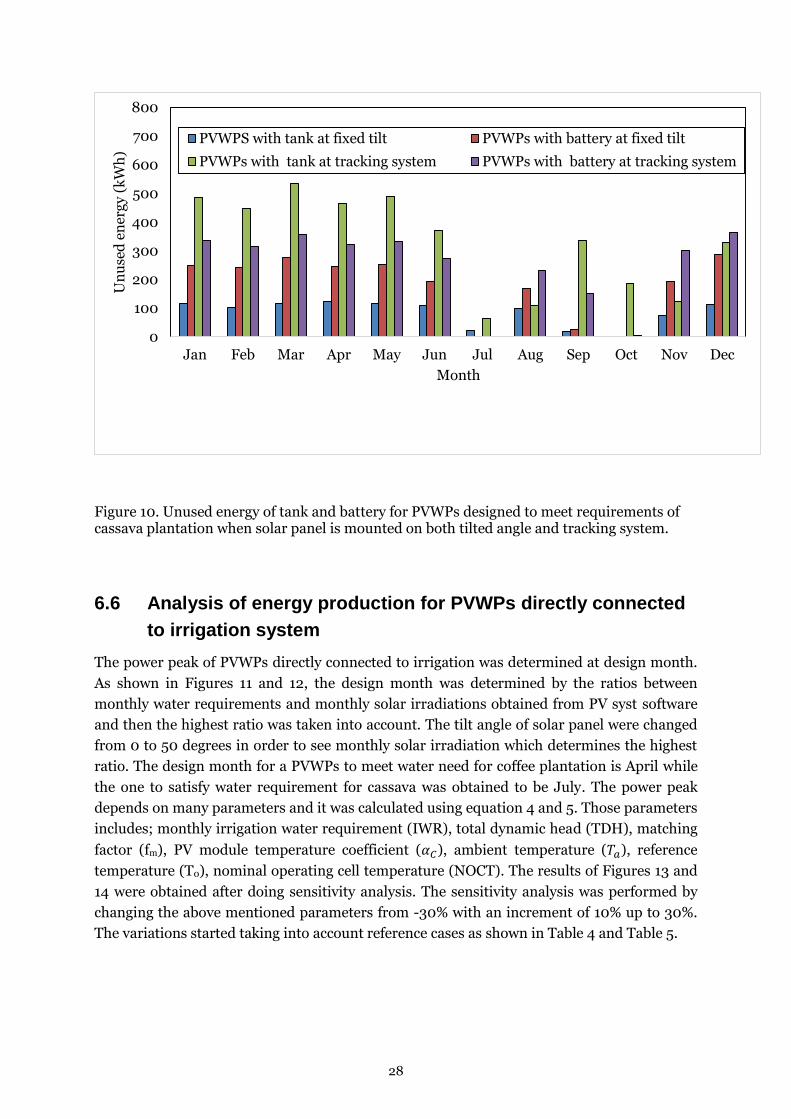
28
Figure 10. Unused energy of tank and battery for PVWPs designed to meet requirements of cassava plantation when solar panel is mounted on both tilted angle and tracking system.
6.6 Analysis of energy production for PVWPs directly connected
to irrigation system
The power peak of PVWPs directly connected to irrigation was determined at design month.
As shown in Figures 11 and 12, the design month was determined by the ratios between
monthly water requirements and monthly solar irradiations obtained from PV syst software
and then the highest ratio was taken into account. The tilt angle of solar panel were changed
from 0 to 50 degrees in order to see monthly solar irradiation which determines the highest
ratio. The design month for a PVWPs to meet water need for coffee plantation is April while
the one to satisfy water requirement for cassava was obtained to be July. The power peak
depends on many parameters and it was calculated using equation 4 and 5. Those parameters
includes; monthly irrigation water requirement (IWR), total dynamic head (TDH), matching
factor (fm), PV module temperature coefficient (𝛼𝐶), ambient temperature (𝑇𝑎), reference
temperature (T0), nominal operating cell temperature (NOCT). The results of Figures 13 and
14 were obtained after doing sensitivity analysis. The sensitivity analysis was performed by
changing the above mentioned parameters from -30% with an increment of 10% up to 30%.
The variations started taking into account reference cases as shown in Table 4 and Table 5.
0
100
200
300
400
500
600
700
800
Jan Feb Mar Apr May Jun Jul Aug Sep Oct Nov Dec
Un
use
d e
ner
gy
(k
Wh
)
Month
PVWPS with tank at fixed tilt PVWPs with battery at fixed tilt
PVWPs with tank at tracking system PVWPs with battery at tracking system
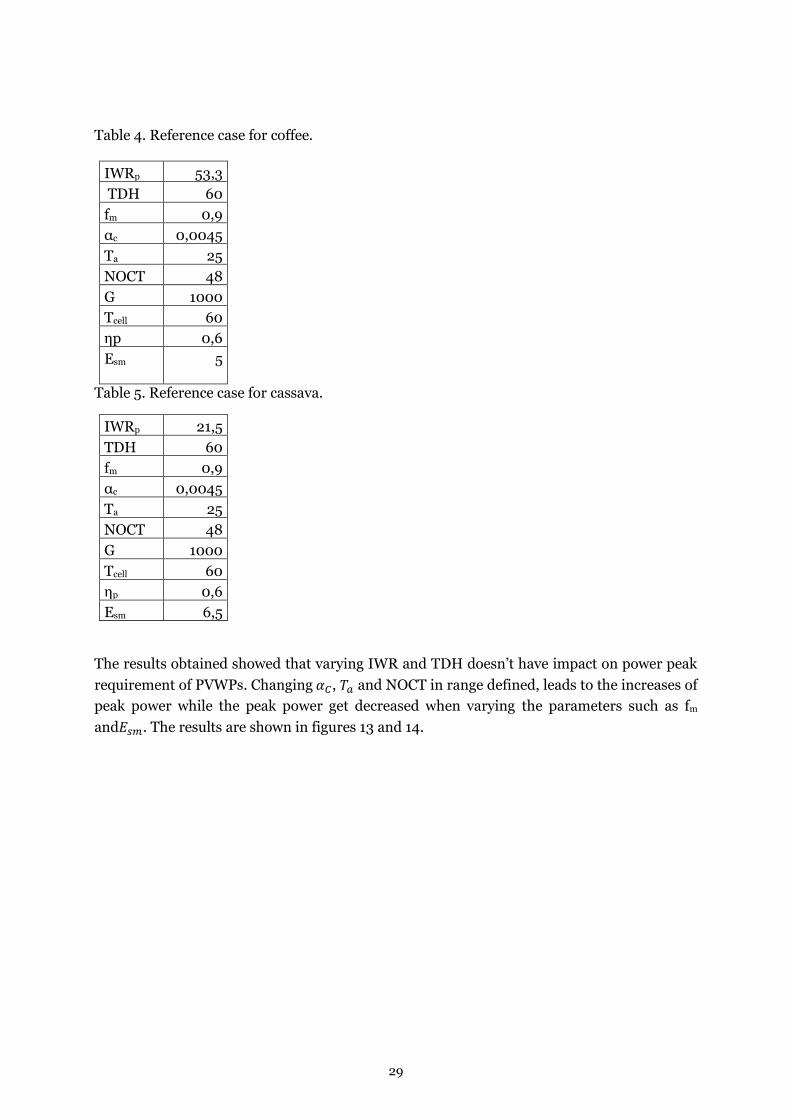
29
Table 4. Reference case for coffee.
IWRp 53,3
TDH 60
fm 0,9
αc 0,0045
Ta 25
NOCT 48
G 1000
Tcell 60
ηp 0,6
Esm 5
Table 5. Reference case for cassava.
IWRp 21,5
TDH 60
fm 0,9
αc 0,0045
Ta 25
NOCT 48
G 1000
Tcell 60
ηp 0,6
Esm 6,5
The results obtained showed that varying IWR and TDH doesn’t have impact on power peak
requirement of PVWPs. Changing 𝛼𝐶, 𝑇𝑎 and NOCT in range defined, leads to the increases of
peak power while the peak power get decreased when varying the parameters such as fm
and𝐸𝑠𝑚. The results are shown in figures 13 and 14.
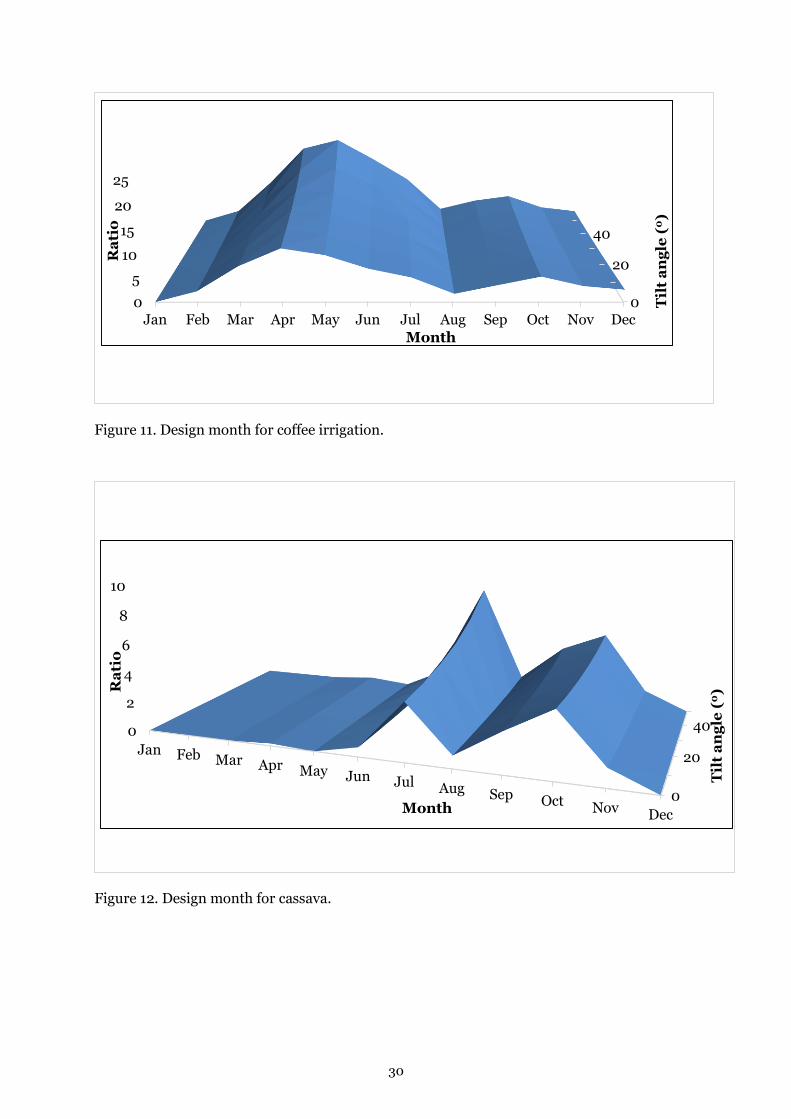
30
Figure 11. Design month for coffee irrigation.
Figure 12. Design month for cassava.
0
20
40
0
5
10
15
20
25
Jan Feb Mar Apr May Jun Jul Aug Sep Oct Nov Dec
Til
t a
ng
le (
0)
Ra
tio
Month
0
20
400
2
4
6
8
10
Jan Feb Mar Apr May Jun Jul Aug Sep Oct Nov Dec
Til
t a
ng
le (
0)R
ati
o
Month

31
Figure 13. Power peak requirement for PVWPs directly connected to irrigation of coffee land
obtained by varying different parameters by 10 % from -30% to 30%.
Figure 14. Power peak requirement for a PVWPs directly connected to irrigation of cassava land obtained by varying different parameters by 10% from -30% to 30%.
0
1
2
3
4
5
6
7
8
-40 -30 -20 -10 0 10 20 30 40
Pea
k p
ow
er (
kW
p)
Variation (%)
IWR TDH fm αc
Ta NOCT Esm
0
0.5
1
1.5
2
2.5
3
3.5
-40 -30 -20 -10 0 10 20 30 40
Po
wer
pea
k (
kW
p)
Variation( %)
IWR TDH fm αC
Ta NOCT Esm

32
The total electricity production from PV system is not fully utilized by pump to meet water
requirement for irrigation. The excess of electricity varies depends on method of storage used
either to store electricity in form of water into tank or in form of chemical energy into battery.
Alternatively electricity surplus is obtained for a PVWPs directly connected to irrigation
without storages medium. In addition the difference in water consumption of crops during
their irrigation and the period in which irrigation is being made, are other two major important
factors affecting electricity production and electricity surplus. Electricity exceeded for a
PVWPs is directly proportional to the water requirements to irrigate a specific crop and it
becomes higher for crop which needs much water. A significant increases in electricity surplus
is obtained when there is no irrigation required. Even though some months do not need
electricity for pumping water but solar panel keeps producing it from the available sun energy
resource. Figure 15 presents monthly electricity surplus from three alternatives of PVWPs to
meet irrigation of coffee and cassava. A summary of total annual electricity produced is also
presented in Table 6. Due to higher storing efficiency, the PVWPs incorporating battery storage
produces a huge amount of electricity excess compared to the rests of PVWPs used. The reason
behind the difference in electricity surplus is that electricity produced from PVWPs directly
connected to irrigation is used only when water is needed and during no irrigation period, the
electricity is lost as there is no way to conserve it. On other hand low electricity surplus in
PVWPs with tank as storage is due to loss of water either by evaporation in summer or water
is freezing in tank during cold period.
Table 6. Total annual electricity surplus for PVWPs technologies.
PVWPs Technologies Total annual electricity surplus (kWh)
PVWPs equipped with tank to irrigate cassava 1013
PVWPs equipped with tank to irrigate coffee 1 672,9 PVWPs equipped with battery to irrigate cassava 2 141,8
PVWPs equipped with battery to irrigate coffee 7466
PVWP directly connected to irrigate cassava 2 197,7
PVWP directly connected to irrigate coffee 4 104,8
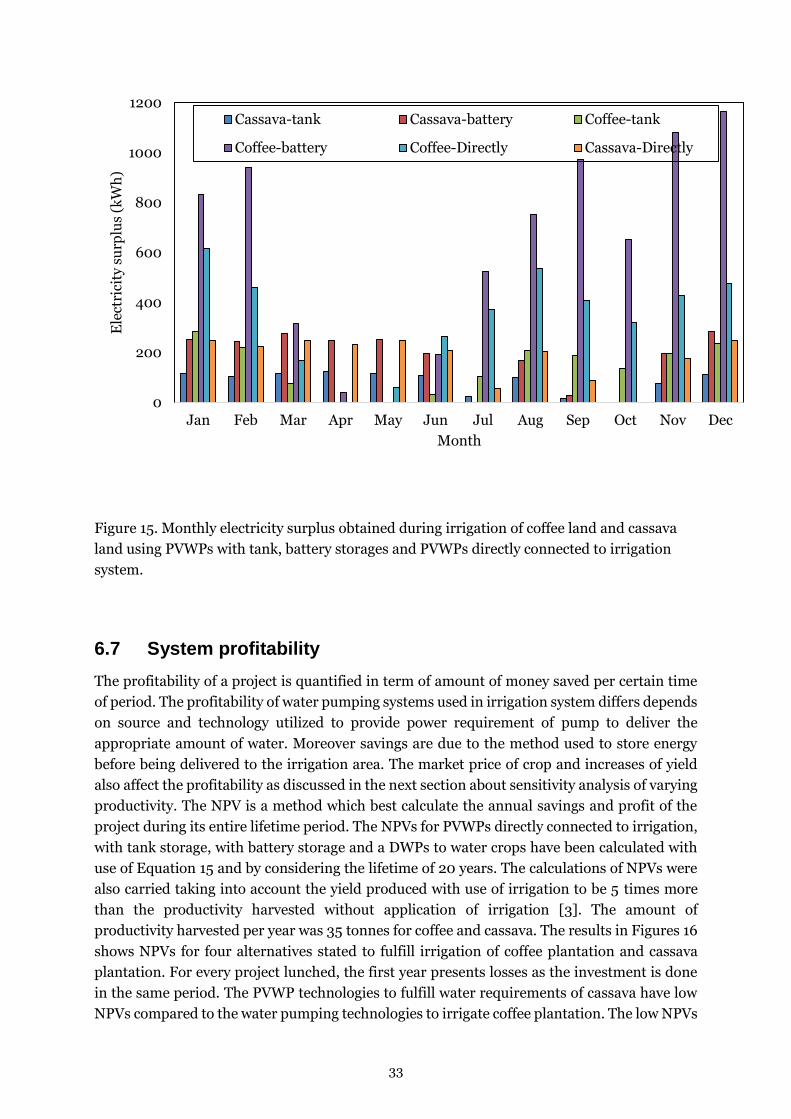
33
Figure 15. Monthly electricity surplus obtained during irrigation of coffee land and cassava
land using PVWPs with tank, battery storages and PVWPs directly connected to irrigation
system.
6.7 System profitability
The profitability of a project is quantified in term of amount of money saved per certain time
of period. The profitability of water pumping systems used in irrigation system differs depends
on source and technology utilized to provide power requirement of pump to deliver the
appropriate amount of water. Moreover savings are due to the method used to store energy
before being delivered to the irrigation area. The market price of crop and increases of yield
also affect the profitability as discussed in the next section about sensitivity analysis of varying
productivity. The NPV is a method which best calculate the annual savings and profit of the
project during its entire lifetime period. The NPVs for PVWPs directly connected to irrigation,
with tank storage, with battery storage and a DWPs to water crops have been calculated with
use of Equation 15 and by considering the lifetime of 20 years. The calculations of NPVs were
also carried taking into account the yield produced with use of irrigation to be 5 times more
than the productivity harvested without application of irrigation [3]. The amount of
productivity harvested per year was 35 tonnes for coffee and cassava. The results in Figures 16
shows NPVs for four alternatives stated to fulfill irrigation of coffee plantation and cassava
plantation. For every project lunched, the first year presents losses as the investment is done
in the same period. The PVWP technologies to fulfill water requirements of cassava have low
NPVs compared to the water pumping technologies to irrigate coffee plantation. The low NPVs
0
200
400
600
800
1000
1200
Jan Feb Mar Apr May Jun Jul Aug Sep Oct Nov Dec
Ele
ctri
city
su
rplu
s (k
Wh
)
Month
Cassava-tank Cassava-battery Coffee-tank
Coffee-battery Coffee-Directly Cassava-Directly

34
are due to the market price of cassava which is very low in comparison to that of coffee and the
higher the price on market, the more there is money earned. Furthermore higher profitability
of PVWP technologies to satisfy water needs of coffee comes from an annual electricity surplus
of about 30% more than electricity surplus from cassava and which is sold at 0.22$/kWh.
Initially, higher cost of battery storage results in higher initial investment costs of PVWPs
equipped with battery thereby making the system to be the least profitable at the first year.
However within time, PVWPs generates much money because of a huge amount of electricity
surplus during its operation. In all cases, DWPs is the least to save money and even becomes
negative for irrigation of cassava plantation. Initially DWPs can be a best option due to its
lowest investment costs. However within the system lifetime, the operation and maintenance
costs become much higher than the system using solar energy as a source of power. The PVWPs
directly connected to irrigation can also be the best option as the costs are minimized due to
the fact there is no storages medium used. However the problem for the system is to operate
only when sun is available.
Figure 16. Comparison of NPVs for PVWPs with battery and tank, PVWPs directly connected
to irrigation and DWPs to meet water requirements of coffee and cassava when production is
increased by 5times.
The NPVs for PVWPs vary depend on yields harvested. In order to see how much is the
variations in NPVs, a sensitive analysis were carried increasing the actually annual productivity
of 7tonnes by 20% and 40% respectively. Technologies such as PVWPs incorporating tank
storage, PVWPs with battery, PVWPs directly connected to irrigation and DWPs have been
considered. Moreover using all technologies, the NPVs were calculated taking into account
irrigation of both coffee and cassava plantations. The Figures 17 and 18 present the NPVs
obtained when increasing productivity by 20% and 40%. The NPVs generated from a
technology when the production is increased by 40% became higher than the NPVs obtained
when a technology is used for the yield topped up to 20%. Coffee and cassava are sold on
market at the prices of $1.4/kg and $0.02/kg respectively [50, 51]. This implies that an
-100000
-50000
0
50000
100000
150000
200000
250000
300000
350000
400000
0 1 2 3 4 5 6 7 8 9 10 11 12 13 14 15 16 17 18 19 20 21
NP
V($
)
Year
directly -coffee directly -cassava tank -coffee
tank -cassava Battery-coffee Battery-cassava
DWP-coffee DWP-cassava
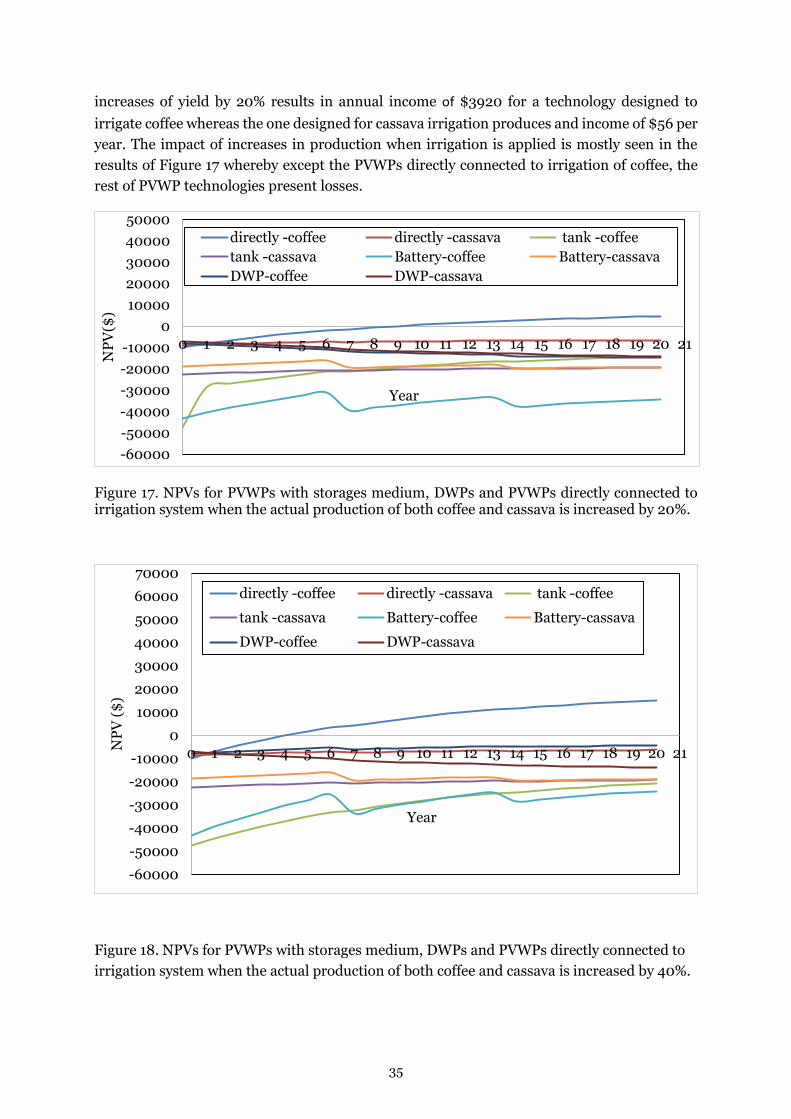
35
increases of yield by 20% results in annual income of $3920 for a technology designed to
irrigate coffee whereas the one designed for cassava irrigation produces and income of $56 per
year. The impact of increases in production when irrigation is applied is mostly seen in the
results of Figure 17 whereby except the PVWPs directly connected to irrigation of coffee, the
rest of PVWP technologies present losses.
Figure 17. NPVs for PVWPs with storages medium, DWPs and PVWPs directly connected to irrigation system when the actual production of both coffee and cassava is increased by 20%.
Figure 18. NPVs for PVWPs with storages medium, DWPs and PVWPs directly connected to
irrigation system when the actual production of both coffee and cassava is increased by 40%.
-60000
-50000
-40000
-30000
-20000
-10000
0
10000
20000
30000
40000
50000
0 1 2 3 4 5 6 7 8 9 10 11 12 13 14 15 16 17 18 19 20 21
NP
V($
)
Year
directly -coffee directly -cassava tank -coffee
tank -cassava Battery-coffee Battery-cassava
DWP-coffee DWP-cassava
-60000
-50000
-40000
-30000
-20000
-10000
0
10000
20000
30000
40000
50000
60000
70000
0 1 2 3 4 5 6 7 8 9 10 11 12 13 14 15 16 17 18 19 20 21
NP
V (
$)
Year
directly -coffee directly -cassava tank -coffee
tank -cassava Battery-coffee Battery-cassava
DWP-coffee DWP-cassava
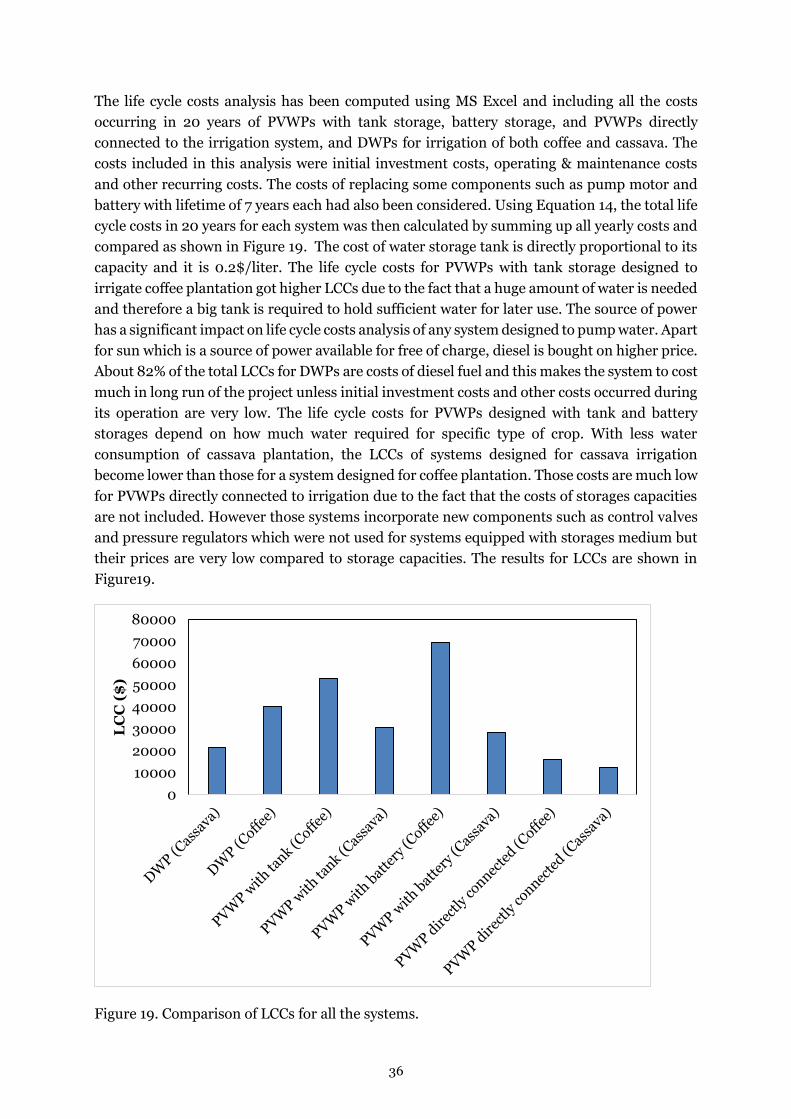
36
The life cycle costs analysis has been computed using MS Excel and including all the costs
occurring in 20 years of PVWPs with tank storage, battery storage, and PVWPs directly
connected to the irrigation system, and DWPs for irrigation of both coffee and cassava. The
costs included in this analysis were initial investment costs, operating & maintenance costs
and other recurring costs. The costs of replacing some components such as pump motor and
battery with lifetime of 7 years each had also been considered. Using Equation 14, the total life
cycle costs in 20 years for each system was then calculated by summing up all yearly costs and
compared as shown in Figure 19. The cost of water storage tank is directly proportional to its
capacity and it is 0.2$/liter. The life cycle costs for PVWPs with tank storage designed to
irrigate coffee plantation got higher LCCs due to the fact that a huge amount of water is needed
and therefore a big tank is required to hold sufficient water for later use. The source of power
has a significant impact on life cycle costs analysis of any system designed to pump water. Apart
for sun which is a source of power available for free of charge, diesel is bought on higher price.
About 82% of the total LCCs for DWPs are costs of diesel fuel and this makes the system to cost
much in long run of the project unless initial investment costs and other costs occurred during
its operation are very low. The life cycle costs for PVWPs designed with tank and battery
storages depend on how much water required for specific type of crop. With less water
consumption of cassava plantation, the LCCs of systems designed for cassava irrigation
become lower than those for a system designed for coffee plantation. Those costs are much low
for PVWPs directly connected to irrigation due to the fact that the costs of storages capacities
are not included. However those systems incorporate new components such as control valves
and pressure regulators which were not used for systems equipped with storages medium but
their prices are very low compared to storage capacities. The results for LCCs are shown in
Figure19.
Figure 19. Comparison of LCCs for all the systems.
0
10000
20000
30000
40000
50000
60000
70000
80000
LC
C (
$)

37
The time period after then a project will be financed itself, is an important factor which needs
to be taken into account. The payback periods (PBPs) for all three PVWPs alternatives in
addition to DWPs have been calculated in MS Excel using Equation 17. The results of Figure
20 show the impact of LCCs and NPVs on PBPs considering a case where annual productivity
without irrigation is increased by 40%. NPVs taken into account are a sum up of all annual
NPVs in a lifetime period of 20years. Increases of production results in additional money saved
every year as the yield is sold on market at certain price. The PBP depends on both LCCs
occurred during lifetime of the project and its annual incomes. In other word the more there is
money saved, the more the payback period of the project becomes shorter. In contrary the PBP
takes longer in case the LCCs are higher. Although water pumping technologies to water coffee
plantation cost much because of big size of systems required but annual incomes from a huge
amount of electricity surplus and higher price of coffee encompass all costs and make the
technologies to be paid back in a very short time. The PBP becomes much shorter for a PVWPs
without any storage medium because the costs of storages medium are not included in LCCs.
Figure 20. Impact of LCCs and NPVs on Payback period for different systems when actually productivity is increased by 40%.
0
5
10
15
20
25
30
35
-35000
-15000
5000
25000
45000
65000
85000
Yea
r
LC
C a
nd
NP
V($
)
LCCs NPV
PBP
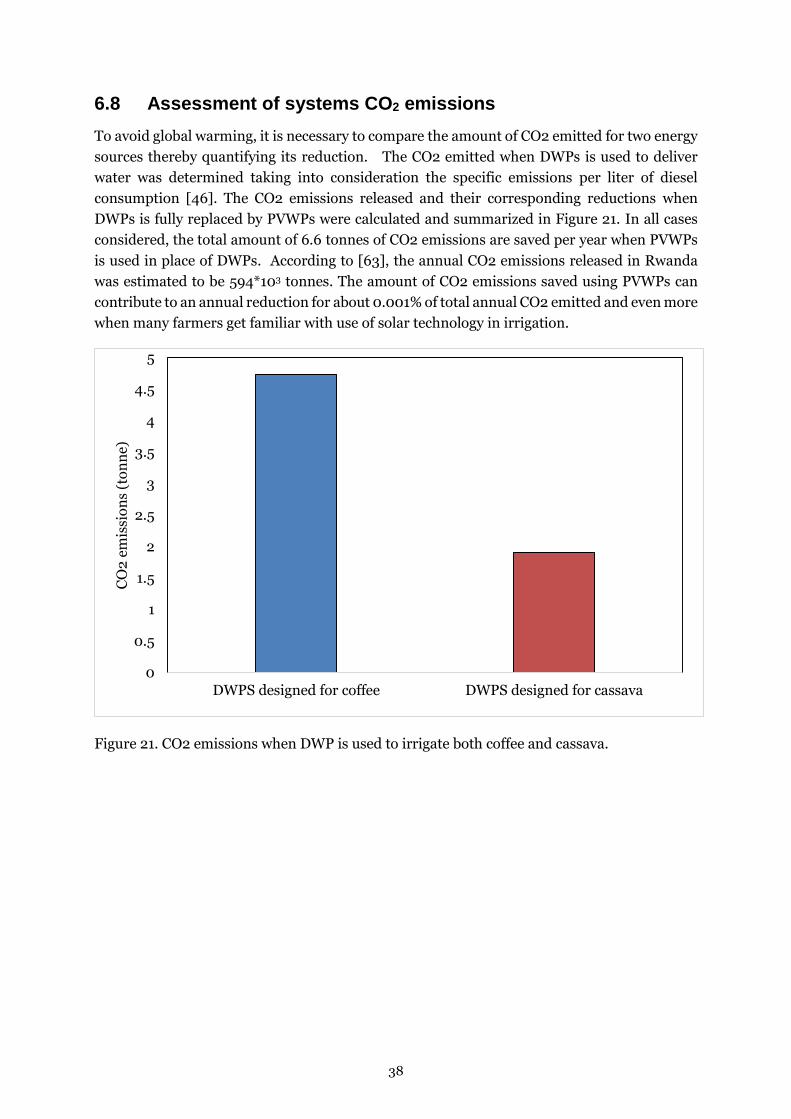
38
6.8 Assessment of systems CO2 emissions
To avoid global warming, it is necessary to compare the amount of CO2 emitted for two energy
sources thereby quantifying its reduction. The CO2 emitted when DWPs is used to deliver
water was determined taking into consideration the specific emissions per liter of diesel
consumption [46]. The CO2 emissions released and their corresponding reductions when
DWPs is fully replaced by PVWPs were calculated and summarized in Figure 21. In all cases
considered, the total amount of 6.6 tonnes of CO2 emissions are saved per year when PVWPs
is used in place of DWPs. According to [63], the annual CO2 emissions released in Rwanda
was estimated to be 594*103 tonnes. The amount of CO2 emissions saved using PVWPs can
contribute to an annual reduction for about 0.001% of total annual CO2 emitted and even more
when many farmers get familiar with use of solar technology in irrigation.
Figure 21. CO2 emissions when DWP is used to irrigate both coffee and cassava.
0
0.5
1
1.5
2
2.5
3
3.5
4
4.5
5
DWPS designed for coffee DWPS designed for cassava
CO
2 e
mis
sio
ns
(to
nn
e)

39
7 CONCLUSIONS
This thesis was focused on design and optimization of a cost effective of PVWPs considering
different alternatives such as: PVWPs with storage tank, battery storage and PVWPs directly
connected to irrigation system without storage medium. The PVWPs were designed to fulfil the
irrigation water requirements of coffee and cassava cultivated on two different location and
marked out by an irrigated area of 5 hectares each. The irrigation method used to water the
crops was drip irrigation due to its higher efficiency both in terms of water saving and energy
consumption. MS Excel was used mainly for the design of PVWPs directly connected to
irrigation, economic analysis, evaluation of CO2 emission and reduction, design of drip
irrigation system and calculations of different parameters. The water requirements for two
crops were obtained from CROPWAT software. Other tool which was utilized is PVsyst to
determine meteorological data of Kampala (Uganda), the region which was taken into
consideration. After making sure that solar is available enough to provide energy requirements
of pump, the same tool of PVsyst was also used to design and simulate a PVWPs with tank and
battery storages. During design and simulation in PVsyst, solar irradiation and energy surplus
for PVWPs equipped with both tank and battery storages were obtained and compared when
solar panel is mounted on fixed tilt and tracking system. Electricity surplus produced from all
the alternatives stated above were determined and discussed. In terms of economy LCCs, NPV,
and PBP were analyzed comparing all the PVWPs with DWPs. Finally CO2 emissions from
DWPs and their corresponding reductions when DWPs is fully replaced by PVWPs were
determined and discussed. In brief, the main findings are summarized here below:
Two factors need to be properly investigated in order to optimize the energy from
available sun resource. Those include the optimum tilt angle which is the angle
determined by the latitude of the region under consideration and temperature of the
PV modules which affects the performance of solar modules. Apart for tilt angle and
temperature of PV modules, the power peak production of PVWPs directly connected
to irrigation system is affected by different parameters and it changes depends on how
much those parameters are varied.
The energy produced and exceeded depends on how big is the size of the PVWPs. The
size of PVWPs in turn is determined based on type of crop to be irrigated and its water
requirements. The highest energy production and surplus was obtained for PVWPs
designed to irrigate coffee plantation while it becomes lower for PVWPs designed for
cassava plantation.
Market price of crop to be irrigated, increases of productivity and electricity surplus
from a PVWPs are the most three important factors which impact the profitability both
in terms of money savings and time period after then a system can finance itself. In all
systems designed for irrigation of coffee and cassava, DWPs showed to have lower
profitability and becomes even negative for cassava irrigation.
Even though PVWPs directly connected to irrigation system needs to operate only when
sun is available, it has been selected to be the best configuration due to its low initial
investment costs, high NPVs and short PBP.
Fully replacement of DWPs by PVWPs results in CO2 emissions reduction of about
6.6tonnes.
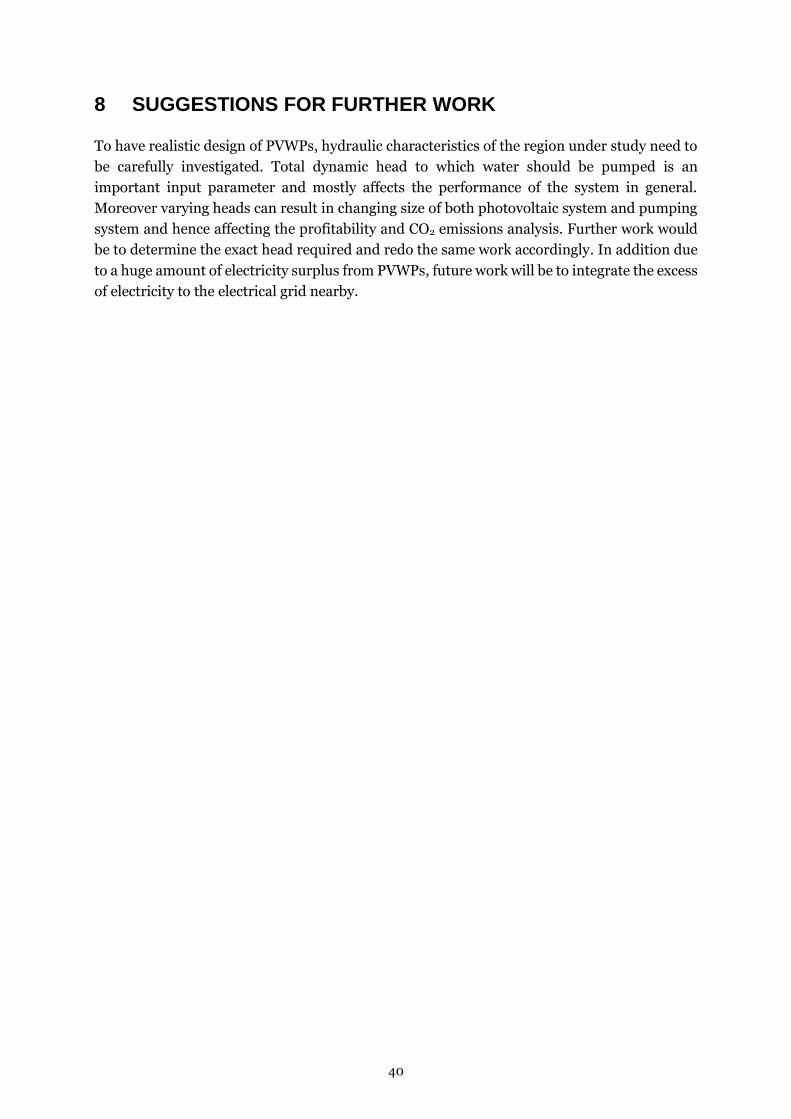
40
8 SUGGESTIONS FOR FURTHER WORK
To have realistic design of PVWPs, hydraulic characteristics of the region under study need to
be carefully investigated. Total dynamic head to which water should be pumped is an
important input parameter and mostly affects the performance of the system in general.
Moreover varying heads can result in changing size of both photovoltaic system and pumping
system and hence affecting the profitability and CO2 emissions analysis. Further work would
be to determine the exact head required and redo the same work accordingly. In addition due
to a huge amount of electricity surplus from PVWPs, future work will be to integrate the excess
of electricity to the electrical grid nearby.
41
REFERENCES
[1]U.S.Department of Energy, 2014, the water energy nexus: challenges and opportunities
[2]Food and Organization of the United Nations, 2014, the water-food- energy nexus
[3]MAIMBO Mabanga Malesu, 2010, Rwanda Irrigation Master Plan, World Agroforestry
Centre (ICRAF)
[4]Andreas P.SAWA, Karen FRENKEN, 2001, Irrigation Development: a Multifaceted
Process, Social, Economic, Engineering, Agronomic, Health and Environmental Issues to be
considered in a Feasibility study, Irrigation Manual, Module 1.
[5]T.Khatib, 2010, Design of Photovoltaic water pumping system at minimum cost for
Palestine: A Review
[6]M.Abu-Aligah, 2011, Design of Photovoltaic Water Pumping System and Compare it to
Diesel Powered Pump, Jordan Journal of Mechanical and Industrial Engineering, volume 5,
pp 273-280
[7]Bardi, U., El Asmar, T. &Lavacchi, A., 2013, agriculture can be powered by renewable
energy resources.
[8] Overview of renewable energy and energy efficiency
http://africa-toolkit.reeep.org/modules/Module1.pdf, 2015-04-03
[9]B.Kavitha, S.Karthikeyan, B.Iswarya, 2014, Design of solar PV water pumping system
using BLDC drive using sensorless method.
[10]Fabien Twagiramungu, 2006, Environmental Profile of Rwanda
[11] National Institute of Statistics of Rwanda (NISR), 2013, Seasonal Agricultural Survey
Report
[12]IPAR Rwanda Report, 2009, Rwanda Agriculture Sector Situation Analysis
[13]Brian Harding, 2009, Review of the Economic Impacts of Climate Change in Kenya,
Rwanda and Burundi.
[14]Nang Saw Yuzana Kyaing, 2011, Design considerations of PV water pumping and rural
electrification in lower Myannar
https://www.gafspfund.org/sites/gafspfund.org/files/Documents/Rwanda_StrategicPlan.pd
f, agriculture sector, 2015-05-17
[15]ttp://www.1001worldmap.com/map-of-rwanda/

42
[16]Ministry of Agriculture and Animal Resources, Republic of Rwanda, Strategic Plan for the
Transformation of Agriculture in Rwanda-Phase II (PSTAII), 2009, Final report
[17]Eline Boelee, Henry Madsen, 2006, Irrigation and Schistosomiasis in Africa: Ecological
Aspects, Research Report 99
[18]http://css.wsu.edu/wp-content/uploads/2012/09/L_James_Ch21.pdf, Farm Irrigation
Systems and System Design Fundamentals, 2015-05-17
[19]http://css.wsu.edu/wp-content/uploads/2012/09/L_James_Ch21.pdf, Farm Irrigation
Systems and System Design Fundamentals, 2015-05-17
[20]http://www.jains.com/irrigation/popups%20and%20sprinklers/sprinklersystems.htm
[21]Reuben M.J.Kadigi, GirmayTesfay, Alfred Bizoza, Genet Zinabou, 2013, Irrigation and
Water Use Efficiency in Sub-Saharan Africa, Working Paper No.63
[22] NaanDanJain Brazil, 2009, Drip Irrigation for Coffee Plantations: Feasible and
Profitable http://www.naandanjain.com/uploads/catalogerfiles/coffee-2/Coffee-
dripirrigation.pdf, 2015-03-25.
[23]http://www.jains.com/irrigation/drip%20irrigation%20system.htm
[24]http://www.minagri.gov.rw/fileadmin/user_upload/documents/Tenders/Concept_note
_and_Terms_of_Reference_for_Irrigation_expert_-
TA_DFID_fund_CORRECT_Document.pdf, Irrigation and Mechanization, 2015-04-27
[25]Derrel .L.Martin, 2011, Evaluation Energy use for pumping irrigation water
[26]Tamara Jackson, 2009, an appraisal of the on-farm water and energy nexus in irrigated
agriculture, a thesis submitted to Charles Sturt University for the degree of Doctor of
Philosophy
[27]Mahir DURSUN, Semih OZDEN, 2012, Application of Solar Powered Automatic
Pumping in Turkey, International Journal of Computer and Electrical Engineering, vol4,
No2, April, 2012
[28]Luisa F. Cabeza (Spain), K.G.Terry Hollands (Canada), Arnulf Jäger-Waldau
(Italy/Germany), Michio Kondo (Japan), Chalres Konseibo (Burkina Faso), Valentin
Meleshko (Russia), Wesley Stein (Australia), Yutaka Tamaura (Japan), Honghua Xu (China),
Roberto Zilles (Brasil), 2011, Direct Solar Energy, Chapter 3.
[29] Mark Hankins, 2009, Rwanda’s solar Market
[30]Ulrich Elmer Hansen, 2014, Prospects for investment in large-scale, grid-connected solar
power in Africa
[31]Esdras Nshimyumuremyi, 2015, Solar Water Pumping System in Isolated Area to
Electricity: The Case of Mibirizi Village (Rwanda)

43
[32]Gasore Geoffrey, Munyaneza Jean de Dieu, Ngendabanga Jean Pierre, Twibanire
Aimable, 2015, Design of Automatic Irrigation System for Small Farmers in Rwanda.
[33]Y. Fan, H. Li, G. Miguez-Macho, “Global patterns of groundwater table
Depth”, Science, vol. 339, p. 940–943, 2013
[34]Christian Kwaku Amuzuvi, Emmanuel Effah, 2014, Design of a photovoltaic system as an
alternative source of electrical energy for powering the lighting circuits for premises in Ghana,
Journal of Electrical and Electronic Engineering, Vol.2, No.1, 2014,p9-16.
[35]http://software.informer.com/search/CROPWAT
[36] K.G.Mansaray, 2009, Optimum Design of Solar Photovoltaic Pumping System by
Computer Simulation, International Journal of Engineering Technology and Advanced
Engineering, Volume 4, Issue 9, September 2014.
[37] M.Prins, 2001, Irrigation Water Management: Irrigation Method
[38] Jean Niyongabo, 2004, Where Sustainable Agriculture means Agricultural Productivity?
The case study of Gikongoro in Southern Rwanda
[39] Robert Nyamvumba, 2014, Expression of interest for Scaling up Renewable Energy
Program (SREP) Financing for Energy Projects in Rwanda
[40]Oko COC and Ogoloma OB, 2011, Generation of Typical Meteorological Year for Port
Hardcourt Zone. Journal of Engineering Science and Technology, 6(2):204-214
[41]Nang Saw Yuzana Kyaing, 2011, Design considerations of PV water pumping and rural
electrification in lower Myannar
[42] Gain-Angee Migan, 2013, Study of the operating temperature of a PV module
[43]Muhammad Ashraf, 2012, Design of Drip Irrigation System, pp
[44]Seleshi Bakele Awulachew, Philippe Lemperiere, Taffa Tulu, 2009, Irrigation methods:
Drip irrigations for smallholders
[45]Technical manual for affordable micro-irrigation technology (AMIT),
http://www.siminet.org/images/pdfs/technical-manual.pdf, 2015-04-01
[46]Emil Nilson, Milos Jacksic, Diana Osta, Roje Torsian, Tobias Jahn, 2015, Solar-Driven
Irrigation in Dhulghat, India; Project 3.7, Sustainable Energy Systems-Advanced studies.
[47]http://people.exeter.ac.uk/TWDavies/energy_conversion/Calculation%20of%20CO2%2
0emissions%20from%20fuels.htm, calculation of CO2 emissions, 2015-05-02
[48]Pietro Elie Campana, 2013, PV water pumping systems for grassland and farmland
conservation, Licentiate Theses, No 172
[49] Dimitry Mindlin, 2013, Present Values, Investment Returns and Discount Rates, ASA,
MAA, PhD, CDI Advisors LLC.

44
[50]http://www.theigc.org/wp-content/uploads/2015/02/Macciavello-and-Morjaria-2015-
Project-Memo.pdf, 2015-04-22.
[51] http://www.asareca.org/researchdir/FILES/NPPFULLCASSAVA.PDF, 2015-04-22
[52]http://www.theeastafrican.co.ke/news/Rwanda-to-lower-power-tariff-for-industries/-
/2558/2406242/-/fa5dhi/-/index.html, Rwanda to lower power tariff for industries, 2015-04-
22
[53]J.I.Sodiki et al., 2014, Solar-Powered Groundwater Pumping Systems for Nigerian Water
Sheds, Vol.4, No.2
[54]Hamed ALLaham, A-K. Hamid, Ali Cheaitou, 2014, Technical and Econmic Analysis of
Photovoltaic System Applied to UAE Data Centre
[55]Arnulf-Waldau, 2013, PV Status Report
[56]Matthew Bates, Bryan Pon, Anna Petersons, 2009, Irrigated Agriculture in Djibouti: An
Economic and Physical Analysis of Irrigation Systems
[57]https://www.google.se/?gfe_rd=cr&ei=yGw3VZP9DcqCZIGMgNgE&gws_rd=ssl#q=typ
es+of+water+storage+tank,pdf&start=0, Chapter VI, Water storage tanks, 2015-05-22
[58]http://www.nswfarmers.org.au/__data/assets/pdf_file/0007/35854/Energy-Irrigation-
Diesel-versus-electric-pumps.pdf, Diesel versus electric pump, 2015-04-22
[59] Antoni C.Jimenez, Tom Lawand, 2000, Renewable Energy for Rural School, book.
[60]http://ocw.tudelft.nl/fileadmin/ocw/courses/SolarCells/res00029/CH9_Photovoltaic_s
ystems.pdf, Miron Zeman, Photovoltaic Systems, chapter 9, Delt University of Technology,
2015-05-21
[61]Michael G. Thomas, 1996, Water pumping: The solar alternative
[62]https://www.nswfarmers.org.au/__data/assets/pdf_file/0011/35858/Energy-
Irrigation-Solar-PV-pumping-systems.pdf, 2015-05-23
[63]http://en.wikipedia.org/wiki/List_of_countries_by_carbon_dioxide_emissions, List of
countries by 2010 CO2 emissions, 2015-05-02

45
APPENDIX
Appendix 1. Rwanda groundwater level
Without hydrological data provided, it is difficult to know the exact depth of water for a given
region. However the groundwater map can give an indication on how to make assumptions. As
it is seen in figure below, Rwandan groundwater seems to be situated on higher height below
the surface and this could prevent the pump from meeting the water demand due to higher
pressure head requirement.

Box 883, 721 23 Västerås Tel: 021-10 13 00 Box 325, 631 05 Eskilstuna Tel: 016-15 36 00
Email: [email protected] Web: www.mdh.se
Related Documents