This article appeared in a journal published by Elsevier. The attached copy is furnished to the author for internal non-commercial research and education use, including for instruction at the authors institution and sharing with colleagues. Other uses, including reproduction and distribution, or selling or licensing copies, or posting to personal, institutional or third party websites are prohibited. In most cases authors are permitted to post their version of the article (e.g. in Word or Tex form) to their personal website or institutional repository. Authors requiring further information regarding Elsevier’s archiving and manuscript policies are encouraged to visit: http://www.elsevier.com/copyright

Welcome message from author
This document is posted to help you gain knowledge. Please leave a comment to let me know what you think about it! Share it to your friends and learn new things together.
Transcript

This article appeared in a journal published by Elsevier. The attachedcopy is furnished to the author for internal non-commercial researchand education use, including for instruction at the authors institution
and sharing with colleagues.
Other uses, including reproduction and distribution, or selling orlicensing copies, or posting to personal, institutional or third party
websites are prohibited.
In most cases authors are permitted to post their version of thearticle (e.g. in Word or Tex form) to their personal website orinstitutional repository. Authors requiring further information
regarding Elsevier’s archiving and manuscript policies areencouraged to visit:
http://www.elsevier.com/copyright

Author's personal copy
Nuclear Engineering and Design 240 (2010) 1433–1442
Contents lists available at ScienceDirect
Nuclear Engineering and Design
journa l homepage: www.e lsev ier .com/ locate /nucengdes
Design of transition cores of RSG GAS (MPR-30) with higher loading silicide fuel
Liem Peng Honga,∗, Tagor Malem Sembiringb
a Research Laboratory for Nuclear Reactors, Tokyo Institute of Technology, O-okayama, Meguro, Tokyo 152-8550, Japanb Center for Reactor Technology and Nuclear Safety, National Nuclear Energy Agency (Batan), Puspiptek, Serpong, Tangerang 15310, Indonesia
a r t i c l e i n f o
Article history:Received 23 July 2009Received in revised form 12 January 2010Accepted 18 January 2010
a b s t r a c t
A procedure of designing transition cores to achieve the equilibrium silicide core of RSG GAS with higherfuel loading of 300 g U/fuel element (FE) (meat density of 3.55 g U/cm3) has been proposed. In the proposedprocedure, the EOC excess reactivity of each transition core is minimized in order to satisfy the safetydesign limit of one-stuck-rod sub-criticality margin while keeping the maximum of radial power peakingfactor below the allowable value. Under the design procedure, the initial fuel loadings are increasedgradually in two steps, i.e. from 250 to 275 g U/FE followed by 275–300 g U/FE. The analysis results showthat all transition cores can satisfy all design requirements and safety limits. We concluded that theobtained transition core design should be adopted into the future core conversion program of RSG GAS.The targeted silicide core can be achieved practically in at least 24 transition cores.
© 2010 Elsevier B.V. All rights reserved.
Contents
1. Introduction . . . . . . . . . . . . . . . . . . . . . . . . . . . . . . . . . . . . . . . . . . . . . . . . . . . . . . . . . . . . . . . . . . . . . . . . . . . . . . . . . . . . . . . . . . . . . . . . . . . . . . . . . . . . . . . . . . . . . . . . . . . . . . . . . . . . . . . . . . 14332. Reactor description and present status of core conversion program . . . . . . . . . . . . . . . . . . . . . . . . . . . . . . . . . . . . . . . . . . . . . . . . . . . . . . . . . . . . . . . . . . . . . . . . . . . . . . . 14343. Design objectives, constraints and procedure . . . . . . . . . . . . . . . . . . . . . . . . . . . . . . . . . . . . . . . . . . . . . . . . . . . . . . . . . . . . . . . . . . . . . . . . . . . . . . . . . . . . . . . . . . . . . . . . . . . . . . . 1435
3.1. Design objective and constraints . . . . . . . . . . . . . . . . . . . . . . . . . . . . . . . . . . . . . . . . . . . . . . . . . . . . . . . . . . . . . . . . . . . . . . . . . . . . . . . . . . . . . . . . . . . . . . . . . . . . . . . . . . . . . 14353.2. Design procedure of transition core. . . . . . . . . . . . . . . . . . . . . . . . . . . . . . . . . . . . . . . . . . . . . . . . . . . . . . . . . . . . . . . . . . . . . . . . . . . . . . . . . . . . . . . . . . . . . . . . . . . . . . . . . . 14363.3. Computational method and codes . . . . . . . . . . . . . . . . . . . . . . . . . . . . . . . . . . . . . . . . . . . . . . . . . . . . . . . . . . . . . . . . . . . . . . . . . . . . . . . . . . . . . . . . . . . . . . . . . . . . . . . . . . . 1438
4. Results and discussions . . . . . . . . . . . . . . . . . . . . . . . . . . . . . . . . . . . . . . . . . . . . . . . . . . . . . . . . . . . . . . . . . . . . . . . . . . . . . . . . . . . . . . . . . . . . . . . . . . . . . . . . . . . . . . . . . . . . . . . . . . . . . . 14395. Summary . . . . . . . . . . . . . . . . . . . . . . . . . . . . . . . . . . . . . . . . . . . . . . . . . . . . . . . . . . . . . . . . . . . . . . . . . . . . . . . . . . . . . . . . . . . . . . . . . . . . . . . . . . . . . . . . . . . . . . . . . . . . . . . . . . . . . . . . . . . . . 1442
References . . . . . . . . . . . . . . . . . . . . . . . . . . . . . . . . . . . . . . . . . . . . . . . . . . . . . . . . . . . . . . . . . . . . . . . . . . . . . . . . . . . . . . . . . . . . . . . . . . . . . . . . . . . . . . . . . . . . . . . . . . . . . . . . . . . . . . . . . . . 1442
1. Introduction
One research activity with high priority in the Center for Mul-tipurpose Reactor, National Nuclear Energy Agency (Batan), is the30 MWth Reaktor Serba Guna G.A. Siwabessy (RSG GAS, previousname MPR-30) core conversion program from oxide to silicide fuel.Among other advantages of silicide fuel, its higher loading of fissilematerial is expected to increase the operation cycle; hence, higherreactor availability and utilization can be achieved while the fuelcost can be reduced (Arbie, 1996).
The roadmap of the core conversion program is illustrated inFig. 1. When the reactor was commissioned in 1987, the reac-tor used low enriched uranium (LEU, enrichment 19.75 w/o, fuel
∗ Corresponding author. Present address: NAIS Co., Inc., 416 Muramatsu, Tokai-mura, Naka-gun, Ibaraki 319-1112, Japan. Tel.: +81 29 2705000;fax: +81 29 2705001.
E-mail address: [email protected] (P.H. Liem).
meat density 2.96 g U/cm−3) oxide fuel with 250 g 235U loadingper fuel element. In 1998, the design procedure and fuel man-agement strategy were established (Liem et al., 1998) for higherloading silicide cores. In this particular work, a completely newfuel management strategy of the equilibrium silicide cores (alsocalled typical working core, TWC) with higher fuel loadings of 300 g235U/FE (meat density 3.55 g U/cm−3) and 350 g 235U/FE (meat den-sity of 4.15 g U/cm−3) was proposed and investigated, and as aresult, significantly longer core life times can be achieved. The newfuel management strategy of the silicide cores requires only 5 newfuel elements (FE) and one control element (CE) at the beginning ofcycle (BOC) while the original oxide core requires 6 new FEs and 1or 2 CEs. The results of this work become the milestones (Stages 5and 6) for the core conversion program as highlighted in Fig. 1. Inaccordance with the core conversion program, research and devel-opment programs in the Nuclear Fuel Element Development Centerof the Agency are being conducted. Mini and full scale experimen-tal silicide fuel elements manufactured by the Center have beenirradiated in the RSG GAS and examined for safety and licensing
0029-5493/$ – see front matter © 2010 Elsevier B.V. All rights reserved.doi:10.1016/j.nucengdes.2010.01.028

Author's personal copy
1434 P.H. Liem, T.M. Sembiring / Nuclear Engineering and Design 240 (2010) 1433–1442
Fig. 1. Roadmap of core conversion program (circles and triangles represent stages of equilibrium and non-equilibrium cores, respectively; white, black and grey coloursindicate oxide core, silicide core and oxide-silicide mixed core; solid line arrows and dashed line arrows indicate past history and future plan, respectively, present status isindicated by circle no. 3; n FE m CE denote number of fresh fuel elements and control elements loaded at BOC, respectively).
procedures. Referring to the roadmap, at present, the oxide core(250 g U/FE) has been completely converted into a silicide core withthe same fuel loading (i.e., 250 g U/FE; Stage 3 in Fig. 1). The nextimportant task, which is the main topic of the present paper, is toestablish the fuel management strategy for the transition silicidecores which must fulfil all design objectives and safety limitationsalready imposed to RSG GAS design.
The paper is organized as follows. In Section 2, the outline ofRSG GAS and the present status of the core conversion program arebriefly described to provide adequate information for the bases oftransition core design. Section 3 discusses the design objectives,constraints, procedures as well as numerical tools adopted in thepresent design. Section 4 presents the results of the higher loadingsilicide transient cores obtained, and in Section 5, the summary ofthe present work is discussed.
2. Reactor description and present status of coreconversion program
RSG GAS (Batan, 1987) is a Be-reflected, light-water-moderatedand -cooled, 30 MWth (max.) multi-purpose reactor. The core andreflector configuration and the reactor main data (when the reactorwas commissioned in 1987) are shown in Fig. 2 and Table 1, respec-tively. Originally, the core used MTR-type LEU (19.75 w/o) oxidefuel elements (FEs). On the 10 × 10 core grid positions there were 40standard FEs (each consisting of 21 fuel plates as depicted in Fig. 3),8 control elements (CEs, each consisting of 15 fuel plates as depictedin Fig. 4) initially loaded with 250 and 178.6 g 235U respectively, Bereflector elements, and other irradiation facilities. This fuel loadingcorresponds to a uranium meat density of 2.96 g U/cm3. The orig-inal nominal core cycle is 25 days or equivalent to 750 MWD percycle. The equilibrium core is divided into seven burn-up classeswith an average burn-up step of approximately 8% loss of 235U.
As mentioned above, at present, the oxide core has been com-pletely converted into a silicide core using the same uranium fuelloading (250 g U/FE) under the new fuel management strategy. Asshown in Fig. 2 and Table 2, under the new fuel management strat-egy, the 40 FEs and 8 CEs are grouped into eight burn-up classes(batches or zoning). Consequently, at BOC 5 fresh FEs and 1 freshCE are loaded after discharging the same number of old FEs andCE from the core. This refuelling/reshuffling scheme adopted canbe categorized as scatter loading, with the expectation of obtain-ing a rather flat power distribution. Operational data show that thenew fuel management strategy is effective and the equilibrium con-
ditions of the silicide core have been practically attained. Table 3summarizes the differences of core characteristics of the originaloxide core (250 g U/FE) under the original fuel management strat-egy, and the new equilibrium silicide cores with fuel loadings of300 g U/FE under the new fuel management strategy. Table 4 showsthe reactivity balances for the original oxide core (250 g U/FE) andthe new equilibrium silicide cores with fuel loadings of 300 g U/FEwhile Table 5 gives the check result of the one-stuck-rod sub-criticality of the new equilibrium silicide cores with fuel loadingsof 300 g U/FE.
At present, the core conversion program of RSG GAS has reachedStage 3, where the oxide core has been completely converted to anequilibrium silicide core with the same (250 g U/FE) fuel loading.
Fig. 2. Core-reflector configuration of RSG GAS with burn-up class (for the newsilicide core) in the second rows (FE: fuel element, CE: control element, BE: Bereflector element, BS+: Be reflector element with plug, IP: irradiation position, CIP:central irradiation position, PNRS: pneumatic rabbit system, HYRS: hydraulic rabbitsystem).

Author's personal copy
P.H. Liem, T.M. Sembiring / Nuclear Engineering and Design 240 (2010) 1433–1442 1435
Table 1Reactor main design data of RSG GAS (original oxide core).
GeneralReactor type Pool typeFuel element type LEU oxide MTRCooling system Forced convection
Down flowModerator/coolant H2OReflector Be and H2ONominal power (MWt) 30
Core characteristicsNo. of fuel elements 40No. of control elements 8No. of fork type absorber (pairs) 8Nominal cycle length (fpd) 25Ave. burn-up at BOC (% loss of 235U) 23.3Ave. burn-up at EOC (% loss of 235U) 31.3Ave. discharge burn-up at EOC (% loss of 235U) 53.7
Fuel/control elementsFuel/control element dimension (mm) 77.1 × 81 × 600Fuel plate thickness (mm) 1.3Coolant channel width (mm) 2.55No. of plate per fuel element 21No. of plate per control element 15Fuel plate clad material AlMg2
Fuel plate clad thickness (mm) 0.38Fuel meat dimension (mm) 0.54 × 62.75 × 600Fuel meat material U3O8AlU-235 enrichment (w/o) 19.75Uranium density in meat (g/cm3) 2.96U-235 loading per fuel element (g) 250U-235 loading per control element (g) 178.6Absorber meat material Ag–In–CdAbsorber thickness (mm) 3.38Absorber clad material SUS-321Absorber clad thickness 0.85
Reactivity values (%)Excess reactivity at BOC Cold, w/o xenon 9.2Reactivity reserve for movable experiment 2.0Reactivity worth of control rods (8) −14.5Shut-down reactivity at BOC, cold, w/o xenon (8
control rods inserted)−5.3
Shut-down reactivity at BOC, cold, w/o xenon stuckrod (7 control rods inserted)
−2.2
Max. controlled reactivity insertion rate (including15% safety margin) (��, s)
2.8 × 10⁻⁴
Kinetic characteristics (BOC)Fuel temperature coefficient (��, K) −1.6 × 10⁻⁵
Moderator temperature coefficient (��, K) −1.1 × 10⁻⁴
Moderator void coefficient (��, % void) −1.2 × 10⁻³
Delayed neutron fraction 0.0071Lifetime for prompt fission neutron (�s) 61.3
As will be shown later, altering the strategy from 6 FEs + 1 or 2CEs to 5 FEs + 1 CE while maintaining the fuel loading (250 g U/FE)forced the core cycle length to be shorter (about 22.5 days, i.e.2.5 days shorter) and the EOC excess reactivity is also slightlylower. However, one should note that under the new strategy, thenumber of FEs and CE required at BOC of each cycle is lower anda true equilibrium core can be achieved. This present equilibriumsilicide core consequently will be taken as the initial condition forall transient cores analyses in the present work.
Referring again to the roadmap of the core conversion program(Fig. 1), there are two scenarios available to achieve the equilib-rium silicide cores with higher fuel loadings. For both scenarios,we decided to allow transition cores loaded with FEs and CEs withdifferent fuel loadings so that the core dimension, irradiation holesand facilities, and neutron flux level can be kept practically thesame. These cannot be realized if we choose to have transition coreswith only new and higher loading of FEs and CEs, since we have tostart with smaller core dimensions. On top of that, under the twoscenarios, there is no partly burnt FE or CE would be wasted, sinceall FEs and CEs burnt in the core at present will be used for operating
Table 2Reshuffling and refueling strategy for the silicide equilibrium cores (Stages 2–6) ofRSG GAS (also used for transition cores under Scenario 1 or 2).
From To From To From To
H-9 F-10 F-5 F-8 C-7 B-8H-8 C-4 F-4 F-6 C-6 G-5H-7 F-7 F-3 C-10 C-5 D-4H-6 D-10 E-10 B-4 C-4 D-5H-5 E-5 E-9 G-6 C-3 H-8H-4 F-9 E-8 D-3 B-9 C-9G-9 E-8 E-5 A-8 B-8 outG-8 out E-3 A-7 B-7 outG-6 B-7 D-10 G-4 B-5 outG-5 G-8 D-8 out B-4 A-6G-4 C-7 D-5 H-5 A-9 A-4F-10 G-9 D-4 E-9 A-8 B-5F-9 A-5 D-3 C-6 A-7 H-7F-8 C-5 C-10 E-3 A-6 B-9F-7 F-4 C-9 D-8 A-5 H-6F-6 out C-8 F-5 A-4 E-10
the transition cores. Here, we limit our discussion to the fuel loadingof up to 300 g U/FE. In Scenario 1, the fuel loading for the transitioncores is gradually increased in two steps, i.e. 275 g U/FE and finally300 g U/FE, while in Scenario 2, the fuel loading is increased directlyto 300 g U/FE. Both scenarios will be investigated and the optimalone will be adopted in the core conversion program.
3. Design objectives, constraints and procedure
From the economic and licensing points of view, the core con-version program puts rather strict limitations on the silicide coredesign, namely, that no major modification of the reactor bal-ance of plant and core main structural components should occur.Consequently, several useful design parameters cannot be freelymanipulated to obtain the silicide transition cores.
3.1. Design objective and constraints
As in our previous work for designing the equilibrium silicidecore (Liem et al., 1998) the main design objective for the new silicidecore of RSG GAS was to maximize the core cycle length withoutviolating the following important constraints:
1. No major modification to the reactor balance of plant, shield-ing, core main structural components, and civil buildings maybe made.
2. The number as well as the performance of irradiation positionsand facilities must be maintained.
Table 3Comparison of the fuel burn-up characteristics between the original oxide core(250 g U/FE, Stage 1) and the silicide equilibrium core (300 g U/FE, Stage 5).
Description BOC EOC
Oxide Silicide Oxide Silicide
No. of FE loaded per cycle 6 5 – –No. of CE loaded per cycle 1 or 2 1 – –Core cycle length (days) 25 32.5In-core 235U mass (kg) 8.6 9.3 7.8 8.2In-core U mass (kg) 55.3 65.2 54.4 64.0Core-ave. fuel burn-up (GWD/THM) 36.6 52.6 49.5 66.6Core-ave. fuel burn-up (% loss of 235U) 23.3 32.2 31.4 40.5Max. FE burn-up (% loss of 235U) – – 53.9 68.2Max. CE burn-up (% loss of 235U) – – 55.4 71.1Core-averaged 235U fuel enrich. (w/o) 15.8 14.3 14.4 12.7In-core Pu mass (kg) 0.21 0.37 0.28 0.45Core-averaged fissile Pu fuel enrich. (w/o) 87.8 85.1 86.3 83.6Max. radial fuel element channel factor 1.29 1.27 1.29 1.28

Author's personal copy
1436 P.H. Liem, T.M. Sembiring / Nuclear Engineering and Design 240 (2010) 1433–1442
Fig. 3. RSG GAS standard fuel element (unit mm).
3. The existing one-stuck-rod (OSR) sub-criticality margin andthermal–hydraulic safety requirements must be fulfilled.
4. Maximum discharge burn-up is limited to around 70% for licens-ing purposes (however, recent experimental data show highervalues are acceptable).
The objective of the transition core design is to achieve the equi-librium cores with smallest number of transition cores. The abovementioned design constraints will also be imposed to the present
Table 4Reactivity balances for the original oxide (250 g U/FE, Stage 1) and the silicide equi-librium cores (300 g U/FE, Stage 5) of RSG-GAS.
Reactivity balance (%) Oxide 2.96 gU/cm3 25 days750 MWD
Silicide 3.55 gU/cm3 32.5days 975 MWD
�� hot to cold 0.3 0.70a
�� equilibrium xenon poisoning 3.5 3.70�� burn-up 3.0 3.77�� for exp., partial Xe override, etc. 2.4 1.07Core excess reactivity 9.2 9.24Total shutdown reactivity −14.5 −13.05
−5.3 −3.81One stuck rod reactivity 3.1 2.78One stuck rod shutdown reactivity margin −2.2 −1.03
a Be positive temperature reactivity feedback is not included.
transition core design. The first constraint, which arises from eco-nomic considerations, includes the use of the existing design ofFE, CE and Ag–In–Cd control rods. In the original oxide core, theeight control rods (with fresh absorber blades) have a total reac-tivity worth of around 14.5% while in our previous work (Liem etal., 1998) shows that the worth decreased slightly as the neutronspectrum in the silicide core becomes harder.
The second constraint prevents the reduction of the number ofcentral irradiation position (CIP) and irradiation positions (IP), sincein those locations irradiation and other facilities have been installedand operated. In addition, the position of other irradiation facilities(PRTF, rabbit systems) outside the core must also be maintained.
The third constraint, in fact, is not imposed solely on the silicidecore design but also for the original oxide core design. Therefore, thesame thermal design procedure as in the original oxide core can beadopted without significant modifications. Although not discussedin detail, the maximum, FE-averaged radial power peaking factormay not exceed 1.4. One problem associated with the lower controlrod worth previously mentioned is the OSR sub-criticality marginwhich must be more than 1%.
3.2. Design procedure of transition core
Now, we have to find a procedure to design transition coreswhile fulfilling the above mentioned constraints under Scenario
Author's personal copy
P.H. Liem, T.M. Sembiring / Nuclear Engineering and Design 240 (2010) 1433–1442 1437
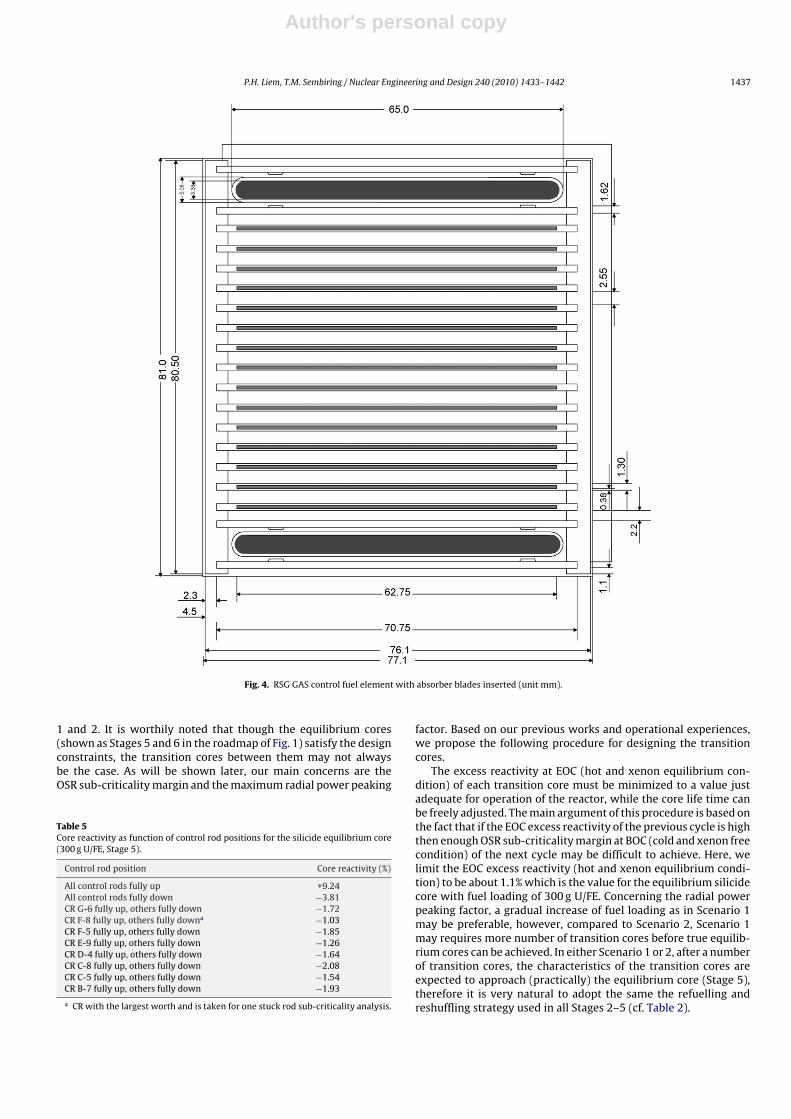
Fig. 4. RSG GAS control fuel element with absorber blades inserted (unit mm).
1 and 2. It is worthily noted that though the equilibrium cores(shown as Stages 5 and 6 in the roadmap of Fig. 1) satisfy the designconstraints, the transition cores between them may not alwaysbe the case. As will be shown later, our main concerns are theOSR sub-criticality margin and the maximum radial power peaking
Table 5Core reactivity as function of control rod positions for the silicide equilibrium core(300 g U/FE, Stage 5).
Control rod position Core reactivity (%)
All control rods fully up +9.24All control rods fully down −3.81CR G-6 fully up, others fully down −1.72CR F-8 fully up, others fully downa −1.03CR F-5 fully up, others fully down −1.85CR E-9 fully up, others fully down −1.26CR D-4 fully up, others fully down −1.64CR C-8 fully up, others fully down −2.08CR C-5 fully up, others fully down −1.54CR B-7 fully up, others fully down −1.93
a CR with the largest worth and is taken for one stuck rod sub-criticality analysis.
factor. Based on our previous works and operational experiences,we propose the following procedure for designing the transitioncores.
The excess reactivity at EOC (hot and xenon equilibrium con-dition) of each transition core must be minimized to a value justadequate for operation of the reactor, while the core life time canbe freely adjusted. The main argument of this procedure is based onthe fact that if the EOC excess reactivity of the previous cycle is highthen enough OSR sub-criticality margin at BOC (cold and xenon freecondition) of the next cycle may be difficult to achieve. Here, welimit the EOC excess reactivity (hot and xenon equilibrium condi-tion) to be about 1.1% which is the value for the equilibrium silicidecore with fuel loading of 300 g U/FE. Concerning the radial powerpeaking factor, a gradual increase of fuel loading as in Scenario 1may be preferable, however, compared to Scenario 2, Scenario 1may requires more number of transition cores before true equilib-rium cores can be achieved. In either Scenario 1 or 2, after a numberof transition cores, the characteristics of the transition cores areexpected to approach (practically) the equilibrium core (Stage 5),therefore it is very natural to adopt the same the refuelling andreshuffling strategy used in all Stages 2–5 (cf. Table 2).

Author's personal copy
1438 P.H. Liem, T.M. Sembiring / Nuclear Engineering and Design 240 (2010) 1433–1442
Fig. 5. Design procedure for the silicide transition cores of RSG GAS.
3.3. Computational method and codes
The neutronic design procedure of the transition cores is shownin the schematic diagram of Fig. 5. First, the cross section libraryfor fissile and non-fissile materials is prepared with the WIMS/D4cell calculation code (Askew et al., 1966). The library in four energygroup (3 fast and one thermal) is prepared to accommodate a widerange of design parameters such as fuel burn-up level, fuel meatdensity, fuel operational temperature, and existence of importantneutron poisons (xenon and samarium). The general reactor data,
refueling and fuel reshuffling strategy, and the initial guess forcore cycle length are fed into a dedicated in-core fuel manage-ment code module, Batan-FUEL (Liem, 1996). Since the moduleadopts the 2-D diffusion theory, an accurate axial buckling mustbe provided through rigorous 3-D diffusion calculations by theBatan-3DIFF module (Liem, 1995). A transient core with the pre-scribed core cycle length is first calculated to obtain the BOC andEOC conditions, and then a check is done to determine whether theEOC excess reactivity under the hot and xenon equilibrium condi-tion converged to the prescribed value (i.e., 1.1%). If the initially

Author's personal copy
P.H. Liem, T.M. Sembiring / Nuclear Engineering and Design 240 (2010) 1433–1442 1439
Table 6Fuel burn-up characteristics of transition cores under Scenario 1 and 2 (Stage 3 as the initial condition is also shown).
Description BOC EOC
Initial cond.(Stage 3)
Scenario 1 transcore 24
Scenario 2trans core 16
Initial cond.(Stage 3)
Scenario 1 transcore 24
Scenario 2trans core 16
No. of FE loaded per cycle 5 5 5 – – –No. of CE loaded per cycle 1 1 1 – – –Core life time (days) – – – 22.5 32.5 32.5In-core 235U mass (kg) 8.4 9.3 9.3 7.6 8.1 8.1In-core U mass (kg) 55.0 65.2 65.1 54.2 64.0 64.0Core-ave. fuel burn-up (GWD/THM) 42.6 52.8 52.8 54.3 66.9 66.9Core-ave. fuel burn-up (% loss of 235U) 26.4 32.4 32.4 33.4 40.7 40.7Max. FE burn-up (% loss of 235U) – – – 57.3 68.0 67.9Max. CE burn-up (% loss of 235U) – – – 60.8 70.5 70.3Core-averaged 235U fuel enrich. (w/o) 15.3 14.2 14.2 14.0 12.7 12.7In-core Pu mass (kg) 0.25 0.37 0.37 0.31 0.45 0.45Core-ave. fissile Pu fuel enrich. (w/o) 87.6 85.0 85.1 86.3 83.5 83.5Max. radial fuel element channel factor 1.24 1.27 1.27 1.25 1.28 1.28
specified core cycle length is not appropriate then it is repeti-tively adjusted so that it will converge to the prescribed EOC excessreactivity.
Calculations in 3-D diffusion theory with the Batan-3DIFF mod-ule are then conducted to check the OSR sub-criticality margin. Ifthis safety requirement is not satisfied, some modification of thetransition core scenario must be made.
The last part of the neutronic design procedure, which is not dis-cussed in detail here, covers the calculations of kinetic parameters,various feedback reactivity coefficients, and, of most importance,the nuclear hot channel factors mostly conducted by using Batan-3DIFF module. The latter factors are fed to the thermal–hydraulicanalysis to ensure sufficient safety margins under normal or abnor-mal conditions of the reactor. Feedback from thermal–hydraulicanalysis results may force modification of some neutronic designparameters.
Batan-FUEL module, together with the Batan-3DIFF modulesused in the present work, were validated through several bench-mark calculations defined in the IAEA-TECDOC-233 (IAEA, 1980)and IAEA-TECDOC-643 (IAEA, 1992), and the results have beenreported elsewhere (Liem and Sembiring, 1997; Sembiring andLiem, 1997). Furthermore, a similar validation effort of the moduleshad already been done by comparing the calculation results withthe criticality experiment results of the first core of RSG GAS (Liem,1999) and the Kyoto University Critical Assembly, KUCA (Zuhairet al., 1998). The Ag–In–Cd is a strong absorber material and it istreated specially using blackness coefficients in Batan-2DIFF and-3DIFF codes. The accuracy of the approach has been validated andreported by Liem and Sembiring (1997) and Sembiring and Liem(1999).
4. Results and discussions
The initial conditions (Stage 3; equilibrium silicide core with250 g U/FE fuel loading) for designing the transition cores are shownin Fig. 6 and summarized in Table 6 (columns 2 and 5 for BOCand EOC, respectively), while the targeted equilibrium silicide core(Stage 5) is shown in Fig. 7. As mentioned before, the core shownin Fig. 6 represents the present status of RSG-GAS.
The main results of the transition core design under Scenario1 and 2 are shown in Figs. 8–10, respectively. Fig. 8 shows themain characteristics of transition cores no. 1 to 8 of Scenario 1 (i.e.Stages 3–4). During this period, the core contains silicide FEs andCEs with different initial loadings, i.e. 250 and 275 g U/FE. Followingthis period, in Fig. 9, the main characteristics of transition cores no.9–24 are shown. Transition cores no. 9–16 contain FEs and CEs withinitial loading of 275 and 300 g U/FE, and the rest of the transitioncores (no. 16–24) consist of only FEs and CEs with 300 g U/FE ini-
Fig. 6. BOC/EOC fuel burn-up distributions of the RSG GAS silicide equilibrium corewith 250 g U/FE loading (Stage 3, initial condition for transition core analyses) andcore cycle length of 22.5 days (first and second rows represent BOC and EOC burn-upvalues, respectively. BE: Be reflector element, BS+: Be reflector element with plug,IP: irradiation position, CIP: central irradiation position).
tial loading. If only BOC/EOC excess reactivity and core cycle lengthshown in the figures are considered, transition core no. 20 or latercan be thought to be practically very near to the equilibrium core(Stage 5), however, here we prefer transition core no. 24 for strictconvergence. Rather large decreases of BOC excess reactivity occur
Fig. 7. BOC/EOC fuel burn-up distributions of the equilibrium core of the RSG GASnew silicide core with 300 g U/FE loading (Stage 5, targeted equilibrium core) andcore cycle length of 32.5 days (BE: Be reflector element, BS+: Be reflector elementwith plug, IP: irradiation position, CIP: central irradiation position).

Author's personal copy
1440 P.H. Liem, T.M. Sembiring / Nuclear Engineering and Design 240 (2010) 1433–1442
Fig. 8. Characteristics of transition cores under Scenario 1 (Stages 3–4).
Fig. 9. Characteristics of transition cores under Scenario 1 (Stages 4–5).
during the earlier phases of fuel loading change, i.e. transition coresno. 2, 10 and 18. The large decreases are attributed to the relativelylonger core life time of the previous transition core to compen-sate higher fuel loading (in order to achieve the same EOC excessreactivity).
For Scenario 2, similarly Fig. 10 shows the main characteristicsof 16 transition cores involved. Transition cores no. 1–8 contain FEsand CEs with initial loadings of 250 and 300 g U/FE, while the restof the transition cores consist of only FEs and CEs with 300 g U/FEinitial loading. Similar decreases of BOC excess reactivity occur inthe earlier phases of fuel loading change, i.e. transition cores no. 2
Fig. 10. Characteristics of transition cores under Scenario 2 (Stages 3–5).
Fig. 11. BOC burn-up distribution of transition core no. 24 under Scenario 1 (firstrows) compared to the one of the equilibrium core (Stage 5, second rows) (BE: Bereflector element, BS+: Be reflector element with plug, IP: irradiation position, CIP:central irradiation position).
and 9, where the reason has been explained in Scenario 1 above.From the figures as well as Table 6, one can conclude that Scenario1 needs at least 24 transition cores and Scenario 2 needs at least 16transition cores to practically converge into the equilibrium core(Stage 5). Hence from this point of view, Scenario 2 is superior toScenario 1. In Table 6, Figs. 11 and 12, the burn-up characteristicsof transition cores no. 24 of Scenario 1 and no. 16 of Scenario 2should be compared to the equilibrium ones shown in Table 3 andFig. 7. By comparing Table 6 with Table 3, one can conclude thateither Scenario 1 or 2 practically can attain the equilibrium core, interm of core cycle length, discharge FE and CE burn-up, etc. Fromcomparisons of FE/CE burn-up distribution shown in Figs. 11 and 12with the one in Fig. 7, the largest difference in the FE and CE burn-up levels is found in core grid C-4, i.e. approximately 2–3%. Thislocation is occupied by a FE of the second burn-up class which isreshuffled from core grid H-8. Core grid H-8 is just adjacent to a Bereflector element where the flux gradient is expected to be severeand may attribute to this deviation.
The maximum radial power peaking factors for the transitioncores under Scenario 1 and 2 are shown in Table 7 and Fig. 13.It should be noted that the imposed safety design limit demandsthese factors to be lower than 1.4. For Scenario 1, the location ofthe maximum radial power peaking factors always occurs in coregrid C-8 which is occupied by a fresh CE and is adjacent to bothIP and CIP where severe flux gradients are expected. For Scenario
Fig. 12. BOC burn-up distribution of transition core no. 16 under Scenario 2 (firstrows) compared to the one of the equilibrium core (Stage 5, second rows) (BE: Bereflector element, BS+: Be reflector element with plug, IP: irradiation position, CIP:central irradiation position).

Author's personal copy
P.H. Liem, T.M. Sembiring / Nuclear Engineering and Design 240 (2010) 1433–1442 1441
Table 7Maximum radial power peaking factors of transition cores under Scenario 1 and 2.
Transition core no. Scenario 1 Scenario 2
BOC EOC BOC EOC
1 1.28 1.30 1.32 1.342 1.29 1.30 1.33 1.343 1.29 1.29 1.32 1.334 1.28 1.29 1.31 1.325 1.27 1.28 1.29 1.306 1.26 1.27 1.28 1.297 1.25 1.26 1.26 1.278 1.26 1.27 1.27 1.289 1.29 1.30 1.28 1.29
10 1.30 1.31 1.27 1.2811 1.29 1.30 1.27 1.2812 1.28 1.29 1.27 1.2813 1.28 1.29 1.26 1.2714 1.27 1.28 1.26 1.2815 1.27 1.28 1.27 1.2816 1.27 1.28 1.27 1.2817 1.27 1.2818 1.27 1.2819 1 27 1 2820 1.27 1.2821 1.27 1.2822 1.27 1.2823 1.27 1.2824 1.27 1.28
All peaking factors are located at 8-C, except for Scenario 2, transition core no. 3 atF-9 (EOC) and transition core no. 5 at F-5 (BOC).
Fig. 13. Maximum radial power peaking factors for transition cores under Scenario1 and 2.
2, the location of the maximum radial power peaking factors alsomainly occurs in core grid C-8, with a few exceptions as follows.The location changes to core grid F-9 for transition core no. 3 atEOC and to core grid F-5 for transition core no. 7 at BOC. In generalthe maximum radial power peaking factors are slightly higher for
Fig. 14. Radial power peaking factors of the worst case of Scenario 1, i.e. transitioncore no. 10 (first rows and second rows represent BOC and EOC values, respectively;BE: Be reflector element, BS+: Be reflector element with plug, IP: irradiation position,CIP: central irradiation position).
Fig. 15. Radial power peaking factors of the worst case of Scenario 2, i.e. transitioncore no. 16 (first rows and second rows represent BOC and EOC values, respectively;BE: Be reflector element, BS+: Be reflector element with plug, IP: irradiation position,CIP: central irradiation position).
EOC than for BOC, which is attributed to the wider differences ofburn-up level amongst FEs and CEs. As predicted, Scenario 2 showsseverer maximum radial power peaking factors than Scenario 1.One can recall that transition cores under Scenario 2 consist of FEsand CEs with wider differences in initial fuel loadings. Both scenar-ios show two local peaks in Fig. 13 where the initial fuel loading isincreased and these differences are further pronounced. The radialpower peaking distributions at the worst cases of Scenario 1 (transi-tion core no. 10) and of Scenario 2 (transition core no. 2) are shownin Figs. 14 and 15, respectively. Both figures show the distributions
Table 8One-stuck-rod sub-criticality margins of transition cores under Scenario 1 and 2.
Transition core no. Scenario 1 Scenario 2
1 9 16 24 1 8 16
All control rods fully up 9.13 9.44 9.30 9.19 9.29 9.51 9.19All control rods fully down −4.60 −3.82 −3.75 −3.86 −4.31 −3.54 −3.86CR G-6 fully up, others fully down −2.41 −1.76 −1.74 −1.87 −2.13 −1.52 −1.87CR F-8 fully up, others fully downa −1.84 −1.07 −1.01 −1.11 −1.60 −0.83 −1.11CR F-5 fully up, others fully down −2.45 −1.80 −1.79 −1.92 −2.16 −1.57 −1.91CR E-9 fully up, others fully down −2.12 −1.33 −1.33 −1.33 −1.89 −1.04 −1.33CR D-4 fully up, others fully down −2.36 −1.66 −1.60 −1.71 −2.07 −1.41 −1.71CR C-8 fully up, others fully down −2.69 −2.03 −2.02 −2.15 −2.43 −1.79 −2.15CR C-5 fully up, others fully down −2.20 −1.55 −1.50 −1.61 −1.96 −1.29 −1.61CR B-7 fully up, others fully down −2.46 −1.86 −1.87 −2.00 −2.21 −1.63 −2.00
a CR with the largest worth and is taken for one-stuck-rod sub-criticality analyses.
Author's personal copy
1442 P.H. Liem, T.M. Sembiring / Nuclear Engineering and Design 240 (2010) 1433–1442
for BOC as well as for EOC. Both scenarios can fulfil the safety designlimit imposed, although Scenario 1 shows preferable results.
Concerning the OSR sub-criticality margin, an observation onthe BOC excess reactivity shown in Figs. 8 and 9 (Scenario 1) and10 (Scenario 2) must be made. For Scenario 1, the transition coresno. 1, 9 and 16 show a relatively high BOC excess reactivity and OSRsub-criticality checks are conducted. As for Scenario 2, for the samereason OSR sub-criticality checks are conducted for transition coresno. 1 and 8. The OSR sub-criticality check is conducted by calculat-ing the sub-criticality at BOC under cold and xenon free conditionswhere all control rods are fully inserted except the one consideredstuck. Since there are eight CEs in the core, eight eigenvalue calcu-lations are conducted. The results of the OSR sub-criticality checksare summarized in Table 8. The results for transition core no. 24under Scenario 1 and no. 16 under Scenario 2 are also tabularized.For both scenarios and all transition cores considered, the controlrod at core grid F-8 has the largest reactivity worth and is selectedfor OSR sub-criticality checks. Scenario 1 shows a promising resultin that sub-criticality margin of more than 1% can be achieved whileScenario 2 fails at transition core no. 8.
Summarizing all of the above mentioned results, we concludethat the transition cores under Scenario 1 should be adopted intothe core conversion program of RSG GAS, where the initial fuel load-ings are increased gradually in two steps, i.e. from 250 to 275 g U/FEwithin 8 transition cores, from 275 to 300 g U/FE within 8 transi-tion cores, and followed by other 8 transition cores with 300 g U/FEloading to approach the targeted silicide equilibrium core. All tran-sition cores under Scenario 1 satisfy main design safety limitations,among others, the maximum radial power peaking factor and theone-stuck-rod sub-criticality margin.
5. Summary
A procedure of designing transition cores to achieve the equilib-rium silicide core of RSG GAS with higher fuel loading of 300 g U/FE(meat density of 3.55 g U/cm3) has been proposed. In the proposedprocedure, the EOC excess reactivity of each transition core is min-imized in order to satisfy the safety design limit of one-stuck-rodsub-criticality margin while keeping the maximum of radial powerpeaking factor below the allowable value. In addition to these mainsafety design limits, several design constraints imposed on the pre-
vious design work for obtaining the equilibrium cores must alsobe fulfilled by the transition cores. Two scenarios are considered.Under Scenario 1, the initial fuel loadings are increased graduallyin two steps from 250 to 300 g U/FE while under Scenario 2, the ini-tial fuel loadings are increased directly to 300 g U/FE. The analysisresults show that all transition cores under Scenario 1 can satisfyall design requirements and safety limits while a transition coreunder Scenario 2 fails to fulfil adequate margin of one-stuck-rodsub-criticality. We concluded that the transition core design underScenario 1 should be adopted into the future core conversion pro-gram of RSG GAS. Under Scenario 1, the targeted silicide core canbe achieved practically in at least 24 transition cores. Compared toScenario 2, Scenario 1 gives lower maximum radial peaking poweras well as another beneficial effect as to provide enough time forfurther gradual testing on mini and full scale fuel elements.
References
Arbie, B., 1996. Oxide to silicide fuel conversion study for multipurpose reactor G.A.Siwabessy. Ph.D. thesis. University of Gadjah Mada, Yogyakarta.
Askew, J.R., et al., 1966. A general description of the code WIMS. J. Br. Nucl. EnergySoc., 5.
Batan, 1987. MPR-30 Safety Analysis Report Rev. 7. Jakarta.IAEA, 1980. Research Reactor Core Conversion From The Use of Highly Enriched
Uranium to the Use of Low Enriched Uranium Fuels Guide Book. IAEA-TECDOC-233, Vienna.
IAEA, 1992. Research Reactor Conversion Guide Book—vol. 3: Analytical Verification.IAEA-TECDOC-643, Vienna.
Liem, P.H., 1995. Development of Batan’s standard 3-D multigroup diffusion code(Batan-3DIFF). In: Proc. 5-th Workshop of Computation in Nuclear Science andTechnology, Batan, Jakarta.
Liem, P.H., 1996. Batan-FUEL: a general in-core fuel management code. Atom Indone-sia 22, 2.
Liem, P.H., Sembiring, T.M., 1997. Validation of Batan’s standard neutron diffusioncodes for control rod worth analysis. Atom Indonesia 23, 2.
Liem, P.H., et al., 1998. Fuel management strategy for the new equilibrium silicidecore design of RSG GAS (MPR-30). Nuclear Engineering and Design 180, 207–219.
Liem, P.H., 1999. Validation of Batan’s standard 3-D diffusion code, Batan-3DIFF, onthe First Core of RSG GAS. Atom Indonesia 25, 2.
Sembiring, T.M., Liem, P.H., 1997. Validation of Batan’s standard diffusion codes onIAEA benchmark static calculations. Atom Indonesia 23, 2.
Sembiring, T.M., Liem, P.H., 1999. Validation of Batan-3DIFF code on 3-D model ofthe IAEA 10 MWth benchmark core for partially-inserted control rods. AtomIndonesia 25, 2.
Zuhair, et al., 1998. Batan-2DIFF and -3DIFF diffusion codes validation on KyotoUniversity Critical Assembly (KUCA). Atom Indonesia 24, 2.
Related Documents