1 Design of the Reverse Auction in the Broadcast Incentive Auction An expert report in response to Comment Public Notice FCC 14-191 Peter Cramton, Hector Lopez, David Malec and Pacharasut Sujarittanonta 1 15 June 2015 Abstract We consider important design issues of the reverse auction, a key and innovative part of the broadcast television incentive auction. In the reverse auction, broadcasters compete to repurpose television broadcast spectrum for mobile broadband use. The Comment Public Notice (FCC 14-191) outlined the basic structure of the reverse auction. We take that basic structure as given and then examine critical elements of the design to maximize the government’s objectives of efficiency, simplicity, transparency, and fairness. Based on extensive simulation analysis of the FCC’s basic design, we identify important enhancements to the design that maintain its basic structure, yet improve the chance of a successful auction. This is accomplished by strengthening incentives for broadcaster participation and relying on competitive forces to determine auction clearing prices. Our analysis is based on a carefully-crafted reservation price model for broadcasters together with inevitable uncertainties of these reservation prices. In our simulations, we are able to clear 126 MHz of spectrum at a cost that is well within plausible revenues from the forward auction. This is accomplished with an improved scoring rule and replacing Dynamic Reserve Prices (DRP) with a much simpler Round Zero Reserve (RZR, pronounced “razor”) to promote objectives of transparency and simplicity. We also propose a simplified method of setting the clearing target and an information policy that allows for important outcome discovery. Relative to the FCC’s proposal outlined in the Comment PN, our enhanced proposal is more robust, efficient, and transparent; it also is simpler and fairer. 1 Peter Cramton is Professor of Economics at the University of Maryland; since 1983, he has conducted widely-cited research on auctioning many related items, and has applied that research to major auctions of radio spectrum, electricity, financial securities, and other products. Hector Lopez is a doctoral candidate at the Economics Department of the University of Maryland, specializing in market design. David Malec is a post-doc at the Economics Department of the University of Maryland; he is a computer scientist specializing in algorithmic game theory. Pat Sujarittanonta is Assistant Professor of Economics at Chulalongkorn University, specializing in market design. The four authors comprise Cramton Associates, a consultancy providing expert advice on auctions and market design. Bob Day of the University of Connecticut provided expert help with combinatorial optimization. We have benefitted from the extensive help of many U.S. broadcasters. We are grateful to a member of the Expanding Opportunities for Broadcasters Coalition (EOBC) for funding this research. The views presented are our own and not necessarily those of EOBC or its members. This is a revision of the 12 March 2015 draft.

Welcome message from author
This document is posted to help you gain knowledge. Please leave a comment to let me know what you think about it! Share it to your friends and learn new things together.
Transcript
1
Design of the Reverse Auction in the Broadcast Incentive Auction An expert report in response to Comment Public Notice FCC 14 -191
Peter Cramton, Hector Lopez, David Malec and Pacharasut Sujarittanonta 1
15 June 2015
Abstract
We consider important design issues of the reverse auction, a key and innovative part of the
broadcast television incentive auction. In the reverse auction, broadcasters compete to
repurpose television broadcast spectrum for mobile broadband use. The Comment Public Notice
(FCC 14-191) outlined the basic structure of the reverse auction. We take that basic structure as
given and then examine critical elements of the design to maximize the government’s objectives
of efficiency, simplicity, transparency, and fairness. Based on extensive simulation analysis of the
FCC’s basic design, we identify important enhancements to the design that maintain its basic
structure, yet improve the chance of a successful auction. This is accomplished by strengthening
incentives for broadcaster participation and relying on competitive forces to determine auction
clearing prices. Our analysis is based on a carefully-crafted reservation price model for
broadcasters together with inevitable uncertainties of these reservation prices. In our
simulations, we are able to clear 126 MHz of spectrum at a cost that is well within plausible
revenues from the forward auction. This is accomplished with an improved scoring rule and
replacing Dynamic Reserve Prices (DRP) with a much simpler Round Zero Reserve (RZR,
pronounced “razor”) to promote objectives of transparency and simplicity. We also propose a
simplified method of setting the clearing target and an information policy that allows for
important outcome discovery. Relative to the FCC’s proposal outlined in the Comment PN, our
enhanced proposal is more robust, efficient, and transparent; it also is simpler and fairer.
1 Peter Cramton is Professor of Economics at the University of Maryland; since 1983, he has conducted widely-cited research on auctioning many related items, and has applied that research to major auctions of radio spectrum, electricity, financial securities, and other products. Hector Lopez is a doctoral candidate at the Economics Department of the University of Maryland, specializing in market design. David Malec is a post-doc at the Economics Department of the University of Maryland; he is a computer scientist specializing in algorithmic game theory. Pat Sujarittanonta is Assistant Professor of Economics at Chulalongkorn University, specializing in market design. The four authors comprise Cramton Associates, a consultancy providing expert advice on auctions and market design. Bob Day of the University of Connecticut provided expert help with combinatorial optimization. We have benefitted from the extensive help of many U.S. broadcasters. We are grateful to a member of the Expanding Opportunities for Broadcasters Coalition (EOBC) for funding this research. The views presented are our own and not necessarily those of EOBC or its members. This is a revision of the 12 March 2015 draft.
2
Contents Abstract ................................................................................................................................................. 1
Contents ................................................................................................................................................ 2
What’s new in this revision? ................................................................................................................ 3
Introduction .......................................................................................................................................... 4 Methodology ................................................................................................................................. 5 Summary ........................................................................................................................................ 6 Summary of recommendations .................................................................................................. 14 Literature ..................................................................................................................................... 15 Outline.......................................................................................................................................... 16
Objectives ............................................................................................................................................ 16 Efficiency ...................................................................................................................................... 16 Simplicity ...................................................................................................................................... 19 Transparency ............................................................................................................................... 19 Fairness ........................................................................................................................................ 19 Discussion .................................................................................................................................... 20
Economic setting................................................................................................................................. 21 Carriers’ demand for spectrum .................................................................................................. 21 Broadcasters’ supply of spectrum .............................................................................................. 29
The FCC proposal ................................................................................................................................ 31 Overview and timeline ................................................................................................................ 32 Reverse auction ........................................................................................................................... 33 Forward auction .......................................................................................................................... 34 Integration of the reverse and forward auctions...................................................................... 35
Improve the scoring rule .................................................................................................................... 37 Precluded population .................................................................................................................. 39 Freeze probability........................................................................................................................ 40
Simplify the setting of the clearing target ........................................................................................ 41
Replace DRP with RZR ........................................................................................................................ 43
Enhance the information policy......................................................................................................... 46 Alternative information policies................................................................................................. 46 DMA vacancy is easy to define and calculate ........................................................................... 47 DMA vacancy provides much needed information to improve decision making ................... 48 Outcome discovery requires the auction to occur at a gradual pace ..................................... 49 DMA vacancy provides a foundation for a good information policy ....................................... 49
Simulation analysis supports our recommendations ....................................................................... 50 Proof of concept of our design recommendations ................................................................... 50 RZR results in no or little impairment even with a 126 MHz clearing target .......................... 55 Clearing cost is well within likely forward auction revenues ................................................... 57 Top-6 affiliates continue over-the-air broadcast in the vast majority of DMAs ..................... 58 The FCC volume measure fosters price discrimination, harming efficiency and fairness ...... 59
Address other important issues ......................................................................................................... 63 The FCC should not delay the incentive auction ....................................................................... 63 Price decrements should be small and a fixed percentage of the opening price................... 63 Proxy bidding and small decrements are complementary....................................................... 65 Intra-round bidding simplifies bidding and improves efficiency ............................................. 65 The AWS-3 auction demonstrates the need for a few rule changes ....................................... 66
Conclusion ........................................................................................................................................... 66
References ........................................................................................................................................... 67

3
What’s new in this revision?
On 12 March 2015, we filed an initial draft of this paper with the Federal Communications
Commission (FCC). Due to the complexity of the auction analysis, we had to make some
simplifying assumptions to meet the March deadline. In particular, we used a simplified model of
impairment and we were unable to model DRP. In this revision, with the benefit of three more
months of intensive work, we now are able to use the full ISIX impairment methodology proposed
by the FCC and we have modeled two versions of DRP. Here is a list of key enhancements in this
revision:
Full ISIX impairment methodology
Improved clearing target optimization
Simulation of DRP
Improved and simplified RZR pricing
Improved information policy based on DMA vacancy
Analysis of changes in broadcast coverage of top-6 affiliations in each DMA
Despite these advances in our analysis, our recommendations remain largely unchanged. This is
because the more sophisticated simulations confirm and strengthen the conclusions from our
earlier work. The FCC should make a number of important enhancements to its original proposal
to maximize the chances of a successful auction that robustly clears 126 MHz of broadcast
spectrum. Specifically, the FCC should:
1. Improve opening prices to encourage participation and reduce mispricing. This is best
done with two simple changes: reduce the weight on broadcast population when
computing volume, and rescale opening prices based on the most recent AWS-3 prices.
2. Simplify the setting of the clearing target to maximize the spectrum cleared and improve
transparency. Our recommended approach is to set the target at the maximum of the two
bottleneck markets, New York and Los Angeles. To enhance the robustness of this
proposal, we recommend allowing limited impairment—up to the equivalent of 15%
impairment in each of two blocks—in the market that sets the national clearing target
(either LA or New York).
3. Replace Dynamic Reserve Pricing (DRP) with Round Zero Reserve (RZR) pricing to simplify
the auction, improve transparency and avoid unnecessary impairment. We have
suggested a RZR formula that imposes a lower reserve price for a handful of stations for
which there is a lack of competition. RZR only impacts pricing in these small number of
markets—typically border markets.
4. Encourage outcome discovery—both the likelihood of clearing and the price of clearing—
with an information policy that reflects the competitive market structure on the
broadcaster side. We find that reporting DMA vacancy strikes the right balance. It
provides effective outcome discovery, yet provides the information with sufficient
aggregation that it cannot be used to support collusive arrangements.
4
Our simulation results on DRP confirm our initial fears. DRP has proven to be extremely difficult
to model. Since the FCC’s description of DRP is incomplete, we necessary had to make a number
of assumptions. Further, since the computational problem is intractable even with state-of-the-
art hardware and software, approximations are required at various steps. For this reason there
remains uncertainty in our minds about how DRP is apt to perform in practice. The outcome
necessarily depends on the particular approximations the FCC makes. Our simulations show that
DRP outcomes can vary considerably and in unknowable ways based on alternative
approximations. This uncertainty and complexity is certainly a disadvantage of DRP.
More specifically, our simulations have uncovered DRP’s Achilles Heel. To properly implement
DRP requires a full channel-assignment optimization between rounds of the reverse auction.
Without a full optimization between rounds, the FCC will need to rely on impairment estimates
that can be off by an order of magnitude, and thus would not be reliable indicators of when DRP
should be turned off. Given that full channel assignment optimization would likely require days,
not hours, to complete, implementation between rounds appears to be impractical. Therefore
we see no current computational option that would allow the FCC to implement DRP in both a
timely and reliable manner. DRP should be rejected by the Commission. The complexity would
introduce substantial implementation risk and undermine essential broadcaster participation.
Importantly our new simulations confirm that the FCC will be able to clear 126 MHz robustly if it
strengthens incentives for broadcaster participation. Moreover, our simulations show this can be
accomplished while retaining over-the-air broadcast coverage of each of the top-6 affiliates in
nearly all DMAs.
Recently the FCC released its own simulations of the reverse auction (FCC 2015). We welcome
this useful analysis. One of the striking features of the FCC simulations is how consistent they are
with our results. First, the FCC simulations show the tremendous importance of motivating
broadcaster participation. When broadcaster participation moves from 40-50% to 60-70%, the
quantity of spectrum cleared increases from below 20 billion to above 30 bil lion MHzPop--more
than a 50% increase (FCC 2015, Appendix p. 4). In value creation terms, this is an increase of
roughly $30 billion, using the recent AWS-3 auction as the pricing benchmark. Second, they show
that with good participation levels, such as 60-70%, it is possible to clear 126 MHz with little
impairment nationwide (FCC 2015, Appendix p. 1). Both of these results are important.
Our simulations go further by modeling the entire reverse auction, not just the initial clearing
target optimization. Further, our simulations are based on plausible broadcaster reservation
values. Decisions to participate in the auction and to exit the auction follow from our reservation
value model. It is comforting that our more elaborate simulations are broadly in line with the FCC
simulations.
Introduction
The FCC is engaged in a critical effort to repurpose broadcast TV spectrum for mobile broadband
use. The low-band spectrum that will be repurposed in a successful incentive auction would bring

5
enormous consumer value as the demand for mobile broadband continues to grow
exponentially. The low-band spectrum also will greatly enhance competition as it offers an
essential means for the smaller incumbents to expand coverage given the excellent propagation
characteristics of the 600 MHz spectrum that permit economic coverage within buildings,
through difficult terrain, and in less densely populated areas. Carriers will directly express the
high value of this spectrum in the forward auction. Consumers will then enjoy a much higher
value in the form of improved services and competition post auction.
Although this study has benefited from the funding of broadcasters as well as from literally
hundreds of conversations with broadcasters over the last two years, we have been given free
rein to write a report that focuses on the key FCC objective of maximizing the success of the
incentive auction. We have taken this objective quite seriously. As such this report does not
represent the views of any particular broadcasters, nor the views of Expanding Opportunities for
Broadcasters Coalition (EOBC). We have certainly talked with EOBC and its members extensively
and benefited from their views. But our analysis and our views are just that.
The reason our team has been given this latitude in writing this report are two: (1) we insisted
on this level of intellectual freedom, and (2) we argued, apparently convincingly, that the
interests of broadcasters—at least collectively—are in close alignment with the FCC, assuming
the FCC is motivated as it should be with social welfare maximization—what is best for society in
aggregate. We discuss the FCC’s objective at length in the next section.
Methodology
Our approach in answering the basic question—how best to design the reverse auction?—is to
apply the rigorous methodology of auction design. Auction design combines science and
engineering. It is a field largely within economics, but also drawing from the disciplines of
computer science and operations research. We make extensive use of all three disciplines in our
study.
Auction design begins with auction theory, which is an extremely well-developed field of
economics. It then turns to test the theory, both in the field and in the experimental lab, to
determine the circumstances where the theory applies well and where other factors become
important to the auction design. Finally, auction design uses agent-based simulation to test
designs. The simulation approach is valuable in that it can include a much richer set of details
from the actual setting and the analysis can be completed relatively quickly, since the bidding
and analysis are all done by computers, which do billions of calculations per second. Indeed, for
the simulation analysis we used cloud computing to engage literally thousands of computer cores
to perform the necessary calculations in a timely manner.
Similar to the FCC’s expert design team, we have made use of auction theory, empirical auction
work from the lab and the field, and our own simulation work. In the context of the reverse
auction, our chief method of evaluating alternative designs is simulation. The reasons to rely
heavily on simulation in this case are: (1) the auction is necessarily innovative as nothing like this

6
has been done anywhere in the world—the FCC is breaking new ground, (2) the setting is much
more complex than anything that can be analyzed with existing auction theory—yes, we can gain
some broad insights from theory, but we cannot test alternative designs with theory, (3) since
nothing like this has ever been done before, there is no relevant field data with which to assess
alternatives, and (4) the setting is much more complex than can be handled in the experimental
lab. For this reason, we rely heavily on simulation analysis, and have taken great care in the
development and testing of our simulations. A technical appendix describes the simulation
methodology in detail. Our frequent discussions with broadcasters over the last two years have
been especially helpful in coming up with a benchmark valuation model.
Summary
Our overall conclusion is that the FCC auction design team has done an outstanding job in
producing a reverse auction design. Indeed, as we evaluate and refine the FCC design we are able
to stay within the basic structure that the FCC has proposed in the Comment PN. Nonetheless,
we find four important issues that need to be addressed to maximize the chance of a successful
incentive auction. There are a number of additional details that the FCC will want to address as
well. We discuss these at the end of our report so as not to distract from the key issues. The four
important changes are:
Improve the scoring rule to encourage participation and reduce mispricing.
Simplify the setting of the clearing target to maximize the spectrum cleared and improve
transparency.
Replace Dynamic Reserve Pricing (DRP) with Round Zero Reserve (RZR, pronounced
“razor”) pricing to simplify the auction and improve transparency.
Encourage outcome discovery—both the likelihood of clearing and the price of clearing—
with an information policy that reflects the competitive market structure on the
broadcaster side.
In addition, there is one important issue on which the FCC should hold firm: the timing of the
auction. We anticipate that the dominant incumbents (AT&T and Verizon) will lobby for a delay
of the auction. This is not surprising, as shareholders will benefit from delay and companies
should lobby for policies that increase profits.
Here is the issue. AT&T and Verizon enjoy a substantial coverage advantage over the other
nationwide competitors, T-Mobile and Sprint. The 600 MHz spectrum is an opportunity for T-
Mobile and Sprint to get the low-band spectrum they need and thereby become stronger
competitors in mobile broadband. The dominant incumbents will of course be harmed by this
greater competition, but consumers and the broader communication industry and related
technology industries will benefit. A delay in the auction would be a gift to the dominant
incumbents at the expense of all other parties. Delay would result in a substantial reduction in
social welfare.
We now summarize each of the four changes.
7
Improve the scoring rule
The scoring rule determines the opening prices in the reverse auction. These are critical to
motivate participation of broadcasters, as the opening price is the maximum price that a station
can receive, and a commitment to participate in the auction is a commitment to accept the
opening price. Moreover, as the result of a simplifying feature of the incentive auction—that
clocks move down in identical percentage steps—the opening prices also have a major impact on
the sequence of exits and therefore the set of stations that clear and their payments for clearing.
To say the scoring rule is an important determinant of the auction outcome is an understatement.
The scoring rule plays a critical role.
For this reason, a main focus of our analysis was the FCC’s proposed scoring rule and literally
hundreds of alternative rules. We examined the properties of each rule and selected the best
performing rules based on the FCC’s key objective of maximizing the likelihood of a successful
auction.
The scoring rule consists of two components, the base clock price and volume, in particular:
Score = (base clock price) × (volume)
For the base clock price, we considered two alternatives in addition to the FCC price of $900:
$1250 and $1500. These two base clock prices increase the FCC base clock price to encourage
participation and thereby make the auction more robust to high broadcaster reservation values.
We show that the higher base clock prices increase the likelihood of a successful auction and
better reflect the new information revealed in the AWS-3 auction about likely forward auction
revenues. Moreover, the higher base clock price adds little to the clearing cost, since clearing
prices are driven down to competitive levels. For this reason, we recommend the higher base
clock price of $1500.
For volume, two measures stand out as good alternatives to the FCC volume measure. We
experimented with a range of alternative volume measures, and describe two additional
formulas, one which makes minimal changes to the FCC formula and one which makes
substantive changes to the FCC formula, but best represents a station’s preclusive effect as
shown through the FCC’s constraint files. We focus on these two measures and the FCC proposal
in our analysis:
FCC volume = (Broadcast population)1/2 × (Interference count)1/2
Reweighted volume = (Broadcast population)1/4 × (Interference count)1/2
Freeze volume = (Precluded population) × (Freeze probability)
where
Broadcast population = a station’s interference-free broadcast population. This is the FCC’s
population measure defined in ¶96 of the Comment PN. We use “broadcast population” rather

8
than “interference-free population” to highlight that this population is referring to broadcast
coverage.
Interference count = a station’s count of the number of pairwise interference constraints. This is
the FCC’s interference measure also defined in ¶96 of the Comment PN.
Precluded population = the population that cannot be served by any other station if the specified
station is repacked. This is a new measure of population that better reflects the population that
the station interferes with if repacked.
Freeze probability = the long-run frequency with which the station freezes in simulations with a
random order of station exits. This is a measure of repacking difficulty that follows directly from
the interference constraint and domain files. It was initially proposed in Kearns and Dworkin
(2014).
Notice that these alternatives retain the same structure as the FCC measure.
Indeed, the reweighted volume measure is identical with the exception that broadcast
population is given a weight of ¼ rather than ½. This change in exponent has many benefits, the
two most important being:
Improved robustness—a higher likelihood of auction success—as incentives for
participation are increased, especially for smaller stations. More stations participate,
allowing a higher clearing target with fewer impairments.
A smaller loss in broadcaster coverage (about 36 million people will receive one additional
over-the-air TV broadcast station), since the reweighted volume puts less weight on
broadcast population. With the FCC volume, broadcast population is given more weight
and this induces more stations with large broadcast population to clear.
We go on to show that the exponents in reweighted volume have a strong justification. When
we consider all possible exponents, the reweighted exponents of ¼ and ½ best fit an empirical
measure of volume—freeze probability—that follows directly from the two FCC inputs in the
repacking process, the domain file and the interference constraint file, without making any
assumptions about broadcaster values. In particular, freeze probability is calculated by running
thousands of simulations with random station exits and computing the frequency at which a
station is frozen. This measure of a station’s contribution to the clearing process is independent
of assumptions about station values. Thus, the exponents in reweighted volume follow directly
from the FCC constraint files; whereas, the FCC exponents were simply chosen arbitrarily based
on some “equal weight” notion and constant returns to scale (the exponents sum to one), neither
of which are justified in any way by the FCC.
The precluded population measure also is a minor, but important, variation of the broadcast
population element used to determine the FCC volume. It reflects the fact that a broadcaster’s
signal extends far beyond its protected contour, creating a “zone of preclusion” in which no other
broadcasting or other wireless operations could exist without experiencing destructive

9
interference. The FCC’s ISIX methodology shows that the zone of preclusion for a single New York
City station with interference-free service to 20 million people, can extend from Boston to
Baltimore, disrupting wireless operations for as many as 48 million people. The FCC’s formula
fails to properly value this impact. Although it includes a metric for “interference count”, the FCC
formula makes no distinction between interference in isolated markets with low population
density vs. interference in the most sought after, densely populated markets like New York City.
This causes significant mispricing of stations. In particular it undervalues stations that cause
interference in high population density markets just beyond their protected contours.
The Freeze volume measure is both a more significant deviation from the proposed FCC volume
and a greater improvement. It replaces both FCC measures with improved measures. Precluded
population replaces broadcast population and freeze probability replaces interference constraint
count.
Based on our simulation analysis, we recommend that the FCC adopt our proposed Reweighted
volume alternative. This alternative performs much better than the FCC formula, especially with
respect to robustness to broadcaster value uncertainty.
We estimate that our proposed formula will result in the FCC’s payments to broadcasters being
nearly 10 percent lower than they would be if the FCC adopted a formula that truly reflected the
contribution of each station to clearing spectrum. This is because, even with our proposed
changes, the formula still acts as a price-discrimination tool, systematically offering lower prices
per unit of spectrum to stations that are relatively more difficult to repack. That is why we
consider this proposal to be a compromise: it only partially mitigates the price discrimination that
is built in to the FCC’s proposed formula.
Compared to the FCC formula, our alternative brings a significant reduction in broadcast coverage
loss and most importantly a significant increase in the likelihood of clearing 126 MHz of
spectrum—10 blocks—for the forward auction. Success of the incentive auction should be
measured in terms of societal net benefits, which depend almost exclusively on the amount of
spectrum successfully cleared.
Simplify the setting of the clearing target to maximize the spectrum cleared
Perhaps the most important design element in the auction is the establishment of the clearing
target. The clearing target sets the nationwide band plan. It determines the maximum quantity
of spectrum to be repurposed. The FCC proposes to establish the clearing target using a complex
optimization that, even today, has been insufficiently specified to allow researchers like ourselves
to simulate its implications. This level of complexity and lack of transparency is troubling and
unnecessary.
We propose a simple alternative for setting the clearing target that has worked extremely well in
our simulation analysis: set the clearing target equal to the maximum quantity of spectrum that
can be cleared in either New York City or Los Angeles, whichever is higher, based on the

10
broadcasters’ participation decisions—each station’s commitment to accept its opening price.
This method is much simpler than the FCC’s proposal.
By setting the national clearing target based on New York and LA, the FCC can avoid the concern
that the FCC’s proposed target setting method, with its 20% allowable weighted impairment, will
counterproductively reclaim the most spectrum in the markets where it is needed least. Instead,
this proposal ensures that spectrum will only be cleared in rural markets to the extent that it
facilitates harmonization with the spectrum being cleared in New York and/or LA. Further, to
enhance the robustness of our proposal, we recommend allowing limited impairment—up to the
equivalent of 15% impairment in each of two blocks—in the market that sets the national clearing
target (either LA or New York). Our simulations indicate that the additional flexibility provided by
this small allowance for impairment will significantly improve the frequency of achieving higher
clearing targets, while limiting the impairment to a few Category 1 licenses.
In our simulations, New York and LA are the most common and important bottlenecks that limit
the quantity of spectrum that can be repurposed. As an example, suppose New York can clear
126 MHz and LA can clear 114 MHz (LA is often more constrained as a result of its proximity to
the Mexican border). In this case, we would set the nationwide clearing target at 126 MHz and
one or more blocks would be impaired or not offered in LA. Thus, the approach avoids letting
border constraints in Mexico disrupt substantially larger value from clearing in the East.
Not only is this approach simple and unambiguous, but it maximizes the spectrum cleared subject
to broadcaster participation. Doing so maximizes social welfare.
Replace DRP with RZR
Another source of great complexity and non-transparency is DRP. DRP remains extremely difficult
to model and is still not fully described in the FCC proposal. As such DRP looms like a Trojan horse.
The FCC says it is a nice horse, but there is no way for the broadcasters to look inside the horse
to confirm. Broadcaster suspicion and confusion harms participation. And suspicion is not only
natural but advisable—the more we study DRP, the more suspicious we become. The FCC has
taken many steps in the incentive auction proceeding that appear adverse to broadcasters.
Broadcasters cannot possibly trust the FCC that ambiguous or indecipherable rules are in the best
interest of broadcasters.
Further DRP necessarily leads to unnecessary impairment. DRP effectively says, “Let’s accept
some level of additional impairment in order to pay the broadcasters less.” Impairment destroys
value in the forward auction. Accepting artificial impairment is inconsistent with the primary goal
of the incentive auction: to maximize the quantity of cleared spectrum.
The distinction between necessary impairment and artificial impairment is an important one.
Necessary impairment is impairment caused from inadequate supply in a few difficult markets,
such as border markets, where supply is especially limited and foreign TV broadcast may impair
mobile broadband. Artificial impairment is impairment caused by DRP—supply is sufficient but
the FCC drives the price down anyway and accepts some level of impairment in exchange for a
11
lower price paid to broadcasters. The problem is that DRP mechanically sets impairment levels
irrespective of prices, and therefore cannot possibly optimize the benefits and costs in the social
welfare calculation. Artificial impairment has real costs to carriers and consumers.
Fortunately, there is a simple and unambiguous alternative to DRP that can avoid artificial
impairment: Round Zero Reserve (RZR) pricing. Both DRP and RZR address the same basic
problem. Due to uncertainties in stations’ reservation values it is desirable to set a high opening
price, higher than the FCC would like to pay, unless the high price is determined from the
competitive exit of other stations. However, there will inevitably be a handful of stations where
there is an absence of competition. DRP sets these prices—and many others—through a complex
administrative process. RZR instead sets these prices directly and limits the use of the
administrative prices to only those stations that freeze at round zero, based on the clearing target
and the stations’ decisions to accept the opening prices. Any station that freezes at the opening
price, before the auction begins, is offered the RZR price. The RZR price is a station-specific price
that is lower than the station’s opening price. The RZR price represents the FCC’s maximum
willingness to pay in instances where there is an absence of competition. It should be emphasized
the RZR approach is not novel or untested; it is the standard approach to protecting buyers in a
reverse auction and is used in almost all auctions.
Only stations that freeze at round 0 are asked whether they will accept the RZR price. Provided
the vast majority of the stations accept the RZR price, the auction proceeds to round 1, possibly
with some impairments from RZR rejections. The decision to accept the RZR price is binding;
rejection of RZR means that the station will be repacked, possibly in the 600 MHz band. In
instances of many RZR rejections, the FCC may need to reduce the clearing target, but in our
extensive simulations this never occurred.
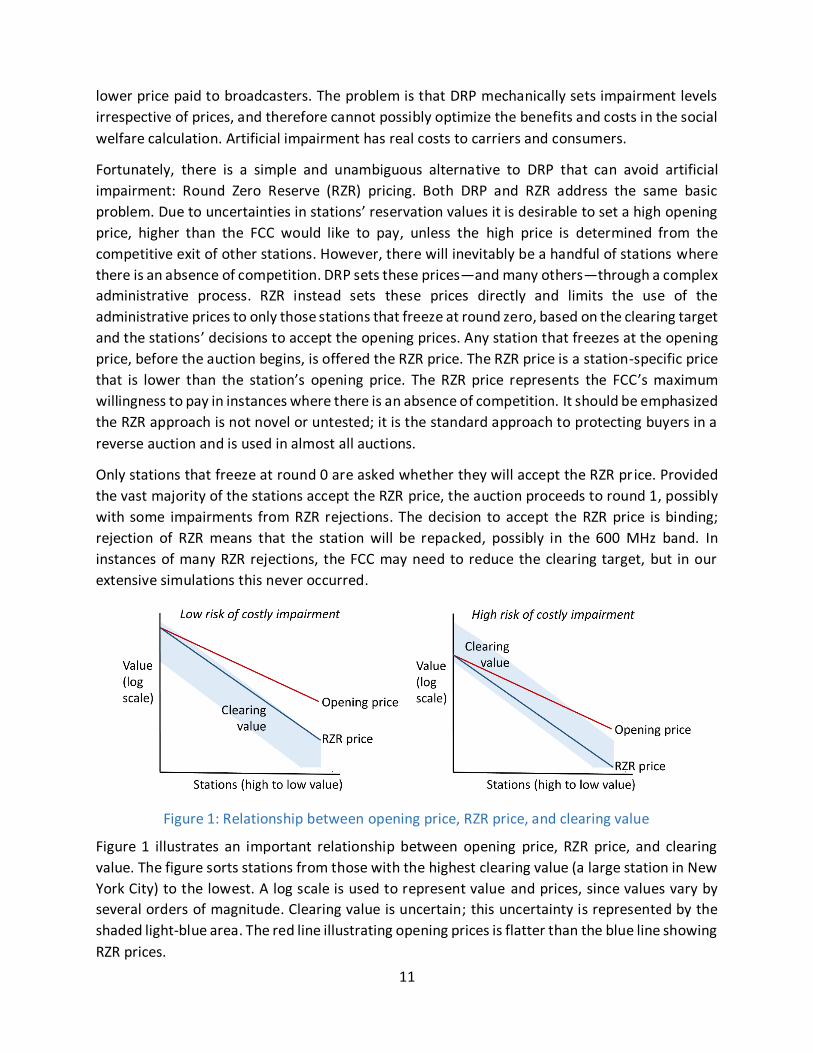
Figure 1: Relationship between opening price, RZR price, and clearing value
Figure 1 illustrates an important relationship between opening price, RZR price, and clearing
value. The figure sorts stations from those with the highest clearing value (a large station in New
York City) to the lowest. A log scale is used to represent value and prices, since values vary by
several orders of magnitude. Clearing value is uncertain; this uncertainty is represented by the
shaded light-blue area. The red line illustrating opening prices is flatter than the blue line showing
RZR prices.

12
In the left panel, opening prices start near the upper range of clearing value in New York City,
then fall more slowly than clearing values. The high starting price in New York assures that
stations that are willing to clear at a price reflective of the clearing value do so, if they are needed.
The flatter slope of opening prices promotes efficiency by making it more likely that high-value
stations, such as those in New York and Los Angeles, will be resolved either through repacking or
clearing before stations with less value to the auction. Efficiency is enhanced with this approach,
as it makes it less likely that a station in New Haven, for example, will get in the way of a station
in New York. This tendency for stations in major markets to resolve first is analogous to the
resolution of major markets in the forward auction—a fact that has been observed in every major
FCC spectrum auction. An additional benefit of a flatter curve for opening prices is that it further
motivates participation of stations in smaller markets, making it more likely that the reverse
auction will be highly competitive. RZR prices more closely follow clearing values, but are still
above likely clearing values, limiting the scope for costly impairment. Finally, the RZR price of the
highest-score station is equal to the station’s opening price. For this max-score station, there is
no reason to start the auction at a price above the FCC’s maximum willingness to pay; hence, the
opening price should equal the RZR price.
The right panel is the same as the left panel, but both opening and RZR prices have shifted down
(for example, using a base clock price of $900, rather than $1,500). The result is predictable.
Opening and RZR prices that are too low discourage participation and lead to impairment—or
even worse—a lower clearing target.
Our simulations show that higher opening and RZR prices greatly increase the likelihood of a
successful auction that clears the maximum feasible quantity of spectrum. Moreover, the
clearing cost is determined by competitive forces and therefore is largely invariant to the opening
and RZR prices.
The critical RZR detail is the formula that determines RZR prices. We considered a number of
possibilities for RZR prices. Ultimately, we settled on one of the simplest approaches based on
multiplying a station’s opening price by a multiplier that is less than or equal to 1 and reflects
forward auction spectrum value of the particular station.
Round Zero Reserve (RZR) price is calculated by multiplying a station’s opening price by its RZR
Multiplier, where
RZR Multiplier = (Local AWS-3 price/Maximum AWS-3 price)1/2
Local AWS-3 price = the weighted average of the prices, in $/MHzPop, paid in the AWS-3 auction
for spectrum in the PEAs that a station’s contour touches. The weighting is done on the basis of
the broadcast population that the station serves in each PEA, relative to the station’s total
broadcast population coverage.
Maximum AWS-3 price = the maximum AWS-3 Price in the country, which was $5.55/MHzPop for
Chicago.
13
The intent of the formula is to make RZR prices in the highest-valued markets close to their
opening price, while offering prices in lower-valued markets that reflect the lower value those
markets bring to the forward auction. The square root in the formula moderates the discount
applied to stations in lower-valued markets, which is warranted because clearing broadcasters in
small markets brings benefits that extend beyond their local market. For example, clearing a few
stations in border markets may make the difference between certain blocks being impairment-
free nationwide or not.
With this formula, the average RZR multiplier is approximately 57%. Top markets like Chicago,
New York and Los Angeles all are above 90%.
AWS-3 pricing is used because the AWS-3 auction was a competitive auction and offers the most
current pricing information for paired spectrum across geographic markets. Alternatively, a price
index that included data from other auctions could be applied in a similar fashion. However, we
believe the AWS-3 auction data provides the best benchmark.
Note that it is possible for a station that is not frozen at round zero to receive a price that is higher
than the RZR price. Such a price is set by the competitive exit of another station, and therefore is
acceptable to the broadcaster and presumably the FCC.
RZR is both simple to implement and straightforward to understand. In particular, the method is
readily studied in our simulations. We have found that typically only a handful of stations receive
the RZR price (typically in border markets such as Detroit and San Diego). In the most challenging
cases, more stations receive RZR prices, but even then it is a small minority of stations. The vast
majority of stations are frozen at competitive prices. Impairments are minimal, aside from
unavoidable impairments caused by foreign TV broadcast in border markets.
One defense of DRP we have heard from the FCC is that it establishes “competitive” prices, rather
than the “administrative” prices of RZR. It is true that DRP appears as being more market-based
than RZR, but this is an illusion. Both the prices and set of stations that freeze under DRP are
determined through administrative decisions, such as the opening prices and the impairment
levels. Moreover, the number of stations that freeze under DRP is potentially much larger and
more uncertain than under RZR. Finally, DRP fails the very basic tests of simplicity and
transparency. DRP is too complex and ambiguous to simulate without making additional
assumptions that may or may not be true. In the interests of simplicity, transparency, efficiency,
and fairness, the FCC should abandon DRP. DRP is a Trojan horse that will damage broadcaster
participation.
Encourage outcome discovery
The fourth critical change to the FCC proposal is the adoption of an improved information policy
that allows for desirable outcome discovery—both the likelihood of clearing and the clearing
price—during the process of bidding. The FCC wisely chose a dynamic clock process to gradually
reveal the supply curve in the reverse auction. Clock auctions are used primarily to promote

14
outcome discovery so that bidders can make better decisions during the auction and are exposed
to fewer risks.
The forward auction is a good example. In the forward auction, the FCC gradually raises the price
in markets where there is excess demand and reveals, at the end of each round, the demand by
PEA at the end of round price. This is valuable information for carriers to best manage their
bidding in light of spectrum portfolio needs. No individual bids are shown, just the aggregate
demand in each PEA. This approach has worked well in dozens of high-stakes clock auctions
world-wide, even in circumstances of high concentration. For example, the AWS-3 auction (also
a simultaneous ascending auction) had nearly the equivalent information policy. This auction was
viewed by all as quite competitive despite the fact that the vast majority of spectrum was won
by three bidders: AT&T, Verizon, and Dish.
In sharp contrast, for reasons unstated, the FCC has proposed that broadcasters receive no
information about supply as the reverse auction ticks down. This strange information policy is
especially odd when one considers that the broadcast market is much less concentrated than the
mobile broadband market. One argument is that the broadcasters do not have a “need to know”
the supply information when placing their bids; each station should just think of its reservation
value and exit when its value is reached. This argument is false. Even for a broadcaster with a
single station, the broadcaster has many options that must be weighed—whether to clear, share,
or move down to a lower band. Broadcasters with multiple stations, some dispersed across the
country, have portfolio needs and constraints that must be addressed. Having good outcome
discovery is essential to the decision making of such a broadcaster. The absence of this
information exposes the station to a great deal of risk, which of course deters participation,
undermining competition and a successful auction.
We have examined alternative information policies in our simulations. Our recommendation is
that the FCC reveal DMA vacancy in each bidding round. DMA vacancy is just the average of the
station vacancy across all stations in the DMA. The FCC currently calculates station vacancy at
each round for its own purposes. Vacancy, a number between 0 and 1, is a measure of excess
supply. We calculate DMA vacancy for each of our simulations. It is useful in outcome discovery—
giving the bidder some limited aggregate information related to excess supply—yet it does not
provide the kind of information that would be useful in supporting collusive arrangements.
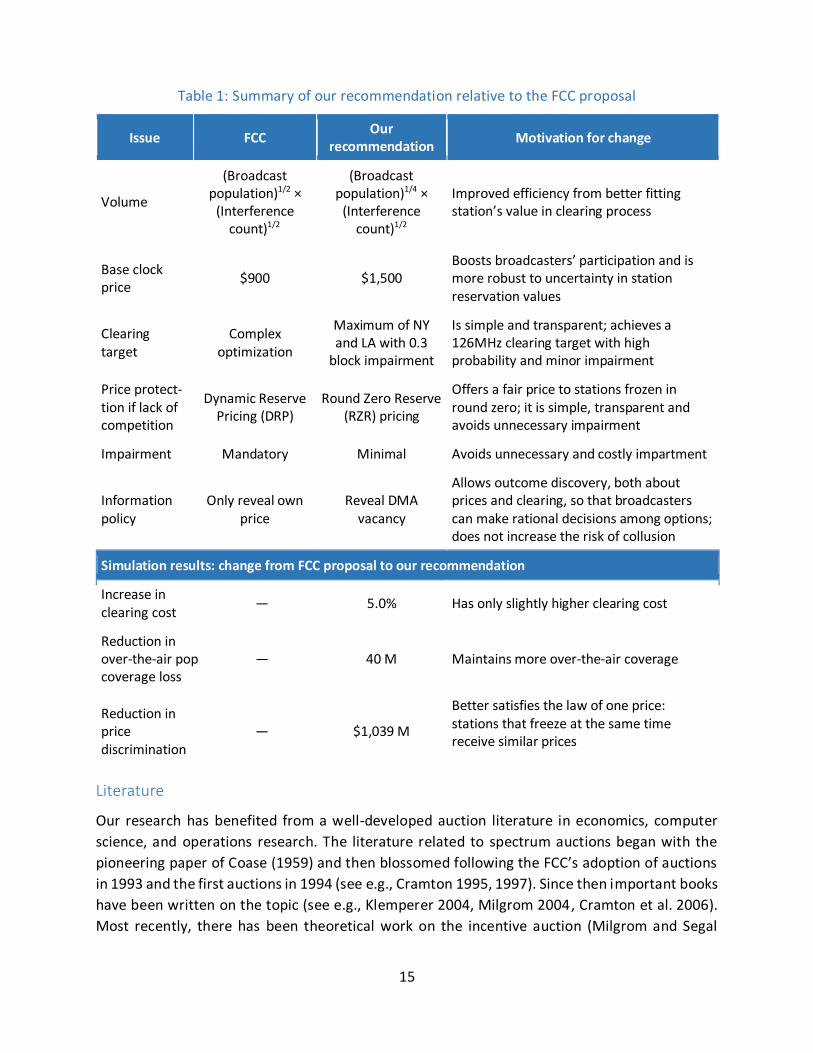
Summary of recommendations
Table 1 summarizes each of our recommendations and the motivation for the change. Summary
results from our simulations in the benchmark scenario are also shown. A critical benefit of our
recommendations that is not shown is a far greater robustness to challenges in broadcaster
participation and high reservation values. This benefit is shown when we present the detailed
simulation results.
15
Table 1: Summary of our recommendation relative to the FCC proposal
Issue FCC Our recommendation Motivation for change
Volume (Broadcast
population)1/2 × (Interference
count)1/2
(Broadcast population)1/4 ×
(Interference count)1/2
Improved efficiency from better fitting station’s value in clearing process
Base clock price $900 $1,500
Boosts broadcasters’ participation and is more robust to uncertainty in station reservation values
Clearing target
Complex optimization
Maximum of NY and LA with 0.3
block impairment
Is simple and transparent; achieves a 126MHz clearing target with high probability and minor impairment
Price protect-tion if lack of competition
Dynamic Reserve Pricing (DRP)
Round Zero Reserve (RZR) pricing
Offers a fair price to stations frozen in round zero; it is simple, transparent and avoids unnecessary impairment
Impairment Mandatory Minimal Avoids unnecessary and costly impartment
Information policy
Only reveal own price
Reveal DMA vacancy
Allows outcome discovery, both about prices and clearing, so that broadcasters can make rational decisions among options; does not increase the risk of collusion
Simulation results: change from FCC proposal to our recommendation
Increase in clearing cost — 5.0% Has only slightly higher clearing cost
Reduction in over-the-air pop coverage loss
— 40 M Maintains more over-the-air coverage
Reduction in price discrimination
— $1,039 M Better satisfies the law of one price: stations that freeze at the same time receive similar prices
Literature
Our research has benefited from a well-developed auction literature in economics, computer
science, and operations research. The literature related to spectrum auctions began with the
pioneering paper of Coase (1959) and then blossomed following the FCC’s adoption of auctions
in 1993 and the first auctions in 1994 (see e.g., Cramton 1995, 1997). Since then important books
have been written on the topic (see e.g., Klemperer 2004, Milgrom 2004, Cramton et al. 2006).
Most recently, there has been theoretical work on the incentive auction (Milgrom and Segal

16
2014). The reader is urged to consult the references at the end of this paper for other related
research.
We also have benefitted from the wealth of documents and information that the FCC has
provided on the incentive auction (see FCC 2002, 2012, 2013, 2014a, 2015). For an analysis of the
state of competition in mobile wireless see FCC 2014b.
Outline
Our study is structured as follows. We beginning with a discussion of the objective of the auction.
Then we discuss the economic setting, both from the carriers’ and broadcasters’ viewpoint. Next
we present a high-level version of the FCC proposal—the reverse auction to determine supply,
the forward auction to determine demand, and the integration of the reverse and forward
auction to determine the final outcome. The next four sections provide a detailed analysis of our
four main recommendations for improving the reverse auction: the scoring rule, the clearing
target, DRP and RZR, and the information policy. We then discuss a number of more minor issues
on which the FCC seeks comment.
Objectives
We apply the standard objectives for government spectrum auctions: efficiency, simplicity,
transparency, and fairness. The auction should perform well with respect to each of these
objectives with high probability. The design should be robust to key uncertainties of the setting.
The chief uncertainties are broadcaster participation levels and reservation prices. For this reason
we consider a variety of plausible participation levels and reservation prices.
We now define and discuss each of the four objectives.
Efficiency
One does not need to turn to arcane theories to understand the importance of the efficiency
objective—simple demand and supply analysis illustrates the theory well (Figure 2). To simplify,
we can think of the spectrum as a divisible good. The supply, offered by the broadcasters in the
descending-clock reverse auction, represents the marginal cost of supply. Stations with a high
cost of clearing exit the auction first and are seen on the far right side of the supply curve; stations
with a low cost of clearing exit the auction late—the left side of the supply curve. The demand,
bid by the carriers in the ascending-clock forward auction, represents the marginal value of
spectrum to carriers. At low prices, carriers demand a great deal of spectrum, but as the price
clock ticks higher, carriers reduce demands, as shown in the demand curve.

17
Figure 2: Efficiency is maximized at intersection of supply and demand
The left panel of Figure 2 shows the supply and demand curves. The point where supply and
demand intersect defines the equilibrium price and quantity (P*, Q*). This point represents the
welfare maximizing trade, with total surplus equal to the green area between the demand and
supply curves. This outcome is implemented with a single-price auction: all demand bid at prices
above P* trades with the supply offered at prices below P*. Trade of Q* occurs at the price P*.
This picture illustrates the two fundamental theorems of welfare economics: the competitive
equilibrium is efficient (first theorem) and the efficient outcome can be obtained as a competitive
equilibrium (second theorem).
In the incentive auction, it is not possible to perfectly balance supply and demand, because the
spectrum blocks are discrete (lumpy). This is illustrated in the right panel of Figure 2. To maximize
efficiency the FCC selects the highest clearing target for which demand exceeds supply. This is
126 MHz in the figure. Alternatively, the FCC could select a lower clearing target, such as 84 MHz;
however, this results in a significant welfare loss—the bright green area in the right panel of
Figure 2. Social welfare is maximized by setting the highest possible clear target.
Figure 3 illustrates the importance of encouraging participation in the auction. Even a modest
reduction in broadcaster participation, resulting in a shift to the left of the supply curve causes a
significant loss in total surplus (the red area).

18
Figure 3: A reduction in participation causes a loss in total surplus
The simple supply and demand analysis abstracts from many details. Still the analysis captures
much of the basic insights needed for auction design and policy discussions. However, there are
two key ways in which the analysis underestimates the benefits of clearing a large quantity of
spectrum.
First, the demand as represented in the figure and in the auction only reflects the share of value
that the carriers are able to capture as profits (producer surplus). Consumer value is much higher,
since a large share of the total value is retained as consumer surplus in the mobile broadband
market.
Second, since spectrum is an essential input in providing mobile communications, repurposing
additional spectrum improves competition in the market for mobile broadband services. This
increased competition fosters a healthy and innovative ecosystem for mobile broadband.
An emphasis on efficiency rather than revenue maximization in the forward auction (and cost
minimization in the reverse auction) is much better policy for the FCC. To quote from earlier work
discussing forward auctions (Cramton 2013, p. 3),
The goal for the government should be efficiency, not revenue maximization. The
government should focus on ensuring that those who can put the spectrum to its highest
use get it. Focusing simply on revenue maximization is short-sighted. Many steps such
as technical and service flexibility, and license aggregation and disaggregation, improve
efficiency and thereby improve revenues. But short-run revenue maximization by
creating monopolies, which would create the highest profits before spectrum fees, and
therefore would sustain the largest fees, should be resisted. Indeed, competition, which
ultimately will lead to greater innovation and better and cheaper services, will likely
generate greater government revenues from a long-run perspective. The government
can best accomplish this objective with an efficient auction that puts the spectrum to its
best use.

19
Simplicity
The auction should be as simple as possible, but not simpler. In the case of the reverse auction,
the economic problem to be solved is complex, largely because of the repacking problem to
establish the feasibility of clearing a particular quantity of spectrum. Each station’s clearing value
is interrelated as it depends on a large and complex network of interference constraints and
domain restrictions.
Simplicity is best measured in terms of the simplicity of participating in the auction. Clear rules
that make it straightforward to develop an effective bidding strategy get high marks for
simplicity. Simpler auction designs tend to avoid guesswork. For example, a descending clock
design that facilitates outcome discovery, both with respect to clearing prices and the prospects
for winning, is a simpler design than a static auction in which bidders, especially those with many
stations or many options, have to engage in substantial guesswork and speculation in order to
determine an effective bidding strategy.
Simpler designs also limit risks to bidders. Again dynamic designs with good outcome discovery
often let the bidder better manage budget and portfolio constraints. Executing a particular
business plan is often more straightforward in such designs.
Simpler designs tend to promote efficiency by letting the bidder express preferences more simply
and effectively.
Transparency
A first requirement of transparency is clear and unambiguous rules that map bids into outcomes.
With a transparent design, bidders know why they won or lost and understand why their
payments are what they are. Bidders are able—at least after the event—to confirm that the
auction rules were followed.
Higher levels of transparency are achieved in auction designs that have excellent outcome
discovery—both with respect to prices and prospects for winning. These are dynamic auctions,
such as the descending clock auction, in which substantial information is provided to bidders to
understand prices and winning prospects during the auction. Still the auction designer must
recognize that the release of some information could potentially be used to foster collusion or
improper coordination among bidders. For this reason it is common to release anonymous
information that is relevant to understanding the supply of spectrum being offered in various
markets. Transparent reverse auctions have an information policy that reveals information that
is most helpful in understanding supply. Such designs promote outcome discovery, which
generally promotes auction participation and competition.
Fairness
Equal opportunity is a basic requirement of fairness. All potential participants have access to the
rules and the rules do not inappropriately discriminate among parties. In the context of the
reverse auction, this means that stations offering a similar clearing benefit are paid similar

20
amounts for clearing. Of course, no two stations are identical. Prices will certainly differ across
stations, but prices should be nearly the same in instances where the stations offer nearly
identical clearing benefits.
One element of fairness that is part of the FCC proposal is that all stations—those who never
participated and those who exited after the initial participation decision—would face an equal
risk of being placed into the 600 MHz wireless spectrum block.
Discussion
Now that the four objectives have been defined, it is helpful to view them in combination. To a
large extent, the objectives are complementary. The auction designer can choose a design that
gets high marks with respect to each objective. This is most easily seen when we abstract from
details and consider the auction of a single divisible good, as we did in our supply and demand
analysis.
Consider a single-price descending clock auction in a competitive setting in which aggregate
supply is reported after each round. Our claim is that this auction gets high marks with respect
to all four objectives. First, the auction is a simple price discovery process. Bidding strategy
amounts to figuring out what the spectrum is worth to the bidder and then exiting when that
reservation value is reached. Second, the auction is highly transparent. The rules are clear and it
is easy to see why a bidder won or lost at a particular price. The revelation of aggregate supply
promotes excellent outcome discovery, both about the market price and also the prospects for
winning. Third, the auction is fair. Every potential bidder faces the same rules and all trade takes
place at the market-determined clearing price. And finally, the auction is efficient. Given the
straightforward and effective bidding strategy of exiting when reservation values are reached,
the auction is fully efficient, maximizing total surplus.
Of course, when we introduce complicating details, such as the network of interference
constraints and the domain restrictions, the auction necessarily becomes more complex.
However, it is still possible for the auction design to perform well with respect the four
complementary objectives, as we will see.
For the most part, the FCC’s proposed reverse auction has the potential for getting high marks
with respect to the four objectives. The descending clock auction with sequential feasibility
checking in order of exit bids is a simple and elegant solution to a complex economic problem.
However, for the auction to perform well, it is desirable to properly “tune” the basic parameters
of the design to the economic setting, and eliminate or simplify some add-ons to the basic design
that undermine the key objectives.
We structure our comments around our four main areas of concern:
1. Improving the scoring rule
2. Setting the clearing target in a simple and unambiguous way
3. Replacing DRP with RZR pricing
21
4. Enhancing the information policy to promote outcome discovery during the auction
However, before discussing these issues in detail it will be useful to set the stage with a high-level
description of the economic setting. Good auction design begins with objectives and then an
understanding of the economic setting. Then we can tailor the design elements to best meet the
objectives given the economic setting.
Economic setting
The FCC incentive auction breaks new ground by being a two-sided market. Both the supply
(broadcasters) and demand (carriers) are active participants. We must consider both, even if our
main focus is the reverse auction (supply side). We first examine the carriers’ demand for
spectrum. Then we turn to the broadcasters’ supply of spectrum.
Carriers’ demand for spectrum
Demand for mobile broadband is increasing exponentially. This is in large part because of the
rapid development and innovation in smart phones as illustrated for example by the sequence of
iPhones over the last decade. These devices, together with the supporting software and
networks, have made smart phones indispensable for most U.S. consumers.
Market structure
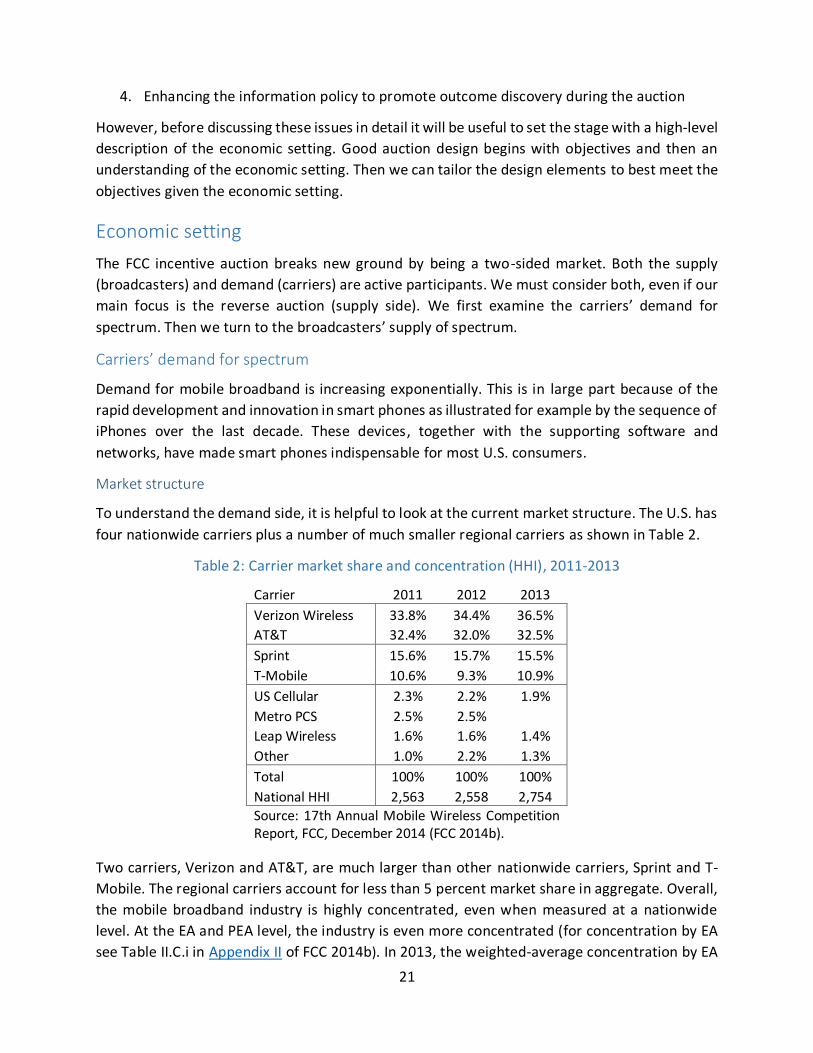
To understand the demand side, it is helpful to look at the current market structure. The U.S. has
four nationwide carriers plus a number of much smaller regional carriers as shown in Table 2.
Table 2: Carrier market share and concentration (HHI), 2011-2013
Carrier 2011 2012 2013
Verizon Wireless 33.8% 34.4% 36.5%
AT&T 32.4% 32.0% 32.5%
Sprint 15.6% 15.7% 15.5%
T-Mobile 10.6% 9.3% 10.9%
US Cellular 2.3% 2.2% 1.9%
Metro PCS 2.5% 2.5%
Leap Wireless 1.6% 1.6% 1.4%
Other 1.0% 2.2% 1.3%
Total 100% 100% 100%
National HHI 2,563 2,558 2,754
Source: 17th Annual Mobile Wireless Competition Report, FCC, December 2014 (FCC 2014b).
Two carriers, Verizon and AT&T, are much larger than other nationwide carriers, Sprint and T-
Mobile. The regional carriers account for less than 5 percent market share in aggregate. Overall,
the mobile broadband industry is highly concentrated, even when measured at a nationwide
level. At the EA and PEA level, the industry is even more concentrated (for concentration by EA
see Table II.C.i in Appendix II of FCC 2014b). In 2013, the weighted-average concentration by EA
22
was 3,027. The U.S. Department of Justice and the Federal Trade Commission merger guidelines
consider an industry with a concentration measure (HHI) of more than 2,500 to be highly
concentrated.
What is being auctioned?
The forward auction will auction some number of 5+5 MHz blocks in each PEA. The exact number
of blocks depends on the nationwide clearing target as shown in Table 3 and Figure 4. The FCC
wisely chose to auction paired blocks in the 5+5 MHz configuration that the current mobile
broadband technology, LTE, prefers. Carriers will surely use the LTE standard in the 600 MHz plan.
LTE has been adopted worldwide as the global mobile broadband technology. Although versions
of LTE can support unpaired spectrum, carriers have expressed a preference for paired auctions,
both worldwide and in the most recent AWS-3 spectrum auction in the U.S.
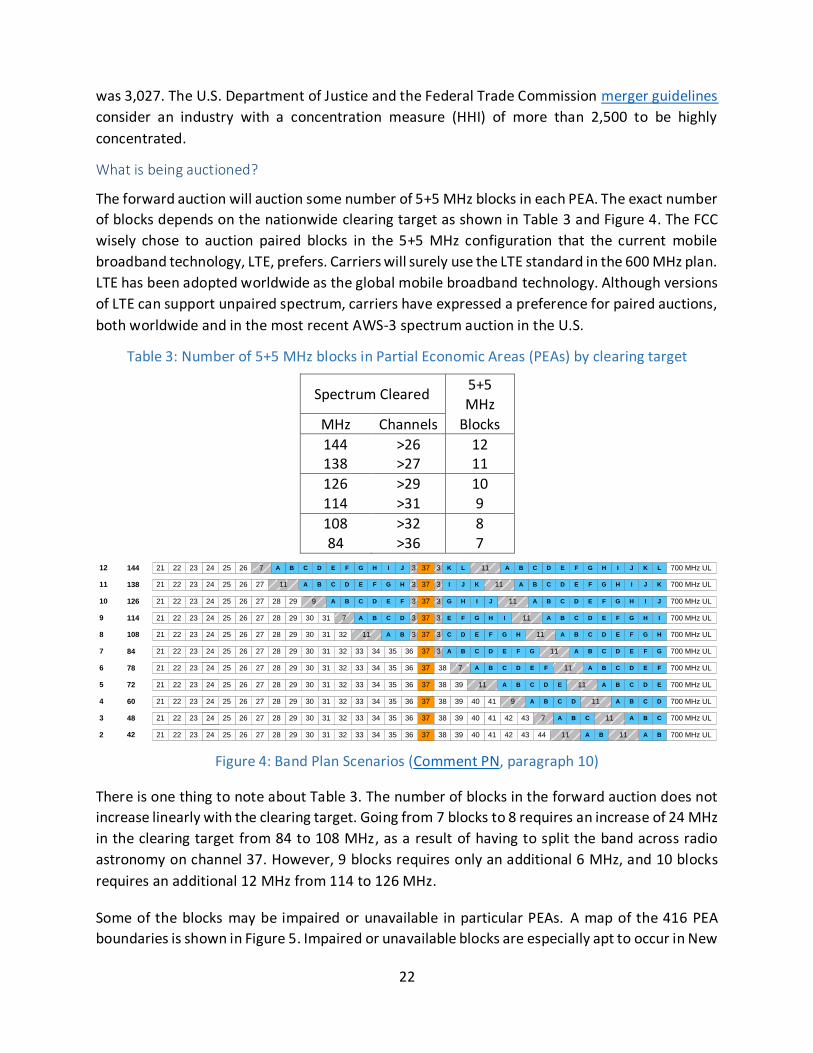
Table 3: Number of 5+5 MHz blocks in Partial Economic Areas (PEAs) by clearing target
Spectrum Cleared 5+5 MHz
MHz Channels Blocks
144 >26 12 138 >27 11
126 >29 10 114 >31 9
108 >32 8 84 >36 7
Figure 4: Band Plan Scenarios (Comment PN, paragraph 10)
There is one thing to note about Table 3. The number of blocks in the forward auction does not
increase linearly with the clearing target. Going from 7 blocks to 8 requires an increase of 24 MHz
in the clearing target from 84 to 108 MHz, as a result of having to split the band across radio
astronomy on channel 37. However, 9 blocks requires only an additional 6 MHz, and 10 blocks
requires an additional 12 MHz from 114 to 126 MHz.
Some of the blocks may be impaired or unavailable in particular PEAs. A map of the 416 PEA
boundaries is shown in Figure 5. Impaired or unavailable blocks are especially apt to occur in New
37 38333231 3635343029282726252724232221 39 42 44434140 700 MHz ULBA11 BA 112 42
37 38333231 3635343029282726252724232221 39 42 434140 700 MHz ULCBACBA7 11
37 38333231 3635343029282726252724232221 39 4140 700 MHz ULDCBADCBA9 11
3 48
4 60
37 38333231 3635343029282726252724232221 39 700 MHz ULEDCBAEDCBA5 72 1111
37 38333231 3635343029282726252724232221 700 MHz ULFEDCBFEDCB AA6 78 117
37 700 MHz UL26252724232221 30292827 333231 3534 GFEDC GFEDCBA BA36 117 384
9
108
37 700 MHz UL39
37 700 MHz UL302928 31 311
3
3 C HGFED B11
G H JI JIHGFED11
A
CBA
BA C HGFED
FEDCBA
3226252724232221 278
37 700 MHz UL7 3 3 IHGFE IHGFEDC11 BADCBA302928 3126252724232221 27114
10 292826252724232221 27126
37 700 MHz UL3 3H I KJ KJIHGFE11 DCBGFEDCB26252724232221 27 A A
37 700 MHz UL3 3I J LK LKJIHGF11 EDCHGFEDCB BA A26252724232221
11 138
12 144
11
7

23
York, Los Angeles, and PEAs along the Canadian and Mexican borders. The FCC has proposed two
levels of impairment. Blocks with impairment of less than 15 percent will be auctioned as
category 1 (low impairment) blocks; blocks with impairment of more than 15 percent but less
than 50 percent will be auctioned as category 2 (high impairment) blocks; blocks with greater
than 50 percent impairment will not be auctioned. In the clock stage of the forward auction all
blocks within the same impairment category are treated as identical and will have the same clock
price. Differences among blocks within the same category are expressed in the assignment stage,
which assigns specific blocks once the quantity of blocks won is determined in the clock stage.
Figure 5: FCC Partial Economic Area (PEA) Boundaries
Likely demand
Forecasting demand in a spectrum auction typically is quite challenging. However, in this case,
the challenge is greatly reduced as a result of the AWS-3 auction completed on 29 January 2015.
The AWS-3 was a competitive auction for mid-band paired spectrum. This paired spectrum will
be used by the carriers using the same LTE technology as the 600 MHz spectrum. The key
difference is that the mid-band AWS-3 spectrum has inferior propagation characteristics,
especially for providing coverage in buildings, in difficult terrain, and in less densely populated
areas. Nonetheless, the AWS-3 outcome does represent an excellent point of comparison with
which to assess demand in the forward auction.

24
Figure 6: AWS-3 winners by block with prices ($/MHzPop) and gross payments
Figure 6 shows the winners by block together with prices ($/MHzPop) and payments (before
small bidder discounts; Dish received a 25 percent discount as a “very small bidder”). The first
two blocks are unpaired blocks. These sold at a fraction of the paired price, indicating the carriers’
strong preference for paired spectrum. Since the 600 MHz auction will only include paired blocks,
we will focus on these hereafter. Block J is twice the size (10+10 MHz) of the other paired blocks
(G, H and I). This is why it is roughly twice as expensive as the smaller blocks. The fact that block
J had the highest price ($2.91/MHzPop vs. $2.69 for H and I and $2.37 for G) is a reflection of the
synergies that come with greater bandwidth. A carrier with 10+10 MHz has more than double
the capacity and speed than a carrier with 5+5 MHz. This complementarity is a feature of the LTE
technology. This will be important in assessing demand in the 600 MHz auction.
The nationwide average price for the paired blocks was $2.72/MHzPop. This is about three times
higher than investment banking estimates before the auction began in November 2014. The
higher prices are the result of a highly competitive auction—winners had to pay competitive
prices—and the high reservation values of the carriers. Although the prices were high, they were
much lower than the prices paid in Germany and the U.K. in 2000 during the tech bubble, which
were greater than €5/MHzPop, more than double the AWS-3 prices.
The AWS-3 paired price of $2.72/MHzPop is a timely estimate of 600 MHz auction prices. This
price implies forward auction revenues of $84.9 billion for the 126 MHz clearing target (10
blocks). There are good reasons to believe that revenues will be higher than $84.9 billion as a
result of the better propagation characteristics of the 600 MHz band and the greater scarcity of
low-band spectrum. The AWS-3 auction presents current market evidence that the 600 MHz
auction will achieve revenues above $80 billion if 10 unimpaired blocks are auctioned.

25
Figure 7: AWS-3 Winners by paired block and paired block total
Figure 7 shows the winners for the paired blocks. The final row shows the grand total across all
paired blocks. There were four major winners in the auction, AT&T, Dish, Verizon, and T-Mobile.
There are two interesting features of the winners’ shares.
First, the two smaller nationwide carriers, T-Mobile and Sprint, won relatively little. Both bidders
consciously decided to limit spending in the AWS-3 auction to focus spending on the 600 MHz
auction. Indeed, Sprint did not bid in the AWS-3. Both intend to compete aggressively in the 600
MHz auction, as both have a strong need for low-band spectrum to improve coverage in
buildings, in difficult terrain, and in less densely populated areas.
Second, the satellite operator Dish bid aggressively and won a large share of the spectrum. Dish
appears to be motivated by making its spectrum portfolio an interesting acquisition target for
Verizon or, alternatively, Dish could merge with T-Mobile. Dish’s stock price was higher following
26
the auction than before it started. This is a market test that suggests that Dish did not overpay
for the spectrum it won.
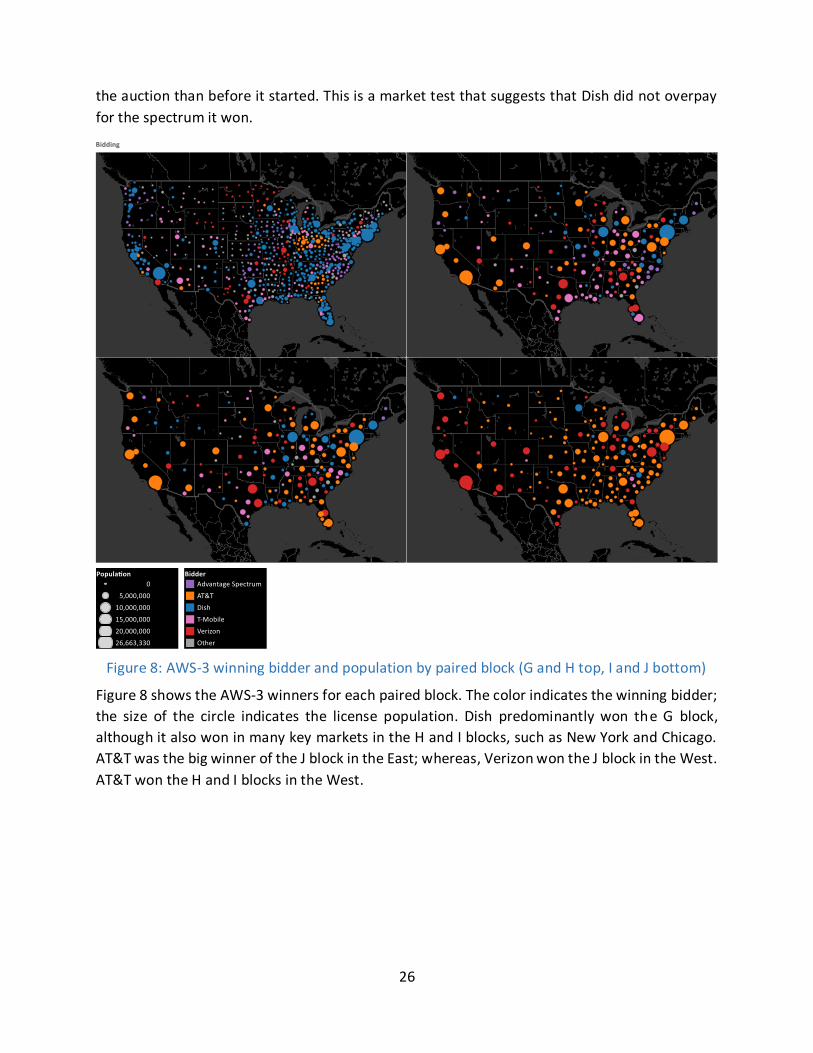
Figure 8: AWS-3 winning bidder and population by paired block (G and H top, I and J bottom)
Figure 8 shows the AWS-3 winners for each paired block. The color indicates the winning bidder;
the size of the circle indicates the license population. Dish predominantly won the G block,
although it also won in many key markets in the H and I blocks, such as New York and Chicago.
AT&T was the big winner of the J block in the East; whereas, Verizon won the J block in the West.
AT&T won the H and I blocks in the West.
27
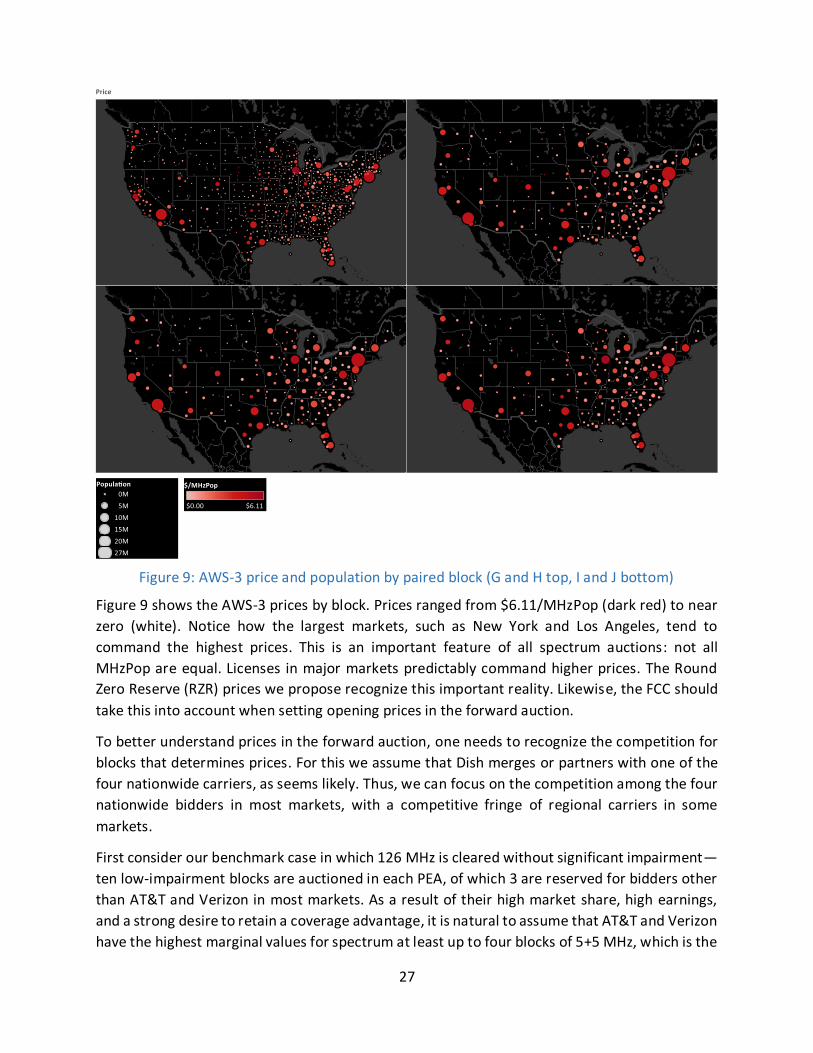
Figure 9: AWS-3 price and population by paired block (G and H top, I and J bottom)
Figure 9 shows the AWS-3 prices by block. Prices ranged from $6.11/MHzPop (dark red) to near
zero (white). Notice how the largest markets, such as New York and Los Angeles, tend to
command the highest prices. This is an important feature of all spectrum auctions: not all
MHzPop are equal. Licenses in major markets predictably command higher prices. The Round
Zero Reserve (RZR) prices we propose recognize this important reality. Likewise, the FCC should
take this into account when setting opening prices in the forward auction.
To better understand prices in the forward auction, one needs to recognize the competition for
blocks that determines prices. For this we assume that Dish merges or partners with one of the
four nationwide carriers, as seems likely. Thus, we can focus on the competition among the four
nationwide bidders in most markets, with a competitive fringe of regional carriers in some
markets.
First consider our benchmark case in which 126 MHz is cleared without significant impairment—
ten low-impairment blocks are auctioned in each PEA, of which 3 are reserved for bidders other
than AT&T and Verizon in most markets. As a result of their high market share, high earnings,
and a strong desire to retain a coverage advantage, it is natural to assume that AT&T and Verizon
have the highest marginal values for spectrum at least up to four blocks of 5+5 MHz, which is the

28
current threshold where synergies in capacity and speed with additional blocks end. These
synergies in capacity and speed are apt to offset the natural tendency for diminishing marginal
values. As such, at least up to a demand of 4 blocks each, we expect the demands from AT&T and
Verizon to be roughly flat and above the marginal values of other bidders. This has an immediate
implication: AT&T and Verizon win the 7 unreserved blocks (in most markets), splitting the 600
MHz spectrum 4-3. In most markets, the price of the unreserved blocks is set at the incremental
value of a fourth block for each dominant carrier. Similarly, the price of the reserved blocks is
determined by the fight between T-Mobile and Sprint to secure two blocks, rather than one. In
this case, there are even stronger synergies in speed and capacity in securing two blocks. This
means that the fight between T-Mobile and Sprint is apt to be intense and cause the reserve price
to be only slightly below the unreserved price or perhaps there will be no discount at all.
The ten block scenario (126 MHz clearing target) is especially desirable from a competition and
revenue perspective. The ten blocks are split 7-3 between unreserved and reserved. Then AT&T
and Verizon fight over who should get four blocks (20+20 MHz) or three blocks (15+15 MHz), and
T-Mobile and Sprint fight over who should get two blocks (10+10 MHz) or one block (5+5 MHz),
while other regional bidders and speculators will further intensify the competition.
Our view is that this competitive structure with ten blocks likely will mean that prices will not
increase much if fewer blocks were auctioned, say nine, eight, or seven blocks, which are the
other most relevant possibilities. Thus, we believe that the carrier demand curve is quite flat for
clearing targets between 84 and 126 MHz (7 and 10 blocks), as depicted in Figures 2-3. From this
we conclude that there is enormous carrier and consumer value from clearing as much spectrum
as possible.
The benefit of additional spectrum is an important input in the FCC’s auction design decisions. In
particular, it is highly relevant to decisions about opening prices (that motivate participation) and
RZR prices (that limit impairment). One quite conservative estimate of the incremental value of
another 5+5 MHz block of spectrum is $8.49 billion (the AWS-3 per block price). This is
conservative because: (1) it ignores the superior propagation characteristics of the low-band
spectrum, (2) it assumes that there is no consumer surplus, so that total surplus (benefit) is equal
to the as-bid producer surplus, and (3) it ignores the consumer surplus that surely comes from
enhanced competition in the downstream market for mobile broadband services. More
realistically, the FCC should assign a benefit higher than $8.49 billion to an additional 5+5 MHz
block.
Understanding the benefit from additional spectrum is essential in the decision about opening
prices and RZR prices. For example, if higher opening prices resulted in greater participation, and
this greater participation led to clearing one additional block, then the higher opening prices
would be preferable so long as clearing costs did not increase by more than $8.49 billion. Our
analysis examines this tradeoff in the much more complex setting where station reservation
values are uncertain.
29
Value destruction
The key drivers for carrier value are: (1) a nationwide interoperable band plan consistent with
global standards, (2) paired spectrum, (3) unimpaired spectrum, and (4) regulatory certainty. On
(1) and (2), the FCC’s proposal scores high marks. The FCC has proposed a nationwide
interoperable band plan that is consistent with global standards. Further, the FCC is auctioning
paired spectrum in 5+5 MHz blocks, which existing LTE is designed to handle. Regulatory
uncertainty is reduced with the timely conduct of a well-designed auction. The FCC is well on its
way to resolving regulatory uncertainty.
The most dangerous value-destroyer is impairment. Substantial impairment will greatly
complicate the forward auction, expose the carriers to significant risks, and erode the value of
the 600 MHz spectrum. For this reason, as we argue below, the FCC should strive to minimize
impairments, while at the same time establishing as high a clearing target as broadcaster
participation allows.
Broadcasters’ supply of spectrum
Up to 2,202 broadcast TV stations will compete to supply spectrum for clearing.2 Of these, about
500 volunteers are needed to clear 126 MHz of spectrum, less than one in four. Moreover, if 500
stations were willing to share a channel—freeing 250 channels—then only about 250 would be
needed to clear. These calculations suggest that the competition to supply spectrum is apt to be
intense, at least in most markets.
Our simulation analysis examines the competition to clear in great detail. Of course, competition
will vary across markets. Some will be highly constrained such as New York, Los Angeles, and
certain border markets; others will be unconstrained and require few or no volunteers.
Market structure
A good starting point in evaluating market-level competition is calculating the concentration
measure (HHI) based on alternative market definitions. Table 4 does this for four different
geographic aggregations: nationwide, EA, DMA, and PEA. The population-weighted average of
concentration is shown together with the population-weighted standard deviation. Broadcast TV
markets are commonly defined by DMAs. This implies a weighted average concentration of 1,218,
which the DOJ and FTC merger guidelines considers unconcentrated. Even with a finer market
definition such as PEA, the average concentration remains below 1,500, and therefore
unconcentrated.
2 On 9 June 2015, the FCC’s Media Bureau released a preliminary list of 2,202 auction-eligible stations. DA 15-679. Our simulations are based on the Commission’s earlier list of 2,173 auction-eligible stations; however, we do not believe that the revised list of stations results in any material changes to our analysis.

30
Table 4: Broadcaster concentration by geographic aggregation
Concentration
Weighted average
HHI
Weighted standard deviation
DOJ and FTC merger
guidelines*
Nationwide 159 Unconcentrated
Economic Area 998 634 Unconcentrated
DMA 1,218 760 Unconcentrated
PEA 1,497 1,521 Unconcentrated
* An HHI less than 1,500 is considered to be unconcentrated.
Of course, this is an average level of concentration. Particular DMAs or PEAs may experience a
much higher level of concentration. However, for the most part these tend to be in small markets
where there is little broadcast TV and no need for volunteers, such as American Samoa.
This analysis of market structure is particularly relevant to the information policy. As we saw in
the prior section, the carrier market is highly concentrated irrespective of geographic
aggregation. Yet the FCC has proposed that the carriers learn demand at the end of each round
at the PEA level. We applaud this level of transparency in the forward auction. Carriers need to
have a high degree of outcome discovery to manage portfolio, budget, and other aggregate
constraints. Moreover, recent auctions, especially the AWS-3 auction, have demonstrated that
this level of transparency does not create incentives for collusion or undesirable coordination.
There is no question that the AWS-3 auction, with a similar information policy, was highly
competitive.
Our analysis of market structure in broadcasting demonstrates that concerns of collusion and
inappropriate coordination among broadcasters in the reverse auction are misplaced. The
market structure is unconcentrated even at the PEA level, except perhaps a few small PEAs, such
as American Samoa, which are easily combined with other small PEAs to assure that no PEA is
highly concentrated. From this, the obvious conclusion is that the reverse auction should have
an information policy that is at least as transparent as in the highly concentrated forward auction.
Supply by PEA should be revealed at the end of each round in the reverse auction.
What is being auctioned?
A major reason for at least a moderate level of transparency in the reverse auction is that
broadcasters, even single station owners, have a need for outcome discovery, both the likelihood
of clearing and the clearing price. Each single-station broadcaster has multiple options to
consider—whether to clear, whether to share, or whether to move down to a lower band.
Outcome discovery helps such a bidder decide among these four options.
Some broadcasters have many stations, often spread around the country as for example the
major networks: CBS, NBC, ABC, Fox, Univision, and ION. For these key broadcasters in the
incentive auction, outcome discovery is essential. Just like the nationwide carriers, these

31
broadcasters have portfolio, budget, and other aggregate constraints that demand a high level
of outcome discovery to manage. The current “no transparency” proposal would expose these
bidders to much greater risks and guesswork, thereby reducing incentives for robust
participation.
Likely supply
Our simulation model depends critically on the stations’ reservation values. We therefore have
taken great care in developing a plausible valuation model. This was accomplished with extensive
discussions with many broadcasters, taking into account revenue data, historical station sales
prices, station affiliation information, total market revenue, and other factors. Still the
reservation values are uncertain. We therefore add an unbiased error term to our benchmark
values. Finally, to establish robustness of the auction design to uncertainty about values we
consider cases where all values are scaled up from the benchmark by 0, 50, and 100 percent. This
results in station reservation values that range from near-zero to over 2 billion dollars. Due to the
sensitive nature of this data, we are not disclosing further details about the reservation price
model at this time.
For simplicity, we assume that each station’s exit bid is equal to the station’s reservation value.
Given the competitive market structure in broadcasting this is a reasonable initial assumption.
Alternatively, one can think of the reservation value model as an exit bid model that includes in
the exit bid the station’s strategy mapping reservation values into exit bids. A full equilibrium
analysis of broadcaster bidding is well beyond what can be accomplished in this study.
Cost escalation
As with the carriers, there are things that the FCC can do to enhance the attractiveness of the
reverse auction for broadcasters. The most direct is the setting of high opening prices and RZR
prices to encourage participation. Next, the FCC can adopt unambiguous auction rules that are
as simple as possible given the complex economic problem. Third, the FCC can improve
transparency by promoting outcome discovery with a sensible information policy. And fourth,
the FCC can promote efficiency by setting as large a clearing target as possible given the level of
broadcaster participation.
The absence of any of these key elements will reduce broadcaster participation and reduce the
chance of a successful auction. The aggregate supply curve will shift to the left as in Figure 3, and
a great deal of social welfare will be lost.
The FCC proposal
Our starting point is the FCC proposal as presented in the Comment Public Notice (FCC 14-191).
We summarize here the key elements of the proposal. All references in this section are to
paragraphs in the Comment Public Notice (FCC 14-191).
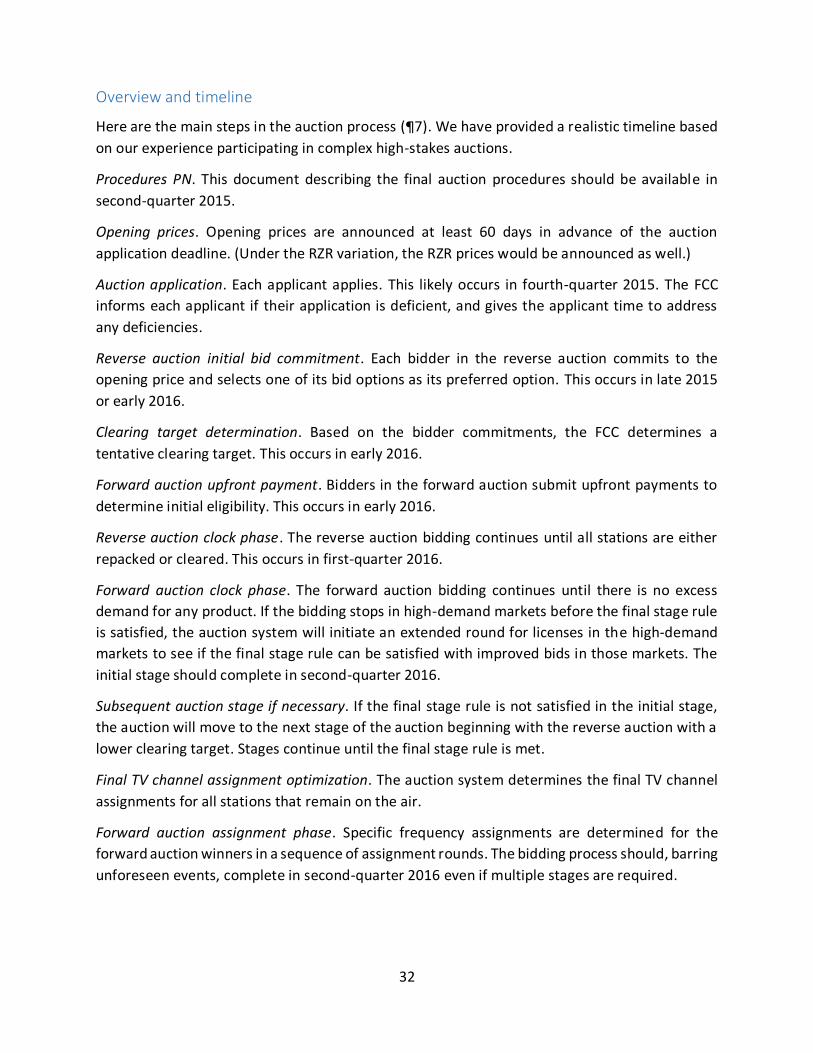
32
Overview and timeline
Here are the main steps in the auction process (¶7). We have provided a realistic timeline based
on our experience participating in complex high-stakes auctions.
Procedures PN. This document describing the final auction procedures should be available in
second-quarter 2015.
Opening prices. Opening prices are announced at least 60 days in advance of the auction
application deadline. (Under the RZR variation, the RZR prices would be announced as well.)
Auction application. Each applicant applies. This likely occurs in fourth-quarter 2015. The FCC
informs each applicant if their application is deficient, and gives the applicant time to address
any deficiencies.
Reverse auction initial bid commitment. Each bidder in the reverse auction commits to the
opening price and selects one of its bid options as its preferred option. This occurs in late 2015
or early 2016.
Clearing target determination. Based on the bidder commitments, the FCC determines a
tentative clearing target. This occurs in early 2016.
Forward auction upfront payment. Bidders in the forward auction submit upfront payments to
determine initial eligibility. This occurs in early 2016.
Reverse auction clock phase. The reverse auction bidding continues until all stations are either
repacked or cleared. This occurs in first-quarter 2016.
Forward auction clock phase. The forward auction bidding continues until there is no excess
demand for any product. If the bidding stops in high-demand markets before the final stage rule
is satisfied, the auction system will initiate an extended round for licenses in the high-demand
markets to see if the final stage rule can be satisfied with improved bids in those markets. The
initial stage should complete in second-quarter 2016.
Subsequent auction stage if necessary. If the final stage rule is not satisfied in the initial stage,
the auction will move to the next stage of the auction beginning with the reverse auction with a
lower clearing target. Stages continue until the final stage rule is met.
Final TV channel assignment optimization. The auction system determines the final TV channel
assignments for all stations that remain on the air.
Forward auction assignment phase. Specific frequency assignments are determined for the
forward auction winners in a sequence of assignment rounds. The bidding process should, barring
unforeseen events, complete in second-quarter 2016 even if multiple stages are required.
33
Reverse auction
The purpose of the reverse auction is to identify broadcasters willing to relinquish some or all of
their spectrum usage rights, and the corresponding incentive payments those broadcasters will
require in order to clear and achieve a clearing target.
There are three options in addition to non-participation or exit: (1) go off-air, (2) end in Low-VHF,
and (3) end in High-VHF. Bidders can only bid for options lower than their original band.
Bidders will only be informed of the prices of their stations.
Opening prices for each option are provided at least 60 days in advance of the deadline to apply
to participate. Each bidder is required to indicate which of the allowed options the bidder is
willing to consider and favorite one among them.
Not all bidders are allowed to bid for all of their indicated options. The FCC selects which options,
among those indicated by each bidder, are offered to each bidder (¶91). All bidders are allowed
to bid for going off-air, if going off-air was indicated.
Each station is offered an opening price for each bidding option. Opening prices for Low-VHF and
High-VHF are a specific percentage of going off-air. Opening prices for going off-air are calculated
using a base clock price and a station-specific volume; that is,
Opening price = (Base clock price) × (Volume)
The proposed base clock price is $900. Each station’s volume is calculated as follows (see
Appendix D):
Station volume = (Broadcast population)1/2 × (Interference)1/2
Station volume is scaled so that the maximum is one million.
Low-VHF have an opening price between 67 and 80 percent of going off-air. High-VHF have an
opening price between 33 and 50 percent of going off-air. The exact percentages have yet to be
set by the FCC.
Each station is offered successively lower prices for each of its available options. When an option
becomes essential to meeting the clearing target, the price for that option stops decreasing; that
is, this station is “frozen”. Bidders only bid for one option at a time. A bidder who indicated more
than one option is able to switch from lower to higher options, but not the other way around.
In the early rounds of the auction, prices for all station options decrease even if some of the
stations are essential to meeting the clearing target. This process is known as dynamic reserve
pricing (DRP). Under DRP, stations may be assigned to the 600 MHz band instead of being offered
the price at which they become essential to meeting the clearing target. This procedure lowers
the clearing cost by increasing impairments in the 600 MHz band (see Appendix D for details).
34
The reverse auction concludes at a given clearing target when all stations have been either
assigned to their pre-auction bands or one of their bidding options. If the final stage rule fails,
the auction will continue and some of the previously frozen stations become active again. The
base clock price will be reset to the highest clock price at which one of the newly active stations
became frozen.
Forward auction
The purpose of the forward auction is to assign spectrum licenses to interested carriers in
exchange for competitively determined payments.
Interested carriers inform the FCC about geographic areas in which they are interested in
acquiring spectrum licenses. The FCC then notifies each forward auction applicant of the
identities of other forward auction applicants that have selected geographic areas that overlap
with the applicant’s own selection. Interested carriers are required to submit upfront, refundable
payments as a prerequisite to being found qualified to bid on licenses. The upfront payment is
$2,500 per bidding unit (see below).
Two types of generic licenses are offered: (1) Category 1, and (2) Category 2. Category 1 licenses
have potential impairments affecting 15 percent or less of the population in the license area.
Category 2 licenses have potential impairments affecting between 15 and 50 percent of the
population in the license area.
At the end of the clock phase, final clock prices for licenses are discounted by their amount of
impairment. A discount of one percent is applied for every one percent of impartment to each
license, regardless of its category.
Licenses will be assigned a bidding unit. Each license bidding unit will be calculated by multiplying
the population of each PEA associated with the license by an index value for the PEA (see
Appendix F).
The forward auction is carried out using an ascending clock format. In each round, each bidder
indicates the quantity of blocks in each category in each PEA that it demands at a given price. A
bidder is allowed to demand fewer blocks in a category than it did in the previous round only if
aggregate demand will not fall below the available supply of licenses in the category.
In each round, the price of each license increases a fixed percentage between 5 and 15 percent.
Initial prices for every license will be determined per bidding unit. The initial price will be $5,000
per bidding unit.
In each round, bidders will be allowed to use three different types of bids: (1) simple bids, (2) all-
or-nothing bids, and (3) switch bids. A simple bid indicates a desired quantity of licenses in a
category at a price. An all-or-nothing bid allows the bidder to indicate that it wants the bid to be
implemented fully or not at all. A switch bid allows the bidder to request to move its demand for
a quantity of licenses from one category of generic licenses to another category within the same
PEA (see Appendix G).
35
All bidders are required to bid on blocks with bidding units equal to 92 to 97 percent of their
current eligibility in the round.
Whenever: (1) demand does not exceed supply in “high-demand” PEAs and (2) proceeds of the
forward auction are not sufficient to cover the clearing cost of the reverse auction and the costs
of running the auctions, an extended round is implemented. In this round, prices in “high-
demand” PEA’s increase and bidders send new, improved bids (see Appendix G). The purpose of
this extended round is to increase the forward auction proceeds without reducing the quantity
of allocated spectrum.
The auction ends whenever bidding has stopped in all PEAs on every category. In case a clearing
target fails, the bidding resumes with prices equal to the last round in each PEA, regardless of
whether the last round is an extended round or regular round.
When the forward auction concludes, the assignment auction begins. In this auction, winners of the forward auction will have the opportunity to bid for specific frequencies for the licenses they won (see Appendix H).
Integration of the reverse and forward auctions
The FCC has structured the incentive auction in two phases: (1) a clock phase and (2) an
assignment phase. The clock phase ends and the assignment phase begins when the final stage
rule is met.
The clock phase is composed of four main elements: (1) a rule to determine the clearing target,
(2) the reverse auction, (3) the forward auction and (4) a rule to determine when the clock phase
has ended.
The assignment phase is composed of two elements: (1) reverse auction assignment and (2)
forward auction assignment.
Figure 10 presents a flow chart of the incentive auction.
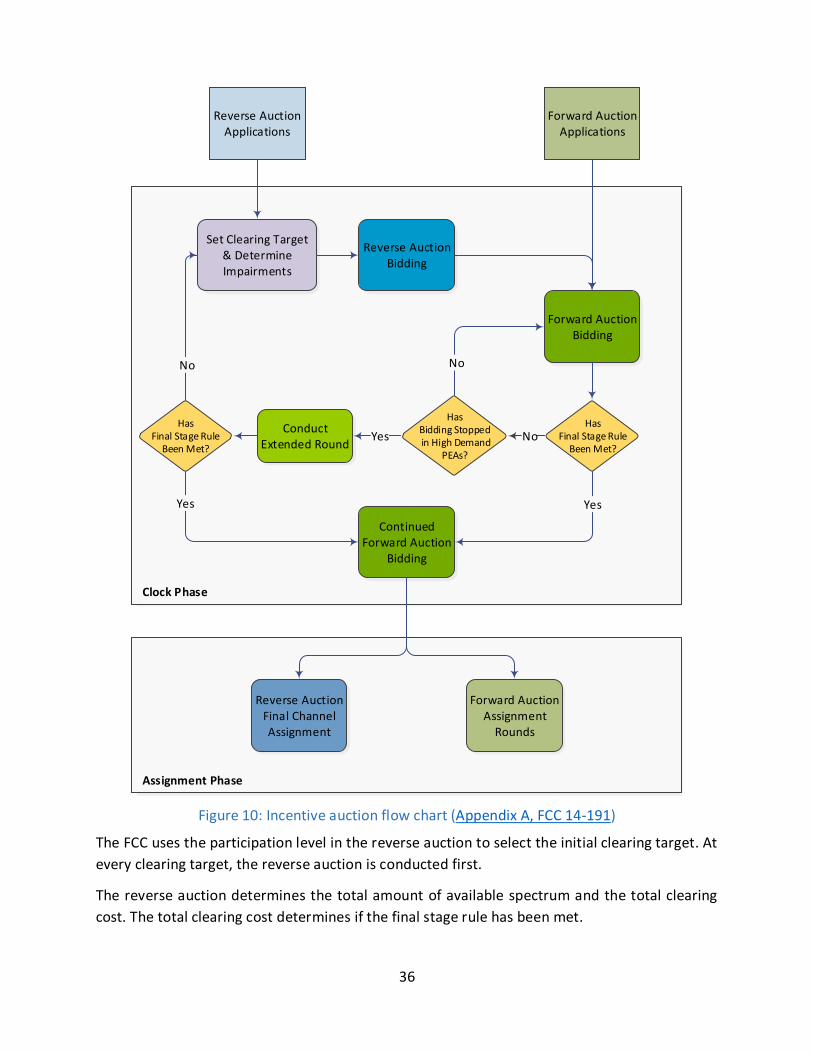
36
Figure 10: Incentive auction flow chart (Appendix A, FCC 14-191)
The FCC uses the participation level in the reverse auction to select the initial clearing target. At
every clearing target, the reverse auction is conducted first.
The reverse auction determines the total amount of available spectrum and the total clearing
cost. The total clearing cost determines if the final stage rule has been met.
Assignment Phase
Clock Phase
Reverse Auction Applications
Set Clearing Target & Determine Impairments
Reverse Auction Bidding
Forward Auction Bidding
HasFinal Stage Rule
Been Met?
Reverse Auction Final Channel Assignment
Forward Auction Assignment
Rounds
Yes
NoHas
Final Stage Rule Been Met?
No
Conduct Extended Round
Yes
ContinuedForward Auction
Bidding
HasBidding Stopped in High Demand
PEAs?
No
Yes
Forward Auction Applications

37
The final stage rule determines when the current clearing target is the final clearing target. It is
satisfied whenever the following two components are met: (1) reserve prices and (2) clearing
costs.
The reserve price is satisfied whenever one or both of the following conditions are met: (1) the
average price per MHzPop for licenses in the forward auction is at least $1.25 MHzPop, or (2) the
total proceeds associated with licenses in the forward auction exceed the product of $1.25
MHzPop and the total number of pops for those licenses.
The clearing cost component is satisfied whenever the forward auction proceeds exceed the sum
of: (1) payments to winning bidders in the reverse auction (determined in the reverse auction),
(2) the Commission’s relevant administrative costs of the auction (to be determined), (3) an
estimate of broadcaster relocation costs ($1.75 billion), and (4) any amounts still needed to
provide funding for FirstNet (up to $7 billion).
We now address in detail the four critical changes to the FCC proposal that are needed to
maximize the chance of a successful auction. These are improve the scoring rule, simplify the
setting of the clearing target, replace DRP with RZR, and enhance the information policy.
Improve the scoring rule
The scoring rule plays a critical role in the auction process for two reasons. First, it sets the
opening prices that motivate participation in the auction. If prices are set too low, there will be
insufficient broadcaster participation and the auction will fail. Second, since in the reverse
auction all prices move down in the same percentage terms, the scoring rule determines the
relative prices of stations that are still active. This plays an essential role both in the sequencing
of exits during the auction and in establishing the payments made to broadcasters that clear.
As discussed in the introduction, given the importance of the scoring rule to the auction process
and outcome, we examined a wide variety of alternative scoring rules. In crafting alternatives,
we focused on the primary objectives of efficiency, transparency, simplicity, and fairness. In the
end, we settled on approaches that followed the FCC’s basic structure.
The scoring rule consists of two components, the base clock price and volume, in particular:
Score = (base clock price) × (volume)
For the base clock price, we consider two alternatives in addition to the FCC price of $900: $1250
and $1500. These two base clock prices increase the FCC base clock price to encourage
participation and thereby make the auction more robust to high broadcaster reservation values.
In examining the costs and benefits of higher opening prices, one must recognize a large
asymmetry in the costs of deviating from “optimal” opening prices. If prices are set too low,
broadcasters do not participate and the auction fails; if prices are set too high, then there is a
possibility that clearing costs may be slightly higher as a result of market power in one or more
service areas. This implies that given the great uncertainty about the “optimal” price level, the

38
FCC should err on the side of higher opening prices. The FCC does the same in the forward
auction—where opening prices are set at a small fraction (often 20 percent or less) of estimated
final prices.
The higher base clock prices are motivated by new information, specifically the high carrier values
revealed in the AWS-3 auction. At the time the FCC set the base clock price at $900, investment
bankers were valuing the AWS-3 spectrum at roughly one-third of the prices in the AWS-3
auction. Thus, we now have a convincing market test that carrier values are substantially higher
than we thought in the fall of 2014. This new price information warrants a significant increase in
the base clock price.
Not raising the base clock price would be a strange and poor policy given this clear market signal.
The AWS-3 outcome tells us that the greatest risk in the incentive auction is a shortage of
broadcasters from opening prices that are too low, rather than a shortage of revenues in the
forward auction.
A high base clock price greatly motivates broadcaster participation. Greater participation means
more cleared spectrum and greater social welfare. Moreover, the greater participation, holding
the clearing target fixed, means more competition and lower prices in the reverse auction.
A higher base clock price can be thought of as buying insurance, which protects against the
possibility that some broadcasters have a high reservation value and therefore will not
participate unless there is a high base clock price. What the simulation analysis will show is that
this insurance is actually quite inexpensive (in terms of clearing cost) and reaps large benefits in
terms of a higher probability of a successful outcome.
For volume, two measures stand out as good alternatives to the FCC volume measure. We
experimented with a range of alternative volume measures, and describe two additional
formulas, one which makes minimal changes to the FCC formula and one which makes
substantive changes to the FCC formula, but best represents a station’s preclusive effect as
shown through the FCC’s constraint files. We focus on these two measures and the FCC proposal
in our analysis:
FCC volume = (Broadcast population)1/2 × (Interference count)1/2
Reweighted volume = (Broadcast population)1/4 × (Interference count)1/2
Freeze volume = (Precluded population) × (Freeze probability)
where
Broadcast population = a station’s interference-free broadcast population. This is the FCC’s
population measure defined in ¶96 of the Comment PN.
Interference count = a station’s count of the number of pairwise interference constraints. This is
the FCC’s interference measure also defined in ¶96 of the Comment PN.

39
Precluded population = the population that cannot be served by any other station if the specified
station is repacked. This is a new measure of population that better reflects the population that
the station interferes with if repacked. The full definition is given below.
Freeze probability = the frequency with which the station freezes in thousands of simulations
with a random order of station exits. This is a measure of repacking difficulty that follows directly
from the interference constraint and domain files, as proposed in Kearns and Dworkin (2014). To
avoid extremes, freeze probabilities are bounded with a floor and a ceiling (e.g., a floor of 0.1 and
a ceiling of 0.8). We discuss this measure below.
Precluded population
The definition of precluded population is the population that cannot be served by any other
station if a certain station is repacked. It is a quantity that can be derived from the pairwise
interference file, together with the associated output from TVStudy. It has many attractive
properties. For example,
For a station that causes no interference, precluded population is its interference-free
broadcast population.
Blocked population is only counted once. Unlike some metrics which grow to large
numbers with no intuitive meaning, precluded population produces numbers that still
represent real population counts. They are higher than the broadcast population counts
because they include blocked populations that are outside a station’s service contour or
on adjacent channels. So for the KAMU-TV example shown in the Appendix, the broadcast
population is only 330,386, but the precluded population is 8.5 million. The interpretation
of these numbers is simply that if KAMU-TV is assigned to channel 25, it will make it
impossible for any other station to provide service on channel 25 to 8.5 million people,
including 330,386 inside KAMU’s contour, and 8.2 million people outside of KAMU’s
contour. KAMU should be priced equivalently in the auction to other stations in the same
area that block service to 8.5 million people when repacked.
Simulations show that the sum of the precluded populations of all stations that can be
packed onto a single channel across the country averages about 300 million—close to the
national population. Intuitively this is right because in a tight repack almost the entire
national population should be precluded, otherwise there would be open spaces available
for repacking more stations.
The sum of precluded populations of repacked stations is much less variable in our
simulations than the sum of broadcast populations, suggesting it is a better indicator of
volume—when optimally packing a trunk with suitcases the sum of the volumes of the
packed suitcases is roughly a constant equal to the volume of the trunk.
The details of calculating precluded population are in the Appendix.
Precluded population is a much better measure of a station’s contribution to the clearing process
than interference free population. The FCC’s population measure appears to focus, not on

40
clearing value, but on station enterprise value. That is, it appears to be motivated as a means to
price discriminate against certain stations, specifically stations that have a high value in clearing
but have a small broadcast population. This price discrimination is risky, as it likely leads to two
inefficiencies: (1) the repacking of stations that have much greater value in clearing, and (2) the
clearing of some stations with high broadcast population that add comparatively less to the
clearing process.
Although it is conceivable that the FCC’s price discrimination may be useful in a world in which
revenues from the forward auction are small, the AWS-3 outcome has eliminated that possibility.
This is why a shift away from broadcast population is desirable as a way to reduce the
inefficiencies created with price discrimination. All of our alternatives make this shift. Reweighted
volume puts less weight on broadcast population and freeze volume eliminates broadcast
population altogether.
An additional reason to put less weight on the broadcast population and more weight on
precluded population is that doing so is consistent with the FCC’s rule making. For example, in
the pricing discussion of the Report and Order (FCC 14-50 at ¶450), the FCC states, “Thus, a
station with a high potential for interference will be offered a price that is higher than a station
with less potential for interference to other stations. Setting prices in this manner will encourage
stations with more interference potential to remain active in the reverse auction bidding longer,
increasing the efficiency of the repacking process by reducing the likelihood that such stations
will have to be assigned channels, thereby blocking other stations with less interference
potential.”
Freeze probability
Freeze probability is an amazingly simple measure of interference and domain scarcity. Freeze
probability is the long-run frequency that a station freezes given a random exit of stations. The
beauty of freeze probability is that it reduces FCC’s interference constraint and domain files into
a single, meaningful number for each station. Notice in particular that freeze probability does not
depend on any model of station reservation values or other assumptions. Freeze probabilities
are reproducible by anyone using only the data (interference constraints and domains) that the
FCC has released. It is an “assumption free” measure that summarizes how essential the station
is in the clearing process. Stations with a freeze probability of 1 are essential; stations with a
freeze probability of 0 are inessential. Most stations lie somewhere in between.
Unlike the other measures, freeze probability has a natural scale. This is why it is given weight
one in the Freeze volume measure. However, it is useful to avoid the extreme probabilities of 0
and 1. For this reason we bound freeze probability with a floor and ceiling, typically 0.1 and 0.8.
This bounding has two desirable features: (1) it assures that inessential stations still are able to
participate in the auction and see a positive price, and (2) it reduces the reward to essential
stations to a level that is similar to stations that are extremely valuable in clearing, but not
absolutely essential. Freeze probabilities of 1 typically are the result of domain limitations, such
as in difficult border markets.

41
Freeze probability in general depends on the clearing target. However, for simplicity, we decided
that a practical measure of volume should not depend on the clearing target (the size of suitcases
do not vary with the size of the trunk). For this reason, we calculate freeze probability with our
benchmark clearing target of 126 MHz. We calculated freeze probabilities with 11,500 simulation
runs. This was sufficient to assure an accurate measure of the freeze probability (within 0.005
with high probability).
Freeze volume replaces the FCC’s interference constraint count with freeze probability, because
it is a superior measure of interference problems. There are stations with many constraints that
can be repacked without problems; conversely, there are stations with few constraints that are
difficult to repack. Freeze probability does a better job of capturing the importance of
interference constraints as well as domain scarcity.
Of all the volume measures, freeze volume is on the strongest theoretical grounds. It represents
the best measure of a station’s value in clearing, as determined from the population that is
precluded if the station is repacked and the likelihood that the station must clear to maintain a
feasible repack. Our simulation work, however, showed that freeze volume did not perform
significantly better than reweighted volume. Thus, to minimize the change relative to the FCC
proposal, we focus on reweighted volume.
In a subsequent section, we compare the various scoring rules using our simulation analysis.
However, since the simulations depend on a complete specification of the auction rules, we
discuss the remaining three issues before turning to the simulations.
Simplify the setting of the clearing target
A critical step in the incentive auction is the setting of the clearing target following the
broadcasters’ decisions to participate. Even minimal levels of transparency require clear and
unambiguous rules on how the initial clearing target is set based on the broadcasters’
participation decisions. The FCC has proposed an approach that uses optimization and possibly
other factors to determine the clearing target.
The FCC’s approach is so complex that we have only recently been able to implement it. Even
now, after many months of intense work, we have had to make some simplifying assumptions to
solve the optimization steps. Further we remain uncertain as to whether the FCC’s optimization
is equivalent to ours.
Our simulations suggest that a far simpler approach will work quite well. The approach recognizes
that the clearing target, and hence the nationwide band plan, almost always is limited by
participation levels in New York and Los Angeles. One other aspect is that the network of
interference constraints is separable between East and West. This means that there is no reason
to limit the number of blocks sold in the East as a results of constraints in the West or vice versa.
For this reason, it makes sense to set the clearing target based on the maximum target that is
feasible with minimal impairment in either New York or Los Angeles, whichever is greater. Thus,
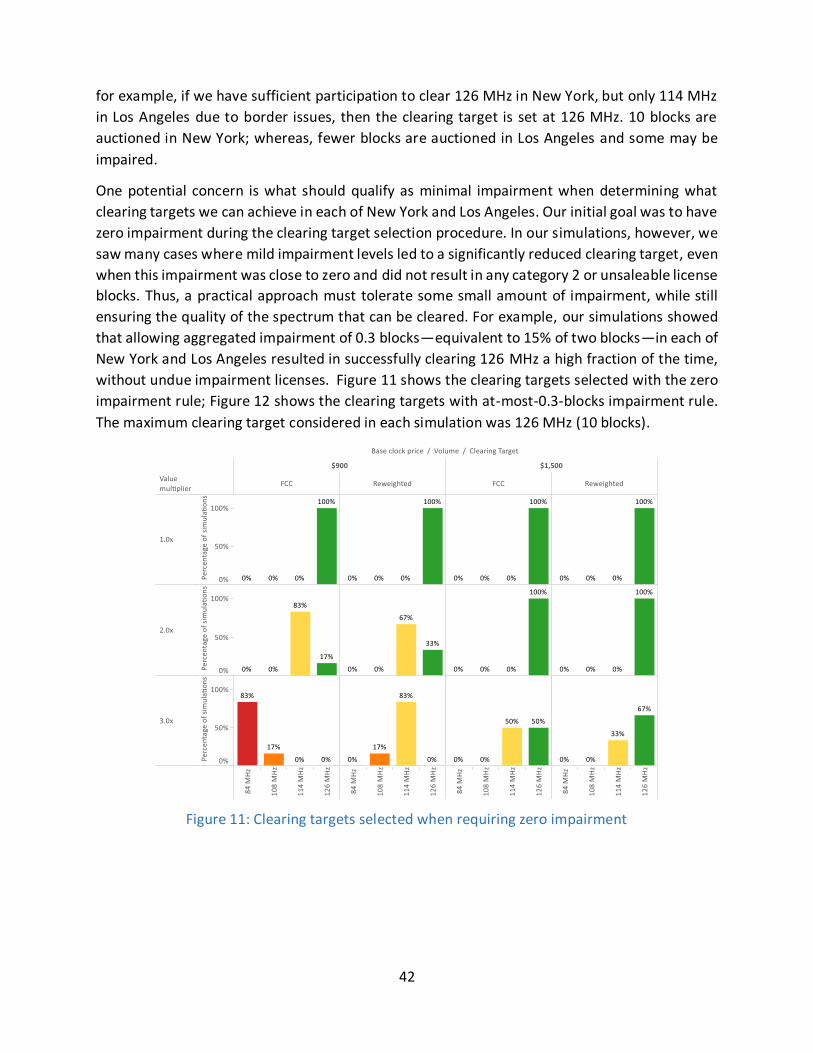
42
for example, if we have sufficient participation to clear 126 MHz in New York, but only 114 MHz
in Los Angeles due to border issues, then the clearing target is set at 126 MHz. 10 blocks are
auctioned in New York; whereas, fewer blocks are auctioned in Los Angeles and some may be
impaired.
One potential concern is what should qualify as minimal impairment when determining what
clearing targets we can achieve in each of New York and Los Angeles. Our initial goal was to have
zero impairment during the clearing target selection procedure. In our simulations, however, we
saw many cases where mild impairment levels led to a significantly reduced clearing target, even
when this impairment was close to zero and did not result in any category 2 or unsaleable license
blocks. Thus, a practical approach must tolerate some small amount of impairment, while still
ensuring the quality of the spectrum that can be cleared. For example, our simulations showed
that allowing aggregated impairment of 0.3 blocks—equivalent to 15% of two blocks—in each of
New York and Los Angeles resulted in successfully clearing 126 MHz a high fraction of the time,
without undue impairment licenses. Figure 11 shows the clearing targets selected with the zero
impairment rule; Figure 12 shows the clearing targets with at-most-0.3-blocks impairment rule.
The maximum clearing target considered in each simulation was 126 MHz (10 blocks).
Figure 11: Clearing targets selected when requiring zero impairment
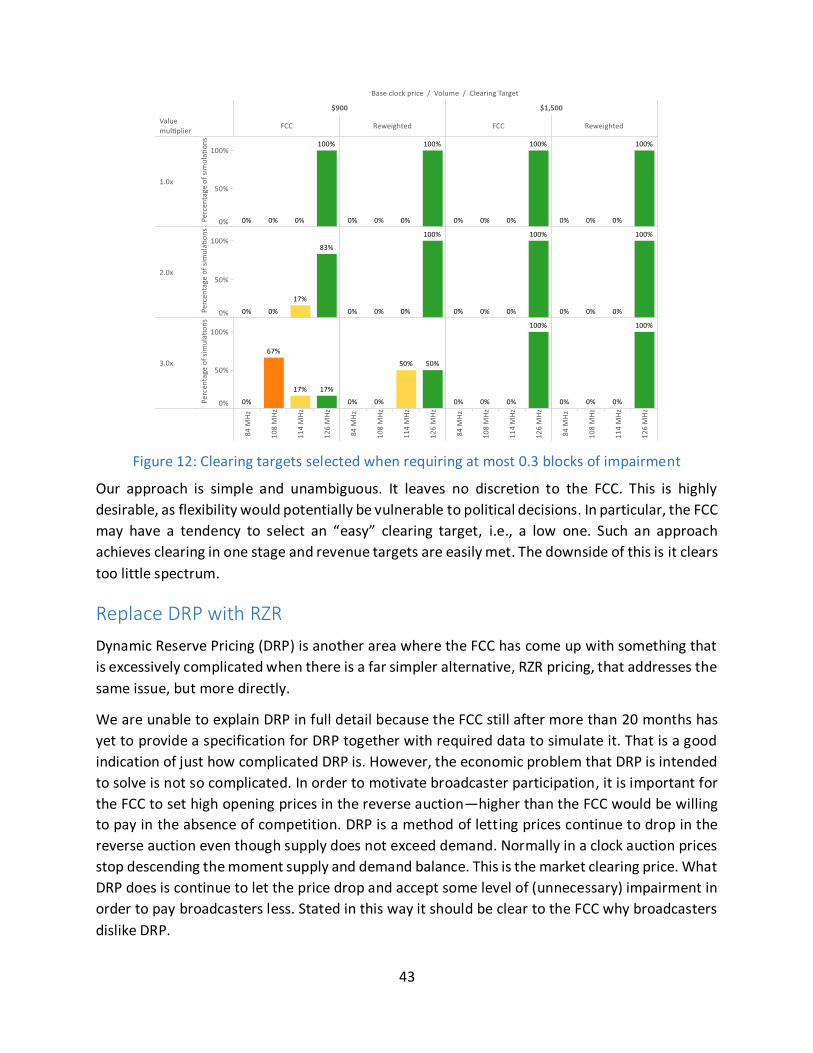
43
Figure 12: Clearing targets selected when requiring at most 0.3 blocks of impairment
Our approach is simple and unambiguous. It leaves no discretion to the FCC. This is highly
desirable, as flexibility would potentially be vulnerable to political decisions. In particular, the FCC
may have a tendency to select an “easy” clearing target, i.e., a low one. Such an approach
achieves clearing in one stage and revenue targets are easily met. The downside of this is it clears
too little spectrum.
Replace DRP with RZR
Dynamic Reserve Pricing (DRP) is another area where the FCC has come up with something that
is excessively complicated when there is a far simpler alternative, RZR pricing, that addresses the
same issue, but more directly.
We are unable to explain DRP in full detail because the FCC still after more than 20 months has
yet to provide a specification for DRP together with required data to simulate it. That is a good
indication of just how complicated DRP is. However, the economic problem that DRP is intended
to solve is not so complicated. In order to motivate broadcaster participation, it is important for
the FCC to set high opening prices in the reverse auction—higher than the FCC would be willing
to pay in the absence of competition. DRP is a method of letting prices continue to drop in the
reverse auction even though supply does not exceed demand. Normally in a clock auction prices
stop descending the moment supply and demand balance. This is the market clearing price. What
DRP does is continue to let the price drop and accept some level of (unnecessary) impairment in
order to pay broadcasters less. Stated in this way it should be clear to the FCC why broadcasters
dislike DRP.
44
But it is not just broadcasters that dislike DRP. Simply put, DRP is a bad design feature in the
setting of the reverse auction. It goes against each of the basic objectives of the FCC:
Transparency—DRP still to this day has not been stated in a way that it leads to an unambiguous
and computable auction outcome. Thus, DRP, as it currently stands, fails the most basic level of
transparency. Auction rules must unambiguously map bids into outcomes. DRP does not do that;
whereas RZR easily meets this minimum standard of transparency.
Simplicity—In its current form, DRP is the most complex design element. It is so complex that we
are unable to simulate it without making numerous assumptions that may or may not be correct.
Our simulations of RZR provide a clear “proof of concept” for the RZR process.
Efficiency—DRP leads to unnecessary impairments that damage carrier and consumer value. DRP
makes no attempt to optimize the most relevant tradeoff, which is whether the underpricing
caused by DRP somehow enables the final stage rule to be satisfied and thereby may prevent
moving to a second stage and a lower clearing target. While this remains a theoretical possibility,
our simulation analysis will show that DRP likely will not improve matters. Indeed, we show a
wide range of cases where DRP cannot improve matters, because under RZR the highest possible
clearing target is achieved without any unnecessary impairment. RZR limits impairments to only
those markets where the FCC’s willingness to pay is below a station’s reservation value and where
foreign TV broadcast creates unavoidable impairment in border markets.
Fairness—DRP further fosters price discrimination that inevitably leads to similar stations being
paid substantially different prices. The RZR process reduces this price discrimination.

45
Figure 13: Flow chart of RZR pricing
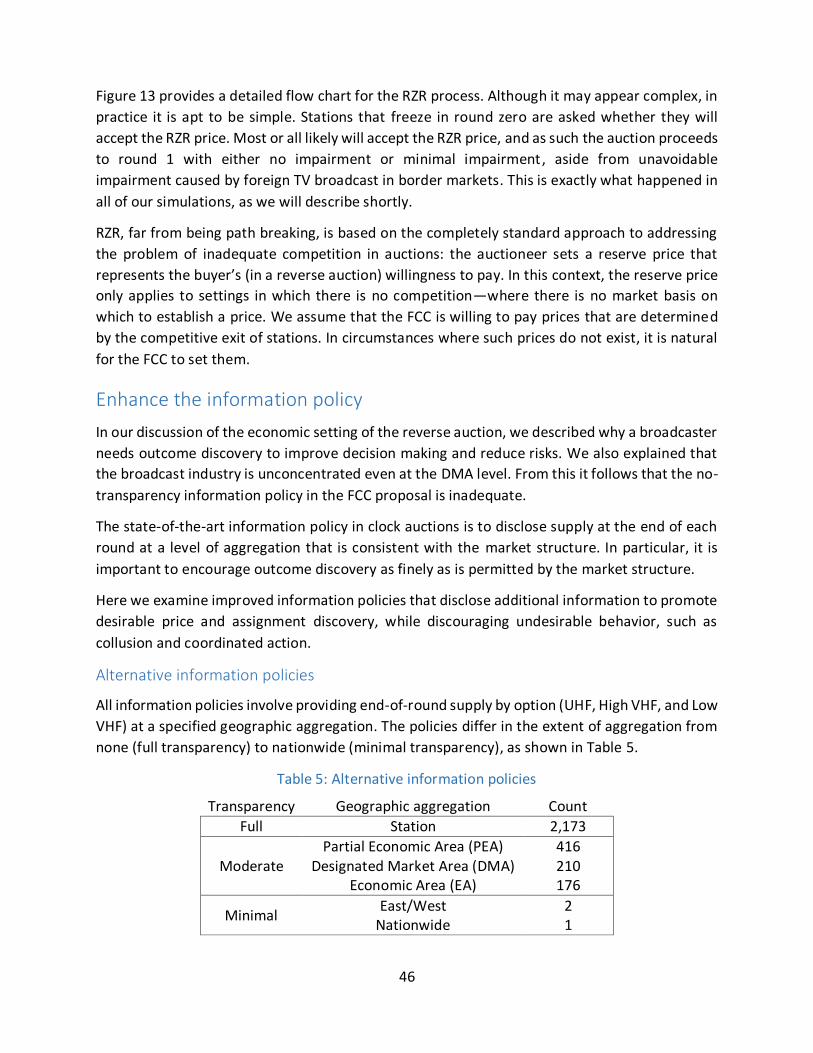
46
Figure 13 provides a detailed flow chart for the RZR process. Although it may appear complex, in
practice it is apt to be simple. Stations that freeze in round zero are asked whether they will
accept the RZR price. Most or all likely will accept the RZR price, and as such the auction proceeds
to round 1 with either no impairment or minimal impairment, aside from unavoidable
impairment caused by foreign TV broadcast in border markets. This is exactly what happened in
all of our simulations, as we will describe shortly.
RZR, far from being path breaking, is based on the completely standard approach to addressing
the problem of inadequate competition in auctions: the auctioneer sets a reserve price that
represents the buyer’s (in a reverse auction) willingness to pay. In this context, the reserve price
only applies to settings in which there is no competition—where there is no market basis on
which to establish a price. We assume that the FCC is willing to pay prices that are determined
by the competitive exit of stations. In circumstances where such prices do not exist, it is natural
for the FCC to set them.
Enhance the information policy
In our discussion of the economic setting of the reverse auction, we described why a broadcaster
needs outcome discovery to improve decision making and reduce risks. We also explained that
the broadcast industry is unconcentrated even at the DMA level. From this it follows that the no-
transparency information policy in the FCC proposal is inadequate.
The state-of-the-art information policy in clock auctions is to disclose supply at the end of each
round at a level of aggregation that is consistent with the market structure. In particular, it is
important to encourage outcome discovery as finely as is permitted by the market structure.
Here we examine improved information policies that disclose additional information to promote
desirable price and assignment discovery, while discouraging undesirable behavior, such as
collusion and coordinated action.
Alternative information policies
All information policies involve providing end-of-round supply by option (UHF, High VHF, and Low
VHF) at a specified geographic aggregation. The policies differ in the extent of aggregation from
none (full transparency) to nationwide (minimal transparency), as shown in Table 5.
Table 5: Alternative information policies
Transparency Geographic aggregation Count
Full Station 2,173
Moderate Partial Economic Area (PEA) 416
Designated Market Area (DMA) 210 Economic Area (EA) 176
Minimal East/West 2
Nationwide 1
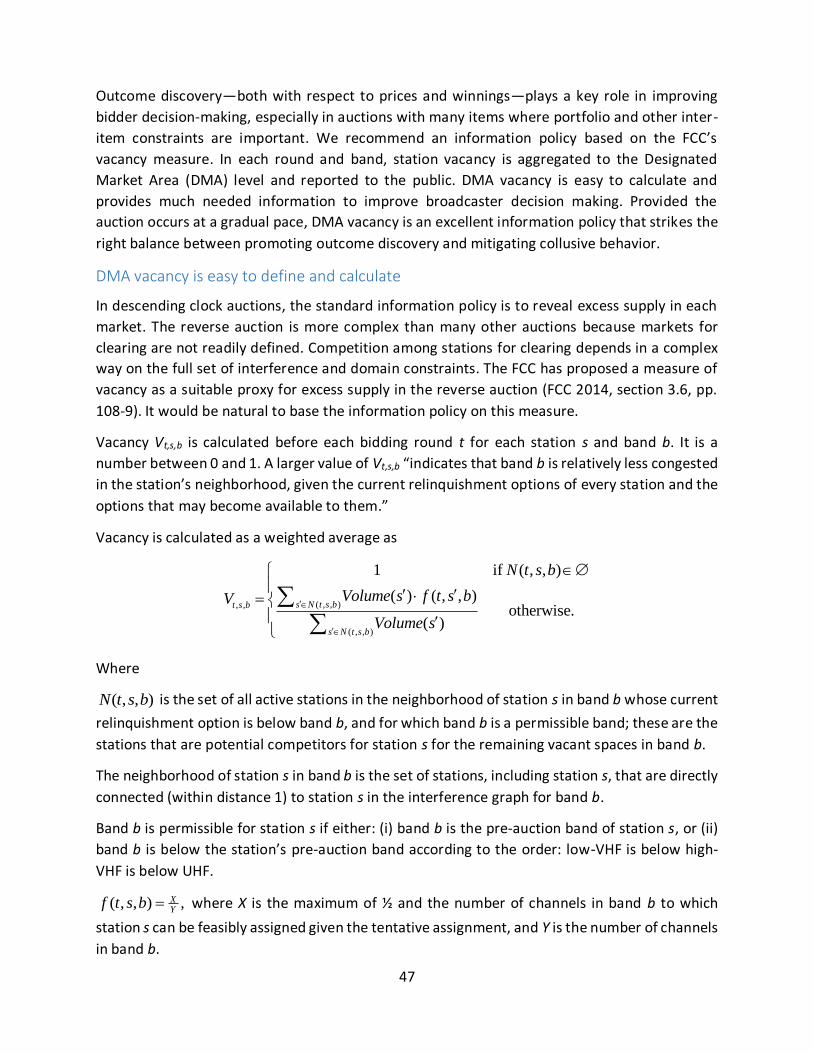
47
Outcome discovery—both with respect to prices and winnings—plays a key role in improving
bidder decision-making, especially in auctions with many items where portfolio and other inter-
item constraints are important. We recommend an information policy based on the FCC’s
vacancy measure. In each round and band, station vacancy is aggregated to the Designated
Market Area (DMA) level and reported to the public. DMA vacancy is easy to calculate and
provides much needed information to improve broadcaster decision making. Provided the
auction occurs at a gradual pace, DMA vacancy is an excellent information policy that strikes the
right balance between promoting outcome discovery and mitigating collusive behavior.
DMA vacancy is easy to define and calculate
In descending clock auctions, the standard information policy is to reveal excess supply in each
market. The reverse auction is more complex than many other auctions because markets for
clearing are not readily defined. Competition among stations for clearing depends in a complex
way on the full set of interference and domain constraints. The FCC has proposed a measure of
vacancy as a suitable proxy for excess supply in the reverse auction (FCC 2014, section 3.6, pp.
108-9). It would be natural to base the information policy on this measure.
Vacancy Vt,s,b is calculated before each bidding round t for each station s and band b. It is a
number between 0 and 1. A larger value of Vt,s,b “indicates that band b is relatively less congested
in the station’s neighborhood, given the current relinquishment options of every station and the
options that may become available to them.”
Vacancy is calculated as a weighted average as
( , , ), ,
( , , )
1 if ( , , )
( ) ( , , )otherwise.
( )
s N t s bt s b
s N t s b
N t s b
Volume s f t s bV
Volume s
Where
( , , )N t s b is the set of all active stations in the neighborhood of station s in band b whose current
relinquishment option is below band b, and for which band b is a permissible band; these are the
stations that are potential competitors for station s for the remaining vacant spaces in band b.
The neighborhood of station s in band b is the set of stations, including station s, that are directly
connected (within distance 1) to station s in the interference graph for band b.
Band b is permissible for station s if either: (i) band b is the pre-auction band of station s, or (ii)
band b is below the station’s pre-auction band according to the order: low-VHF is below high-
VHF is below UHF.
( , , ) ,XY
f t s b where X is the maximum of ½ and the number of channels in band b to which
station s can be feasibly assigned given the tentative assignment, and Y is the number of channels
in band b.

48
( )Volume s is the volume of station s as defined in the auction rules:
12( ) (Broadcast population of station ) (Interference count of station ) .Volume s s s
We consider two values for α in the definition of volume: α = ½ is the volume measure as initially
proposed by the FCC; α = ¼ is the reweighted volume as proposed in Cramton et al. (2015).
One issue with the vacancy measure as defined above is that it is station specific, rather than
based on a market. This is problematic since the disclosure of a station specific measure, if
disclosed to all parties, would lead broadcasters to attempt to figure out additional information
about the behavior of other broadcasters by reverse engineering the formulas above with station
specific data. One way to address this is to only disclose the Vt,s,b to the owner of station s rather
than all broadcasters. However, such limited disclosure of station specific information is a poor
information policy, since it gives extra information to broadcasters owning many stations. This
would seem unjustifiable from a public policy perspective.
The correct fix is to make public a market-level aggregation of vacancy. The appropriate level of
aggregation is DMAs, since DMAs are familiar and useful markets in broadcasting. For each
market M in the set of all DMA markets,
, ,
1, ,
#, t s b
s M
VM
Vacancy t M b
where #M is the number of stations in DMA M. This market-specific vacancy measure can now
be disclosed to all broadcasters and the public before each round t. The DMA aggregation
simplifies the information disclosure (as there are only 210 DMAs), reveals the same outcome-
discovery information to all parties, and prevents the reverse engineering of formulas to gain
additional information.
Some DMAs may be too small to provide sufficient aggregation to conceal identities. A “too
small” DMA would be merged with its closest neighboring DMA, where closeness is defined based
on a metric of connectedness. For the most part, these “too small” DMAs tend to be less
important in the reverse auction—American Samoa and Guam—but there may be exceptions
where the “too small” DMA neighbors a critical DMA. Nonetheless, this issue is straightforward
to address.
DMA vacancy provides much needed information to improve decision making
We have performed thousands of simulations to test DMA vacancy as an information policy.
DMA-level information appears to be helpful to bidders evaluating alternative strategies, yet
given the low concentration of ownership at the DMA-level, broadcasters would not be able to
exploit the information to enforce collusive strategies. Indeed, the definition of vacancy is based
on aggregating information from a large number of stations. First, there is the fact that the
station-specific definition includes all stations a station is directly connected to. On average a
station has 49 direct neighbors. Second, DMA vacancy aggregates all stations within the DMA.

49
On average a DMA has more than 10 stations. Further, the within DMA market structure is
typically unconcentrated. As shown earlier, the weighted average HHI at the DMA level is 1,218.
The DOJ and FTC merger guidelines consider any market with concentration less than 1,500 as
unconcentrated.
Figure 14: DMA vacancy for top-10 DMAs in a simulation with fixed 1 percent decrement
Figure 14 shows DMA vacancy for the top-10 DMAs in a typical simulation. The simulation uses
our recommended decrement policy of a fixed 1 percent of opening prices each round. Prices
start at the opening prices and then move linearly to 0 after 100 rounds. The information does
not reveal exits of particular stations and as far as we can tell it does not in any way support or
encourage any collusive strategies. DMA vacancy does not indicate when a bidder may be in a
position to impact the price through the exit of a particular station. Rather, DMA vacancy
provides some useful information about likely outcomes by DMA. DMA vacancy generally
decreases as prices fall, but there are a few instances where it increases. DMA vacancy appears
to strike the right balance: it permits effective outcome discovery, yet it does not support
collusive strategies.
Outcome discovery requires the auction to occur at a gradual pace
One thing is clear: regardless of the details of the information policy, it will make sense for the
FCC to maintain a steady and gradual pace in the reverse auction. A one percentage point price
reduction from the opening price is desirable each round. This will give bidders time to make
critical decisions and will enable bidders to plan on when these critical decisions will need to be
made. Further there is no possibility that the auction can continue too long. The auction is sure
to end within one hundred rounds, as prices reach zero at round 100.
DMA vacancy provides a foundation for a good information policy
Revealing DMA vacancy before each round for each band is a promising information policy. DMA
vacancy scores well with each of the FCC’s main objectives:

50
Efficiency. The DMA vacancy information allows for improved decision making for
broadcasters making irreversible decisions among a multitude of options. Yet, it is hard
to see how this information could be used as part of a collusive strategy.
Transparency. Revealing DMA vacancy greatly improves outcome transparency. Bidders
have a much better sense of where prices may be heading.
Simplicity. DMA vacancy is a simple arithmetic average of information the FCC already
plans to calculate. Decision making will involve less guesswork. This simplifies decision-
making and improves efficiency.
Fairness. All bidders (and the public) receive the same outcome discovery information
with which to inform their decision making.
Simulation analysis supports our recommendations
The simulation analysis presented here is helpful in evaluating our simple approach to setting the
clearing target, RZR pricing, and alternative scoring rules. With respect to the scoring rules, we
are able to directly compare the FCC proposal with our alternatives. However, with respect to
setting the clearing target and RZR pricing, we cannot present a direct comparison between the
FCC approach and our approach. This is because we are not able to simulate the FCC approach in
these two cases. The FCC approach is either insufficiently defined or has missing data that make
simulation impossible. We could make assumptions that make the FCC approach unambiguous
and computable, but we have little basis to believe that the FCC would make similar choices and
our comparison would be valid. Indeed, a key motivation for our simple method of setting the
clearing price and the replacement of DRP with RZR is that our approach can be simulated, and
our belief that the simplified methods perform quite well. The simulation provides a proof of
concept for two issues—the clearing target and RZR—and a direct comparison among alternative
scoring rules.
Proof of concept of our design recommendations
Our simulations provide compelling evidence in support of our recommendations. It is important
to emphasize that our simulation is a complete simulation of the entire auction through the
conclusion of the reverse auction. (We do assume that the final stage rule is met, so as not to
simulate the forward auction; the AWS-3 auction gives us great confidence that this will be the
case.) Most importantly our simulation assumes our proposed rule for setting the clearing target
and RZR pricing as a replacement to DRP. This was necessary, since we found the FCC method of
setting the clearing target and DRP to be ambiguous and not computable given the information
that the FCC provides in the Comment PN and the available data files.
We use RZR prices based on the AWS-3 auction. RZR prices are obtained by multiplying a station’s
opening price by a multiplier that is less than or equal to 1 and reflects forward auction spectrum
value of the particular station. For the most valuable markets—New York, Los Angeles, and
Chicago, the multiplier is close to 1. The logic is the same as how the FCC would set the opening
price in an “unscored” auction in which the FCC had to set the same opening price for all stations.

51
The right opening price would be based on the FCC’s willingness to pay the station that is most
valuable to clearing.
We are especially interested in the robustness of our recommendations with respect to
uncertainty about broadcaster reservation values. The auction is more challenging when
reservation values are higher, so we consider five cases—our benchmark and cases with values
50%, 100%, 150% and 200% higher (value multipliers of 1, 1.5, 2, 2.5 and 3). The base clock price
is either $900, $1,250, or $1,500; volume is either FCC volume or reweighted volume (the same
as the FCC but with a weight of ¼ on broadcast population, rather than ½). For each of these
5×3×2 scenarios, there are 6 distinct instances based on 6 variations of the benchmark valuation
model, which come from a small random and unbiased error term. Thus, the numbers below
represent 30×6 = 180 complete auctions simulations. This may not seem like a large number, but
keep in mind that each auction simulation requires solving roughly 800 thousand feasibility
checks, each of which is an NP hard problem (there is no known method of solution that scales
with a polynomial bound). For this reason, we conduct the simulation on the cloud, harnessing
thousands of cores on computational servers.
We provide additional details of the simulation approach as well as more detailed results from
additional simulations in the appendix. Also, although we have checked our work carefully and
have been working on the simulation for more than one year, there is always the possibility of
error. We are comforted by the intuitive results that the simulation produces. Nonetheless, we
will continue do extensive testing to confirm our analysis is correct.
One caveat with respect to computational complexity: To simulate a single auction requires
about 800 thousand feasibility checks. Most feasibility checks are easy, but any particular
feasibility check can take an unlimited amount of time in the worst case. Indeed, there are about
300 out of the 800 thousand where we stop computation in the “unknown” state—that is, we
are not certain whether the case is feasible or infeasible—when a propagation limit of 10 million
is reached. In these unknown cases, we make the conservative assumption that the case is
infeasible. Table 6 shows statistics on the average number of feasible, infeasible, and unknown
feasibility checks in an auction, together with average and maximum solution times. Our tests
suggests that setting a propagation limit of one or two orders of magnitude higher would have
only an insignificant impact in our results.
Table 6: Feasibility checks per auction by outcome (propagation limit of 10 million)
Feasible Frozen
Infeasible Unknown
Average number of solutions 838,411 158 337
Average solution time (seconds) 0.01 0.75 5.70
Max solution time (seconds) 7.71 13.61 13.34
52
Two more caveats are worth making on impairment: (1) we focus on avoidable impairment by
excluding impairment caused by foreign TV broadcast in border markets—the auction process
cannot prevent such impairment, and (2) our measure of impairment is a rough proxy for the ISIX
methodology, and may be optimistic about the level of impairment caused by stations. (The FCC
has yet to release a complete set of ISIX data that would enable research teams to evaluate
impairment with this metric.) Even so, we think these results are quite promising.
One important step in our auction simulation is the selection of the clearing target. Most cases,
the optimized clearing target from the RZR process is 126 MHz—there are only a few instances
of 114 and 108 MHz targets in challenging cases where reservation values are extremely high.
(Again we limited the clearing target to 126 MHz in cases where the maximum target in New York
and Los Angeles was above 126 MHz—this often had the effect of paying competitive prices in
New York and Los Angeles.) This is good news. A high clearing target is not only possible, but
robustly selected with our simple rule that focuses on the New York and Los Angeles markets. As
we discuss below, there may be impairments in the band plan, but even in challenging cases the
impairments are manageable provided our improvements to the scoring rule are adopted.

53
Figure 15: Pre-bidding exits and RZR decisions by volume, base clock price, and value multiplier
Figure 15 shows the pre-bidding exits in each scenario as well as the count of stations that receive
RZR pricing, because of freezing in round zero. Again, the results are quite promising. The
improvements to the scoring rule, both the reweighting and the higher base clock price,
dramatically improve participation, especially in the challenging cases with a value multiplier. RZR
pricing is largely innocuous, as it should be. Few stations are asked to accept RZR and all or nearly
all accept the RZR price. RZR pricing only visually appears in the challenging cases and even in the
case of a value multiplier of 2 or more, the improvements to the scoring rule effectively eliminate
the impact of RZR pricing. As a result, nearly all pricing is based on the competitive exit bids of
the stations.
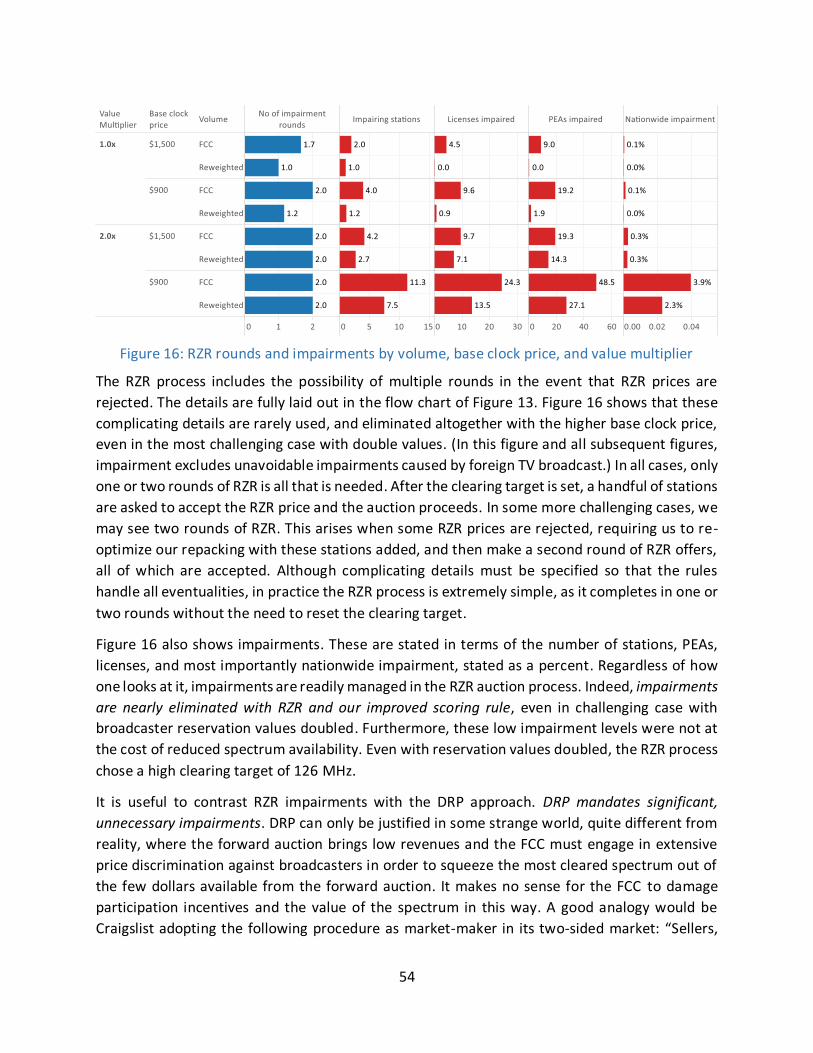
54
Figure 16: RZR rounds and impairments by volume, base clock price, and value multiplier
The RZR process includes the possibility of multiple rounds in the event that RZR prices are
rejected. The details are fully laid out in the flow chart of Figure 13. Figure 16 shows that these
complicating details are rarely used, and eliminated altogether with the higher base clock price,
even in the most challenging case with double values. (In this figure and all subsequent figures,
impairment excludes unavoidable impairments caused by foreign TV broadcast.) In all cases, only
one or two rounds of RZR is all that is needed. After the clearing target is set, a handful of stations
are asked to accept the RZR price and the auction proceeds. In some more challenging cases, we
may see two rounds of RZR. This arises when some RZR prices are rejected, requiring us to re-
optimize our repacking with these stations added, and then make a second round of RZR offers,
all of which are accepted. Although complicating details must be specified so that the rules
handle all eventualities, in practice the RZR process is extremely simple, as it completes in one or
two rounds without the need to reset the clearing target.
Figure 16 also shows impairments. These are stated in terms of the number of stations, PEAs,
licenses, and most importantly nationwide impairment, stated as a percent. Regardless of how
one looks at it, impairments are readily managed in the RZR auction process. Indeed, impairments
are nearly eliminated with RZR and our improved scoring rule, even in challenging case with
broadcaster reservation values doubled. Furthermore, these low impairment levels were not at
the cost of reduced spectrum availability. Even with reservation values doubled, the RZR process
chose a high clearing target of 126 MHz.
It is useful to contrast RZR impairments with the DRP approach. DRP mandates significant,
unnecessary impairments. DRP can only be justified in some strange world, quite different from
reality, where the forward auction brings low revenues and the FCC must engage in extensive
price discrimination against broadcasters in order to squeeze the most cleared spectrum out of
the few dollars available from the forward auction. It makes no sense for the FCC to damage
participation incentives and the value of the spectrum in this way. A good analogy would be
Craigslist adopting the following procedure as market-maker in its two-sided market: “Sellers,

55
please list your car on Craigslist. If you do we will hit you and your car with a sledge hammer a
random number of times, then we will sell it to willing buyers. Good luck.”
RZR results in no or little impairment even with a 126 MHz clearing target
Figure 17 shows impairment by PEA with various scoring rules and value models. With our
benchmark valuation model (1.0x) we clear 126 MHz without any significant impairment-- except
when the FCC scoring rule is used. With the FCC scoring rule, we see significant impairments in
two border markets—along the Texas-Mexico border and along the New York-Canada border. In
the challenging cases where we double station values (2.0x), some impairment exists with all
scoring rules, but the impairment is dramatically less with our proposed rule.

56
Figure 17: Impairment by PEA with various scoring rules
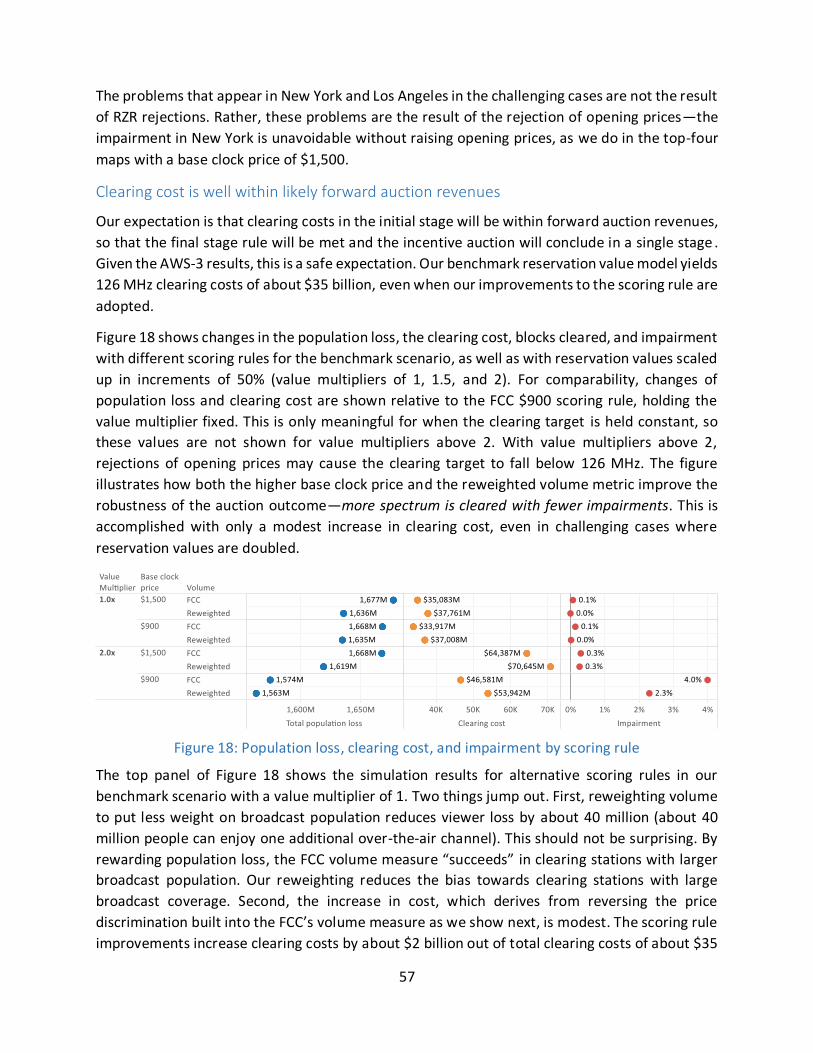
57
The problems that appear in New York and Los Angeles in the challenging cases are not the result
of RZR rejections. Rather, these problems are the result of the rejection of opening prices—the
impairment in New York is unavoidable without raising opening prices, as we do in the top-four
maps with a base clock price of $1,500.
Clearing cost is well within likely forward auction revenues
Our expectation is that clearing costs in the initial stage will be within forward auction revenues,
so that the final stage rule will be met and the incentive auction will conclude in a single stage .
Given the AWS-3 results, this is a safe expectation. Our benchmark reservation value model yields
126 MHz clearing costs of about $35 billion, even when our improvements to the scoring rule are
adopted.
Figure 18 shows changes in the population loss, the clearing cost, blocks cleared, and impairment
with different scoring rules for the benchmark scenario, as well as with reservation values scaled
up in increments of 50% (value multipliers of 1, 1.5, and 2). For comparability, changes of
population loss and clearing cost are shown relative to the FCC $900 scoring rule, holding the
value multiplier fixed. This is only meaningful for when the clearing target is held constant, so
these values are not shown for value multipliers above 2. With value multipliers above 2,
rejections of opening prices may cause the clearing target to fall below 126 MHz. The figure
illustrates how both the higher base clock price and the reweighted volume metric improve the
robustness of the auction outcome—more spectrum is cleared with fewer impairments. This is
accomplished with only a modest increase in clearing cost, even in challenging cases where
reservation values are doubled.
Figure 18: Population loss, clearing cost, and impairment by scoring rule
The top panel of Figure 18 shows the simulation results for alternative scoring rules in our
benchmark scenario with a value multiplier of 1. Two things jump out. First, reweighting volume
to put less weight on broadcast population reduces viewer loss by about 40 million (about 40
million people can enjoy one additional over-the-air channel). This should not be surprising. By
rewarding population loss, the FCC volume measure “succeeds” in clearing stations with larger
broadcast population. Our reweighting reduces the bias towards clearing stations with large
broadcast coverage. Second, the increase in cost, which derives from reversing the price
discrimination built into the FCC’s volume measure as we show next, is modest. The scoring rule
improvements increase clearing costs by about $2 billion out of total clearing costs of about $35
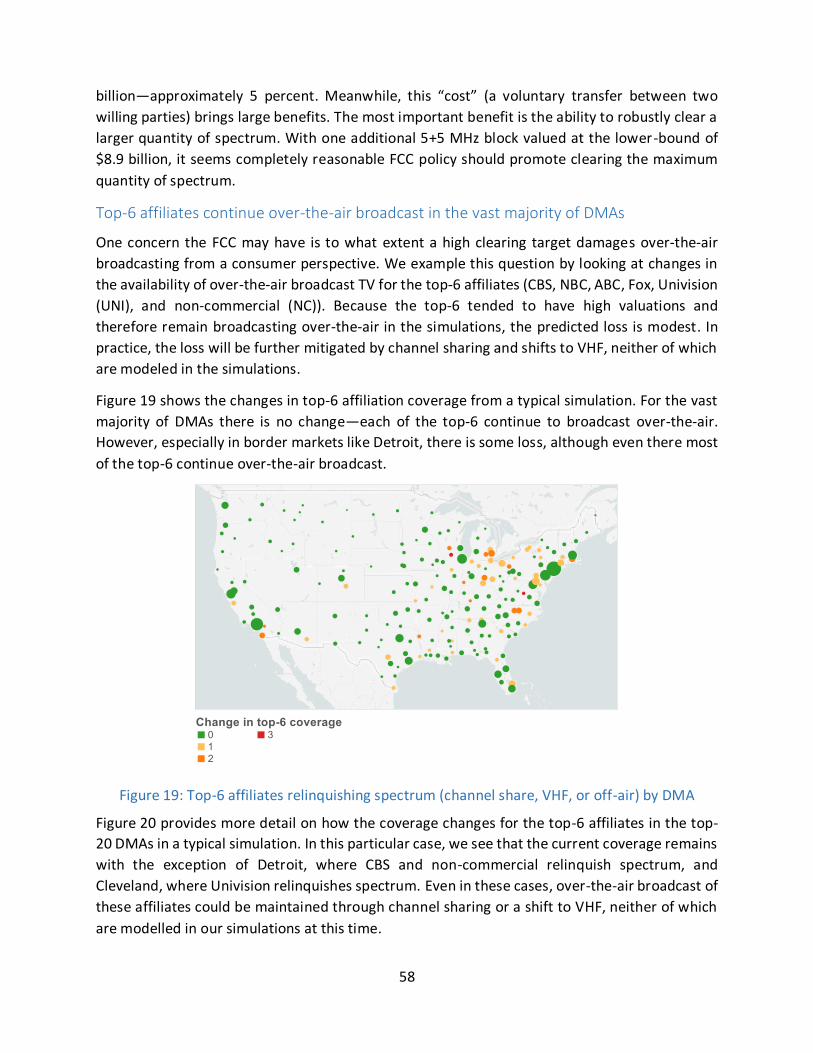
58
billion—approximately 5 percent. Meanwhile, this “cost” (a voluntary transfer between two
willing parties) brings large benefits. The most important benefit is the ability to robustly clear a
larger quantity of spectrum. With one additional 5+5 MHz block valued at the lower-bound of
$8.9 billion, it seems completely reasonable FCC policy should promote clearing the maximum
quantity of spectrum.
Top-6 affiliates continue over-the-air broadcast in the vast majority of DMAs
One concern the FCC may have is to what extent a high clearing target damages over-the-air
broadcasting from a consumer perspective. We example this question by looking at changes in
the availability of over-the-air broadcast TV for the top-6 affiliates (CBS, NBC, ABC, Fox, Univision
(UNI), and non-commercial (NC)). Because the top-6 tended to have high valuations and
therefore remain broadcasting over-the-air in the simulations, the predicted loss is modest. In
practice, the loss will be further mitigated by channel sharing and shifts to VHF, neither of which
are modeled in the simulations.
Figure 19 shows the changes in top-6 affiliation coverage from a typical simulation. For the vast
majority of DMAs there is no change—each of the top-6 continue to broadcast over-the-air.
However, especially in border markets like Detroit, there is some loss, although even there most
of the top-6 continue over-the-air broadcast.
Figure 19: Top-6 affiliates relinquishing spectrum (channel share, VHF, or off-air) by DMA
Figure 20 provides more detail on how the coverage changes for the top-6 affiliates in the top-
20 DMAs in a typical simulation. In this particular case, we see that the current coverage remains
with the exception of Detroit, where CBS and non-commercial relinquish spectrum, and
Cleveland, where Univision relinquishes spectrum. Even in these cases, over-the-air broadcast of
these affiliates could be maintained through channel sharing or a shift to VHF, neither of which
are modelled in our simulations at this time.
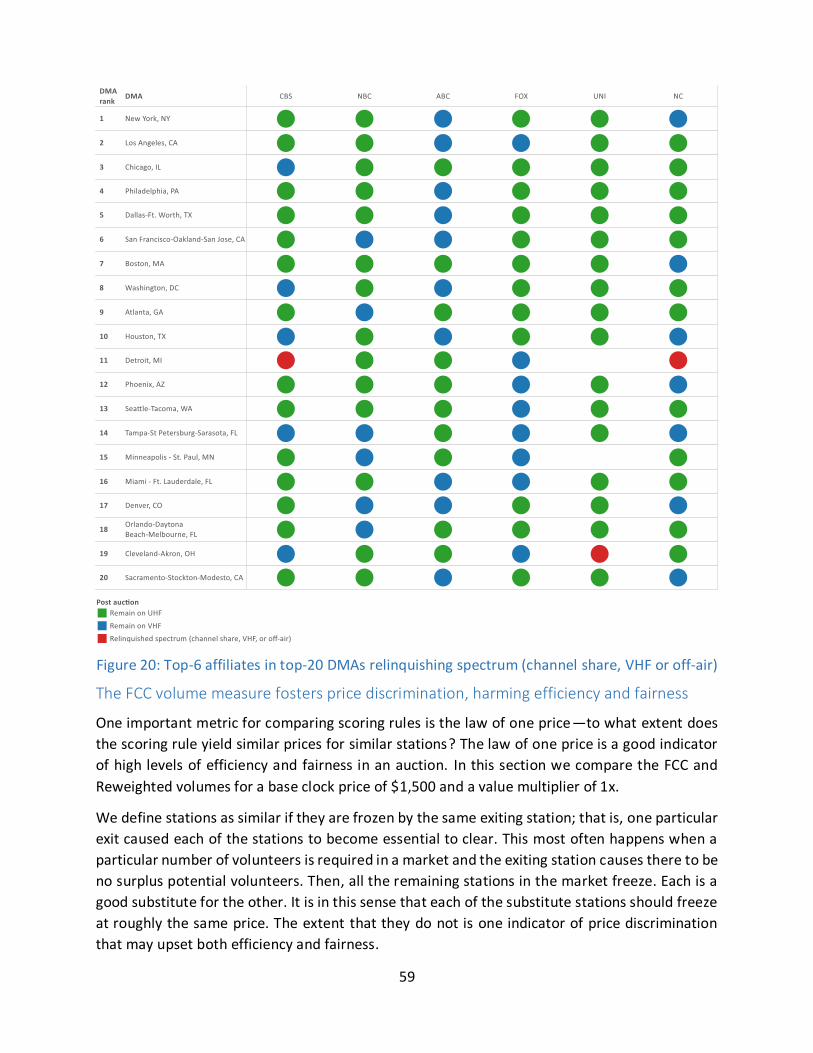
59
Figure 20: Top-6 affiliates in top-20 DMAs relinquishing spectrum (channel share, VHF or off-air)
The FCC volume measure fosters price discrimination, harming efficiency and fairness
One important metric for comparing scoring rules is the law of one price—to what extent does
the scoring rule yield similar prices for similar stations? The law of one price is a good indicator
of high levels of efficiency and fairness in an auction. In this section we compare the FCC and
Reweighted volumes for a base clock price of $1,500 and a value multiplier of 1x.
We define stations as similar if they are frozen by the same exiting station; that is, one particular
exit caused each of the stations to become essential to clear. This most often happens when a
particular number of volunteers is required in a market and the exiting station causes there to be
no surplus potential volunteers. Then, all the remaining stations in the market freeze. Each is a
good substitute for the other. It is in this sense that each of the substitute stations should freeze
at roughly the same price. The extent that they do not is one indicator of price discrimination
that may upset both efficiency and fairness.
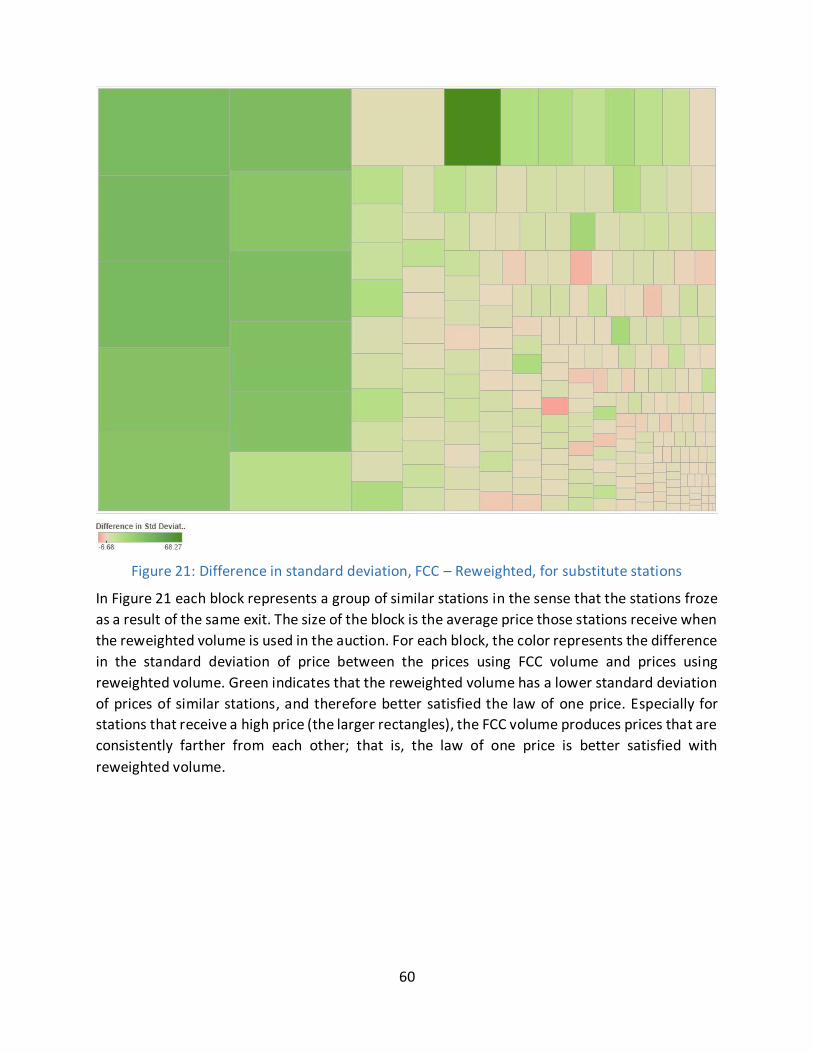
60
Figure 21: Difference in standard deviation, FCC – Reweighted, for substitute stations
In Figure 21 each block represents a group of similar stations in the sense that the stations froze
as a result of the same exit. The size of the block is the average price those stations receive when
the reweighted volume is used in the auction. For each block, the color represents the difference
in the standard deviation of price between the prices using FCC volume and prices using
reweighted volume. Green indicates that the reweighted volume has a lower standard deviation
of prices of similar stations, and therefore better satisfied the law of one price. Especially for
stations that receive a high price (the larger rectangles), the FCC volume produces prices that are
consistently farther from each other; that is, the law of one price is better satisfied with
reweighted volume.

61
Figure 22: Difference in price gap, FCC – Reweighted, for substitute stations
In Figure 22 each block again represents similar stations—those that froze as a result of the same
exit. Again the size of the block is the average price those stations receive when the reweighted
volume is used. For each block, the color represents the difference in price gap—the maximum
difference in prices among the similar stations between the FCC and the reweighted volumes.
Green indicates that the reweighted volume better satisfies the law of one price in that the
maximum difference in prices is smaller with reweighted volume. Especially for stations that
receive a high price, reweighted volume produces prices that are consistently closer to each
other; that is, the law of one price is better satisfied when the reweighted volume is used.

62
Figure 23: Sum of price gaps for similar stations
Figure 23 shows the aggregate price gap for each of 6 simulations, and their average. Every blue
dot represents the sum of price gaps among similar stations. The red line indicates the mean sum
of price gaps across all 6 simulations. The FCC produces gaps that are 53 percent larger than those
produced by reweighted volume.
Figure 24: Total clearing cost without price discrimination
Figure 24 shows the total costs of clearing when price gaps are eliminated by giving identical
prices to similar stations. The values are calculated by adding the price gaps in Figure 23 and
clearing costs of Figure 18. In Figure 24, each station receives a price equal to the highest price
among similar stations. This figure demonstrates an important feature of the FCC volume: its
slightly lower clearing cost stems directly from its price discrimination, and indeed the FCC

63
volume would result in higher clearing costs if we required prices under both approaches to
satisfy the law of one price.
Address other important issues
We now discuss four additional issues. The proper resolution of these issues should be
straightforward for the FCC. Although each of these issues is important, the first is especially
important: do not delay the auction.
The FCC should not delay the incentive auction
From an economic viewpoint, the issue of delay is an easy one. Delay of the auction would benefit
the dominant incumbents—AT&T and Verizon—by maintaining a barrier to competition. The
dominant incumbents currently enjoy a coverage advantage that comes in part from the highly
concentrated ownership of low-band spectrum. This auction would give competitors access to
coverage-enhancing low-band spectrum. As a result, competition and innovation in mobile
broadband would be improved. Conducting the auction on schedule will benefit all parties,
except the dominant incumbents. Economics points to no delay.
The FCC should strongly resist the lobbying efforts of the dominant incumbents and their political
supports on this matter. We have seen in other countries the foreclosure of competition through
unnecessary delay of major spectrum auctions.
One reason that has been emphasized by those supporting delay is that—following the AWS-3
auction—the carriers need time to “reload” for the next major auction. This is silly. The incentive
auction is more than a year away. Capital markets in the U.S. work extremely well. Every bidder
in the AWS-3 auction bid knowing that the incentive auction would be coming up in early 2016.
Indeed, this is the reason that T-Mobile limited its bidding in AWS-3 and why Sprint chose not to
participate in AWS-3 altogether. These smaller incumbents will come “loaded for bear” in early
2016. AT&T and Verizon will as well. All the incumbents can easily raise capital to buy the low-
band spectrum they need.
Price decrements should be small and a fixed percentage of the opening price
The FCC has proposed decrements of between 3 and 10 percent in the reverse auction. There is
no reason for such haste. The AWS-3 auction just concluded after 341 bidding rounds. The
incentive auction is a much more complex and larger auction, likely more than double the size
the AWS-3 auction. Further the incentive auction uses modern clock methods that are much
faster and predictable than the older SMRA format. In particular, in the clock auction, all prices
fall simultaneously until the station is frozen or repacked. This means that the duration of the
auction can be guaranteed to last no more than a certain number of rounds. For example, even
if prices were to drop all the way to zero, the reverse auction would last only 100 rounds (less
than one-third the duration of the AWS-3 auction) with a decrement of 1 percent per round. With
a measured pace of four rounds per day, this would mean a maximum possible duration of 25
days, roughly one month. Such a measured pace is entirely in line with the extremely high stakes

64
in both the reverse and forward auction. For both broadcasters and carriers, the incentive auction
is a once‐in‐a‐lifetime event. It will define both industries for well over a decade.
We favor a constant decrease per round, based on a fixed percentage of the opening price. This
is simpler and offers a guaranteed end. With a percentage decrease from the current round,
prices never reach zero. The FCC has learned from its forward auction experience that it is a bad
idea to reduce increments later in the auction. The FCC should apply the same logic in the reverse
auction. Using a fixed percentage of the opening price solves this problem.
For this reason, we recommend a decrement of 1 percent of the opening price per round. Thus,
with a base clock price of $1500, the clock would drop $15 each round, $60 each day, and $300
each week, assuming four rounds per day. Such a measured pace allows broadcasters to make
the difficult decisions that the auction requires. It also guarantees the timely completion of the
auction as a result of the modern clock method. Figure 25 shows the auction history at four points
in time—the beginning, one‐third finished, two‐third finished, and the end—with the benchmark
valuation model, two volume rules, and two base prices.
Figure 25: Auction history with RZR pricing in benchmark case at four points in the auction

65
Proxy bidding and small decrements are complementary
The need for outcome discovery will surely vary by bidder. Small bidders with especially simple
decision problems may not value outcome discovery. Nationwide bidders with complex portfolio,
budget, and other aggregate constraints may have a great need for outcome discovery. A small
decrement of 1 percent of the opening price together with proxy bidding offers the best of both
worlds. Proxy bidding reduces bidder participation costs for those with simple decision problems,
and the 1 percent decrement provides ample outcome discovery for the large bidder. There is no
downside to this approach. Proxy bidding is a well-recognized feature of a state-of-the-art clock
auction implementation.
There are two important details in the proper implementation of proxy bidding. To understand
these let’s be clear about what proxy bidding is in a clock auction: proxy bidding is the ability to
specify an exit bid at a price that has yet to be reached. The two implementation details are: (1)
privacy—the FCC does not see the proxy bids; the auction system hides them from the FCC so
that the FCC cannot condition the conduct of the auction on this information, and (2) flexibility—
the exit bid can be freely revised until the end of the round in which the price is reached. These
two features make proxy bidding much more valuable in a high-stakes auction.
As an example, consider a single-station broadcaster. Suppose the broadcaster has a firm exit
price of $250. The broadcaster does not care about outcome discovery. The FCC clock starts at
$1000 and the clock ticks down $10 per round.
With proxy bidding the bidder can submit an exit bid of $250 in round 1, and then never log into
the system again. This is much easier than entering the bid "I'm in." in each of the first 75 rounds.
However, should the bidder change its mind and decide it wants to exit at $300, the bidder can
do so in any round until the clock price falls below $300.
Large bidders would care a great deal about outcome discovery and therefore likely would not
want to take advantage of proxy bidding. However, its presence does not harm the large bidder
in any way.
A small and fixed decrement provides the needed outcome discovery without any possibility of
an excessively long auction. And proxy bidding assures that a small bidder with a simple decision
problem can participate in the auction in a simple way.
In the worst case, the auction may last multiple months. But this is completely appropriate for a
once-in-a-lifetime event that will determine the market structure both in broadcasting and in
mobile broadband for decades to come.
Intra-round bidding simplifies bidding and improves efficiency
Intra-round bidding does not complicate the bidding. Indeed, it simplifies the bidding by letting
a bidder express the bidder’s true preferences, rather than forcing the bidder to speculate about
the likelihood of ties and other complex tradeoffs. For this reason, intra-round bidding, or exit
66
bids, is part of any state-of-the-art clock auction implementation. Intra-round bidding should be
allowed. Intra-round bidding has important benefits and no downside.
The AWS-3 auction demonstrates the need for a few rule changes
The AWS-3 auction suggests two fixes to the standard auction rules are required.
First, the FCC needs to take steps to eliminate loopholes that allow a bidder to undermine the
activity rule and price discovery through the use of multiple affiliated bidders. This is easily
remedied in future auctions by requiring that affiliated bidders bid on disjointed sets of licenses.
Second, the FCC should take steps to eliminate the use of fronts by large bidders to claim small
bidder discounts. The whole notion of “small business” is misguided in mobile broadband. Even
small mobile carriers must spend hundreds of millions of dollars for spectrum and network. They
are hardly small businesses. Rather if a distinction is made among carriers, it should be between
dominant incumbents and small incumbents or new entrants. A policy based on this distinction
is consistent with sensible competition policy. This is the approach used in other countries such
as the U.K. and Canada. It is remarkable that the FCC sticks with its “small business” program for
mobile broadband given the long history of its problems, such as bidder fronts and payment
defaults.
Should the FCC decide to keep its “small business” program, then it should base qualification on
the economic principle of ownership, not the slippery legal definition of control. One can be
certain that when the stakes are billions of dollars that ownership determines control. This is for
the obvious reason that owners would not invest billions of dollars in a venture controlled by
another. Doing so would subject the owner to expropriation of its investment. The owner would
only be willing to grant control to another to the extent the other is constrained to act in the
interest of the owner. But this amounts to the owner having effective control.
Conclusion
The FCC incentive auction to repurpose broadcast TV spectrum is among the most important
auction events in the 21st century. The FCC should take great care in its design and
implementation. Fortunately, the FCC is on a good path. Only modest adjustments are needed.
Our study is a rigorous scientific effort to inform the FCC about important design details that will
maximize the chance of a successful auction. Our focus is the reverse auction, which determines
the stations that clear and the price paid to those who clear.
Based on extensive simulation analysis of the FCC proposal and alternative designs, we make four
key recommendations. The FCC should:
Improve the scoring rule to encourage participation and reduce mispricing.
Simplify the setting of the clearing target to maximize the spectrum cleared and improve
transparency.
67
Replace Dynamic Reserve Pricing (DRP) with Round Zero Reserve (RZR, pronounced
“razor”) pricing to simplify the auction and improve transparency.
Encourage outcome discovery—both the likelihood of clearing and the price of clearing—
with an information policy that reflects the competitive market structure on the
broadcaster side.
All of these changes are easily implemented. Indeed, two of the changes—the mechanism for
setting the clearing target and the replacement of DRP with RZR—greatly simplify both the design
and implementation for the FCC and the participants.
None of these changes or any other factors warrant a delay of the auction. The auction should
take place in early 2016 as planned. There will be calls from the dominant incumbents and their
political supports to delay the auction. This is simply a request by the dominant incumbents to
maintain an entry barrier—the lack of low-band spectrum—that has limited competition in
mobile broadband. Of course, the FCC should ignore such pleas. Delay is adverse to all other
parties: the non-dominant carriers, the broadcasters, the technology and communication
industries, and most importantly consumers.
References
Ausubel, Lawrence M., Peter Cramton, Marek Pycia, Marzena Rostek, and Marek Weretka, “Demand Reduction and Inefficiency in Multi-Unit Auctions,” Review of Economic Studies, forthcoming, 2014.
Ausubel, Lawrence M. and Peter Cramton (2004), “Auctioning Many Divisible Goods,” Journal of the European Economic Association, 2, 480-493, April-May.
Ausubel, Lawrence M., Peter Cramton, R. Preston McAfee, and John McMillan (1997), “Synergies in Wireless Telephony: Evidence from the Broadband PCS Auctions,” Journal of Economics and Management Strategy, 6:3, 497-527.
Ausubel, Lawrence M., Peter Cramton, and Paul Milgrom (2006), “The Clock-Proxy Auction: A Practical Combinatorial Auction Design,” in Peter Cramton, Yoav Shoham, and Richard Steinberg (eds.), Combinatorial Auctions, Chapter 5, 115-138, MIT Press.
Biere, Armin (2008), “PicoSAT Essentials,” Journal on Satisfiability, Boolean Modeling and Computation (JSAT), 4, 75-97, 2008.
Brusco, Sandro and Giuseppe Lopomo (2002), “Collusion via Signalling in Simultaneous Ascending Bid Auctions with Heterogeneous Objects, with and without Complementarities,” Review of Economic Studies, 69, 407-436.
Bulow, Jeremy, Jonathan Levin, and Paul Milgrom (2009), “Winning Play in Spectrum Auctions,” Working Paper, Stanford University.
Coase, Ronald H. (1959), “The Federal Communications Commission,” Journal of Law and Economics, 2, 1-40.
Cramton, Peter (1995), “Money Out of Thin Air: The Nationwide Narrowband PCS Auction,” Journal of Economics and Management Strategy, 4, 267-343.
Cramton, Peter (1997), “The FCC Spectrum Auctions: An Early Assessment,” Journal of Economics and Management Strategy, 6:3, 431-495.
Cramton, Peter (2013), “Spectrum Auction Design,” Review of Industrial Organization, 42:2, 161-190, March 2013.

68
Cramton, Peter, Evan Kwerel, Gregory Rosston, and Andrzej Skrzypacz (2011), “Using Spectrum Auctions to Enhance Competition in Wireless Services,” Journal of Law and Economics, 54, 2011.
Cramton, Peter, Evan Kwerel, and John Williams (1998), “Efficient Relocation of Spectrum Incumbents,” Journal of Law and Economics, 41, 647-675.
Cramton, Peter and Jesse Schwartz (2002), “Collusive Bidding in the FCC Spectrum Auctions,” Contributions to Economic Analysis & Policy, 1:1, 1-17.
Cramton, Peter, Yoav Shoham, and Richard Steinberg (2006), Combinatorial Auctions, Cambridge, MA: MIT Press.
Eppstein, David, Maarten Löffler, and Darren Strash (2010), “Listing all maximal cliques in sparse graphs in near-optimal time,” Lecture Notes in Computer Science, 6506, 403-414.
Federal Communications Commission (2002), “Spectrum Policy Task Force,” ET Docket No. 02-135.
Federal Communications Commission (2012), “Broadcast Television Spectrum Incentive Auction NPRM,” FCC 12-118, released 2 October 2012.
Federal Communications Commission (2013), “Incentive Auction Task Force Releases Information Related to Incentive Auction Repacking,” DA 13-1613, released 22 July 2013.
Federal Communications Commission (2014a), “Comment Sought on Competitive Bidding Procedures for Broadcast Incentive Auction 1000, Including Auctions 1001 and 1002,” FCC 14-191, released 17 December 2014.
Federal Communications Commission (2014b), “Mobile Wireless Competition Report (17th Annual),” FCC 14-1862, released 18 December 2014.
Federal Communications Commission (2015), “Incentive Auction Task Force Releases Initial Clearing Target Optimization Simulations,” FCC 14-252, released 20 May 2015.
Kagel, John H. and Dan Levin (1986), “The Winner's Curse and Public Information in Common Value Auctions,” American Economic Review, 76, 894-920.
Kagel, John H., Dan Levin, and Jean-Francois Richard (1996), “Revenue Effects and Information Processing in English Common Value Auctions,” American Economic Review, 86, 442-460.
Kearns, Michael and Lili Dworkin (2014), “A Computational Study of Feasible Repackings in the FCC Incentive Auctions,” white paper filed with Federal Communications Commission, June 2014.
Klemperer, Paul (2004), Auctions: Theory and Practice, Princeton University Press.
Leighton-Brown, Kevin (2014), “Feasibility Checking for Spectrum Repacking: Methodologies and Test Results,” Talk at FCC LEARN Workshop on Feasibility Checking During Repacking Process, February 21, 2014.
Milgrom, Paul (2004), Putting Auction Theory to Work, Cambridge: Cambridge University Press.
Milgrom, Paul and Ilya Segal (2014), “Deferred-Acceptance Auctions and Radio Spectrum Reallocation,” Working Paper, Stanford University.
Milgrom, Paul, Lawrence M. Ausubel, Jonathan Levin, and Ilya Segal (2012), “Incentive Auction Rules Option and Discussion,” NPRM Appendix FCC-12-118A2.
Pagnozzi, Marco (2010), “Are Speculators Unwelcome in Multi-object Auctions?” American Economic Journal: Microeconomics, 2:2, 97-131.
Parkes, David C. (2006), “Iterative Combinatorial Auctions,” in Peter Cramton, Yoav Shoham, and Richard Steinberg (eds.), Combinatorial Auctions, Chapter 2, 41-78, MIT Press.
Related Documents