Pervasive and Mobile Computing 5 (2009) 639–653 Contents lists available at ScienceDirect Pervasive and Mobile Computing journal homepage: www.elsevier.com/locate/pmc Fast track article Design of smart sensing components for volcano monitoring ✩ Mingsen Xu a , Wen-Zhan Song a,* , Renjie Huang a , Yang Peng a , Behrooz Shirazi d , Richard Lahusen c , Aaron Kiely b , Nina Peterson d , Andy Ma a , Lohith Anusuya-Rangappa d , Michael Miceli e , Devin McBride f a Sensorweb Research Laboratory, Washington State University, Vancouver, WA 98686, USA b Jet Propulsion Laboratory, California Institute of Technology, Technology, Pasadena, CA 91109, USA c Cascades Volcano Observatory, U.S.Geological Survey, Vancouver, WA, USA d School of Electrical Engineering and Computer Science, Washington State University, Pullman, WA 99163, USA e School of Computer Science, Louisiana State University, Baton Rouge, LA 70803, USA f School of Computer Science, Seattle University, Seattle, WA 98122, USA article info Article history: Received 27 September 2008 Received in revised form 9 June 2009 Accepted 9 June 2009 Available online 17 June 2009 Keywords: Wireless sensor network Volcano monitoring Situation awareness Time synchronization abstract In a volcano monitoring application, various geophysical and geochemical sensors gener- ate continuous high-fidelity data, and there is a compelling need for real-time raw data for volcano eruption prediction research. It requires the network to support network synchro- nized sampling, online configurable sensing and situation awareness, which pose signifi- cant challenges on sensing component design. Ideally, the resource usages shall be driven by the environment and node situations, and the data quality is optimized under resource constraints. In this paper, we present our smart sensing component design, including hy- brid time synchronization, configurable sensing, and situation awareness. Both design de- tails and evaluation results are presented to show their efficiency. Although the presented design is for a volcano monitoring application, its design philosophy and framework can also apply to other similar applications and platforms. © 2009 Elsevier B.V. All rights reserved. 1. Introduction An active volcano provides a challenging environment to examine and advance sensor network technology [1,2]. The crater is a three-dimensional environment with very rugged terrain, and generates frequent volcanic activities such as rock avalanches, land sliding, earthquakes and gas/steam emissions. Volcanic eruptions may even destroy stations. The occasional eruptions, as well as the heavy rain, snow, ice and wind weather conditions pose significant challenges on the network robustness and self-organizing/self-healing ability. The hardware and software system needs to be robust enough to survive those extreme weather conditions and volcanic activities. Various geophysical and geochemical sensors generate continuous high-fidelity data, and there is a compelling need for real-time raw data for volcano eruption prediction research. This requires our components to support high-fidelity synchronized sampling, and poses significant challenges on sensing and data quality management. Partial results of this paper was published in [25]. ✩ This work is supported by National Aeronautics and Space Administration (NASA) ESTO AIST program and U.S. Geological Survey (USGS) Volcano Hazard program under the research grant NNX06AE42G. Partial results of this paper was published in [Y. Peng, R. Lahusen, B. Shirazi, W. Song, Design of smart sensing component for volcano monitoring, in: the 4th IET International Conference on Intelligent Environments, 2008]. * Corresponding address: Sensorweb Research Laboratory, Washington State University, 14204 NE Salmon Creek Ave, Vancouver, WA 98686, USA. E-mail addresses: [email protected] (M. Xu), [email protected] (W.-Z. Song), [email protected] (R. Huang), [email protected] (Y. Peng), [email protected] (B. Shirazi), [email protected] (R. Lahusen), [email protected] (A. Kiely), [email protected] (N. Peterson), [email protected] (A. Ma), [email protected] (L. Anusuya-Rangappa), [email protected] (M. Miceli), [email protected] (D. McBride). 1574-1192/$ – see front matter © 2009 Elsevier B.V. All rights reserved. doi:10.1016/j.pmcj.2009.06.004

Welcome message from author
This document is posted to help you gain knowledge. Please leave a comment to let me know what you think about it! Share it to your friends and learn new things together.
Transcript
Pervasive and Mobile Computing 5 (2009) 639–653
Contents lists available at ScienceDirect
Pervasive and Mobile Computing
journal homepage: www.elsevier.com/locate/pmc
Fast track article
Design of smart sensing components for volcano monitoringI
Mingsen Xu a, Wen-Zhan Song a,∗, Renjie Huang a, Yang Peng a, Behrooz Shirazi d,Richard Lahusen c, Aaron Kiely b, Nina Peterson d, Andy Ma a, Lohith Anusuya-Rangappa d,Michael Miceli e, Devin McBride fa Sensorweb Research Laboratory, Washington State University, Vancouver, WA 98686, USAb Jet Propulsion Laboratory, California Institute of Technology, Technology, Pasadena, CA 91109, USAc Cascades Volcano Observatory, U.S.Geological Survey, Vancouver, WA, USAd School of Electrical Engineering and Computer Science, Washington State University, Pullman, WA 99163, USAe School of Computer Science, Louisiana State University, Baton Rouge, LA 70803, USAf School of Computer Science, Seattle University, Seattle, WA 98122, USA
a r t i c l e i n f o
Article history:Received 27 September 2008Received in revised form 9 June 2009Accepted 9 June 2009Available online 17 June 2009
Keywords:Wireless sensor networkVolcano monitoringSituation awarenessTime synchronization
a b s t r a c t
In a volcano monitoring application, various geophysical and geochemical sensors gener-ate continuous high-fidelity data, and there is a compelling need for real-time raw data forvolcano eruption prediction research. It requires the network to support network synchro-nized sampling, online configurable sensing and situation awareness, which pose signifi-cant challenges on sensing component design. Ideally, the resource usages shall be drivenby the environment and node situations, and the data quality is optimized under resourceconstraints. In this paper, we present our smart sensing component design, including hy-brid time synchronization, configurable sensing, and situation awareness. Both design de-tails and evaluation results are presented to show their efficiency. Although the presenteddesign is for a volcano monitoring application, its design philosophy and framework canalso apply to other similar applications and platforms.
© 2009 Elsevier B.V. All rights reserved.
1. Introduction
An active volcano provides a challenging environment to examine and advance sensor network technology [1,2]. Thecrater is a three-dimensional environment with very rugged terrain, and generates frequent volcanic activities such asrock avalanches, land sliding, earthquakes and gas/steam emissions. Volcanic eruptions may even destroy stations. Theoccasional eruptions, as well as the heavy rain, snow, ice and wind weather conditions pose significant challenges on thenetwork robustness and self-organizing/self-healing ability. The hardware and software system needs to be robust enoughto survive those extreme weather conditions and volcanic activities. Various geophysical and geochemical sensors generatecontinuous high-fidelity data, and there is a compelling need for real-time rawdata for volcano eruption prediction research.This requires our components to support high-fidelity synchronized sampling, and poses significant challenges on sensingand data quality management. Partial results of this paper was published in [25].
I Thiswork is supported byNational Aeronautics and Space Administration (NASA) ESTOAIST programandU.S. Geological Survey (USGS) VolcanoHazardprogram under the research grant NNX06AE42G. Partial results of this paper was published in [Y. Peng, R. Lahusen, B. Shirazi, W. Song, Design of smartsensing component for volcano monitoring, in: the 4th IET International Conference on Intelligent Environments, 2008].∗ Corresponding address: Sensorweb Research Laboratory, Washington State University, 14204 NE Salmon Creek Ave, Vancouver, WA 98686, USA.E-mail addresses:[email protected] (M. Xu), [email protected] (W.-Z. Song), [email protected] (R. Huang), [email protected] (Y. Peng),
[email protected] (B. Shirazi), [email protected] (R. Lahusen), [email protected] (A. Kiely), [email protected] (N. Peterson), [email protected](A. Ma), [email protected] (L. Anusuya-Rangappa), [email protected] (M. Miceli), [email protected] (D. McBride).
1574-1192/$ – see front matter© 2009 Elsevier B.V. All rights reserved.doi:10.1016/j.pmcj.2009.06.004
640 M. Xu et al. / Pervasive and Mobile Computing 5 (2009) 639–653
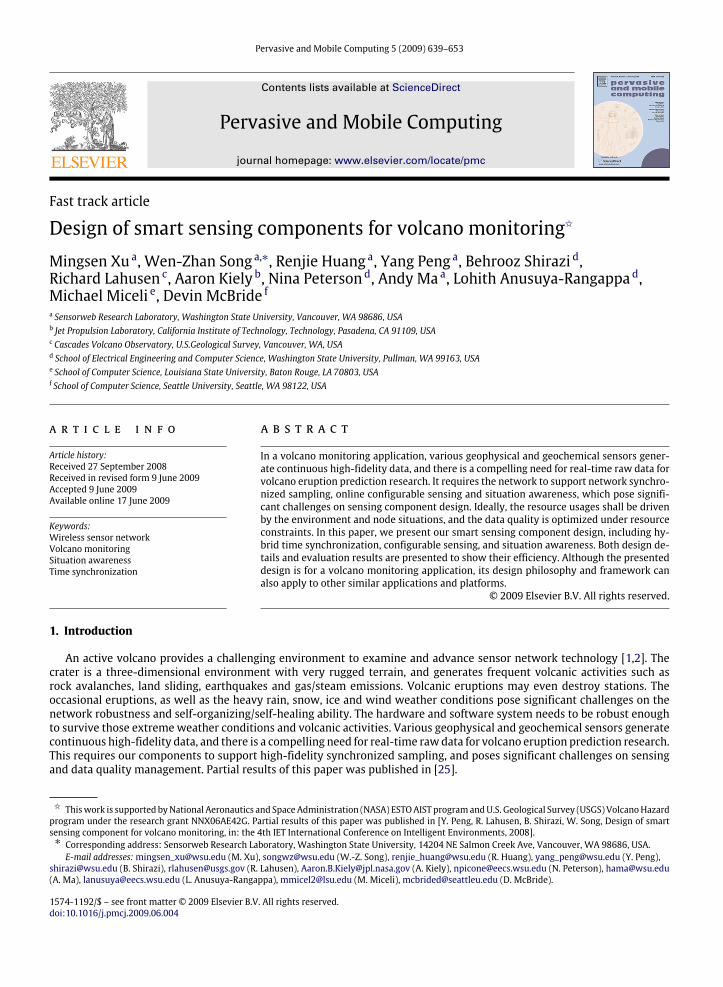
Fig. 1. Smart sensing component framework.
In this paper we present our smart sensing component design in a real volcanomonitoring sensor network, which is partof an Optimized Autonomous Space In situ Sensor Web (OASIS) [3]. The OASIS system integrates space and in situ sensorsinto a semi-closed loop and feeds information into an earth science decision system. It aims to develop a prototype dynamicand scalable hazard monitoring sensor web and apply it to volcano monitoring, and involves a multi-disciplinary team ofcomputer scientists (Washington StateUniversity), earth scientists (USGSCascadeVolcanoObservatory) and space scientists(Jet Propulsion Laboratory). More information about the whole system can be found at [3]. The system requirements givenby USGS earth scientists include:
• Synchronized sampling: To utilize the temporal and spatial correlation of volcano signals, earth scientists require that allstations perform synchronized sampling and time-stamp recorded signals with precise UTC time, with error no morethan one millisecond.• Real-time continuous raw data: There are currently no well-agreed algorithms or models available to predict volcanoeruptions, thus high-fidelity continuous data is a compelling need for studying the behavior of volcanoes.• One-year robust operation: The crater is a harsh environment (as described above), but USGS scientists expect that thesensor network can run continuously for one year, hence the hardware and software system needs to be robust enoughto survive those extreme weather conditions and volcanic activities.• Reliable command control: This OASIS system [3] aims to integrate complementary space and in situ elements to buildan interactive, autonomous sensor web. The sensor network shall provide an interface to interact with external inputs,including the NASA Earth Observation (EO-1) satellite and USGS science softwares. The command and control shall bedelivered reliably in real time.
The main functions of sensing components are to preserve the fidelity of effective sensing data, filter out faulty signalsand deliver data to the sensor network. We mainly designed the hybrid time synchronization mechanisms, configurablesensing and situation awareness middlewares to address those requirements. Fig. 1 depicts the overall framework. Thedesign details include: (1) To support robust synchronized sampling, we designed a hybrid time synchronization scheme, Z-SYNC, to achieve both accuracy and robustness. Time synchronization could be implemented through a time synchronizationprotocol, or GPS. While GPS provides higher timing accuracy, it may be damaged in the harsh volcano environment. Inthe literature, there are several time synchronization protocols [4–6] developed for wireless sensor networks. However,former researchers [1] found that those protocols were not stable in their field deployment. We utilized their advantagesto develop a hybrid time synchronization protocol. The design details will be presented in Section 3. (2) To support onlineconfigurable sensing, we designed a scalable sensor driver and RPC mechanism to provide the flexibility of customizingsensing capabilities on the fly. For instance, the sampling rate and channel are configurable, and the processing tasks oneach data type is configurable too (different nodes could be configured to run different processing algorithms on the fly).The data management for real-time continuous raw data is another challenging issue and is addressed in the configurablesensing section. The design details will be presented in Section 4. (3) To collect real-time continuous data with limitedbandwidths, we have to drop some packets in a congested situation. Thus we designed a situation awareness middlewareto detect the node and environment situations and adjust data priorities accordingly. The design details will be presentedin Section 5. Although the presented design is for a volcano monitoring application, its design philosophy and framework is

M. Xu et al. / Pervasive and Mobile Computing 5 (2009) 639–653 641
also suitable for various other applications and platforms. The design is generic. The rest of the paper is organized as follows.In Section 2, we present the hardware design for volcano monitoring. Finally, we conclude the paper in Section 6.
2. Hardware design
To support one-year of continuous operation, our hardware design has considered various volcanic environmentchallenges with the direct involvement of experienced USGS engineers. We designed a 3-leg spider station, which is about4-feet tall including the lifted antenna and weighs about 70 pounds. The spider station is designed to support air-dropdeployment and survive in the harsh wild environment (e.g., heavy gust at more than 120 miles per hour) with helpfrom our mechanical engineering faculty and students. We mounted a 6 dBi omnidirectional antenna on a PVC steel pipeto get reasonable line-of-sight. And, because solar panels do not work well in the northwest area due to the long rainyseason, we used high-capacity AIR-ALKALINE batteries for a reliable energy supply. The weight of the battery helps tostabilize the station in heavy gusts. A 900MHz Freewave radio modem is attached to the sink node to provide long-distancecommunication to the gateway.Inside the spider, the core hardware components are encapsulated in a small weather-proofing white iron box, with
a dimension of 30 × 20 cm2 (Fig. 2). The white box contains a sensor mote (iMote2), a sensor board (MDA320CA), a GPSreceiver (LEA-4T) and other components, as shown in Fig. 2.We choose iMote2 because it offers better in-network processingcapability: its PXA271 processor can be configured to work from 13 MHz to 416 MHz; it has 256 KB SRAM and 32 MBSDRAM memory space. In addition, it has rich I/O interfaces to support flexible extension, including three SPI, three UART,and multiple GPIO interfaces. We configured its PXA271 processor to operate in a low voltage (0.85 V) and low frequency(13MHz)mode to conserve energies. A low-power U-Blox LEA-4T L1 GPS receiver is connected to iMote2 through bluetoothUART interface for raw data capturing, and through GPIO 93 for PPS (pulse-per-second) signal capturing. The GPS measuresthe volcano ground deformation and time-stamps sensor data in UTC time. The accuracy of its time pulse is up to 50 ns.An accuracy of 15 ns is achievable by using the quantization error information to compensate the granularity of the timepulse. This GPS can be configured to provide rawmeasurement data and offer precise positioning, real-time kinematics andaltitude sensing. In addition, a MDA320CA sensor board is connected to the iMote2 through an SPI interface, acquiring datafrom seismic, infrasonic and lightning sensors. The MDA320CA board provides up to 8 channels of 16-bit analog-to-digitalconversion. The device provides a shutdown mode that reduces power dissipation to under 15 µW. All components arestrictly ground power isolated from electromagnetic interference. It is worth mentioning that, in our initial data acquisitionsoftware design, iMote2 read the sensing data from MDA320CA through the SPI and the SPI clock speed is controlled byiMote2, with the speed divisor as setup in the ADC driver. One lesson we learned is that the overclock of 6.5 MHz clockrate causes unstable ADC acquisitions. At 3 V supply, it needs to drop to 2.0 to 2.4 MHz depending on choice of external orinternal clock modes.The seismic, infrasonic and lightning sensors are connected to the white iron box through data cables. The seismic sensor,
Silicon DesignsModel 1221 [7], is a low-cost integrated accelerometer for use in zero tomedium frequency instrumentationapplications that require extremely low noise. And the 2g version is ideally suited for seismic applications. The infrasonicsensor, Model 1 INCH-D-MV [8], is a low range differential pressure sensor to record infrasound, low-frequency (<20 Hz)acoustic waves generated during explosive events. This millivolt output pressure sensor is based upon a proprietarytechnology to reduce output offset or common mode errors. Output offset errors due to change in temperature, stability towarm-up, stability to long time periods, and position sensitivity are all significantly reducedwhen compared to conventionalcompensation methods. The lightning sensor is an RF pulse detector [9] capable of detecting lightning strikes 10 kmaway. The entire lightning sensor is built from scratch. It consists of an antenna, MOSFET amplifier and pulse conditioner.Lightning is detected on seismograms as simultaneous spikes and simultaneous gain-ranging and the typical spike durationis 0.04–0.05 s. Thus, lightning strength correlates with both tremor amplitude and magmatic gas content and can be usedfor ash detection.
3. Synchronized sampling
In our volcano monitoring application, a requirement from our earth science collaborator is that all stations performsynchronized sampling and time-stamp recorded signals with precise UTC time, with error no more than one millisecond.Precise timing is important for utilizing the temporal and spatial correlation of volcano signals. For instance, the time lagof seismic event samples from different stations can be utilized to locate an earthquake source. Thus, all stations need toperform network-wide synchronized sampling and time-stamp recorded signals with precise UTC time, within the errorof no more than one millisecond. Notice that synchronized sampling means that all sensors in the network sample theenvironment parameters at the same time point. It can be based on time synchronization, but requires some modificationson the timer design.Time synchronization could be implemented either through a time synchronization protocol [4–6,10], or through GPS
signal processing. While GPS provides better accuracy, it might be damaged in the harsh volcanic environment. In RBS [4],a reference message is broadcasted to eliminate non-determinism in the sender side but additional message exchange isnecessary to communicate the local time-stamps between the nodes. The TPSN [6] algorithm achieves better performanceby time-stamping the radio messages in the Medium Access Control (MAC) layer and by relying on a two-way message
642 M. Xu et al. / Pervasive and Mobile Computing 5 (2009) 639–653
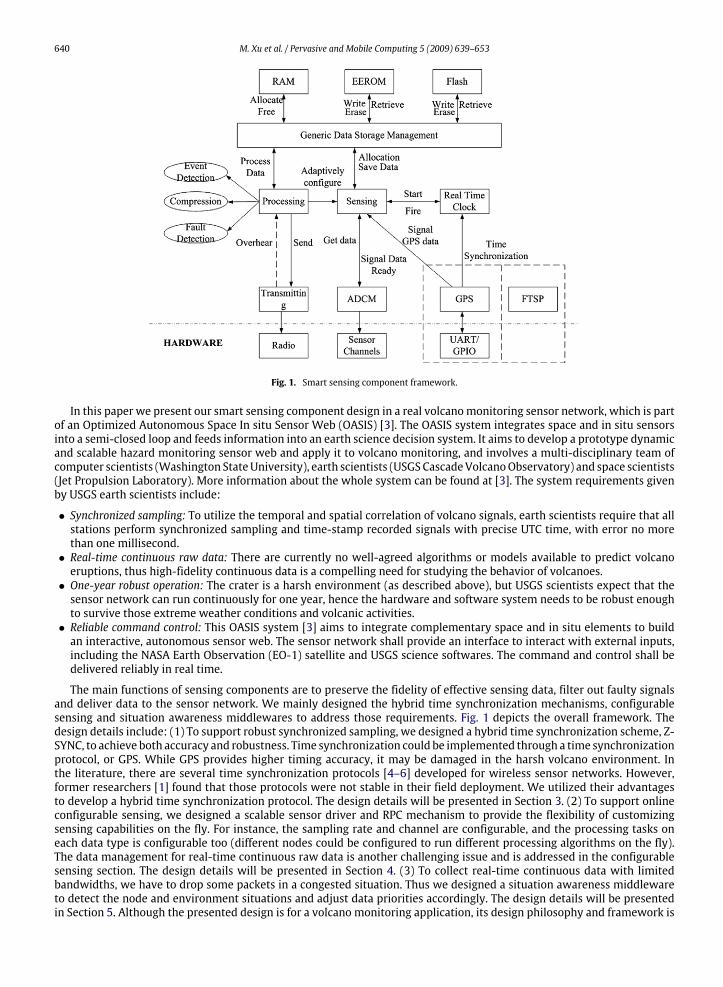
Fig. 2. The white box contains iMote2, MDA320CA, U-Blox LEA-4T GPS receiver.
Time Sync Root
Time Sync Root
5
1
4 6
3
1
4 5 6
322
No GPS Signal Has GPS Signal
Fig. 3. FTSP root election in Z-SYNC: choose the smallest id node with GPS FTSP root (Left); if the whole network lose GPS signal, then choose the nodewith the smallest id as FTSP root (Right).
exchange. However, TPSN does not handle dynamic topology changes. The Wisden system [10] proposed a lightweighttime-stamping approach that focuses on time-stamping the data consistently at the base station, rather than synchronizingclocks network-wide. However, the clock drift will affect the precision of the time-stamp. The longer the packets stay in thenetwork, themore it drifts. FTSP (Flooding Time Synchronization Protocol) [5] is a multi-hop time synchronization protocol,which achieves high precision performance by utilizing MAC-layer time-stamping and comprehensive error compensationincluding clock skew estimation. Timing errors of less than 67 µs were reported [5] for an 11-hop network of Mica2 nodes.However, former researchers [1] found that FTSP was not stable in their field deployment.We proposed a hybrid time synchronization mechanism, which retains the merits of FTSP and offsets its instability with
dynamic root election. If a node is equipped with a GPS receiver it is synchronized to the GPS time by default. If the GPSsignal disappears, then the node will switch to FTSP mode. Three situations can drive Z-SYNC to switch from GPS mode toFTSP mode: (1) missing PPS signal for over 10 s; (2) missing GPS data for over 20 s; (3) receiving two continuous invalidpackets of GPS data. For a node in the FTSP mode, if valid PPS signal and GPS data is received again, the Z-SYNC will changethe synchronization mode back to the GPS mode immediately. In the original design of FTSP, the node with the smallest idin a multi-hop network is selected as the FTSP root. All other nodes synchronize to the FTSP root. However, the node withthe smallest id may have lost GPS signal while some other nodes are still synchronized to GPS. To solve the problem, weextended the FTSP to support dynamic FTSP root selection, as illustrated in Fig. 3. In Z-SYNC, only a node that receives GPSsignal is allowed to claim itself as a FTSP root. For the nodes with GPS connection, they simply ignore the incoming FTSPpackets. If there are nodes with GPS in neighborhood when a node loses GPS signal, it synchronizes to the closest GPS node.Otherwise, it synchronizes to the node with the smallest id. So, in the worst case, if the whole network loses GPS signals thenode with the smallest id will be selected as the root, same as the original FTSP protocol.In Z-SYNC, GPS can be configured to enable a node to synchronize with UTC time. In our design, two types of raw GPS
data are configured to receive: NMEA message and UBX RXM-RAW message. NMEA message only contains the UTC timeinformation in ASCII format. The accurate global time, UTC time, can be conveniently parsed from the NMEAmessage insidea sensor node and this time could be used as the accurate global time source. The other type of data, UBX RXM-RAWmessage, contains the raw data of both time and position information, which could be analyzed for ground deformationmeasurement. It is worth mentioning that GPS in our system is not just for time synchronization, but also for grounddeformationmeasurement. Herewe take the advantage of its existence to support time synchronization and time-stamping.TheGPS rawdata is delivered to aUSGS database for precise ground deformation analysis. The synchronization process couldbe separated into two phases:
M. Xu et al. / Pervasive and Mobile Computing 5 (2009) 639–653 643
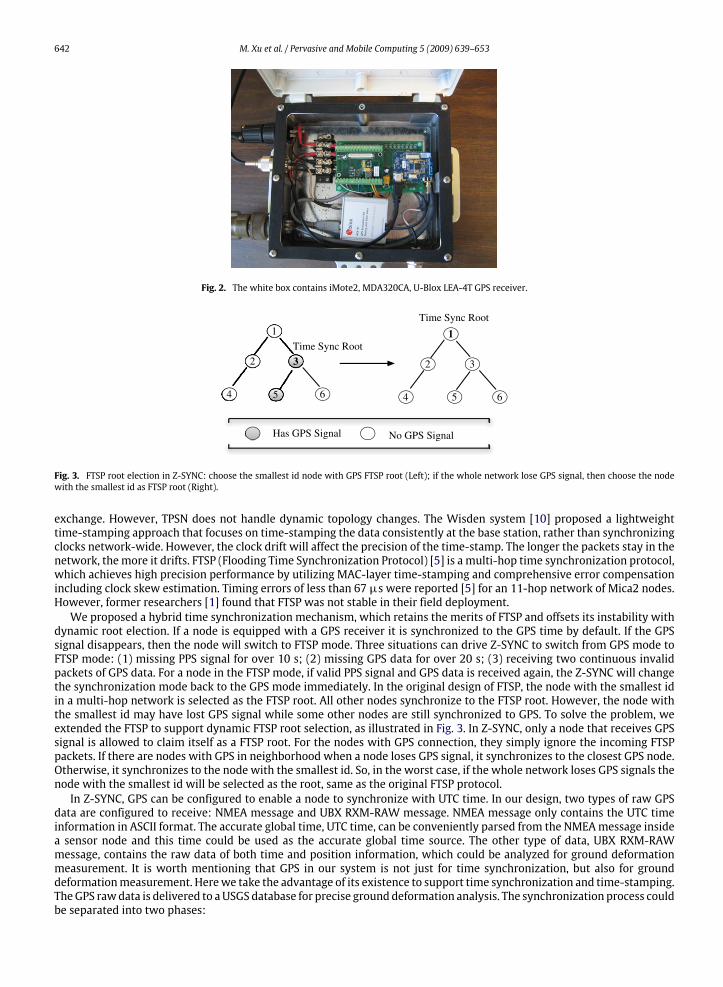
Fig. 4. GPS time synchronization.
• Phase 1: GPS raw data capturing. At the first time the valid GPS data is recorded, the UTC time information is extractedfrom the NMEA message and one second adjustment is added to it (UTC time has one millisecond resolution), becausethis UTC timewill not be used in synchronization until the next PPS signal arrives, which has a one second arrival interval.• Phase 2: PPS signal capturing. When the next PPS signal is captured after preparing the UTC time, the local time valuein the RTC module is immediately set with previous ready-to-use UTC time. After resetting the local time, the node localtime is synchronized with the global time.
The purpose of setting the RTC time value in the next PPS capturing is to minimize the time error. The GPS data comesto the UART interface after the PPS signal arrived with a short random delay, and the receiving of the whole NMEAmessageand extraction of UTC time will bring more delay. In order to get a precise global time, setting the global time at the nextPPS signal after UTC time is ready would remove the time difference introduced by the processing above (see Fig. 4). ThoughGPS data are received every ten seconds, the global time is only set once. After the first time setting, the global time willonly be adjusted based on the clock drift. The arrival interval of PPS signal is desired to be 1000000 ticks which are assumedto be 1 s; however, due to the clock drift problem, the arrival interval would decrease and the value could be 999,976 ticks,in which case a clock tick period is longer than 1 µs. The RTC time fire interval will be adjusted periodically based on drifts,which is calculated by the difference between assumed PPS arrival time and real local time. For example, if the drift is 27tick/second, the RTC clock fire interval will be decreased by 1 every 1000000/27 µs. Hence, it compensates the time driftproblem and guarantees an accurate global time.With Z-SYNC’s help of maintaining a global synchronized time, the synchronized sampling is achieved by the RTC (Real-
Time Clock) component according to the accurate global time. RTC has a 32-bit time count which increases every 1 msdriven by a low level hardware clock of microsecond resolution. RTC provides a millisecond resolution timer for a sensingcomponent. The basic idea of strict synchronized sampling is that the synchronized timers fire when the clock time value Tsatisfies Tcurrent%δ = 0, where Tcurrent is the current clock time and δ is the sampling interval. So, instead of setting the nextfire time point as Tcurrent + δ, the fire point Tfire is set to p Tcurrent
δq ∗ δ. For example if δ = 10 ms and Tcurrent is 20:00:00:422,
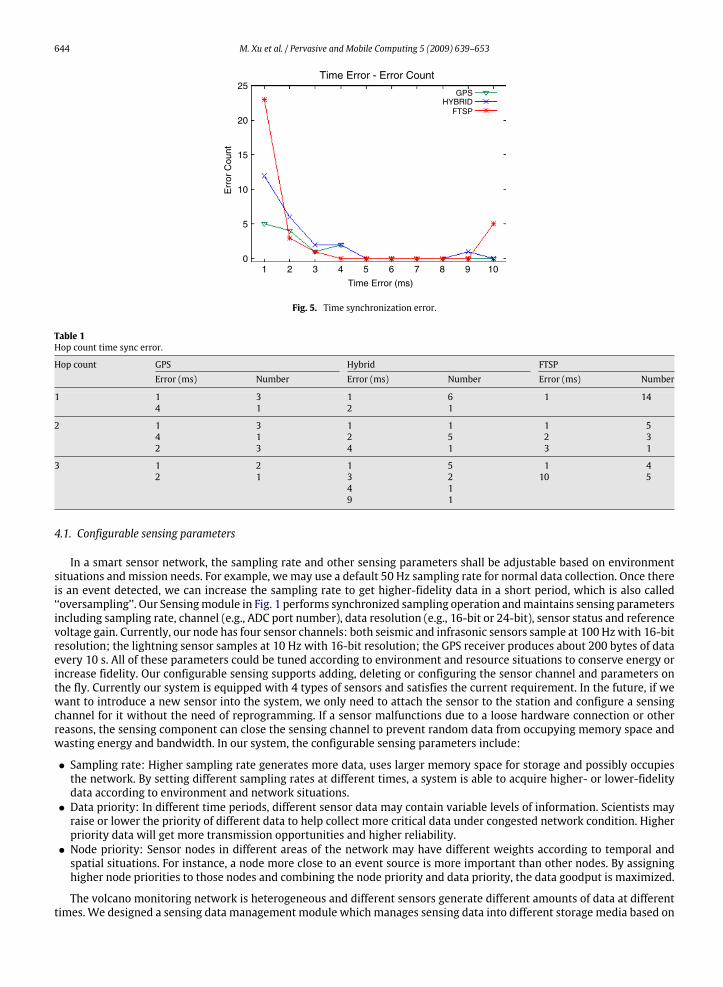
then the next fire interval is 20:00:00:430 but not 20:00:00:432.Evaluation. The Z-SYNC algorithm aims atminimizing the time error between nodes. In order to evaluate the performance
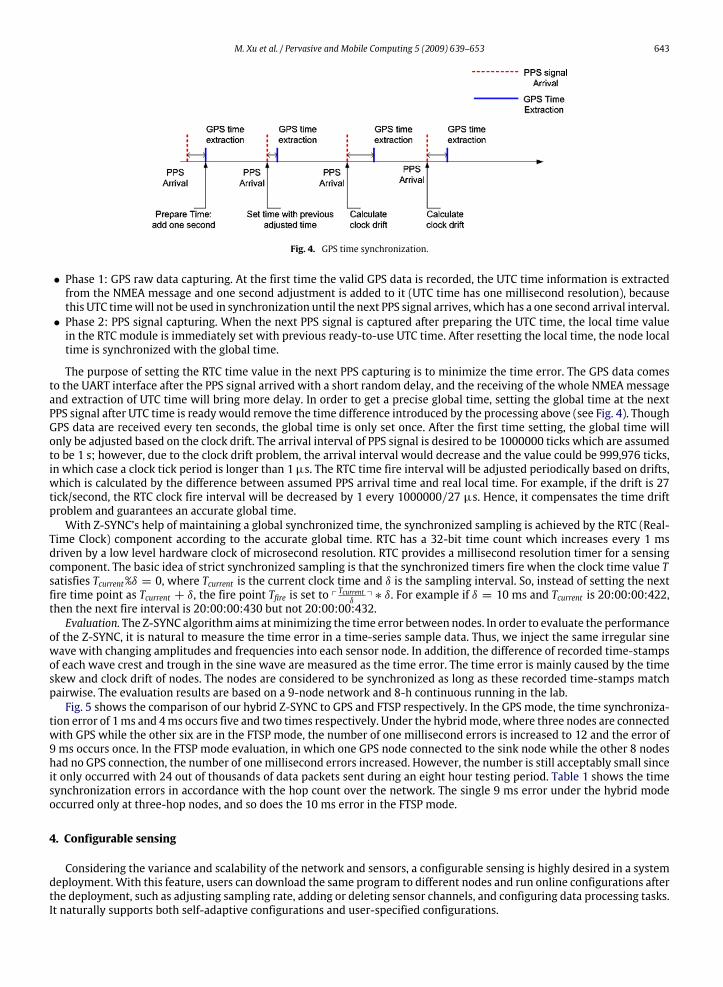
of the Z-SYNC, it is natural to measure the time error in a time-series sample data. Thus, we inject the same irregular sinewave with changing amplitudes and frequencies into each sensor node. In addition, the difference of recorded time-stampsof each wave crest and trough in the sine wave are measured as the time error. The time error is mainly caused by the timeskew and clock drift of nodes. The nodes are considered to be synchronized as long as these recorded time-stamps matchpairwise. The evaluation results are based on a 9-node network and 8-h continuous running in the lab.Fig. 5 shows the comparison of our hybrid Z-SYNC to GPS and FTSP respectively. In the GPS mode, the time synchroniza-
tion error of 1ms and 4ms occurs five and two times respectively. Under the hybridmode, where three nodes are connectedwith GPS while the other six are in the FTSP mode, the number of one millisecond errors is increased to 12 and the error of9 ms occurs once. In the FTSP mode evaluation, in which one GPS node connected to the sink node while the other 8 nodeshad no GPS connection, the number of onemillisecond errors increased. However, the number is still acceptably small sinceit only occurred with 24 out of thousands of data packets sent during an eight hour testing period. Table 1 shows the timesynchronization errors in accordance with the hop count over the network. The single 9 ms error under the hybrid modeoccurred only at three-hop nodes, and so does the 10 ms error in the FTSP mode.
4. Configurable sensing
Considering the variance and scalability of the network and sensors, a configurable sensing is highly desired in a systemdeployment. With this feature, users can download the same program to different nodes and run online configurations afterthe deployment, such as adjusting sampling rate, adding or deleting sensor channels, and configuring data processing tasks.It naturally supports both self-adaptive configurations and user-specified configurations.
644 M. Xu et al. / Pervasive and Mobile Computing 5 (2009) 639–653
25
20
15
10
5
01 2 3 4 5 6 7 8 9 10
Time Error (ms)
Err
or C
ount
Time Error - Error Count
GPSHYBRID
FTSP
Fig. 5. Time synchronization error.
Table 1Hop count time sync error.
Hop count GPS Hybrid FTSPError (ms) Number Error (ms) Number Error (ms) Number
1 1 3 1 6 1 144 1 2 1
2 1 3 1 1 1 54 1 2 5 2 32 3 4 1 3 1
3 1 2 1 5 1 42 1 3 2 10 5
4 19 1
4.1. Configurable sensing parameters
In a smart sensor network, the sampling rate and other sensing parameters shall be adjustable based on environmentsituations andmission needs. For example, we may use a default 50 Hz sampling rate for normal data collection. Once thereis an event detected, we can increase the sampling rate to get higher-fidelity data in a short period, which is also called‘‘oversampling’’. Our Sensingmodule in Fig. 1 performs synchronized sampling operation andmaintains sensing parametersincluding sampling rate, channel (e.g., ADC port number), data resolution (e.g., 16-bit or 24-bit), sensor status and referencevoltage gain. Currently, our node has four sensor channels: both seismic and infrasonic sensors sample at 100 Hzwith 16-bitresolution; the lightning sensor samples at 10 Hz with 16-bit resolution; the GPS receiver produces about 200 bytes of dataevery 10 s. All of these parameters could be tuned according to environment and resource situations to conserve energy orincrease fidelity. Our configurable sensing supports adding, deleting or configuring the sensor channel and parameters onthe fly. Currently our system is equipped with 4 types of sensors and satisfies the current requirement. In the future, if wewant to introduce a new sensor into the system, we only need to attach the sensor to the station and configure a sensingchannel for it without the need of reprogramming. If a sensor malfunctions due to a loose hardware connection or otherreasons, the sensing component can close the sensing channel to prevent random data from occupying memory space andwasting energy and bandwidth. In our system, the configurable sensing parameters include:
• Sampling rate: Higher sampling rate generates more data, uses larger memory space for storage and possibly occupiesthe network. By setting different sampling rates at different times, a system is able to acquire higher- or lower-fidelitydata according to environment and network situations.• Data priority: In different time periods, different sensor data may contain variable levels of information. Scientists mayraise or lower the priority of different data to help collect more critical data under congested network condition. Higherpriority data will get more transmission opportunities and higher reliability.• Node priority: Sensor nodes in different areas of the network may have different weights according to temporal andspatial situations. For instance, a node more close to an event source is more important than other nodes. By assigninghigher node priorities to those nodes and combining the node priority and data priority, the data goodput is maximized.
The volcano monitoring network is heterogeneous and different sensors generate different amounts of data at differenttimes. We designed a sensing data management module which manages sensing data into different storage media based on
M. Xu et al. / Pervasive and Mobile Computing 5 (2009) 639–653 645
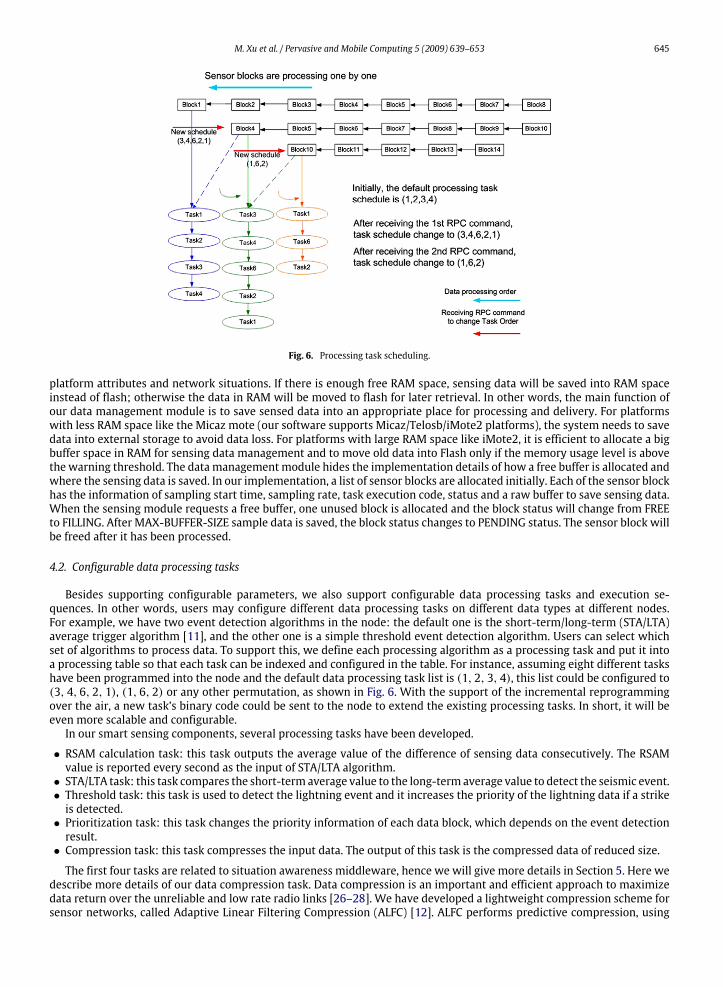
Fig. 6. Processing task scheduling.
platform attributes and network situations. If there is enough free RAM space, sensing data will be saved into RAM spaceinstead of flash; otherwise the data in RAM will be moved to flash for later retrieval. In other words, the main function ofour data management module is to save sensed data into an appropriate place for processing and delivery. For platformswith less RAM space like the Micaz mote (our software supports Micaz/Telosb/iMote2 platforms), the system needs to savedata into external storage to avoid data loss. For platforms with large RAM space like iMote2, it is efficient to allocate a bigbuffer space in RAM for sensing data management and to move old data into Flash only if the memory usage level is abovethe warning threshold. The datamanagementmodule hides the implementation details of how a free buffer is allocated andwhere the sensing data is saved. In our implementation, a list of sensor blocks are allocated initially. Each of the sensor blockhas the information of sampling start time, sampling rate, task execution code, status and a raw buffer to save sensing data.When the sensing module requests a free buffer, one unused block is allocated and the block status will change from FREEto FILLING. After MAX-BUFFER-SIZE sample data is saved, the block status changes to PENDING status. The sensor block willbe freed after it has been processed.
4.2. Configurable data processing tasks
Besides supporting configurable parameters, we also support configurable data processing tasks and execution se-quences. In other words, users may configure different data processing tasks on different data types at different nodes.For example, we have two event detection algorithms in the node: the default one is the short-term/long-term (STA/LTA)average trigger algorithm [11], and the other one is a simple threshold event detection algorithm. Users can select whichset of algorithms to process data. To support this, we define each processing algorithm as a processing task and put it intoa processing table so that each task can be indexed and configured in the table. For instance, assuming eight different taskshave been programmed into the node and the default data processing task list is (1, 2, 3, 4), this list could be configured to(3, 4, 6, 2, 1), (1, 6, 2) or any other permutation, as shown in Fig. 6. With the support of the incremental reprogrammingover the air, a new task’s binary code could be sent to the node to extend the existing processing tasks. In short, it will beeven more scalable and configurable.In our smart sensing components, several processing tasks have been developed.
• RSAM calculation task: this task outputs the average value of the difference of sensing data consecutively. The RSAMvalue is reported every second as the input of STA/LTA algorithm.• STA/LTA task: this task compares the short-term average value to the long-term average value to detect the seismic event.• Threshold task: this task is used to detect the lightning event and it increases the priority of the lightning data if a strikeis detected.• Prioritization task: this task changes the priority information of each data block, which depends on the event detectionresult.• Compression task: this task compresses the input data. The output of this task is the compressed data of reduced size.
The first four tasks are related to situation awareness middleware, hence we will give more details in Section 5. Here wedescribe more details of our data compression task. Data compression is an important and efficient approach to maximizedata return over the unreliable and low rate radio links [26–28]. We have developed a lightweight compression scheme forsensor networks, called Adaptive Linear Filtering Compression (ALFC) [12]. ALFC performs predictive compression, using
646 M. Xu et al. / Pervasive and Mobile Computing 5 (2009) 639–653
0.4
0.5
0.6
0.7
0.8
0.9
1
1.1
1.2
5.4K 8K 10.8K 14.1K 20.8K
Del
iver
y R
atio
Data Rate(bps)
No CompressionBaseline CompressionLP-3LP-4LP-5
Fig. 7. Delivery ratio evaluation based on FEQ data set.
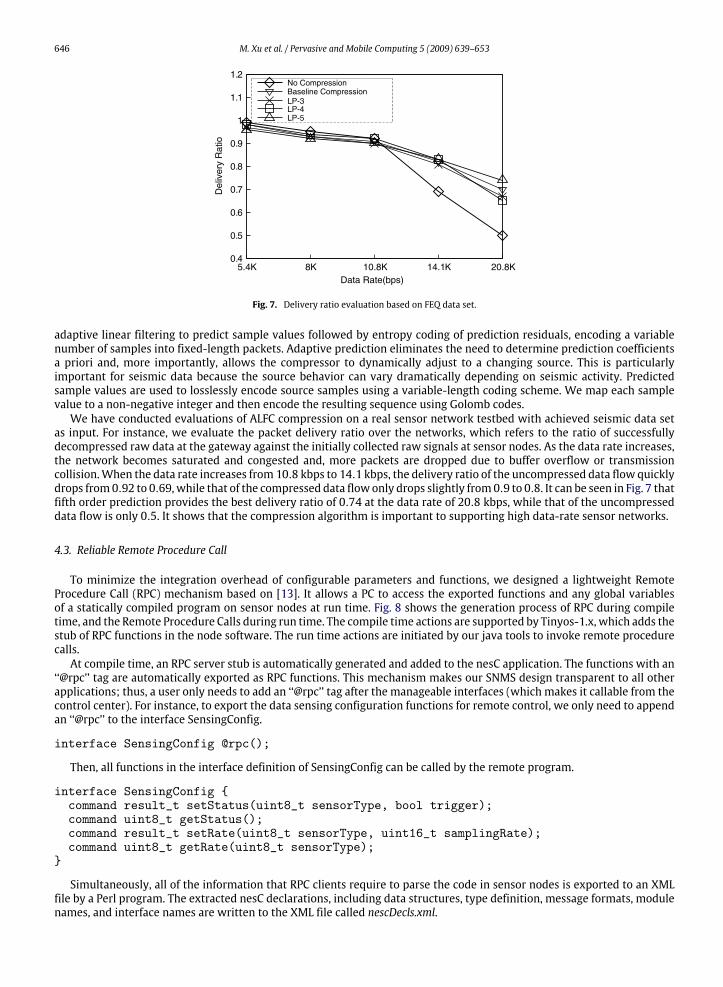
adaptive linear filtering to predict sample values followed by entropy coding of prediction residuals, encoding a variablenumber of samples into fixed-length packets. Adaptive prediction eliminates the need to determine prediction coefficientsa priori and, more importantly, allows the compressor to dynamically adjust to a changing source. This is particularlyimportant for seismic data because the source behavior can vary dramatically depending on seismic activity. Predictedsample values are used to losslessly encode source samples using a variable-length coding scheme. We map each samplevalue to a non-negative integer and then encode the resulting sequence using Golomb codes.We have conducted evaluations of ALFC compression on a real sensor network testbed with achieved seismic data set
as input. For instance, we evaluate the packet delivery ratio over the networks, which refers to the ratio of successfullydecompressed raw data at the gateway against the initially collected raw signals at sensor nodes. As the data rate increases,the network becomes saturated and congested and, more packets are dropped due to buffer overflow or transmissioncollision.When the data rate increases from 10.8 kbps to 14.1 kbps, the delivery ratio of the uncompressed data flow quicklydrops from0.92 to 0.69,while that of the compressed data flow only drops slightly from0.9 to 0.8. It can be seen in Fig. 7 thatfifth order prediction provides the best delivery ratio of 0.74 at the data rate of 20.8 kbps, while that of the uncompresseddata flow is only 0.5. It shows that the compression algorithm is important to supporting high data-rate sensor networks.
4.3. Reliable Remote Procedure Call
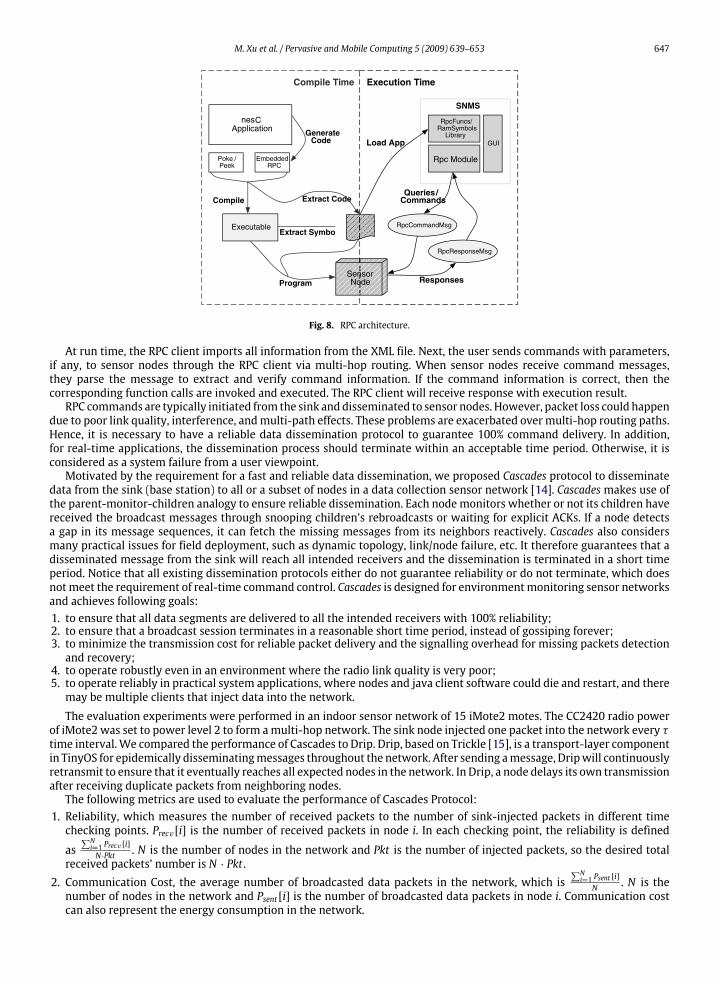
To minimize the integration overhead of configurable parameters and functions, we designed a lightweight RemoteProcedure Call (RPC) mechanism based on [13]. It allows a PC to access the exported functions and any global variablesof a statically compiled program on sensor nodes at run time. Fig. 8 shows the generation process of RPC during compiletime, and the Remote Procedure Calls during run time. The compile time actions are supported by Tinyos-1.x, which adds thestub of RPC functions in the node software. The run time actions are initiated by our java tools to invoke remote procedurecalls.At compile time, an RPC server stub is automatically generated and added to the nesC application. The functions with an
‘‘@rpc’’ tag are automatically exported as RPC functions. This mechanism makes our SNMS design transparent to all otherapplications; thus, a user only needs to add an ‘‘@rpc’’ tag after the manageable interfaces (which makes it callable from thecontrol center). For instance, to export the data sensing configuration functions for remote control, we only need to appendan ‘‘@rpc’’ to the interface SensingConfig.
interface SensingConfig @rpc();
Then, all functions in the interface definition of SensingConfig can be called by the remote program.
interface SensingConfig {command result_t setStatus(uint8_t sensorType, bool trigger);command uint8_t getStatus();command result_t setRate(uint8_t sensorType, uint16_t samplingRate);command uint8_t getRate(uint8_t sensorType);
}
Simultaneously, all of the information that RPC clients require to parse the code in sensor nodes is exported to an XMLfile by a Perl program. The extracted nesC declarations, including data structures, type definition, message formats, modulenames, and interface names are written to the XML file called nescDecls.xml.
M. Xu et al. / Pervasive and Mobile Computing 5 (2009) 639–653 647
nesCApplication
Poke /Peek
EmbeddedRPC
Executable
RpcFuncs/RamSymbols
Library
Rpc Module
GUI
RpcCommandMsg
RpcResponseMsg
GenerateCode
Compile Extract Code
Extract Symbols
Program
Load App
Queries /Commands
Responses
SNMS
Compile Time Execution Time
XML
SensorNode
Fig. 8. RPC architecture.
At run time, the RPC client imports all information from the XML file. Next, the user sends commands with parameters,if any, to sensor nodes through the RPC client via multi-hop routing. When sensor nodes receive command messages,they parse the message to extract and verify command information. If the command information is correct, then thecorresponding function calls are invoked and executed. The RPC client will receive response with execution result.RPC commands are typically initiated from the sink anddisseminated to sensor nodes. However, packet loss could happen
due to poor link quality, interference, andmulti-path effects. These problems are exacerbated over multi-hop routing paths.Hence, it is necessary to have a reliable data dissemination protocol to guarantee 100% command delivery. In addition,for real-time applications, the dissemination process should terminate within an acceptable time period. Otherwise, it isconsidered as a system failure from a user viewpoint.Motivated by the requirement for a fast and reliable data dissemination, we proposed Cascades protocol to disseminate
data from the sink (base station) to all or a subset of nodes in a data collection sensor network [14]. Cascadesmakes use ofthe parent-monitor-children analogy to ensure reliable dissemination. Each nodemonitors whether or not its children havereceived the broadcast messages through snooping children’s rebroadcasts or waiting for explicit ACKs. If a node detectsa gap in its message sequences, it can fetch the missing messages from its neighbors reactively. Cascades also considersmany practical issues for field deployment, such as dynamic topology, link/node failure, etc. It therefore guarantees that adisseminated message from the sink will reach all intended receivers and the dissemination is terminated in a short timeperiod. Notice that all existing dissemination protocols either do not guarantee reliability or do not terminate, which doesnotmeet the requirement of real-time command control. Cascades is designed for environmentmonitoring sensor networksand achieves following goals:1. to ensure that all data segments are delivered to all the intended receivers with 100% reliability;2. to ensure that a broadcast session terminates in a reasonable short time period, instead of gossiping forever;3. to minimize the transmission cost for reliable packet delivery and the signalling overhead for missing packets detectionand recovery;
4. to operate robustly even in an environment where the radio link quality is very poor;5. to operate reliably in practical system applications, where nodes and java client software could die and restart, and theremay be multiple clients that inject data into the network.
The evaluation experiments were performed in an indoor sensor network of 15 iMote2 motes. The CC2420 radio powerof iMote2 was set to power level 2 to form amulti-hop network. The sink node injected one packet into the network every τtime interval.We compared the performance of Cascades to Drip. Drip, based on Trickle [15], is a transport-layer componentin TinyOS for epidemically disseminatingmessages throughout the network. After sending amessage, Dripwill continuouslyretransmit to ensure that it eventually reaches all expected nodes in the network. In Drip, a node delays its own transmissionafter receiving duplicate packets from neighboring nodes.The following metrics are used to evaluate the performance of Cascades Protocol:
1. Reliability, which measures the number of received packets to the number of sink-injected packets in different timechecking points. Precv[i] is the number of received packets in node i. In each checking point, the reliability is defined
as∑Ni=1 Precv [i]N·Pkt . N is the number of nodes in the network and Pkt is the number of injected packets, so the desired total
received packets’ number is N · Pkt .2. Communication Cost, the average number of broadcasted data packets in the network, which is
∑Ni=1 Psent [i]N . N is the
number of nodes in the network and Psent [i] is the number of broadcasted data packets in node i. Communication costcan also represent the energy consumption in the network.
648 M. Xu et al. / Pervasive and Mobile Computing 5 (2009) 639–653
1
0.8
0.6
0.4
0.2
00 50 100 150 200
Checking Time Points (seconds)
Rel
iabi
lity
Time - ReliabilityCascades
Drip
Fig. 9. Reliability in different checking time.
2000
1500
1000
500
00 50 100 150 200
Checking Time Points (seconds)
Com
mun
icat
ion
Cos
t
Time - Communication CostCascades
Drip
Fig. 10. Communication cost in different checking time.
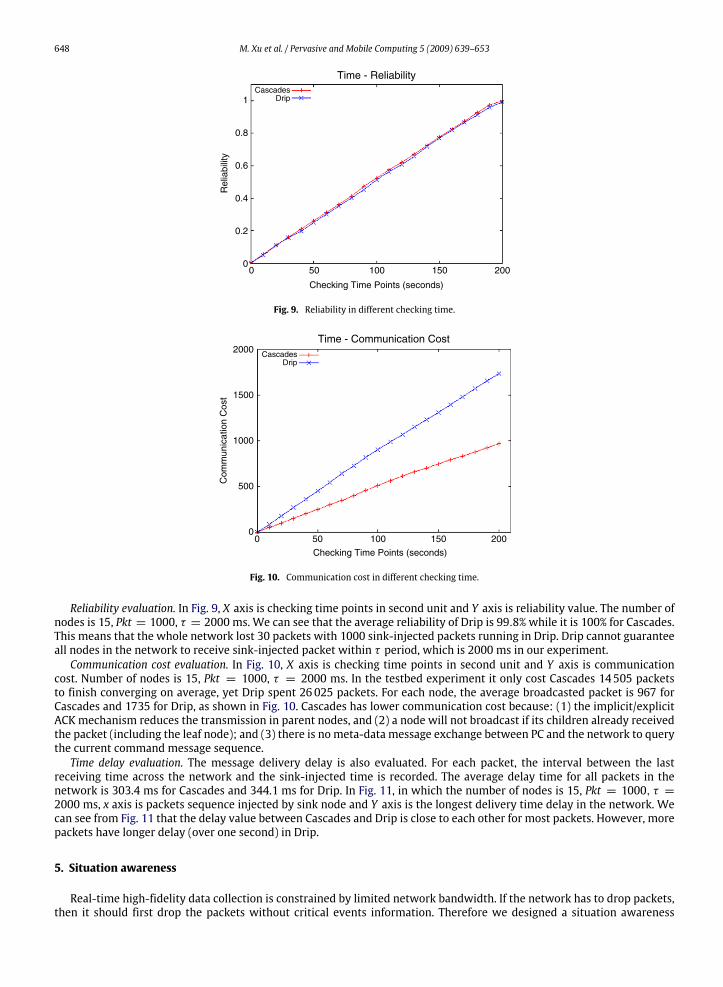
Reliability evaluation. In Fig. 9, X axis is checking time points in second unit and Y axis is reliability value. The number ofnodes is 15, Pkt = 1000, τ = 2000 ms. We can see that the average reliability of Drip is 99.8% while it is 100% for Cascades.This means that the whole network lost 30 packets with 1000 sink-injected packets running in Drip. Drip cannot guaranteeall nodes in the network to receive sink-injected packet within τ period, which is 2000 ms in our experiment.Communication cost evaluation. In Fig. 10, X axis is checking time points in second unit and Y axis is communication
cost. Number of nodes is 15, Pkt = 1000, τ = 2000 ms. In the testbed experiment it only cost Cascades 14505 packetsto finish converging on average, yet Drip spent 26025 packets. For each node, the average broadcasted packet is 967 forCascades and 1735 for Drip, as shown in Fig. 10. Cascades has lower communication cost because: (1) the implicit/explicitACK mechanism reduces the transmission in parent nodes, and (2) a node will not broadcast if its children already receivedthe packet (including the leaf node); and (3) there is no meta-data message exchange between PC and the network to querythe current command message sequence.Time delay evaluation. The message delivery delay is also evaluated. For each packet, the interval between the last
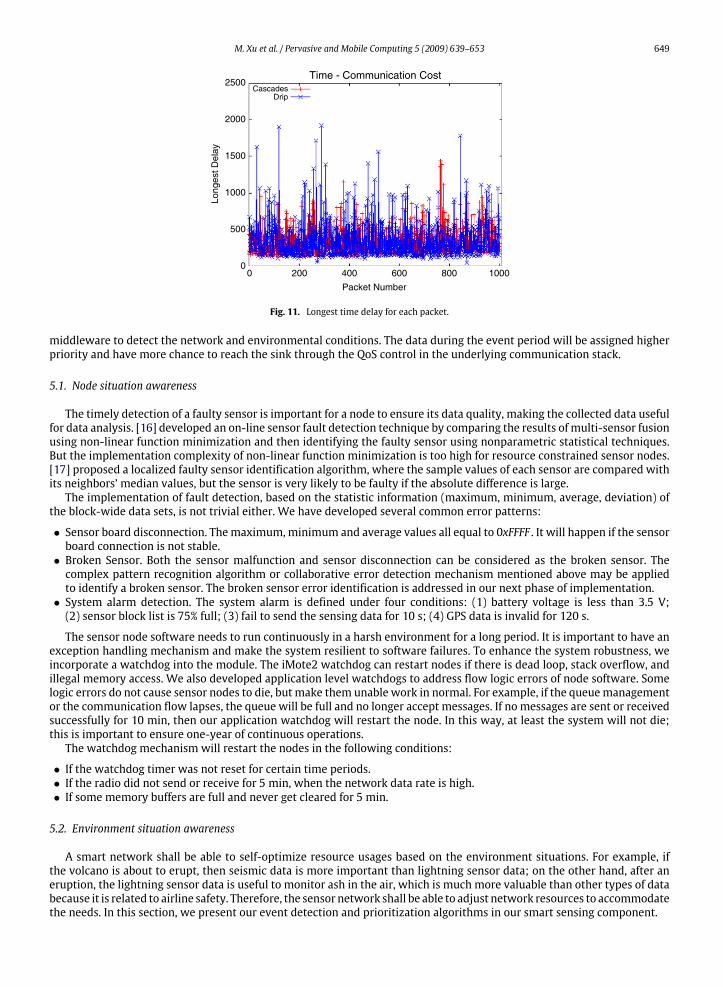
receiving time across the network and the sink-injected time is recorded. The average delay time for all packets in thenetwork is 303.4 ms for Cascades and 344.1 ms for Drip. In Fig. 11, in which the number of nodes is 15, Pkt = 1000, τ =2000 ms, x axis is packets sequence injected by sink node and Y axis is the longest delivery time delay in the network. Wecan see from Fig. 11 that the delay value between Cascades and Drip is close to each other for most packets. However, morepackets have longer delay (over one second) in Drip.
5. Situation awareness
Real-time high-fidelity data collection is constrained by limited network bandwidth. If the network has to drop packets,then it should first drop the packets without critical events information. Therefore we designed a situation awareness
M. Xu et al. / Pervasive and Mobile Computing 5 (2009) 639–653 649
2000
1500
1000
500
0 200 400 600 800
Packet Number
Time - Communication CostCascades
Drip
1000
2500
0
Long
est D
elay
Fig. 11. Longest time delay for each packet.
middleware to detect the network and environmental conditions. The data during the event period will be assigned higherpriority and have more chance to reach the sink through the QoS control in the underlying communication stack.
5.1. Node situation awareness
The timely detection of a faulty sensor is important for a node to ensure its data quality, making the collected data usefulfor data analysis. [16] developed an on-line sensor fault detection technique by comparing the results of multi-sensor fusionusing non-linear function minimization and then identifying the faulty sensor using nonparametric statistical techniques.But the implementation complexity of non-linear function minimization is too high for resource constrained sensor nodes.[17] proposed a localized faulty sensor identification algorithm, where the sample values of each sensor are compared withits neighbors’ median values, but the sensor is very likely to be faulty if the absolute difference is large.The implementation of fault detection, based on the statistic information (maximum, minimum, average, deviation) of
the block-wide data sets, is not trivial either. We have developed several common error patterns:
• Sensor board disconnection. Themaximum, minimum and average values all equal to 0xFFFF . It will happen if the sensorboard connection is not stable.• Broken Sensor. Both the sensor malfunction and sensor disconnection can be considered as the broken sensor. Thecomplex pattern recognition algorithm or collaborative error detection mechanism mentioned above may be appliedto identify a broken sensor. The broken sensor error identification is addressed in our next phase of implementation.• System alarm detection. The system alarm is defined under four conditions: (1) battery voltage is less than 3.5 V;(2) sensor block list is 75% full; (3) fail to send the sensing data for 10 s; (4) GPS data is invalid for 120 s.
The sensor node software needs to run continuously in a harsh environment for a long period. It is important to have anexception handling mechanism and make the system resilient to software failures. To enhance the system robustness, weincorporate a watchdog into the module. The iMote2 watchdog can restart nodes if there is dead loop, stack overflow, andillegal memory access. We also developed application level watchdogs to address flow logic errors of node software. Somelogic errors do not cause sensor nodes to die, but make them unable work in normal. For example, if the queuemanagementor the communication flow lapses, the queue will be full and no longer accept messages. If no messages are sent or receivedsuccessfully for 10 min, then our application watchdog will restart the node. In this way, at least the system will not die;this is important to ensure one-year of continuous operations.The watchdog mechanism will restart the nodes in the following conditions:
• If the watchdog timer was not reset for certain time periods.• If the radio did not send or receive for 5 min, when the network data rate is high.• If some memory buffers are full and never get cleared for 5 min.
5.2. Environment situation awareness
A smart network shall be able to self-optimize resource usages based on the environment situations. For example, ifthe volcano is about to erupt, then seismic data is more important than lightning sensor data; on the other hand, after aneruption, the lightning sensor data is useful to monitor ash in the air, which is much more valuable than other types of databecause it is related to airline safety. Therefore, the sensor network shall be able to adjust network resources to accommodatethe needs. In this section, we present our event detection and prioritization algorithms in our smart sensing component.
650 M. Xu et al. / Pervasive and Mobile Computing 5 (2009) 639–653
50 100 150 200 250Time(second)
Time(second)
50 100 150 200 250
-400-300-200-100
0 100 200 300 400
0 0.5
1 1.5
2 2.5
3 3.5
4
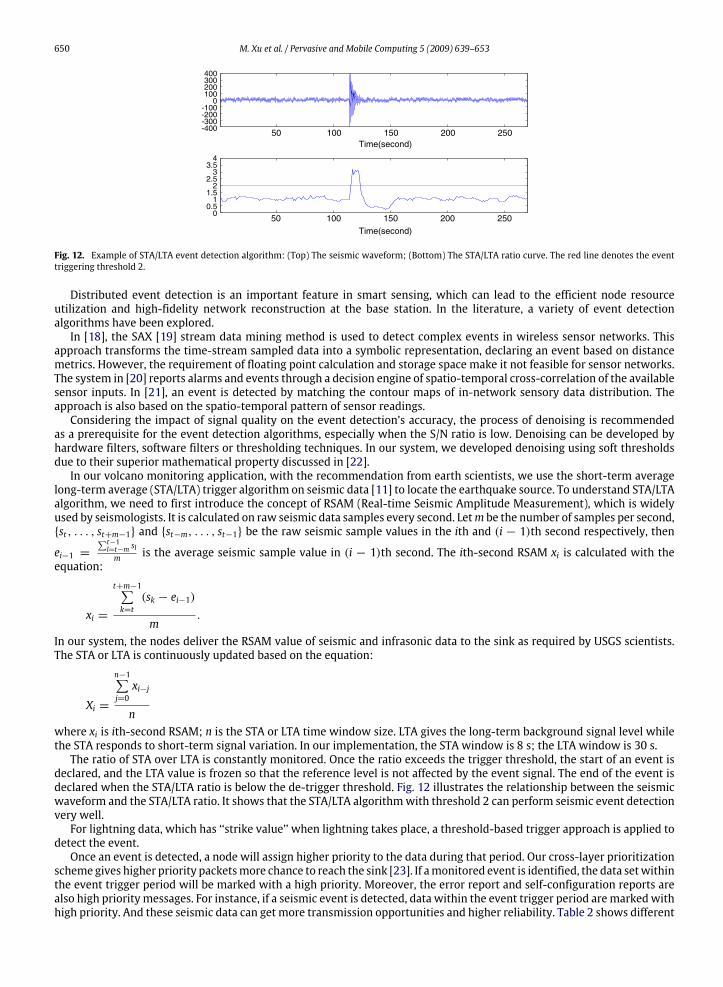
Fig. 12. Example of STA/LTA event detection algorithm: (Top) The seismic waveform; (Bottom) The STA/LTA ratio curve. The red line denotes the eventtriggering threshold 2.
Distributed event detection is an important feature in smart sensing, which can lead to the efficient node resourceutilization and high-fidelity network reconstruction at the base station. In the literature, a variety of event detectionalgorithms have been explored.In [18], the SAX [19] stream data mining method is used to detect complex events in wireless sensor networks. This
approach transforms the time-stream sampled data into a symbolic representation, declaring an event based on distancemetrics. However, the requirement of floating point calculation and storage space make it not feasible for sensor networks.The system in [20] reports alarms and events through a decision engine of spatio-temporal cross-correlation of the availablesensor inputs. In [21], an event is detected by matching the contour maps of in-network sensory data distribution. Theapproach is also based on the spatio-temporal pattern of sensor readings.Considering the impact of signal quality on the event detection’s accuracy, the process of denoising is recommended
as a prerequisite for the event detection algorithms, especially when the S/N ratio is low. Denoising can be developed byhardware filters, software filters or thresholding techniques. In our system, we developed denoising using soft thresholdsdue to their superior mathematical property discussed in [22].In our volcano monitoring application, with the recommendation from earth scientists, we use the short-term average
long-term average (STA/LTA) trigger algorithm on seismic data [11] to locate the earthquake source. To understand STA/LTAalgorithm, we need to first introduce the concept of RSAM (Real-time Seismic Amplitude Measurement), which is widelyused by seismologists. It is calculated on raw seismic data samples every second. Letm be the number of samples per second,{st , . . . , st+m−1} and {st−m, . . . , st−1} be the raw seismic sample values in the ith and (i − 1)th second respectively, then
ei−1 =∑t−1l=t−m slm is the average seismic sample value in (i − 1)th second. The ith-second RSAM xi is calculated with the
equation:
xi =
t+m−1∑k=t
(sk − ei−1)
m.
In our system, the nodes deliver the RSAM value of seismic and infrasonic data to the sink as required by USGS scientists.The STA or LTA is continuously updated based on the equation:
Xi =
n−1∑j=0xi−j
nwhere xi is ith-second RSAM; n is the STA or LTA time window size. LTA gives the long-term background signal level whilethe STA responds to short-term signal variation. In our implementation, the STA window is 8 s; the LTA window is 30 s.The ratio of STA over LTA is constantly monitored. Once the ratio exceeds the trigger threshold, the start of an event is
declared, and the LTA value is frozen so that the reference level is not affected by the event signal. The end of the event isdeclared when the STA/LTA ratio is below the de-trigger threshold. Fig. 12 illustrates the relationship between the seismicwaveform and the STA/LTA ratio. It shows that the STA/LTA algorithmwith threshold 2 can perform seismic event detectionvery well.For lightning data, which has ‘‘strike value’’ when lightning takes place, a threshold-based trigger approach is applied to
detect the event.Once an event is detected, a node will assign higher priority to the data during that period. Our cross-layer prioritization
scheme gives higher priority packetsmore chance to reach the sink [23]. If amonitored event is identified, the data setwithinthe event trigger period will be marked with a high priority. Moreover, the error report and self-configuration reports arealso high priority messages. For instance, if a seismic event is detected, data within the event trigger period aremarkedwithhigh priority. And these seismic data can get more transmission opportunities and higher reliability. Table 2 shows different

M. Xu et al. / Pervasive and Mobile Computing 5 (2009) 639–653 651
Table 2Data types and priorities.
Sensor name Data name Data type value Data priority value
Seismic RSAM1: Seismic RSAM value 1 7Seismic Seismic triggered events 2 5Seismic Seismic continuous data 2 2Infrasonic RSAM2: Infrasonic RSAM value 3 6Infrasonic Infrasonic triggered events 4 4Infrasonic Infrasonic continuous data 4 1Lightning Lightning strike data 5 6GPS GPS UBX-RXM-RAW data 6 3
sensor types and their corresponding priority values. Both seismic and infrasonic data have three types of data: RSAM datawhich is the average value per second, continuous data which is non-triggered data and triggered event data which fallinto the event triggering window. The triggered data and continuous data share the same sensor type value with differentpriority value. The default priority of seismic data and infrasonic data is 2 and 1 respectively, and the priority of triggereddata is increased by 3. Different from raw data, both RSAM values are viewed as high priority data. The priority of GPS datais assigned for 3.
5.3. Quality of Service management
Under the limited radio bandwidth, high-fidelity data collection networks are likely to experience congestion, in whichcase higher priority data need a larger delivery ratio to the gateway. Therefore, Quality of Service (QoS) managementschemes are required to manage the network traffic. Motivated by this, we propose a network QoS management to ensurethat high priority data are delivered throughout the network even in the presence of network congestion. The algorithm,called Tiny-DynamicWeighted Fair Queuing (Tiny-DWFQ) [23], uses a set of queues at each node to manage network trafficaccording to data priorities and network congestion. Tiny-DWFQ differs from the traditional Weighted Fair Queuing (WFQ)[24] algorithm in that we dynamically allocate more queue room to packets of higher priority and push packets of lowerpriority out of the queue, according to the current network congestion. Instead, for WFQ, the scheduling of the packets ismanaged by using one queue for each priority level and processing more packets from higher priority queues regardless ofthe network congestion. Moreover, Tiny-DWFQ is a generic scheduling algorithm, and any approach of determining dataand node priority can work in this framework. For instance, we can integrate the approaches discussed in Section 5.2 toassign data priorities.In volcanomonitoring applications, the priority of data dynamically changes depending on the data source. For example,
when the lava flows on the east side of the crater, the nodes on the east side of the crater should have a higher prioritythan the other nodes in the network. In addition, specific types of data, such as Real-time Seismic Amplitude Measurement(RSAM) should have higher priorities. Therefore, in order to prioritize the data as accurately as possible while preserving thelimited resources, we developed a Dynamic Weighted Priority (DWP). DWP takes into account both the data priority andthe node priority. Our design of DWP allows users to decide the relative importance of both the node and data priorities (asa percentage from 1 to 100).The Tiny-DWFQ algorithm contains two phases: enqueue and dequeue phases. The enqueuing phase occurs when a new
packet arrives and a decision about where it should be placed must be made. This decision is based on the packet’s DWP,which is a key component in Tiny-DWFQ’s enqueuing algorithm. The physical queue is composed of n virtual queues, one foreach of the n priority levelswithin the system. If there is space available in the virtual queue corresponding to the DWPof thenewly arriving packet, then it is inserted accordingly. Otherwise the packet is inserted into the next highest priority queuewith available space.When network congestion occurs, a higher priority packet replaces a lower priority packet without theneeds for retransmission. The dropping of the lower priority packets (during congestion) will decrease the QoS of the lowpriority packets in order to increase the QoS of the higher priority packets.Our dequeuing phase consists of four steps:
1. Calculate current network congestion.2. Calculate virtual queue weights.3. Calculate the number of packets to be dequeued from each virtual queue.4. Remove the appropriate packets from the queues and inject them into the network.
Network congestion is defined as the used queue space in the lightweight queue divided by the total queue size. In orderto reduce the number of distinct congestion levels we represented them as ranges between 0% and 100% (for instance,0%–30%, 31%–50%, 51%–75%, and 76%–100%). Both the number of ranges and the length of each range can be adjusted byusers. Calculation of the virtual queue weight requires the use of three parameters: current network congestion, availablespace in the next queue, and the application constants associated with each congestion level. After the queue weights havebeen calculated, we can determine the appropriate number of packets to be dequeued from each queue. For instance, thenumber of packets we should dequeue from queue k is determined by the number of packets in the virtual queue, divided
652 M. Xu et al. / Pervasive and Mobile Computing 5 (2009) 639–653
1 2 3 4 5 6
Pac
ket L
oss
Data Priority
Tiny-DWFQTiny-WFQ
10
15
20
25
30
35
40
45
50
40
50
60
70
80
90
100
1 2 3 4 5 6
Thr
ough
put
Data Priority
Tiny-DWFQTiny-WFQ
(a) Packet loss. (b) Throughput.
Fig. 13. Performance evaluation of Tiny-DWFQ.
by the number of virtual queues, times the weight of virtual queue k. For virtual queue k− 1 the same process is used if thetotal number of packets in virtual queue kwas less than the numberwhich could have been removed. The remaining packetscan be added to the number to be removed from virtual queue k− 1. The calculation for each virtual queue continues for alln queues.We evaluated our algorithm by comparing Tiny-DWFQ with Tiny-WFQ, measuring their packet loss and throughput for
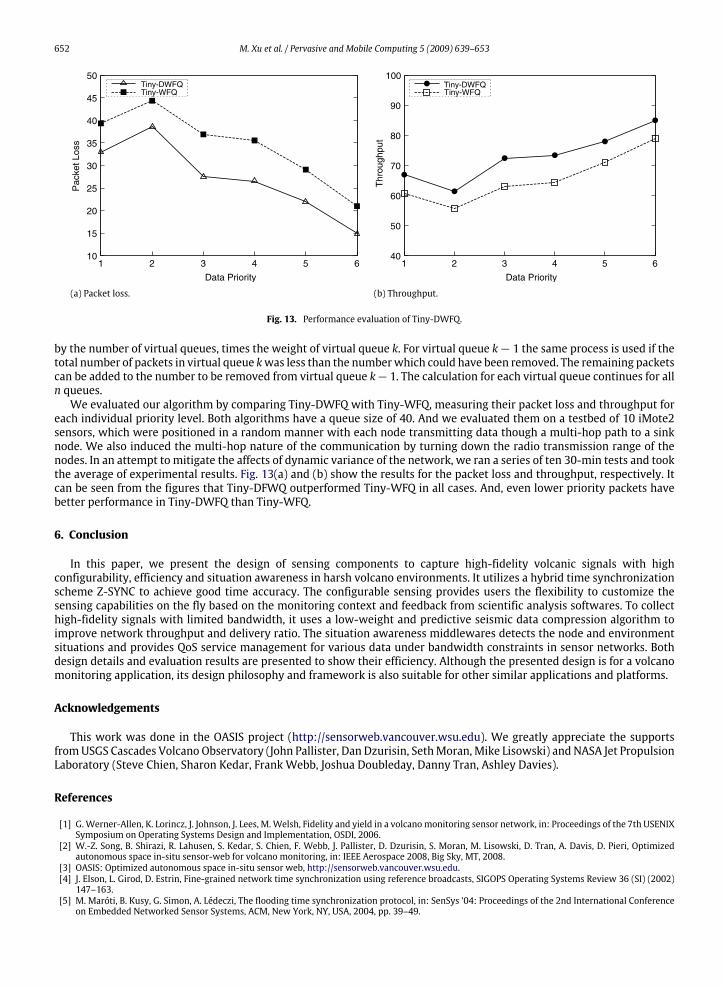
each individual priority level. Both algorithms have a queue size of 40. And we evaluated them on a testbed of 10 iMote2sensors, which were positioned in a random manner with each node transmitting data though a multi-hop path to a sinknode. We also induced the multi-hop nature of the communication by turning down the radio transmission range of thenodes. In an attempt to mitigate the affects of dynamic variance of the network, we ran a series of ten 30-min tests and tookthe average of experimental results. Fig. 13(a) and (b) show the results for the packet loss and throughput, respectively. Itcan be seen from the figures that Tiny-DFWQ outperformed Tiny-WFQ in all cases. And, even lower priority packets havebetter performance in Tiny-DWFQ than Tiny-WFQ.
6. Conclusion
In this paper, we present the design of sensing components to capture high-fidelity volcanic signals with highconfigurability, efficiency and situation awareness in harsh volcano environments. It utilizes a hybrid time synchronizationscheme Z-SYNC to achieve good time accuracy. The configurable sensing provides users the flexibility to customize thesensing capabilities on the fly based on the monitoring context and feedback from scientific analysis softwares. To collecthigh-fidelity signals with limited bandwidth, it uses a low-weight and predictive seismic data compression algorithm toimprove network throughput and delivery ratio. The situation awareness middlewares detects the node and environmentsituations and provides QoS service management for various data under bandwidth constraints in sensor networks. Bothdesign details and evaluation results are presented to show their efficiency. Although the presented design is for a volcanomonitoring application, its design philosophy and framework is also suitable for other similar applications and platforms.
Acknowledgements
This work was done in the OASIS project (http://sensorweb.vancouver.wsu.edu). We greatly appreciate the supportsfromUSGS Cascades Volcano Observatory (John Pallister, Dan Dzurisin, SethMoran, Mike Lisowski) and NASA Jet PropulsionLaboratory (Steve Chien, Sharon Kedar, Frank Webb, Joshua Doubleday, Danny Tran, Ashley Davies).
References
[1] G. Werner-Allen, K. Lorincz, J. Johnson, J. Lees, M.Welsh, Fidelity and yield in a volcanomonitoring sensor network, in: Proceedings of the 7th USENIXSymposium on Operating Systems Design and Implementation, OSDI, 2006.
[2] W.-Z. Song, B. Shirazi, R. Lahusen, S. Kedar, S. Chien, F. Webb, J. Pallister, D. Dzurisin, S. Moran, M. Lisowski, D. Tran, A. Davis, D. Pieri, Optimizedautonomous space in-situ sensor-web for volcano monitoring, in: IEEE Aerospace 2008, Big Sky, MT, 2008.
[3] OASIS: Optimized autonomous space in-situ sensor web, http://sensorweb.vancouver.wsu.edu.[4] J. Elson, L. Girod, D. Estrin, Fine-grained network time synchronization using reference broadcasts, SIGOPS Operating Systems Review 36 (SI) (2002)147–163.
[5] M. Maróti, B. Kusy, G. Simon, A. Lédeczi, The flooding time synchronization protocol, in: SenSys ’04: Proceedings of the 2nd International Conferenceon Embedded Networked Sensor Systems, ACM, New York, NY, USA, 2004, pp. 39–49.
M. Xu et al. / Pervasive and Mobile Computing 5 (2009) 639–653 653
[6] S. Ganeriwal, R. Kumar, M.B. Srivastava, Timing-sync protocol for sensor networks, in: SenSys ’03: Proceedings of the 1st International Conference onEmbedded Networked Sensor Systems, ACM, New York, NY, USA, 2003, pp. 138–149.
[7] Silicon, 1221j-002 accelerometer datasheet. http://www.silicondesigns.com/pdf/1221.pdf.[8] Pressure sensor datasheet. http://www.allsensors.com/datasheets/commercial_temp/ds-0091_revb2.pdf.[9] S.R. Mcnutt, C.M. Davis, Lightning associated with the 1992 eruptions of crater peak, mount spurr volcano, Alaska, Journal of Volcanology andGeothermal Research 102 (2000) 45–65.
[10] N. Xu, S. Rangwala, K.K. Chintalapudi, D. Ganesan, A. Broad, R. Govindan, D. Estrin, A wireless sensor network for structural monitoring, in: ACMConference on Embedded Networked Sensor Systems, 2004, pp. 13–24.
[11] T.Murray, E. Endo, A real-time seismic-amplitudemeasurement system (rsam), in: J.W. Ewert, D.A. Swanson (Eds.), Monitoring Volcanoes: Techniquesand Strategies Used by the Staff of the Cascades Volcano Observeratory, 1980–1990, in: USGS Bulletin, vol. 1966, 1992, pp. 5–10.
[12] A. Kiely, M. Xu, W.-Z. Song, R. Huang, B. Shirazi, Adaptive linear filtering compression on realtime sensor networks, in: PERCOM, 2009.[13] K. Whitehouse, G. Tolle, J. Taneja, C. Sharp, S. Kim, J. Jeong, J. Hui, P. Dutta, D. Culler, Marionette: Using rpc for interactive development and debugging
of wireless embedded networks, in: IPSN2006: The Fifth International Conference on Information Processing in Sensor Networks, April 2006.[14] Y. Peng, W. Song, R. Huang, M. Xu, B. Shirazi, Cacades: a reliable dissemination protocol for data collection sensor network, in: IEEE Aerospace 2009,
2009.[15] P. Levis, N. Patel, D. Culler, S. Shenker, Trickle: A self-regulating algorithm for code propagation and maintenance in wireless sensor networks,
in: Proceedings of the First USENIX/ACM Symposium on Networked Systems Design and Implementation, NSDI 2004, 2004.[16] N. Ramanathan, L. Balzano, M. Burt, D. Estrin, T. Harmon, C. Harvey, J. Jay, E. Kohler, S. Rothenberg, M. Srivastava, Rapid deployment with confidence:
Calibration and fault detection in environmental sensor networks, Tech. Rep., April 2006.[17] M. Ding, D. Chen, K. Xing, X. Cheng, Localized Fault-Tolerant Event Boundary Detection in Sensor Networks, Vol. 2, 2005.[18] M. Zoumboulakis, G. Roussos, Escalation: Complex event detection in wireless sensor networks, in: Proceeding of the 2nd European Conference on
Smart Sensing and Context, 2007.[19] J. Lin, E. Keogh, S. Lonardi, B. Chiu, A symbolic representation of time series, with implications for streaming algorithms, in: DMKD ’03: Proceedings
of the 8th ACM SIGMODWorkshop on Research Issues in Data Mining and Knowledge Discovery, ACM Press, New York, NY, USA, 2003, pp. 2–11.[20] I. Marshall, M. Price, H. Li, N. Boyd, S. Boult, Multi-sensor cross correlation for alarm generation in a deployed sensor network, in: Smart Sensing and
Context, in: Lecture Notes in Computer Science, vol. 4793, Springer, Berlin, Heidelberg, 2007, pp. 286–299.[21] W. Xue, Q. Luo, L. Chen, Y. Liu, Contour map matching for event detection in sensor networks, in: SIGMOD’06: Proceedings of the 2006 ACM SIGMOD
International Conference on Management of Data, ACM Press, New York, NY, USA, 2006, pp. 145–156.[22] D.L. Donoho, De-noising by soft-thresholding, IEEE Transactions on Information Theory 41 (3) (1995) 613–627.[23] N. Peterson, L. Anusuya-Rangappa, B. Shirazi, R. Huang, W.-Z. Song, M. Miceli, D. Mcbride, A. Hurson, R. Lahusen, Tinyos-based quality of service
management in wireless sensor networks, January 2009.[24] A. Parekh, Control in integrated services networks, Ph.D. Thesis, February 1992.[25] Y. Peng, R. Lahusen, B. Shirazi, W. Song, Design of smart sensing component for volcano monitoring, in: the 4th IET International Conference on
Intelligent Environments, 2008.[26] S.S. Pradhan, J. Kusuma, K. Ramchandran, Distributed compression in a dense microsensor network, IEEE Signal Processing Magazine 19 (2) (2002)
51–60.[27] J. Chou, D. Petrovic, K. Ramchandran, A distributed and adaptive signal processing approach to reducing energy consumption in sensor networks,
in: INFOCOM.[28] T.A. Welch, A technique for high-performance data compression, IEEE Computer 17 (6) (1984) 8–19.
Related Documents