Proceedings of the 2011 International Conference on Advanced Mechatronic Systems, Zhengzhou, China, August 11-13, 2011 Design of PV Power Station Remote Monitoring System Data Acquisition Device Junming Xiao, Pengcheng Liu, Lingyun Jiao, Haiming Zhu, Yinghu Du Abstract-This paper mainly introduced the basic structure and design p rocess of hardware and soſtware of PV power station remote monitoring s y stem data acquisition device, collected and monitored the photovoltaic power generation s y stem voltage, current, tem p erature, gave the bidirectional current sensing circuit, temperature detection circuit, serial communications interface circuit and remote communication diagram of PC and single chi p microcom p uter, the conditioning circuit of inverter AC voltage and current, data acquisition flow chart and so on. Aiming at the large scale parallel centralized development trend of PV power station, using group control technolog y , in the case of low sunshine data acquisition centralized control inverter to make inverter turns o p eration, greatl y extend the service life of the inverter. The s y stem could com p lete the data acquisition and p rocessing of PV power station operating parameters and the instantaneous value of electrical equipment operating status, realized d y namic curves and re p ort shows and p rint function of realize real-time and historical data. Keywords: PV power station; remote monitoring; data acquisition; group control technolo; bidirectional current sensing circuit I. INTRODUCTION Energy is the essential economic foundation of human life. Reliable, safe supply of energy and clean, efficient energy utilization is the basic guarantee to realize the economic and social development. People pay more and more attention to solar energy, which is an inexhaustible clean energy, PV draws the most attention [ 1, 2 1. In order to improve the efficiency of photovoltaic power generation system and understanding the local solar energy resources and the natural environment, photovoltaic system must be monitored and controlled [31. Traditional photovoItaic monitoring system is generally close monitoring maintenance staff on site need to keep continuously monitoring the data shown in equipment and making the corresponding treatment. A large part of the current constructions of photovoltaic power station are in remote areas where the environment is not suitable for long-term duty. To solve these above problems, this paper adapts the way of combination of telephone lines and RS-232 bus to transfer data. With the existing telephone network, remote monitoring the operation of PV power station, making the PV power station built in remote areas do not need staff on duty. Save of manpower resources has great significance for rther promotion and application of PV power station. JM. Xiao, P c. Liu, LY Jiao, H.M. Zhu, YH. Du are with the School of Electrical and Information, Zhongyuan University of Technology, 41 Zhongyuan Road, Zhengzhou, China, 450007. [email protected](JM. Xiao), [email protected](P.c. Liu). 978-0-9555293-7-5/11/$25.00 II. THE STRUCTURE AND FUNCTION OF REMOTE MONITORING SYSTEM Voltage and current signal acquisition module Luminous intensity signal acquisition module Temperature signal acquisition module Reset and watch-dog circuit Fig.l System hardware structure Output control and alarm si nal As figure 1 shown is the system hardware structure diagram, its core is micro-controller. The whole control system consisted of data acquisition, AID conversion and reset and watch-dog circuit, output control, clock chips, serial communication, LCD display and print drives and other peripheral circuit. Functions as follows: (1) Monitoring DC current: current of photovoltaic cells and battery; (2)Monitoring AC voltage and current: inverter output voltage and current; (3)Temperature testing: environmental temperature, battery surface temperature, room temperature and battery surface temperature; (4)Collecting PV power system environment parameter, battery array, electrical equipment operation parameters and the grid parameters; (5)The system could real-time monitoring the operation state of PV power station. When the equipment malnction it can immediately issued a warning signal, promptly noti the staff to handle the accident [41. (6)ln the process of battery charge and discharge, the system can effectively monitor the various states of battery array. With the existing telephone network to remote monitoring PV power station, realize the nction of remote control, telemetry, remote communication and remote adjustment; 367

Welcome message from author
This document is posted to help you gain knowledge. Please leave a comment to let me know what you think about it! Share it to your friends and learn new things together.
Transcript
Proceedings of the 2011 International Conference on Advanced Mechatronic Systems, Zhengzhou, China, August 11-13, 2011
Design of PV Power Station Remote Monitoring System Data
Acquisition Device
Junming Xiao, Pengcheng Liu, Lingyun Jiao, Haiming Zhu, Yinghu Du
Abstract-This paper mainly introduced the basic structure
and design process of hardware and software of PV power station remote monitoring system data acquisition device, collected and monitored the photovoltaic power generation
system voltage, current, temperature, gave the bidirectional
current sensing circuit, temperature detection circuit, serial communications interface circuit and remote communication diagram of PC and single chip microcomputer, the conditioning circuit of inverter AC voltage and current, data acquisition flow chart and so on. Aiming at the large scale
parallel centralized development trend of PV power station, using group control technology, in the case of low sunshine data acquisition centralized control inverter to make inverter turns operation, greatly extend the service life of the inverter. The system could complete the data acquisition and processing of PV power station operating parameters and the instantaneous value of electrical equipment operating status, realized dynamic curves and report shows and print function of realize real-time and historical data. Keywords: PV power station; remote monitoring; data acquisition; group control technology; bidirectional current sensing circuit
I. INTRODUCTION
Energy is the essential economic foundation of human life. Reliable, safe supply of energy and clean, efficient energy utilization is the basic guarantee to realize the economic and social development. People pay more and more attention to solar energy, which is an inexhaustible clean energy, PV draws the most attention [1, 21. In order to improve the efficiency of photovoltaic power generation system and understanding the local solar energy resources and the natural environment, photovoltaic system must be monitored and controlled [31. Traditional photovoItaic monitoring system is generally close monitoring maintenance staff on site need to keep continuously monitoring the data shown in equipment and making the corresponding treatment. A large part of the current constructions of photovoltaic power station are in remote areas where the environment is not suitable for long-term duty. To solve these above problems, this paper adapts the way of combination of telephone lines and RS-232 bus to transfer data. With the existing telephone network, remote monitoring the operation of PV power station, making the PV power station built in remote areas do not need staff on duty. Save of manpower resources has great significance for further promotion and application of PV power station.
JM. Xiao, P c. Liu, LY Jiao, H.M. Zhu, YH. Du are with the School of Electrical and Information, Zhongyuan University of Technology, 41 Zhongyuan Road, Zhengzhou, China, 450007. [email protected](JM. Xiao), [email protected](P.c. Liu).
978-0-9555293-7-5/11/$25.00
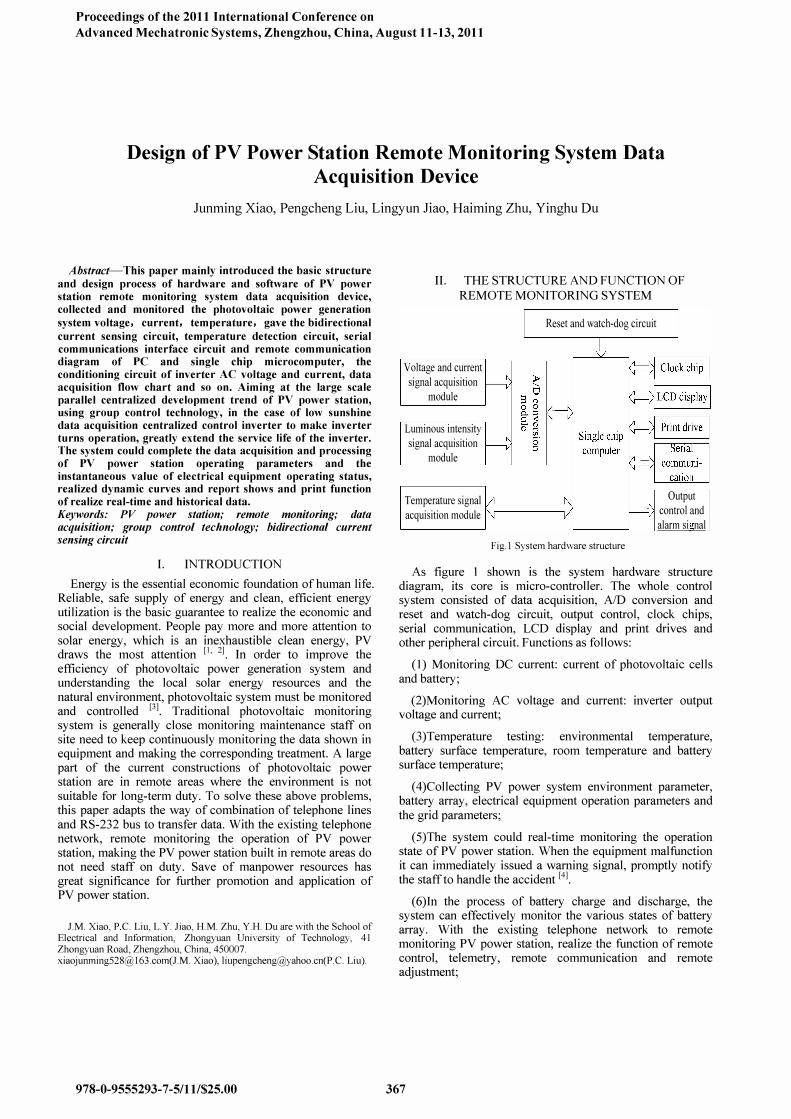
II. THE STRUCTURE AND FUNCTION OF
REMOTE MONITORING SYSTEM
Voltage and current signal acquisition
module
Luminous intensity signal acquisition
module
Temperature signal acquisition module
Reset and watch-dog circuit
Fig.l System hardware structure
Output control and alarm si nal
As figure 1 shown is the system hardware structure diagram, its core is micro-controller. The whole control system consisted of data acquisition, AID conversion and reset and watch-dog circuit, output control, clock chips, serial communication, LCD display and print drives and other peripheral circuit. Functions as follows:
(1) Monitoring DC current: current of photovoltaic cells and battery;
(2)Monitoring AC voltage and current: inverter output voltage and current;
(3)Temperature testing: environmental temperature, battery surface temperature, room temperature and battery surface temperature;
(4)Collecting PV power system environment parameter, battery array, electrical equipment operation parameters and the grid parameters;
(5)The system could real-time monitoring the operation state of PV power station. When the equipment malfunction it can immediately issued a warning signal, promptly notify the staff to handle the accident [41.
(6)ln the process of battery charge and discharge, the system can effectively monitor the various states of battery array. With the existing telephone network to remote monitoring PV power station, realize the function of remote control, telemetry, remote communication and remote adjustment;
367
(7)Storing the operation information of PV power station, realize the graphic display and printing of real-time data and historical data.
Except the general function, the system using group control technology, through centralized control of data acquisition to make inverter "rotate the leadership", inverter turns into operation in the case of low sunshine. This can improve the efficiency of low sunshine, extend the life of the inverter, achieved the n+x redundancy, increasing capacity prediction and energy management functions.
III. TWO-POINT SAMPLING ALGORITHMS
There are two ways to acquire power station AC according to the different sampling signals, they are DC sampling and AC sampling [51. DC sampling algorithm is simple and easy to filter. However, it has the problem of large investments and maintenance complex. AC sampling has the advantages of good real-time, phase distortion, less investment and easy to maintain. AC sampling have wide range of application, there are many algorithms according to the different application. It can be divided into sinusoidal model algorithm and the non-sinusoidal periodic model algorithm in accordance with the model function [61, in the sinusoidal model algorithm there are a single point of sampling, two sampling algorithm, etc. This article adopts two sampling algorithm.
Suppose u, = Urn sine OJt + rp)
u, = Urn sine OJt + rp + 90°)
U,2 +U22
= U"� sin2 (OJt + rp) + U:, cos' (OJt + rp)
= U� = 2U2
:. U =
�u" ;U22
. . rt:+t: SImIlarly 1 = �� P, Q acquisition:
u, i, + u,z, = Urn sine OJt + rp )1rn sine OJt -¢ + rp) +
(I)
(2)
(3)
(4)
(5)
U,,, sine OJt + rp + 90°)1", sine OJt -¢ + rp + 90°) (6)
= UJm COS¢ = 2P
UJ, - u,i, = Um sine OJt + rp )1m cos( OJt - ¢ + rp)
- U'" cos( OJt + rp)1", sine OJt - ¢ + rp)
= U 1 sin n\ = 2Q III III r
IV. SYSTEM HARDWARE DESIGN
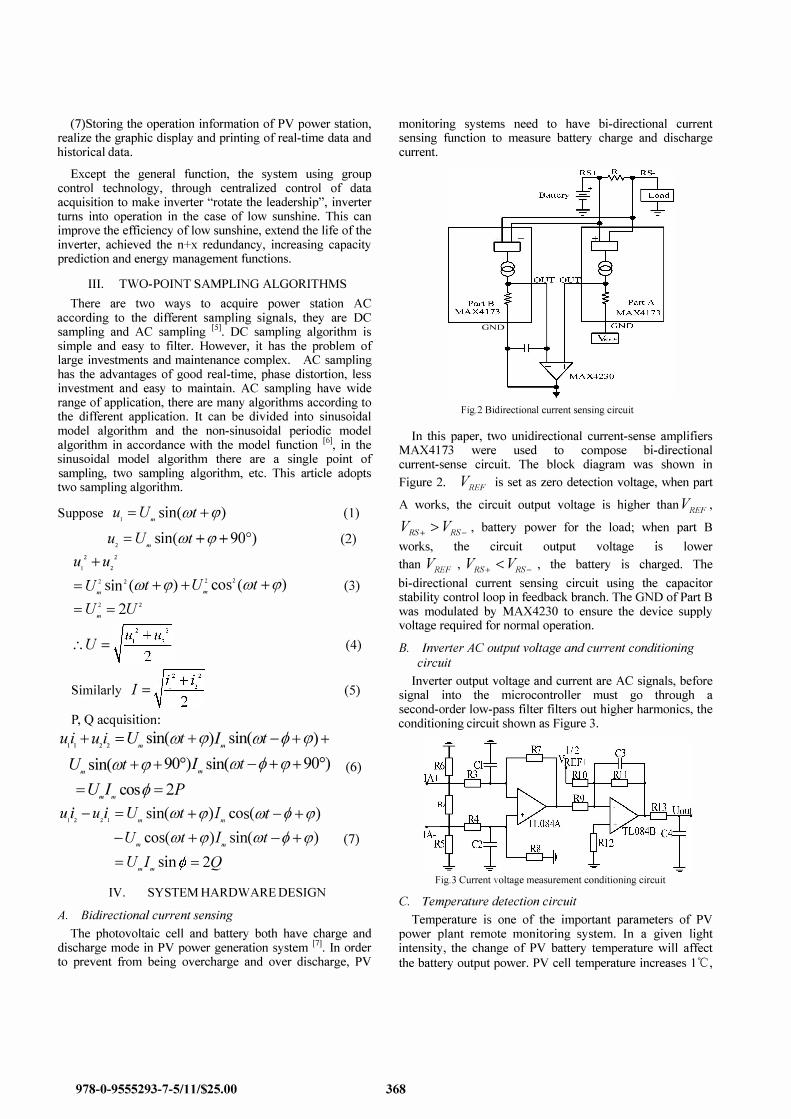
A. Bidirectional current sensing
(7)
The photovoltaic cell and battery both have charge and discharge mode in PV power generation system [71. In order to prevent from being overcharge and over discharge, PV
978-0-9555293-7-5/11/$25.00
monitoring systems need to have bi-directional current sensing function to measure battery charge and discharge current.
�---1"'"0""i1JT O,..,.l.i..!J +---+
GND
Fig.2 Bidirectional current sensing circuit
In this paper, two unidirectional current-sense amplifiers MAX4173 were used to compose bi-directional current-sense circuit. The block diagram was shown in
Figure 2. VREF is set as zero detection voltage, when part
A works, the circuit output voltage is higher than V REF '
�IS+ > �IS-' battery power for the load; when part B works, the circuit output voltage IS lower
than �I"F ' �IS+ < �IS-' the battery is charged. The
bi-directional current sensing circuit using the capacitor stability control loop in feedback branch. The GND of Part B was modulated by MAX4230 to ensure the device supply voltage required for normal operation.
B. Inverter AC output voltage and current conditioning circuit
Inverter output voltage and current are AC signals, before signal into the microcontroller must go through a second-order low-pass filter filters out higher harmonics, the conditioning circuit shown as Figure 3.
Fig.3 Current voltage measurement conditioning circuit
C. Temperature detection circuit Temperature is one of the important parameters of PV
power plant remote monitoring system. In a given light intensity, the change of PV battery temperature will affect the battery output power. PV cell temperature increases 1°C,
368
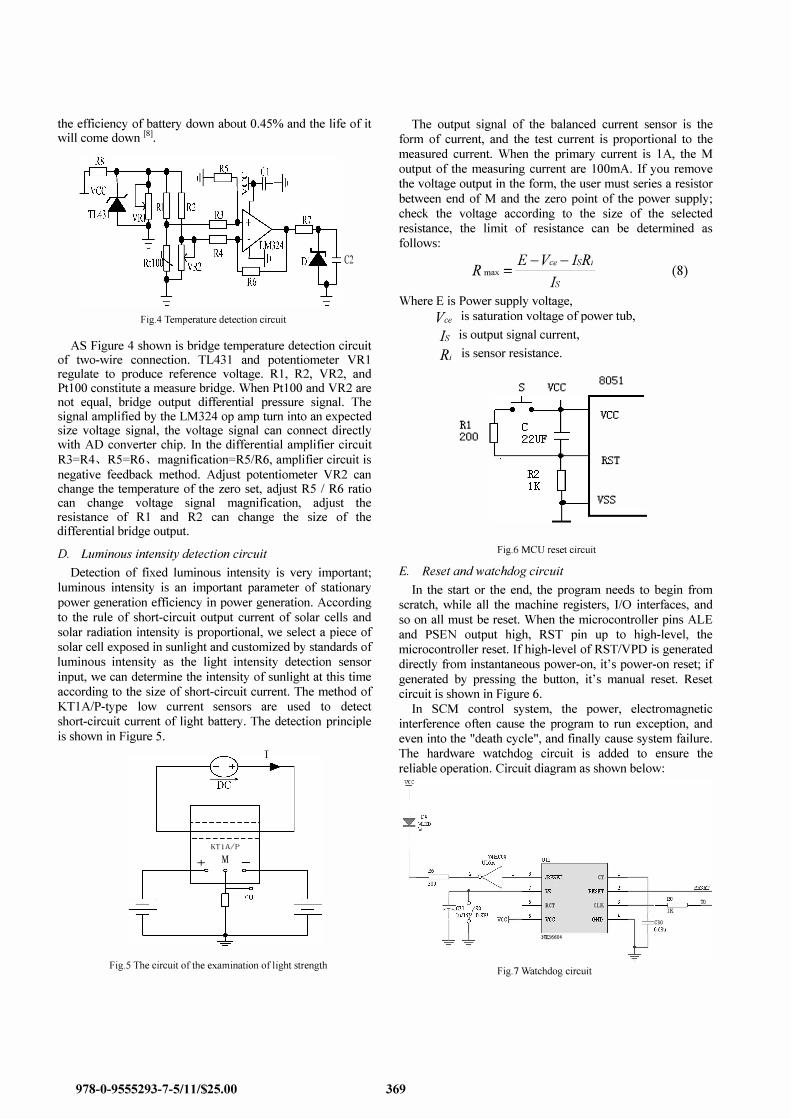
the efficiency of battery down about 0.45% and the life of it will come down [8].
C2
FigA Temperature detection circuit
AS Figure 4 shown is bridge temperature detection circuit of two-wire connection. TL431 and potentiometer VRI regulate to produce reference voltage. RI, R2, VR2, and PtlOO constitute a measure bridge. When PtlOO and VR2 are not equal, bridge output differential pressure signal. The signal amplified by the LM324 op amp turn into an expected size voltage signal, the voltage signal can connect directly with AD converter chip. In the differential amplifier circuit
R3=R4, R5=R6, magnification=R5/R6, amplifier circuit is
negative feedback method. Adjust potentiometer VR2 can change the temperature of the zero set, adjust R5 / R6 ratio can change voltage signal magnification, adjust the resistance of R 1 and R2 can change the size of the differential bridge output.
D. Luminous intensity detection circuit
Detection of fixed luminous intensity is very important;
luminous intensity is an important parameter of stationary
power generation efficiency in power generation. According
to the rule of short-circuit output current of solar cells and
solar radiation intensity is proportional, we select a piece of
solar cell exposed in sunlight and customized by standards of
luminous intensity as the light intensity detection sensor
input, we can determine the intensity of sunlight at this time
according to the size of short-circuit current. The method of
KTIAIP-type low current sensors are used to detect
short-circuit current of light battery. The detection principle
is shown in Figure 5.
I ,-----�- +r---�-.
KTli\/P
+ M
Fig.S The circuit of the examination oflight strength
978-0-9555293-7-5/11/$25.00
The output signal of the balanced current sensor is the
form of current, and the test current is proportional to the
measured current. When the primary current is lA, the M
output of the measuring current are 100mA. If you remove
the voltage output in the form, the user must series a resistor
between end of M and the zero point of the power supply;
check the voltage according to the size of the selected
resistance, the limit of resistance can be determined as
follows:
E-Vce-hRi R max = -----------
1�'
Where E is Power supply voltage,
Vee is saturation voltage of power tub,
h is output signal current,
Ri is sensor resistance.
R1 200
s vee
Fig.6 MCU reset circuit
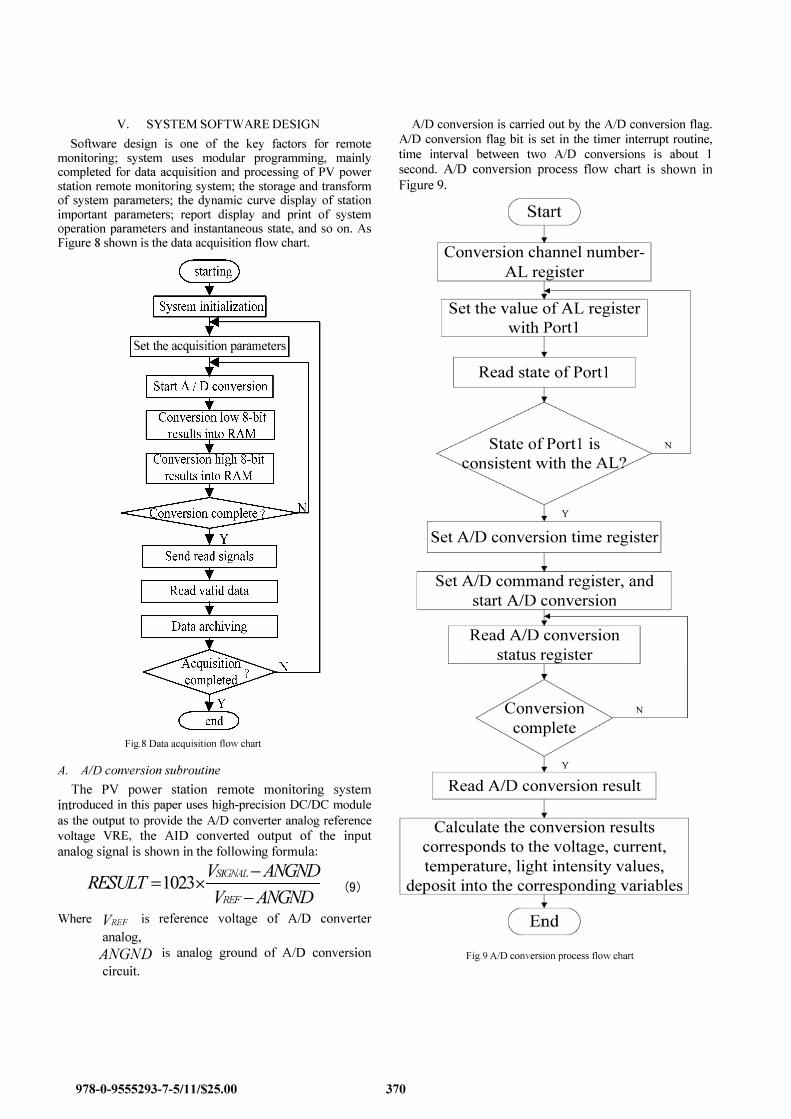
E. Reset and watchdog circuit
8051
vee
RST
vss
(8)
In the start or the end, the program needs to begin from
scratch, while all the machine registers, I/O interfaces, and
so on all must be reset. When the microcontroller pins ALE
and PSEN output high, RST pin up to high-level, the
microcontroller reset. If high-Ievel ofRSTNPD is generated
directly trom instantaneous power-on, it's power-on reset; if
generated by pressing the button, it's manual reset. Reset
circuit is shown in Figure 6.
In SCM control system, the power, electromagnetic
interference often cause the program to run exception, and
even into the "death cycle", and finally cause system failure.
The hardware watchdog circuit is added to ensure the
reliable operation. Circuit diagram as shown below:
369
RCT
vee
NE56604
CT 1---'-------, �� ����----�����
eLK f--''-----+--M TO lK
"lID C30
Fig.7 Watchdog circuit
v. SYSTEM SOFTWARE DESIGN
Software design is one of the key factors for remote monitoring; system uses modular programming, mainly completed for data acquisition and processing of PY power station remote monitoring system; the storage and transform of system parameters; the dynamic curve display of station important parameters; report display and print of system operation parameters and instantaneous state, and so on. As Figure 8 shown is the data acquisition flow chart.
Set the acquisition parameters
N
Fig.8 Data acquisition f10w chart
A. AID conversion subroutine
The PV power station remote monitoring system introduced in this paper uses high-precision DCIDC module
as the output to provide the AID converter analog reference voltage VRE, the AID converted output of the input
analog signal is shown in the following formula:
RESULT = 1023 X VsIGNAL -ANGND
VREF-ANGND (9)
Where VllioF is reference voltage of AID converter
analog, ANGND is analog ground of AID conversion
circuit.
978-0-9555293-7-5/11/$25.00
AID conversion is carried out by the AID conversion flag. AID conversion flag bit is set in the timer interrupt routine, time interval between two AID conversions is about 1
second. AID conversion process flow chart is shown in
Figure 9.
370
Conversion channel number
AL register
Set the value of AL register
with Portl
Read state of Port 1
State of Port I is
onsistent with the AL?
y
Set AID conversion time register
Set AID command register, and
start AID conversion
Read AID conversion
status register
Conversion N
N
>--------" complete
y
Read AID conversion result
Calculate the conversion results
corresponds to the voltage, current,
temperature, light intensity values,
de osit into the corres onding variables
Fig.9 AID conversion process flow chart
B. Key processing subroutine
The system has key circuits and related routines to display multiple parameter values. It can judge whether the trigger button is pressed and cumulate number of times of the trigger button depending on which to display different parameters used to achieve more data inquiry.
In this subroutine, the key state level will be determined at first, if the key state of high I, it doesn't trigger and returns the main program; key triggers at the state of low level 0, meanwhile, number of key trigger states plus I(the system shows nine values, so the key states are designed to 9 times) . Followed by cycle, until the number of key states to 9, then a query loop has all ended, the number of key states back to 0 in preparation for the next query cycle. As Figure 10 shown is the key processing subroutine flow chart.
Judge key state
Judge trigger number
Exit button processing procedure, return to
main program
key=J, untriggered
keyflag=9
Keyflag reset
Fig.10 Key processing subroutine flow chart
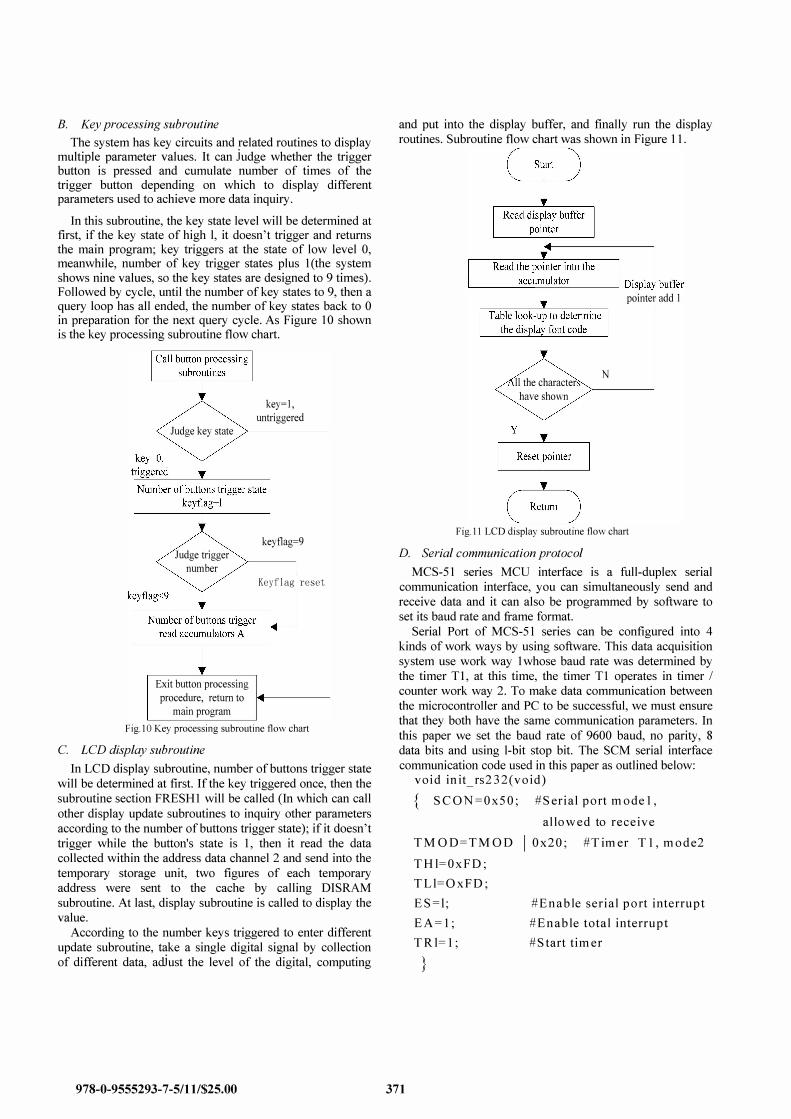
C. LCD display subroutine
In LCD display subroutine, number of buttons trigger state will be determined at first. If the key triggered once, then the subroutine section FRESHl will be called (In which can call
other display update subroutines to inquiry other parameters according to the number of buttons trigger state); if it doesn't trigger while the button's state is I, then it read the data collected within the address data channel 2 and send into the
temporary storage unit, two figures of each temporary address were sent to the cache by calling DI SRAM subroutine. At last, display subroutine is called to display the value.
According to the number keys triggered to enter different update subroutine, take a single digital signal by collection of different data, adjust the level of the digital, computing
978-0-9555293-7-5/11/$25.00
and put into the display buffer, and finally run the display routines. Subroutine flow chart was shown in Figure II.
� ____ ---, ____ � Display buffer
]] the character have shown
N
pointer add J
Fig.11 LCD display subroutine flow chart
D. Serial communication protocol
MCS-SI series MCU interface is a full-duplex serial communication interface, you can simultaneously send and receive data and it can also be programmed by software to set its baud rate and frame format.
Serial Port of MCS-Sl series can be configured into 4
kinds of work ways by using software. This data acquisition system use work way 1 whose baud rate was determined by the timer TI, at this time, the timer TI operates in timer /
counter work way 2. To make data communication between the microcontroller and PC to be successful, we must ensure that they both have the same communication parameters. In
this paper we set the baud rate of 9600 baud, no parity, 8
data bits and using I-bit stop bit. The SCM serial interface communication code used in this paper as outlined below:
371
void in it_rs232 ( v o id )
{ S CON=Ox S O; #S erial p o rt m o del,
allo w ed to receive
TMOD= TMOD
T H I=OxFD;
TL l=O xFD;
E S=I;
EA =I;
T RI=I;
}
Ox2 0; #T im er T I , m o d e2
#En a b le serial p o rt interru p t
#En a b le total interru p t
#S tart tim er
VI. EXPERIMENTAL RESULTS
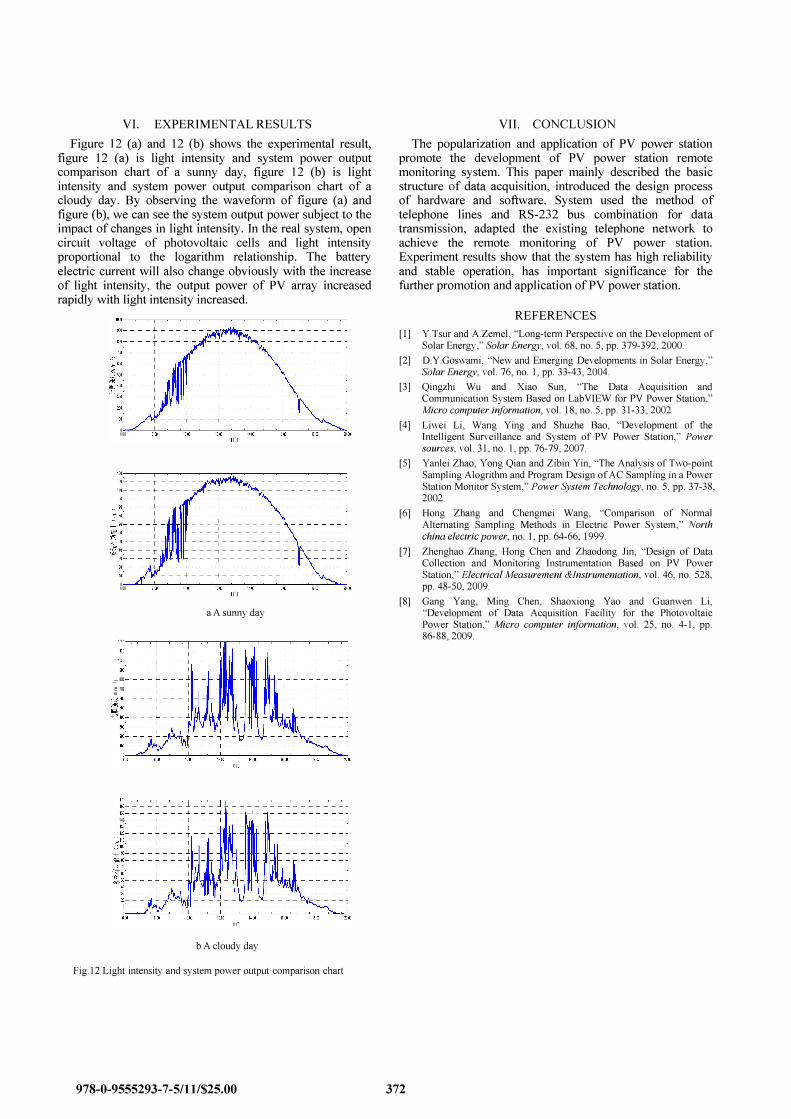
Figure 12 (a) and 12 (b) shows the experimental result, figure 12 (a) is light intensity and system power output comparison chart of a sunny day, figure 12 (b) is light intensity and system power output comparison chart of a cloudy day. By observing the waveform of figure (a) and figure (b), we can see the system output power subject to the impact of changes in light intensity. In the real system, open circuit voltage of photovoltaic cells and light intensity proportional to the logarithm relationship. The battery electric current will also change obviously with the increase of light intensity, the output power of PY array increased rapidly with light intensity increased.
�.oo
�.oo
";_ 800
.."'700 .
--- � --- � -------- r ---
____
1 _______ _
I ----1------------1----------- --,-------- ---- -,-------- -
--- -+ --- ---.j --------
aA sunny day
I' ,
ii<600- - -- - --- - ---
�:- - -- - --- -
"
, I
" , �
---1- --I----�---.:
'40 ----------- -,.
"
--I----f-------- - --I----r-----:
-- 1----1----:: -- 1---- 1-----
b A cloudy day
Fig� 12 Light intensity and system power output comparison chart
978-0-9555293-7-5/11/$25.00
VII. CONCLUSION
The popularization and application of PV power station promote the development of PY power station remote monitoring system. This paper mainly described the basic structure of data acquisition, introduced the design process of hardware and software. System used the method of telephone lines and RS-232 bus combination for data transmission, adapted the existing telephone network to achieve the remote monitoring of PV power station. Experiment results show that the system has high reliability and stable operation, has important significance for the further promotion and application ofPY power station.
REFERENCES
[1] YTsur and A.Zemel, "Long-term Perspective on the Development of Solar Energy," Solar Energy, vol. 68, no. 5, pp. 379-392,2000.
[2] D.Y.Goswami, "New and Emerging Developments in Solar Energy," Solar Energy, vol. 76, no. 1, pp. 33-43,2004.
[3] Qingzhi Wu and Xiao Sun, 'The Data Acquisition and Communication System Based on LabV1EW for PV Power Station," Micro computer information, vol. 18, no� 5, pp� 31-33,2002
[4] Liwei Li, Wang Ying and Shuzhe Bao, "Development of the Intelligent Surveillance and System of PV Power Station," Power sources, vol. 31, no. 1, pp. 76-79,2007.
[5] Yanlei Zhao, Yong Qian and Zibin Yin, "The Analysis of Two-point Sampling Alogrithm and Program Design ofAC Sampling in a Power Station Monitor System," Power System Technology, no. 5, pp. 37-38, 2002.
[6] Hong Zhang and Chengmei Wang, "Comparison of Normal Alternating Sampling Methods in Electric Power System," North china electric power, no. 1, pp. 64-66, 1999.
[7] Zhenghao Zhang, Hong Chen and Zhaodong Jin, "Design of Data Collection and Monitoring Instrumentation Based on PV Power Station," Electrical Measurement &Instrumentation, vol. 46, no. 528, pp. 48-50,2009.
[8] Gang Yang, Ming Chen, Shaoxiong Yao and Guanwen Li, "Development of Data Acquisition Facility for the Photovoltaic Power Station," Micro computer information, vol. 25, no. 4-1, pp� 86-88, 2009�
372
Related Documents