Verification Report D-S HEET P ILING Design of diaphragm and sheet pile walls

Welcome message from author
This document is posted to help you gain knowledge. Please leave a comment to let me know what you think about it! Share it to your friends and learn new things together.
Transcript

Verification Report
D-Sheet Piling
Design of diaphragm and sheet pile walls

D-SHEET PILING
Design of diaphragm and sheet pile walls
Verification Report
Version: 16.1Revision: 00
7 December 2015
D-SHEET PILING, Verification Report
Published and printed by:DeltaresBoussinesqweg 12629 HV DelftP.O. 1772600 MH DelftThe Netherlands
telephone: +31 88 335 82 73fax: +31 88 335 85 82e-mail: [email protected]: https://www.deltares.nl
For sales contact:telephone: +31 88 335 81 88fax: +31 88 335 81 11e-mail: [email protected]: http://www.deltaressystems.nl
For support contact:telephone: +31 88 335 81 00fax: +31 88 335 81 11e-mail: [email protected]: http://www.deltaressystems.nl
Copyright © 2015 DeltaresAll rights reserved. No part of this document may be reproduced in any form by print, photoprint, photo copy, microfilm or any other means, without written permission from the publisher:Deltares.

Contents
Contents
Introduction 1
1 Group 1: Benchmarks from literature (exact solution) 31.1 Load on beam on elastic foundation . . . . . . . . . . . . . . . . . . . . . . 3
1.1.1 Description . . . . . . . . . . . . . . . . . . . . . . . . . . . . . . 31.1.2 Benchmark results . . . . . . . . . . . . . . . . . . . . . . . . . . 41.1.3 D-SHEET PILING results . . . . . . . . . . . . . . . . . . . . . . . 4
1.2 Beam with a prescribed displacement . . . . . . . . . . . . . . . . . . . . . 41.2.1 Description . . . . . . . . . . . . . . . . . . . . . . . . . . . . . . 51.2.2 Benchmark results . . . . . . . . . . . . . . . . . . . . . . . . . . 51.2.3 D-SHEET PILING results . . . . . . . . . . . . . . . . . . . . . . . 6
1.3 Beam on two supports, loaded by moment . . . . . . . . . . . . . . . . . . 61.3.1 Description . . . . . . . . . . . . . . . . . . . . . . . . . . . . . . 61.3.2 Benchmark results . . . . . . . . . . . . . . . . . . . . . . . . . . 71.3.3 D-SHEET PILING results . . . . . . . . . . . . . . . . . . . . . . . 8
1.4 Beam with distributed non-uniform load . . . . . . . . . . . . . . . . . . . . 81.4.1 Description . . . . . . . . . . . . . . . . . . . . . . . . . . . . . . 81.4.2 Benchmark results . . . . . . . . . . . . . . . . . . . . . . . . . . 91.4.3 D-SHEET PILING results . . . . . . . . . . . . . . . . . . . . . . . 10
1.5 Beam loaded by tangent and normal forces . . . . . . . . . . . . . . . . . . 111.5.1 Description . . . . . . . . . . . . . . . . . . . . . . . . . . . . . . 111.5.2 Benchmark results . . . . . . . . . . . . . . . . . . . . . . . . . . 111.5.3 D-SHEET PILING results . . . . . . . . . . . . . . . . . . . . . . . 12
1.6 Beam/wall with soil displacement . . . . . . . . . . . . . . . . . . . . . . . 121.6.1 Description . . . . . . . . . . . . . . . . . . . . . . . . . . . . . . 121.6.2 Benchmark results . . . . . . . . . . . . . . . . . . . . . . . . . . 131.6.3 D-SHEET PILING results . . . . . . . . . . . . . . . . . . . . . . . 13
1.7 Load on beam/wall on elastic foundation, in stratified soil . . . . . . . . . . . 131.7.1 Description . . . . . . . . . . . . . . . . . . . . . . . . . . . . . . 131.7.2 Benchmark results . . . . . . . . . . . . . . . . . . . . . . . . . . 131.7.3 D-SHEET PILING results . . . . . . . . . . . . . . . . . . . . . . . 15
1.8 Calculation of the K-ratios for a straight slip surface . . . . . . . . . . . . . . 151.8.1 Description . . . . . . . . . . . . . . . . . . . . . . . . . . . . . . 151.8.2 Benchmark results . . . . . . . . . . . . . . . . . . . . . . . . . . 161.8.3 D-SHEET PILING results . . . . . . . . . . . . . . . . . . . . . . . 16
1.9 Calculation of the K-ratios for a curved slip surface . . . . . . . . . . . . . . 161.9.1 Description . . . . . . . . . . . . . . . . . . . . . . . . . . . . . . 171.9.2 Benchmark results . . . . . . . . . . . . . . . . . . . . . . . . . . 171.9.3 D-SHEET PILING results . . . . . . . . . . . . . . . . . . . . . . . 17
1.10 Modulus of subgrade reaction according to Ménard . . . . . . . . . . . . . . 181.10.1 Description . . . . . . . . . . . . . . . . . . . . . . . . . . . . . . 181.10.2 Benchmark results . . . . . . . . . . . . . . . . . . . . . . . . . . 181.10.3 D-SHEET PILING results . . . . . . . . . . . . . . . . . . . . . . . 19
1.11 Single pile loaded by horizontal force . . . . . . . . . . . . . . . . . . . . . 191.11.1 Description . . . . . . . . . . . . . . . . . . . . . . . . . . . . . . 191.11.2 Benchmark results . . . . . . . . . . . . . . . . . . . . . . . . . . 191.11.3 D-SHEET PILING results . . . . . . . . . . . . . . . . . . . . . . . 19
1.12 Passive earth pressure coefficient acc. to Brinch-Hansen . . . . . . . . . . . 191.12.1 Description . . . . . . . . . . . . . . . . . . . . . . . . . . . . . . 201.12.2 Benchmark results . . . . . . . . . . . . . . . . . . . . . . . . . . 201.12.3 D-SHEET PILING results . . . . . . . . . . . . . . . . . . . . . . . 21
Deltares iii

D-SHEET PILING, Verification Report
2 Group 2: Benchmarks from literature (approximate solution) 232.1 Horizontal load due to different level of water table . . . . . . . . . . . . . . 23
2.1.1 Description . . . . . . . . . . . . . . . . . . . . . . . . . . . . . . 232.1.2 Benchmark results . . . . . . . . . . . . . . . . . . . . . . . . . . 232.1.3 D-SHEET PILING results . . . . . . . . . . . . . . . . . . . . . . . 23
2.2 Fundamental solution according to Culmann . . . . . . . . . . . . . . . . . 242.2.1 Description . . . . . . . . . . . . . . . . . . . . . . . . . . . . . . 242.2.2 Benchmark results . . . . . . . . . . . . . . . . . . . . . . . . . . 242.2.3 D-SHEET PILING results . . . . . . . . . . . . . . . . . . . . . . . 24
3 Group 3: Benchmarks from spreadsheets 273.1 Anchor wall stability for a short anchorage in homogeneous soil . . . . . . . . 27
3.1.1 Description . . . . . . . . . . . . . . . . . . . . . . . . . . . . . . 273.1.2 Benchmark results . . . . . . . . . . . . . . . . . . . . . . . . . . 273.1.3 D-SHEET PILING results . . . . . . . . . . . . . . . . . . . . . . . 28
3.2 Anchor wall stability for a long anchorage in homogeneous soil . . . . . . . . 283.2.1 Description . . . . . . . . . . . . . . . . . . . . . . . . . . . . . . 293.2.2 Benchmark results . . . . . . . . . . . . . . . . . . . . . . . . . . 293.2.3 D-SHEET PILING results . . . . . . . . . . . . . . . . . . . . . . . 30
3.3 Displacement using several branches in the stress-displacement diagram . . . 303.3.1 Description . . . . . . . . . . . . . . . . . . . . . . . . . . . . . . 303.3.2 Benchmark results . . . . . . . . . . . . . . . . . . . . . . . . . . 313.3.3 D-SHEET PILING results . . . . . . . . . . . . . . . . . . . . . . . 32
3.4 Displacement during unloading/reloading steps . . . . . . . . . . . . . . . . 323.4.1 Description . . . . . . . . . . . . . . . . . . . . . . . . . . . . . . 323.4.2 Benchmark results . . . . . . . . . . . . . . . . . . . . . . . . . . 333.4.3 D-SHEET PILING results . . . . . . . . . . . . . . . . . . . . . . . 34
3.5 Functioning of anchors and struts . . . . . . . . . . . . . . . . . . . . . . . 343.5.1 Description . . . . . . . . . . . . . . . . . . . . . . . . . . . . . . 343.5.2 Benchmark results . . . . . . . . . . . . . . . . . . . . . . . . . . 343.5.3 D-SHEET PILING results . . . . . . . . . . . . . . . . . . . . . . . 35
3.6 Additional horizontal pressure due to a uniform load . . . . . . . . . . . . . . 353.6.1 Description . . . . . . . . . . . . . . . . . . . . . . . . . . . . . . 353.6.2 Benchmark results . . . . . . . . . . . . . . . . . . . . . . . . . . 353.6.3 D-SHEET PILING results . . . . . . . . . . . . . . . . . . . . . . . 36
3.7 Additional horizontal pressure due to a surcharge load . . . . . . . . . . . . 363.7.1 Description . . . . . . . . . . . . . . . . . . . . . . . . . . . . . . 363.7.2 Benchmark results . . . . . . . . . . . . . . . . . . . . . . . . . . 363.7.3 D-SHEET PILING results . . . . . . . . . . . . . . . . . . . . . . . 37
3.8 Vertical force balance . . . . . . . . . . . . . . . . . . . . . . . . . . . . . 373.8.1 Description . . . . . . . . . . . . . . . . . . . . . . . . . . . . . . 373.8.2 Benchmark results . . . . . . . . . . . . . . . . . . . . . . . . . . 383.8.3 D-SHEET PILING results . . . . . . . . . . . . . . . . . . . . . . . 39
3.9 Horizontal pressures in stratified soil with additional pore pressures . . . . . . 393.9.1 Description . . . . . . . . . . . . . . . . . . . . . . . . . . . . . . 403.9.2 Benchmark results . . . . . . . . . . . . . . . . . . . . . . . . . . 403.9.3 D-SHEET PILING results . . . . . . . . . . . . . . . . . . . . . . . 41
3.10 Flexural stiffness of a combined wall . . . . . . . . . . . . . . . . . . . . . 413.10.1 Description . . . . . . . . . . . . . . . . . . . . . . . . . . . . . . 413.10.2 Benchmark results . . . . . . . . . . . . . . . . . . . . . . . . . . 423.10.3 D-SHEET PILING results . . . . . . . . . . . . . . . . . . . . . . . 42
3.11 Interpretation of a CPT GEF file generated manually . . . . . . . . . . . . . 423.11.1 Description . . . . . . . . . . . . . . . . . . . . . . . . . . . . . . 433.11.2 Benchmark results . . . . . . . . . . . . . . . . . . . . . . . . . . 43
iv Deltares
Contents
3.11.3 D-SHEET PILING results . . . . . . . . . . . . . . . . . . . . . . . 44
4 Group 4: Benchmarks generated by D-Sheet Piling 454.1 Comparison of the c, ϕ, δ and Ka, K0, Kp methods: uniform load on lower side 45
4.1.1 Description . . . . . . . . . . . . . . . . . . . . . . . . . . . . . . 454.1.2 D-SHEET PILING results . . . . . . . . . . . . . . . . . . . . . . . 45
4.2 Comparison of the c, ϕ, δ and Ka, K0, Kp methods: uniform load on higherside . . . . . . . . . . . . . . . . . . . . . . . . . . . . . . . . . . . . . . 454.2.1 Description . . . . . . . . . . . . . . . . . . . . . . . . . . . . . . 464.2.2 D-SHEET PILING results . . . . . . . . . . . . . . . . . . . . . . . 46
4.3 Influence of the load distance to sheet pile: load of 25 kN/m2 on high side . . . 464.3.1 Description . . . . . . . . . . . . . . . . . . . . . . . . . . . . . . 464.3.2 D-SHEET PILING results . . . . . . . . . . . . . . . . . . . . . . . 47
4.4 Influence of soil against sheet pile wall for an excavation . . . . . . . . . . . 474.4.1 Description . . . . . . . . . . . . . . . . . . . . . . . . . . . . . . 474.4.2 D-SHEET PILING results . . . . . . . . . . . . . . . . . . . . . . . 48
4.5 Equilibrium of initially unequal surfaces and surcharges . . . . . . . . . . . . 484.5.1 Description . . . . . . . . . . . . . . . . . . . . . . . . . . . . . . 484.5.2 D-SHEET PILING results . . . . . . . . . . . . . . . . . . . . . . . 49
4.6 Comparison of secant and tangent modulus of subgrade reaction . . . . . . . 504.6.1 Description . . . . . . . . . . . . . . . . . . . . . . . . . . . . . . 504.6.2 D-SHEET PILING results . . . . . . . . . . . . . . . . . . . . . . . 51
4.7 Non-horizontal surface . . . . . . . . . . . . . . . . . . . . . . . . . . . . 524.7.1 Description . . . . . . . . . . . . . . . . . . . . . . . . . . . . . . 524.7.2 D-SHEET PILING results . . . . . . . . . . . . . . . . . . . . . . . 52
4.8 Symmetry of a problem . . . . . . . . . . . . . . . . . . . . . . . . . . . . 524.8.1 Description . . . . . . . . . . . . . . . . . . . . . . . . . . . . . . 534.8.2 D-SHEET PILING results . . . . . . . . . . . . . . . . . . . . . . . 53
4.9 Effect of the acting width . . . . . . . . . . . . . . . . . . . . . . . . . . . 534.9.1 Description . . . . . . . . . . . . . . . . . . . . . . . . . . . . . . 534.9.2 D-SHEET PILING results . . . . . . . . . . . . . . . . . . . . . . . 54
4.10 Effect of the shell factor . . . . . . . . . . . . . . . . . . . . . . . . . . . . 544.10.1 Description . . . . . . . . . . . . . . . . . . . . . . . . . . . . . . 544.10.2 D-SHEET PILING results . . . . . . . . . . . . . . . . . . . . . . . 55
4.11 Functioning of pre-tensioned anchors . . . . . . . . . . . . . . . . . . . . . 564.11.1 Description . . . . . . . . . . . . . . . . . . . . . . . . . . . . . . 564.11.2 D-SHEET PILING results . . . . . . . . . . . . . . . . . . . . . . . 56
4.12 Functioning of pre-compressed strut . . . . . . . . . . . . . . . . . . . . . 574.12.1 Description . . . . . . . . . . . . . . . . . . . . . . . . . . . . . . 574.12.2 D-SHEET PILING results . . . . . . . . . . . . . . . . . . . . . . . 57
4.13 Reduction of delta friction angles according to CUR 166 . . . . . . . . . . . 584.13.1 Description . . . . . . . . . . . . . . . . . . . . . . . . . . . . . . 584.13.2 D-SHEET PILING results . . . . . . . . . . . . . . . . . . . . . . . 59
4.14 Pile loaded by calculated and user-defined soil displacements . . . . . . . . 594.14.1 Description . . . . . . . . . . . . . . . . . . . . . . . . . . . . . . 594.14.2 D-SHEET PILING results (Calculated soil displacements) . . . . . . . 604.14.3 D-SHEET PILING results (User-defined soil displacements) . . . . . . 60
4.15 Loading by soil displacements – Comparison between single pile and sheetpiling . . . . . . . . . . . . . . . . . . . . . . . . . . . . . . . . . . . . . 614.15.1 Description . . . . . . . . . . . . . . . . . . . . . . . . . . . . . . 614.15.2 D-SHEET PILING results . . . . . . . . . . . . . . . . . . . . . . . 62
4.16 Automatic determination of the favorable/unfavorable effect of loads . . . . . . 624.16.1 Description . . . . . . . . . . . . . . . . . . . . . . . . . . . . . . 624.16.2 D-SHEET PILING results . . . . . . . . . . . . . . . . . . . . . . . 62
Deltares v
D-SHEET PILING, Verification Report
4.17 Verify Sheet Piling calculation acc. CUR 166 Method B (only last stage verified) 634.17.1 Description . . . . . . . . . . . . . . . . . . . . . . . . . . . . . . 634.17.2 D-SHEET PILING results (standard calculation using design input values) 664.17.3 D-SHEET PILING results (CUR 166 verification calculation using rep-
resentative input values) . . . . . . . . . . . . . . . . . . . . . . . 674.18 Verify Sheet Piling calculation acc. CUR 166 Method B (all stages verified) . . 68
4.18.1 Description . . . . . . . . . . . . . . . . . . . . . . . . . . . . . . 694.18.2 D-SHEET PILING results . . . . . . . . . . . . . . . . . . . . . . . 69
4.19 Verify Sheet Piling calculation acc. CUR 166 Method A . . . . . . . . . . . . 724.19.1 Description . . . . . . . . . . . . . . . . . . . . . . . . . . . . . . 724.19.2 D-SHEET PILING results (standard calculation using design input values) 734.19.3 D-SHEET PILING results (CUR 166 verification calculation using rep-
resentative input values) . . . . . . . . . . . . . . . . . . . . . . . 744.20 Design Sheet Piling Length acc. CUR 166 . . . . . . . . . . . . . . . . . . 76
4.20.1 Description . . . . . . . . . . . . . . . . . . . . . . . . . . . . . . 774.20.2 D-SHEET PILING results . . . . . . . . . . . . . . . . . . . . . . . 77
4.21 Verify Sheet Piling acc. Eurocode 7 – General . . . . . . . . . . . . . . . . 784.21.1 Description . . . . . . . . . . . . . . . . . . . . . . . . . . . . . . 784.21.2 D-SHEET PILING results (standard calculation using design input values) 794.21.3 D-SHEET PILING results (Eurocode verification calculation using rep-
resentative input values) . . . . . . . . . . . . . . . . . . . . . . . 804.22 Design Sheet Piling Length acc. Eurocode 7 – General . . . . . . . . . . . . 81
4.22.1 Description . . . . . . . . . . . . . . . . . . . . . . . . . . . . . . 814.22.2 D-SHEET PILING results . . . . . . . . . . . . . . . . . . . . . . . 81
4.23 Verify Sheet Piling calculation acc. Eurocode 7 - NL annex . . . . . . . . . . 824.23.1 Description . . . . . . . . . . . . . . . . . . . . . . . . . . . . . . 824.23.2 D-SHEET PILING results . . . . . . . . . . . . . . . . . . . . . . . 83
4.24 Design Sheet Piling Length acc. Eurocode 7 – NL annex . . . . . . . . . . . 884.24.1 Description . . . . . . . . . . . . . . . . . . . . . . . . . . . . . . 894.24.2 D-SHEET PILING results . . . . . . . . . . . . . . . . . . . . . . . 89
4.25 Verify Sheet Piling calculation acc. Eurocode 7 – Belgian annex and method A 904.25.1 D-SHEET PILING results (standard calculation using design input values) 914.25.2 D-SHEET PILING results (Eurocode verification calculation using rep-
resentative input values) . . . . . . . . . . . . . . . . . . . . . . . 924.26 Design Sheet Piling Length acc. Eurocode 7 – Belgian annex and method A . 93
4.26.1 Description . . . . . . . . . . . . . . . . . . . . . . . . . . . . . . 944.26.2 D-SHEET PILING results . . . . . . . . . . . . . . . . . . . . . . . 94
4.27 Verify Sheet Piling calculation acc. Eurocode 7 – Belgian annex and methodB (only last stage verified) . . . . . . . . . . . . . . . . . . . . . . . . . . . 944.27.1 Description . . . . . . . . . . . . . . . . . . . . . . . . . . . . . . 944.27.2 D-SHEET PILING results . . . . . . . . . . . . . . . . . . . . . . . 95
4.28 Design Sheet Piling Length acc. Eurocode 7 – Belgian annex and method B(only last stage verified) . . . . . . . . . . . . . . . . . . . . . . . . . . . . 964.28.1 Description . . . . . . . . . . . . . . . . . . . . . . . . . . . . . . 964.28.2 D-SHEET PILING results . . . . . . . . . . . . . . . . . . . . . . . 96
4.29 Total settlement by vibration . . . . . . . . . . . . . . . . . . . . . . . . . . 964.29.1 Description . . . . . . . . . . . . . . . . . . . . . . . . . . . . . . 964.29.2 Benchmark results . . . . . . . . . . . . . . . . . . . . . . . . . . 974.29.3 D-SHEET PILING results . . . . . . . . . . . . . . . . . . . . . . . 98
4.30 Elasto-plastic behaviour of a single pile loaded by soil displacements . . . . . 1004.30.1 Description . . . . . . . . . . . . . . . . . . . . . . . . . . . . . . 1004.30.2 D-SHEET PILING results . . . . . . . . . . . . . . . . . . . . . . . 102
4.31 Elasto-plastic behaviour of a diaphragm wall . . . . . . . . . . . . . . . . . 1064.31.1 Description . . . . . . . . . . . . . . . . . . . . . . . . . . . . . . 106
vi Deltares

Contents
4.31.2 D-SHEET PILING results . . . . . . . . . . . . . . . . . . . . . . . 1074.32 Functioning of the reduction factor on the stiffness . . . . . . . . . . . . . . 108
4.32.1 Description . . . . . . . . . . . . . . . . . . . . . . . . . . . . . . 1084.32.2 D-SHEET PILING results . . . . . . . . . . . . . . . . . . . . . . . 109
5 Group 5: Benchmarks compared with other programs 1115.1 Overall Stability . . . . . . . . . . . . . . . . . . . . . . . . . . . . . . . . 111
5.1.1 Description . . . . . . . . . . . . . . . . . . . . . . . . . . . . . . 1115.1.2 D-Geo Stability results . . . . . . . . . . . . . . . . . . . . . . . . 1115.1.3 D-SHEET PILING results . . . . . . . . . . . . . . . . . . . . . . . 112
5.2 Additional horizontal pressure due to a surcharge load . . . . . . . . . . . . 1135.2.1 Description . . . . . . . . . . . . . . . . . . . . . . . . . . . . . . 1135.2.2 D-SETTLEMENT results . . . . . . . . . . . . . . . . . . . . . . . . 1135.2.3 D-SHEET PILING results . . . . . . . . . . . . . . . . . . . . . . . 113
5.3 Horizontal displacements and stresses acc. to De Leeuw tables . . . . . . . . 1135.3.1 Description . . . . . . . . . . . . . . . . . . . . . . . . . . . . . . 1135.3.2 LEEUWIN results . . . . . . . . . . . . . . . . . . . . . . . . . . . 1145.3.3 D-SHEET PILING results . . . . . . . . . . . . . . . . . . . . . . . 115
5.4 Single pile loaded by calculated soil displacements . . . . . . . . . . . . . . 1165.4.1 Description . . . . . . . . . . . . . . . . . . . . . . . . . . . . . . 1165.4.2 MHORPILE results . . . . . . . . . . . . . . . . . . . . . . . . . . 1175.4.3 D-SHEET PILING results . . . . . . . . . . . . . . . . . . . . . . . 117
5.5 Single pile loaded by horizontal load . . . . . . . . . . . . . . . . . . . . . 1185.5.1 Description . . . . . . . . . . . . . . . . . . . . . . . . . . . . . . 1185.5.2 MHORPILE results . . . . . . . . . . . . . . . . . . . . . . . . . . 1195.5.3 D-SHEET PILING results . . . . . . . . . . . . . . . . . . . . . . . 119
5.6 Settlement by vibration in homogeneous and saturated subsoil . . . . . . . . 1195.6.1 Description . . . . . . . . . . . . . . . . . . . . . . . . . . . . . . 1205.6.2 TRILDENS3 results . . . . . . . . . . . . . . . . . . . . . . . . . . 1215.6.3 D-SHEET PILING results . . . . . . . . . . . . . . . . . . . . . . . 123
5.7 Settlement by vibration in homogeneous and unsaturated subsoil . . . . . . . 1255.7.1 Description . . . . . . . . . . . . . . . . . . . . . . . . . . . . . . 1255.7.2 TRILDENS3 results . . . . . . . . . . . . . . . . . . . . . . . . . . 1265.7.3 D-SHEET PILING results . . . . . . . . . . . . . . . . . . . . . . . 127
5.8 Settlement by vibration in layered subsoil . . . . . . . . . . . . . . . . . . . 1285.8.1 Description . . . . . . . . . . . . . . . . . . . . . . . . . . . . . . 1285.8.2 TRILDENS3 results . . . . . . . . . . . . . . . . . . . . . . . . . . 1295.8.3 D-SHEET PILING results . . . . . . . . . . . . . . . . . . . . . . . 130
Bibliography 133
Deltares vii

D-SHEET PILING, Verification Report
viii Deltares

List of Figures
List of Figures
1.1 Beam loaded by a force in the middle (bm1-1) . . . . . . . . . . . . . . . . . 31.2 Beam with displacement of one end (bm1-2) . . . . . . . . . . . . . . . . . 51.3 Beam with two supports loaded by a moment (bm1-3) . . . . . . . . . . . . . 61.4 Analytical solution supports (bm1-3) . . . . . . . . . . . . . . . . . . . . . 71.5 Analytical solution displacements (bm1-3) . . . . . . . . . . . . . . . . . . . 71.6 Beam with distributed non- uniform load . . . . . . . . . . . . . . . . . . . . 81.7 Beam loaded by a tangent force and a normal force (bm1-5) . . . . . . . . . 111.8 Beam with prescribed displacement . . . . . . . . . . . . . . . . . . . . . . 121.9 Beam in stratified soil . . . . . . . . . . . . . . . . . . . . . . . . . . . . . 13
2.1 Changing water levels (benchmark bm2-1) . . . . . . . . . . . . . . . . . . 232.2 The force against the wall is calculated graphically . . . . . . . . . . . . . . 24
3.1 Short anchor (bm3-1) . . . . . . . . . . . . . . . . . . . . . . . . . . . . . 273.2 Long anchor (bm3-2) . . . . . . . . . . . . . . . . . . . . . . . . . . . . . 293.3 Application of horizontal line loads for the four stages . . . . . . . . . . . . . 303.4 Stress-displacement diagram . . . . . . . . . . . . . . . . . . . . . . . . . 313.5 Loads applied in each stage . . . . . . . . . . . . . . . . . . . . . . . . . 323.6 Stress-displacement diagram for unloading . . . . . . . . . . . . . . . . . . 333.7 Position of the anchor . . . . . . . . . . . . . . . . . . . . . . . . . . . . . 343.8 Uniform distribution of the load . . . . . . . . . . . . . . . . . . . . . . . . 353.9 Triangular distribution of the surcharge load . . . . . . . . . . . . . . . . . . 363.10 Forces equilibrium in benchmark 3-8 . . . . . . . . . . . . . . . . . . . . . 383.11 Stratified soil with additional pore pressures (bm3-9) . . . . . . . . . . . . . 403.12 Combined wall . . . . . . . . . . . . . . . . . . . . . . . . . . . . . . . . 423.13 D-Sheet Piling results: Soil Profiles window after interpretation of CPT-GEF
file “bm3-11a” with CUR rule . . . . . . . . . . . . . . . . . . . . . . . . . 443.14 D-Sheet Piling results: Soil Profiles window after interpretation of CPT-GEF
file “bm3-11b” with NEN (Stress dependent) rule . . . . . . . . . . . . . . . 44
4.1 Geometry of bm4-1 . . . . . . . . . . . . . . . . . . . . . . . . . . . . . . 454.2 Geometry for bm4-2 . . . . . . . . . . . . . . . . . . . . . . . . . . . . . 464.3 Geometry for bm4-3 . . . . . . . . . . . . . . . . . . . . . . . . . . . . . 474.4 Schematization of the three situations of bm4-4 . . . . . . . . . . . . . . . . 484.5 Loading during phases 1, 2 and 3 . . . . . . . . . . . . . . . . . . . . . . . 494.6 Stress-displacement diagram with three branches according to CUR 166 and
D-Sheet Piling Classic . . . . . . . . . . . . . . . . . . . . . . . . . . . . 504.7 Non-horizontal soil surface modeled as a horizontal surface with an additional
trapezoidal surcharge . . . . . . . . . . . . . . . . . . . . . . . . . . . . . 524.8 Symmetry of the problem . . . . . . . . . . . . . . . . . . . . . . . . . . . 534.9 Anchor with pre-tensioning . . . . . . . . . . . . . . . . . . . . . . . . . . 564.10 Geometry overview (bm4-14) . . . . . . . . . . . . . . . . . . . . . . . . . 594.11 Stages overview (bm4-17) . . . . . . . . . . . . . . . . . . . . . . . . . . 644.12 Partial safety factors and geometry variations (bm4-17) . . . . . . . . . . . . 664.13 Partial safety factors and geometry variations for the different design approaches
(bm4-21) . . . . . . . . . . . . . . . . . . . . . . . . . . . . . . . . . . . 794.14 Partial safety factors and geometry variations for the different classes of Eu-
rocode 7 with NL Annex (bm4-23) . . . . . . . . . . . . . . . . . . . . . . . 834.15 Partial safety factors and geometry variations for the different design approaches
(bm4-25) . . . . . . . . . . . . . . . . . . . . . . . . . . . . . . . . . . . 904.16 Geometry of bm4-30 . . . . . . . . . . . . . . . . . . . . . . . . . . . . . 1014.17 M-N-Kappa diagrams of both sections of bm4-30 . . . . . . . . . . . . . . . 1014.18 Comparison of the results of benchmarks bm4-30a, bm4-30b and bm4-30e . . 102
Deltares ix
D-SHEET PILING, Verification Report
4.19 Comparison of the results of benchmarks bm4-30a and bm4-30c . . . . . . . 1054.20 Comparison of the results of benchmarks bm4-30a and bm4-30d . . . . . . . 1064.21 Geometry of bm4-31 . . . . . . . . . . . . . . . . . . . . . . . . . . . . . 1064.22 Comparison of the results of benchmarks bm4-31a, bm4-31b and bm4-31e . . 1074.23 Comparison of the results of benchmarks bm4-31a, bm4-31b and bm4-31c . . 1084.24 Comparison of the results of benchmarks bm4-31a and bm4-31d . . . . . . . 108
5.1 todo . . . . . . . . . . . . . . . . . . . . . . . . . . . . . . . . . . . . . 1115.2 Partial factors for Overall Stability . . . . . . . . . . . . . . . . . . . . . . . 1115.3 Geometry overview (bm5-3) . . . . . . . . . . . . . . . . . . . . . . . . . . 1145.4 Horizontal displacements and stresses acc. to LEEUWIN program . . . . . . 1155.5 Geometry overview (bm5-4) . . . . . . . . . . . . . . . . . . . . . . . . . . 1175.6 Comparison between D-SHEET PILING and MHORPILE results for both cases 1185.7 Horizontal load on pile (bm5-5) . . . . . . . . . . . . . . . . . . . . . . . . 1185.8 Geometry of the reference case (case A) . . . . . . . . . . . . . . . . . . . 1205.9 Geometry of cases B and C . . . . . . . . . . . . . . . . . . . . . . . . . . 1205.10 Geometry of case D . . . . . . . . . . . . . . . . . . . . . . . . . . . . . 1215.11 Geometry of case E for both stages . . . . . . . . . . . . . . . . . . . . . . 1215.12 Input data’s in TRILDENS for benchmark 5-6 . . . . . . . . . . . . . . . . . 1225.13 longtable results of TRILDENS3 for benchmark 5-6 . . . . . . . . . . . . . . 1225.14 Comparison of TRILDENS3 and D-SHEET PILING for benchmark 5-6, Settle-
ments during installation of the sheet piling . . . . . . . . . . . . . . . . . . 1235.15 Geometry of benchmark 5-7 (homogeneous unsaturated subsoil) . . . . . . . 1265.16 Input data’s in TRILDENS for benchmark 5-7 . . . . . . . . . . . . . . . . . 1265.17 longtable results of TRILDENS3 for benchmark 5-7 . . . . . . . . . . . . . . 1275.18 Comparison of TRILDENS3 and DSheet Piling for benchmark 5-7, Settle-
ments during installation of the sheet piling . . . . . . . . . . . . . . . . . . 1275.19 Geometry of benchmark 5-8 (layered sub soil) . . . . . . . . . . . . . . . . 1295.20 Input data’s in TRILDENS for benchmark 5-8 . . . . . . . . . . . . . . . . . 1295.21 longtable results of TRILDENS3 for benchmark 5-8 . . . . . . . . . . . . . . 1305.22 Comparison of TRILDENS3 and DSheet Piling for benchmark 5-8, Settle-
ments during installation of the sheet piling . . . . . . . . . . . . . . . . . . 130
x Deltares

List of Tables
List of Tables
1.1 Results of benchmark 1-1 . . . . . . . . . . . . . . . . . . . . . . . . . . . 41.2 Results of benchmark 1-2 . . . . . . . . . . . . . . . . . . . . . . . . . . . 61.3 Results of benchmark 1-3 . . . . . . . . . . . . . . . . . . . . . . . . . . . 81.4 Results of benchmark 1-4 . . . . . . . . . . . . . . . . . . . . . . . . . . . 111.5 Results of benchmark 1-5 . . . . . . . . . . . . . . . . . . . . . . . . . . . 121.6 Results of benchmark 1-6 . . . . . . . . . . . . . . . . . . . . . . . . . . . 131.8 Results of benchmark 1-7 . . . . . . . . . . . . . . . . . . . . . . . . . . . 151.9 Results of benchmark 1-8 . . . . . . . . . . . . . . . . . . . . . . . . . . . 161.10 Results of benchmark 1-9 . . . . . . . . . . . . . . . . . . . . . . . . . . . 171.12 Modulus of subgrade reaction acc. to Ménard formula . . . . . . . . . . . . . 181.13 Results of benchmark 1-10 – Modulus of subgrade reaction according to Ménard 191.14 Results of benchmark 1-11 . . . . . . . . . . . . . . . . . . . . . . . . . . 191.15 Calculation of factors Kq and Kc according to Brinch-Hansen . . . . . . . . . 211.16 Stresses according to Brinch-Hansen . . . . . . . . . . . . . . . . . . . . . 211.17 Results of benchmark 1-12 – Passive earth pressure coefficient and adapted
cohesion according to Brinch-Hansen . . . . . . . . . . . . . . . . . . . . . 21
2.1 Results of benchmark 2-1 – Water pressures for different water levels . . . . . 242.2 Results of benchmark 2-2 . . . . . . . . . . . . . . . . . . . . . . . . . . . 25
3.2 Results of benchmark 3-1 – Short anchor stability . . . . . . . . . . . . . . . 283.4 Results of benchmark 3-2 – Long anchor stability . . . . . . . . . . . . . . . 303.5 Results of benchmark 3-3 – Displacements . . . . . . . . . . . . . . . . . . 323.6 Results of benchmark 3-4 – Displacements . . . . . . . . . . . . . . . . . . 343.8 Results of benchmark 3-5a – Anchor . . . . . . . . . . . . . . . . . . . . . 353.9 Results of benchmark 3-5b – Strut . . . . . . . . . . . . . . . . . . . . . . 353.10 Results of benchmark 3-6 – Horizontal pressure along the sheet piling . . . . 363.12 Results of benchmark 3-7a – Horizontal effective stress due to triangular sur-
charge (Ka < K0 < Kp) . . . . . . . . . . . . . . . . . . . . . . . . . . 373.13 Results of benchmark 3-7b – Horizontal effective stress due to triangular sur-
charge (Kp = Ka = K0 = 1) . . . . . . . . . . . . . . . . . . . . . . . . . . 373.14 Properties of the sheet piling (benchmark 3-8) . . . . . . . . . . . . . . . . 383.15 Results of benchmark 3-8 . . . . . . . . . . . . . . . . . . . . . . . . . . . 393.16 Properties of the layers (bm3-9) . . . . . . . . . . . . . . . . . . . . . . . . 403.17 Results of benchmark 3-9 . . . . . . . . . . . . . . . . . . . . . . . . . . . 413.18 Results of benchmark 3-10 . . . . . . . . . . . . . . . . . . . . . . . . . . 423.19 CPT-GEF files – Values of the cone resistance and the friction ratio . . . . . . 433.20 Interpretation of CPT-GEF file “bm3-11a”using CUR rule . . . . . . . . . . . 433.21 Interpretation of CPT-GEF file “bm3-11b”using NEN (Stress dep.) rule . . . . 44
4.1 Results of benchmark 4-1 . . . . . . . . . . . . . . . . . . . . . . . . . . . 454.2 Results of benchmark 4-2 . . . . . . . . . . . . . . . . . . . . . . . . . . . 464.3 Results of benchmark 4-3 . . . . . . . . . . . . . . . . . . . . . . . . . . . 474.4 Results of benchmark 4-4 . . . . . . . . . . . . . . . . . . . . . . . . . . . 484.5 Results of benchmark 4-5 – Maximum displacements . . . . . . . . . . . . . 504.6 Results of benchmark 4-6 . . . . . . . . . . . . . . . . . . . . . . . . . . . 524.7 Results of benchmark 4-7 . . . . . . . . . . . . . . . . . . . . . . . . . . . 524.8 Results of benchmark 4-8 . . . . . . . . . . . . . . . . . . . . . . . . . . . 534.9 Results of benchmark 4-9 . . . . . . . . . . . . . . . . . . . . . . . . . . . 544.10 Soil properties for bm4-10a . . . . . . . . . . . . . . . . . . . . . . . . . . 554.11 Modified soil properties for bm4-10b . . . . . . . . . . . . . . . . . . . . . 554.12 Results of benchmark 4-10 . . . . . . . . . . . . . . . . . . . . . . . . . . 554.13 Results of benchmark 4-11 . . . . . . . . . . . . . . . . . . . . . . . . . . 57
Deltares xi
D-SHEET PILING, Verification Report
4.14 Results of benchmark 4-12 . . . . . . . . . . . . . . . . . . . . . . . . . . 584.15 Soil properties (bm4-13) . . . . . . . . . . . . . . . . . . . . . . . . . . . 584.16 Results of benchmark 4-13 . . . . . . . . . . . . . . . . . . . . . . . . . . 594.17 Soil properties for bm4-14a and bm4-14b using Calculated soil displacements
option . . . . . . . . . . . . . . . . . . . . . . . . . . . . . . . . . . . . . 604.18 Input values for bm4-14c using User-defined soil displacements option (= out-
put values of bm4-14a) . . . . . . . . . . . . . . . . . . . . . . . . . . . . 604.19 Input values for bm4-14d using User-defined soil displacements option (= out-
put values of bm4-14b) . . . . . . . . . . . . . . . . . . . . . . . . . . . . 614.20 Results of benchmark 4-14 . . . . . . . . . . . . . . . . . . . . . . . . . . 614.21 Results of benchmark 4-15 – Loading by soil displacements . . . . . . . . . 624.22 Results of benchmark 4-16 . . . . . . . . . . . . . . . . . . . . . . . . . . 634.23 Loads (bm4-17) . . . . . . . . . . . . . . . . . . . . . . . . . . . . . . . . 654.24 Ground and water levels (bm4-17) . . . . . . . . . . . . . . . . . . . . . . 654.25 Soil properties for all stages (bm4-17) . . . . . . . . . . . . . . . . . . . . . 654.26 Design values for loads (steps 6.1 to 6.4) . . . . . . . . . . . . . . . . . . . 664.27 Design values for soil properties in the last stage (steps 6.1 to 6.4) . . . . . . 674.28 Design values for geometric levels in the last stage (steps 6.1 to 6.4) . . . . . 674.29 Results of benchmark 4-17a – Stage 3 . . . . . . . . . . . . . . . . . . . . 684.30 Results of benchmark 4-18 – Stage 1 . . . . . . . . . . . . . . . . . . . . . 704.31 Results of benchmark 4-18 – Stage 2 . . . . . . . . . . . . . . . . . . . . . 714.32 Results of benchmark 4-18 – Stage 3 . . . . . . . . . . . . . . . . . . . . . 724.33 Design values for loads (steps 6.1 to 6.4) . . . . . . . . . . . . . . . . . . . 734.34 Design values for soil properties in the last stage (steps 6.1 to 6.4) . . . . . . 734.35 Design values for geometric levels (steps 6.1 to 6.4) . . . . . . . . . . . . . 734.36 Results of benchmark 4-19a – CUR method A, Class I, Stage 1 . . . . . . . . 744.37 Results of benchmark 4-19a/b/c – Stage 2 . . . . . . . . . . . . . . . . . . 754.38 Results of benchmark 4-19a/b/c – Stage 3 . . . . . . . . . . . . . . . . . . 764.39 Results of benchmark 4-20 – Method A, stage 3 . . . . . . . . . . . . . . . 774.40 Results of benchmark 4-20 – Method B . . . . . . . . . . . . . . . . . . . . 784.41 Design values for loads (bm4-21) . . . . . . . . . . . . . . . . . . . . . . . 794.42 Design values for soil parameters (bm4-21) . . . . . . . . . . . . . . . . . . 794.43 Design values for ground level at both sides (bm4-21) . . . . . . . . . . . . . 804.44 Results of benchmark 4-21a/c – Design approach with partial factors on effect
of loads . . . . . . . . . . . . . . . . . . . . . . . . . . . . . . . . . . . . 804.45 Results of benchmark 4-21b/d – Design approach with partial factors on loads 814.46 Results of benchmark 4-22 – Stage 3 . . . . . . . . . . . . . . . . . . . . . 824.47 Verification calculations performed for benchmark 4-23 . . . . . . . . . . . . 834.48 Results of benchmark 4-23a/b/c – Method A . . . . . . . . . . . . . . . . . 844.49 Results of benchmark 4-23d – Method B (only stage 1 verified) . . . . . . . . 854.50 Results of benchmark 4-23e– Method B (only stage 2 verified) . . . . . . . . 864.51 Results of benchmark 4-23f – Method B (only stage 3 verified) . . . . . . . . 874.52 Results of benchmark 4-23g – Method B (All stages verified) . . . . . . . . . 884.53 Results of benchmark 4-24 – Method A . . . . . . . . . . . . . . . . . . . . 894.54 Results of benchmark 4-24 – Method B . . . . . . . . . . . . . . . . . . . . 894.55 Design values for loads for set 1 (bm4-25c) . . . . . . . . . . . . . . . . . . 914.56 Design values for loads for set 2 (bm4-25d) . . . . . . . . . . . . . . . . . . 914.57 Design values for soil parameters (bm4-25) . . . . . . . . . . . . . . . . . . 914.58 Design values for ground level at both sides (bm4-25) . . . . . . . . . . . . . 924.59 Results of benchmark 4-25a – EC7-B method A, set 1 . . . . . . . . . . . . 924.60 Results of benchmark 4-25b – EC7-B method A, set 2 . . . . . . . . . . . . 934.61 Results of benchmark 4-25b – EC7-B method A, set 2 . . . . . . . . . . . . 934.62 Results of benchmark 4-26 – EC7-B method A, stage 3 . . . . . . . . . . . . 944.63 Results of benchmark 4-27a – EC7-B method B (only last stage verified), set 1 95
xii Deltares
List of Tables
4.64 Results of benchmark 4-27b – EC7-B method B (only last stage verified), set 2 954.65 Results of benchmark 4-27b – EC7-B method B (only last stage verified), De-
formation . . . . . . . . . . . . . . . . . . . . . . . . . . . . . . . . . . . 954.66 Results of benchmark 4-28 – EC7-B method B, stage 3 . . . . . . . . . . . . 964.67 Total settlements during removal of sheet piling deduced from the settlements
during installation calculated with D-SHEET PILING . . . . . . . . . . . . . . 974.68 Total settlements during removal of sheet piling deduced from the settlements
during installation calculated with D-SHEET PILING . . . . . . . . . . . . . . 984.69 Results of benchmark 4-25 – Total settlements during removal . . . . . . . . 994.70 Results of benchmark 4-25 – Total settlements during installation and removal 1004.71 Moments calculated for benchmark 4-30a and input values of EI for bench-
mark 4-30c . . . . . . . . . . . . . . . . . . . . . . . . . . . . . . . . . . 1024.72 Results of benchmark 4-32 – Elastic Sheet Piling . . . . . . . . . . . . . . . 1094.73 Results of benchmark 4-32 – Plastic Sheet Piling . . . . . . . . . . . . . . . 109
5.1 Design values of soil properties acc. to CUR verification . . . . . . . . . . . 1115.2 Design values of soil properties acc. to Eurocode 7 verification . . . . . . . . 1125.3 D-Geo Stability results for benchmark 5-1 – Safety factor . . . . . . . . . . . 1125.4 Results of benchmark 5-1 – Safety factor . . . . . . . . . . . . . . . . . . . 1125.5 Results of benchmark 5-2 – Effective stress distribution acc. to Boussinesq . . 1135.6 Results of benchmark 5-3a – Horizontal modulus of subgrade reaction for case A1155.6 Results of benchmark 5-3a – Horizontal modulus of subgrade reaction for case A1165.7 Results of benchmark 5-3b – Horizontal modulus of subgrade reaction for case B1165.8 Results of benchmark 5-3c – Horizontal modulus of subgrade reaction for case C1165.9 Results of benchmark 5-4a – Case 1 . . . . . . . . . . . . . . . . . . . . . 1175.10 Results of benchmark 5-4b – Case 2 . . . . . . . . . . . . . . . . . . . . . 1175.11 Soil properties for bm5-5 . . . . . . . . . . . . . . . . . . . . . . . . . . . 1195.12 Results of benchmark 5-5 – Passive earth pressure coefficients and fictive
cohesion acc. to Brinch-Hansen and modulus of subgrade reaction acc. toMénard . . . . . . . . . . . . . . . . . . . . . . . . . . . . . . . . . . . . 119
5.13 Results of benchmark 5-5 – Moments/Shear forces/Displacements . . . . . . 1195.14 Results of benchmark 5-6 – Settlements due to densification (during installation)1235.15 Results of benchmark – Settlements due to sheet pile volume (during installation)1245.16 Results of benchmark 5-6 – Total settlements (during installation) . . . . . . . 1255.17 Results of benchmark 5-7 – Settlements due to densification (during installation)1285.18 Results of benchmark 5-8 – Settlements due to densification (during installation)131
Deltares xiii

D-SHEET PILING, Verification Report
xiv Deltares

Introduction
Deltares Systems commitment to quality control and quality assurance has led them to de-velop a formal and extensive procedure to verify the correct working of all of their geotechnicalengineering tools. An extensive range of benchmark checks have been developed to checkthe correct functioning of each tool. During product development these checks are run on aregular basis to verify the improved product. These benchmark checks are provided in thefollowing sections, to allow the user to overview the checking procedure and verify for them-selves the correct functioning of D-SHEET PILING.
The benchmarks are subdivided into five separate groups as described below.
� Group 1 [chapter 1] – Benchmarks from literature (exact solution) Simple bench-marks for which an exact analytical result is available from literature.
� Group 2 [chapter 2] – Benchmarks from literature (approximate solution) More com-plex benchmarks described in literature for which an approximate solution is known.
� Group 3 [chapter 3] – Benchmarks from spread sheets Benchmarks which test pro-gram features specific to D-SHEET PILING.
� Group 4 [chapter 4] – Benchmarks generated by D-SHEET PILING Benchmarks for whichthe reference results are generated using D-SHEET PILING.
� Group 5 [chapter 5] – Benchmarks compared with other programs Benchmarks forwhich the results of D-SHEET PILING are compared with the results of other programs.
The number of benchmarks in group 1 will probably remain the same in the future. The reasonfor this is that they are very simple, using only the most basic features of the program.
The number of benchmarks in group 2 may grow in the future. The benchmarks in this chapterare well documented in literature. There are no exact solutions available for these problems,however in the literature estimated results are available. When verifying the program, theresults should be close to the results found in the literature.
The number of benchmarks in groups 3, 4 and 5 will grow as new versions of the program arereleased. These benchmarks are designed so that (new) features specific to the program canbe verified. The benchmarks are kept as simple as possible so that only one specific featureis verified from one benchmark to the next.
As much as software developers would wish they could, it is impossible to prove the correct-ness of any non-trivial program. Re-calculating all the benchmarks in this report, and makingsure the results are as they should be, proves to some degree that the program works as itshould. Nevertheless, there will always be combinations of input values that will cause theprogram to crash or to produce wrong results. Hopefully by using the verification procedurethe number of ways this can occur will be limited. The benchmarks are all described in suffi-cient detail for reproduction to be possible at any time. The information given is enough to beable to make the calculation. The input files can be found on CD-ROM or can be downloadedfrom our website www.deltaressystems.com.
Deltares 1 of 136

D-SHEET PILING, Verification Report
2 of 136 Deltares
1 Group 1: Benchmarks from literature (exact solution)
The different benchmarks from literature with an exact solution (group 1) are described in thefollowing paragraphs.
1.1 Load on beam on elastic foundation
1.1.1 Description
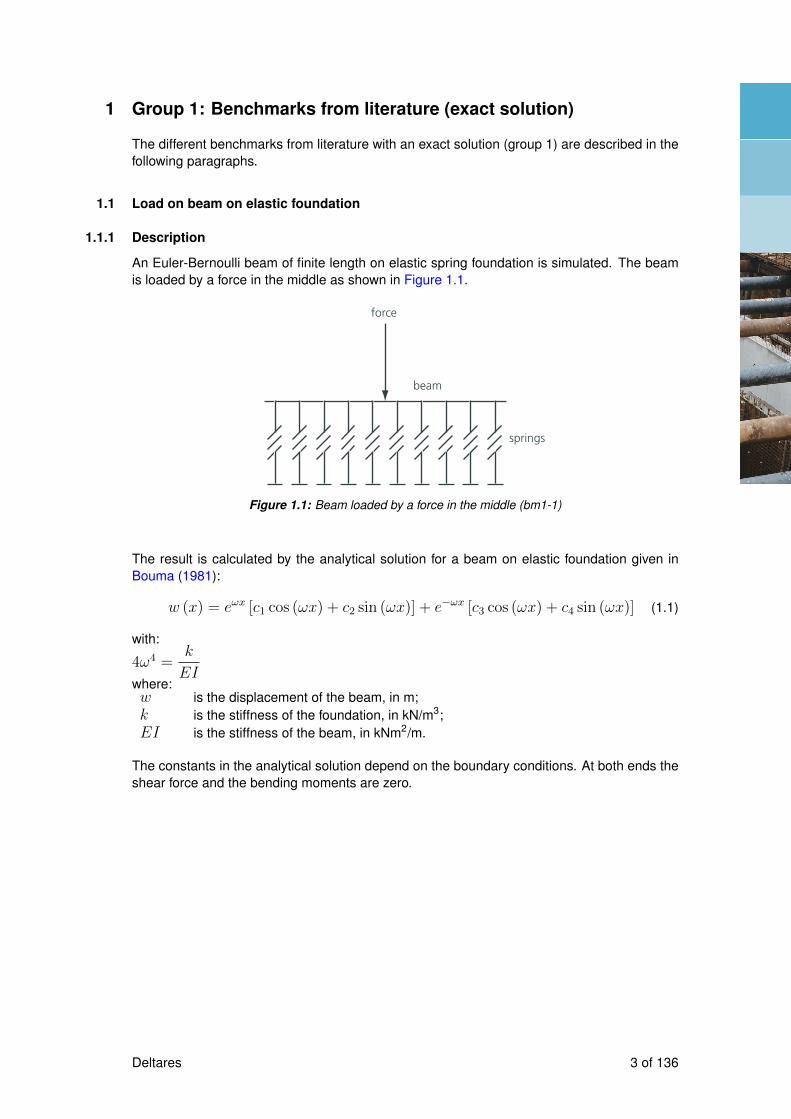
An Euler-Bernoulli beam of finite length on elastic spring foundation is simulated. The beamis loaded by a force in the middle as shown in Figure 1.1.
springs
beam
force
Figure 1.1: Beam loaded by a force in the middle (bm1-1)
The result is calculated by the analytical solution for a beam on elastic foundation given inBouma (1981):
w (x) = eωx [c1 cos (ωx) + c2 sin (ωx)] + e−ωx [c3 cos (ωx) + c4 sin (ωx)] (1.1)
with:
4ω4 =k
EIwhere:w is the displacement of the beam, in m;k is the stiffness of the foundation, in kN/m3;EI is the stiffness of the beam, in kNm2/m.
The constants in the analytical solution depend on the boundary conditions. At both ends theshear force and the bending moments are zero.
Deltares 3 of 136

D-SHEET PILING, Verification Report
1.1.2 Benchmark results
For this symmetrical problem only the right-side of the beam is considered. WithEI = 1042 kNm2/m, k = 10 kN/m3, L = 20 m and F = 10 kN/m, the constants of the generalsolution are solved from four boundary conditions as follows.
Q = −EI d3w
dx3
∣∣∣∣x=0
= −F2⇒ −2ω3 c1 + 2ω3 c2 + 2ω3 c3 + 2ω3 c4 =
F
2EI
(1.2)
dw
dx
∣∣∣∣x=0
= 0⇒ c1 + c2 − c3 + c4 = 0 (1.3)
M = −EI d2w
dx2
∣∣∣∣x=L/2
= 0 (1.4)
⇒ eωL2
[− tan
(ωL
2
)c1 + c2
]+ e
−ωL2
[tan
(ωL
2
)c3 − c4
]= 0 (1.5)
Q = −EI d3w
dx3
∣∣∣∣x=L/2
= 0 (1.6)
⇒ eωL2
[− cos
(ωL
2
)− sin
(ωL
2
)]c1 + e
ωL2
[cos
(ωL
2
)− sin
(ωL
2
)]c2
(1.7)
+ e−ωL
2
[cos
(ωL
2
)− sin
(ωL
2
)]c3 + e
−ωL2
[cos
(ωL
2
)+ sin
(ωL
2
)]c4 = 0
(1.8)
This leads to four equations with four unknowns which can be solved. The solution reads:c1 = 3.64255× 10⁻³, c2 = 1.14302× 10⁻¹, c3 = -1.69783× 10⁻³ and c4 = 1.12357× 10⁻¹.
1.1.3 D-SHEET PILING results
Modelling this problem in D-SHEET PILING is straightforward. Plasticity is avoided by a properchoice of the active and passive earth pressure coefficients.To compare D-SHEET PILING re-sults and benchmark results, the modulus of subgrade reaction of the soil in D-SHEET PILING
must be divided by a factor 2 (k = 5 kN/m3) as the soil is present on both sides of the beam.Results are compared in Table 1.1.
Table 1.1: Results of benchmark 1-1
Benchmark D-SHEET PILING Rel. error[%]
Max. displacement at x = 0 m [mm] 117.9 117.9 0.00Min.displacement at x = 10 m [mm] -30.0 -30.0 0.00Max. shear force at x = 0 m [kN] 5.0 5.0 0.00Max. bending moment at x = 0 [kNm] 11.6 11.6 0.00Min. bending moment [kNm] -0.8 -0.8 0.00
Use D-SHEET PILING input file bm1-1.shi to run this benchmark.
1.2 Beam with a prescribed displacement
4 of 136 Deltares
Group 1: Benchmarks from literature (exact solution)
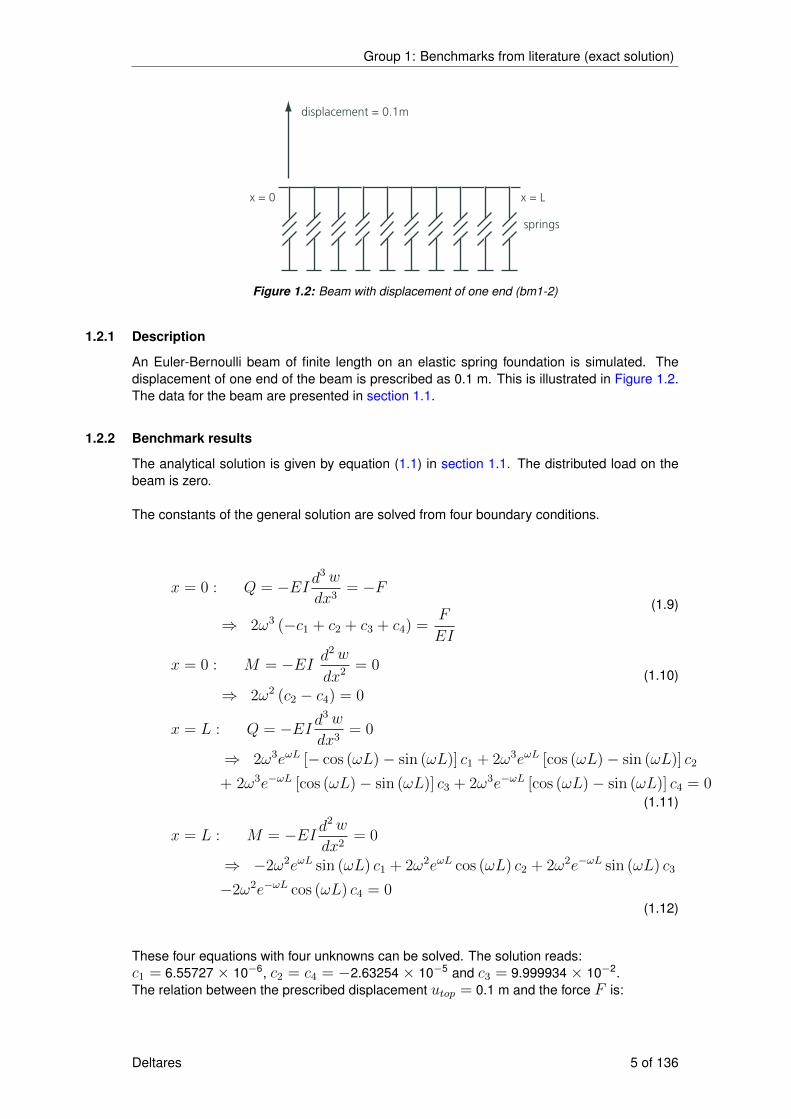
springs
x = 0 x = L
displacement = 0.1m
Figure 1.2: Beam with displacement of one end (bm1-2)
1.2.1 Description
An Euler-Bernoulli beam of finite length on an elastic spring foundation is simulated. Thedisplacement of one end of the beam is prescribed as 0.1 m. This is illustrated in Figure 1.2.The data for the beam are presented in section 1.1.
1.2.2 Benchmark results
The analytical solution is given by equation (1.1) in section 1.1. The distributed load on thebeam is zero.
The constants of the general solution are solved from four boundary conditions.
x = 0 : Q = −EI d3w
dx3= −F
⇒ 2ω3 (−c1 + c2 + c3 + c4) =F
EI
(1.9)
x = 0 : M = −EI d2w
dx2 = 0
⇒ 2ω2 (c2 − c4) = 0
(1.10)
x = L : Q = −EI d3w
dx3= 0
⇒ 2ω3eωL [− cos (ωL)− sin (ωL)] c1 + 2ω3eωL [cos (ωL)− sin (ωL)] c2
+ 2ω3e−ωL [cos (ωL)− sin (ωL)] c3 + 2ω3e−ωL [cos (ωL)− sin (ωL)] c4 = 0(1.11)
x = L : M = −EI d2w
dx2= 0
⇒ −2ω2eωL sin (ωL) c1 + 2ω2eωL cos (ωL) c2 + 2ω2e−ωL sin (ωL) c3
−2ω2e−ωL cos (ωL) c4 = 0(1.12)
These four equations with four unknowns can be solved. The solution reads:c1 = 6.55727 × 10⁻⁶, c2 = c4 = −2.63254 × 10⁻⁵ and c3 = 9.999934 × 10⁻².The relation between the prescribed displacement utop = 0.1 m and the force F is:
Deltares 5 of 136
D-SHEET PILING, Verification Report
F = utop2EIω3
[1− 4e2ωL + e4ωL + 2e2ωL cos (2ωL)
]1− e4ωL + 2e2ωL sin (2ωL)
= 2.2577 kN (1.13)
1.2.3 D-SHEET PILING results
In D-SHEET PILING, the active and passive earth pressure coefficients are chosen properlyin order to avoid plasticity. To compare D-SHEET PILING results and benchmark results, themodulus of subgrade reaction of the soil in D-SHEET PILING must be divided by a factor 2(k = 5 kN/m3) as the soil is present on both sides of the beam. Results are compared inTable 1.2.
Table 1.2: Results of benchmark 1-2
Benchmark D-SHEET PILING Relative error[%]
Maximum displacement [mm] 100 100 0.00Minimum displacement [mm] -6.9 -6.9 0.00Maximum shear force [kN] 0.5 0.5 0.00Minimum shear force [kN] -2.3 -2.2 4.54Maximum moment [kNm] 0.0 0.0 0.00Minimum moment [kNm] -3.3 -3.3 0.00
Use D-SHEET PILING input file bm1-2.shi to run this benchmark.
1.3 Beam on two supports, loaded by moment
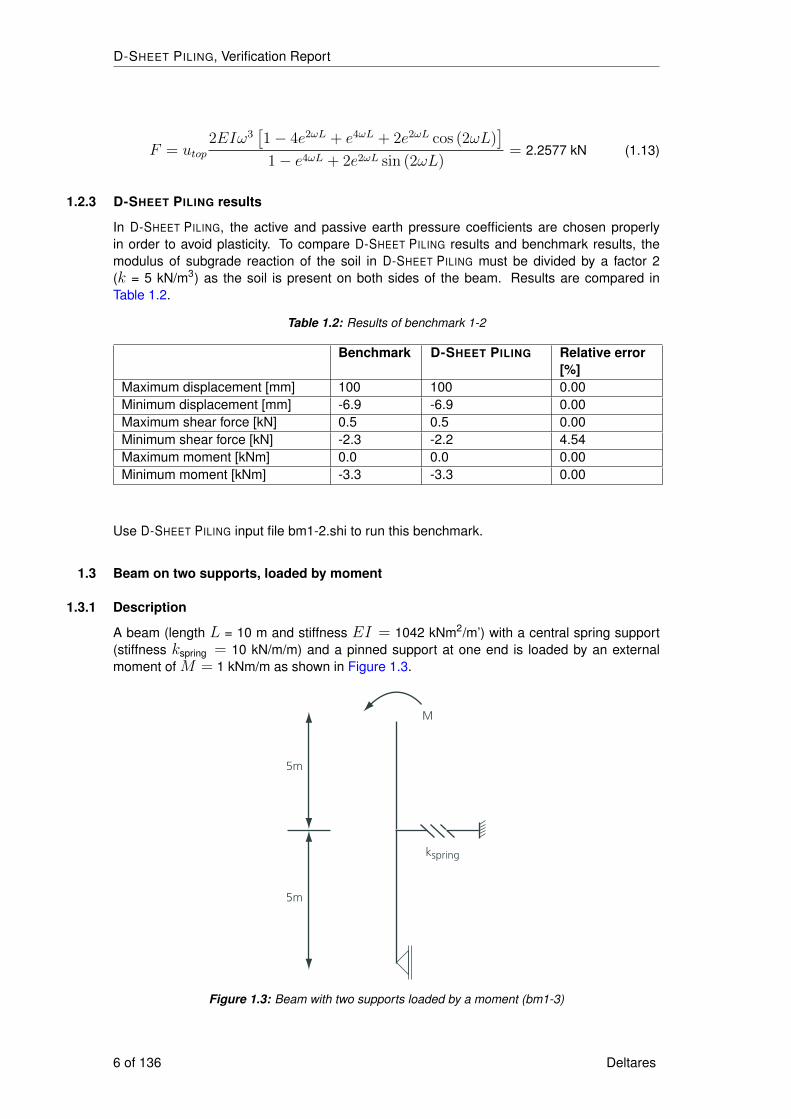
1.3.1 Description
A beam (length L = 10 m and stiffness EI = 1042 kNm2/m’) with a central spring support(stiffness kspring = 10 kN/m/m) and a pinned support at one end is loaded by an externalmoment of M = 1 kNm/m as shown in Figure 1.3.
M
kspring
5m
5m
Figure 1.3: Beam with two supports loaded by a moment (bm1-3)
6 of 136 Deltares
Group 1: Benchmarks from literature (exact solution)
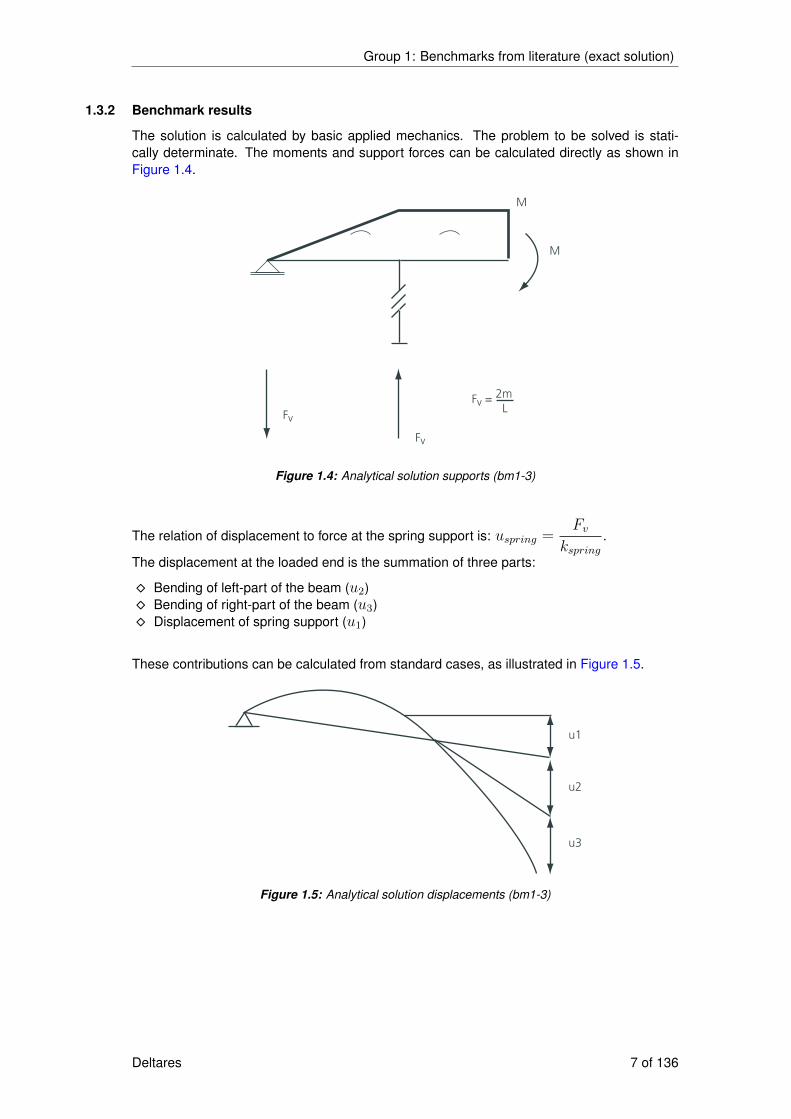
1.3.2 Benchmark results
The solution is calculated by basic applied mechanics. The problem to be solved is stati-cally determinate. The moments and support forces can be calculated directly as shown inFigure 1.4.
Fv = 2m
L
M
M
Fv
Fv
Figure 1.4: Analytical solution supports (bm1-3)
The relation of displacement to force at the spring support is: uspring =Fv
kspring.
The displacement at the loaded end is the summation of three parts:
� Bending of left-part of the beam (u2)� Bending of right-part of the beam (u3)� Displacement of spring support (u1)
These contributions can be calculated from standard cases, as illustrated in Figure 1.5.
u1
u2
u3
Figure 1.5: Analytical solution displacements (bm1-3)
Deltares 7 of 136
D-SHEET PILING, Verification Report
u1 = 2× uspring =4M
kspringL= 40 mm (1.14)
u2 =1
2L× ϕspring =
1
L× 1
6
ML
EI=
1
12
ML2
EI(1.15)
u3 =1
8
ML2
EI(1.16)
utip = u1 + u2 + u3
=4M
kspringL+
2
24
ML2
EI+
3
24
ML2
EI=
4M
kspringL+
5
24
ML2
EI= 60.8 mm
(1.17)
1.3.3 D-SHEET PILING results
The modulus of subgrade reaction is chosen as its minimum value in D-SHEET PILING (k = 0.01 kN/m3).The D-SHEET PILING results and benchmark results are compared in Table 1.3.
Table 1.3: Results of benchmark 1-3
Benchmark D-SHEET PILING Error[%]
Displacement of spring at x = –5 m [mm] 20 19.7 1.52Displacement of tip at x = 0 m [mm] 60.8 59.3 2.53Maximum moment [kNm] 1.0 1.0 0.00
Use D-SHEET PILING input file bm1-3.shi to run this benchmark.
1.4 Beam with distributed non-uniform load
1.4.1 Description
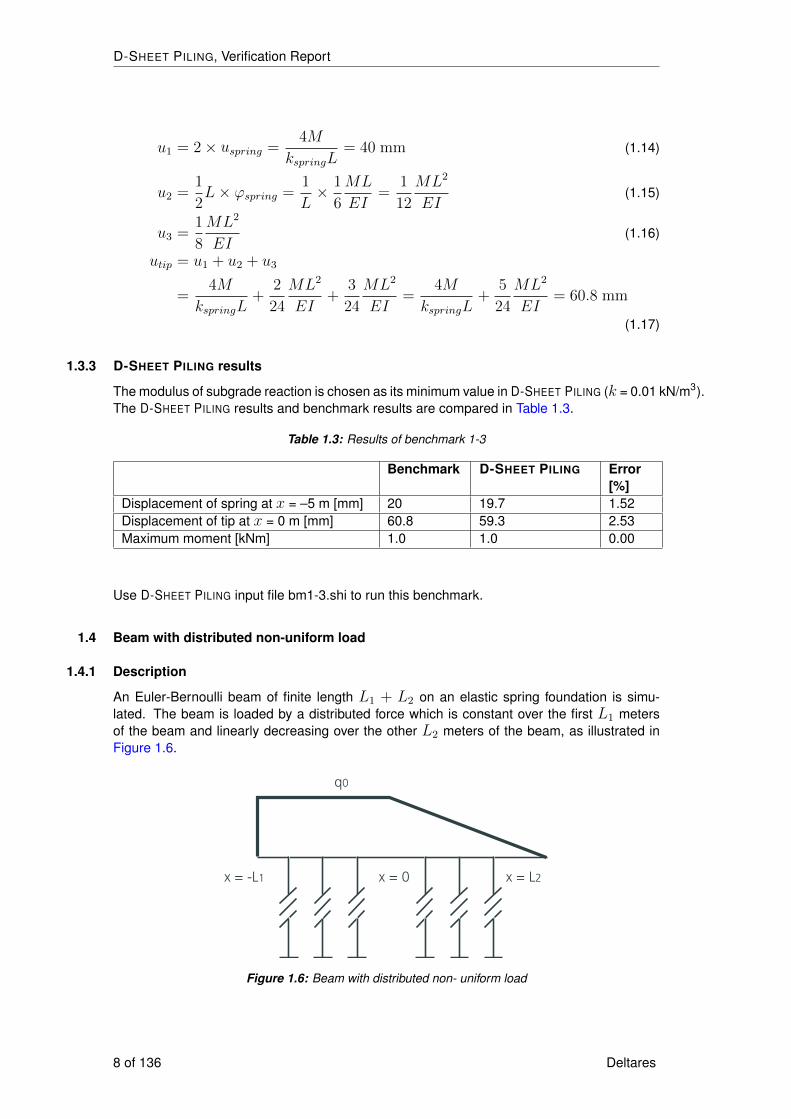
An Euler-Bernoulli beam of finite length L1 + L2 on an elastic spring foundation is simu-lated. The beam is loaded by a distributed force which is constant over the first L1 metersof the beam and linearly decreasing over the other L2 meters of the beam, as illustrated inFigure 1.6.
q0
x = -L1 x = 0 x = L2
Figure 1.6: Beam with distributed non- uniform load
8 of 136 Deltares

Group 1: Benchmarks from literature (exact solution)
The solution for both parts (x≤ 0 and x≥ 0) must be calculated. According to Bouma (1981):For −L1 < x ≤ 0 :
w(x) = eωx [c1 cos (ωx) + c2 sin (ωx)]+e−ωx [c3 cos (ωx) + c4 sin (ωx)]−q0
k(1.18)
For 0 ≤ x ≤ L2:
w(x) = eωx [c5 cos (ωx) + c6 sin (ωx)]+e−ωx [c7 cos (ωx) + c8 sin (ωx)]−q0
k
(1− x
L2
)(1.19)
The constants c1 to c4 refer to the part of the beam for which x ≤ 0. The constants c5 to c8
refer to the part of the beam for which x ≥ 0. The values of these constants can be foundfrom the boundary conditions at x = L1 and x = L2 and the required continuity at x = 0.
1.4.2 Benchmark results
The result is calculated using the analytical solution for a beam on elastic foundation withlength L1 + L2. The parameters are assigned the following values:EI =1042 kNm2/mk = 100 kN/m3
L1= 10 mL2= 2 mq0 = 20 kN/m.
Deltares 9 of 136
D-SHEET PILING, Verification Report
Therefore:
x = −L1 : Q = −EI d3w
dx3= 0
⇒ e−βL1 [− cos(βL1) + sin(βL1)]c1 + e−βL1 [cos(βL1) + sin(βL1)]c2
+eβL1 [cos(βL1) + sin(βL1)]c3 − eβL1 [− cos(βL1) + sin(βL1)]c4 = 0(1.20)
x = −L1 : M = −EI d2w
dx2= 0
⇒ e−βL1 sin(βL1)c1 + e−βL1 cos(βL1)c2 − eβL1 sin(βL1)c3
−eβL1 cos(βL1)c4 = 0
(1.21)
x = 0 : w(0−) = w(0+)
⇒ c1 + c3 −q0
k= c5 + c7 −
q0
k
(1.22)
x = 0 :dw
dx(0−) =
dw
dx(0+)
⇒ β(c1 + c2 − c3 + c4) = β(c5 + c6 − c7 + c8) +q0
kL2
(1.23)
x = L2 : Q = −EI d3w
dx3= 0
⇒ eβL2 [− cos(βL2)− sin(βL2)]c5 + eβL2 [cos(βL2)− sin(βL2)]c6
−e−βL2 [− cos(βL2) + sin(βL2)]c7 + e−βL2 [cos(βL2) + sin(βL2)]c8 = 0(1.24)
x = L2 : M = −EI d2w
dx2= 0
⇒ −eβL2 sin(βL2)c5 + eβL2 cos(βL2)c6 + e−βL2 sin(βL2)c7
−e−βL2 cos(βL2)c8 = 0
(1.25)
x = 0 : −EI d2w
dx2(0−) = −EI d
2w
dx2(0+)
⇒ c2 − c4 = c6 − c8
(1.26)
x = 0 : −EI d3w
dx3(0−) = −EI d
3w
dx3(0+)
⇒ −c1 + c2 + c3 + c4 = −c5 + c6 + c7 + c8
(1.27)
The constants are therefore:c1 = 5.04161× 10⁻² c2 = 2.40163× 10⁻²
c3 = −9.00103 × 10⁻⁶ c4 = 3.78931× 10⁻⁵
c5 = −1.311056× 10⁻² c6 = − 3.95054 × 10⁻²
c7 = 6.35127 × 10⁻² c8 = − 6.34938 × 10⁻²
1.4.3 D-SHEET PILING results
The distributed load is introduced by lowering the water table by 2 m. This leads to a value ofq0 = 20 kN/m2. To compare D-SHEET PILING results and benchmark results, the modulus of
10 of 136 Deltares

Group 1: Benchmarks from literature (exact solution)
subgrade reaction of the soil in D-SHEET PILING must be divided by a factor 2 (k = 50 kN/m3) asthe soil is present on both sides of the beam. The D-SHEET PILING results and the benchmarkresults are compared in Table 1.4.
Table 1.4: Results of benchmark 1-4
Benchmark D-SHEET PILING Relative error[%]
Maximum displacement [mm] 206.1 206.1 0.00Displacement at the top [mm] 81.9 81.9 0.00Displacement at the bottom [mm] 198.6 198.6 0.00Minimum moment [kNm] -9.05 -9.0 0.55Maximum moment [kNm] 0.1 0.1 0.00Minimum shear force [kN] -5.2 -5.2 0.00Maximum shear force [kN] 2.3 2.3 0.00
Use D-SHEET PILING input file bm1-4.shi to run this benchmark.
1.5 Beam loaded by tangent and normal forces
1.5.1 Description
A beam of length L = 20 m is loaded by a tangent force F = 100 kN/m at x = L and a linearlyvarying normal force: Nmax = 10000 kN at x = L and Nmin = 8000 kN at x = 0 (Figure 1.7).
N(x)
Nmin
Nmax
L
F
x0
Figure 1.7: Beam loaded by a tangent force and a normal force (bm1-5)
1.5.2 Benchmark results
The solution is calculated by basic applied mechanics. The shear force is constant along thebeam (equal to F ) and the bending moment is nil, which leads to the following differentialequation:
N (x)dw
dx= F (1.28)
where w is the displacement of the beam.Therefore:
N (x) = Nmin +Nmax −Nmin
Lx (1.29)
The analytical solution is:
w (x) =FL
Nmax −Nmin
ln
(Nmin +
Nmax −Nmin
Lx
)+ c1 (1.30)
Deltares 11 of 136
D-SHEET PILING, Verification Report
The pinned support at x = 0 prevents any displacement, which leads to:
c1 = − FL
Nmax −Nmin
ln (Nmin) (1.31)
Therefore:
w (x) =FL
Nmax −Nmin
ln
(1 +
Nmax −Nmin
LNmin
x
)(1.32)
1.5.3 D-SHEET PILING results
In D-SHEET PILING, the modulus of subgrade reaction is set equal to its minimum (k = 0.01 kN/m3)in order to neglect the stiffness of the soil.
Table 1.5: Results of benchmark 1-5
Benchmark D-SHEET PILING Relative error[%]
Displacement at the bottom [mm] 0 0 0.00Displacement at the top [mm] 223.1 223.2 0.04
Use D-SHEET PILING input file bm1-5.shi to run this benchmark.
1.6 Beam/wall with soil displacement
1.6.1 Description
An Euler-Bernoulli beam of finite length on elastic spring foundation is simulated Bouma(1981). The data for the beam are presented in section 1.1. The soil displacement on oneside of the beam is prescribed as 0.1 m and a rigid support at one end of the beam preventstranslation.
prescribed soil
displacement
prescribed
beam
displacement
Figure 1.8: Beam with prescribed displacement
This problem is therefore identical to benchmark bm3-2 in section 1.2 where a beam has aprescribed displacement of 0.1 m.
12 of 136 Deltares
Group 1: Benchmarks from literature (exact solution)
1.6.2 Benchmark results
The analytical results are identical to those from section 1.2 as illustrated in Figure 1.8.
1.6.3 D-SHEET PILING results
In D-SHEET PILING, the active and passive earth pressure coefficients must be chosen properlyin order to avoid plasticity. To compare D-SHEET PILING results and benchmark results, thestiffness of the soil in D-SHEET PILING must be divided by a factor 2 (k = 5 kN/m3) as the soilis present at both side of the beam. The maximum relative variation of displacement, shearforce and moment are compared in Table 1.6.
Table 1.6: Results of benchmark 1-6
Benchmark D-SHEET PILING Relative error[%]
Displacement [mm] 100 –(– 6.9) = 106.9 106.9 – 0 = 106.9 0.00Shear force [kN] 0.5 –(–2.2) = 2.7 2.2 –(–0.5) = 2.7 0.00Moment [kNm] 0.0 –(-3.3) = 3.3 3.3 – 0.0 = 3.3 0.00
Use D-SHEET PILING input file bm1-6.shi to run this benchmark.
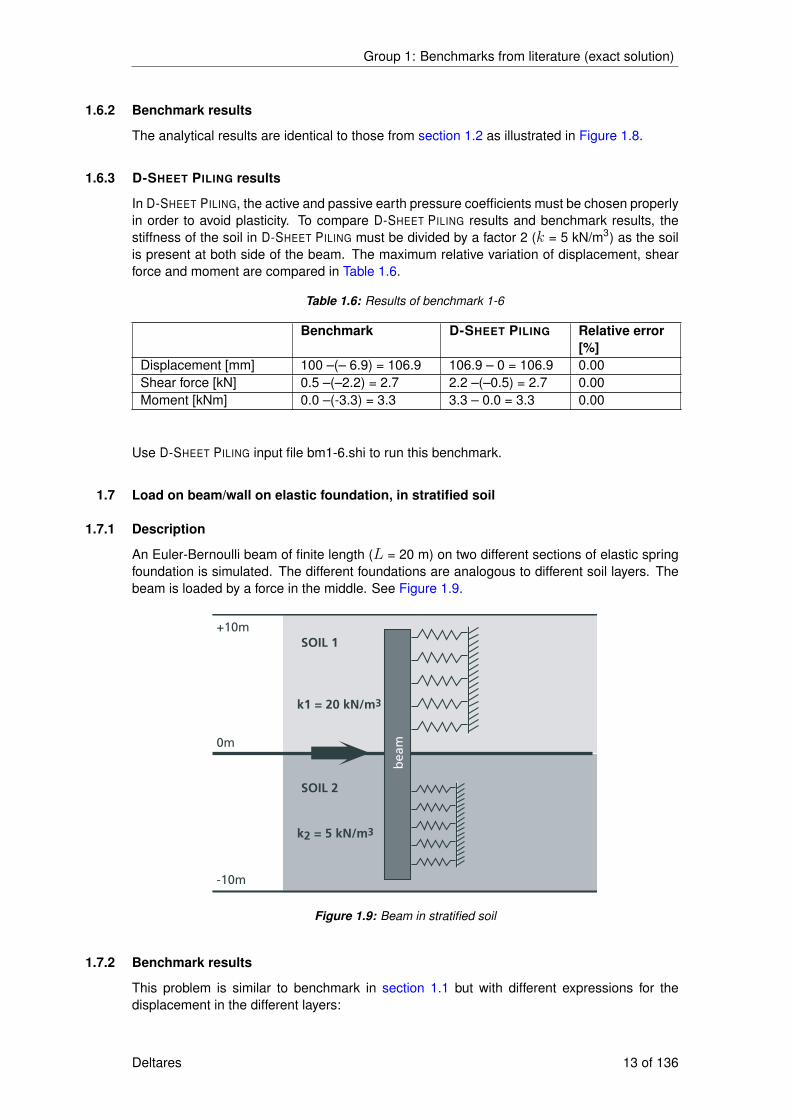
1.7 Load on beam/wall on elastic foundation, in stratified soil
1.7.1 Description
An Euler-Bernoulli beam of finite length (L = 20 m) on two different sections of elastic springfoundation is simulated. The different foundations are analogous to different soil layers. Thebeam is loaded by a force in the middle. See Figure 1.9.
be
am
SOIL 1
SOIL 2
k2 = 5 kN/m3
k1 = 20 kN/m3
+10m
0m
-10m
Figure 1.9: Beam in stratified soil
1.7.2 Benchmark results
This problem is similar to benchmark in section 1.1 but with different expressions for thedisplacement in the different layers:
Deltares 13 of 136
D-SHEET PILING, Verification Report
soil 1: w1 (x) = eω1x [c1 cos (ω1x) + c2 sin (ω1x)] + e−ω1x [c3 cos (ω1x) + c4 sin (ω1x)]
soil 2: w2 (x) = eω2x [c5 cos (ω2x) + c6 sin (ω2x)] + e−ω2x [c7 cos (ω2x) + c8 sin (ω2x)]
with:
w1 is the displacement of the beam in soil 1w2 is the displacement of the beam in soil 24ω4 = k/EIk1, k2 are the modulus of subgrade reaction of soils 1 and 2 respectivelyEI is the stiffness of the beam (1042 kNm/m)
The constants in the analytical solution depend on the boundary conditions. At both ends theshear force and the bending moments are zero. At the interface of both soils, the displacementand the moment must be continuous. Thus:
x = 0 : w1 = w2 ⇒ c1 + c3 = c5 + c7 (1.33)
x = 0 :dw1
dx=dw2
dx⇒ ω1(c1 + c2 − c3 + c4) =
ω2(c5 + c6 − c7 + c8) (1.34)
x = 0 : M = −EI d2w1
dx2 = −EI d2w2
dx2 ⇒ ω21(c2 − c4) = ω2
2(c6 − c8) (1.35)
x = 0 : Q = −EI(d3w1
dx3− d3w2
dx3) = F ⇒ ω3
1(c1 − c2 − c3 − c4)
−ω32(c5 − c6 − c7 − c8) =
F
2(1.36)
x = −1/2L : M = −EI d2w1
dx2 = 0 ⇒ cos(ω1L
2)(−c2 + c4e
ω1L)
− sin(ω1L
2)(c1 − c3e
ω1L) = 0
(1.37)
x = −1/2L : Q = −EI d3w1
dx3= 0 ⇒ cos(
ω1L
2)(−c1 + c2 + (c3 + c4)eω1L)
+ sin(ω1L
2)(c1 + c2 + (c3 − c4)eω1L)
= 0 (1.38)
x = 1/2L : M = −EI d2w2
dx2 = 0 ⇒ cos(ω2L
2)(−c8 + c6e
ω2L)
+ sin(ω2L
2)(c7 − c5e
ω2L) = 0
(1.39)
x = 1/2L : Q = −EI d3w2
dx3= 0 ⇒ cos(
ω2L
2)(c7 + c8 − (c5 − c6)eω2L)
− sin(ω2L
2)(c7 − c8 + (c5 + c6)eω2L)
= 0 (1.40)
14 of 136 Deltares
Group 1: Benchmarks from literature (exact solution)
This leads to eight equations with eight unknowns which can be solved. Solving these equa-tions gives:c1 = 1.5981 × 10⁻³ c5 = 1.0314× 10⁻¹
c2 = − 2.0442 × 10⁻¹ c6 = − 1.4514 × 10⁻¹
c3 = 1.0598 × 10⁻¹ c7 = 4.4372× 10⁻³
c4 = 7.3864 × 10⁻² c8 = 2.9949× 10⁻³
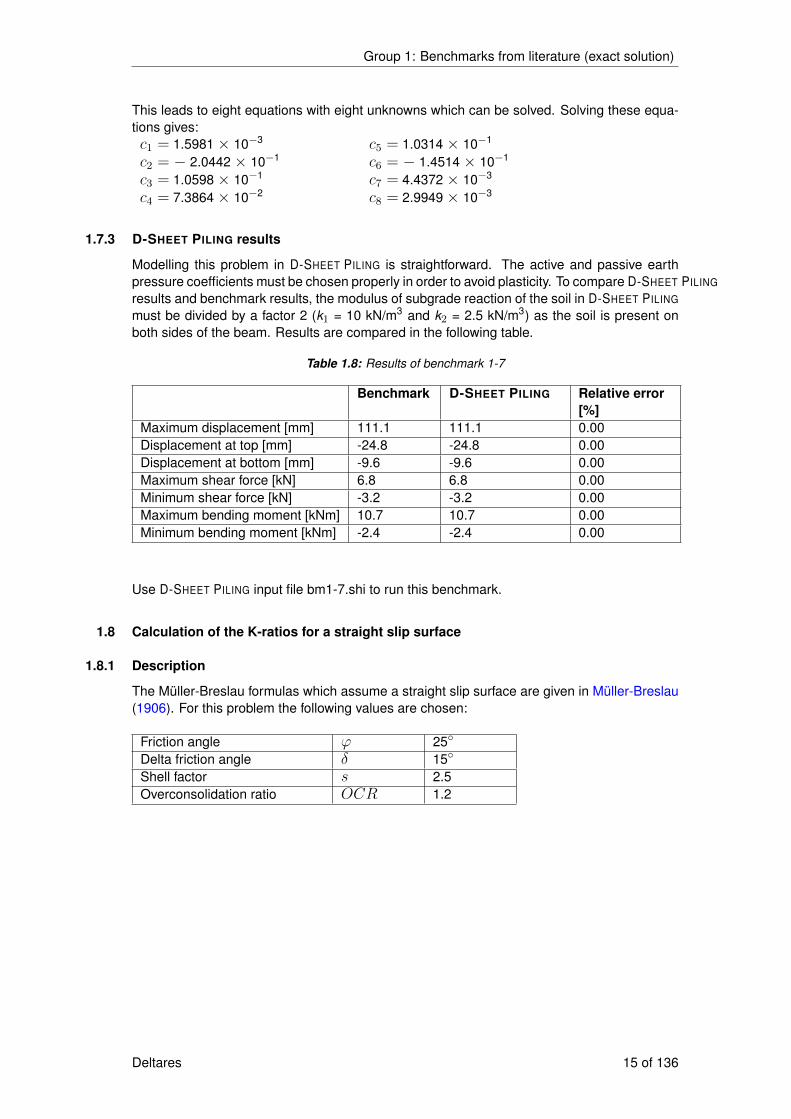
1.7.3 D-SHEET PILING results
Modelling this problem in D-SHEET PILING is straightforward. The active and passive earthpressure coefficients must be chosen properly in order to avoid plasticity. To compare D-SHEET PILING
results and benchmark results, the modulus of subgrade reaction of the soil in D-SHEET PILING
must be divided by a factor 2 (k1 = 10 kN/m3 and k2 = 2.5 kN/m3) as the soil is present onboth sides of the beam. Results are compared in the following table.
Table 1.8: Results of benchmark 1-7
Benchmark D-SHEET PILING Relative error[%]
Maximum displacement [mm] 111.1 111.1 0.00Displacement at top [mm] -24.8 -24.8 0.00Displacement at bottom [mm] -9.6 -9.6 0.00Maximum shear force [kN] 6.8 6.8 0.00Minimum shear force [kN] -3.2 -3.2 0.00Maximum bending moment [kNm] 10.7 10.7 0.00Minimum bending moment [kNm] -2.4 -2.4 0.00
Use D-SHEET PILING input file bm1-7.shi to run this benchmark.
1.8 Calculation of the K-ratios for a straight slip surface
1.8.1 Description
The Müller-Breslau formulas which assume a straight slip surface are given in Müller-Breslau(1906). For this problem the following values are chosen:
Friction angle ϕ 25◦
Delta friction angle δ 15◦
Shell factor s 2.5Overconsolidation ratio OCR 1.2
Deltares 15 of 136

D-SHEET PILING, Verification Report
1.8.2 Benchmark results
According to Müller-Breslau (1906), K-ratios are (including the arching effect):
Ka =cos2 ϕ
s
(1 +
√sinϕ sin (ϕ+ δ)
cos δ
)2 (1.41)
Kp =s× cos2 ϕ(
1−√
sinϕ sin (ϕ+ δ)
cos δ
)2 (1.42)
And the neutral earth pressure ratio K0 is:
K0 =√OCR (1− sinϕ) for coarse grain
K0 = OCRsinϕ (1− sinϕ) for fine coarse
Those three formulas lead to:
� Ka = 0.1403� Kp = 9.3086� K0 = 0.6236 for fine grain� K0 = 0.6325 for coarse grain
1.8.3 D-SHEET PILING results
In D-SHEET PILING, calculations are performed using the Ka, K0, Kp method in the Modelwindow and the Straight slip surfaces option in the Soil Materials window. The results of theD-SHEET PILING calculation and the analytical calculation are given in the following table.
Table 1.9: Results of benchmark 1-8
Earth pressurecoefficient
Grain type Benchmark D-SHEET PILING Relative error[%]
Ka [-] - 0.14 0.14 0.00Kp [-] - 9.31 9.31 0.00K0 [-] Fine 0.62 0.62 0.00
Coarse 0.63 0.63 0.00
Use D-SHEET PILING input file bm1-8.shi to run this benchmark.
1.9 Calculation of the K-ratios for a curved slip surface
16 of 136 Deltares
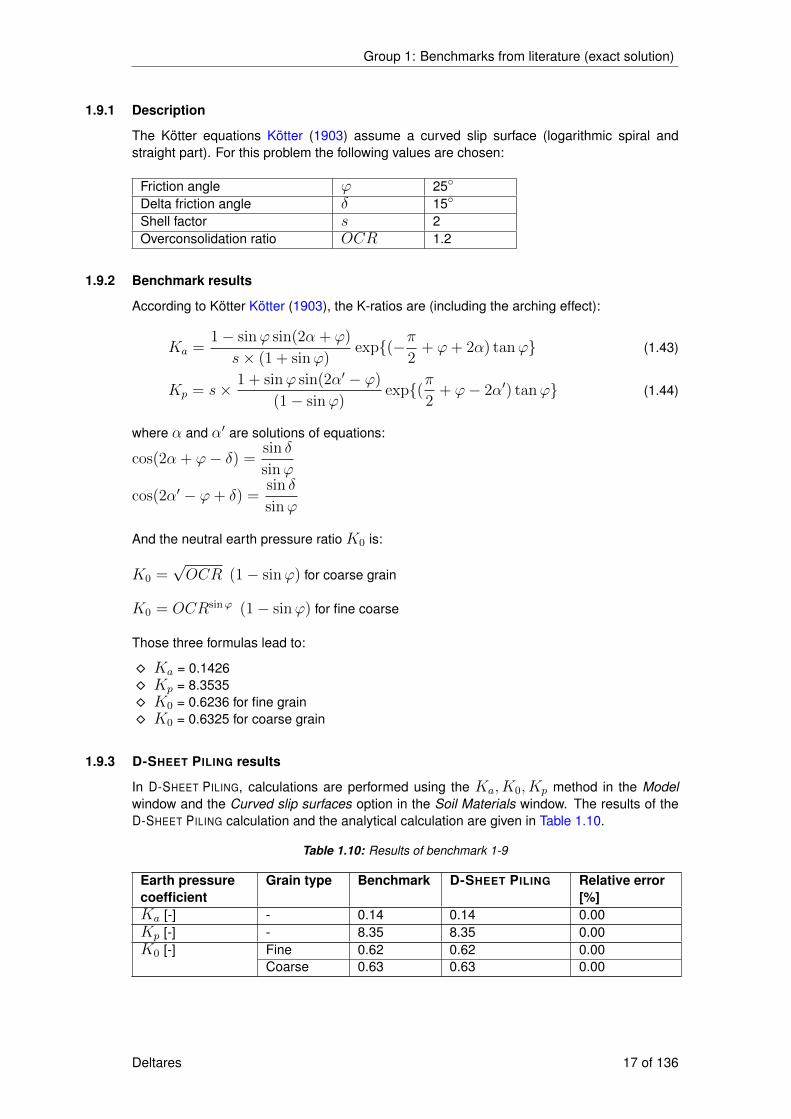
Group 1: Benchmarks from literature (exact solution)
1.9.1 Description
The Kötter equations Kötter (1903) assume a curved slip surface (logarithmic spiral andstraight part). For this problem the following values are chosen:
Friction angle ϕ 25◦
Delta friction angle δ 15◦
Shell factor s 2Overconsolidation ratio OCR 1.2
1.9.2 Benchmark results
According to Kötter Kötter (1903), the K-ratios are (including the arching effect):
Ka =1− sinϕ sin(2α + ϕ)
s× (1 + sinϕ)exp{(−π
2+ ϕ+ 2α) tanϕ} (1.43)
Kp = s× 1 + sinϕ sin(2α′ − ϕ)
(1− sinϕ)exp{(π
2+ ϕ− 2α′) tanϕ} (1.44)
where α and α′ are solutions of equations:
cos(2α + ϕ− δ) =sin δ
sinϕ
cos(2α′ − ϕ+ δ) =sin δ
sinϕ
And the neutral earth pressure ratio K0 is:
K0 =√OCR (1− sinϕ) for coarse grain
K0 = OCRsinϕ (1− sinϕ) for fine coarse
Those three formulas lead to:
� Ka = 0.1426� Kp = 8.3535� K0 = 0.6236 for fine grain� K0 = 0.6325 for coarse grain
1.9.3 D-SHEET PILING results
In D-SHEET PILING, calculations are performed using the Ka, K0, Kp method in the Modelwindow and the Curved slip surfaces option in the Soil Materials window. The results of theD-SHEET PILING calculation and the analytical calculation are given in Table 1.10.
Table 1.10: Results of benchmark 1-9
Earth pressurecoefficient
Grain type Benchmark D-SHEET PILING Relative error[%]
Ka [-] - 0.14 0.14 0.00Kp [-] - 8.35 8.35 0.00K0 [-] Fine 0.62 0.62 0.00
Coarse 0.63 0.63 0.00
Deltares 17 of 136
D-SHEET PILING, Verification Report
Use D-SHEET PILING input file bm1-9.shi to run this benchmark.
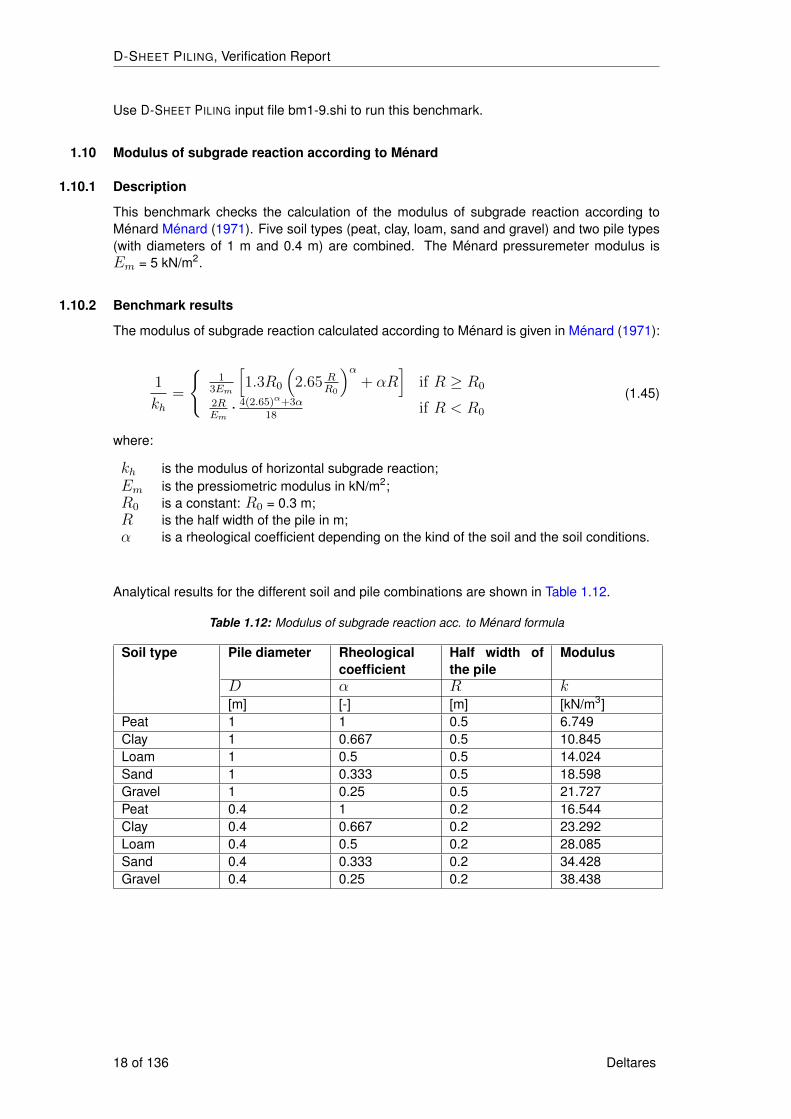
1.10 Modulus of subgrade reaction according to Ménard
1.10.1 Description
This benchmark checks the calculation of the modulus of subgrade reaction according toMénard Ménard (1971). Five soil types (peat, clay, loam, sand and gravel) and two pile types(with diameters of 1 m and 0.4 m) are combined. The Ménard pressuremeter modulus isEm = 5 kN/m2.
1.10.2 Benchmark results
The modulus of subgrade reaction calculated according to Ménard is given in Ménard (1971):
1
kh=
{1
3Em
[1.3R0
(2.65 R
R0
)α+ αR
]if R ≥ R0
2REm
· 4(2.65)α+3α18
if R < R0
(1.45)
where:
kh is the modulus of horizontal subgrade reaction;Em is the pressiometric modulus in kN/m2;R0 is a constant: R0 = 0.3 m;R is the half width of the pile in m;α is a rheological coefficient depending on the kind of the soil and the soil conditions.
Analytical results for the different soil and pile combinations are shown in Table 1.12.
Table 1.12: Modulus of subgrade reaction acc. to Ménard formula
Soil type Pile diameter Rheologicalcoefficient
Half width ofthe pile
Modulus
D α R k[m] [-] [m] [kN/m3]
Peat 1 1 0.5 6.749Clay 1 0.667 0.5 10.845Loam 1 0.5 0.5 14.024Sand 1 0.333 0.5 18.598Gravel 1 0.25 0.5 21.727Peat 0.4 1 0.2 16.544Clay 0.4 0.667 0.2 23.292Loam 0.4 0.5 0.2 28.085Sand 0.4 0.333 0.2 34.428Gravel 0.4 0.25 0.2 38.438
18 of 136 Deltares
Group 1: Benchmarks from literature (exact solution)
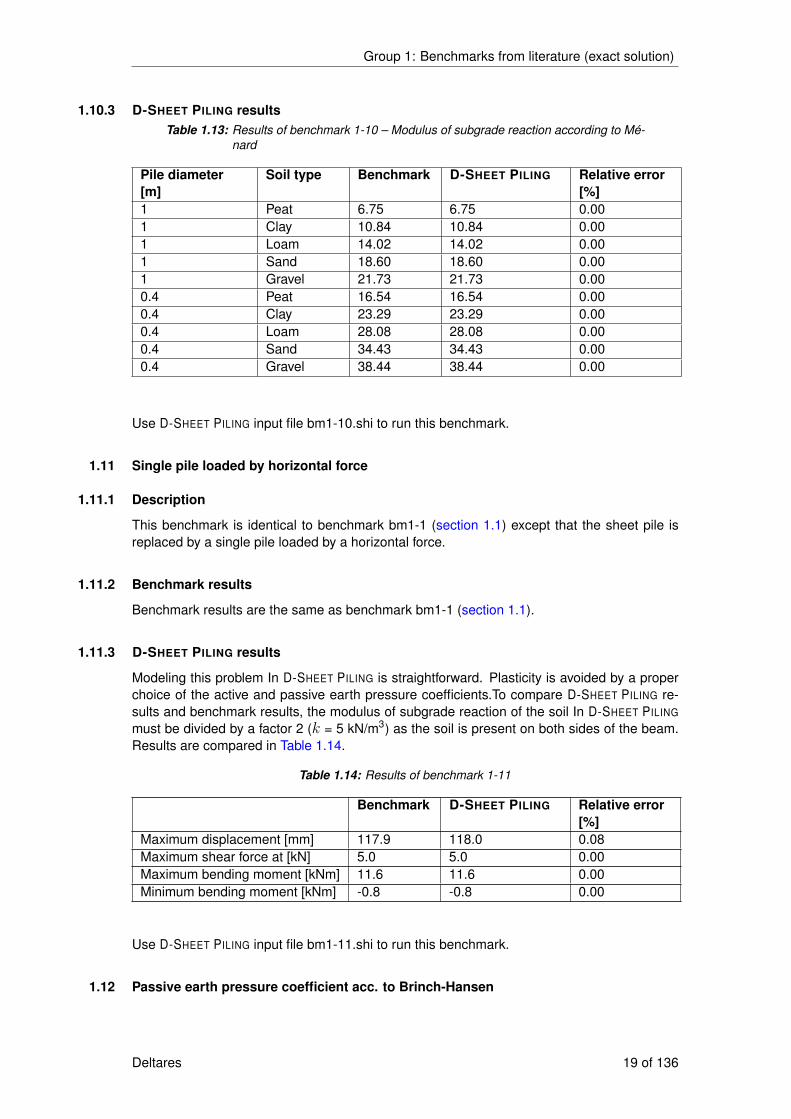
1.10.3 D-SHEET PILING resultsTable 1.13: Results of benchmark 1-10 – Modulus of subgrade reaction according to Mé-
nard
Pile diameter[m]
Soil type Benchmark D-SHEET PILING Relative error[%]
1 Peat 6.75 6.75 0.001 Clay 10.84 10.84 0.001 Loam 14.02 14.02 0.001 Sand 18.60 18.60 0.001 Gravel 21.73 21.73 0.000.4 Peat 16.54 16.54 0.000.4 Clay 23.29 23.29 0.000.4 Loam 28.08 28.08 0.000.4 Sand 34.43 34.43 0.000.4 Gravel 38.44 38.44 0.00
Use D-SHEET PILING input file bm1-10.shi to run this benchmark.
1.11 Single pile loaded by horizontal force
1.11.1 Description
This benchmark is identical to benchmark bm1-1 (section 1.1) except that the sheet pile isreplaced by a single pile loaded by a horizontal force.
1.11.2 Benchmark results
Benchmark results are the same as benchmark bm1-1 (section 1.1).
1.11.3 D-SHEET PILING results
Modeling this problem In D-SHEET PILING is straightforward. Plasticity is avoided by a properchoice of the active and passive earth pressure coefficients.To compare D-SHEET PILING re-sults and benchmark results, the modulus of subgrade reaction of the soil In D-SHEET PILING
must be divided by a factor 2 (k = 5 kN/m3) as the soil is present on both sides of the beam.Results are compared in Table 1.14.
Table 1.14: Results of benchmark 1-11
Benchmark D-SHEET PILING Relative error[%]
Maximum displacement [mm] 117.9 118.0 0.08Maximum shear force at [kN] 5.0 5.0 0.00Maximum bending moment [kNm] 11.6 11.6 0.00Minimum bending moment [kNm] -0.8 -0.8 0.00
Use D-SHEET PILING input file bm1-11.shi to run this benchmark.
1.12 Passive earth pressure coefficient acc. to Brinch-Hansen
Deltares 19 of 136
D-SHEET PILING, Verification Report
1.12.1 Description
A single pile of length L = 5 m and diameter B = 0.6 m, in stratified soil, is loaded by ahorizontal force F = 300 kN acting half way down the pile. As the pile is supposed to be rigid(stiffnessEI = 1010 kNm2), the distribution of the horizontal stresses along the pile is uniformand equal to σH = F/(L×B) = 100 kN/m2.
The passive earth pressure coefficient and the adapted cohesion are calculated according toBrinch-Hansen Brinch-Hansen and Christensen (1961).
1.12.2 Benchmark results
Factors Kq and Kc are calculated using the following equations:
Kq =K0q +K∞q × αq × D
B
1 + αq × DB
(1.46)
Kc =K0c +K∞c × αc × D
B
1 + αc × DB
(1.47)
where:
K0q = e(π
2+ϕ)×tanϕ × cosϕ× tan(
π
4+ϕ
2)− e(−π
2+ϕ)×tanϕ × cosϕ× tan(
π
4− ϕ
2)
(1.48)
K0c = [e(π
2+ϕ)×tanϕ × cosϕ× tan(
π
4+ϕ
2)− 1]× cotϕ (1.49)
K∞q = K∞c ×K0 × tanϕ (1.50)
K∞c = Nc × d∞c (1.51)
d∞c = 1.58 + 4.09× tan4 ϕ (1.52)
Nc = [eπ×tanϕ × tan2(π
4+ϕ
2)− 1]× cotϕ (1.53)
K0 = 1− sinϕ for OCR = 1 (1.54)
αq =K0q
K∞q −K0q
× K0 × sinϕ
sin(π4
+ ϕ2)
(1.55)
αc =K0c
K∞c −K0c
× 2 sin(π
4+ϕ
2) (1.56)
D is the average depth at the middle of the layer [m].By identification with the usual formula for the calculation of the passive earth pressure σp =Kp × σ′v + 2c∗
√Kp, it can be deduced:
Kp = Kq Passive earth pressure coefficient [-] (1.57)
c∗ =c×Kc
2√Kq
Adapted cohesion [kN/m2] (1.58)
Results for the different layers are given in Table 1.15.
20 of 136 Deltares
Group 1: Benchmarks from literature (exact solution)
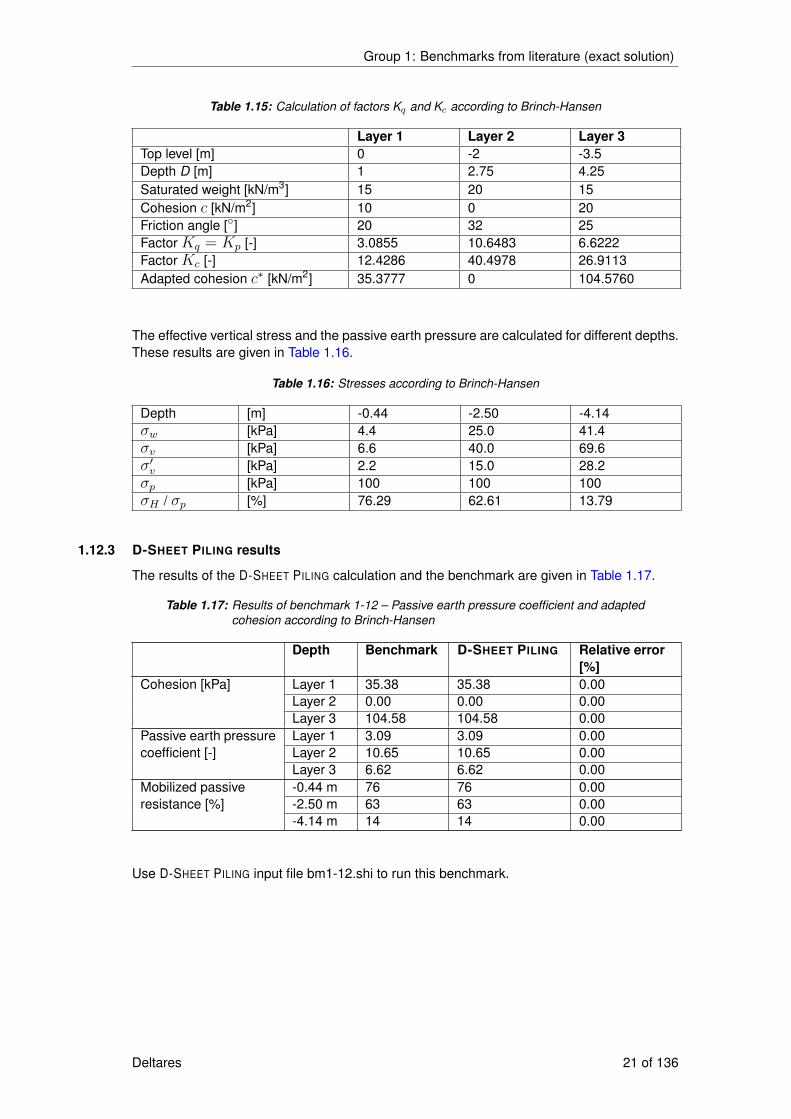
Table 1.15: Calculation of factors Kq and Kc according to Brinch-Hansen
Layer 1 Layer 2 Layer 3Top level [m] 0 -2 -3.5Depth D [m] 1 2.75 4.25Saturated weight [kN/m3] 15 20 15Cohesion c [kN/m2] 10 0 20Friction angle [◦] 20 32 25Factor Kq = Kp [-] 3.0855 10.6483 6.6222Factor Kc [-] 12.4286 40.4978 26.9113Adapted cohesion c∗ [kN/m2] 35.3777 0 104.5760
The effective vertical stress and the passive earth pressure are calculated for different depths.These results are given in Table 1.16.
Table 1.16: Stresses according to Brinch-Hansen
Depth [m] -0.44 -2.50 -4.14σw [kPa] 4.4 25.0 41.4σv [kPa] 6.6 40.0 69.6σ′v [kPa] 2.2 15.0 28.2σp [kPa] 100 100 100σH / σp [%] 76.29 62.61 13.79
1.12.3 D-SHEET PILING results
The results of the D-SHEET PILING calculation and the benchmark are given in Table 1.17.
Table 1.17: Results of benchmark 1-12 – Passive earth pressure coefficient and adaptedcohesion according to Brinch-Hansen
Depth Benchmark D-SHEET PILING Relative error[%]
Cohesion [kPa] Layer 1 35.38 35.38 0.00Layer 2 0.00 0.00 0.00Layer 3 104.58 104.58 0.00
Passive earth pressure Layer 1 3.09 3.09 0.00coefficient [-] Layer 2 10.65 10.65 0.00
Layer 3 6.62 6.62 0.00Mobilized passive -0.44 m 76 76 0.00resistance [%] -2.50 m 63 63 0.00
-4.14 m 14 14 0.00
Use D-SHEET PILING input file bm1-12.shi to run this benchmark.
Deltares 21 of 136

D-SHEET PILING, Verification Report
22 of 136 Deltares

2 Group 2: Benchmarks from literature (approximate solution)
This chapter contains benchmarks described in literature, for which an approximate solutionis known (group 2).
2.1 Horizontal load due to different level of water table
2.1.1 Description
A sheet pile wall is loaded by hydrostatic water pressure, with (as far as is physically possible)stationary, but different, water table levels on either side of the wall. In D-SHEET PILING a sheetpile wall 12 m long is placed in homogeneous soil with the water table at the top of the wall.Thereafter, in succeeding stages, the water table on the left hand side of the wall is loweredto -2, -4 and -6 m respectively. The water pressures at the middle level and the toe level arecompared.
-2 m
-2 m
-2 m-12 m
GL = 0.0
Figure 2.1: Changing water levels (benchmark bm2-1)
2.1.2 Benchmark results
On both sides the water pressure increases linearly with depth. The increase per meter depthequals the volumetric weight of the water.
2.1.3 D-SHEET PILING results
The calculations are carried out using the input file which is similar to that for benchmark 1-4(section 1.4). The results of D-SHEET PILING and the benchmark are compared in Table 2.1.
Deltares 23 of 136

D-SHEET PILING, Verification Report
Table 2.1: Results of benchmark 2-1 – Water pressures for different water levels
Water tablelowering (left)
Depth Benchmark[kN/m2]
D-SHEET PILING
[kN/m2]Relative error[%]
0 m Middle 60 60 0.00Toe 120 120 0.00
2 m Middle 40 40 0.00Toe 100 100 0.00
4 m Middle 20 20 0.00Toe 80 80 0.00
6 m Middle 0 0 0.00Toe 60 60 0.00
Use D-SHEET PILING input file bm2-1.shi to run this benchmark.
2.2 Fundamental solution according to Culmann
2.2.1 Description
At failure the equilibrium of a sliding soil mass must be insured. For a simple case the equi-librium can be calculated analytically.
A short sheet pile wall (length L = 2 m) is fixed at the toe. The soil is purely cohesive(c = 1 kN/m2 and ϕ = 0◦) and almost mass-less (γsoil = 1 kN/m3). In this case the shearforce along a sliding surface is known (length of surface × cohesion) and the equilibriumcan be calculated (Figure 2.2). A surcharge load of q = 2 kN/m2 is applied; this value is themaximum force possible that insures stability.
2.2.2 Benchmark resultssoil mass equilibrium with load
load = 100 kN
Fwall = 98 kN
Fload = 100 kN
Fsoil weight = 2 kN
Ffriction = 2√2 kN
Fn = 100√2 kN
h =
2m
l = 2m
L =
2√2m
fixed
c = 1 kN/m2
γ = 1 kN/m3
Figure 2.2: The force against the wall is calculated graphically
2.2.3 D-SHEET PILING results
The results of D-SHEET PILING and the benchmark are shown in Table 2.2.
24 of 136 Deltares

Group 2: Benchmarks from literature (approximate solution)
Table 2.2: Results of benchmark 2-2
Benchmark D-SHEET PILING Rel. error[%]
Total force without surface load [kN] 2.0 2.0 0.00Total force with surface load [kN] 98.0 98.0 0.00
Use D-SHEET PILING input file bm2-2.shi to run this benchmark.
Deltares 25 of 136

D-SHEET PILING, Verification Report
26 of 136 Deltares

3 Group 3: Benchmarks from spreadsheets
This chapter contains benchmarks which test program features specific to D-Sheet Pilingusing spreadsheets (group 3).
3.1 Anchor wall stability for a short anchorage in homogeneous soil
3.1.1 Description
A sheet pile H = 7 m long has a ground surface at 0 m on one side and -4.5 m on the otherside. An anchor is attached at -2 m, at an angle β = 5 degrees to the horizontal axis. Theanchor length is L = 5 m and the anchor wall is h = 1 m high. The soil is homogeneous(γ’ = 5 kN/m3, ϕ = 25◦and c = 2 kPa). A uniform load of q = 6 kN/m2 is applied on the rightside.
GL - 4.5 m
GL 0 m
H L
Th
β
passive slip
plane wall
active slip
plane
sheet piling
π4
ϕ4
Θ = Arc tan h - T
L cos β
Figure 3.1: Short anchor (bm3-1)
3.1.2 Benchmark results
The allowable anchor force P according to Kranz method Kranz (1953) for a short anchorageis given by equation:
P =Ea − (E0 + Er) + Ec
Es(3.1)
where:
Ea is the active pressure on the sheet pile:Ea = 1
2Ka × γ ×H2 − 2c
√Ka ×H +Ka × q ×H
E0 is the active pressure on the anchor wall:Eo = 1
2Ka × γ × T 2 − 2c
√Ka × T +Ka × q × T
Er is the horizontal pressure on deep slide plane:
Er = L× cos β
(γ′H + T
2+ q
)tan (θ − ϕ)
Ec is the horizontal cohesive force along the slide plane:EC = c× L× cos β
Es is the factor due to the anchor inclination:ES = cos β − sin β × tan(θ − ϕ)
Deltares 27 of 136
D-SHEET PILING, Verification Report
Ka is the lateral earth pressure ratio at active yielding:
Ka =1− sinϕ
1 + sinϕγ′ is the effective soil unit weight in kN/m3;q is the surface load in kN/m2;H is the distance between the level of the top of the sheet pile wall and the level at which
the maximum bending moment occurs.
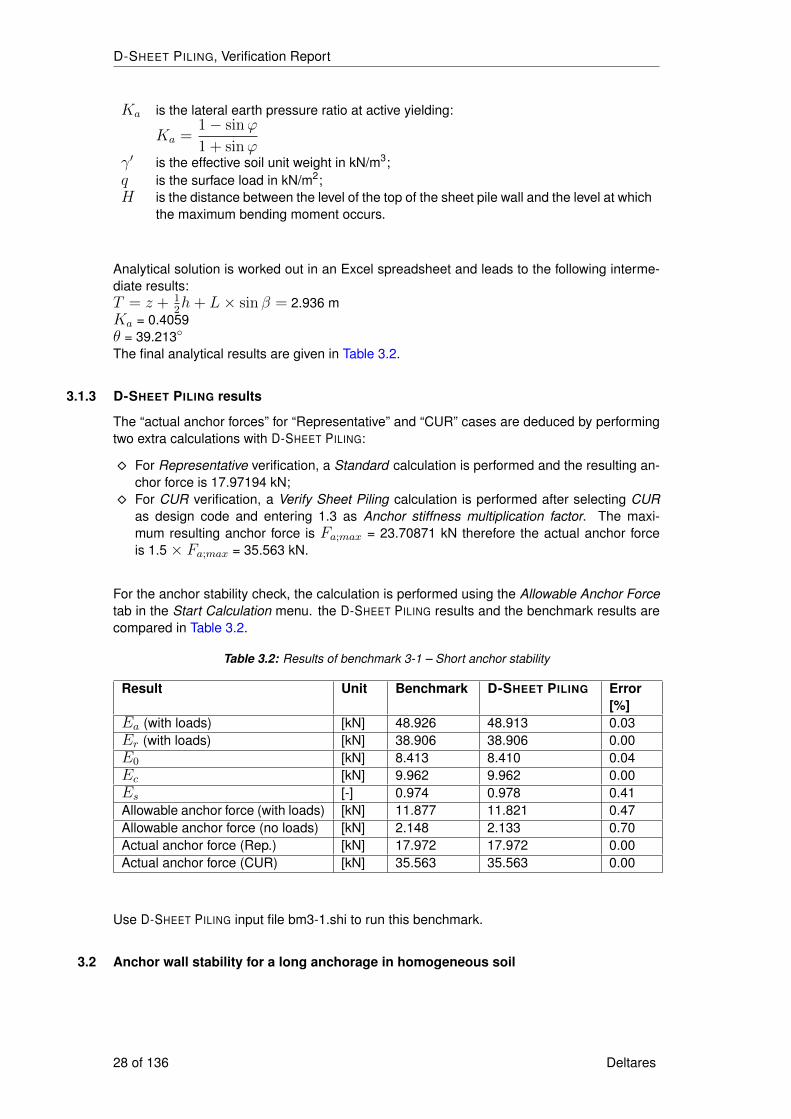
Analytical solution is worked out in an Excel spreadsheet and leads to the following interme-diate results:T = z + 1
2h+ L× sin β = 2.936 m
Ka = 0.4059θ = 39.213◦
The final analytical results are given in Table 3.2.
3.1.3 D-SHEET PILING results
The “actual anchor forces” for “Representative” and “CUR” cases are deduced by performingtwo extra calculations with D-SHEET PILING:
� For Representative verification, a Standard calculation is performed and the resulting an-chor force is 17.97194 kN;
� For CUR verification, a Verify Sheet Piling calculation is performed after selecting CURas design code and entering 1.3 as Anchor stiffness multiplication factor. The maxi-mum resulting anchor force is Fa;max = 23.70871 kN therefore the actual anchor forceis 1.5× Fa;max = 35.563 kN.
For the anchor stability check, the calculation is performed using the Allowable Anchor Forcetab in the Start Calculation menu. the D-SHEET PILING results and the benchmark results arecompared in Table 3.2.
Table 3.2: Results of benchmark 3-1 – Short anchor stability
Result Unit Benchmark D-SHEET PILING Error[%]
Ea (with loads) [kN] 48.926 48.913 0.03Er (with loads) [kN] 38.906 38.906 0.00E0 [kN] 8.413 8.410 0.04Ec [kN] 9.962 9.962 0.00Es [-] 0.974 0.978 0.41Allowable anchor force (with loads) [kN] 11.877 11.821 0.47Allowable anchor force (no loads) [kN] 2.148 2.133 0.70Actual anchor force (Rep.) [kN] 17.972 17.972 0.00Actual anchor force (CUR) [kN] 35.563 35.563 0.00
Use D-SHEET PILING input file bm3-1.shi to run this benchmark.
3.2 Anchor wall stability for a long anchorage in homogeneous soil
28 of 136 Deltares

Group 3: Benchmarks from spreadsheets
3.2.1 Description
This benchmark has the same input as benchmark 3-1 (section 3.1) except for the anchorlength, L = 10 m. Therefore, the anchorage is now a long anchorage.
GL - 4.5 m
GL 0 m
H
Tβ
passive slip
plane wall
active slip
plane
sheet
piling
π4
ϕ4
Θ = Arc tan H - T
L cos β
Figure 3.2: Long anchor (bm3-2)
3.2.2 Benchmark results
The allowable anchor force P according to Kranz method Kranz (1953) for a long anchorageis given by equation:
P = Ep − E0 (3.2)
where:
Ep Passive pressure on the anchor wall:Ep = 1
2Kp × γ × T 2 + 2c
√Kp × T +Kp × q × T
E0 Active pressure on the anchor wall:E0 = 1
2Ka × γ × T 2 − 2c
√Ka × T
Ka Lateral earth pressure ratio at active yielding:
Ka =1− sinϕ
1 + sinϕKp Lateral earth pressure ratio at passive yielding:
Kp =1 + sinϕ
1− sinϕ
Analytical solution is worked out in an Excel spreadsheet and leads to the following interme-diate results:T = z + 1
2h+ L× sin β = 3.372 m
Ka = 0.4059Kp = 2.4639
The final analytical results are given in Table 3.4.
Deltares 29 of 136
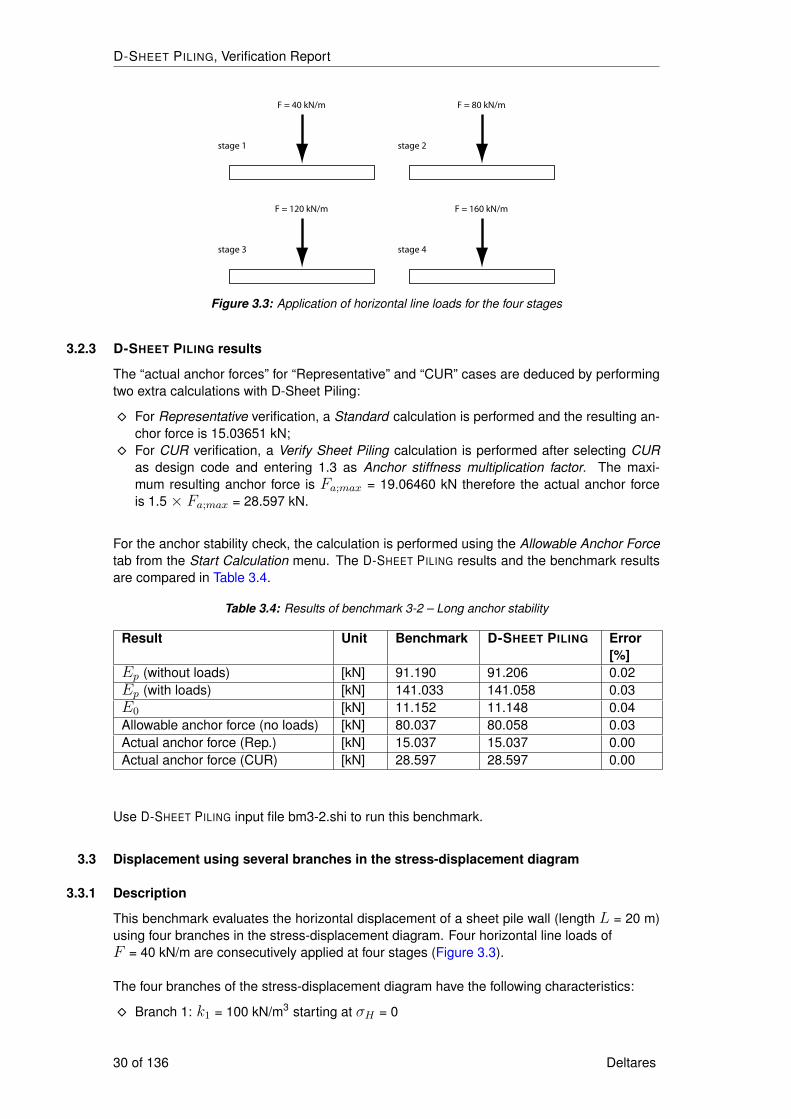
D-SHEET PILING, Verification Report
stage 1
F = 40 kN/m
stage 3
F = 120 kN/m
stage 2
F = 80 kN/m
stage 4
F = 160 kN/m
Figure 3.3: Application of horizontal line loads for the four stages
3.2.3 D-SHEET PILING results
The “actual anchor forces” for “Representative” and “CUR” cases are deduced by performingtwo extra calculations with D-Sheet Piling:
� For Representative verification, a Standard calculation is performed and the resulting an-chor force is 15.03651 kN;
� For CUR verification, a Verify Sheet Piling calculation is performed after selecting CURas design code and entering 1.3 as Anchor stiffness multiplication factor. The maxi-mum resulting anchor force is Fa;max = 19.06460 kN therefore the actual anchor forceis 1.5× Fa;max = 28.597 kN.
For the anchor stability check, the calculation is performed using the Allowable Anchor Forcetab from the Start Calculation menu. The D-SHEET PILING results and the benchmark resultsare compared in Table 3.4.
Table 3.4: Results of benchmark 3-2 – Long anchor stability
Result Unit Benchmark D-SHEET PILING Error[%]
Ep (without loads) [kN] 91.190 91.206 0.02Ep (with loads) [kN] 141.033 141.058 0.03E0 [kN] 11.152 11.148 0.04Allowable anchor force (no loads) [kN] 80.037 80.058 0.03Actual anchor force (Rep.) [kN] 15.037 15.037 0.00Actual anchor force (CUR) [kN] 28.597 28.597 0.00
Use D-SHEET PILING input file bm3-2.shi to run this benchmark.
3.3 Displacement using several branches in the stress-displacement diagram
3.3.1 Description
This benchmark evaluates the horizontal displacement of a sheet pile wall (length L = 20 m)using four branches in the stress-displacement diagram. Four horizontal line loads ofF = 40 kN/m are consecutively applied at four stages (Figure 3.3).
The four branches of the stress-displacement diagram have the following characteristics:
� Branch 1: k1 = 100 kN/m3 starting at σH = 0
30 of 136 Deltares

Group 3: Benchmarks from spreadsheets
� Branch 2: k2 = 500 kN/m3 starting at 25 % of (σp – σa)� Branch 3: k3 = 250 kN/m3 starting at 50 % of (σp – σa)� Branch 4: k4 = 400 kN/m3 starting at 75 % of (σp – σa)
For this problem, the following values are chosen:γ = 0 kN/m3
c = 2 kN/m2
Ka = K0 = 0Kp = 4
As the pile is supposed to be rigid (EI = 9 108 kNm2/m), the distribution of the horizontalstresses along the pile is uniform and equal to:
σH =F
L
3.3.2 Benchmark results
As the unit weight of the soil is zero, the initial vertical stress is nil. This leads to:
σa = Ka × σv − 2c√Ka = 0 (3.3)
σ0 = K0 × σv = 0 (3.4)
σp = Kp × σv + 2c√Kp = 8 kN/m2 (3.5)
According to the input percentage of stress variation, the four branches of the stress-displacementdiagram start respectively at 0, 2, 4 and 6 kPa. Each new load step corresponds to the limitpoint of each branch. Then, the total displacement after each stage is:
w1 =σ1 − σ0
k1
=F/L
k1
=40/20
100= 0.020 m
w2 = w1 +σ2 − σ1
k2
= 0.020 +40/20
500= 0.02 m
w3 = w2 +σ3 − σ2
k3
= 0.024 +40/20
250= 0.032 m
w4 = w3 +σ4 − σ3
k4
= 0.032 +40/20
400= 0.037 m
horizontal stress
σ4 = σp
σ3 = 0.75 σp
σ2 = 0.5 σp
σ1 = 0.25σp
σa = σ0 = 0
w1 w2 w3 w4
displacement
σp = 8 kN/m2
Figure 3.4: Stress-displacement diagram
Deltares 31 of 136
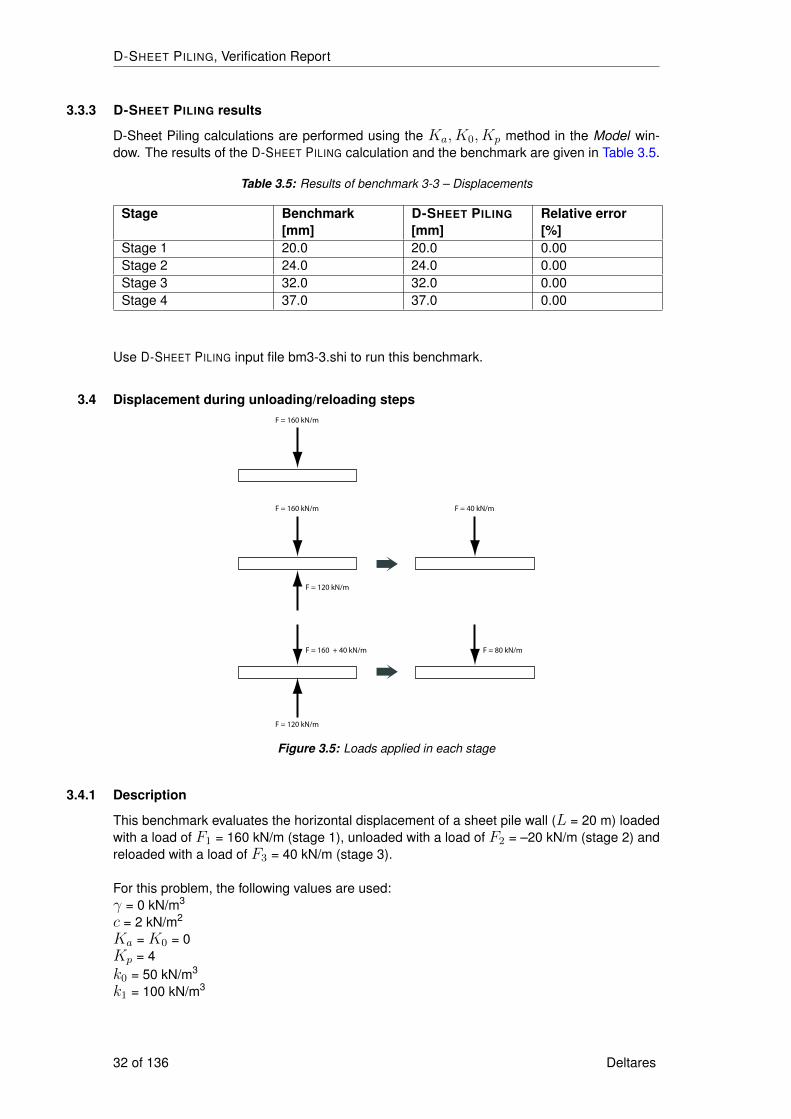
D-SHEET PILING, Verification Report
3.3.3 D-SHEET PILING results
D-Sheet Piling calculations are performed using the Ka, K0, Kp method in the Model win-dow. The results of the D-SHEET PILING calculation and the benchmark are given in Table 3.5.
Table 3.5: Results of benchmark 3-3 – Displacements
Stage Benchmark[mm]
D-SHEET PILING
[mm]Relative error[%]
Stage 1 20.0 20.0 0.00Stage 2 24.0 24.0 0.00Stage 3 32.0 32.0 0.00Stage 4 37.0 37.0 0.00
Use D-SHEET PILING input file bm3-3.shi to run this benchmark.
3.4 Displacement during unloading/reloading stepsF = 160 kN/m
F = 160 kN/m
F = 160 + 40 kN/m
F = 40 kN/m
F = 80 kN/m
F = 120 kN/m
F = 120 kN/m
Figure 3.5: Loads applied in each stage
3.4.1 Description
This benchmark evaluates the horizontal displacement of a sheet pile wall (L = 20 m) loadedwith a load of F1 = 160 kN/m (stage 1), unloaded with a load of F2 = –20 kN/m (stage 2) andreloaded with a load of F3 = 40 kN/m (stage 3).
For this problem, the following values are used:γ = 0 kN/m3
c = 2 kN/m2
Ka = K0 = 0Kp = 4k0 = 50 kN/m3
k1 = 100 kN/m3
32 of 136 Deltares
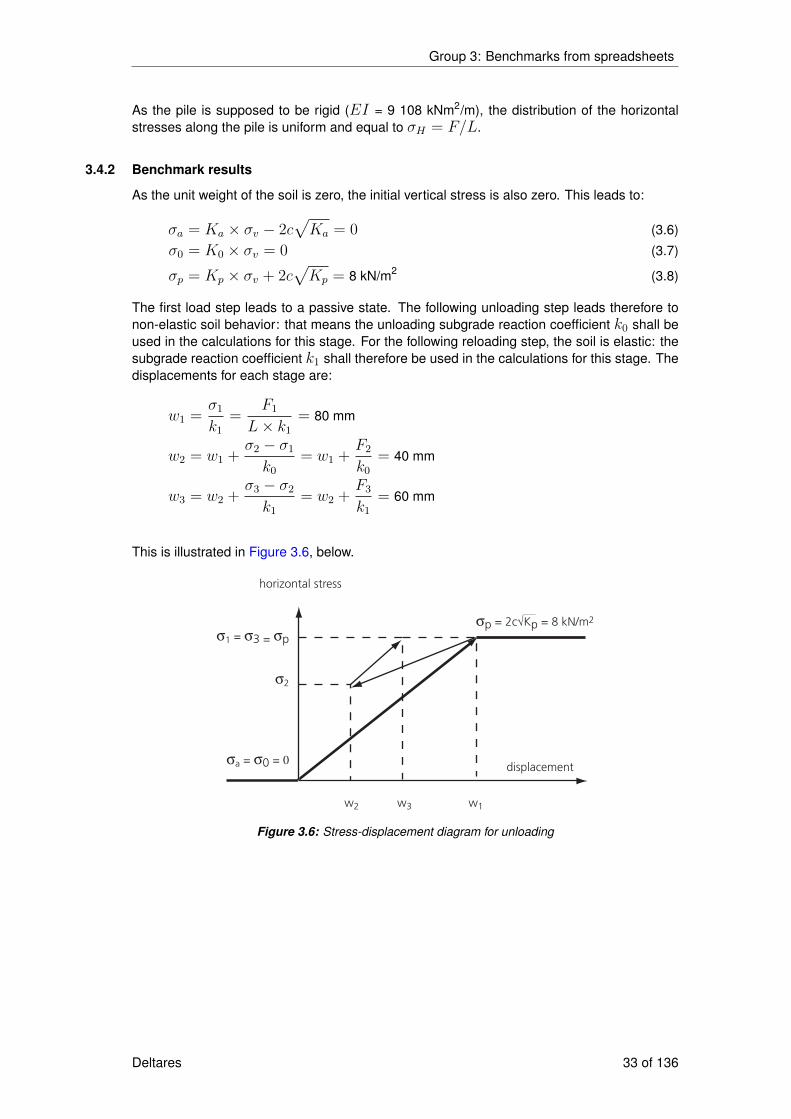
Group 3: Benchmarks from spreadsheets
As the pile is supposed to be rigid (EI = 9 108 kNm2/m), the distribution of the horizontalstresses along the pile is uniform and equal to σH = F/L.
3.4.2 Benchmark results
As the unit weight of the soil is zero, the initial vertical stress is also zero. This leads to:
σa = Ka × σv − 2c√Ka = 0 (3.6)
σ0 = K0 × σv = 0 (3.7)
σp = Kp × σv + 2c√Kp = 8 kN/m2 (3.8)
The first load step leads to a passive state. The following unloading step leads therefore tonon-elastic soil behavior: that means the unloading subgrade reaction coefficient k0 shall beused in the calculations for this stage. For the following reloading step, the soil is elastic: thesubgrade reaction coefficient k1 shall therefore be used in the calculations for this stage. Thedisplacements for each stage are:
w1 =σ1
k1
=F1
L× k1
= 80 mm
w2 = w1 +σ2 − σ1
k0
= w1 +F2
k0
= 40 mm
w3 = w2 +σ3 − σ2
k1
= w2 +F3
k1
= 60 mm
This is illustrated in Figure 3.6, below.
σ1 = σ3 = σp
σ2
σa = σ0 = 0
horizontal stress
w2 w1w3
displacement
σp = 2c√Kp = 8 kN/m2
Figure 3.6: Stress-displacement diagram for unloading
Deltares 33 of 136
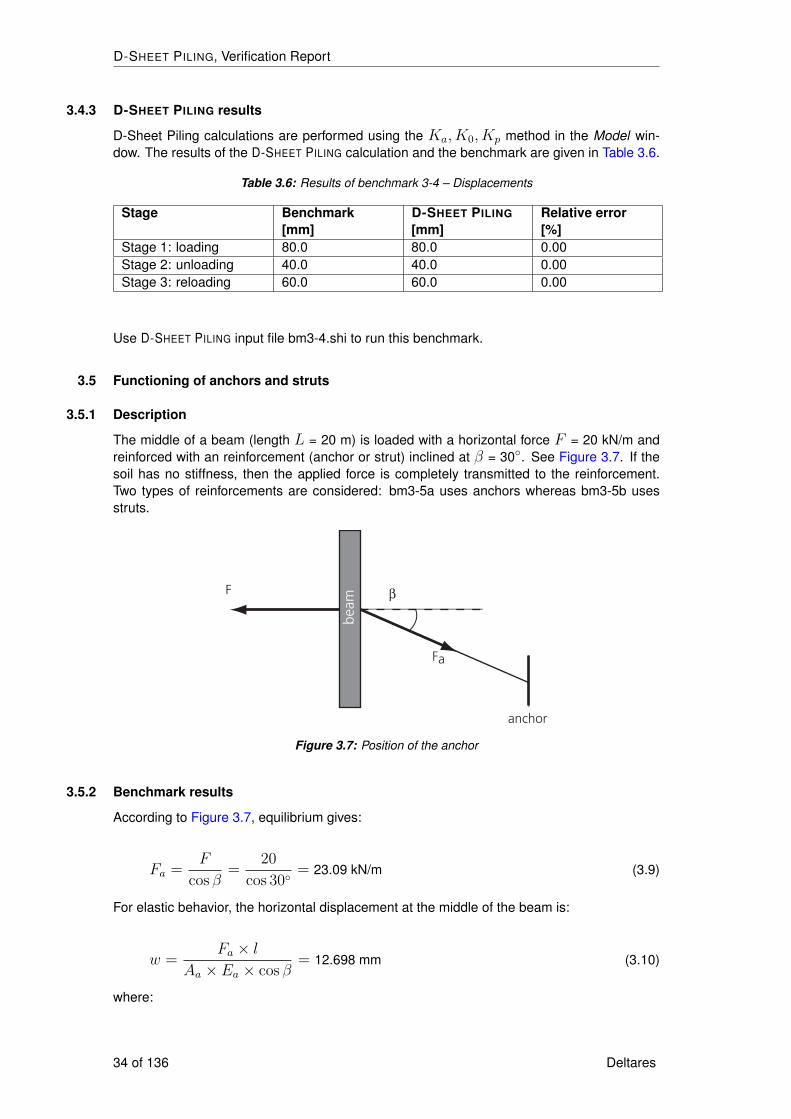
D-SHEET PILING, Verification Report
3.4.3 D-SHEET PILING results
D-Sheet Piling calculations are performed using the Ka, K0, Kp method in the Model win-dow. The results of the D-SHEET PILING calculation and the benchmark are given in Table 3.6.
Table 3.6: Results of benchmark 3-4 – Displacements
Stage Benchmark[mm]
D-SHEET PILING
[mm]Relative error[%]
Stage 1: loading 80.0 80.0 0.00Stage 2: unloading 40.0 40.0 0.00Stage 3: reloading 60.0 60.0 0.00
Use D-SHEET PILING input file bm3-4.shi to run this benchmark.
3.5 Functioning of anchors and struts
3.5.1 Description
The middle of a beam (length L = 20 m) is loaded with a horizontal force F = 20 kN/m andreinforced with an reinforcement (anchor or strut) inclined at β = 30◦. See Figure 3.7. If thesoil has no stiffness, then the applied force is completely transmitted to the reinforcement.Two types of reinforcements are considered: bm3-5a uses anchors whereas bm3-5b usesstruts.
beam β
Fa
F
anchor
Figure 3.7: Position of the anchor
3.5.2 Benchmark results
According to Figure 3.7, equilibrium gives:
Fa =F
cos β=
20
cos 30◦= 23.09 kN/m (3.9)
For elastic behavior, the horizontal displacement at the middle of the beam is:
w =Fa × l
Aa × Ea × cos β= 12.698 mm (3.10)
where:
34 of 136 Deltares
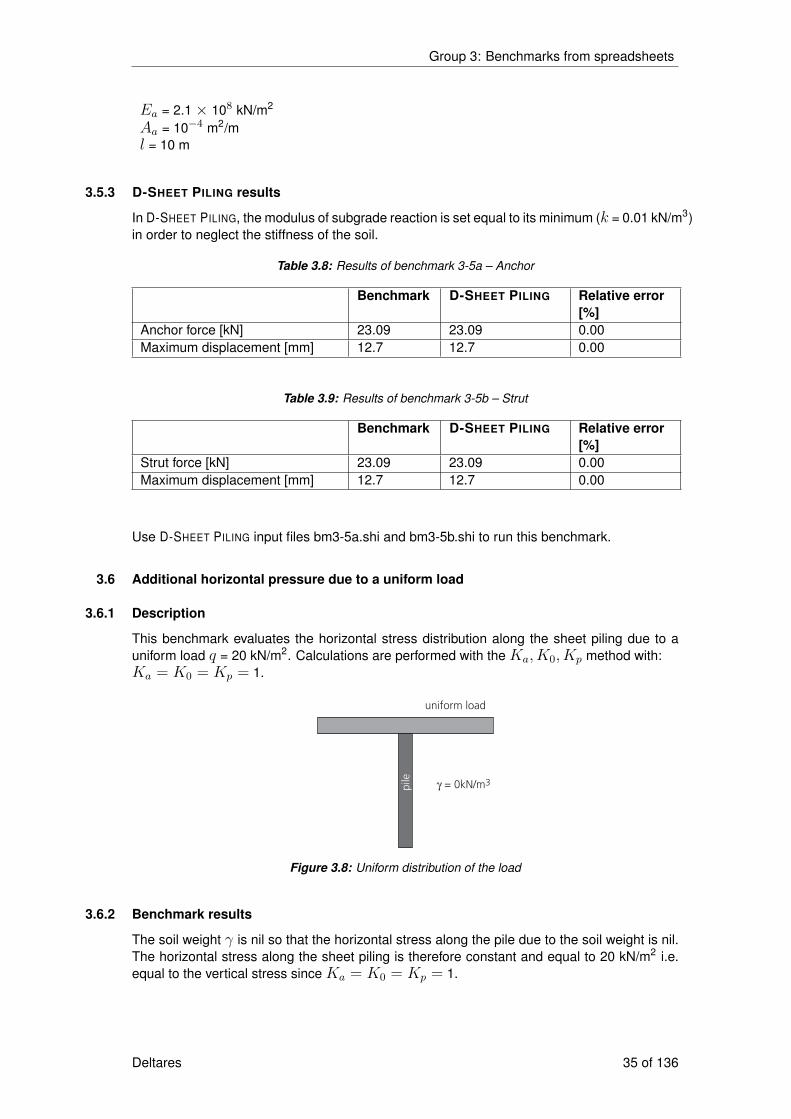
Group 3: Benchmarks from spreadsheets
Ea = 2.1× 10⁸ kN/m2 is the modulus of elasticity of the reinforcement;Aa = 10−4 m2/m is the cross-section area of the reinforcement;l = 10 m is the length of the reinforcement.
3.5.3 D-SHEET PILING results
In D-SHEET PILING, the modulus of subgrade reaction is set equal to its minimum (k = 0.01 kN/m3)in order to neglect the stiffness of the soil.
Table 3.8: Results of benchmark 3-5a – Anchor
Benchmark D-SHEET PILING Relative error[%]
Anchor force [kN] 23.09 23.09 0.00Maximum displacement [mm] 12.7 12.7 0.00
Table 3.9: Results of benchmark 3-5b – Strut
Benchmark D-SHEET PILING Relative error[%]
Strut force [kN] 23.09 23.09 0.00Maximum displacement [mm] 12.7 12.7 0.00
Use D-SHEET PILING input files bm3-5a.shi and bm3-5b.shi to run this benchmark.
3.6 Additional horizontal pressure due to a uniform load
3.6.1 Description
This benchmark evaluates the horizontal stress distribution along the sheet piling due to auniform load q = 20 kN/m2. Calculations are performed with the Ka, K0, Kp method with:Ka = K0 = Kp = 1.
pile
uniform load
γ = 0kN/m3
Figure 3.8: Uniform distribution of the load
3.6.2 Benchmark results
The soil weight γ is nil so that the horizontal stress along the pile due to the soil weight is nil.The horizontal stress along the sheet piling is therefore constant and equal to 20 kN/m2 i.e.equal to the vertical stress since Ka = K0 = Kp = 1.
Deltares 35 of 136
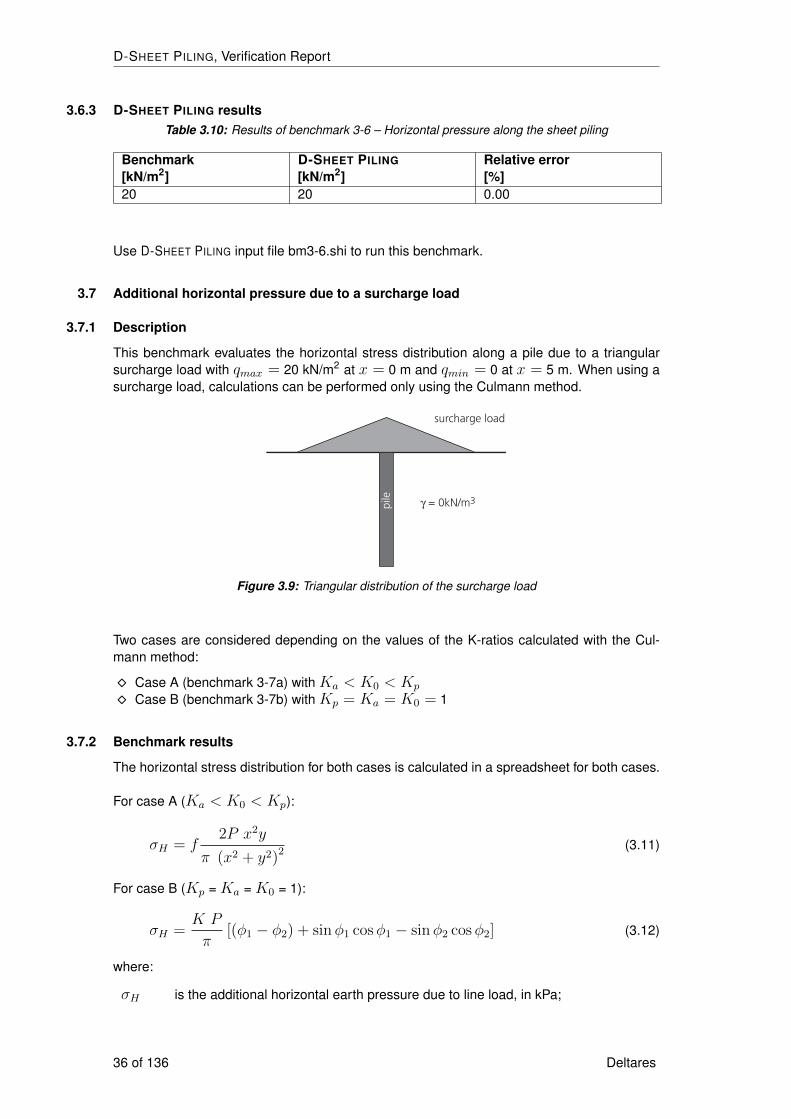
D-SHEET PILING, Verification Report
3.6.3 D-SHEET PILING resultsTable 3.10: Results of benchmark 3-6 – Horizontal pressure along the sheet piling
Benchmark[kN/m2]
D-SHEET PILING
[kN/m2]Relative error[%]
20 20 0.00
Use D-SHEET PILING input file bm3-6.shi to run this benchmark.
3.7 Additional horizontal pressure due to a surcharge load
3.7.1 Description
This benchmark evaluates the horizontal stress distribution along a pile due to a triangularsurcharge load with qmax = 20 kN/m2 at x = 0 m and qmin = 0 at x = 5 m. When using asurcharge load, calculations can be performed only using the Culmann method.
pile
surcharge load
γ = 0kN/m3
Figure 3.9: Triangular distribution of the surcharge load
Two cases are considered depending on the values of the K-ratios calculated with the Cul-mann method:
� Case A (benchmark 3-7a) with Ka < K0 < Kp
� Case B (benchmark 3-7b) with Kp = Ka = K0 = 1
3.7.2 Benchmark results
The horizontal stress distribution for both cases is calculated in a spreadsheet for both cases.
For case A (Ka < K0 < Kp):
σH = f2P x2y
π (x2 + y2)2 (3.11)
For case B (Kp = Ka = K0 = 1):
σH =K P
π[(φ1 − φ2) + sinφ1 cosφ1 − sinφ2 cosφ2] (3.12)
where:
σH is the additional horizontal earth pressure due to line load, in kPa;
36 of 136 Deltares
Group 3: Benchmarks from spreadsheets
f is the multiplication factor (influence of the sheet pile wall):
f =
{L if xi > L2− xi/L if xi ≤ L
L is the length of the sheet pile, in m;P is the line load, in kN/m;x, y is the horizontal and vertical coordinates, in m.
The surcharge load is divided into 50 elements of 0.1 m. Results at different depths arepresented in the tables below.
3.7.3 D-SHEET PILING results
The soil weight γ is nil so that the horizontal stress along the pile due to the soil weight isnil, only the horizontal stress due to the surcharge load is calculated by D-Sheet Piling. Forbenchmark 3-7a, the value of the cohesion is set to c = 100 kN/m2 to get Ka < K0 < Kp.For benchmark 3-7b, the earth pressure coefficients are set to 1 using the Manual option inthe Start Calculation window. Results are found in the Effective Stress chart in the StressState Charts window using the View Data option.
Table 3.12: Results of benchmark 3-7a – Horizontal effective stress due to triangular sur-charge (Ka < K0 < Kp)
Depth Benchmark[kN/m2]
D-SHEET PILING
[kN/m2]Relative error[%]
–2 m 4.54 4.54 0.00–4 m 1.59 1.59 0.00–6 m 0.68 0.68 0.00–8 m 0.34 0.34 0.00–10 m 0.19 0.19 0.00
Table 3.13: Results of benchmark 3-7b – Horizontal effective stress due to triangular sur-charge (Kp = Ka = K0 = 1)
Depth Benchmark[kN/m2]
D-SHEET PILING
[kN/m2]Relative error[%]
–4 m 11.41 11.41 0.00–6 m 8.85 8.85 0.00–8 m 7.11 7.11 0.00–10 m 5.90 5.92 0.34
Use D-SHEET PILING input files bm3-7a.shi and bm3-7b.shi to run this benchmark.
3.8 Vertical force balance
3.8.1 Description
The vertical balance of a sheet pile wall loaded with a horizontal load F = 100 kN/m in themiddle, loaded by a normal force of N = 40 kN over the entire sheet piling, and reinforced atthe middle by an anchor with an inclination β = 15◦is checked. The soil weight is γ = 15 kN/m3,the angle of friction is δ = 20◦, the neutral earth pressure coefficient is K0 = 0.58 and themaximum point resistance is pr;max;point = 6 MPa. The soil reaction is neglected as the
Deltares 37 of 136

D-SHEET PILING, Verification Report
modulus of subgrade reaction is equal to k = 0.01 kN/m3. The pile is composed of twosections with the properties given in Table 3.14.
Table 3.14: Properties of the sheet piling (benchmark 3-8)
Section 1 (top) Section 2 (bottom)Length L [m] 6 4Acting width b [m] 2.5 1.5Height h [mm] 400 600Coating area Acoat [m2/m2 wall] 1.35 1.5Steel section Asteel [cm2/m] 170 220
N
friction
active sidepassive side
Fanchoranchor
Fβ
pile
Figure 3.10: Forces equilibrium in benchmark 3-8
The vertical balance is checked for plugged and unplugged cases, using factors γm;b = 1.2and ξ = 1.5.
3.8.2 Benchmark results
For the calculation of the vertical force balance, four contributions must be considered:
Fbalance = F activeV + F passive
V +N + F anchorV (3.13)
with:
F passivev = −F active
V (3.14)
F passivev =
∫ L
0
K0 γ z tan δ b dz =K0 γ tan δ
2
[L2
1 b1 +((L1 + L2)2 − L2
1
)b2
](plugged) (3.15)
F passivev =
K0 γ tan δ
2
[L2
1 b1Acoat;1 +((L1 + L2)2 − L2
1
)b2Acoat;2
](unplugged) (3.16)
For vertical balance unplugged, a wall surface of 1m2/m is used instead of the paint sur-face (Acoat) in accordance with CUR 166 CUR (2005) (Part 1, page 69, last alinea), leading
38 of 136 Deltares
Group 3: Benchmarks from spreadsheets
therefore to the same results for both plugged and unplugged cases:
F passiveV = −F active
V = 142.49 + 151.99 = 294.49 kN (plugged and unplugged)(3.17)
F anchorV = −1.1× F tan β b = −73.69 kN (3.18)
N = −40 kN (3.19)
The resulting vertical force is then equal to: Fbalance = 113.69 kN
The vertical toe capacity is:
Ftoe;d =pr;point;max Asteel b
ξ × γm,b=
6000× 0.022× 1.5
1.5× 1.2= 110 kN
(unplugged) (3.20)
Ftoe,d =pr;point;max h b
ξ × γm,b=
6000× 0.6× 1.5
1.5× 1.2= 3000 kN
(plugged) (3.21)
The vertical toe capacity is sufficient in both cases (plugged and unplugged).
3.8.3 D-SHEET PILING results
The results of the benchmark are compared with those found by D-Sheet Piling in Table 3.15.
Table 3.15: Results of benchmark 3-8
Benchmark[kN/m2]
D-SHEET PIL-ING
[kN/m2]
Relative error[%]
Unplugged:Vertical active force [kN] -294.49 -294.48 0.00Vertical passive force [kN] 294.49 294.49 0.00Vertical anchor force [kN] -73.69 -73.68 0.01Normal force on sheet piling [kN] -40.00 -40.00 0.00Resulting vertical force [kN] -113.69 -113.67 0.02Vertical force capacity [kN] 110.00 110.00 0.00Plugged:Vertical active force [kN] -294.49 -294.48 0.00Vertical passive force [kN] 294.49 294.49 0.00Vertical anchor force [kN] -73.69 -73.69 0.01Normal force on sheet piling [kN] -40.00 -40.00 0.00Resulting vertical force [kN] -113.69 -113.67 0.02Vertical force capacity [kN] 3000.00 3000.00 0.00
Use D-SHEET PILING input file bm3-8.shi to run this benchmark.
3.9 Horizontal pressures in stratified soil with additional pore pressures
Deltares 39 of 136
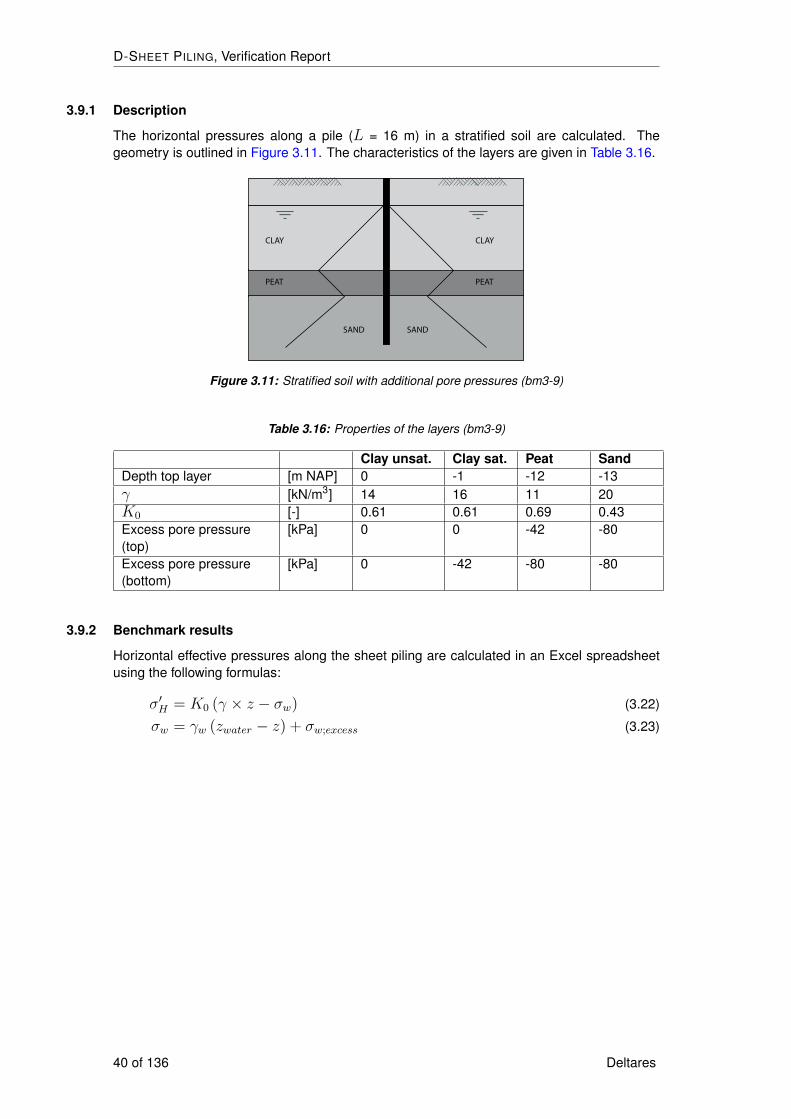
D-SHEET PILING, Verification Report
3.9.1 Description
The horizontal pressures along a pile (L = 16 m) in a stratified soil are calculated. Thegeometry is outlined in Figure 3.11. The characteristics of the layers are given in Table 3.16.
CLAY
PEAT
CLAY
PEAT
SAND SAND
Figure 3.11: Stratified soil with additional pore pressures (bm3-9)
Table 3.16: Properties of the layers (bm3-9)
Clay unsat. Clay sat. Peat SandDepth top layer [m NAP] 0 -1 -12 -13γ [kN/m3] 14 16 11 20K0 [-] 0.61 0.61 0.69 0.43Excess pore pressure(top)
[kPa] 0 0 -42 -80
Excess pore pressure(bottom)
[kPa] 0 -42 -80 -80
3.9.2 Benchmark results
Horizontal effective pressures along the sheet piling are calculated in an Excel spreadsheetusing the following formulas:
σ′H = K0 (γ × z − σw) (3.22)
σw = γw (zwater − z) + σw;excess (3.23)
40 of 136 Deltares

Group 3: Benchmarks from spreadsheets
3.9.3 D-SHEET PILING results
the D-SHEET PILING and spreadsheet results are compared in Table 3.17 for few depths. Themaximum relative error along the sheet piling is also given.
Table 3.17: Results of benchmark 3-9
Depth[m NAP]
Benchmark[kPa]
D-SHEET PIL-ING
[kPa]
Relative error[%]
Pore pressure 0 0.00 0.00 0.00-1 0.00 0.00 0.00-3.2 13.60 13.60 0.00-5.4 27.20 27.20 0.00-7.6 40.80 40.80 0.00-9.8 54.40 54.40 0.00-12 68.00 68.00 0.00-13 40.00 40.00 0.00-15.5 65.00 65.00 0.00-18 90.00 90.00 0.00
Horizontal 0 0.00 0.00 0.00stress -1 8.54 8.54 0.00
-3.2 21.72 21.72 0.00-5.4 34.89 34.89 0.00-7.6 48.07 48.07 0.00-9.8 61.24 61.24 0.00-12 74.42 74.42 0.00-13 111.09 111.09 0.00-15.5 79.98 79.98 0.00-18 90.73 90.73 0.00
Use D-SHEET PILING input file bm3-9.shi to run this benchmark.
3.10 Flexural stiffness of a combined wall
3.10.1 Description
In this benchmark, the calculation of the flexural stiffness of the upper and lower parts of acombined wall is checked. The combined wall consists of three PU 12 sheet piling elementsbetween each pair of King piles (HZ775C-12). The center-to-center distance between theKing piles is 0.53 + 3 × 0.6 = 2.33 m. The length of the King piles is 10 m and the length ofthe sheet piling is 5 m. See Figure 3.12 for a graphic representation of the combined wall.
Deltares 41 of 136
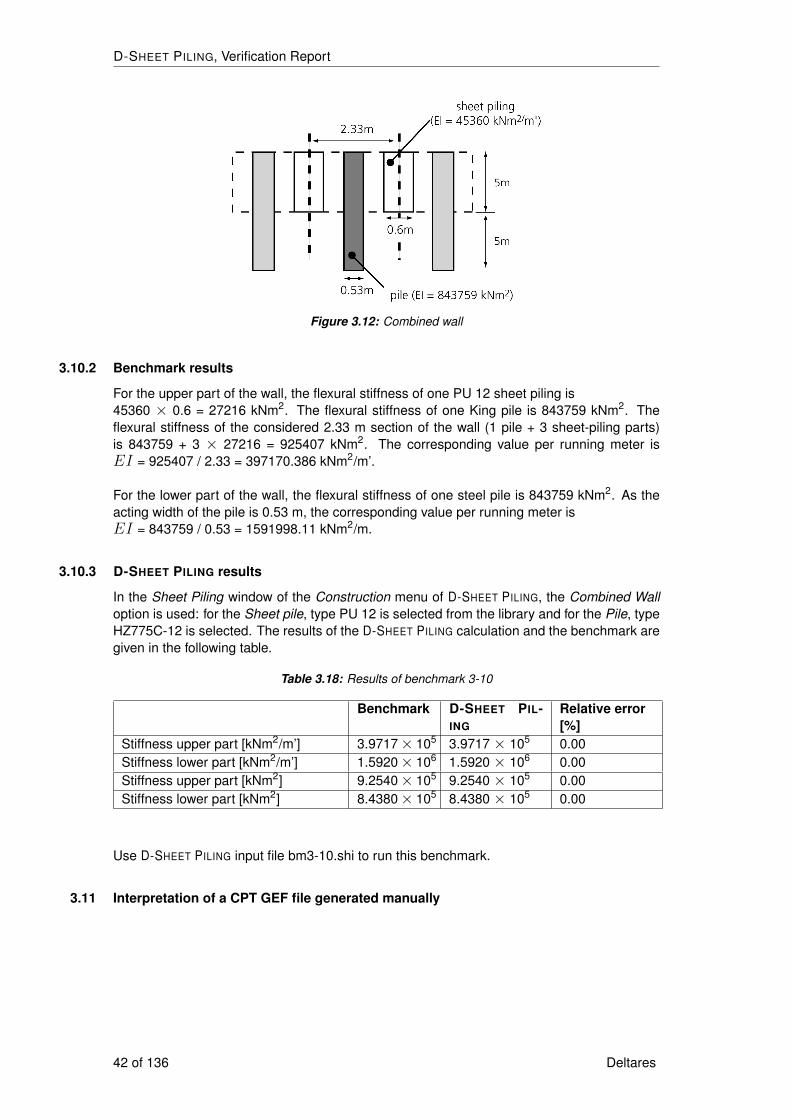
D-SHEET PILING, Verification Report
Figure 3.12: Combined wall
3.10.2 Benchmark results
For the upper part of the wall, the flexural stiffness of one PU 12 sheet piling is45360 × 0.6 = 27216 kNm2. The flexural stiffness of one King pile is 843759 kNm2. Theflexural stiffness of the considered 2.33 m section of the wall (1 pile + 3 sheet-piling parts)is 843759 + 3 × 27216 = 925407 kNm2. The corresponding value per running meter isEI = 925407 / 2.33 = 397170.386 kNm2/m’.
For the lower part of the wall, the flexural stiffness of one steel pile is 843759 kNm2. As theacting width of the pile is 0.53 m, the corresponding value per running meter isEI = 843759 / 0.53 = 1591998.11 kNm2/m.
3.10.3 D-SHEET PILING results
In the Sheet Piling window of the Construction menu of D-SHEET PILING, the Combined Walloption is used: for the Sheet pile, type PU 12 is selected from the library and for the Pile, typeHZ775C-12 is selected. The results of the D-SHEET PILING calculation and the benchmark aregiven in the following table.
Table 3.18: Results of benchmark 3-10
Benchmark D-SHEET PIL-ING
Relative error[%]
Stiffness upper part [kNm2/m’] 3.9717× 10⁵ 3.9717 × 10⁵ 0.00Stiffness lower part [kNm2/m’] 1.5920× 10⁶ 1.5920 × 10⁶ 0.00Stiffness upper part [kNm2] 9.2540× 10⁵ 9.2540 × 10⁵ 0.00Stiffness lower part [kNm2] 8.4380× 10⁵ 8.4380 × 10⁵ 0.00
Use D-SHEET PILING input file bm3-10.shi to run this benchmark.
3.11 Interpretation of a CPT GEF file generated manually
42 of 136 Deltares
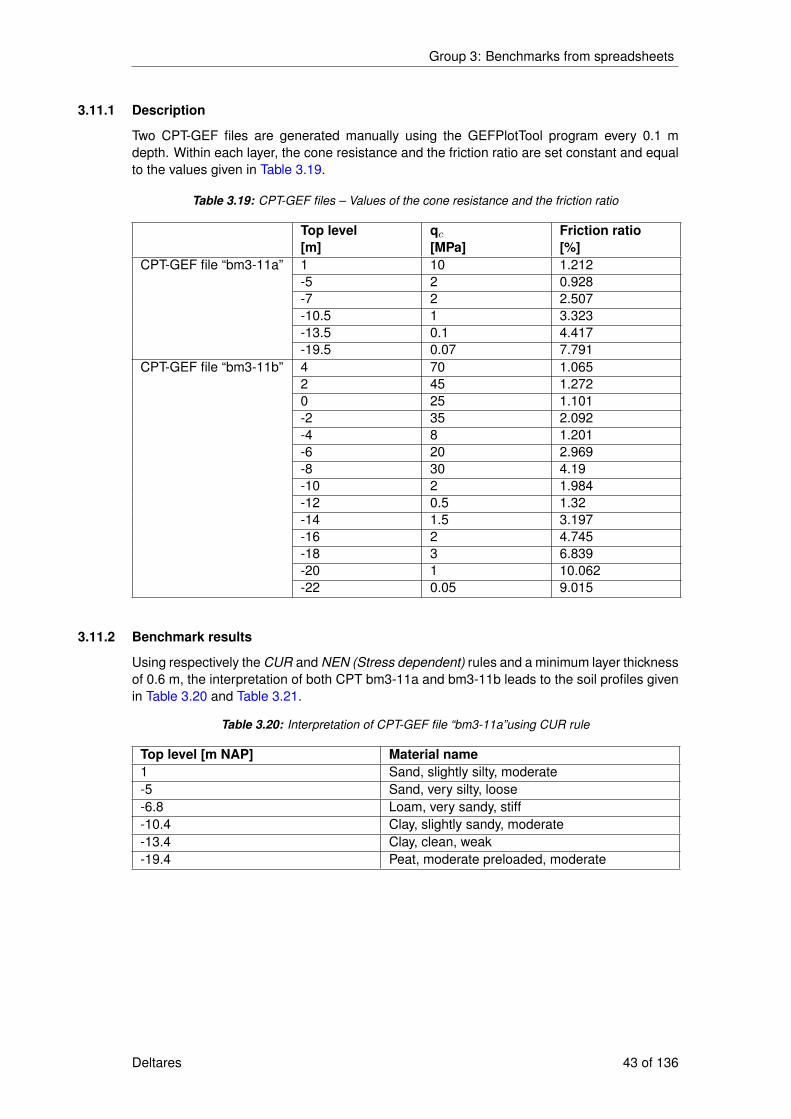
Group 3: Benchmarks from spreadsheets
3.11.1 Description
Two CPT-GEF files are generated manually using the GEFPlotTool program every 0.1 mdepth. Within each layer, the cone resistance and the friction ratio are set constant and equalto the values given in Table 3.19.
Table 3.19: CPT-GEF files – Values of the cone resistance and the friction ratio
Top level[m]
qc[MPa]
Friction ratio[%]
CPT-GEF file “bm3-11a” 1 10 1.212-5 2 0.928-7 2 2.507-10.5 1 3.323-13.5 0.1 4.417-19.5 0.07 7.791
CPT-GEF file “bm3-11b” 4 70 1.0652 45 1.2720 25 1.101-2 35 2.092-4 8 1.201-6 20 2.969-8 30 4.19-10 2 1.984-12 0.5 1.32-14 1.5 3.197-16 2 4.745-18 3 6.839-20 1 10.062-22 0.05 9.015
3.11.2 Benchmark results
Using respectively the CUR and NEN (Stress dependent) rules and a minimum layer thicknessof 0.6 m, the interpretation of both CPT bm3-11a and bm3-11b leads to the soil profiles givenin Table 3.20 and Table 3.21.
Table 3.20: Interpretation of CPT-GEF file “bm3-11a”using CUR rule
Top level [m NAP] Material name1 Sand, slightly silty, moderate-5 Sand, very silty, loose-6.8 Loam, very sandy, stiff-10.4 Clay, slightly sandy, moderate-13.4 Clay, clean, weak-19.4 Peat, moderate preloaded, moderate
Deltares 43 of 136
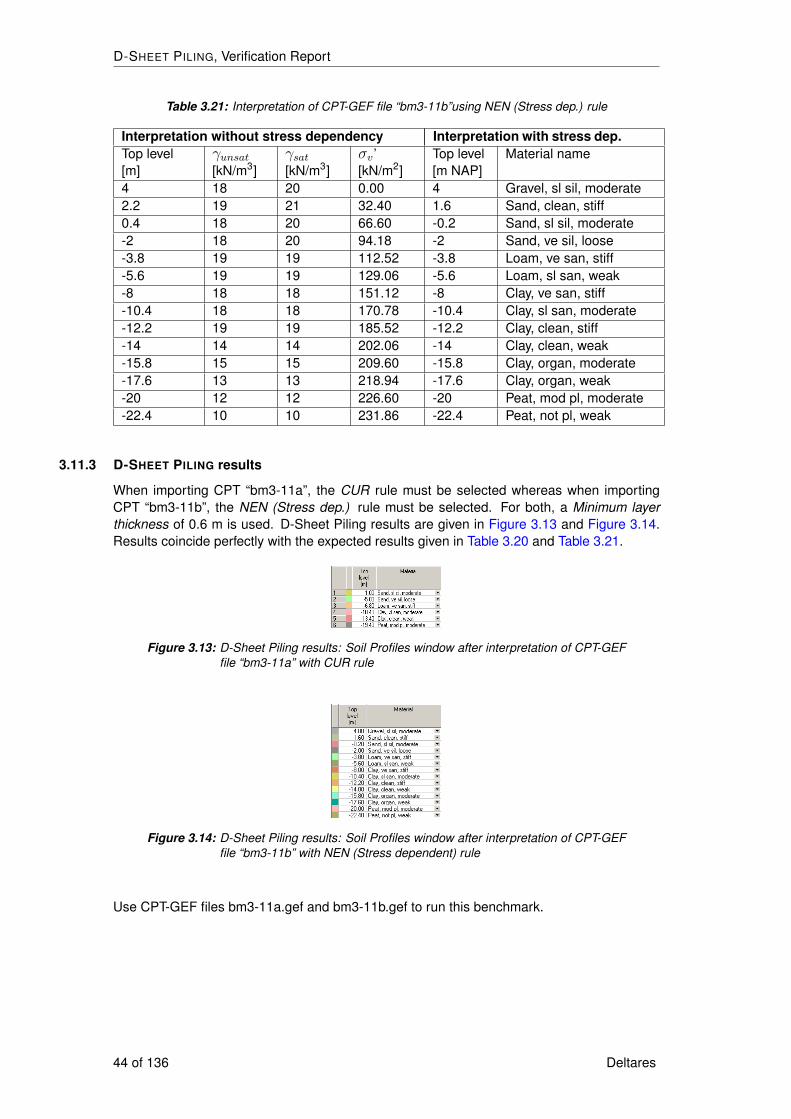
D-SHEET PILING, Verification Report
Table 3.21: Interpretation of CPT-GEF file “bm3-11b”using NEN (Stress dep.) rule
Interpretation without stress dependency Interpretation with stress dep.Top level[m]
γunsat[kN/m3]
γsat[kN/m3]
σv ’[kN/m2]
Top level[m NAP]
Material name
4 18 20 0.00 4 Gravel, sl sil, moderate2.2 19 21 32.40 1.6 Sand, clean, stiff0.4 18 20 66.60 -0.2 Sand, sl sil, moderate-2 18 20 94.18 -2 Sand, ve sil, loose-3.8 19 19 112.52 -3.8 Loam, ve san, stiff-5.6 19 19 129.06 -5.6 Loam, sl san, weak-8 18 18 151.12 -8 Clay, ve san, stiff-10.4 18 18 170.78 -10.4 Clay, sl san, moderate-12.2 19 19 185.52 -12.2 Clay, clean, stiff-14 14 14 202.06 -14 Clay, clean, weak-15.8 15 15 209.60 -15.8 Clay, organ, moderate-17.6 13 13 218.94 -17.6 Clay, organ, weak-20 12 12 226.60 -20 Peat, mod pl, moderate-22.4 10 10 231.86 -22.4 Peat, not pl, weak
3.11.3 D-SHEET PILING results
When importing CPT “bm3-11a”, the CUR rule must be selected whereas when importingCPT “bm3-11b”, the NEN (Stress dep.) rule must be selected. For both, a Minimum layerthickness of 0.6 m is used. D-Sheet Piling results are given in Figure 3.13 and Figure 3.14.Results coincide perfectly with the expected results given in Table 3.20 and Table 3.21.
Figure 3.13: D-Sheet Piling results: Soil Profiles window after interpretation of CPT-GEFfile “bm3-11a” with CUR rule
Figure 3.14: D-Sheet Piling results: Soil Profiles window after interpretation of CPT-GEFfile “bm3-11b” with NEN (Stress dependent) rule
Use CPT-GEF files bm3-11a.gef and bm3-11b.gef to run this benchmark.
44 of 136 Deltares
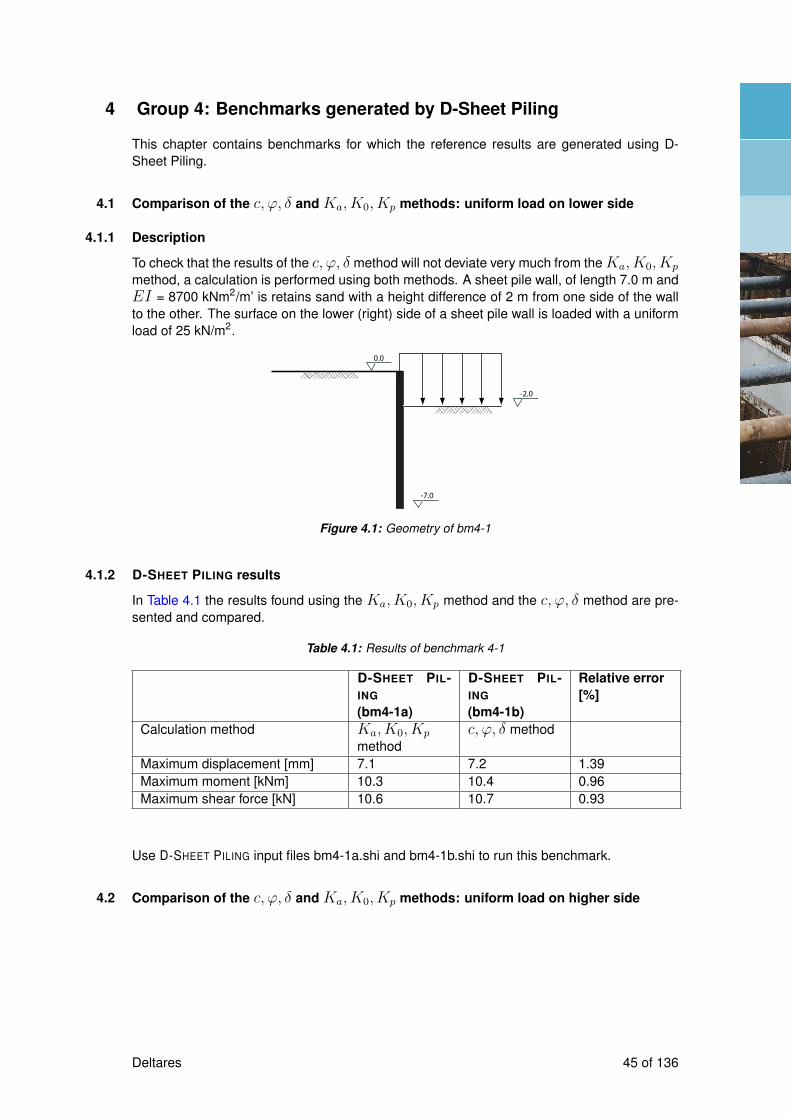
4 Group 4: Benchmarks generated by D-Sheet Piling
This chapter contains benchmarks for which the reference results are generated using D-Sheet Piling.
4.1 Comparison of the c, ϕ, δ and Ka, K0, Kp methods: uniform load on lower side
4.1.1 Description
To check that the results of the c, ϕ, δ method will not deviate very much from theKa, K0, Kp
method, a calculation is performed using both methods. A sheet pile wall, of length 7.0 m andEI = 8700 kNm2/m’ is retains sand with a height difference of 2 m from one side of the wallto the other. The surface on the lower (right) side of a sheet pile wall is loaded with a uniformload of 25 kN/m2.
-7.0
0.0
-2.0
Figure 4.1: Geometry of bm4-1
4.1.2 D-SHEET PILING results
In Table 4.1 the results found using the Ka, K0, Kp method and the c, ϕ, δ method are pre-sented and compared.
Table 4.1: Results of benchmark 4-1
D-SHEET PIL-ING
(bm4-1a)
D-SHEET PIL-ING
(bm4-1b)
Relative error[%]
Calculation method Ka, K0, Kp
methodc, ϕ, δ method
Maximum displacement [mm] 7.1 7.2 1.39Maximum moment [kNm] 10.3 10.4 0.96Maximum shear force [kN] 10.6 10.7 0.93
Use D-SHEET PILING input files bm4-1a.shi and bm4-1b.shi to run this benchmark.
4.2 Comparison of the c, ϕ, δ and Ka, K0, Kp methods: uniform load on higher side
Deltares 45 of 136
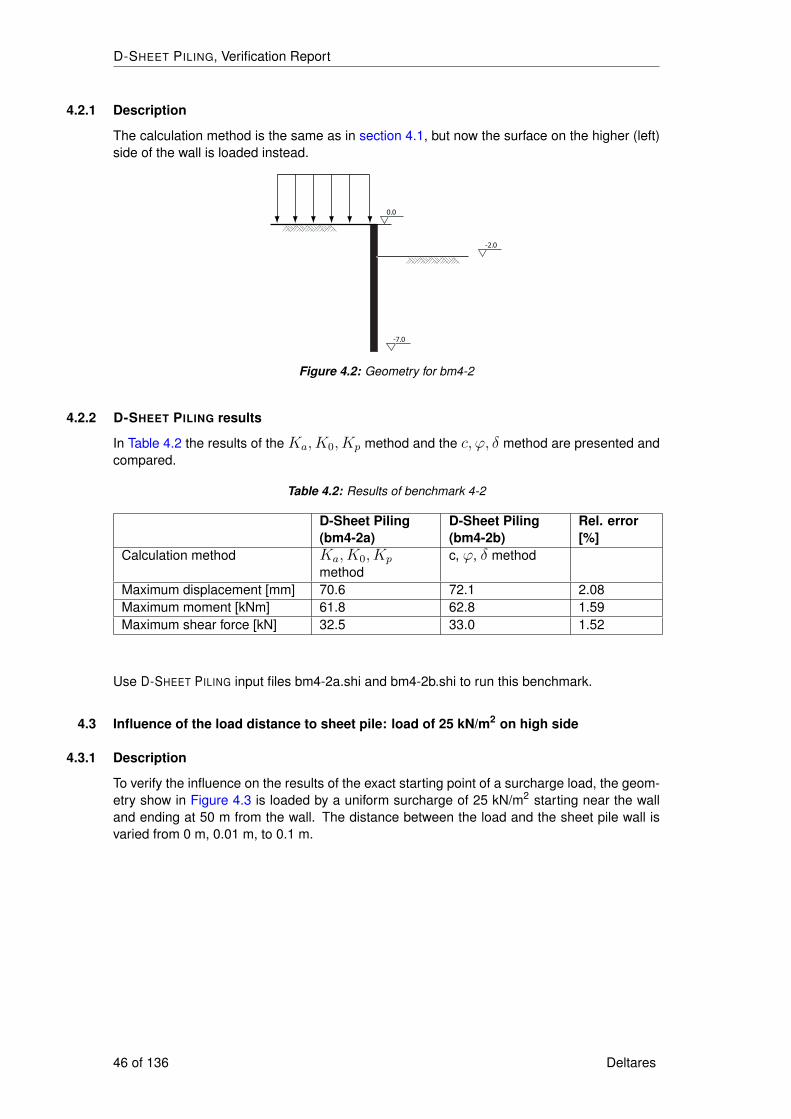
D-SHEET PILING, Verification Report
4.2.1 Description
The calculation method is the same as in section 4.1, but now the surface on the higher (left)side of the wall is loaded instead.
-7.0
0.0
-2.0
Figure 4.2: Geometry for bm4-2
4.2.2 D-SHEET PILING results
In Table 4.2 the results of the Ka, K0, Kp method and the c, ϕ, δ method are presented andcompared.
Table 4.2: Results of benchmark 4-2
D-Sheet Piling(bm4-2a)
D-Sheet Piling(bm4-2b)
Rel. error[%]
Calculation method Ka, K0, Kp
methodc, ϕ, δ method
Maximum displacement [mm] 70.6 72.1 2.08Maximum moment [kNm] 61.8 62.8 1.59Maximum shear force [kN] 32.5 33.0 1.52
Use D-SHEET PILING input files bm4-2a.shi and bm4-2b.shi to run this benchmark.
4.3 Influence of the load distance to sheet pile: load of 25 kN/m2 on high side
4.3.1 Description
To verify the influence on the results of the exact starting point of a surcharge load, the geom-etry show in Figure 4.3 is loaded by a uniform surcharge of 25 kN/m2 starting near the walland ending at 50 m from the wall. The distance between the load and the sheet pile wall isvaried from 0 m, 0.01 m, to 0.1 m.
46 of 136 Deltares
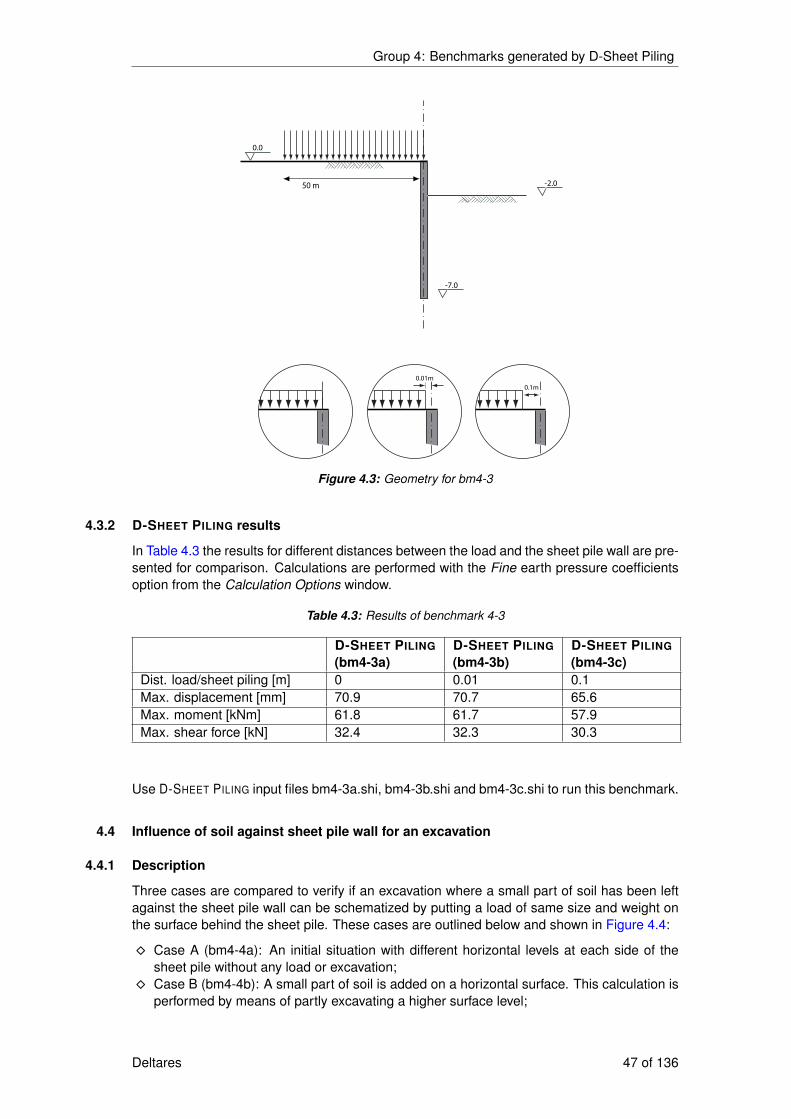
Group 4: Benchmarks generated by D-Sheet Piling
-7.0
0.0
-2.050 m
0.1m
0.01m
Figure 4.3: Geometry for bm4-3
4.3.2 D-SHEET PILING results
In Table 4.3 the results for different distances between the load and the sheet pile wall are pre-sented for comparison. Calculations are performed with the Fine earth pressure coefficientsoption from the Calculation Options window.
Table 4.3: Results of benchmark 4-3
D-SHEET PILING
(bm4-3a)D-SHEET PILING
(bm4-3b)D-SHEET PILING
(bm4-3c)Dist. load/sheet piling [m] 0 0.01 0.1Max. displacement [mm] 70.9 70.7 65.6Max. moment [kNm] 61.8 61.7 57.9Max. shear force [kN] 32.4 32.3 30.3
Use D-SHEET PILING input files bm4-3a.shi, bm4-3b.shi and bm4-3c.shi to run this benchmark.
4.4 Influence of soil against sheet pile wall for an excavation
4.4.1 Description
Three cases are compared to verify if an excavation where a small part of soil has been leftagainst the sheet pile wall can be schematized by putting a load of same size and weight onthe surface behind the sheet pile. These cases are outlined below and shown in Figure 4.4:
� Case A (bm4-4a): An initial situation with different horizontal levels at each side of thesheet pile without any load or excavation;
� Case B (bm4-4b): A small part of soil is added on a horizontal surface. This calculation isperformed by means of partly excavating a higher surface level;
Deltares 47 of 136
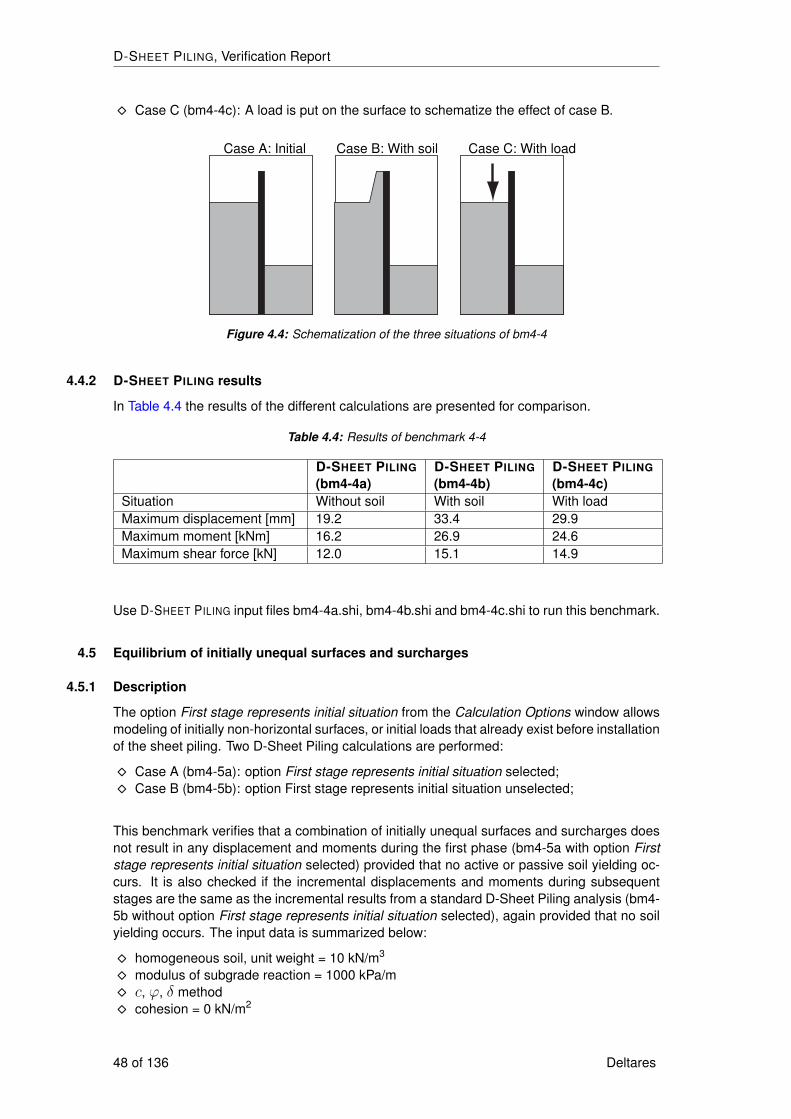
D-SHEET PILING, Verification Report
� Case C (bm4-4c): A load is put on the surface to schematize the effect of case B.
Case A: Initial Case B: With soil Case C: With load
Figure 4.4: Schematization of the three situations of bm4-4
4.4.2 D-SHEET PILING results
In Table 4.4 the results of the different calculations are presented for comparison.
Table 4.4: Results of benchmark 4-4
D-SHEET PILING
(bm4-4a)D-SHEET PILING
(bm4-4b)D-SHEET PILING
(bm4-4c)Situation Without soil With soil With loadMaximum displacement [mm] 19.2 33.4 29.9Maximum moment [kNm] 16.2 26.9 24.6Maximum shear force [kN] 12.0 15.1 14.9
Use D-SHEET PILING input files bm4-4a.shi, bm4-4b.shi and bm4-4c.shi to run this benchmark.
4.5 Equilibrium of initially unequal surfaces and surcharges
4.5.1 Description
The option First stage represents initial situation from the Calculation Options window allowsmodeling of initially non-horizontal surfaces, or initial loads that already exist before installationof the sheet piling. Two D-Sheet Piling calculations are performed:
� Case A (bm4-5a): option First stage represents initial situation selected;� Case B (bm4-5b): option First stage represents initial situation unselected;
This benchmark verifies that a combination of initially unequal surfaces and surcharges doesnot result in any displacement and moments during the first phase (bm4-5a with option Firststage represents initial situation selected) provided that no active or passive soil yielding oc-curs. It is also checked if the incremental displacements and moments during subsequentstages are the same as the incremental results from a standard D-Sheet Piling analysis (bm4-5b without option First stage represents initial situation selected), again provided that no soilyielding occurs. The input data is summarized below:
� homogeneous soil, unit weight = 10 kN/m3
� modulus of subgrade reaction = 1000 kPa/m� c, ϕ, δ method� cohesion = 0 kN/m2
48 of 136 Deltares

Group 4: Benchmarks generated by D-Sheet Piling
� friction angle = 30◦
� sheet piling length = 21 m� flexural stiffness of sheet piling = 4.1370× 10⁸ kNm2/m’� phreatic surface located at -100 m
The loading is modeled as follows:
� Phase 1: On the left of the sheet pile wall is a surface higher than the top of the wall,comparable to a surcharge of 10 kN/m. On the right hand side of the sheet pile wall aninitial surcharge of 20 kN/m.
� Phase 2: The surcharge on the right hand side is reduced to 10 kN/m. The non-horizontalsurface on the left-hand side is replaced by a surface load with equal weight.
� Phase 3: An excavation of 1 m on the right hand side.
10
10
10 10
10 20
Figure 4.5: Loading during phases 1, 2 and 3
4.5.2 D-SHEET PILING results
The results of Table 4.5 show that no displacement occurs during the initial stage of bm4-3a. Moreover displacements and moments calculated using the option First stage representsinitial situation (bm4-5b) are equal to the incremental displacements and moments calculatedfrom a standard D-Sheet Piling calculation (bm4-5a), i.e. without option First stage representsinitial situation.
Deltares 49 of 136

D-SHEET PILING, Verification Report
Table 4.5: Results of benchmark 4-5 – Maximum displacements
D-SHEET PILING
(bm4-5a)D-Sheet Piling(bm4-5b)
Rel. error
[mm] Brut [mm] Incremental [mm] [%]Phase 1 0 -4.1 -4.1 –(-4.1) = 0 0.00Phase 2 4.1 0 0 –(-4.1) = 4.1 0.00Phase 3 7.8 3.2 3.2 –(-4.1) = 7.3 6.41
Use D-SHEET PILING input files bm4-5a.shi and bm4-5b.shi to run this benchmark
4.6 Comparison of secant and tangent modulus of subgrade reaction
4.6.1 Description
This benchmark evaluates the horizontal displacement of a rigid sheet pile wall (lengthL = 20 m,stiffness EI = 9 × 10⁸ kNm2/m) loaded with a horizontal line load of F = 160 kN/m appliedto the centre of the wall. The stress-displacement diagram used has three branches, withintersections at 50 %, 80 % and 100 % of (Kp - Ka) × σV as illustrated in Figure 4.6. Thestiffness of the different branches is defined employing two kinds of modulus of subgradereaction:
� secant modulus (from CUR 166) in benchmark bm4-6a,� tangent modulus (D-Sheet Piling Classic) in benchmark bm4-6b.
0
k2CUR k3
CUR
k1MSheet
k2MSheet
k3MSheet
k1CUR
50% 80% 100%
kp σv
ka σv
horizontal soil stress σH
horizontal displacement
Figure 4.6: Stress-displacement diagram with three branches according to CUR 166 andD-Sheet Piling Classic
According to Figure 4.6, the relations that link the secant moduli k1, k2 and k3 from CUR 166to the tangent moduli as used In D-SHEET PILING are:
50 of 136 Deltares

Group 4: Benchmarks generated by D-Sheet Piling
kD−Sheet P iling1 = kCUR1 (4.1)
kD−Sheet P iling2 =0.8− 0.5
0.8kCUR2
− 0.5kCUR1
(4.2)
kD−Sheet P iling3 =1− 0.8
1kCUR3
− 0.8kCUR2
(4.3)
According to Table 3.3 of CUR 166 procedure CUR (2005), the stress-displacement diagramof a soft peat is defined with the following lowest values of modulus of subgrade reaction:
� kCUR1 = 1000 kN/m3
� kCUR2 = 500 kN/m3
� kCUR3 = 250 kN/m3
So, the conversion to tangent moduli as used by D-Sheet Piling leads to:
� kD−Sheet P iling1 = 1000 kN/m3
� kD−Sheet P iling2 = 272.727272. . . kN/m3
� kD−Sheet P iling3 = 83.333333. . . kN/m3
The following values are chosen:
� γ = 0 kN/m3 c = 2 kN/m2
� Ka = K0 = 0 and Kp = 4
As the pile is supposed to be rigid, the distribution of the horizontal stresses along the pile isuniform and equal to:
σH = F/L = 160/20 = 8 kN/m2 (4.4)
As the unit weight of the soil is zero, the initial vertical stress is nil. This leads to:
σa = Kaσv − 2c√Ka = 0 (4.5)
σ0 = K0σv = 0 (4.6)
σp = Kpσv + 2c√Kp = 8 kN/m2. (4.7)
As the initial horizontal stress is equal to the active stress and the final horizontal stress isequal to the passive stress, the three branches in the stress-displacement diagram are usedin the calculations.
4.6.2 D-SHEET PILING results
For D-Sheet Piling calculation with secant moduli (bm4-6a), the option Secant (CUR 166)must be selected in the Soil Materials window. From Table 3.3 of CUR 166, the soft peat isselected. For D-Sheet Piling calculation with tangent moduli (bm4-6b), the option Tangent(D-Sheet Piling Classic) must be selected in the Soil Materials window.
Deltares 51 of 136
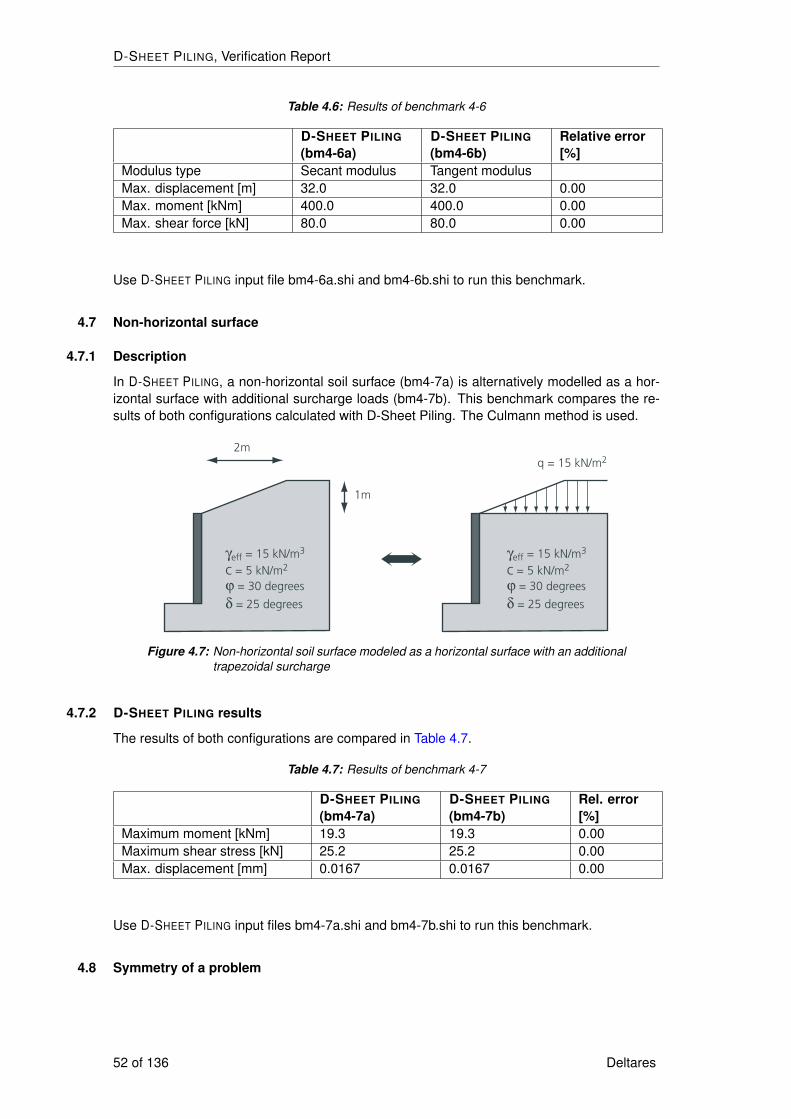
D-SHEET PILING, Verification Report
Table 4.6: Results of benchmark 4-6
D-SHEET PILING
(bm4-6a)D-SHEET PILING
(bm4-6b)Relative error[%]
Modulus type Secant modulus Tangent modulusMax. displacement [m] 32.0 32.0 0.00Max. moment [kNm] 400.0 400.0 0.00Max. shear force [kN] 80.0 80.0 0.00
Use D-SHEET PILING input file bm4-6a.shi and bm4-6b.shi to run this benchmark.
4.7 Non-horizontal surface
4.7.1 Description
In D-SHEET PILING, a non-horizontal soil surface (bm4-7a) is alternatively modelled as a hor-izontal surface with additional surcharge loads (bm4-7b). This benchmark compares the re-sults of both configurations calculated with D-Sheet Piling. The Culmann method is used.
2m
1m
γeff = 15 kN/m3
ϕ = 30 degrees
δ = 25 degrees
c = 5 kN/m2
γeff = 15 kN/m3
q = 15 kN/m2
ϕ = 30 degrees
δ = 25 degrees
c = 5 kN/m2
Figure 4.7: Non-horizontal soil surface modeled as a horizontal surface with an additionaltrapezoidal surcharge
4.7.2 D-SHEET PILING results
The results of both configurations are compared in Table 4.7.
Table 4.7: Results of benchmark 4-7
D-SHEET PILING
(bm4-7a)D-SHEET PILING
(bm4-7b)Rel. error[%]
Maximum moment [kNm] 19.3 19.3 0.00Maximum shear stress [kN] 25.2 25.2 0.00Max. displacement [mm] 0.0167 0.0167 0.00
Use D-SHEET PILING input files bm4-7a.shi and bm4-7b.shi to run this benchmark.
4.8 Symmetry of a problem
52 of 136 Deltares
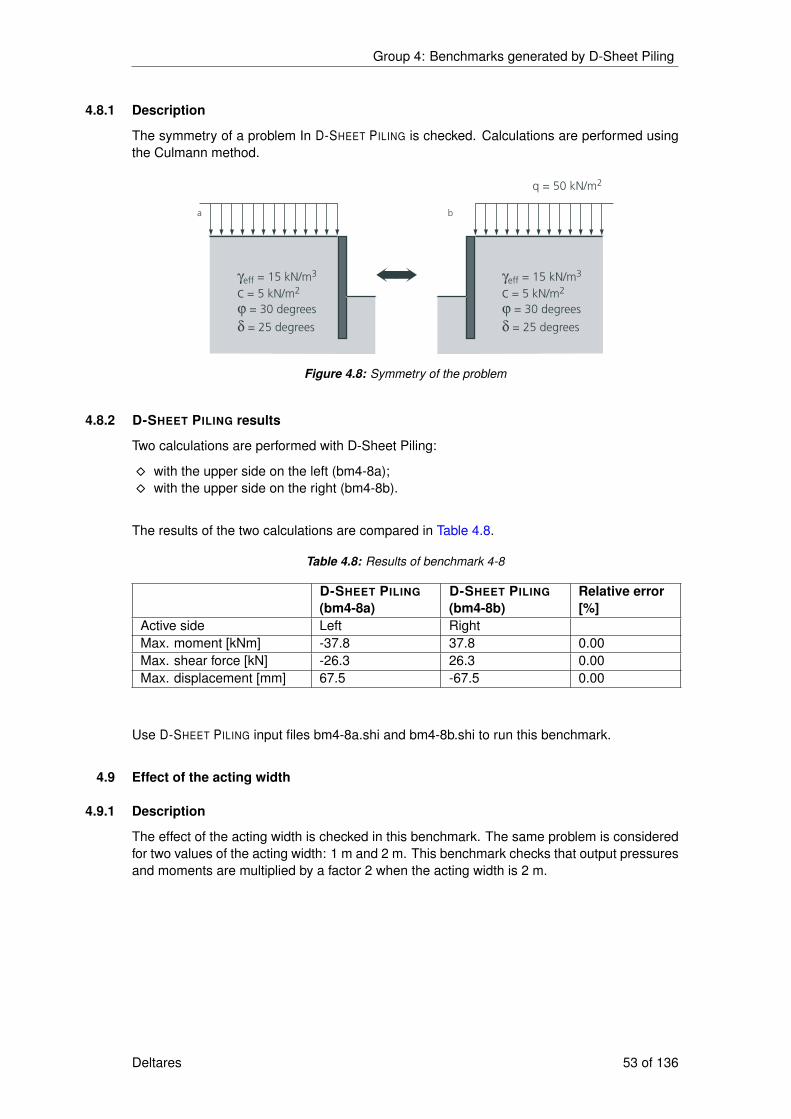
Group 4: Benchmarks generated by D-Sheet Piling
4.8.1 Description
The symmetry of a problem In D-SHEET PILING is checked. Calculations are performed usingthe Culmann method.
γeff = 15 kN/m3
q = 50 kN/m2
ϕ = 30 degrees
δ = 25 degrees
c = 5 kN/m2
γeff = 15 kN/m3
ϕ = 30 degrees
δ = 25 degrees
c = 5 kN/m2
a b
Figure 4.8: Symmetry of the problem
4.8.2 D-SHEET PILING results
Two calculations are performed with D-Sheet Piling:
� with the upper side on the left (bm4-8a);� with the upper side on the right (bm4-8b).
The results of the two calculations are compared in Table 4.8.
Table 4.8: Results of benchmark 4-8
D-SHEET PILING
(bm4-8a)D-SHEET PILING
(bm4-8b)Relative error[%]
Active side Left RightMax. moment [kNm] -37.8 37.8 0.00Max. shear force [kN] -26.3 26.3 0.00Max. displacement [mm] 67.5 -67.5 0.00
Use D-SHEET PILING input files bm4-8a.shi and bm4-8b.shi to run this benchmark.
4.9 Effect of the acting width
4.9.1 Description
The effect of the acting width is checked in this benchmark. The same problem is consideredfor two values of the acting width: 1 m and 2 m. This benchmark checks that output pressuresand moments are multiplied by a factor 2 when the acting width is 2 m.
Deltares 53 of 136

D-SHEET PILING, Verification Report
4.9.2 D-SHEET PILING results
The normal force must be entered as a total force (in kN). As the normal force per runningmeter is set equal to 5 kN/m’, then the input normal forces are 5 kN and 10 kN respectivelyfor the benchmarks with an acting width of 1 and 2 m. The results of these two analyses arecompared in Table 4.9.
Table 4.9: Results of benchmark 4-9
D-SHEET PILING
(bm4-9a)D-SHEET PILING
(bm4-9b)Factor
Acting width [m] 1 2Maximum displacement [mm] -4.3 -4.3 1.00Maximum moment [kNm] -29.6 -59.1 2.00Maximum shear force [kN] -27.3 -54.5 2.00Vertical force balance results:Vertical force active [kN] -44.94 -89.87 2.00Vertical force passive [kN] 28.65 57.31 2.00Vertical anchor force [kN] -2.90 -5.80 2.00Normal force on sheet piling [kN] -5.00 -10.00 2.00Resulting vertical force [kN] -24.19 -48.36 2.00Vertical force capacity [kN] 102.00 102.00 1.00Soil collapse results:Horizontal effective pressure (left) [kN] 58.3 116.6 2.00Horizontal effective pressure (right) [kN] 91.5 182.9 2.00Maximum passive effective resistance [kN] 77.31 154.63 2.00Mobilized passive effective resistance [kN] 58.32 116.63 2.00Percentage mobilized resistance [%] 75.4 75.4 1.00Maximum passive moment [kNm] 308.19 616.38 2.00Mobilized passive moment [kNm] 227.83 455.66 2.00Percentage mobilized moment [%] 73.9 73.9 1.00“Allowable Anchor Force” results [kN]Ea: active pressure sheet pile (with loads) 91.438 182.876 2.00Ea: active pressure sheet pile (no loads) 87.410 174.819 2.00Er: horiz. pressure slide plane (with loads) 10.735 21.470 2.00Er: horiz. pressure slide plane (no loads) 10.427 20.854 2.00E0: active pressure anchor wall 23.410 46.820 2.00Ec: cohesion along slide plane 2.989 5.977 2.00Allowable anchor force (with loads) 60.417 120.835 2.00Allowable anchor force (no loads) 56.689 113.378 2.00Calculated anchor force 33.262 66.525 2.00
Use D-SHEET PILING input files bm4-9a.shi and bm4-9b.shi to run this benchmark.
4.10 Effect of the shell factor
4.10.1 Description
The effect of the shell factor inputted in the Soil Materials window is checked in this bench-mark. Verification is made on a 3-layered soil profile. Two D-Sheet Piling files are used:
� bm4-10a: a shell factor is inputted (see Table 4.10);� bm4-10b: no shell factor used but the soil properties (K and k) are modified (see Ta-
54 of 136 Deltares

Group 4: Benchmarks generated by D-Sheet Piling
ble 4.11)
Benchmarks 4-10a and 4-10b should give the same results.
Table 4.10: Soil properties for bm4-10a
Soil parameter Layer 1 Layer 2 Layer 3Unsaturated weight [kN/m3] γunsat 14 15 17Saturated weight [kN/m3] γsat 14 15 20Cohesion [kN/m2] c 2 5 0Friction angle [◦] ϕ 30 30 30Delta friction angle [◦] δ 0 0 0Shell factor [-] s 1.5 2 2.5Earth pressure coefficients acc. to Ka 0.333 0.333 0.333Müller-Breslau [-] K0 0.5 0.5 0.5
Kp 3 3 3Modulus of subgrade reaction [kN/m3] kh;0 5000 10000 15000
kh;1 2000 6000 12000kh;2 800 4000 6000kh;3 500 2000 3000kh;4 100 1000 1800
Table 4.11: Modified soil properties for bm4-10b
Soil parameter Layer 1 Layer 2 Layer 3Earth pressure coefficients acc. to Ka 0.222 0.167 0.133Müller-Breslau [-] K0 0.5 0.5 0.5
Kp 4.5 6 7.5Modulus of subgrade reaction [kN/m3] kh;0 7500 20000 37500
kh;1 3000 12000 30000kh;2 1200 8000 15000kh;3 750 4000 7500kh;4 150 2000 4500
4.10.2 D-SHEET PILING results
Benchmarks 4-10a and 4-10b give almost the same results (see Table 4.12).
Table 4.12: Results of benchmark 4-10
Stage D-SHEET PILING
(bm4-10a)D-SHEET PILING
(bm4-10b)Rel. error[%]
1 Max. displacement [mm] 10.7 10.6 0.94Max. moment [kNm] 27.6 27.4 0.73Max. shear force [kN] 14.5 14.4 0.69
2 Max. displacement [mm] 492.9 482.3 2.20Max. moment [kNm] 321.3 320.5 0.25Max. shear force [kN] 253.1 251.9 0.48
3 Max. displacement [mm] 493.1 482.6 2.18Max. moment [kNm] 319.7 319.0 0.22Max. shear force [kN] 251.3 250.0 0.52
Deltares 55 of 136

D-SHEET PILING, Verification Report
Use D-SHEET PILING input files bm4-10a.shi and bm4-10b.shi to run this benchmark.
4.11 Functioning of pre-tensioned anchors
4.11.1 Description
The functioning of a pre-tensioned anchor is checked by comparing the results of two cases:
� Case A: a beam is reinforced with an anchor at the middle, pre-tensioned with a forceFpt = 200 kN/m and inclined with an angle of β = 60◦(Figure 4.9).
� Case B: the same beam without reinforcement is loaded with an horizontal force ofF = FPT × cos β = 100 kN/m to model the pre-tensioning (Figure 4.9).
Figure 4.9: Anchor with pre-tensioning
In both cases, three horizontal loads of respectively 50, 100 and 200 kN are applied at threeconsecutive stages, at the middle of the beam.
4.11.2 D-SHEET PILING results
Both benchmarks give exactly the same results as shown in Table 4.13.
56 of 136 Deltares
Group 4: Benchmarks generated by D-Sheet Piling
Table 4.13: Results of benchmark 4-11
Stage D-SHEET PILING
(bm4-11a)D-SHEET PILING
(bm4-11b)Relative er-ror[%]
1 Displacement [mm] -20.8 -20.8 0.00Moment [kNm] -30.0 -30.0 0.00Shear force [kN] 50.0 50.0 0.00Mob. perc.resistance
[%] 49.7 49.7 0.00
2 Displacement [mm] -10.4 -10.4 0.00Moment [kNm] -15.0 -15.0 0.00Shear force [kN] 25.0 25.0 0.00Mob. perc.resistance
[%] 49.4 49.4 0.00
3 Displacement [mm] 0.0 0.0 0.00Moment [kNm] 0.0 0.0 0.00Shear force [kN] 0.0 0.0 0.00Mob. perc.resistance
[%] 49.1 49.1 0.00
4 Displacement [mm] 20.8 20.8 0.00Moment [kNm] 30.0 30.0 0.00Shear force [kN] -50.0 -50.0 0.00Mob. perc.resistance
[%] 49.7 49.7 0.00
Use D-SHEET PILING input files bm4-11a.shi and bm4-11b.shi to run this benchmark.
4.12 Functioning of pre-compressed strut
4.12.1 Description
The data for this problem are the same as given in section 4.11, but the anchor is replaced bya strut (with the same characteristics).
4.12.2 D-SHEET PILING results
The results of both D-Sheet Piling calculations are the same as shown in Table 4.14.
Deltares 57 of 136
D-SHEET PILING, Verification Report
Table 4.14: Results of benchmark 4-12
Stage D-SHEET PILING
(bm4-12a)D-SHEET PILING
(bm4-12b)Rel. error[%]
1 Displacement [mm] -20.8 -20.8 0.00Moment [kNm] -30.0 -30.0 0.00Shear force [kN] 50.0 50.0 0.00Mob. perc. resist. [%] 49.7 49.7 0.00
2 Displacement [mm] -10.4 -10.4 0.00Moment [kNm] -15.0 -15.0 0.00Shear force [kN] 25.0 25.0 0.00Mob. perc. resist. [%] 49.4 49.4 0.00
3 Displacement [mm] 0.0 0.0 0.00Moment [kNm] 0.0 0.0 0.00Shear force [kN] 0.0 0.0 0.00Mob. perc. resist. [%] 49.1 49.1 0.00
4 Displacement [mm] 20.8 20.8 0.00Moment [kNm] 30.0 30.0 0.00Shear force [kN] -50.0 -50.0 0.00Mob. perc. resist. [%] 49.7 49.7 0.00
Use D-SHEET PILING input files bm4-12a.shi and bm4-12b.shi to run this benchmark.
4.13 Reduction of delta friction angles according to CUR 166
4.13.1 Description
The functioning of the option “Reduce delta friction angles according to CUR” available in theCalculation Options window is checked in this benchmark. Verification is made on a 3-layeredsoil profile. The soil properties are given in Table 4.15. Three D-SHEET PILING files are used:
� bm4-13a: the option is marked;� bm4-13b: the option is unmarked and the inputted delta friction angles are from reduced
manually (see last row of Table 4.15);� bm4-13c: the option is unmarked.
Benchmarks 4-13a and 4-13b should give the same results but different from bm4-13c.
Table 4.15: Soil properties (bm4-13)
Layer 1 Layer 2 Layer 3Unsaturated weight [kN/m3] 15 15 15Saturated weight [kN/m3] 15 15 15Cohesion [kN/m2] 15 15 15Friction angle [◦] 30 35 38Delta friction angle [◦] 24 33 36Reduced delta friction angle [◦] 24 16.6 17.2
For benchmark 4-15b, the inputted delta friction angles are reduced according to CUR:
� For layer 1, as ϕ = 30◦, no change is made to δ;� For layer 2, as 30< ϕ = 35◦, δ is reduced to 16.6◦;
58 of 136 Deltares
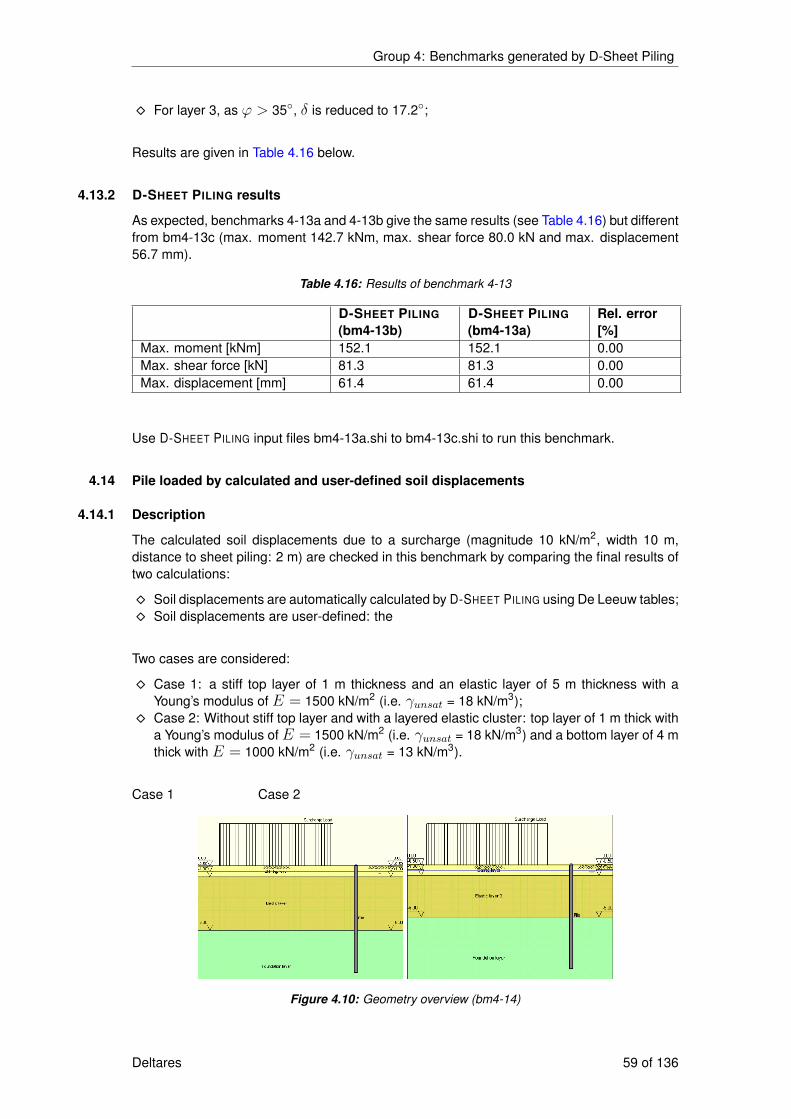
Group 4: Benchmarks generated by D-Sheet Piling
� For layer 3, as ϕ > 35◦, δ is reduced to 17.2◦;
Results are given in Table 4.16 below.
4.13.2 D-SHEET PILING results
As expected, benchmarks 4-13a and 4-13b give the same results (see Table 4.16) but differentfrom bm4-13c (max. moment 142.7 kNm, max. shear force 80.0 kN and max. displacement56.7 mm).
Table 4.16: Results of benchmark 4-13
D-SHEET PILING
(bm4-13b)D-SHEET PILING
(bm4-13a)Rel. error[%]
Max. moment [kNm] 152.1 152.1 0.00Max. shear force [kN] 81.3 81.3 0.00Max. displacement [mm] 61.4 61.4 0.00
Use D-SHEET PILING input files bm4-13a.shi to bm4-13c.shi to run this benchmark.
4.14 Pile loaded by calculated and user-defined soil displacements
4.14.1 Description
The calculated soil displacements due to a surcharge (magnitude 10 kN/m2, width 10 m,distance to sheet piling: 2 m) are checked in this benchmark by comparing the final results oftwo calculations:
� Soil displacements are automatically calculated by D-SHEET PILING using De Leeuw tables;� Soil displacements are user-defined: the
Two cases are considered:
� Case 1: a stiff top layer of 1 m thickness and an elastic layer of 5 m thickness with aYoung’s modulus of E = 1500 kN/m2 (i.e. γunsat = 18 kN/m3);
� Case 2: Without stiff top layer and with a layered elastic cluster: top layer of 1 m thick witha Young’s modulus ofE = 1500 kN/m2 (i.e. γunsat = 18 kN/m3) and a bottom layer of 4 mthick with E = 1000 kN/m2 (i.e. γunsat = 13 kN/m3).
Case 1 Case 2
Figure 4.10: Geometry overview (bm4-14)
Deltares 59 of 136
D-SHEET PILING, Verification Report
4.14.2 D-SHEET PILING results (Calculated soil displacements)
Two D-SHEET PILING calculations corresponding to both cases are performed:
� bm4-14a modelled case 1;� bm4-14b modelled case 2.
The soil properties are given in Table 4.17. The earth pressure coefficients are automaticallycalculated by D-SHEET PILING using Brinch-Hansen theory, at different depths. The outputvalues of the passive earth pressure coefficient and the fictive cohesion are given in Table 4.18for case 1 and Table 4.19 for case 2 and are used as input values for the calculation usingUser-defined soil displacements (see below).
Table 4.17: Soil properties for bm4-14a and bm4-14b using Calculated soil displacementsoption
Stiff Elastic Elastic 2 FoundationUnsaturated weight [kN/m3] 18.5 18 13 17Saturated weight [kN/m3] 20 18 13 20Cohesion [kN/m2] 0 10 5 5Friction angle [◦] 30 25 20 25
4.14.3 D-SHEET PILING results (User-defined soil displacements)
Two D-SHEET PILING calculations (bm4-14c and bm4-14d) corresponding to both cases (re-spectively case 1 and case 2) are performed. The soil properties are given in both tablesbelow. Elastic layer is divided into sub-layers of 1 m thickness.
Table 4.18: Input values for bm4-14c using User-defined soil displacements option (= out-put values of bm4-14a)
Layer Top level Soil displac. Horiz. modulus Fictivecohesion
Kp
Top Bottom[m NAP] [mm] [kN/m3] [kN/m3] [kN/m2] [-]
Stiff 0 0 105 105 0.00 4.75Elastic -1 0 105 1985.40 42.57 5.04Elastic -2 190.3 1985.40 1817.97 49.66 6.05Elastic -3 295.2 1817.97 1839.87 52.65 6.72Elastic -4 298.6 1839.87 2319.19 54.23 7.19Elastic -5 202.7 2319.19 105 55.18 7.53Foundation -6 0 105 105 27.90 7.80Foundation -10 0 105 105 28.49 8.46
60 of 136 Deltares
Group 4: Benchmarks generated by D-Sheet Piling
Table 4.19: Input values for bm4-14d using User-defined soil displacements option (= out-put values of bm4-14b)
Layer Top level Soil displac. Horiz. modulus Fictivecohesion
Kp
Top Bottom[m NAP] [mm] [kN/m3] [kN/m3] [kN/m2] [-]
Elastic 0 622.4 131.98 567.90 15.54 3.29Elastic 2 -1 664.8 567.90 783.90 19.63 3.37Elastic 2 -2 649.8 783.90 960.47 22.30 3.95Elastic 2 -3 539.6 960.47 1379.20 23.37 4.31Elastic 2 -4 328.1 1379.20 105 23.91 4.56Foundation -5 0 105 105 27.59 7.53Foundation -10 0 105 105 28.49 8.46
Results of the comparison are given in Table 4.20. Correlation is very good.
Table 4.20: Results of benchmark 4-14
Case D-SHEET PILING
(Calculateddisplacements)
D-SHEET PILING
(User-defineddisplacements.)
Rel.error
File Result File Result [%]1 Max. moment [kNm] bm4-14a 525.13 bm4-14c 524.79 0.06
Max. shear force [kN] 383.04 383.17 0.05Max. displac. [mm] 217.14 217.04 0.05
2 Max. moment [kNm] bm4-14b 740.53 bm4-14d 740.42 0.01Max. shear force [kN] 385.51 385.44 0.03Max. displac. [mm] 455.13 455.16 0.02
Use D-SHEET PILING input files bm4-14a.shi to bm4-14d.shi to run this benchmark.
4.15 Loading by soil displacements – Comparison between single pile and sheet piling
4.15.1 Description
The functioning of a sheet piling loaded by user-defined soil displacements is checked bycomparing the results with those obtained in benchmark 4-14 (section 4.14) for a single pile.Two cases are considered (1 and 2) as described in section 4.14.
Deltares 61 of 136

D-SHEET PILING, Verification Report
4.15.2 D-SHEET PILING results
Results of the comparison are excellent as expected.
Table 4.21: Results of benchmark 4-15 – Loading by soil displacements
Case D-SHEET PILING
(Calculateddisplacements)
D-SHEET PILING
(User-defineddisplac.)
Rel.error
File Result File Result [%]1 Max. moment [kNm] bm4-14c 524.8 bm4-15a 524.8 0.00
Max. shear force [kN] 383.2 383.2 0.00Max. displac. [mm] 217.0 217.0 0.00
2 Max. moment [kNm] bm4-14d 740.4 bm4-15b 740.4 0.00Max. shear force [kN] 385.4 385.4 0.00Max. displac. [mm] 455.2 455.2 0.00
Use D-SHEET PILING input files bm4-15a.shi and bm4-15b.shi to run this benchmark.
4.16 Automatic determination of the favorable/unfavorable effect of loads
4.16.1 Description
The automatic determination of the favorable/unfavorable effect of loads (in case of verificationcalculation using partial factors) is checked in this benchmark. The same geometry and load-ing as benchmark 4-17a is used (section 4.17) except that the left side is always the passiveside. Moreover, the favorable/unfavorable effect of loads is different:
� Case A (bm4-16a): the option D-Sheet Piling determined is used in the different loadswindows;
� Case B (bm4-16b): loads on passive side are inputted as Favorable whereas loads onactive side are inputted as Unfavorable;
A verification calculation acc. to Eurocode is performed for DA 2 for both benchmarks 4-16aand 4-16b. Results are expected to be the same.
4.16.2 D-SHEET PILING results
62 of 136 Deltares
Group 4: Benchmarks generated by D-Sheet Piling
Table 4.22: Results of benchmark 4-16
Stage Results D-SHEET PILING
(bm4-16a)D-SHEET PILING
(bm4-16b)Rel. error[%]
1 Max. moment [kNm] 34.60 34.60 0.00Max. shear force [kN] 43.94 43.94 0.00Max. displac. [mm] 19.20 19.20 0.00Perc. mob. moment [%] 0.00 0.00 0.00Perc. mob. resist. [%] 14.96 14.96 0.00
2 Max. moment [kNm] 903.21 903.21 0.00Max. shear force [kN] 445.49 445.49 0.00Max. displac. [mm] 383.67 383.67 0.00Perc. mob. moment [%] 12.33 12.33 0.00Perc. mob. resist. [%] 22.33 22.33 0.00Anchor force [kN] 108.00 108.00 0.00
3 Max. moment [kNm] 513.73 513.73 0.00Max. shear force [kN] 260.02 260.02 0.00Max. displac. [mm] 298.37 298.37 0.00Perc. mob. moment [%] 58.45 58.45 0.00Perc. mob. resist. [%] 62.55 62.55 0.00Anchor force [kN] 61.79 61.79 0.00
Use D-SHEET PILING input files bm4-16a.shi and bm4-16b.shi to run this benchmark.
4.17 Verify Sheet Piling calculation acc. CUR 166 Method B (only last stage verified)
4.17.1 Description
The verification is made on an anchored sheet pile wall of 14 m using three stages. Temporaryand permanent loads are applied on left and right sides as shown in Table 4.23. The anchormodulus is Eanchor = 2.1× 10⁸ kPa.
Deltares 63 of 136
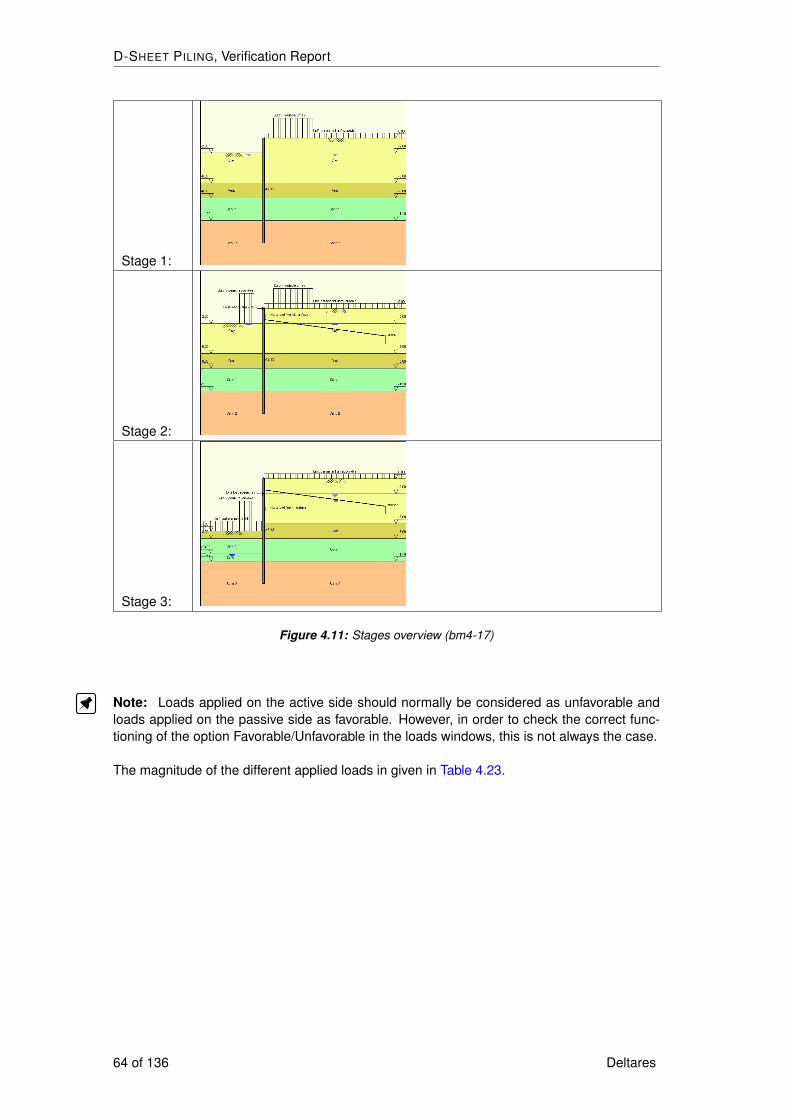
D-SHEET PILING, Verification Report
Stage 1:
Stage 2:
Stage 3:
Figure 4.11: Stages overview (bm4-17)
Note: Loads applied on the active side should normally be considered as unfavorable andloads applied on the passive side as favorable. However, in order to check the correct func-tioning of the option Favorable/Unfavorable in the loads windows, this is not always the case.
The magnitude of the different applied loads in given in Table 4.23.
64 of 136 Deltares

Group 4: Benchmarks generated by D-Sheet Piling
Table 4.23: Loads (bm4-17)
Type of load Magnitude Distanceor Level
Length Presentinstage. . .
[kN/m2] [m] [m] 1 2 3Uniform Variable Fav. 20 (left) x
Perm. Unfav. 10 (right) x x xSurcharge Variable Unfav. 40 2 8 x x
Perm. Fav. 60 2 3 x xHoriz. line Perm. Fav. 200 -2 x
Perm. Unfav. -100 -4 xVariable Fav. 150 0 xVariable Unfav. -300 -1 x
The ground and water levels of the different stages are given in Table 4.24. For stages 1 and3 the left side is inputted as passive side whereas for stage 2 it is the right side, in order tocheck the correct functioning of the changes of the water and ground levels.
Table 4.24: Ground and water levels (bm4-17)
Stage 1 Stage 2 Stage 3Ground level at left side GLleft -2 -2 -7Ground level at right side GLright 0 0 0Phreatic line at left side WLleft -2 -2 -10Phreatic line at right side WLright -2 -2 -2Passive side Right Left Left
The low representative values given in Table 4.25 are used as soil inputs.
Table 4.25: Soil properties for all stages (bm4-17)
Clay Peat Sand 1 Sand 2Top level [m NAP] 0 -6 -8 -11Unsaturated total unit weight [kN/m3] 15 10 17 17Saturated total unit weight [kN/m3] 16 11 19 19Cohesion [kN/m2] 12.5 5 0 0Friction angle [deg] 21 24.5 31 37Delta Friction angle [deg] 14 18 24 24Shell factor [-] 1 1 1 1Over-consolidationratio (OCR)
[-] 1 1 1 1
Grain type Fine Fine Fine FineModulus of subgradereaction
[kN/m3] 2000 800 10000 10000
Verification is performed for the three safety classes (I, II, III) applying the partial factors andlevel variations defined in the User Defined Partial Factors window (see Figure 4.12) on soilstrength (c, ϕ, δ and k), ground level, phreatic surface and the loads, only during the laststage. The multiplication factor for the anchor stiffness is 1.2.
Deltares 65 of 136
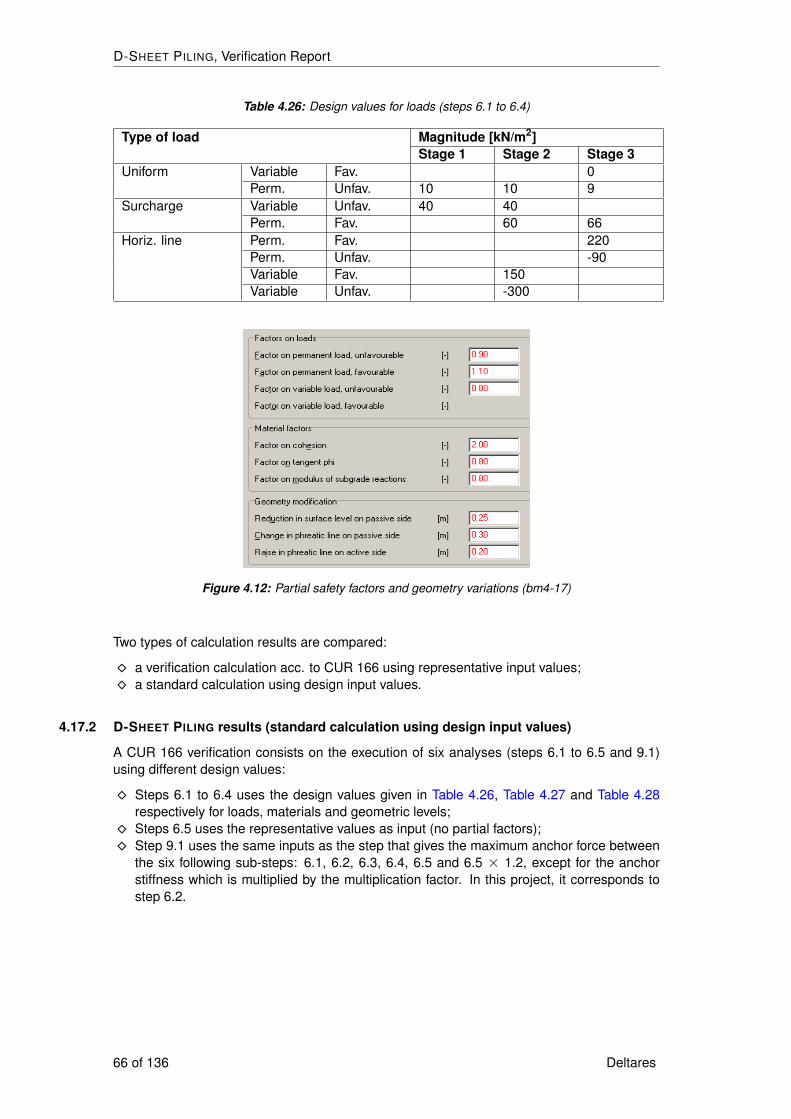
D-SHEET PILING, Verification Report
Table 4.26: Design values for loads (steps 6.1 to 6.4)
Type of load Magnitude [kN/m2]Stage 1 Stage 2 Stage 3
Uniform Variable Fav. 0Perm. Unfav. 10 10 9
Surcharge Variable Unfav. 40 40Perm. Fav. 60 66
Horiz. line Perm. Fav. 220Perm. Unfav. -90Variable Fav. 150Variable Unfav. -300
Figure 4.12: Partial safety factors and geometry variations (bm4-17)
Two types of calculation results are compared:
� a verification calculation acc. to CUR 166 using representative input values;� a standard calculation using design input values.
4.17.2 D-SHEET PILING results (standard calculation using design input values)
A CUR 166 verification consists on the execution of six analyses (steps 6.1 to 6.5 and 9.1)using different design values:
� Steps 6.1 to 6.4 uses the design values given in Table 4.26, Table 4.27 and Table 4.28respectively for loads, materials and geometric levels;
� Steps 6.5 uses the representative values as input (no partial factors);� Step 9.1 uses the same inputs as the step that gives the maximum anchor force between
the six following sub-steps: 6.1, 6.2, 6.3, 6.4, 6.5 and 6.5 × 1.2, except for the anchorstiffness which is multiplied by the multiplication factor. In this project, it corresponds tostep 6.2.
66 of 136 Deltares
Group 4: Benchmarks generated by D-Sheet Piling
Table 4.27: Design values for soil properties in the last stage (steps 6.1 to 6.4)
Layer Parameter Unit Steps 6.1 and 6.3 Steps 6.2 and 6.4Clay c [kPa] 6.25 6.25
ϕ [◦] 25.63 25.63δ [◦] 17.09 17.09k [kN/m3] 2500 4500
Peat c [kPa] 2.5 2.5ϕ [◦] 29.67 29.67δ [◦] 21.80 21.80k [kN/m3] 1000 1800
Sand 1 c [kPa] 0 0ϕ [◦] 36.91 36.91δ [◦] 28.57 28.57k [kN/m3] 12500 22500
Sand 2 c [kPa] 0 0ϕ [◦] 43.29 43.29δ [◦] 28.08 28.08k [kN/m3] 12500 22500
Table 4.28: Design values for geometric levels in the last stage (steps 6.1 to 6.4)
Level [m NAP] Steps 6.1 and 6.2 Steps 6.3 and 6.4GLleft -7.25 -7.25GLright 0 0WLleft -9.7 -10.3WLright -1.8 -1.8
Results of those different calculations are given in Table 4.29.
4.17.3 D-SHEET PILING results (CUR 166 verification calculation using representative inputvalues)
D-SHEET PILING results are obtained using the option Partial factors in verified stage only(method B) and selecting the last stage in the Verify Sheet Piling tab of the Start Calculationwindow with an Anchor stiffness multiplication factor of 1.2. The results obtained from the Mo-ment/Force/Displacement Charts window are compared in the tables below. As expected, thethree Verification calculations with the three different classes give the same results.Relativedifferences between the Verification and the Standard calculations come from the number ofnodes along the wall which is different.
Deltares 67 of 136
D-SHEET PILING, Verification Report
Table 4.29: Results of benchmark 4-17a – Stage 3
Step Result D-SHEET PILING
(Standard)D-SHEET PILING
(Verify)Error[%]
Step 6.1 Max. moment [kNm] bm4-17d -224.44 -224.22 0.10Max. shear force [kN] -166.01 -165.96 0.03Max. displac. [mm] -37.11 -37.05 0.16Perc. mob. moment [%] 33.11 33.17 0.18Perc. mob. resist. [%] 35.36 35.41 0.14Anchor force [kN] 37.83 37.79 0.11
Step 6.2 Max. moment [kNm] bm4-17e -202.01 -201.59 0.21Max. shear force [kN] 164.23 164.46 0.14Max. displac. [mm] -33.28 -33.17 0.33Perc. mob. moment [%] 32.48 32.54 0.18Perc. mob. resist. [%] 35.14 35.19 0.14Anchor force [kN] 51.59 51.54 0.10
Step 6.3 Max. moment [kNm] bm4-17f -223.82 -223.81 0.00Max. shear force [kN] -165.87 -165.87 0.00Max. displac. [mm] -37.01 -37.01 0.00Perc. mob. moment [%] 29.90 29.90 0.00Perc. mob. resist. [%] 32.41 32.41 0.00Anchor force [kN] 37.74 37.74 0.00
Step 6.4 Max. moment [kNm] bm4-17g -201.31 -201.31 0.00Max. shear force [kN] 164.55 164.55 0.00Max. displac. [mm] -33.14 -33.14 0.00Perc. mob. moment [%] 29.56 29.56 0.00Perc. mob. resist. [%] 32.36 32.37 0.03Anchor force [kN] 51.51 51.51 0.00
Step 6.5 Max. moment [kNm] bm4-17h -216.56 -216.56 0.00Max. shear force [kN] -153.80 -153.80 0.00Max. displac. [mm] -35.64 -35.64 0.00Perc. mob. moment [%] 25.75 25.75 0.00Perc. mob. resist. [%] 28.15 28.15 0.00Anchor force [kN] 32.12
Step Max. moment [kNm] bm4-17h -259.87 -259.87 0.006.5× 1.2 Max. shear force [kN] (× 1.2) -184.56 -184.56 0.00
Anchor force [kN] 38.54 38.55 0.03Step 9.1 Anchor force [kN] bm4-17i 47.55 47.48 0.15
Use D-SHEET PILING input files bm4-17a.shi till bm4-17i.shi to run this benchmark.
4.18 Verify Sheet Piling calculation acc. CUR 166 Method B (all stages verified)
68 of 136 Deltares

Group 4: Benchmarks generated by D-Sheet Piling
4.18.1 Description
The same benchmark as the previous benchmark is used (section 4.17) except that methodB is applied on all stages which means that all stages are checked as a “final” stage (i.e.representative values, with no partial factors, are assumed for all stages apart from the “final”stage being checked). The partial factors corresponding to the selected safety class are onlyapplied to the “final” stage.
Two types of calculation results are compared:
� (bm4-18a) A verification calculation acc. to CUR 166 with method B with all stages veri-fied. Safety classes I, II and III and an anchor stiffness multiplication factor of 1, 1.2 and1.4 respectively for stages 1, 2 and 3 are used;
� A verification calculation acc. to CUR 166 with method B with only one stage verified:� (bm4-18b) Stage 1 is verified with safety class I and an anchor stiffness multiplication
factor of 1;� (bm4-18c) Stage 2 is verified with safety class II and an anchor stiffness multiplication
factor of 1.2;� (bm4-18d) Stage 3 is verified with safety class III and an anchor stiffness multiplication
factor of 1.4.
Results of bm4-18a should be the same as bm4-18b, 4-18c and bm4-18d respectively forstages 1, 2 and 3.
4.18.2 D-SHEET PILING results
Deltares 69 of 136
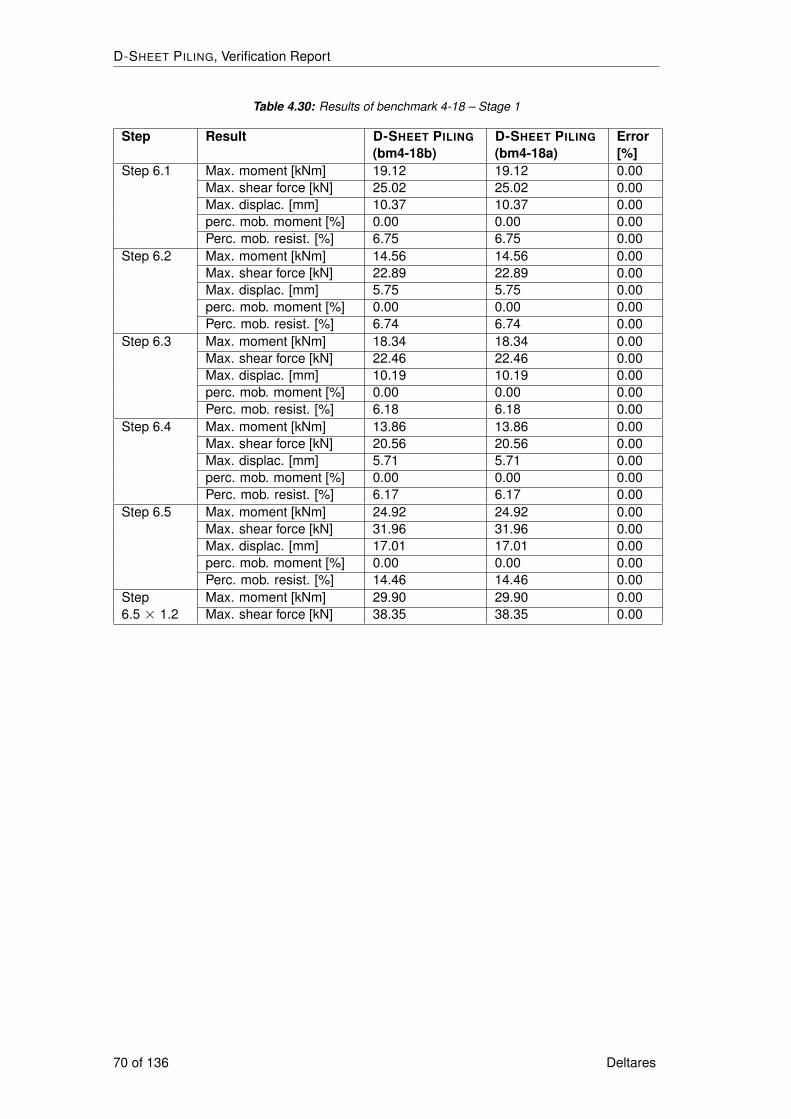
D-SHEET PILING, Verification Report
Table 4.30: Results of benchmark 4-18 – Stage 1
Step Result D-SHEET PILING
(bm4-18b)D-SHEET PILING
(bm4-18a)Error[%]
Step 6.1 Max. moment [kNm] 19.12 19.12 0.00Max. shear force [kN] 25.02 25.02 0.00Max. displac. [mm] 10.37 10.37 0.00perc. mob. moment [%] 0.00 0.00 0.00Perc. mob. resist. [%] 6.75 6.75 0.00
Step 6.2 Max. moment [kNm] 14.56 14.56 0.00Max. shear force [kN] 22.89 22.89 0.00Max. displac. [mm] 5.75 5.75 0.00perc. mob. moment [%] 0.00 0.00 0.00Perc. mob. resist. [%] 6.74 6.74 0.00
Step 6.3 Max. moment [kNm] 18.34 18.34 0.00Max. shear force [kN] 22.46 22.46 0.00Max. displac. [mm] 10.19 10.19 0.00perc. mob. moment [%] 0.00 0.00 0.00Perc. mob. resist. [%] 6.18 6.18 0.00
Step 6.4 Max. moment [kNm] 13.86 13.86 0.00Max. shear force [kN] 20.56 20.56 0.00Max. displac. [mm] 5.71 5.71 0.00perc. mob. moment [%] 0.00 0.00 0.00Perc. mob. resist. [%] 6.17 6.17 0.00
Step 6.5 Max. moment [kNm] 24.92 24.92 0.00Max. shear force [kN] 31.96 31.96 0.00Max. displac. [mm] 17.01 17.01 0.00perc. mob. moment [%] 0.00 0.00 0.00Perc. mob. resist. [%] 14.46 14.46 0.00
Step Max. moment [kNm] 29.90 29.90 0.006.5 × 1.2 Max. shear force [kN] 38.35 38.35 0.00
70 of 136 Deltares
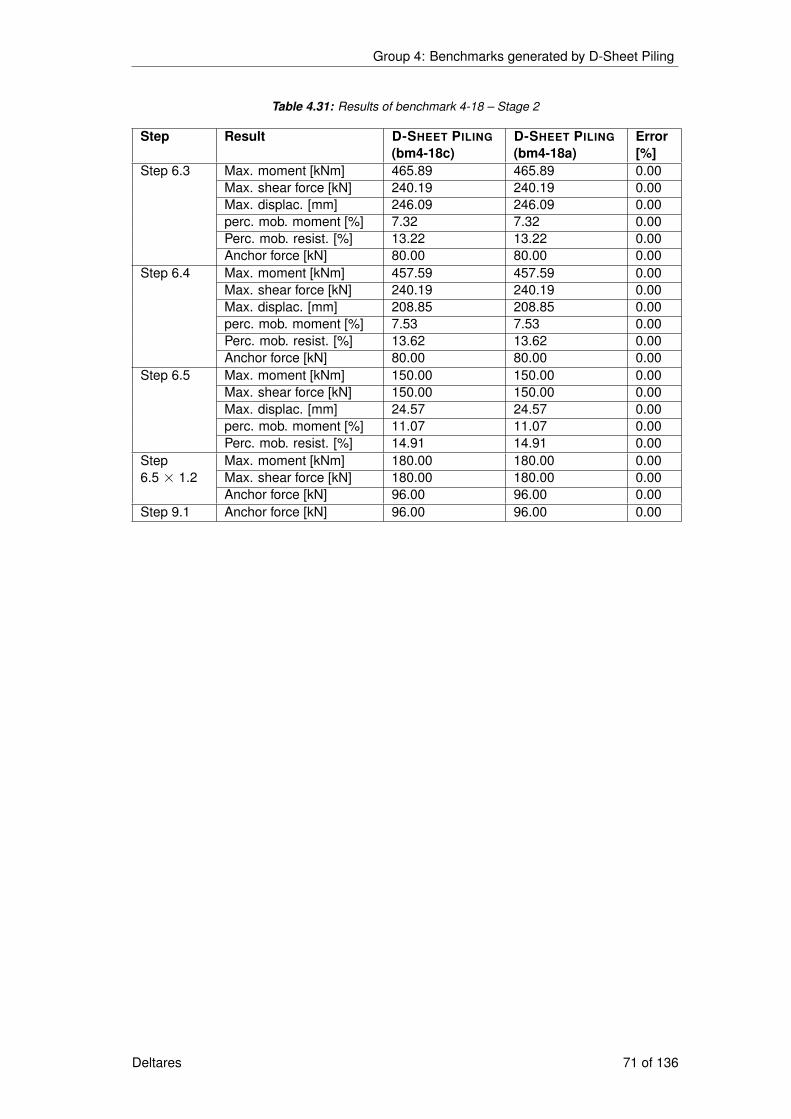
Group 4: Benchmarks generated by D-Sheet Piling
Table 4.31: Results of benchmark 4-18 – Stage 2
Step Result D-SHEET PILING
(bm4-18c)D-SHEET PILING
(bm4-18a)Error[%]
Step 6.3 Max. moment [kNm] 465.89 465.89 0.00Max. shear force [kN] 240.19 240.19 0.00Max. displac. [mm] 246.09 246.09 0.00perc. mob. moment [%] 7.32 7.32 0.00Perc. mob. resist. [%] 13.22 13.22 0.00Anchor force [kN] 80.00 80.00 0.00
Step 6.4 Max. moment [kNm] 457.59 457.59 0.00Max. shear force [kN] 240.19 240.19 0.00Max. displac. [mm] 208.85 208.85 0.00perc. mob. moment [%] 7.53 7.53 0.00Perc. mob. resist. [%] 13.62 13.62 0.00Anchor force [kN] 80.00 80.00 0.00
Step 6.5 Max. moment [kNm] 150.00 150.00 0.00Max. shear force [kN] 150.00 150.00 0.00Max. displac. [mm] 24.57 24.57 0.00perc. mob. moment [%] 11.07 11.07 0.00Perc. mob. resist. [%] 14.91 14.91 0.00
Step Max. moment [kNm] 180.00 180.00 0.006.5× 1.2 Max. shear force [kN] 180.00 180.00 0.00
Anchor force [kN] 96.00 96.00 0.00Step 9.1 Anchor force [kN] 96.00 96.00 0.00
Deltares 71 of 136
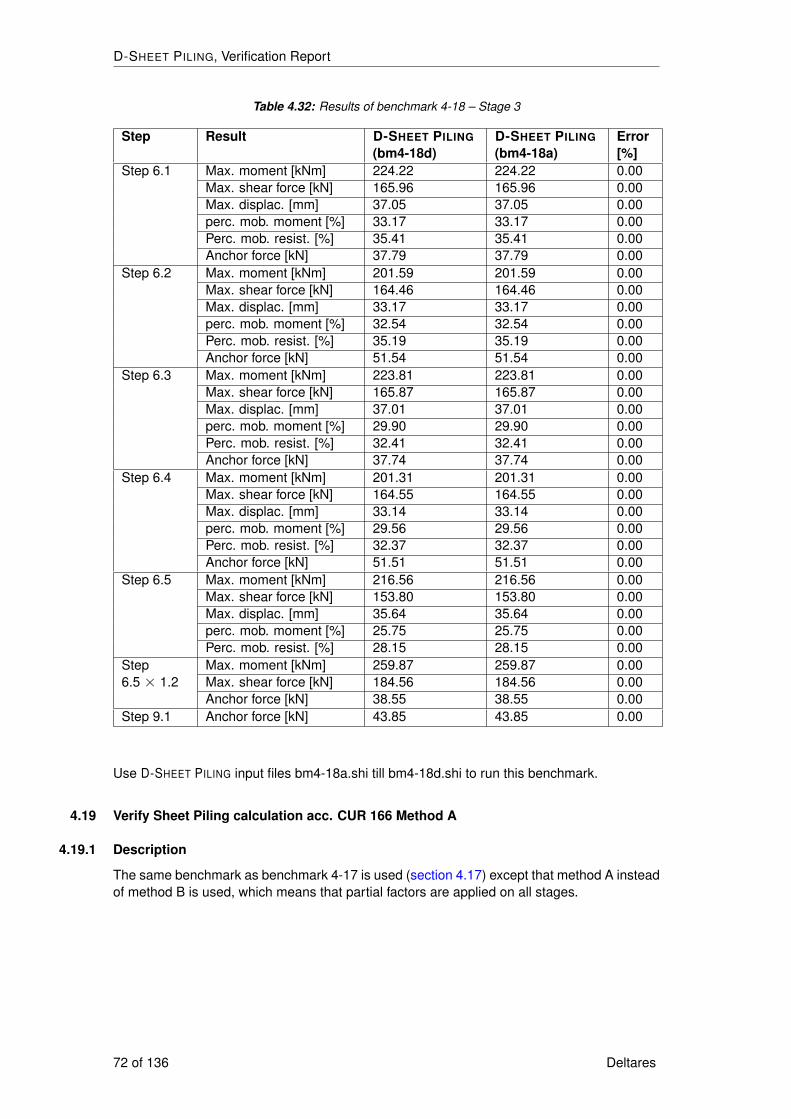
D-SHEET PILING, Verification Report
Table 4.32: Results of benchmark 4-18 – Stage 3
Step Result D-SHEET PILING
(bm4-18d)D-SHEET PILING
(bm4-18a)Error[%]
Step 6.1 Max. moment [kNm] 224.22 224.22 0.00Max. shear force [kN] 165.96 165.96 0.00Max. displac. [mm] 37.05 37.05 0.00perc. mob. moment [%] 33.17 33.17 0.00Perc. mob. resist. [%] 35.41 35.41 0.00Anchor force [kN] 37.79 37.79 0.00
Step 6.2 Max. moment [kNm] 201.59 201.59 0.00Max. shear force [kN] 164.46 164.46 0.00Max. displac. [mm] 33.17 33.17 0.00perc. mob. moment [%] 32.54 32.54 0.00Perc. mob. resist. [%] 35.19 35.19 0.00Anchor force [kN] 51.54 51.54 0.00
Step 6.3 Max. moment [kNm] 223.81 223.81 0.00Max. shear force [kN] 165.87 165.87 0.00Max. displac. [mm] 37.01 37.01 0.00perc. mob. moment [%] 29.90 29.90 0.00Perc. mob. resist. [%] 32.41 32.41 0.00Anchor force [kN] 37.74 37.74 0.00
Step 6.4 Max. moment [kNm] 201.31 201.31 0.00Max. shear force [kN] 164.55 164.55 0.00Max. displac. [mm] 33.14 33.14 0.00perc. mob. moment [%] 29.56 29.56 0.00Perc. mob. resist. [%] 32.37 32.37 0.00Anchor force [kN] 51.51 51.51 0.00
Step 6.5 Max. moment [kNm] 216.56 216.56 0.00Max. shear force [kN] 153.80 153.80 0.00Max. displac. [mm] 35.64 35.64 0.00perc. mob. moment [%] 25.75 25.75 0.00Perc. mob. resist. [%] 28.15 28.15 0.00
Step Max. moment [kNm] 259.87 259.87 0.006.5 × 1.2 Max. shear force [kN] 184.56 184.56 0.00
Anchor force [kN] 38.55 38.55 0.00Step 9.1 Anchor force [kN] 43.85 43.85 0.00
Use D-SHEET PILING input files bm4-18a.shi till bm4-18d.shi to run this benchmark.
4.19 Verify Sheet Piling calculation acc. CUR 166 Method A
4.19.1 Description
The same benchmark as benchmark 4-17 is used (section 4.17) except that method A insteadof method B is used, which means that partial factors are applied on all stages.
72 of 136 Deltares
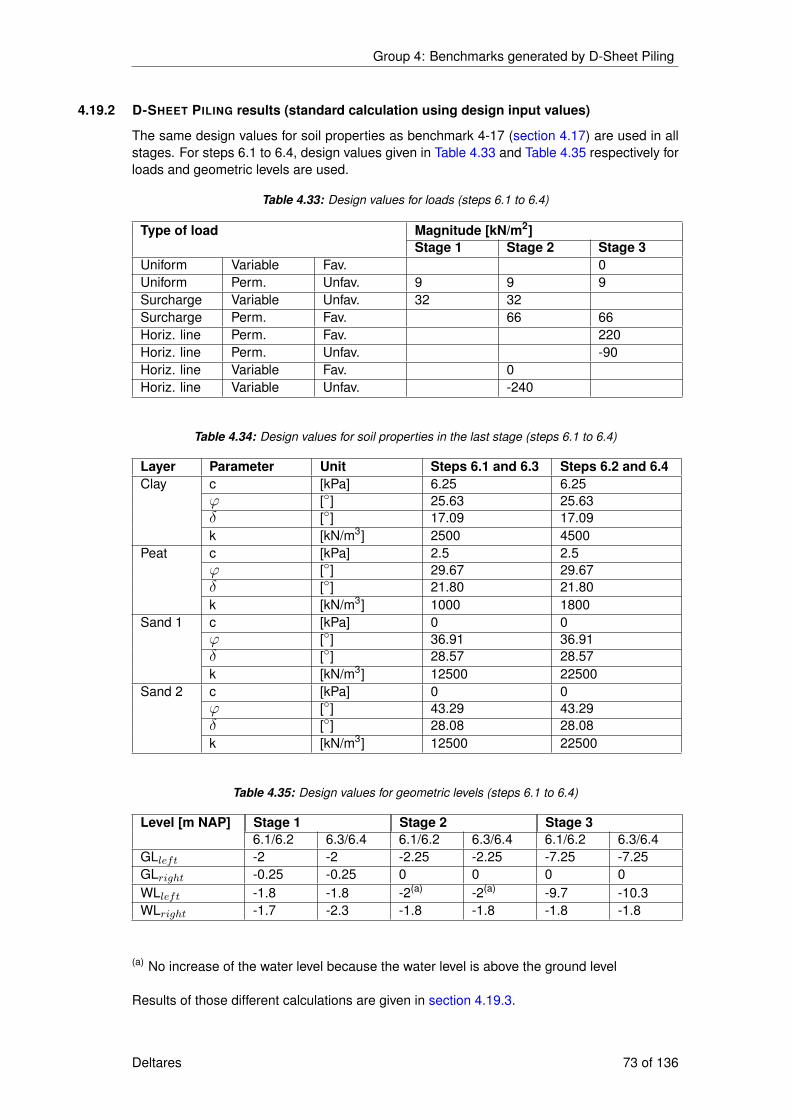
Group 4: Benchmarks generated by D-Sheet Piling
4.19.2 D-SHEET PILING results (standard calculation using design input values)
The same design values for soil properties as benchmark 4-17 (section 4.17) are used in allstages. For steps 6.1 to 6.4, design values given in Table 4.33 and Table 4.35 respectively forloads and geometric levels are used.
Table 4.33: Design values for loads (steps 6.1 to 6.4)
Type of load Magnitude [kN/m2]Stage 1 Stage 2 Stage 3
Uniform Variable Fav. 0Uniform Perm. Unfav. 9 9 9Surcharge Variable Unfav. 32 32Surcharge Perm. Fav. 66 66Horiz. line Perm. Fav. 220Horiz. line Perm. Unfav. -90Horiz. line Variable Fav. 0Horiz. line Variable Unfav. -240
Table 4.34: Design values for soil properties in the last stage (steps 6.1 to 6.4)
Layer Parameter Unit Steps 6.1 and 6.3 Steps 6.2 and 6.4Clay c [kPa] 6.25 6.25
ϕ [◦] 25.63 25.63δ [◦] 17.09 17.09k [kN/m3] 2500 4500
Peat c [kPa] 2.5 2.5ϕ [◦] 29.67 29.67δ [◦] 21.80 21.80k [kN/m3] 1000 1800
Sand 1 c [kPa] 0 0ϕ [◦] 36.91 36.91δ [◦] 28.57 28.57k [kN/m3] 12500 22500
Sand 2 c [kPa] 0 0ϕ [◦] 43.29 43.29δ [◦] 28.08 28.08k [kN/m3] 12500 22500
Table 4.35: Design values for geometric levels (steps 6.1 to 6.4)
Level [m NAP] Stage 1 Stage 2 Stage 36.1/6.2 6.3/6.4 6.1/6.2 6.3/6.4 6.1/6.2 6.3/6.4
GLleft -2 -2 -2.25 -2.25 -7.25 -7.25GLright -0.25 -0.25 0 0 0 0WLleft -1.8 -1.8 -2(a) -2(a) -9.7 -10.3WLright -1.7 -2.3 -1.8 -1.8 -1.8 -1.8
(a) No increase of the water level because the water level is above the ground level
Results of those different calculations are given in section 4.19.3.
Deltares 73 of 136
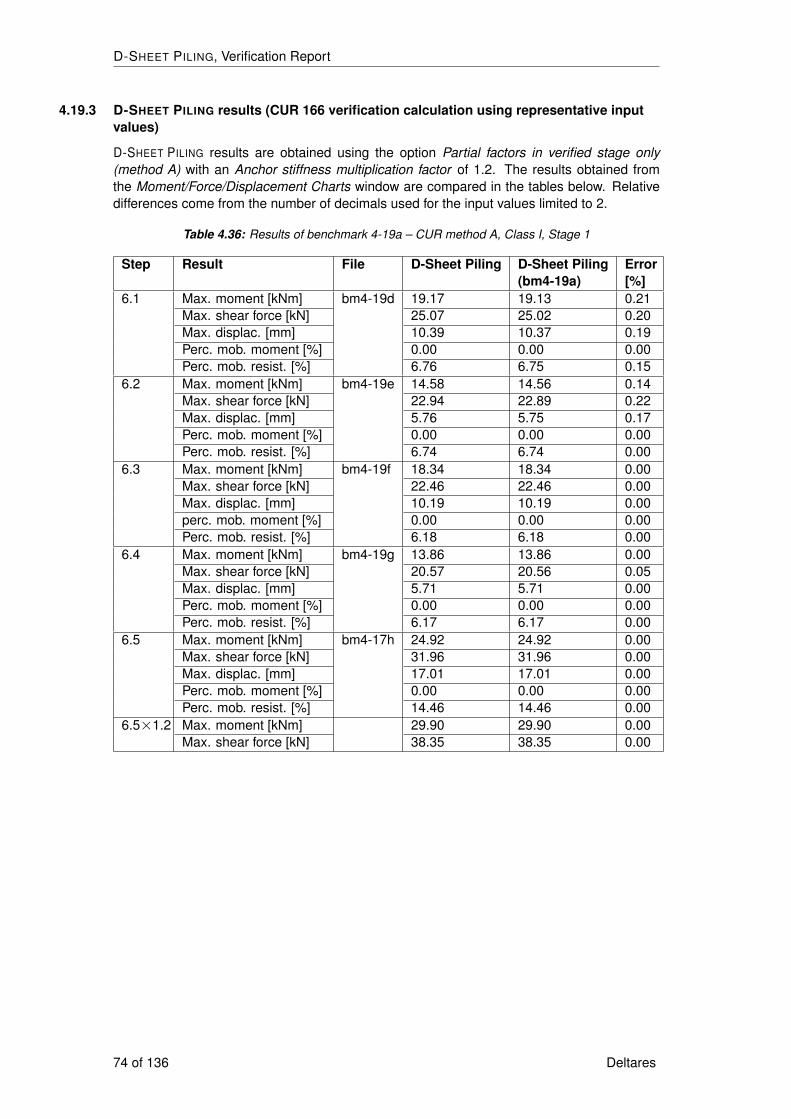
D-SHEET PILING, Verification Report
4.19.3 D-SHEET PILING results (CUR 166 verification calculation using representative inputvalues)
D-SHEET PILING results are obtained using the option Partial factors in verified stage only(method A) with an Anchor stiffness multiplication factor of 1.2. The results obtained fromthe Moment/Force/Displacement Charts window are compared in the tables below. Relativedifferences come from the number of decimals used for the input values limited to 2.
Table 4.36: Results of benchmark 4-19a – CUR method A, Class I, Stage 1
Step Result File D-Sheet Piling D-Sheet Piling(bm4-19a)
Error[%]
6.1 Max. moment [kNm] bm4-19d 19.17 19.13 0.21Max. shear force [kN] 25.07 25.02 0.20Max. displac. [mm] 10.39 10.37 0.19Perc. mob. moment [%] 0.00 0.00 0.00Perc. mob. resist. [%] 6.76 6.75 0.15
6.2 Max. moment [kNm] bm4-19e 14.58 14.56 0.14Max. shear force [kN] 22.94 22.89 0.22Max. displac. [mm] 5.76 5.75 0.17Perc. mob. moment [%] 0.00 0.00 0.00Perc. mob. resist. [%] 6.74 6.74 0.00
6.3 Max. moment [kNm] bm4-19f 18.34 18.34 0.00Max. shear force [kN] 22.46 22.46 0.00Max. displac. [mm] 10.19 10.19 0.00perc. mob. moment [%] 0.00 0.00 0.00Perc. mob. resist. [%] 6.18 6.18 0.00
6.4 Max. moment [kNm] bm4-19g 13.86 13.86 0.00Max. shear force [kN] 20.57 20.56 0.05Max. displac. [mm] 5.71 5.71 0.00Perc. mob. moment [%] 0.00 0.00 0.00Perc. mob. resist. [%] 6.17 6.17 0.00
6.5 Max. moment [kNm] bm4-17h 24.92 24.92 0.00Max. shear force [kN] 31.96 31.96 0.00Max. displac. [mm] 17.01 17.01 0.00Perc. mob. moment [%] 0.00 0.00 0.00Perc. mob. resist. [%] 14.46 14.46 0.00
6.5×1.2 Max. moment [kNm] 29.90 29.90 0.00Max. shear force [kN] 38.35 38.35 0.00
74 of 136 Deltares

Group 4: Benchmarks generated by D-Sheet Piling
Table 4.37: Results of benchmark 4-19a/b/c – Stage 2
Step Result File D-SheetPiling
D-SheetPiling
Error[%]
Step 6.1 Max. moment [kNm] bm4-19d 463.69 464.33 0.14Max. shear force [kN] 240.19 240.19 0.00Max. displac. [mm] 238.89 239.79 0.38Perc. mob. moment [%] 6.93 6.94 0.14Perc. mob. resist. [%] 12.68 12.69 0.08Anchor force [kN] 80.00 80.00 0.00
Step 6.2 Max. moment [kNm] bm4-19e 456.18 456.49 0.07Max. shear force [kN] 240.19 240.19 0.00Max. displac. [mm] 197.01 197.45 0.22Perc. mob. moment [%] 7.15 7.15 0.00Perc. mob. resist. [%] 13.10 13.10 0.00Anchor force [kN] 80.00 80.00 0.00
Step 6.3 Max. moment [kNm] bm4-19f 464.35 465.96 0.35Max. shear force [kN] 240.19 240.19 0.00Max. displac. [mm] 240.12 243.30 1.31perc. mob. moment [%] 6.89 7.10 2.96Perc. mob. resist. [%] 12.63 12.95 2.47Anchor force [kN] 80.00 80.00 0.00
Step 6.4 Max. moment [kNm] bm4-19g 456.49 457.73 0.27Max. shear force [kN] 240.19 240.19 0.00Max. displac. [mm] 197.70 199.36 0.83Perc. mob. moment [%] 7.11 7.32 2.87Perc. mob. resist. [%] 13.05 13.37 2.39Anchor force [kN] 80.00 80.00 0.00
Step 6.5 Max. moment [kNm] bm4-17h 150.00 150.00 0.00Max. shear force [kN] 150.00 150.00 0.00Max. displac. [mm] 24.57 24.57 0.00perc. mob. moment [%] 11.07 11.07 0.00Perc. mob. resist. [%] 14.91 14.91 0.00Anchor force [kN] 80.00
Step Max. moment [kNm] 180.00 180.00 0.006.5× 1.2 Max. shear force [kN] 180.00 180.00 0.00
Anchor force [kN] 96.00 96.00 0.00Step 9.1 Anchor force× 1.2 [kN] bm4-19h 96.00 96.00 0.00
Anchor force [kN] 80.00
Deltares 75 of 136
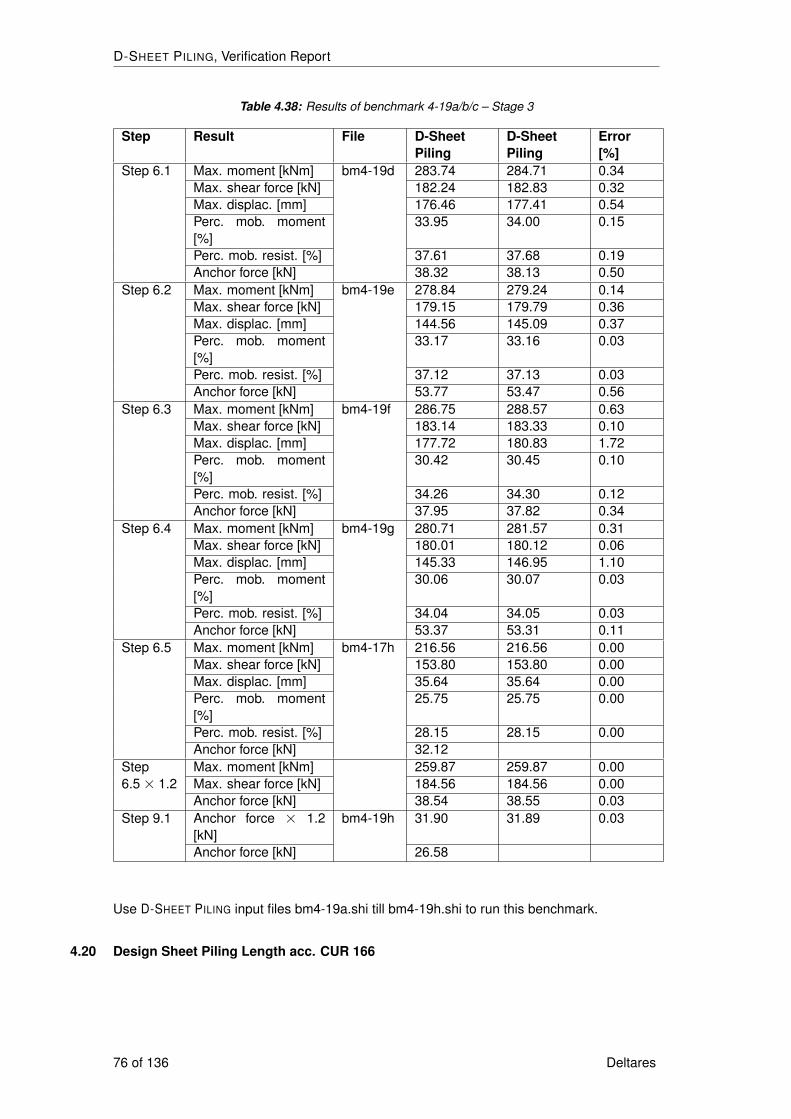
D-SHEET PILING, Verification Report
Table 4.38: Results of benchmark 4-19a/b/c – Stage 3
Step Result File D-SheetPiling
D-SheetPiling
Error[%]
Step 6.1 Max. moment [kNm] bm4-19d 283.74 284.71 0.34Max. shear force [kN] 182.24 182.83 0.32Max. displac. [mm] 176.46 177.41 0.54Perc. mob. moment[%]
33.95 34.00 0.15
Perc. mob. resist. [%] 37.61 37.68 0.19Anchor force [kN] 38.32 38.13 0.50
Step 6.2 Max. moment [kNm] bm4-19e 278.84 279.24 0.14Max. shear force [kN] 179.15 179.79 0.36Max. displac. [mm] 144.56 145.09 0.37Perc. mob. moment[%]
33.17 33.16 0.03
Perc. mob. resist. [%] 37.12 37.13 0.03Anchor force [kN] 53.77 53.47 0.56
Step 6.3 Max. moment [kNm] bm4-19f 286.75 288.57 0.63Max. shear force [kN] 183.14 183.33 0.10Max. displac. [mm] 177.72 180.83 1.72Perc. mob. moment[%]
30.42 30.45 0.10
Perc. mob. resist. [%] 34.26 34.30 0.12Anchor force [kN] 37.95 37.82 0.34
Step 6.4 Max. moment [kNm] bm4-19g 280.71 281.57 0.31Max. shear force [kN] 180.01 180.12 0.06Max. displac. [mm] 145.33 146.95 1.10Perc. mob. moment[%]
30.06 30.07 0.03
Perc. mob. resist. [%] 34.04 34.05 0.03Anchor force [kN] 53.37 53.31 0.11
Step 6.5 Max. moment [kNm] bm4-17h 216.56 216.56 0.00Max. shear force [kN] 153.80 153.80 0.00Max. displac. [mm] 35.64 35.64 0.00Perc. mob. moment[%]
25.75 25.75 0.00
Perc. mob. resist. [%] 28.15 28.15 0.00Anchor force [kN] 32.12
Step Max. moment [kNm] 259.87 259.87 0.006.5× 1.2 Max. shear force [kN] 184.56 184.56 0.00
Anchor force [kN] 38.54 38.55 0.03Step 9.1 Anchor force × 1.2
[kN]bm4-19h 31.90 31.89 0.03
Anchor force [kN] 26.58
Use D-SHEET PILING input files bm4-19a.shi till bm4-19h.shi to run this benchmark.
4.20 Design Sheet Piling Length acc. CUR 166
76 of 136 Deltares

Group 4: Benchmarks generated by D-Sheet Piling
4.20.1 Description
The same problem as in section 4.17 is considered. For the Design Sheet Piling Lengthoption, D-SHEET PILING applies the same partial factors and geometric variations as for step6.3 of the Verify Sheet Piling option. Therefore, the results of the Design Sheet Piling Lengthcalculation (for a length of 14 m) should be the same as:
� results of benchmark 4-19a/b/c (step 6.3) (section 4.19) for method A;� results of benchmark 4-18b (step 6.3) (section 4.18) for method B with stage 1 selected;� results of benchmark 4-18c (step 6.3) (section 4.18) for method B with stage 2 selected;� results of benchmark 4-18d (step 6.3) (section 4.18) for method B with stage 3 selected;
4.20.2 D-SHEET PILING results
D-SHEET PILING results are obtained using the Design Sheet Piling Length tab and selectinga sheet piling length of 14 m.
Table 4.39: Results of benchmark 4-20 – Method A, stage 3
Safetyclass
Results D-SHEET PILING
“Verify” (step 6.3)D-SHEET PILING
“Design”(14 m length)
Error[%]
I Max.displac. [mm]
bm4-19a 180.83 bm4-20a 180.83 0.00
Max.moment [kNm]
288.57 288.57 0.00
Anchorforce [kN]
37.82 37.82 0.00
Mob.resistance [%]
34.30 34.30 0.00
II Max.displac. [mm]
bm4-19b 180.83 bm4-20b 180.83 0.00
Max.moment [kNm]
288.57 288.57 0.00
Anchorforce [kN]
37.82 37.82 0.00
Mob.resistance [%]
34.30 34.30 0.00
III Max.displac. [mm]
bm4-19c 180.83 bm4-20c 180.83 0.00
Max.moment [kNm]
288.57 288.57 0.00
Anchorforce [kN]
37.82 37.82 0.00
Mob.resistance [%]
34.30 34.30 0.00
Deltares 77 of 136
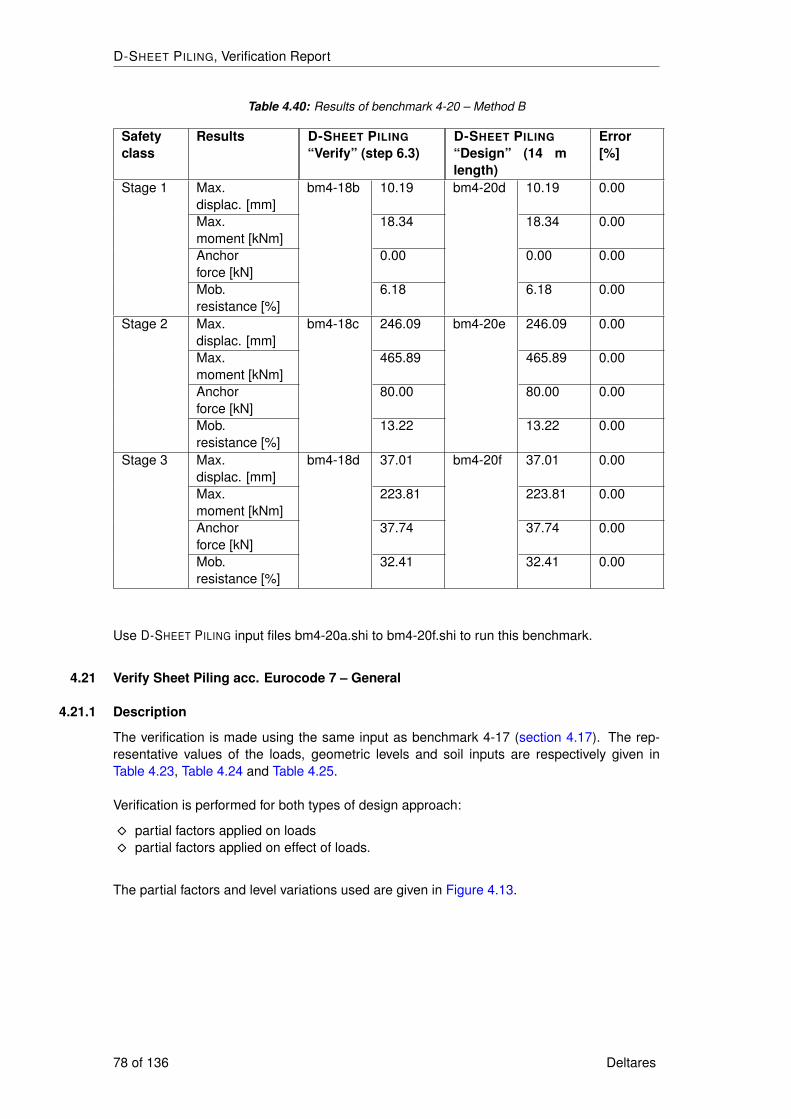
D-SHEET PILING, Verification Report
Table 4.40: Results of benchmark 4-20 – Method B
Safetyclass
Results D-SHEET PILING
“Verify” (step 6.3)D-SHEET PILING
“Design” (14 mlength)
Error[%]
Stage 1 Max.displac. [mm]
bm4-18b 10.19 bm4-20d 10.19 0.00
Max.moment [kNm]
18.34 18.34 0.00
Anchorforce [kN]
0.00 0.00 0.00
Mob.resistance [%]
6.18 6.18 0.00
Stage 2 Max.displac. [mm]
bm4-18c 246.09 bm4-20e 246.09 0.00
Max.moment [kNm]
465.89 465.89 0.00
Anchorforce [kN]
80.00 80.00 0.00
Mob.resistance [%]
13.22 13.22 0.00
Stage 3 Max.displac. [mm]
bm4-18d 37.01 bm4-20f 37.01 0.00
Max.moment [kNm]
223.81 223.81 0.00
Anchorforce [kN]
37.74 37.74 0.00
Mob.resistance [%]
32.41 32.41 0.00
Use D-SHEET PILING input files bm4-20a.shi to bm4-20f.shi to run this benchmark.
4.21 Verify Sheet Piling acc. Eurocode 7 – General
4.21.1 Description
The verification is made using the same input as benchmark 4-17 (section 4.17). The rep-resentative values of the loads, geometric levels and soil inputs are respectively given inTable 4.23, Table 4.24 and Table 4.25.
Verification is performed for both types of design approach:
� partial factors applied on loads� partial factors applied on effect of loads.
The partial factors and level variations used are given in Figure 4.13.
78 of 136 Deltares

Group 4: Benchmarks generated by D-Sheet Piling
Figure 4.13: Partial safety factors and geometry variations for the different design ap-proaches (bm4-21)
Note: In Figure 4.13, values in red color are different from the default values prescribed byEurocode ?.
Two types of calculation results are compared for each design approach:
� a Eurocode verification calculation using representative input values;� a standard calculation using design input values.
4.21.2 D-SHEET PILING results (standard calculation using design input values)
A standard calculation is performed using design input values determined by applying thepartial factors of Figure 4.13. Results are given in Table 4.41, Table 4.42 and Table 4.43respectively for loads, materials and ground levels.
Table 4.41: Design values for loads (bm4-21)
Type of load Magnitude [kN/m2]Stage 1 Stage 2 Stage 3
Uniform Variable Fav. 0Uniform Perm. Unfav. 9 9 9Surcharge Variable Unfav. 32 32Surcharge Perm. Fav. 66 66Horiz. line Perm. Fav. 220Horiz. line Perm. Unfav. -90Horiz. line Variable Fav. 0Horiz. line Variable Unfav. -240
Table 4.42: Design values for soil parameters (bm4-21)
Parameter Unit Clay Peat Sand 1 Sand 2Cohesion [kPa] 6.25 2.5 0 0Friction angle [◦] 25.63 29.67 36.91 43.29Delta friction angle [◦] 17.09 21.80 28.57 28.08
Deltares 79 of 136
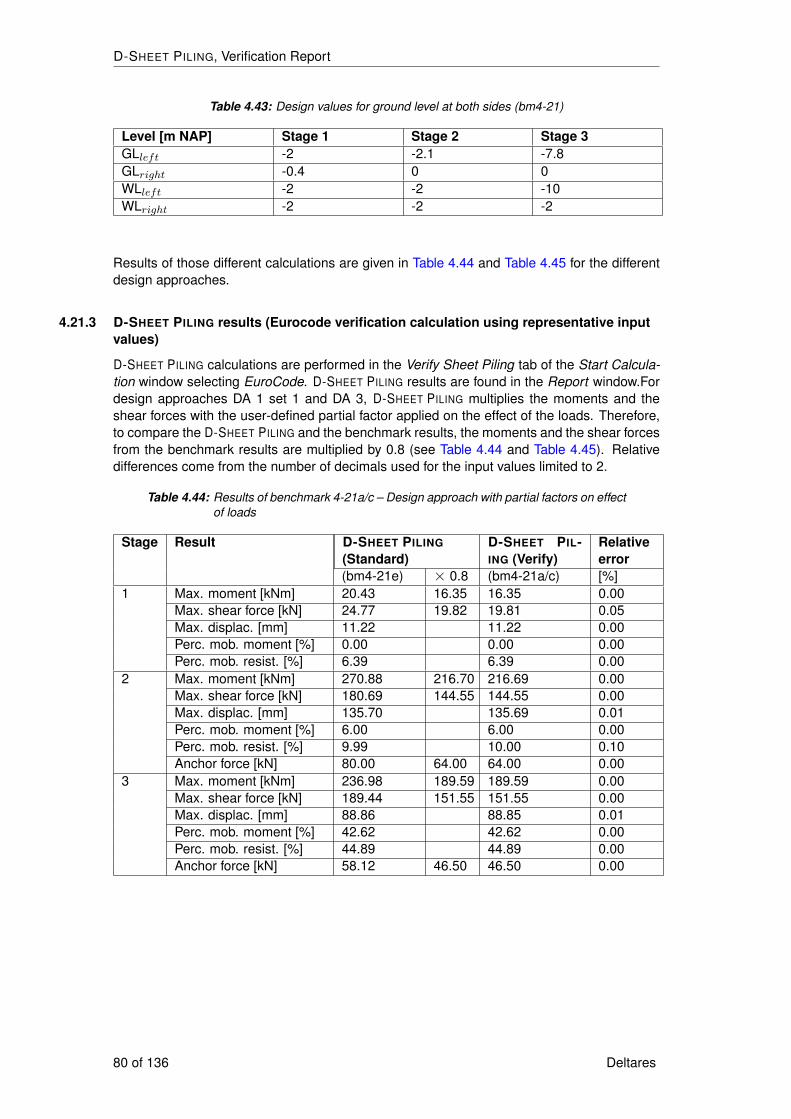
D-SHEET PILING, Verification Report
Table 4.43: Design values for ground level at both sides (bm4-21)
Level [m NAP] Stage 1 Stage 2 Stage 3GLleft -2 -2.1 -7.8GLright -0.4 0 0WLleft -2 -2 -10WLright -2 -2 -2
Results of those different calculations are given in Table 4.44 and Table 4.45 for the differentdesign approaches.
4.21.3 D-SHEET PILING results (Eurocode verification calculation using representative inputvalues)
D-SHEET PILING calculations are performed in the Verify Sheet Piling tab of the Start Calcula-tion window selecting EuroCode. D-SHEET PILING results are found in the Report window.Fordesign approaches DA 1 set 1 and DA 3, D-SHEET PILING multiplies the moments and theshear forces with the user-defined partial factor applied on the effect of the loads. Therefore,to compare the D-SHEET PILING and the benchmark results, the moments and the shear forcesfrom the benchmark results are multiplied by 0.8 (see Table 4.44 and Table 4.45). Relativedifferences come from the number of decimals used for the input values limited to 2.
Table 4.44: Results of benchmark 4-21a/c – Design approach with partial factors on effectof loads
Stage Result D-SHEET PILING
(Standard)D-SHEET PIL-ING (Verify)
Relativeerror
(bm4-21e) × 0.8 (bm4-21a/c) [%]1 Max. moment [kNm] 20.43 16.35 16.35 0.00
Max. shear force [kN] 24.77 19.82 19.81 0.05Max. displac. [mm] 11.22 11.22 0.00Perc. mob. moment [%] 0.00 0.00 0.00Perc. mob. resist. [%] 6.39 6.39 0.00
2 Max. moment [kNm] 270.88 216.70 216.69 0.00Max. shear force [kN] 180.69 144.55 144.55 0.00Max. displac. [mm] 135.70 135.69 0.01Perc. mob. moment [%] 6.00 6.00 0.00Perc. mob. resist. [%] 9.99 10.00 0.10Anchor force [kN] 80.00 64.00 64.00 0.00
3 Max. moment [kNm] 236.98 189.59 189.59 0.00Max. shear force [kN] 189.44 151.55 151.55 0.00Max. displac. [mm] 88.86 88.85 0.01Perc. mob. moment [%] 42.62 42.62 0.00Perc. mob. resist. [%] 44.89 44.89 0.00Anchor force [kN] 58.12 46.50 46.50 0.00
80 of 136 Deltares

Group 4: Benchmarks generated by D-Sheet Piling
Table 4.45: Results of benchmark 4-21b/d – Design approach with partial factors on loads
Stage Result D-SHEET PILING
(Standard)D-Sheet Piling(Verify)
Relativeerror
(bm4-21f) (bm4-21b/d) [%]1 Max. moment [kNm] 21.36 21.37 0.05
Max. shear force [kN] 25.80 25.79 0.04Max. displac. [mm] 12.41 12.41 0.00Perc. mob. moment [%] 0.00 0.00 0.00Perc. mob. resist. [%] 6.65 6.65 0.00
2 Max. moment [kNm] 440.87 440.86 0.00Max. shear force [kN] 240.19 240.19 0.00Max. displac. [mm] 239.51 239.49 0.01Perc. mob. moment [%] 6.54 6.54 0.00Perc. mob. resist. [%] 11.99 11.99 0.00Anchor force [kN] 80.00 80.00 0.00
3 Max. moment [kNm] 282.33 282.32 0.00Max. shear force [kN] 192.46 192.46 0.00Max. displac. [mm] 170.04 170.03 0.01Perc. mob. moment [%] 41.88 41.88 0.00Perc. mob. resist. [%] 44.41 44.41 0.00Anchor force [kN] 41.67 41.64 0.07
Use D-SHEET PILING input files bm4-21a.shi to bm4-21f.shi to run this benchmark.
4.22 Design Sheet Piling Length acc. Eurocode 7 – General
4.22.1 Description
The same problem as benchmark 4-21 (section 4.21) is considered. For the Design SheetPiling Length option, D-SHEET PILING applies the same partial factors and geometric varia-tions as for the Verify Sheet Piling option. Therefore, the results of the Design Sheet PilingLength calculation (for a length of 14 m) should be the same as the results of benchmark 4-21(section 4.21).
4.22.2 D-SHEET PILING results
D-SHEET PILING results are obtained using the Design Sheet Piling Length tab and selectinga sheet piling length of 14 m.
Deltares 81 of 136
D-SHEET PILING, Verification Report
Table 4.46: Results of benchmark 4-22 – Stage 3
DA Results for stage 3 D-SHEET PIL-ING
“Verify”(step 6.3)
D-SHEET PIL-ING
“Design”(length = 14 m)
Relativeerror [%]
1 set 1 Max. displac. [mm] bm4-21a 88.85 bm4-22a 88.85 0.00Max. moment [kNm] 189.59 189.59 0.00Anchor force [kN] 46.50 46.50 0.00Mob. resistance [%] 44.89 44.89 0.00
1 set 2 Max. displac. [mm] bm4-21b 170.03 bm4-22b 170.03 0.00Max. moment [kNm] 282.32 282.32 0.00Anchor force [kN] 41.64 41.67 0.07Mob. resistance [%] 44.41 44.41 0.00
2 Max. displac. [mm] bm4-21c 88.85 bm4-22c 88.85 0.00Max. moment [kNm] 189.59 189.59 0.00Anchor force [kN] 46.50 46.50 0.00Mob. resistance [%] 44.89 44.89 0.00
3 Max. displac. [mm] bm4-21d 170.03 bm4-22d 170.03 0.00Max. moment [kNm] 282.32 282.32 0.00Anchor force [kN] 41.64 41.67 0.07Mob. resistance [%] 44.41 44.41 0.00
Use D-SHEET PILING input files bm4-22a.shi to bm4-22d.shi to run this benchmark.
4.23 Verify Sheet Piling calculation acc. Eurocode 7 - NL annex
4.23.1 Description
The verification is made using the same input as benchmark 4-17 (section 4.17). The DutchAnnex of Eurocode 7 prescribes the same step-by-step procedure as the CUR 166 recom-mendations only the partial factors of the three safety classes are different. However, to checkthe correctness of a verification calculation acc. to NL Annex of Eurocode 7, the same user-defined partial factors as for benchmarks for CUR 166 (benchmarks 4-17, 4-18 and 4-19) areused, except that they are inputted in the EC7 NL tab of the User Defined Partial Factorswindow instead of the CUR tab. Then, a simple comparison with the results of benchmarks4-17, 4-18 and 4-19 is performed (see Table 4.47).
82 of 136 Deltares
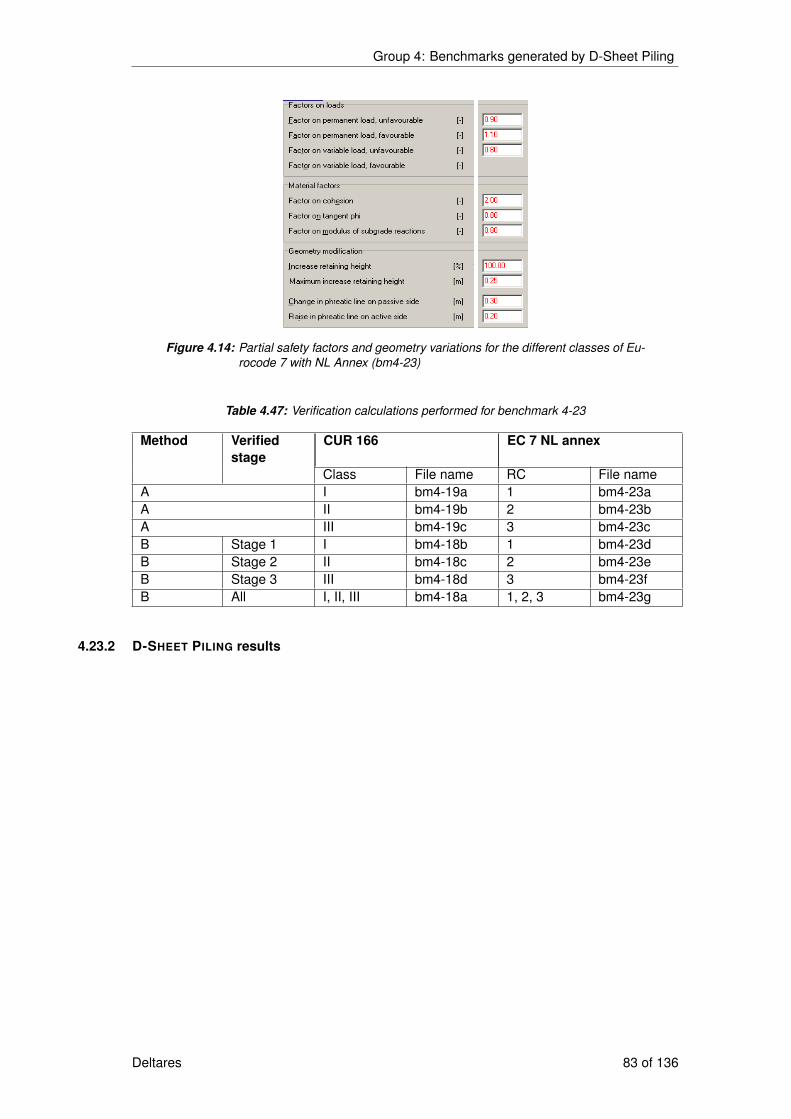
Group 4: Benchmarks generated by D-Sheet Piling
Figure 4.14: Partial safety factors and geometry variations for the different classes of Eu-rocode 7 with NL Annex (bm4-23)
Table 4.47: Verification calculations performed for benchmark 4-23
Method Verifiedstage
CUR 166 EC 7 NL annex
Class File name RC File nameA I bm4-19a 1 bm4-23aA II bm4-19b 2 bm4-23bA III bm4-19c 3 bm4-23cB Stage 1 I bm4-18b 1 bm4-23dB Stage 2 II bm4-18c 2 bm4-23eB Stage 3 III bm4-18d 3 bm4-23fB All I, II, III bm4-18a 1, 2, 3 bm4-23g
4.23.2 D-SHEET PILING results
Deltares 83 of 136
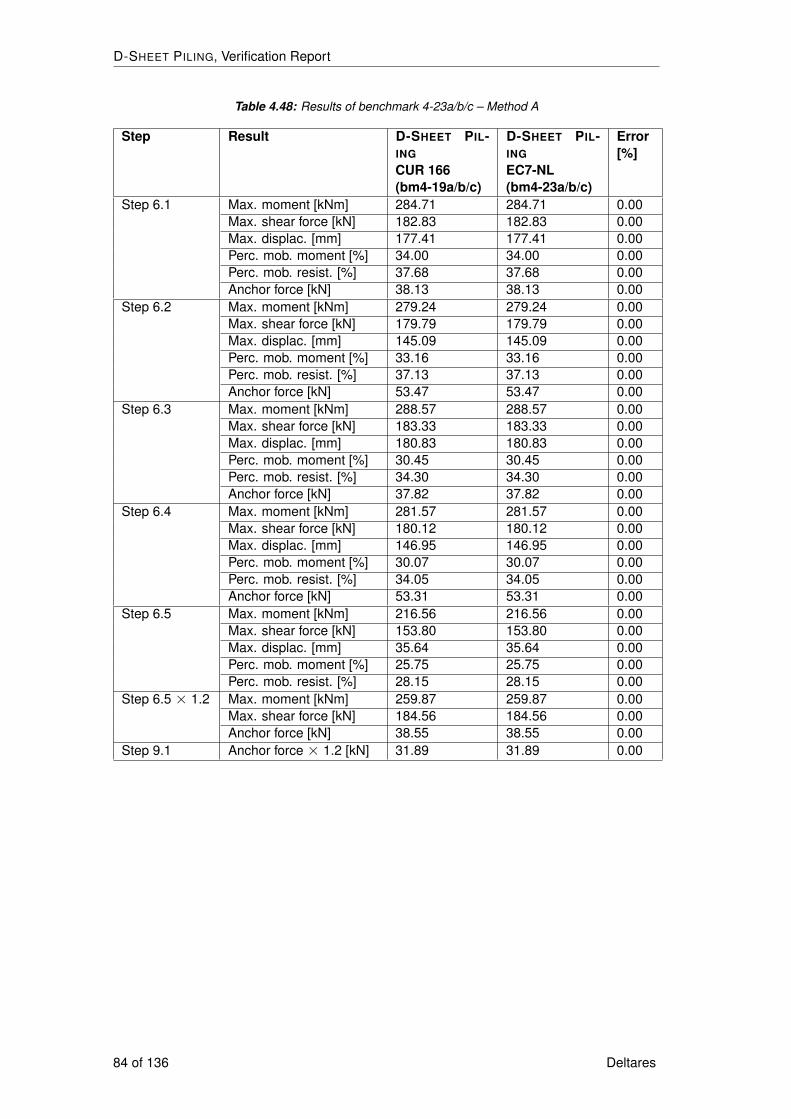
D-SHEET PILING, Verification Report
Table 4.48: Results of benchmark 4-23a/b/c – Method A
Step Result D-SHEET PIL-ING
CUR 166(bm4-19a/b/c)
D-SHEET PIL-ING
EC7-NL(bm4-23a/b/c)
Error[%]
Step 6.1 Max. moment [kNm] 284.71 284.71 0.00Max. shear force [kN] 182.83 182.83 0.00Max. displac. [mm] 177.41 177.41 0.00Perc. mob. moment [%] 34.00 34.00 0.00Perc. mob. resist. [%] 37.68 37.68 0.00Anchor force [kN] 38.13 38.13 0.00
Step 6.2 Max. moment [kNm] 279.24 279.24 0.00Max. shear force [kN] 179.79 179.79 0.00Max. displac. [mm] 145.09 145.09 0.00Perc. mob. moment [%] 33.16 33.16 0.00Perc. mob. resist. [%] 37.13 37.13 0.00Anchor force [kN] 53.47 53.47 0.00
Step 6.3 Max. moment [kNm] 288.57 288.57 0.00Max. shear force [kN] 183.33 183.33 0.00Max. displac. [mm] 180.83 180.83 0.00Perc. mob. moment [%] 30.45 30.45 0.00Perc. mob. resist. [%] 34.30 34.30 0.00Anchor force [kN] 37.82 37.82 0.00
Step 6.4 Max. moment [kNm] 281.57 281.57 0.00Max. shear force [kN] 180.12 180.12 0.00Max. displac. [mm] 146.95 146.95 0.00Perc. mob. moment [%] 30.07 30.07 0.00Perc. mob. resist. [%] 34.05 34.05 0.00Anchor force [kN] 53.31 53.31 0.00
Step 6.5 Max. moment [kNm] 216.56 216.56 0.00Max. shear force [kN] 153.80 153.80 0.00Max. displac. [mm] 35.64 35.64 0.00Perc. mob. moment [%] 25.75 25.75 0.00Perc. mob. resist. [%] 28.15 28.15 0.00
Step 6.5 × 1.2 Max. moment [kNm] 259.87 259.87 0.00Max. shear force [kN] 184.56 184.56 0.00Anchor force [kN] 38.55 38.55 0.00
Step 9.1 Anchor force × 1.2 [kN] 31.89 31.89 0.00
84 of 136 Deltares
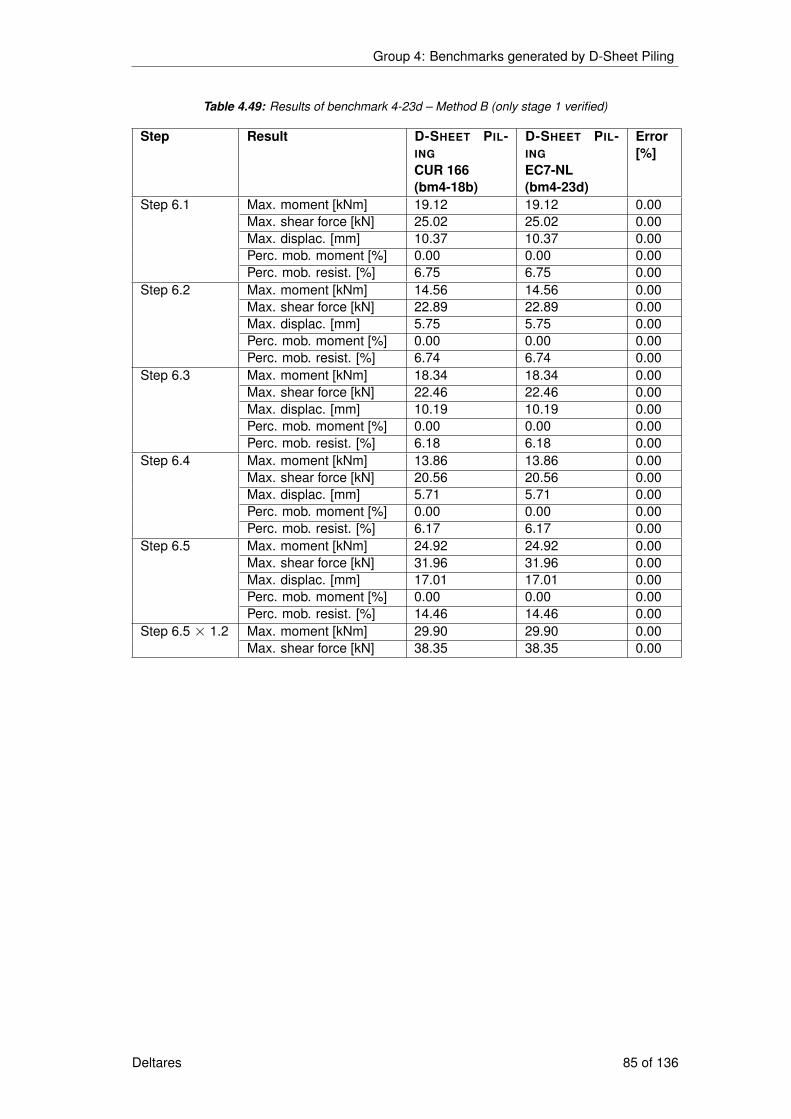
Group 4: Benchmarks generated by D-Sheet Piling
Table 4.49: Results of benchmark 4-23d – Method B (only stage 1 verified)
Step Result D-SHEET PIL-ING
CUR 166(bm4-18b)
D-SHEET PIL-ING
EC7-NL(bm4-23d)
Error[%]
Step 6.1 Max. moment [kNm] 19.12 19.12 0.00Max. shear force [kN] 25.02 25.02 0.00Max. displac. [mm] 10.37 10.37 0.00Perc. mob. moment [%] 0.00 0.00 0.00Perc. mob. resist. [%] 6.75 6.75 0.00
Step 6.2 Max. moment [kNm] 14.56 14.56 0.00Max. shear force [kN] 22.89 22.89 0.00Max. displac. [mm] 5.75 5.75 0.00Perc. mob. moment [%] 0.00 0.00 0.00Perc. mob. resist. [%] 6.74 6.74 0.00
Step 6.3 Max. moment [kNm] 18.34 18.34 0.00Max. shear force [kN] 22.46 22.46 0.00Max. displac. [mm] 10.19 10.19 0.00Perc. mob. moment [%] 0.00 0.00 0.00Perc. mob. resist. [%] 6.18 6.18 0.00
Step 6.4 Max. moment [kNm] 13.86 13.86 0.00Max. shear force [kN] 20.56 20.56 0.00Max. displac. [mm] 5.71 5.71 0.00Perc. mob. moment [%] 0.00 0.00 0.00Perc. mob. resist. [%] 6.17 6.17 0.00
Step 6.5 Max. moment [kNm] 24.92 24.92 0.00Max. shear force [kN] 31.96 31.96 0.00Max. displac. [mm] 17.01 17.01 0.00Perc. mob. moment [%] 0.00 0.00 0.00Perc. mob. resist. [%] 14.46 14.46 0.00
Step 6.5× 1.2 Max. moment [kNm] 29.90 29.90 0.00Max. shear force [kN] 38.35 38.35 0.00
Deltares 85 of 136

D-SHEET PILING, Verification Report
Table 4.50: Results of benchmark 4-23e– Method B (only stage 2 verified)
Step Result D-SHEET PIL-ING
CUR 166(bm4-18c)
D-SHEET PIL-ING
EC7-NL(bm4-23e)
Error[%]
Step 6.3 Max. moment [kNm] 465.89 465.89 0.00Max. shear force [kN] 240.19 240.19 0.00Max. displac. [mm] 246.09 246.09 0.00Perc. mob. moment [%] 7.32 7.32 0.00Perc. mob. resist. [%] 13.22 13.22 0.00Anchor force [kN] 80.00 80.00 0.00
Step 6.4 Max. moment [kNm] 457.59 457.59 0.00Max. shear force [kN] 240.19 240.19 0.00Max. displac. [mm] 208.85 208.85 0.00Perc. mob. moment [%] 7.53 7.53 0.00Perc. mob. resist. [%] 13.62 13.62 0.00Anchor force [kN] 80.00 80.00 0.00
Step 6.5 Max. moment [kNm] 150.00 150.00 0.00Max. shear force [kN] 150.00 150.00 0.00Max. displac. [mm] 24.57 24.57 0.00Perc. mob. moment [%] 11.07 11.07 0.00Perc. mob. resist. [%] 14.91 14.91 0.00
Step 6.5 × 1.2 Max. moment [kNm] 180.00 180.00 0.00Max. shear force [kN] 180.00 180.00 0.00Anchor force [kN] 96.00 96.00 0.00
Step 9.1 Anchor force [kN] 96.00 96.00 0.00
86 of 136 Deltares
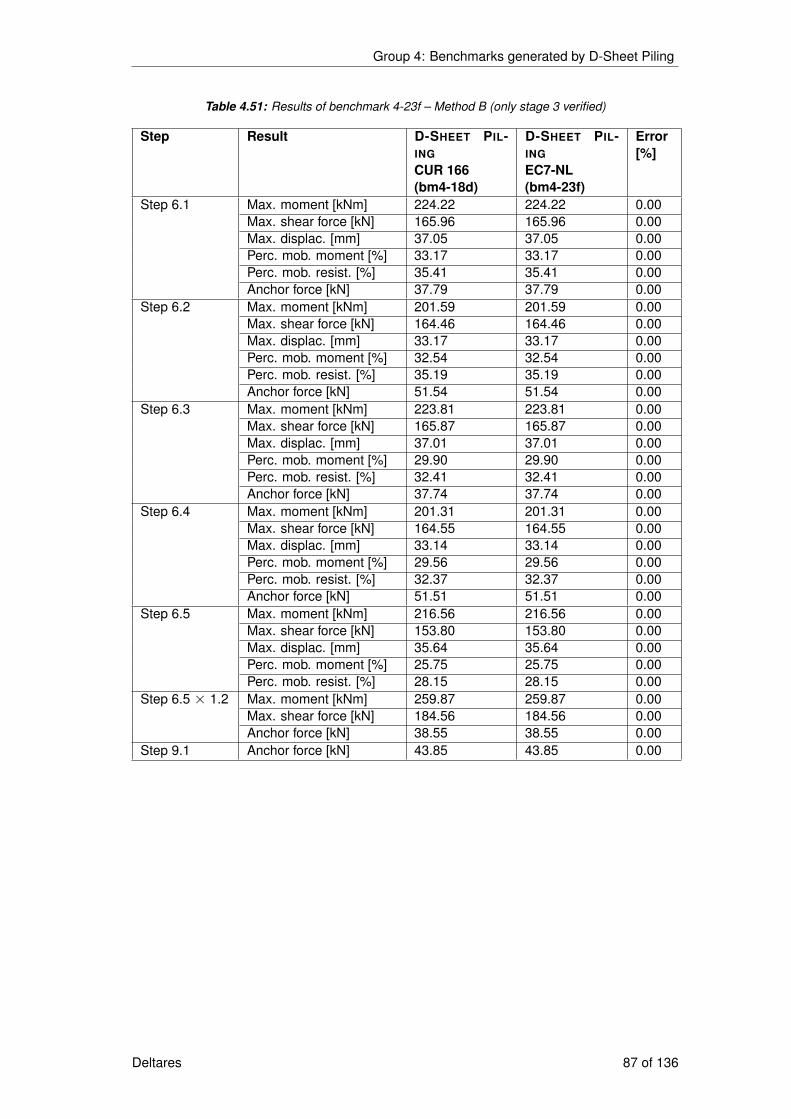
Group 4: Benchmarks generated by D-Sheet Piling
Table 4.51: Results of benchmark 4-23f – Method B (only stage 3 verified)
Step Result D-SHEET PIL-ING
CUR 166(bm4-18d)
D-SHEET PIL-ING
EC7-NL(bm4-23f)
Error[%]
Step 6.1 Max. moment [kNm] 224.22 224.22 0.00Max. shear force [kN] 165.96 165.96 0.00Max. displac. [mm] 37.05 37.05 0.00Perc. mob. moment [%] 33.17 33.17 0.00Perc. mob. resist. [%] 35.41 35.41 0.00Anchor force [kN] 37.79 37.79 0.00
Step 6.2 Max. moment [kNm] 201.59 201.59 0.00Max. shear force [kN] 164.46 164.46 0.00Max. displac. [mm] 33.17 33.17 0.00Perc. mob. moment [%] 32.54 32.54 0.00Perc. mob. resist. [%] 35.19 35.19 0.00Anchor force [kN] 51.54 51.54 0.00
Step 6.3 Max. moment [kNm] 223.81 223.81 0.00Max. shear force [kN] 165.87 165.87 0.00Max. displac. [mm] 37.01 37.01 0.00Perc. mob. moment [%] 29.90 29.90 0.00Perc. mob. resist. [%] 32.41 32.41 0.00Anchor force [kN] 37.74 37.74 0.00
Step 6.4 Max. moment [kNm] 201.31 201.31 0.00Max. shear force [kN] 164.55 164.55 0.00Max. displac. [mm] 33.14 33.14 0.00Perc. mob. moment [%] 29.56 29.56 0.00Perc. mob. resist. [%] 32.37 32.37 0.00Anchor force [kN] 51.51 51.51 0.00
Step 6.5 Max. moment [kNm] 216.56 216.56 0.00Max. shear force [kN] 153.80 153.80 0.00Max. displac. [mm] 35.64 35.64 0.00Perc. mob. moment [%] 25.75 25.75 0.00Perc. mob. resist. [%] 28.15 28.15 0.00
Step 6.5× 1.2 Max. moment [kNm] 259.87 259.87 0.00Max. shear force [kN] 184.56 184.56 0.00Anchor force [kN] 38.55 38.55 0.00
Step 9.1 Anchor force [kN] 43.85 43.85 0.00
Deltares 87 of 136
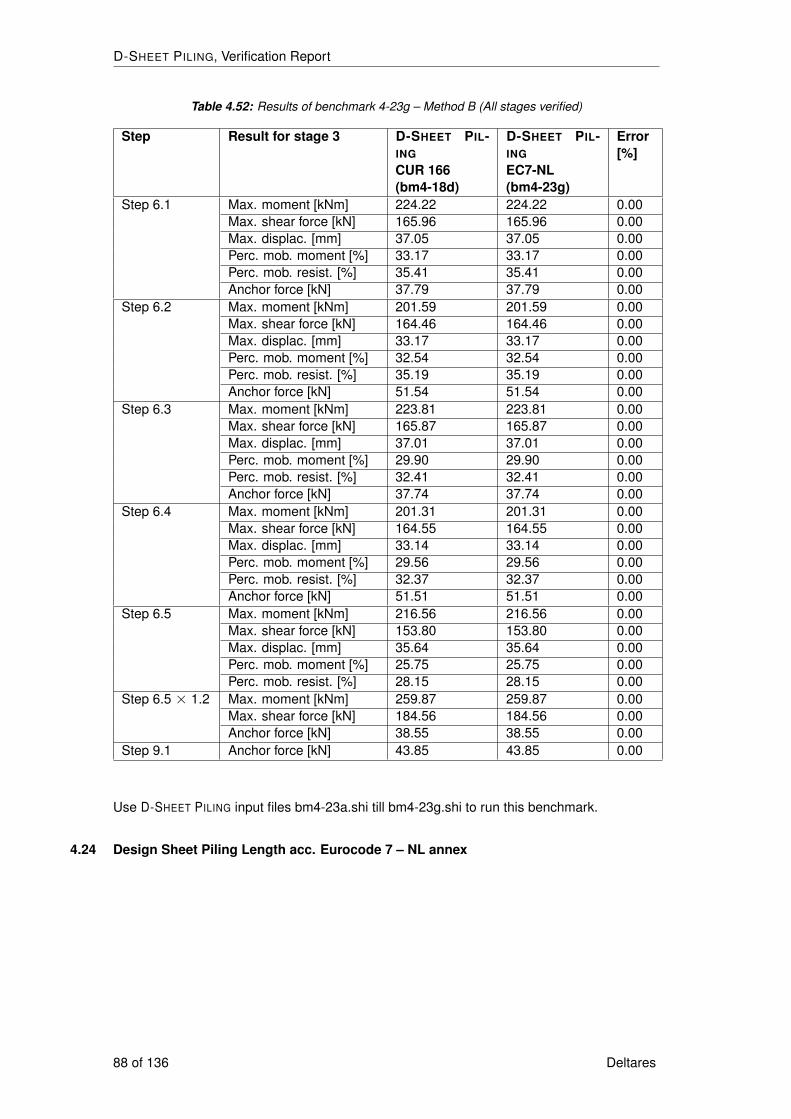
D-SHEET PILING, Verification Report
Table 4.52: Results of benchmark 4-23g – Method B (All stages verified)
Step Result for stage 3 D-SHEET PIL-ING
CUR 166(bm4-18d)
D-SHEET PIL-ING
EC7-NL(bm4-23g)
Error[%]
Step 6.1 Max. moment [kNm] 224.22 224.22 0.00Max. shear force [kN] 165.96 165.96 0.00Max. displac. [mm] 37.05 37.05 0.00Perc. mob. moment [%] 33.17 33.17 0.00Perc. mob. resist. [%] 35.41 35.41 0.00Anchor force [kN] 37.79 37.79 0.00
Step 6.2 Max. moment [kNm] 201.59 201.59 0.00Max. shear force [kN] 164.46 164.46 0.00Max. displac. [mm] 33.17 33.17 0.00Perc. mob. moment [%] 32.54 32.54 0.00Perc. mob. resist. [%] 35.19 35.19 0.00Anchor force [kN] 51.54 51.54 0.00
Step 6.3 Max. moment [kNm] 223.81 223.81 0.00Max. shear force [kN] 165.87 165.87 0.00Max. displac. [mm] 37.01 37.01 0.00Perc. mob. moment [%] 29.90 29.90 0.00Perc. mob. resist. [%] 32.41 32.41 0.00Anchor force [kN] 37.74 37.74 0.00
Step 6.4 Max. moment [kNm] 201.31 201.31 0.00Max. shear force [kN] 164.55 164.55 0.00Max. displac. [mm] 33.14 33.14 0.00Perc. mob. moment [%] 29.56 29.56 0.00Perc. mob. resist. [%] 32.37 32.37 0.00Anchor force [kN] 51.51 51.51 0.00
Step 6.5 Max. moment [kNm] 216.56 216.56 0.00Max. shear force [kN] 153.80 153.80 0.00Max. displac. [mm] 35.64 35.64 0.00Perc. mob. moment [%] 25.75 25.75 0.00Perc. mob. resist. [%] 28.15 28.15 0.00
Step 6.5 × 1.2 Max. moment [kNm] 259.87 259.87 0.00Max. shear force [kN] 184.56 184.56 0.00Anchor force [kN] 38.55 38.55 0.00
Step 9.1 Anchor force [kN] 43.85 43.85 0.00
Use D-SHEET PILING input files bm4-23a.shi till bm4-23g.shi to run this benchmark.
4.24 Design Sheet Piling Length acc. Eurocode 7 – NL annex
88 of 136 Deltares

Group 4: Benchmarks generated by D-Sheet Piling
4.24.1 Description
The same problem as in section 4.17 is considered. For the Design Sheet Piling Lengthoption, D-SHEET PILING applies the same partial factors and geometric variations as for step6.3 of the Verify Sheet Piling option. Therefore, the results of the Design Sheet Piling Lengthcalculation (for a length of 14 m) should be the same as:
� results of benchmark 4-23a/b/c (step 6.3) (section 4.23) for method A;� results of benchmark 4-23d (step 6.3) (section 4.23) for method B with stage 1 selected;� results of benchmark 4-23e (step 6.3) (section 4.23) for method B with stage 2 selected;� results of benchmark 4-23f (step 6.3) (section 4.23) for method B with stage 3 selected.
4.24.2 D-SHEET PILING results
D-SHEET PILING results are obtained using the Design Sheet Piling Length tab and selectinga sheet piling length of 14 m.
Table 4.53: Results of benchmark 4-24 – Method A
Class Result for stage 3 D-SHEET PILING
“Verify”(step 6.3)
D-SHEET PILING
“Design”(14 m length)
Error[%]
RC1 Max. displac. [mm] bm4-23a 180.83 bm4-24a 180.83 0.00Max. moment [kNm] 288.57 288.57 0.00Anchor force [kN] 37.82 37.82 0.00Mob. resistance [%] 34.30 34.30 0.00
RC2 Max. displac. [mm] bm4-23b 180.83 bm4-24b 180.83 0.00Max. moment [kNm] 288.57 288.57 0.00Anchor force [kN] 37.82 37.82 0.00Mob. resistance [%] 34.30 34.30 0.00
RC3 Max. displac. [mm] bm4-23c 180.83 bm4-24c 180.83 0.00Max. moment [kNm] 288.57 288.57 0.00Anchor force [kN] 37.82 37.82 0.00Mob. resistance [%] 34.30 34.30 0.00
Table 4.54: Results of benchmark 4-24 – Method B
Stage Results D-SHEET PILING
“Verify”(step 6.3)
D-SHEET PILING
“Design”(14 m length)
Error[%]
1 Max. displac. [mm] bm4-23d 10.19 bm4-24d 10.19 0.00Max. moment [kNm] 18.34 18.34 0.00Anchor force [kN] 0.00 0.00 0.00Mob. resistance [%] 6.18 6.18 0.00
2 Max. displac. [mm] bm4-23e 246.09 bm4-24e 246.09 0.00Max. moment [kNm] 465.89 465.89 0.00Anchor force [kN] 80.00 80.00 0.00Mob. resistance [%] 13.22 13.22 0.00
3 Max. moment [kNm] bm4-23f 37.01 bm4-24f 37.01 0.00Mob. resistance [%] 223.81 223.81 0.00Max. displac. [mm] 37.74 37.74 0.00Anchor force [kN] 32.41 32.41 0.00
Deltares 89 of 136
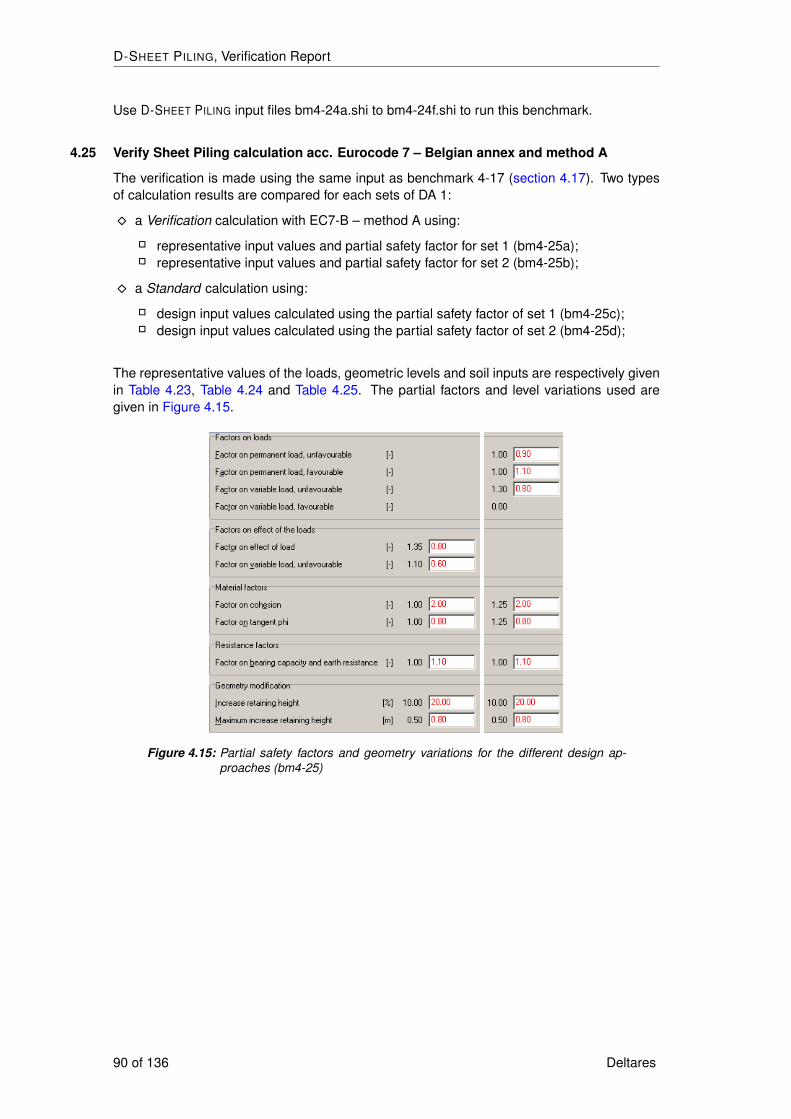
D-SHEET PILING, Verification Report
Use D-SHEET PILING input files bm4-24a.shi to bm4-24f.shi to run this benchmark.
4.25 Verify Sheet Piling calculation acc. Eurocode 7 – Belgian annex and method A
The verification is made using the same input as benchmark 4-17 (section 4.17). Two typesof calculation results are compared for each sets of DA 1:
� a Verification calculation with EC7-B – method A using:
� representative input values and partial safety factor for set 1 (bm4-25a);� representative input values and partial safety factor for set 2 (bm4-25b);
� a Standard calculation using:
� design input values calculated using the partial safety factor of set 1 (bm4-25c);� design input values calculated using the partial safety factor of set 2 (bm4-25d);
The representative values of the loads, geometric levels and soil inputs are respectively givenin Table 4.23, Table 4.24 and Table 4.25. The partial factors and level variations used aregiven in Figure 4.15.
Figure 4.15: Partial safety factors and geometry variations for the different design ap-proaches (bm4-25)
90 of 136 Deltares

Group 4: Benchmarks generated by D-Sheet Piling
4.25.1 D-SHEET PILING results (standard calculation using design input values)
A standard calculation is performed using design input values determined by applying thepartial factors of Figure 4.13. Results are given in Table 4.67, Table 4.68, Table 4.69 andTable 4.70 respectively for loads, materials and ground levels.
Table 4.55: Design values for loads for set 1 (bm4-25c)
Type of load Magnitude [kN/m2]Stage 1 Stage 2 Stage 3
Uniform Variable Fav. 20Uniform Perm. Unfav. 10 10 10Surcharge Variable Unfav. 40× 1.2 = 48 40 × 1.2 = 48Surcharge Perm. Fav. 60 60Horiz. line Perm. Fav. 200Horiz. line Perm. Unfav. -100Horiz. line Variable Fav. 150Horiz. line Variable Unfav. -300 × 1.2 = -
360
Table 4.56: Design values for loads for set 2 (bm4-25d)
Type of load Magnitude [kN/m2]Stage 1 Stage 2 Stage 3
Uniform Variable Fav. 20 × 0 = 0Uniform Perm. Unfav. 10 × 0.9 = 9 10 × 0.9 = 9 10 × 0.9 = 9Surcharge Variable Unfav. 40× 0.8 = 32 40 × 0.8 = 32Surcharge Perm. Fav. 60 × 1.1 = 66 60 × 1.1 = 66Horiz. line Perm. Fav. 200× 1.1 = 220Horiz. line Perm. Unfav. -100× 0.9 = -90Horiz. line Variable Fav. 150 × 0 = 0Horiz. line Variable Unfav. -300 × 0.8 = -
240
Table 4.57: Design values for soil parameters (bm4-25)
Parameter Unit Clay Peat Sand 1 Sand 2Set 1 (bm4-25b):Cohesion [kPa] 6.25 2.5 0 0Friction angle [◦] 25.63 29.67 36.91 43.29Delta friction angle [◦] 17.09 21.80 28.57 28.08Set 2 (bm4-25c):Cohesion [kPa] 6.25 2.5 0 0Friction angle [◦] 25.63 29.67 36.91 43.29Delta friction angle [◦] 17.09 21.80 28.57 28.08
Deltares 91 of 136
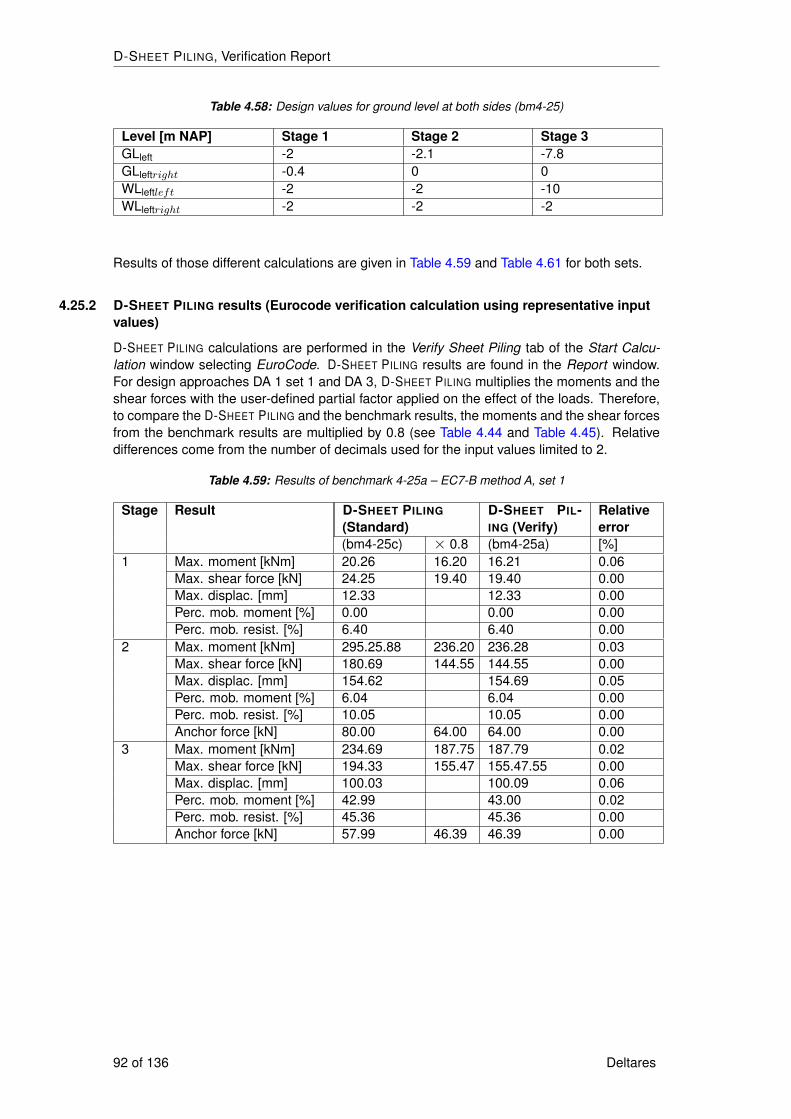
D-SHEET PILING, Verification Report
Table 4.58: Design values for ground level at both sides (bm4-25)
Level [m NAP] Stage 1 Stage 2 Stage 3GLleft -2 -2.1 -7.8GLleftright -0.4 0 0WLleftleft -2 -2 -10WLleftright -2 -2 -2
Results of those different calculations are given in Table 4.59 and Table 4.61 for both sets.
4.25.2 D-SHEET PILING results (Eurocode verification calculation using representative inputvalues)
D-SHEET PILING calculations are performed in the Verify Sheet Piling tab of the Start Calcu-lation window selecting EuroCode. D-SHEET PILING results are found in the Report window.For design approaches DA 1 set 1 and DA 3, D-SHEET PILING multiplies the moments and theshear forces with the user-defined partial factor applied on the effect of the loads. Therefore,to compare the D-SHEET PILING and the benchmark results, the moments and the shear forcesfrom the benchmark results are multiplied by 0.8 (see Table 4.44 and Table 4.45). Relativedifferences come from the number of decimals used for the input values limited to 2.
Table 4.59: Results of benchmark 4-25a – EC7-B method A, set 1
Stage Result D-SHEET PILING
(Standard)D-SHEET PIL-ING (Verify)
Relativeerror
(bm4-25c) × 0.8 (bm4-25a) [%]1 Max. moment [kNm] 20.26 16.20 16.21 0.06
Max. shear force [kN] 24.25 19.40 19.40 0.00Max. displac. [mm] 12.33 12.33 0.00Perc. mob. moment [%] 0.00 0.00 0.00Perc. mob. resist. [%] 6.40 6.40 0.00
2 Max. moment [kNm] 295.25.88 236.20 236.28 0.03Max. shear force [kN] 180.69 144.55 144.55 0.00Max. displac. [mm] 154.62 154.69 0.05Perc. mob. moment [%] 6.04 6.04 0.00Perc. mob. resist. [%] 10.05 10.05 0.00Anchor force [kN] 80.00 64.00 64.00 0.00
3 Max. moment [kNm] 234.69 187.75 187.79 0.02Max. shear force [kN] 194.33 155.47 155.47.55 0.00Max. displac. [mm] 100.03 100.09 0.06Perc. mob. moment [%] 42.99 43.00 0.02Perc. mob. resist. [%] 45.36 45.36 0.00Anchor force [kN] 57.99 46.39 46.39 0.00
92 of 136 Deltares

Group 4: Benchmarks generated by D-Sheet Piling
Table 4.60: Results of benchmark 4-25b – EC7-B method A, set 2
Stage Result D-SHEET PILING
(Standard)D-Sheet Piling(Verify)
Relativeerror
(bm4-25d) (bm4-25b) [%]1 Max. moment [kNm] 21.21 21.22 0.05
Max. shear force [kN] 25.37 25.37 0.00Max. displac. [mm] 13.34 13.34 0.00Perc. mob. moment [%] 0.00 0.00 0.00Perc. mob. resist. [%] 6.66 6.66 0.00
2 Max. moment [kNm] 467.26 467.20 0.01Max. shear force [kN] 240.19 240.19 0.00Max. displac. [mm] 259.89 259.76 0.05Perc. mob. moment [%] 6.63 6.63 0.00Perc. mob. resist. [%] 12.11 12.12 0.08Anchor force [kN] 80.00 80.00 0.00
3 Max. moment [kNm] 299.92 299.81 0.04Max. shear force [kN] 197.72 197.70 0.01Max. displac. [mm] 188.63 188.51 0.06Perc. mob. moment [%] 42.30 42.30 0.00Perc. mob. resist. [%] 44.93 44.94 0.02Anchor force [kN] 41.03 41.04 0.02
Table 4.61: Results of benchmark 4-25b – EC7-B method A, set 2
Stage Result D-SHEET PILING
(Standard)D-Sheet Piling(Verify)
Relativeerror
(bm4-17h) (bm4-25a/b) [%]1 Max. moment [kNm] 24.92 24.92 0.05
Max. shear force [kN] 31.96 31.96 0.00Max. displac. [mm] 17.01 17.01 0.00Perc. mob. moment [%] 0.00 0.00 0.00Perc. mob. resist. [%] 14.46 14.46 0.00
2 Max. moment [kNm] 150.00 150.00 0.00Max. shear force [kN] 150.00 150.00 0.00Max. displac. [mm] 24.57 24.57 0.00Perc. mob. moment [%] 11.07 11.07 0.00Perc. mob. resist. [%] 14.91 14.91 0.00Anchor force [kN] 80.00 - -
3 Max. moment [kNm] 216.56 216.56 0.00Max. shear force [kN] 153.80 153.80 0.00Max. displac. [mm] 35.64 35.64 0.00Perc. mob. moment [%] 25.75 25.75 0.00Perc. mob. resist. [%] 28.15 28.15 0.00Anchor force [kN] 41.03 - -
Use D-SHEET PILING input files bm4-25a.shi to bm4-25d.shi to run this benchmark.
4.26 Design Sheet Piling Length acc. Eurocode 7 – Belgian annex and method A
Deltares 93 of 136
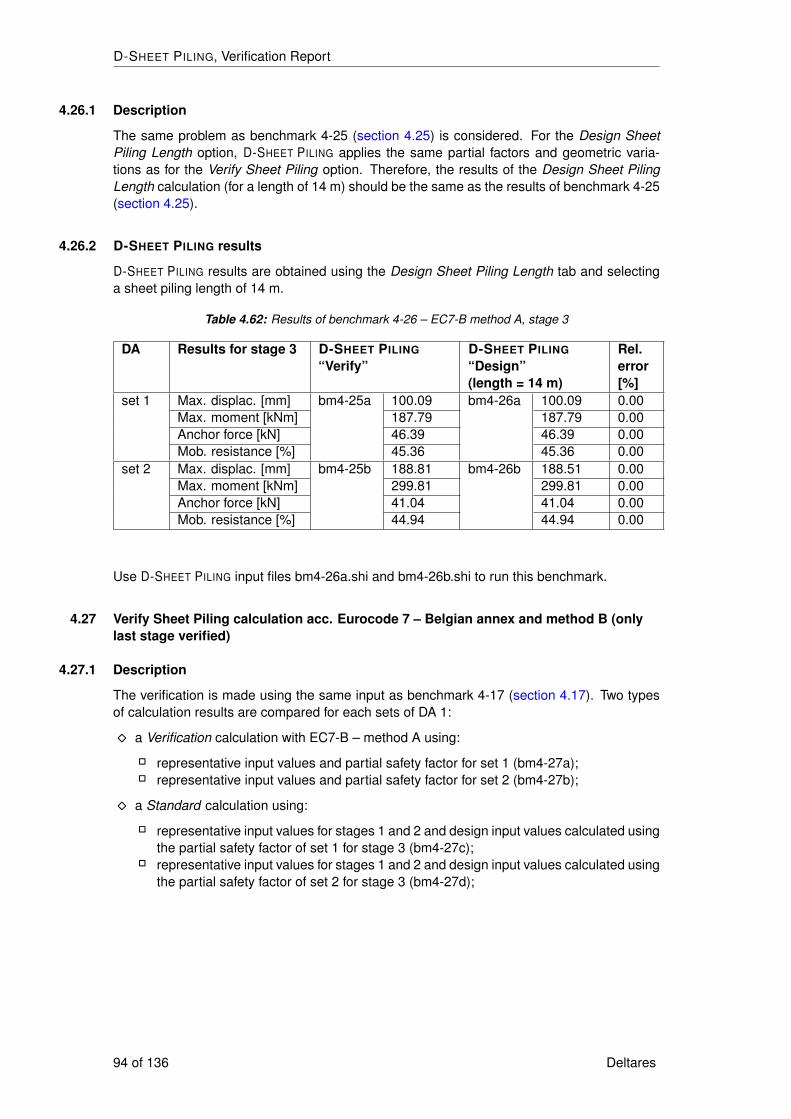
D-SHEET PILING, Verification Report
4.26.1 Description
The same problem as benchmark 4-25 (section 4.25) is considered. For the Design SheetPiling Length option, D-SHEET PILING applies the same partial factors and geometric varia-tions as for the Verify Sheet Piling option. Therefore, the results of the Design Sheet PilingLength calculation (for a length of 14 m) should be the same as the results of benchmark 4-25(section 4.25).
4.26.2 D-SHEET PILING results
D-SHEET PILING results are obtained using the Design Sheet Piling Length tab and selectinga sheet piling length of 14 m.
Table 4.62: Results of benchmark 4-26 – EC7-B method A, stage 3
DA Results for stage 3 D-SHEET PILING
“Verify”D-SHEET PILING
“Design”(length = 14 m)
Rel.error[%]
set 1 Max. displac. [mm] bm4-25a 100.09 bm4-26a 100.09 0.00Max. moment [kNm] 187.79 187.79 0.00Anchor force [kN] 46.39 46.39 0.00Mob. resistance [%] 45.36 45.36 0.00
set 2 Max. displac. [mm] bm4-25b 188.81 bm4-26b 188.51 0.00Max. moment [kNm] 299.81 299.81 0.00Anchor force [kN] 41.04 41.04 0.00Mob. resistance [%] 44.94 44.94 0.00
Use D-SHEET PILING input files bm4-26a.shi and bm4-26b.shi to run this benchmark.
4.27 Verify Sheet Piling calculation acc. Eurocode 7 – Belgian annex and method B (onlylast stage verified)
4.27.1 Description
The verification is made using the same input as benchmark 4-17 (section 4.17). Two typesof calculation results are compared for each sets of DA 1:
� a Verification calculation with EC7-B – method A using:
� representative input values and partial safety factor for set 1 (bm4-27a);� representative input values and partial safety factor for set 2 (bm4-27b);
� a Standard calculation using:
� representative input values for stages 1 and 2 and design input values calculated usingthe partial safety factor of set 1 for stage 3 (bm4-27c);
� representative input values for stages 1 and 2 and design input values calculated usingthe partial safety factor of set 2 for stage 3 (bm4-27d);
94 of 136 Deltares
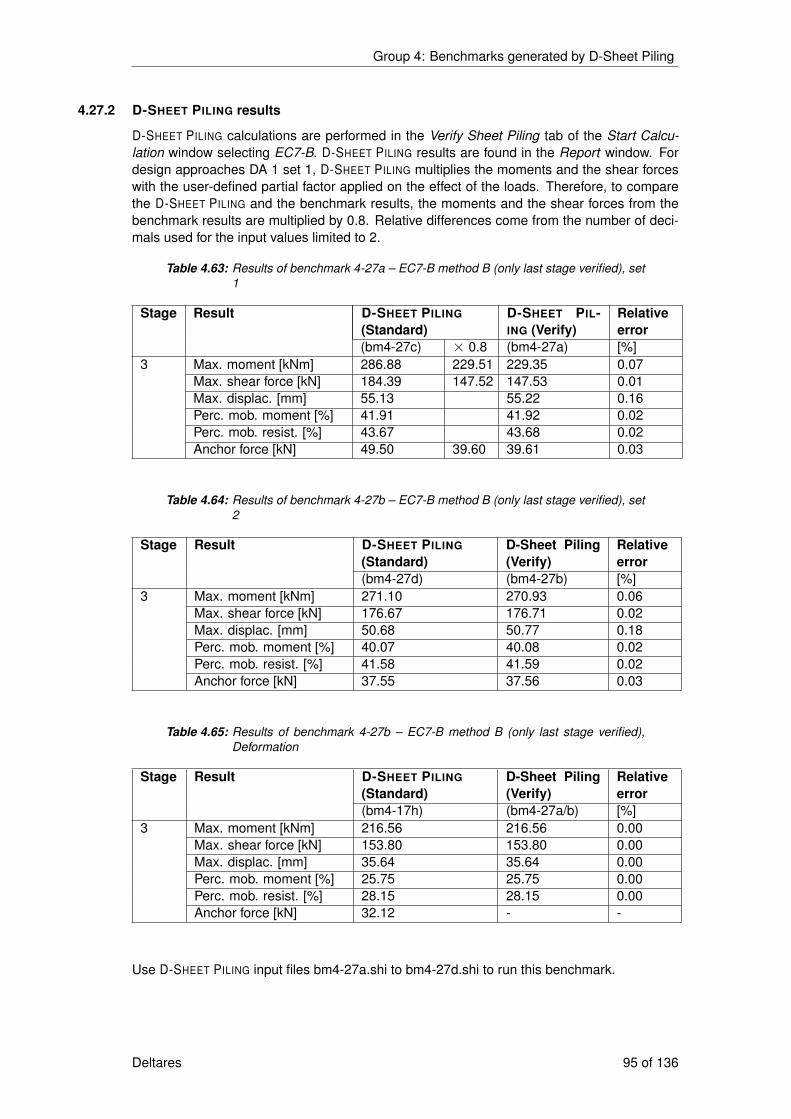
Group 4: Benchmarks generated by D-Sheet Piling
4.27.2 D-SHEET PILING results
D-SHEET PILING calculations are performed in the Verify Sheet Piling tab of the Start Calcu-lation window selecting EC7-B. D-SHEET PILING results are found in the Report window. Fordesign approaches DA 1 set 1, D-SHEET PILING multiplies the moments and the shear forceswith the user-defined partial factor applied on the effect of the loads. Therefore, to comparethe D-SHEET PILING and the benchmark results, the moments and the shear forces from thebenchmark results are multiplied by 0.8. Relative differences come from the number of deci-mals used for the input values limited to 2.
Table 4.63: Results of benchmark 4-27a – EC7-B method B (only last stage verified), set1
Stage Result D-SHEET PILING
(Standard)D-SHEET PIL-ING (Verify)
Relativeerror
(bm4-27c) × 0.8 (bm4-27a) [%]3 Max. moment [kNm] 286.88 229.51 229.35 0.07
Max. shear force [kN] 184.39 147.52 147.53 0.01Max. displac. [mm] 55.13 55.22 0.16Perc. mob. moment [%] 41.91 41.92 0.02Perc. mob. resist. [%] 43.67 43.68 0.02Anchor force [kN] 49.50 39.60 39.61 0.03
Table 4.64: Results of benchmark 4-27b – EC7-B method B (only last stage verified), set2
Stage Result D-SHEET PILING
(Standard)D-Sheet Piling(Verify)
Relativeerror
(bm4-27d) (bm4-27b) [%]3 Max. moment [kNm] 271.10 270.93 0.06
Max. shear force [kN] 176.67 176.71 0.02Max. displac. [mm] 50.68 50.77 0.18Perc. mob. moment [%] 40.07 40.08 0.02Perc. mob. resist. [%] 41.58 41.59 0.02Anchor force [kN] 37.55 37.56 0.03
Table 4.65: Results of benchmark 4-27b – EC7-B method B (only last stage verified),Deformation
Stage Result D-SHEET PILING
(Standard)D-Sheet Piling(Verify)
Relativeerror
(bm4-17h) (bm4-27a/b) [%]3 Max. moment [kNm] 216.56 216.56 0.00
Max. shear force [kN] 153.80 153.80 0.00Max. displac. [mm] 35.64 35.64 0.00Perc. mob. moment [%] 25.75 25.75 0.00Perc. mob. resist. [%] 28.15 28.15 0.00Anchor force [kN] 32.12 - -
Use D-SHEET PILING input files bm4-27a.shi to bm4-27d.shi to run this benchmark.
Deltares 95 of 136

D-SHEET PILING, Verification Report
4.28 Design Sheet Piling Length acc. Eurocode 7 – Belgian annex and method B (only laststage verified)
4.28.1 Description
The same problem as benchmark 4-27 (section 4.27) is considered. For the Design SheetPiling Length option, D-SHEET PILING applies the same partial factors and geometric varia-tions as for the Verify Sheet Piling option. Therefore, the results of the Design Sheet PilingLength calculation (for a length of 14 m) should be the same as the results of benchmark 4-25(section 4.27).
4.28.2 D-SHEET PILING results
D-SHEET PILING results are obtained using the Design Sheet Piling Length tab and selectinga sheet piling length of 14 m.
Table 4.66: Results of benchmark 4-28 – EC7-B method B, stage 3
DA Results for stage 3 D-SHEET PILING
“Verify”D-SHEET PILING
“Design”(length = 14 m)
Rel.error[%]
set 1 Max. displac. [mm] bm4-27a 55.22 bm4-28a 55.22 0.00Max. moment [kNm] 229.35 229.35 0.00Anchor force [kN] 39.61 39.61 0.00Mob. resistance [%] 43.68 43.68 0.00
set 2 Max. displac. [mm] bm4-27b 50.77 bm4-28b 50.77 0.00Max. moment [kNm] 270.93 270.93 0.00Anchor force [kN] 37.56 37.56 0.00Mob. resistance [%] 41.59 41.59 0.00
4.29 Total settlement by vibration
4.29.1 Description
For this benchmark, the D-SHEET PILING results of benchmark 5-6 (section 5.6) during theinstallation of the sheet piling are used to deduce the settlements during removal of the sheetpiling and during “installation + removal” using the following formulas:
∆z (r) = 0.2×∆zdensification (r) + ∆zsheet volume (r) during removal (4.8)
∆z (r) = 1.2×∆zdensification (r) during installation and removal (4.9)
96 of 136 Deltares
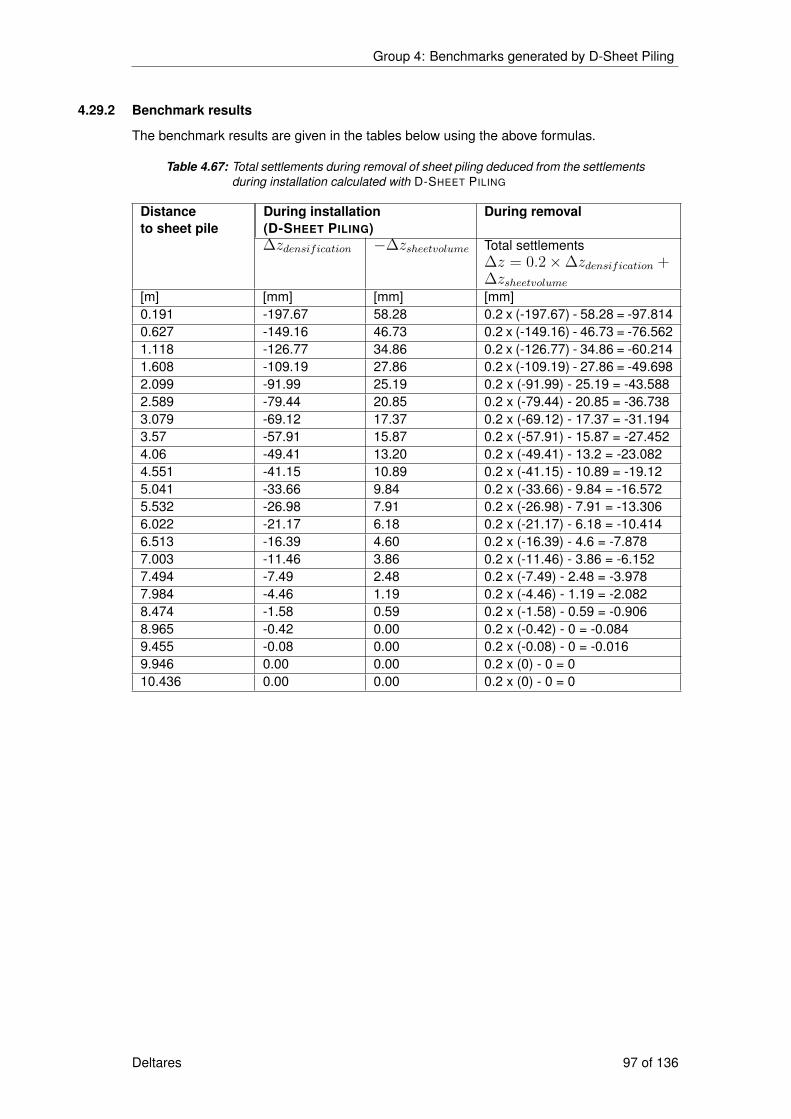
Group 4: Benchmarks generated by D-Sheet Piling
4.29.2 Benchmark results
The benchmark results are given in the tables below using the above formulas.
Table 4.67: Total settlements during removal of sheet piling deduced from the settlementsduring installation calculated with D-SHEET PILING
Distanceto sheet pile
During installation(D-SHEET PILING)
During removal
∆zdensification −∆zsheetvolume Total settlements∆z = 0.2×∆zdensification +∆zsheetvolume
[m] [mm] [mm] [mm]0.191 -197.67 58.28 0.2 x (-197.67) - 58.28 = -97.8140.627 -149.16 46.73 0.2 x (-149.16) - 46.73 = -76.5621.118 -126.77 34.86 0.2 x (-126.77) - 34.86 = -60.2141.608 -109.19 27.86 0.2 x (-109.19) - 27.86 = -49.6982.099 -91.99 25.19 0.2 x (-91.99) - 25.19 = -43.5882.589 -79.44 20.85 0.2 x (-79.44) - 20.85 = -36.7383.079 -69.12 17.37 0.2 x (-69.12) - 17.37 = -31.1943.57 -57.91 15.87 0.2 x (-57.91) - 15.87 = -27.4524.06 -49.41 13.20 0.2 x (-49.41) - 13.2 = -23.0824.551 -41.15 10.89 0.2 x (-41.15) - 10.89 = -19.125.041 -33.66 9.84 0.2 x (-33.66) - 9.84 = -16.5725.532 -26.98 7.91 0.2 x (-26.98) - 7.91 = -13.3066.022 -21.17 6.18 0.2 x (-21.17) - 6.18 = -10.4146.513 -16.39 4.60 0.2 x (-16.39) - 4.6 = -7.8787.003 -11.46 3.86 0.2 x (-11.46) - 3.86 = -6.1527.494 -7.49 2.48 0.2 x (-7.49) - 2.48 = -3.9787.984 -4.46 1.19 0.2 x (-4.46) - 1.19 = -2.0828.474 -1.58 0.59 0.2 x (-1.58) - 0.59 = -0.9068.965 -0.42 0.00 0.2 x (-0.42) - 0 = -0.0849.455 -0.08 0.00 0.2 x (-0.08) - 0 = -0.0169.946 0.00 0.00 0.2 x (0) - 0 = 010.436 0.00 0.00 0.2 x (0) - 0 = 0
Deltares 97 of 136
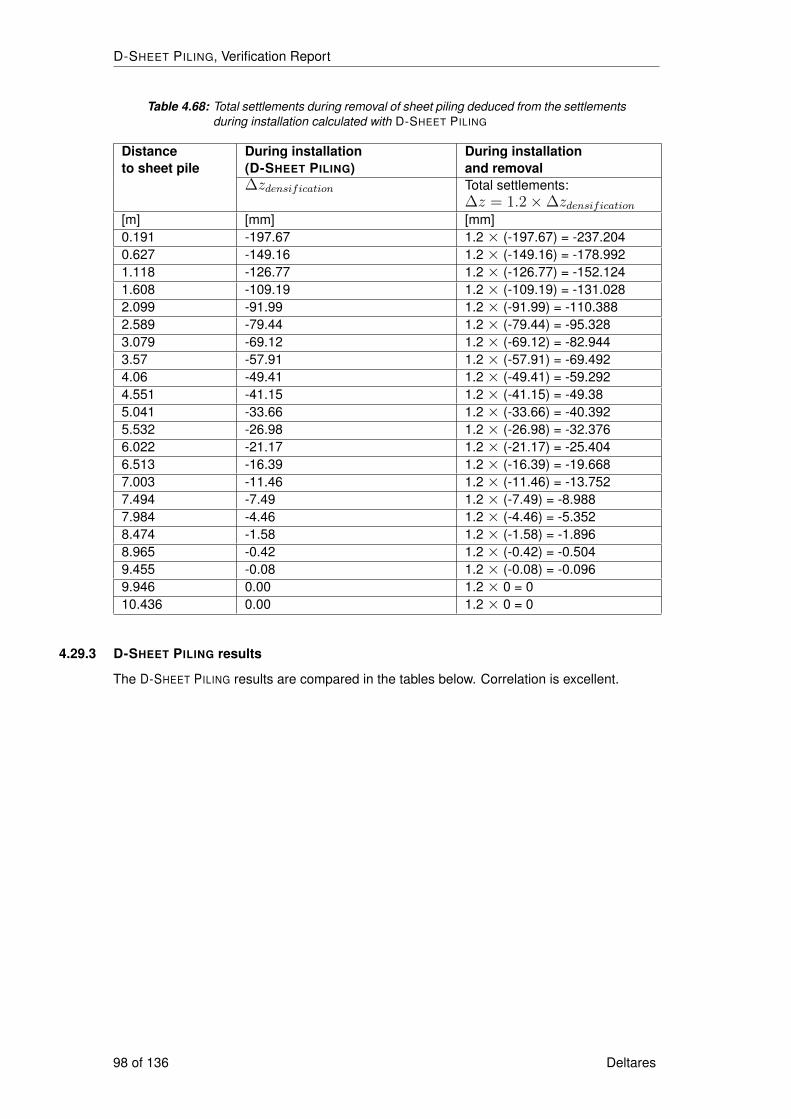
D-SHEET PILING, Verification Report
Table 4.68: Total settlements during removal of sheet piling deduced from the settlementsduring installation calculated with D-SHEET PILING
Distanceto sheet pile
During installation(D-SHEET PILING)
During installationand removal
∆zdensification Total settlements:∆z = 1.2×∆zdensification
[m] [mm] [mm]0.191 -197.67 1.2× (-197.67) = -237.2040.627 -149.16 1.2× (-149.16) = -178.9921.118 -126.77 1.2× (-126.77) = -152.1241.608 -109.19 1.2× (-109.19) = -131.0282.099 -91.99 1.2× (-91.99) = -110.3882.589 -79.44 1.2× (-79.44) = -95.3283.079 -69.12 1.2× (-69.12) = -82.9443.57 -57.91 1.2× (-57.91) = -69.4924.06 -49.41 1.2× (-49.41) = -59.2924.551 -41.15 1.2× (-41.15) = -49.385.041 -33.66 1.2× (-33.66) = -40.3925.532 -26.98 1.2× (-26.98) = -32.3766.022 -21.17 1.2× (-21.17) = -25.4046.513 -16.39 1.2× (-16.39) = -19.6687.003 -11.46 1.2× (-11.46) = -13.7527.494 -7.49 1.2× (-7.49) = -8.9887.984 -4.46 1.2× (-4.46) = -5.3528.474 -1.58 1.2× (-1.58) = -1.8968.965 -0.42 1.2× (-0.42) = -0.5049.455 -0.08 1.2× (-0.08) = -0.0969.946 0.00 1.2× 0 = 010.436 0.00 1.2× 0 = 0
4.29.3 D-SHEET PILING results
The D-SHEET PILING results are compared in the tables below. Correlation is excellent.
98 of 136 Deltares
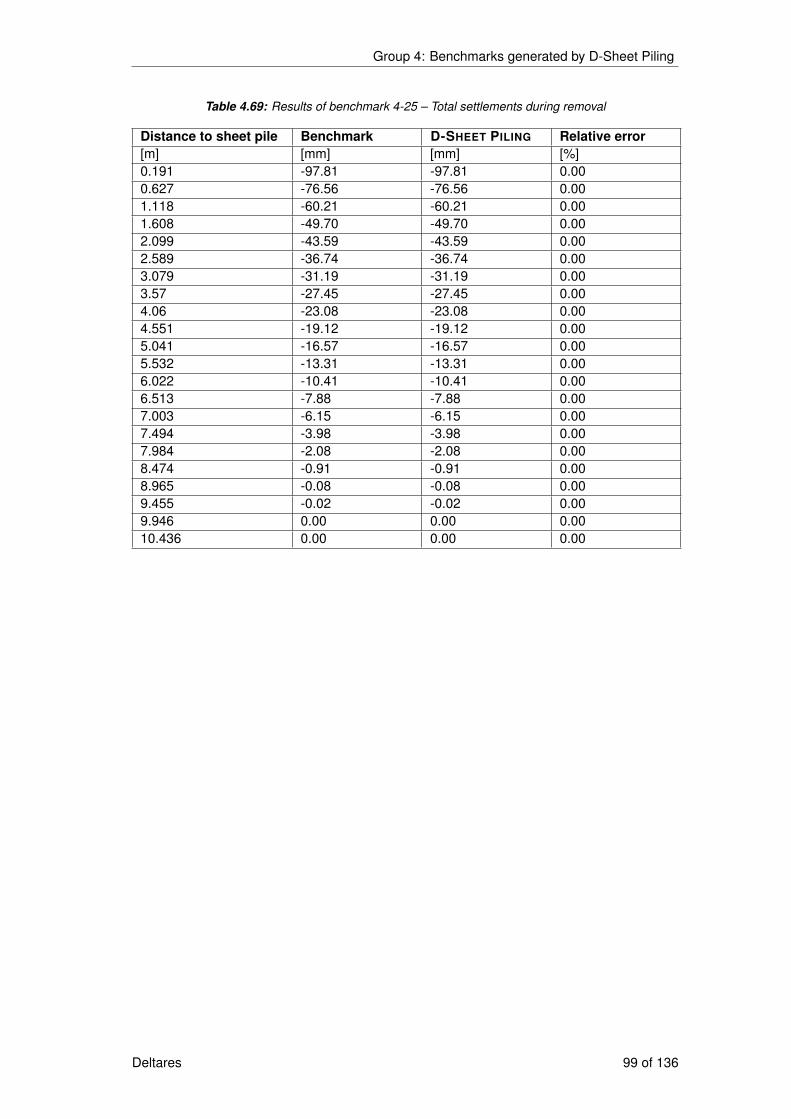
Group 4: Benchmarks generated by D-Sheet Piling
Table 4.69: Results of benchmark 4-25 – Total settlements during removal
Distance to sheet pile Benchmark D-SHEET PILING Relative error[m] [mm] [mm] [%]0.191 -97.81 -97.81 0.000.627 -76.56 -76.56 0.001.118 -60.21 -60.21 0.001.608 -49.70 -49.70 0.002.099 -43.59 -43.59 0.002.589 -36.74 -36.74 0.003.079 -31.19 -31.19 0.003.57 -27.45 -27.45 0.004.06 -23.08 -23.08 0.004.551 -19.12 -19.12 0.005.041 -16.57 -16.57 0.005.532 -13.31 -13.31 0.006.022 -10.41 -10.41 0.006.513 -7.88 -7.88 0.007.003 -6.15 -6.15 0.007.494 -3.98 -3.98 0.007.984 -2.08 -2.08 0.008.474 -0.91 -0.91 0.008.965 -0.08 -0.08 0.009.455 -0.02 -0.02 0.009.946 0.00 0.00 0.0010.436 0.00 0.00 0.00
Deltares 99 of 136
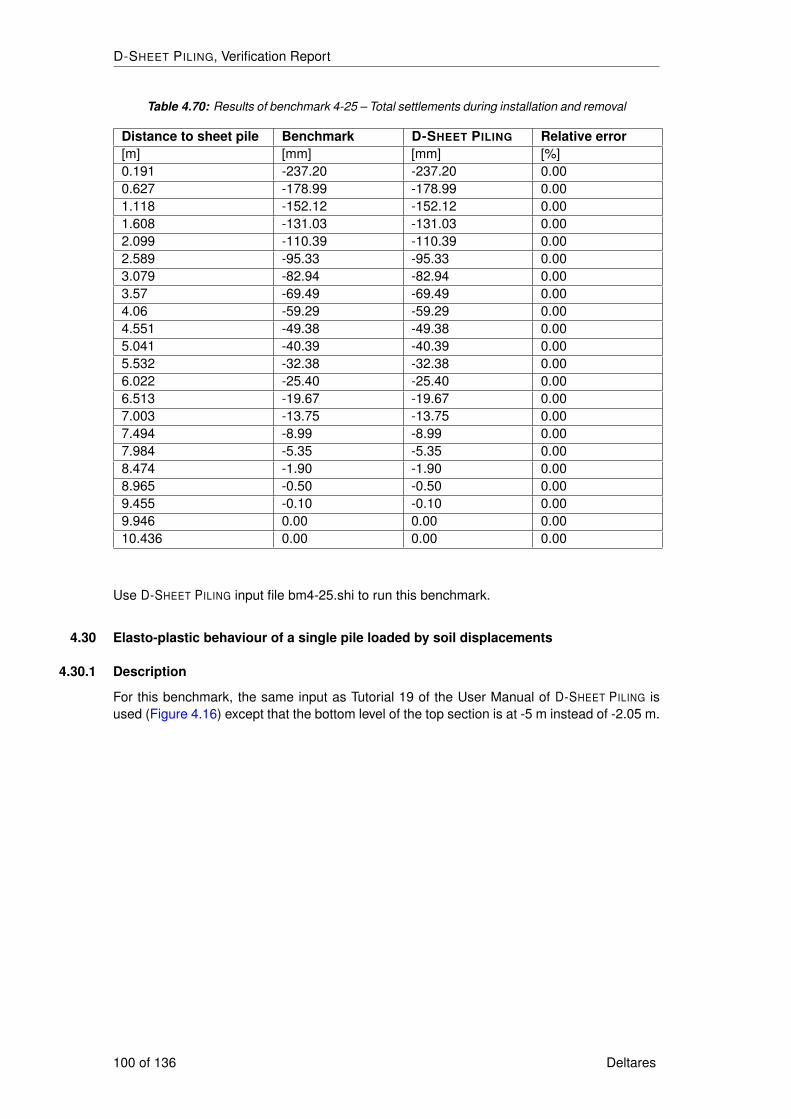
D-SHEET PILING, Verification Report
Table 4.70: Results of benchmark 4-25 – Total settlements during installation and removal
Distance to sheet pile Benchmark D-SHEET PILING Relative error[m] [mm] [mm] [%]0.191 -237.20 -237.20 0.000.627 -178.99 -178.99 0.001.118 -152.12 -152.12 0.001.608 -131.03 -131.03 0.002.099 -110.39 -110.39 0.002.589 -95.33 -95.33 0.003.079 -82.94 -82.94 0.003.57 -69.49 -69.49 0.004.06 -59.29 -59.29 0.004.551 -49.38 -49.38 0.005.041 -40.39 -40.39 0.005.532 -32.38 -32.38 0.006.022 -25.40 -25.40 0.006.513 -19.67 -19.67 0.007.003 -13.75 -13.75 0.007.494 -8.99 -8.99 0.007.984 -5.35 -5.35 0.008.474 -1.90 -1.90 0.008.965 -0.50 -0.50 0.009.455 -0.10 -0.10 0.009.946 0.00 0.00 0.0010.436 0.00 0.00 0.00
Use D-SHEET PILING input file bm4-25.shi to run this benchmark.
4.30 Elasto-plastic behaviour of a single pile loaded by soil displacements
4.30.1 Description
For this benchmark, the same input as Tutorial 19 of the User Manual of D-SHEET PILING isused (Figure 4.16) except that the bottom level of the top section is at -5 m instead of -2.05 m.
100 of 136 Deltares
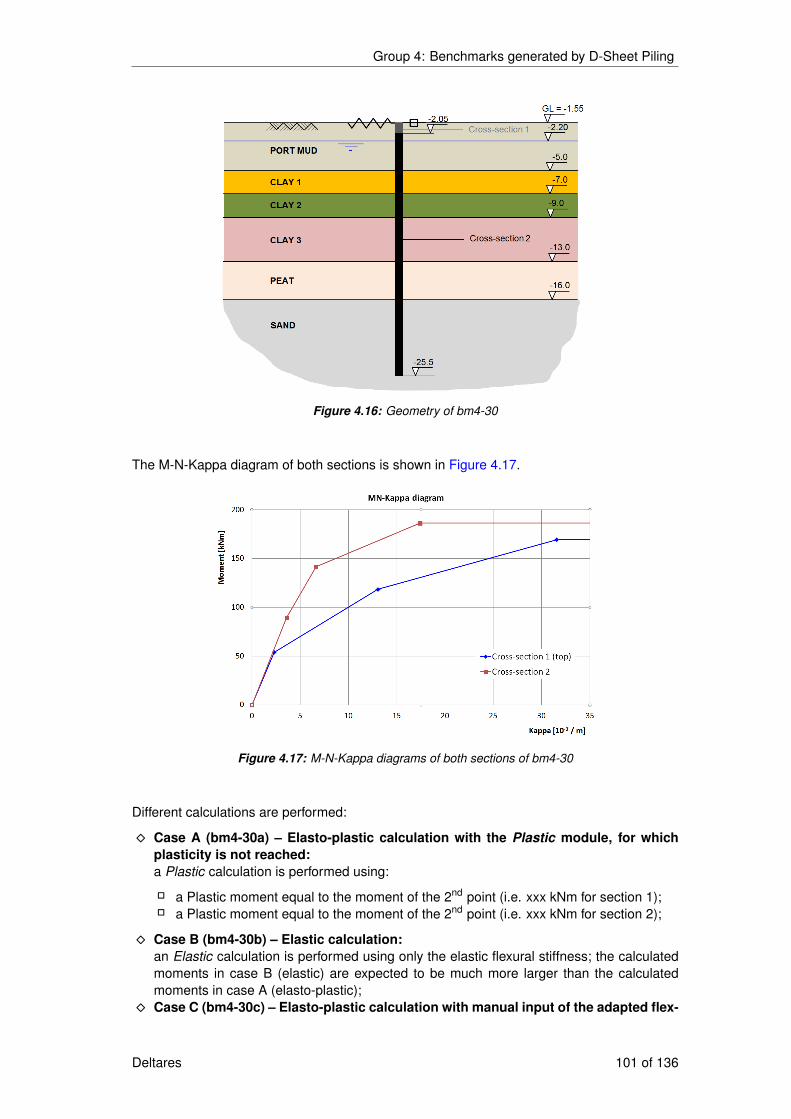
Group 4: Benchmarks generated by D-Sheet Piling
Figure 4.16: Geometry of bm4-30
The M-N-Kappa diagram of both sections is shown in Figure 4.17.
Figure 4.17: M-N-Kappa diagrams of both sections of bm4-30
Different calculations are performed:
� Case A (bm4-30a) – Elasto-plastic calculation with the Plastic module, for whichplasticity is not reached:a Plastic calculation is performed using:
� a Plastic moment equal to the moment of the 2nd point (i.e. xxx kNm for section 1);� a Plastic moment equal to the moment of the 2nd point (i.e. xxx kNm for section 2);
� Case B (bm4-30b) – Elastic calculation:an Elastic calculation is performed using only the elastic flexural stiffness; the calculatedmoments in case B (elastic) are expected to be much more larger than the calculatedmoments in case A (elasto-plastic);
� Case C (bm4-30c) – Elasto-plastic calculation with manual input of the adapted flex-
Deltares 101 of 136

D-SHEET PILING, Verification Report
ural stiffness:an Elastic calculation is performed using several pile sections with an adapted flexuralstiffness deduced from the calculated Moment chart of the Plastic calculation (bm4-30a);the calculated moments in case C are expected to be close to the calculated moments incase A (elasto-plastic);
� Case D (bm4-30d) – Elasto-plastic calculation with the Plastic module, for whichplasticity is reached:a Plastic calculation is performed using the Plastic moments given in Figure 4.17; thecalculated moments in case D are expected to reach the Plastic moment for some pointsalong the pile without exceeding it;
� Case E (bm4-30e) – Elastic calculation with the Plastic module:a Plastic calculation is performed using the elastic stiffness for all the branches of theM-N-Kappa diagram; the calculated moments in case E are expected to be equal to thecalculated moments in case B.
4.30.2 D-SHEET PILING results
The results of bm4-30a are shown in Figure 4.22. The calculated moments in bm4-30a areused to deduce the manual inputted flexural stiffness used in bm4-30c by dividing the pile into20 sections and by calculating an average flexural stiffness for each section. The values of thecalculated moments and the deduced flexural stiffness are given in Table 4.71. Figure 4.22shows the effect of a plastic calculation compare to an elastic calculation and shows that anelastic calculation (bm4-30b) and a plastic calculation with an elastic behaviour (bm4-30e)give the same results, so as expected.
Figure 4.18: Comparison of the results of benchmarks bm4-30a, bm4-30b and bm4-30e
Table 4.71: Moments calculated for benchmark 4-30a and input values of EI for bench-mark 4-30c
Level Calculatedmoment(bm4-30a)
Branch ofthe M-N-Kappadiagram
Corresponding EIper point acc. toM-N-Kappa diagram
Average EIper section
[m] [kNm] [kNm2] [kNm2]
102 of 136 Deltares

Group 4: Benchmarks generated by D-Sheet Piling
-1.55 -169.2 Section 1 - Branch 3 5361.57-1.77 -154.79 Section 1 - Branch 3 6419.048-1.98 -140.57 Section 1 - Branch 3 7462.582 6403.347-2.2 -126.71 Section 1 - Branch 3 8479.698-2.33 -118.5 Section 1 - Branch 3 9082.189 8272.778-2.43 -112.25 Section 1 - Branch 2 10481.396-2.67 -98.24 Section 1 - Branch 2 13617.857-2.9 -84.67 Section 1 - Branch 2 16655.814 12900.693-3.13 -71.48 Section 1 - Branch 2 19608.699-3.37 -58.65 Section 1 - Branch 2 22480.99-3.46 -54 Section 1 - Branch 2 23522 20139.325-3.6 -46.12 Section 1 - Branch 1 23522-3.83 -33.86 Section 1 - Branch 1 23522-4.07 -21.82 Section 1 - Branch 1 23522-4.3 -9.95 Section 1 - Branch 1 23522-4.53 1.8 Section 1 - Branch 1 23522-4.77 13.47 Section 1 - Branch 1 23522-5 25.12 Section 1 - Branch 1 23522 23522-5.17 33.44 Section 2 - Branch 1 24929-5.33 41.78 Section 2 - Branch 1 24929-5.5 50.13 Section 2 - Branch 1 24929-5.71 60.91 Section 2 - Branch 1 24929-5.93 71.68 Section 2 - Branch 1 24929-6.14 82.37 Section 2 - Branch 1 24929-6.28 89.1 Section 2 - Branch 2 24929 24835.591-6.36 92.92 Section 2 - Branch 2 24667.911-6.57 103.26 Section 2 - Branch 2 23961.195-6.79 113.33 Section 2 - Branch 2 23272.932 24089.107-7 123.06 Section 2 - Branch 2 22607.908-7.22 132.52 Section 2 - Branch 2 21961.337-7.44 141.15 Section 2 - Branch 2 21371.496-7.45 141.6 Section 2 - Branch 3 21340.739 22268.698-7.67 148.98 Section 2 - Branch 3 19581.545-7.89 156.02 Section 2 - Branch 3 17903.399-8.11 162.3 Section 2 - Branch 3 16406.415-8.33 167.84 Section 2 - Branch 3 15085.828 18017.223-8.56 172.65 Section 2 - Branch 3 13939.253-8.78 176.74 Section 2 - Branch 3 12964.307-9 180.11 Section 2 - Branch 3 12160.99-9.24 182.13 Section 2 - Branch 3 11679.476 13101.005-9.47 182.01 Section 2 - Branch 3 11708.081-9.71 180.02 Section 2 - Branch 3 12182.443-9.94 176.41 Section 2 - Branch 3 13042.97-10.18 171.39 Section 2 - Branch 3 14239.604 12480.067-10.41 165.15 Section 2 - Branch 3 15727.052-10.65 157.84 Section 2 - Branch 3 17469.56-10.88 149.62 Section 2 - Branch 3 19428.987-11.09 141.6 Section 2 - Branch 3 21340.739 17542.369-11.12 140.6 Section 2 - Branch 2 21409.087-11.35 130.88 Section 2 - Branch 2 22073.428-11.59 120.58 Section 2 - Branch 2 22777.41 22052.27-11.82 109.75 Section 2 - Branch 2 23517.617-12.06 98.48 Section 2 - Branch 2 24287.897
Deltares 103 of 136
D-SHEET PILING, Verification Report
-12.25 89.1 Section 2 - Branch 2 24929 23837.279-12.29 86.84 Section 2 - Branch 1 24929-12.53 74.88 Section 2 - Branch 1 24929-12.76 62.65 Section 2 - Branch 1 24929-13 50.2 Section 2 - Branch 1 24929-13.23 37.89 Section 2 - Branch 1 24929-13.46 25.55 Section 2 - Branch 1 24929-13.69 13.19 Section 2 - Branch 1 24929-13.92 0.82 Section 2 - Branch 1 24929-14.15 -11.55 Section 2 - Branch 1 24929-14.38 -23.93 Section 2 - Branch 1 24929-14.62 -36.3 Section 2 - Branch 1 24929-14.85 -48.66 Section 2 - Branch 1 24929-15.08 -61 Section 2 - Branch 1 24929-15.31 -73.32 Section 2 - Branch 1 24929-15.54 -85.61 Section 2 - Branch 1 24929-15.61 -89.1 Section 2 - Branch 2 24929 24929-15.77 -97.86 Section 2 - Branch 2 24330.273-16 -110.06 Section 2 - Branch 2 23496.43-16.22 -120.83 Section 2 - Branch 2 22760.324-16.44 -129.82 Section 2 - Branch 2 22145.877-16.67 -137.19 Section 2 - Branch 2 21642.153-16.84 -141.6 Section 2 - Branch 3 21340.739 22903.654-16.89 -143.04 Section 2 - Branch 3 20997.482-17.11 -147.42 Section 2 - Branch 3 19953.408-17.33 -150.31 Section 2 - Branch 3 19264.509-17.56 -151.65 Section 2 - Branch 3 18945.089 19828.744-17.78 -151.3 Section 2 - Branch 3 19028.52-18 -149.02 Section 2 - Branch 3 19572.011-18.23 -144.38 Section 2 - Branch 3 20678.062-18.33 -141.6 Section 2 - Branch 3 21340.739 19682.777-18.47 -137.85 Section 2 - Branch 2 21597.044-18.7 -129.93 Section 2 - Branch 2 22138.358-18.94 -121.04 Section 2 - Branch 2 22745.97-19.17 -111.54 Section 2 - Branch 2 23395.275-19.41 -101.73 Section 2 - Branch 2 24065.767-19.64 -91.85 Section 2 - Branch 2 24741.043-19.71 -89.1 Section 2 - Branch 2 24929 23024.252-19.88 -82.11 Section 2 - Branch 1 24929-20.11 -72.67 Section 2 - Branch 1 24929-20.34 -63.66 Section 2 - Branch 1 24929-20.58 -55.18 Section 2 - Branch 1 24929-20.81 -47.29 Section 2 - Branch 1 24929-21.05 -40.04 Section 2 - Branch 1 24929-21.28 -33.46 Section 2 - Branch 1 24929-21.52 -27.55 Section 2 - Branch 1 24929-21.75 -22.32 Section 2 - Branch 1 24929-21.98 -17.75 Section 2 - Branch 1 24929-22.22 -13.8 Section 2 - Branch 1 24929-22.45 -10.46 Section 2 - Branch 1 24929-22.69 -7.67 Section 2 - Branch 1 24929-22.92 -5.4 Section 2 - Branch 1 24929-23.16 -3.59 Section 2 - Branch 1 24929
104 of 136 Deltares
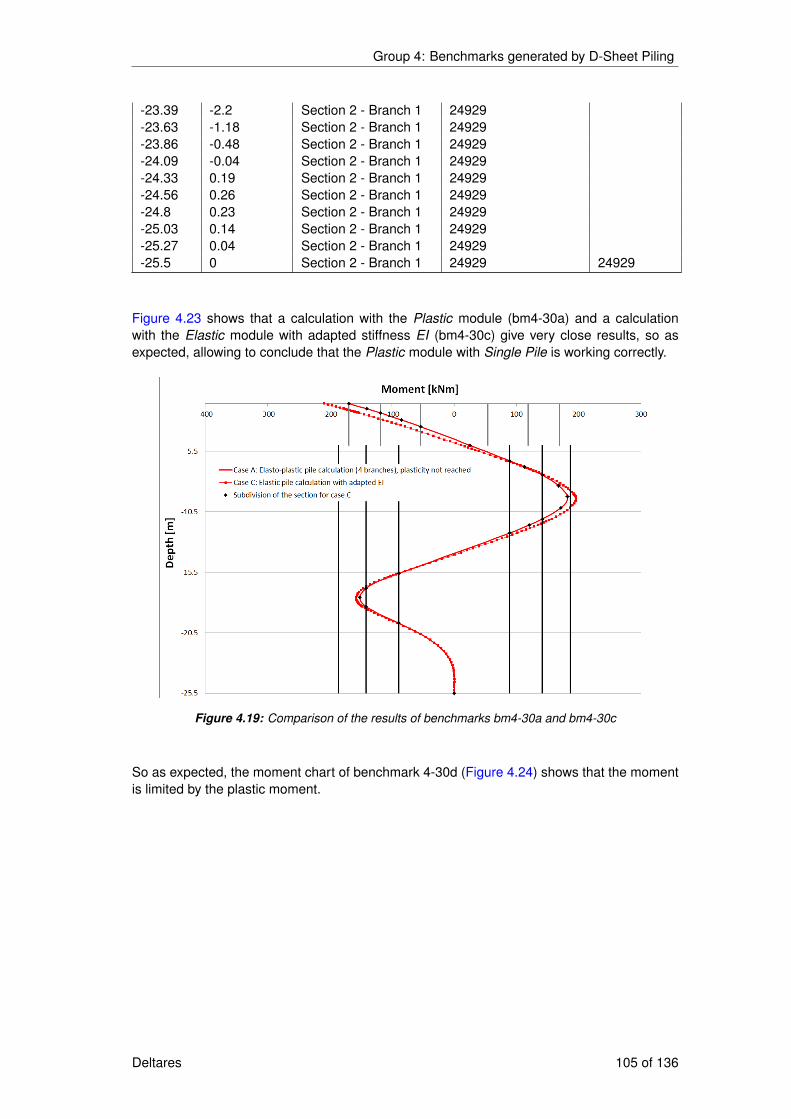
Group 4: Benchmarks generated by D-Sheet Piling
-23.39 -2.2 Section 2 - Branch 1 24929-23.63 -1.18 Section 2 - Branch 1 24929-23.86 -0.48 Section 2 - Branch 1 24929-24.09 -0.04 Section 2 - Branch 1 24929-24.33 0.19 Section 2 - Branch 1 24929-24.56 0.26 Section 2 - Branch 1 24929-24.8 0.23 Section 2 - Branch 1 24929-25.03 0.14 Section 2 - Branch 1 24929-25.27 0.04 Section 2 - Branch 1 24929-25.5 0 Section 2 - Branch 1 24929 24929
Figure 4.23 shows that a calculation with the Plastic module (bm4-30a) and a calculationwith the Elastic module with adapted stiffness EI (bm4-30c) give very close results, so asexpected, allowing to conclude that the Plastic module with Single Pile is working correctly.
Figure 4.19: Comparison of the results of benchmarks bm4-30a and bm4-30c
So as expected, the moment chart of benchmark 4-30d (Figure 4.24) shows that the momentis limited by the plastic moment.
Deltares 105 of 136
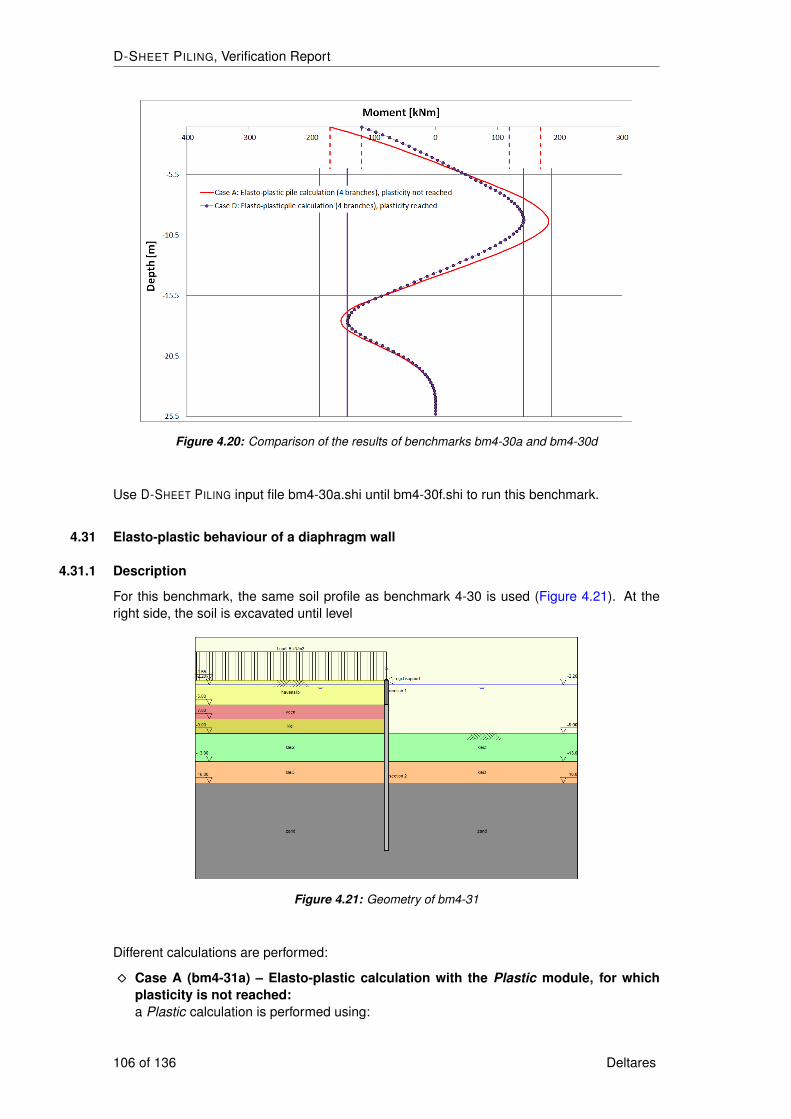
D-SHEET PILING, Verification Report
Figure 4.20: Comparison of the results of benchmarks bm4-30a and bm4-30d
Use D-SHEET PILING input file bm4-30a.shi until bm4-30f.shi to run this benchmark.
4.31 Elasto-plastic behaviour of a diaphragm wall
4.31.1 Description
For this benchmark, the same soil profile as benchmark 4-30 is used (Figure 4.21). At theright side, the soil is excavated until level
Figure 4.21: Geometry of bm4-31
Different calculations are performed:
� Case A (bm4-31a) – Elasto-plastic calculation with the Plastic module, for whichplasticity is not reached:a Plastic calculation is performed using:
106 of 136 Deltares
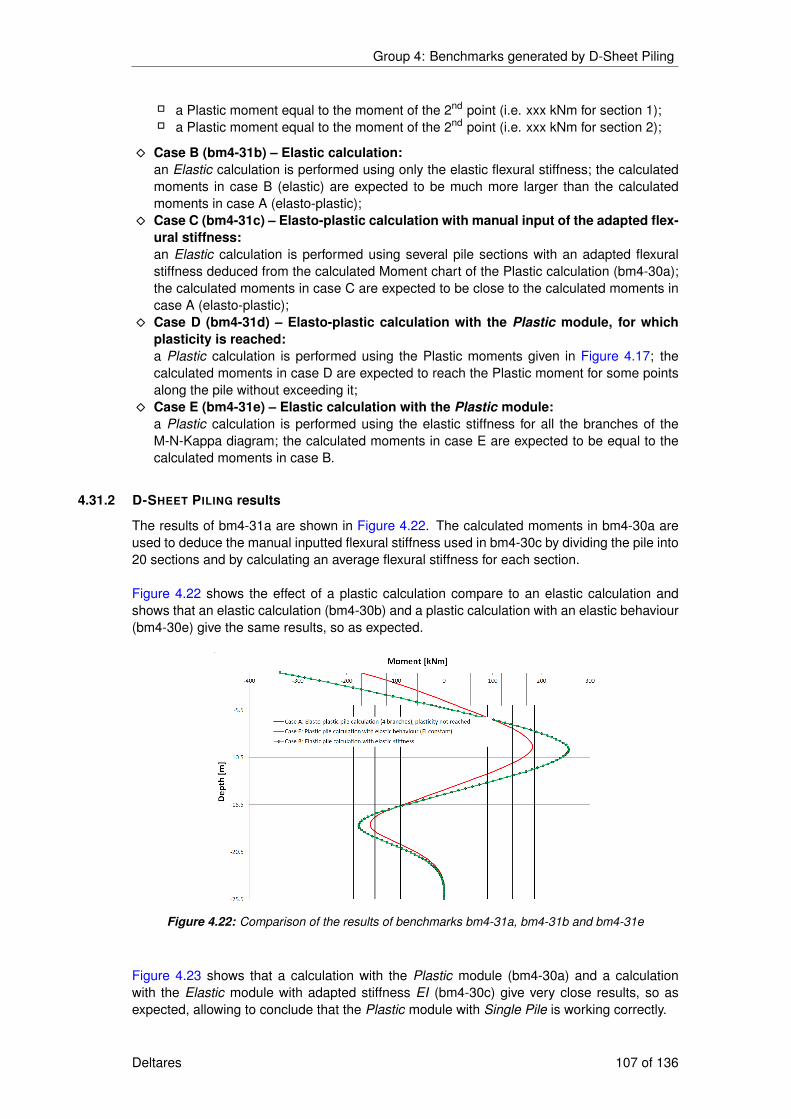
Group 4: Benchmarks generated by D-Sheet Piling
� a Plastic moment equal to the moment of the 2nd point (i.e. xxx kNm for section 1);� a Plastic moment equal to the moment of the 2nd point (i.e. xxx kNm for section 2);
� Case B (bm4-31b) – Elastic calculation:an Elastic calculation is performed using only the elastic flexural stiffness; the calculatedmoments in case B (elastic) are expected to be much more larger than the calculatedmoments in case A (elasto-plastic);
� Case C (bm4-31c) – Elasto-plastic calculation with manual input of the adapted flex-ural stiffness:an Elastic calculation is performed using several pile sections with an adapted flexuralstiffness deduced from the calculated Moment chart of the Plastic calculation (bm4-30a);the calculated moments in case C are expected to be close to the calculated moments incase A (elasto-plastic);
� Case D (bm4-31d) – Elasto-plastic calculation with the Plastic module, for whichplasticity is reached:a Plastic calculation is performed using the Plastic moments given in Figure 4.17; thecalculated moments in case D are expected to reach the Plastic moment for some pointsalong the pile without exceeding it;
� Case E (bm4-31e) – Elastic calculation with the Plastic module:a Plastic calculation is performed using the elastic stiffness for all the branches of theM-N-Kappa diagram; the calculated moments in case E are expected to be equal to thecalculated moments in case B.
4.31.2 D-SHEET PILING results
The results of bm4-31a are shown in Figure 4.22. The calculated moments in bm4-30a areused to deduce the manual inputted flexural stiffness used in bm4-30c by dividing the pile into20 sections and by calculating an average flexural stiffness for each section.
Figure 4.22 shows the effect of a plastic calculation compare to an elastic calculation andshows that an elastic calculation (bm4-30b) and a plastic calculation with an elastic behaviour(bm4-30e) give the same results, so as expected.
Figure 4.22: Comparison of the results of benchmarks bm4-31a, bm4-31b and bm4-31e
Figure 4.23 shows that a calculation with the Plastic module (bm4-30a) and a calculationwith the Elastic module with adapted stiffness EI (bm4-30c) give very close results, so asexpected, allowing to conclude that the Plastic module with Single Pile is working correctly.
Deltares 107 of 136
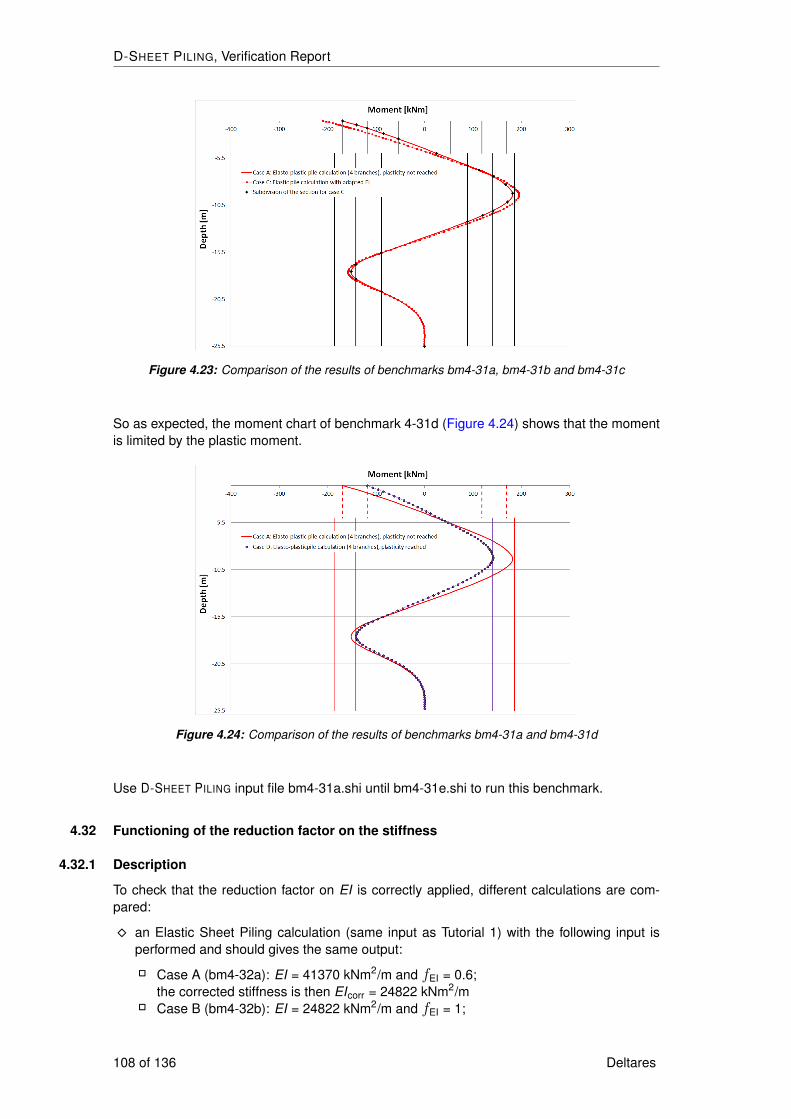
D-SHEET PILING, Verification Report
Figure 4.23: Comparison of the results of benchmarks bm4-31a, bm4-31b and bm4-31c
So as expected, the moment chart of benchmark 4-31d (Figure 4.24) shows that the momentis limited by the plastic moment.
Figure 4.24: Comparison of the results of benchmarks bm4-31a and bm4-31d
Use D-SHEET PILING input file bm4-31a.shi until bm4-31e.shi to run this benchmark.
4.32 Functioning of the reduction factor on the stiffness
4.32.1 Description
To check that the reduction factor on EI is correctly applied, different calculations are com-pared:
� an Elastic Sheet Piling calculation (same input as Tutorial 1) with the following input isperformed and should gives the same output:
� Case A (bm4-32a): EI = 41370 kNm2/m and fEI = 0.6;the corrected stiffness is then EIcorr = 24822 kNm2/m
� Case B (bm4-32b): EI = 24822 kNm2/m and fEI = 1;
108 of 136 Deltares
Group 4: Benchmarks generated by D-Sheet Piling
� an Plastic Sheet Piling calculation with a plastic moment of 160 kNm/m (same input asTutorial 1) with the following input is performed and should gives the same output:
� Case C (bm4-32c): EI = 41370 kNm2/m and fEI = 0.6;the corrected stiffness is then EIcorr = 24822 kNm2/m
� Case D (bm4-32d): EI = 24822 kNm2/m and fEI = 1;
4.32.2 D-SHEET PILING resultsTable 4.72: Results of benchmark 4-32 – Elastic Sheet Piling
Result D-SHEET PILING
(bm4-32a)D-SHEET PILING
(bm4-32b)Error[%]
Stiffness [kNm2/m] 41370 24822 -Reduction factor on EI [-] 0.6 1 -Corrected stiffness [kNm2/m] 24822 24822 0.00Max. displac. [mm] 288.8 288.8 0.00Max. moment [kNm] 158.73 158.73 0.00Max. shear force [kN] 53.65 53.65 0.00Perc. mob. resist. [%] 22.2 22.2 0.00
Table 4.73: Results of benchmark 4-32 – Plastic Sheet Piling
Result D-SHEET PILING
(bm4-32c)D-SHEET PILING
(bm4-32d)Error[%]
Stiffness [kNm2/m] 41370 24822 -Reduction factor on EI [-] 0.6 1 -Corrected stiffness [kNm2/m] 24822 24822 0.00Max. displac. [mm] 294.3 294.3 0.00Max. moment [kNm] 159.79 159.79 0.00Max. shear force [kN] 53.70 53.70 0.00Perc. mob. resist. [%] 22.3 22.3 0.00
Use D-SHEET PILING input file bm4-32a.shi until bm4-32d.shi to run this benchmark.
Deltares 109 of 136

D-SHEET PILING, Verification Report
110 of 136 Deltares
5 Group 5: Benchmarks compared with other programs
This chapter contains benchmarks for which the results of D-SHEET PILING are compared withthe results of other programs.
5.1 Overall Stability
5.1.1 Description
The Overall Stability option checks overall sheet piling stability using the Bishop method withcircular slip planes. The same input as benchmark 4-17 (section 4.17) is used except that theadditional pore pressures in the last stage are removed. The verification is made for the laststage, for different Design Codes:
� For representative verification, no partial factor is applied;� For CUR verification, partial factors given in Figure 5.1 are applied on strength parameters
(c and tan ϕ) and driving moment, for safety classes I, II and III;� For Eurocode verification (General, Dutch Annex and Belgian annex), partial factors given
in Figure 5.1 are applied on soil parameters (c, tan ϕ and γ) for all design approaches.
CUR 166
Figure 5.1: todo
Eurocode 7
Figure 5.2: Partial factors for Overall Stability
5.1.2 D-Geo Stability results
Calculations are performed using the Deltares Systems program D-Geo Stability (formerlyknown as MStab) with the Bishop method and the c-ϕ parameters. For Design Code check,the design input values of soil parameters are given in the tables below. For Eurocode 7,two calculations using low and high values of the unit weight (i.e. respectively divided andmultiplied by the partial factor) are performed and the minimum resulting safety factor is taken.
Table 5.1: Design values of soil properties acc. to CUR verification
Clay Peat Sand 1 Sand 2Cohesion [kPa] 6.25 2.50 0.00 0.00Friction angle [◦] 14.35 16.90 21.83 26.67
Deltares 111 of 136

D-SHEET PILING, Verification Report
Table 5.2: Design values of soil properties acc. to Eurocode 7 verification
Clay Peat Sand 1 Sand 2Cohesion [kPa] 6.25 2.50 0.00 0.00Friction angle [◦] 13.42 15.43 18.94 21.90Unsaturated unitweight, low
[kN/m3] 18.75 12.50 21.25 21.25
Saturated unitweight, low
[kN/m3] 12.00 8.00 13.60 13.60
Unsaturated unitweight, high
[kN/m3] 20.00 13.75 23.75 23.75
Saturated unitweight, high
[kN/m3] 12.80 8.80 15.20 15.20
D-Geo Stability results are given in Table 5.3. For CUR verification, brut results must becorrected (i.e. divided by the partial factor on the driving moment) for comparison withD-SHEET PILING results.
Table 5.3: D-Geo Stability results for benchmark 5-1 – Safety factor
Design Code Unit weight Brut (3 decimals) Corrected (2 decimals)Representative 3.256 2.13CUR 2.151 2.151/1.4 = 1.54Eurocode 7 Low 2.242 2.03
High 2.034
5.1.3 D-SHEET PILING results
the D-SHEET PILING and D-Geo Stability results are compared in Table 5.4.
Table 5.4: Results of benchmark 5-1 – Safety factor
Design Code and class File D-Geo Stabil-ity (corrected)
D-SHEET
PILING
Relative error[%]
Representative bm5-1a 3.26 3.25 0.31CUR – Safety class I bm5-1b 1.54 1.53 0.65CUR – Safety class II bm5-1c 1.54 1.53 0.65CUR – Safety class III bm5-1d 1.54 1.53 0.65EC7 (General) – DA 1 set 1 bm5-1e 2.03 2.03 0.00EC7 (General) – DA 1 set 2 bm5-1f 2.03 2.03 0.00EC7 (General) – DA 2 bm5-1g 2.03 2.03 0.00EC7 (General) – DA 3 bm5-1h 2.03 2.03 0.00EC7 (NL Annex) – RC 1 bm5-1i 2.03 2.03 0.00EC7 (NL Annex) – RC 2 bm5-1j 2.03 2.03 0.00EC7 (NL Annex) – RC 3 bm5-1k 2.03 2.03 0.00EC7 (B Annex) – Set 1 bm5-1l 2.03 2.03 0.00EC7 (B Annex) – Set 2 bm5-1m 2.03 2.03 0.00
Use D-SHEET PILING input files bm5-1a.shi to bm5-1m.shi to run this benchmark.
112 of 136 Deltares
Group 5: Benchmarks compared with other programs
5.2 Additional horizontal pressure due to a surcharge load
5.2.1 Description
This benchmark is the same as benchmark 3-10 (section 3.7). The additional horizontal stressdistribution due to the triangular surcharge is compared to the additional vertical distributioncalculated with the Deltares Systems program D-SETTLEMENT (formerly known as MSettle)using the Boussinesq theory.
5.2.2 D-SETTLEMENT results
The soil weight γ can’t be set to zero, therefore the final and initial effective tresses must besubtracted to get the additional vertical effective stress due to the triangular surcharge. Thesurcharge load is divided into elements of 0.1 m width and the Boussinesq theory is chosen.D-SETTLEMENT results at different depths are presented in the table below.
5.2.3 D-SHEET PILING results
To compare vertical and horizontal stresses, the earth pressure coefficients must be set to 1using the Manual option in the Start Calculation window.
Table 5.5: Results of benchmark 5-2 – Effective stress distribution acc. to Boussinesq
Depth[m NAP]
D-SETTLEMENT
[kN/m2]D-SHEET PILING
[kN/m2]Relative error[%]
–2 m 15.15 15.15 0.00–4 m 11.41 11.41 0.00–6 m 8.85 8.85 0.00–8 m 7.11 7.11 0.00–10 m 5.90 5.92 0.34
Use D-SHEET PILING input file bm5-2.shi to run this benchmark.
5.3 Horizontal displacements and stresses acc. to De Leeuw tables
5.3.1 Description
The calculated horizontal displacements and stresses are compared to the results of theprogram LEEUWIN.EXE based on the tables of De Leeuw. A surcharge load (magnitude:10 kN/m2, width: 10 m, distance to sheet piling: 2 m) is applied. Three cases are considered(Figure 5.3):
� Case A (bm5-3a): stiff top layer of 1 m thick and elastic layer of 5 m thick (E = 1500 kN/m2
i.e. γunsat = 18 kN/m3);� Case B (bm5-3b): same as case A without the stiff top layer;� Case C (bm5-3c): without stiff top layer and with a layered elastic cluster: top layer of
1 m thick (E = 1500 kN/m2 i.e. γunsat = 18 kN/m3) and a bottom layer of 4 m thick(E = 575 kN/m2 i.e. γunsat = 10 kN/m3). The average modulus isEavg = (1 × 1500 + 4 × 575) / 5 = 760 kN/m2.
Deltares 113 of 136

D-SHEET PILING, Verification Report
(a) Case A (b) Case B (c) Case C
Figure 5.3: Geometry overview (bm5-3)
5.3.2 LEEUWIN results
The three situations described above are modeled with the program LEEUWIN.EXE and re-sults are shown in Figure 5.4.
Case A)
Case B)
114 of 136 Deltares
Group 5: Benchmarks compared with other programs
Case C)
Figure 5.4: Horizontal displacements and stresses acc. to LEEUWIN program
5.3.3 D-SHEET PILING results
the D-SHEET PILING and LEEUWIN results are compared in the tables below.
Table 5.6: Results of benchmark 5-3a – Horizontal modulus of subgrade reaction for caseA
Depth [m NAP] Layer LEEUWIN[kN/m3]
D-SHEET PIL-ING
[kN/m3]
Relative error[%]
0 Stiff 100000.00 100000.00 0.00-1 Elastic 100000.00 100000.00 0.00-2 Elastic 1982.93 1985.40 0.12-3 Elastic 1819.07 1817.97 0.06-4 Elastic 1840.44 1839.87 0.03
Deltares 115 of 136
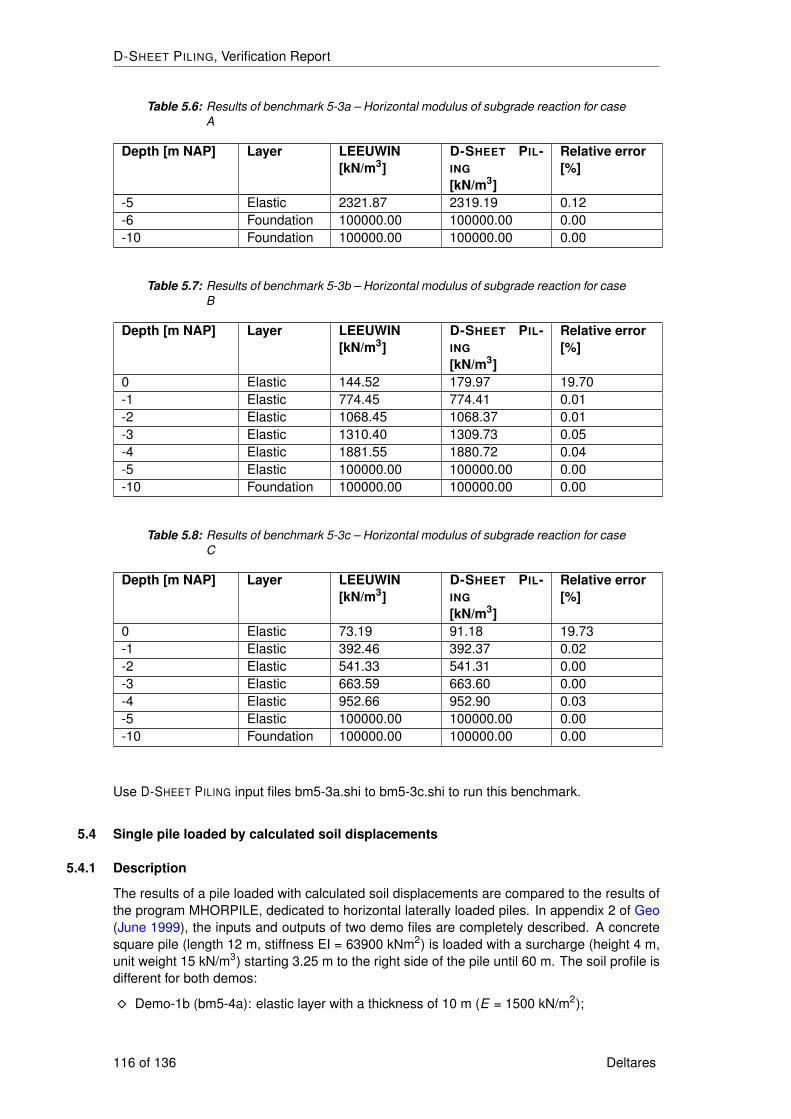
D-SHEET PILING, Verification Report
Table 5.6: Results of benchmark 5-3a – Horizontal modulus of subgrade reaction for caseA
Depth [m NAP] Layer LEEUWIN[kN/m3]
D-SHEET PIL-ING
[kN/m3]
Relative error[%]
-5 Elastic 2321.87 2319.19 0.12-6 Foundation 100000.00 100000.00 0.00-10 Foundation 100000.00 100000.00 0.00
Table 5.7: Results of benchmark 5-3b – Horizontal modulus of subgrade reaction for caseB
Depth [m NAP] Layer LEEUWIN[kN/m3]
D-SHEET PIL-ING
[kN/m3]
Relative error[%]
0 Elastic 144.52 179.97 19.70-1 Elastic 774.45 774.41 0.01-2 Elastic 1068.45 1068.37 0.01-3 Elastic 1310.40 1309.73 0.05-4 Elastic 1881.55 1880.72 0.04-5 Elastic 100000.00 100000.00 0.00-10 Foundation 100000.00 100000.00 0.00
Table 5.8: Results of benchmark 5-3c – Horizontal modulus of subgrade reaction for caseC
Depth [m NAP] Layer LEEUWIN[kN/m3]
D-SHEET PIL-ING
[kN/m3]
Relative error[%]
0 Elastic 73.19 91.18 19.73-1 Elastic 392.46 392.37 0.02-2 Elastic 541.33 541.31 0.00-3 Elastic 663.59 663.60 0.00-4 Elastic 952.66 952.90 0.03-5 Elastic 100000.00 100000.00 0.00-10 Foundation 100000.00 100000.00 0.00
Use D-SHEET PILING input files bm5-3a.shi to bm5-3c.shi to run this benchmark.
5.4 Single pile loaded by calculated soil displacements
5.4.1 Description
The results of a pile loaded with calculated soil displacements are compared to the results ofthe program MHORPILE, dedicated to horizontal laterally loaded piles. In appendix 2 of Geo(June 1999), the inputs and outputs of two demo files are completely described. A concretesquare pile (length 12 m, stiffness EI = 63900 kNm2) is loaded with a surcharge (height 4 m,unit weight 15 kN/m3) starting 3.25 m to the right side of the pile until 60 m. The soil profile isdifferent for both demos:
� Demo-1b (bm5-4a): elastic layer with a thickness of 10 m (E = 1500 kN/m2);
116 of 136 Deltares
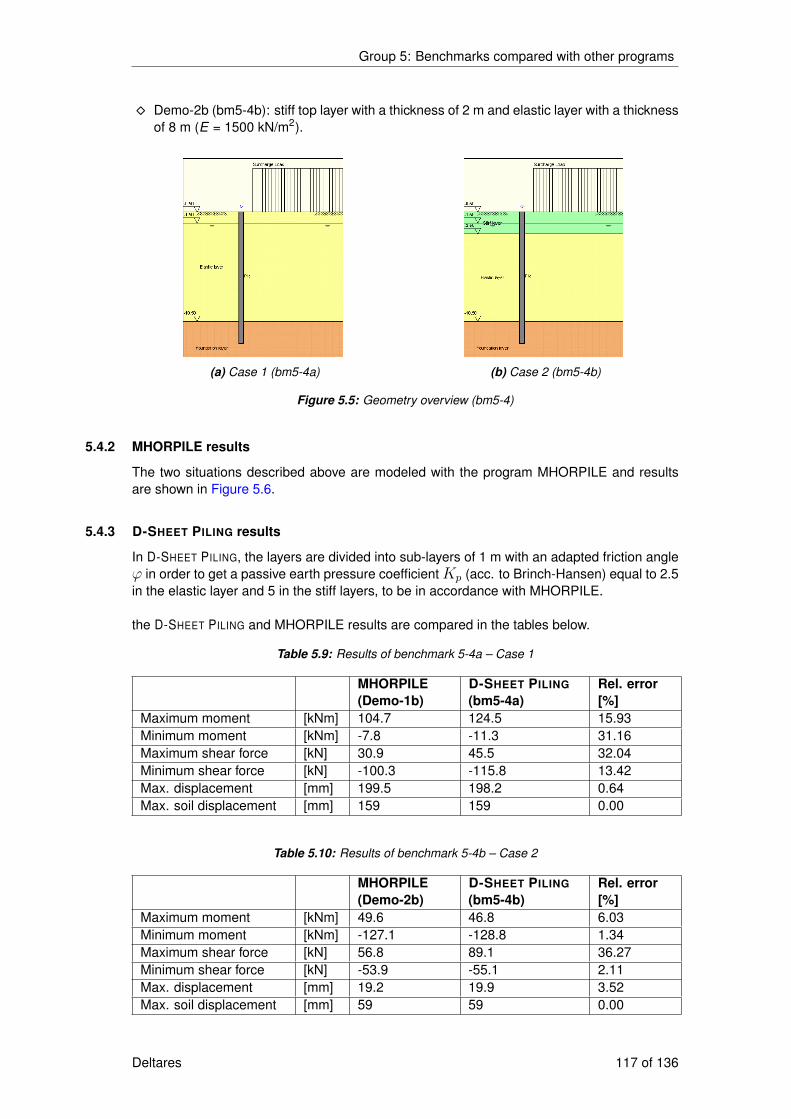
Group 5: Benchmarks compared with other programs
� Demo-2b (bm5-4b): stiff top layer with a thickness of 2 m and elastic layer with a thicknessof 8 m (E = 1500 kN/m2).
(a) Case 1 (bm5-4a) (b) Case 2 (bm5-4b)
Figure 5.5: Geometry overview (bm5-4)
5.4.2 MHORPILE results
The two situations described above are modeled with the program MHORPILE and resultsare shown in Figure 5.6.
5.4.3 D-SHEET PILING results
In D-SHEET PILING, the layers are divided into sub-layers of 1 m with an adapted friction angleϕ in order to get a passive earth pressure coefficientKp (acc. to Brinch-Hansen) equal to 2.5in the elastic layer and 5 in the stiff layers, to be in accordance with MHORPILE.
the D-SHEET PILING and MHORPILE results are compared in the tables below.
Table 5.9: Results of benchmark 5-4a – Case 1
MHORPILE(Demo-1b)
D-SHEET PILING
(bm5-4a)Rel. error[%]
Maximum moment [kNm] 104.7 124.5 15.93Minimum moment [kNm] -7.8 -11.3 31.16Maximum shear force [kN] 30.9 45.5 32.04Minimum shear force [kN] -100.3 -115.8 13.42Max. displacement [mm] 199.5 198.2 0.64Max. soil displacement [mm] 159 159 0.00
Table 5.10: Results of benchmark 5-4b – Case 2
MHORPILE(Demo-2b)
D-SHEET PILING
(bm5-4b)Rel. error[%]
Maximum moment [kNm] 49.6 46.8 6.03Minimum moment [kNm] -127.1 -128.8 1.34Maximum shear force [kN] 56.8 89.1 36.27Minimum shear force [kN] -53.9 -55.1 2.11Max. displacement [mm] 19.2 19.9 3.52Max. soil displacement [mm] 59 59 0.00
Deltares 117 of 136
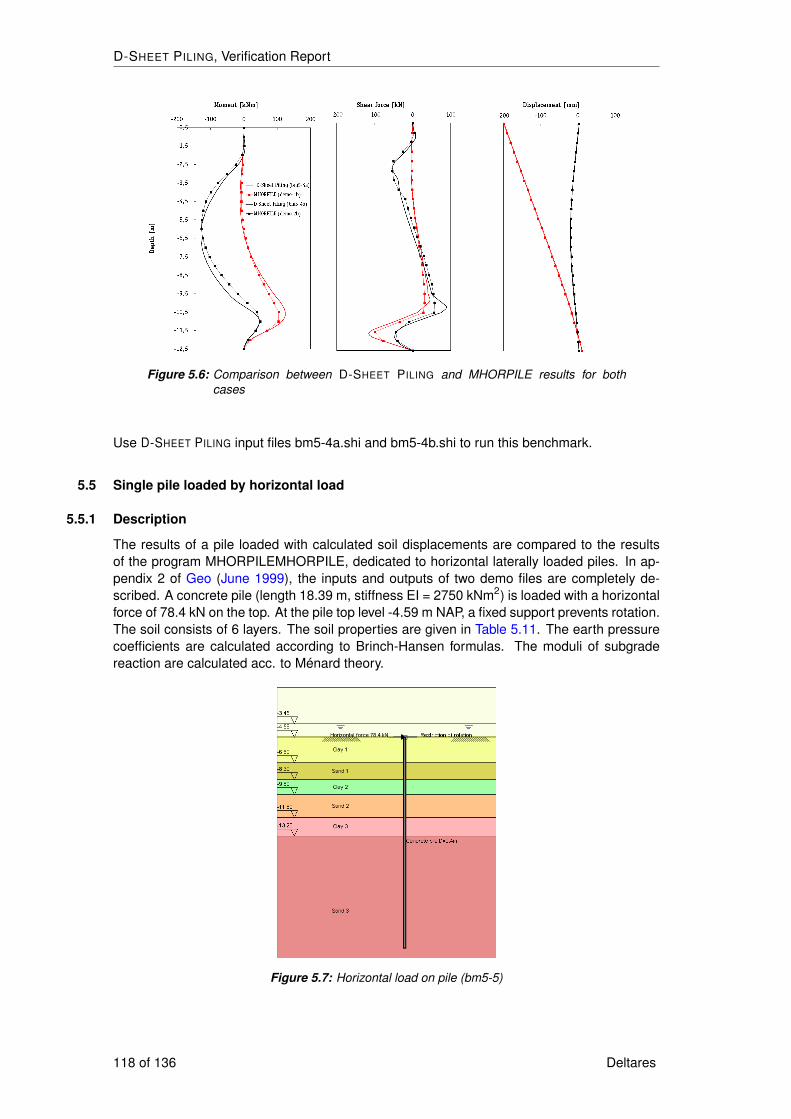
D-SHEET PILING, Verification Report
Figure 5.6: Comparison between D-SHEET PILING and MHORPILE results for bothcases
Use D-SHEET PILING input files bm5-4a.shi and bm5-4b.shi to run this benchmark.
5.5 Single pile loaded by horizontal load
5.5.1 Description
The results of a pile loaded with calculated soil displacements are compared to the resultsof the program MHORPILEMHORPILE, dedicated to horizontal laterally loaded piles. In ap-pendix 2 of Geo (June 1999), the inputs and outputs of two demo files are completely de-scribed. A concrete pile (length 18.39 m, stiffness EI = 2750 kNm2) is loaded with a horizontalforce of 78.4 kN on the top. At the pile top level -4.59 m NAP, a fixed support prevents rotation.The soil consists of 6 layers. The soil properties are given in Table 5.11. The earth pressurecoefficients are calculated according to Brinch-Hansen formulas. The moduli of subgradereaction are calculated acc. to Ménard theory.
Figure 5.7: Horizontal load on pile (bm5-5)
118 of 136 Deltares

Group 5: Benchmarks compared with other programs
Table 5.11: Soil properties for bm5-5
Material Top level γunsat γsat c ϕ Em[m NAP] [kN/m3] [kN/m3] [kN/m2] [◦] [kN/m2]
Clay 1 -4.59 15 15 0 22.5 2000Sand 1 -6.8 18 20 0 32.5 2000Clay 2 -8.3 15 15 10 22.5 4000Sand 2 -9.6 18 20 0 32.5 4000Clay 3 -11.6 17 17 10 17.5 4000Sand 3 -13.2 18 20 0 32.5 9000
5.5.2 MHORPILE results
The MHORPILE results are given in the tables below.
5.5.3 D-SHEET PILING results
the D-SHEET PILING and MHORPILE results are compared in Table 5.12 and Table 5.13.
Table 5.12: Results of benchmark 5-5 – Passive earth pressure coefficients and fictivecohesion acc. to Brinch-Hansen and modulus of subgrade reaction acc. toMénard
MHORPILE(Demo-4)
D-SHEET PILING
(bm5-5)Relative error[%]
c* Kp k c* Kp k c* Kp kClay 1 0.00 4.23 9317 0.00 4.23 9317 0.00 0.00 0.00Sand 1 0.00 13.12 13770 0.00 13.12 13771 0.00 0.00 0.01Clay 2 50.82 5.82 18630 50.82 5.83 18634 0.00 0.17 0.02Sand 2 0.00 16.41 27540 0.00 16.41 27543 0.00 0.00 0.01Clay 3 47.31 3.96 18630 47.32 3.96 18634 0.02 0.00 0.02Sand 3 0.00 19.80 61970 0.00 19.80 61971 0.00 0.00 0.00
Table 5.13: Results of benchmark 5-5 – Moments/Shear forces/Displacements
MHORPILE(Demo-4)
D-SHEET
PILING (bm5-5)Relative error[%]
Maximum moment [kNm] 127.2 127.2 0.00Minimum moment [kNm] -54.3 -54.3 0.00Maximum shear force [kN] 28.9 30.4 4.93Minimum shear force [kN] -78.4 -78.4 0.00Max. displacement [mm] 99.3 99.4 0.10
Use D-SHEET PILING input file bm5-5.shi to run this benchmark.
5.6 Settlement by vibration in homogeneous and saturated subsoil
Deltares 119 of 136
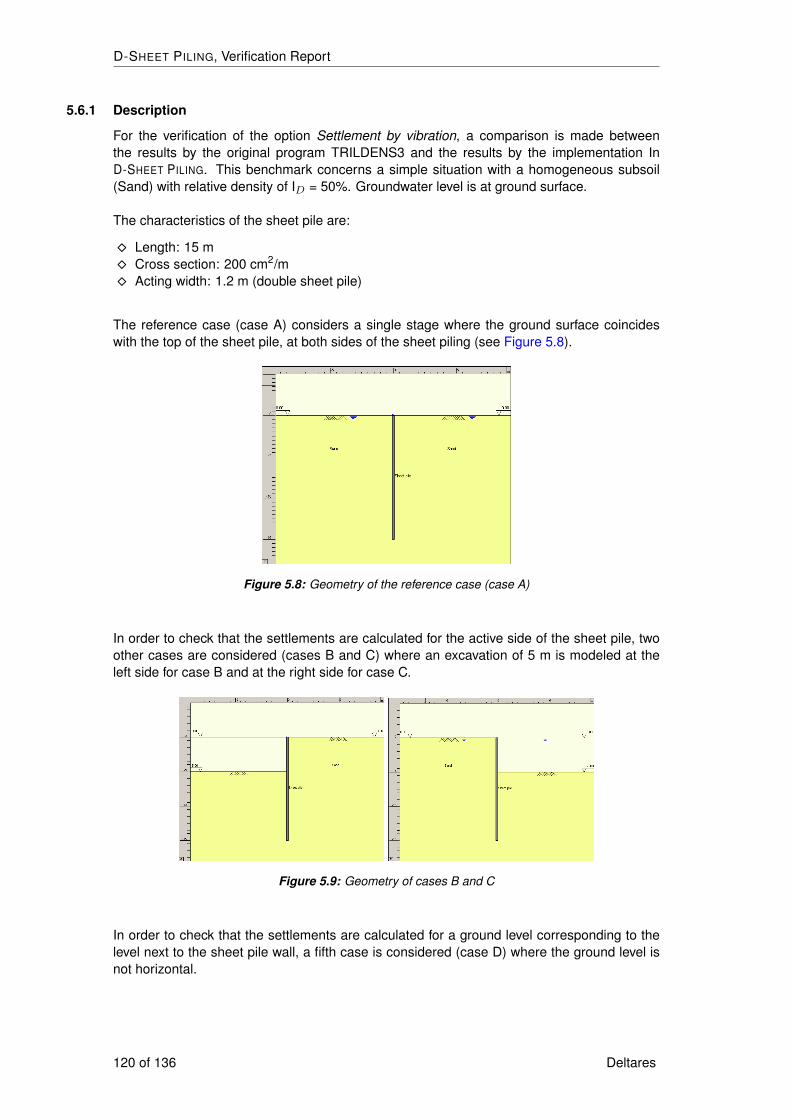
D-SHEET PILING, Verification Report
5.6.1 Description
For the verification of the option Settlement by vibration, a comparison is made betweenthe results by the original program TRILDENS3 and the results by the implementation InD-SHEET PILING. This benchmark concerns a simple situation with a homogeneous subsoil(Sand) with relative density of ID = 50%. Groundwater level is at ground surface.
The characteristics of the sheet pile are:
� Length: 15 m� Cross section: 200 cm2/m� Acting width: 1.2 m (double sheet pile)
The reference case (case A) considers a single stage where the ground surface coincideswith the top of the sheet pile, at both sides of the sheet piling (see Figure 5.8).
Figure 5.8: Geometry of the reference case (case A)
In order to check that the settlements are calculated for the active side of the sheet pile, twoother cases are considered (cases B and C) where an excavation of 5 m is modeled at theleft side for case B and at the right side for case C.
Figure 5.9: Geometry of cases B and C
In order to check that the settlements are calculated for a ground level corresponding to thelevel next to the sheet pile wall, a fifth case is considered (case D) where the ground level isnot horizontal.
120 of 136 Deltares
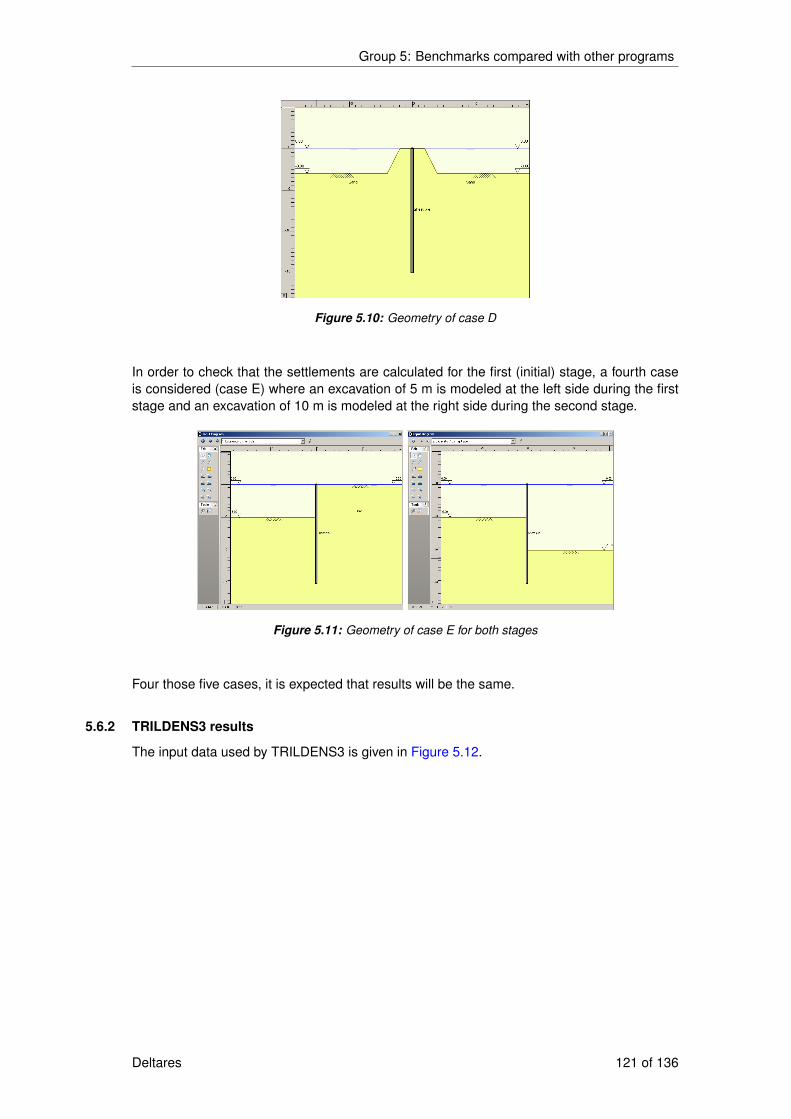
Group 5: Benchmarks compared with other programs
Figure 5.10: Geometry of case D
In order to check that the settlements are calculated for the first (initial) stage, a fourth caseis considered (case E) where an excavation of 5 m is modeled at the left side during the firststage and an excavation of 10 m is modeled at the right side during the second stage.
Figure 5.11: Geometry of case E for both stages
Four those five cases, it is expected that results will be the same.
5.6.2 TRILDENS3 results
The input data used by TRILDENS3 is given in Figure 5.12.
Deltares 121 of 136

D-SHEET PILING, Verification Report
Figure 5.12: Input data’s in TRILDENS for benchmark 5-6
The longtable results are given in Figure 5.13.
Figure 5.13: longtable results of TRILDENS3 for benchmark 5-6
122 of 136 Deltares
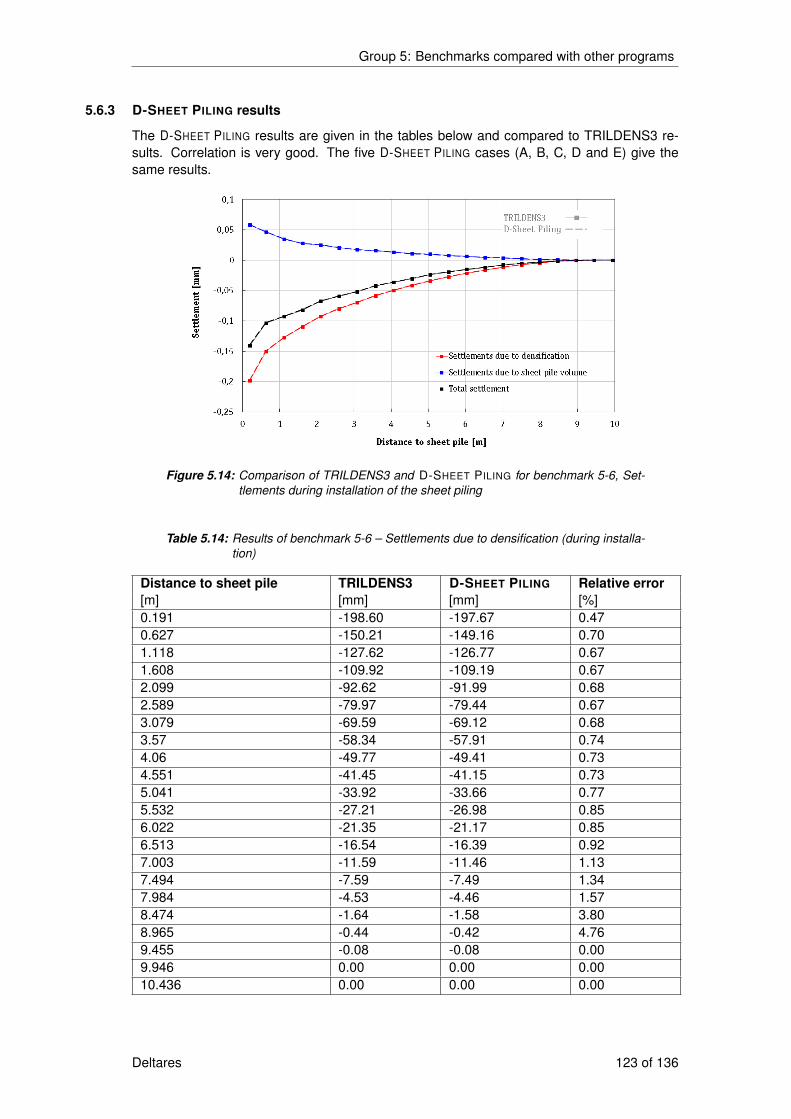
Group 5: Benchmarks compared with other programs
5.6.3 D-SHEET PILING results
The D-SHEET PILING results are given in the tables below and compared to TRILDENS3 re-sults. Correlation is very good. The five D-SHEET PILING cases (A, B, C, D and E) give thesame results.
Figure 5.14: Comparison of TRILDENS3 and D-SHEET PILING for benchmark 5-6, Set-tlements during installation of the sheet piling
Table 5.14: Results of benchmark 5-6 – Settlements due to densification (during installa-tion)
Distance to sheet pile TRILDENS3 D-SHEET PILING Relative error[m] [mm] [mm] [%]0.191 -198.60 -197.67 0.470.627 -150.21 -149.16 0.701.118 -127.62 -126.77 0.671.608 -109.92 -109.19 0.672.099 -92.62 -91.99 0.682.589 -79.97 -79.44 0.673.079 -69.59 -69.12 0.683.57 -58.34 -57.91 0.744.06 -49.77 -49.41 0.734.551 -41.45 -41.15 0.735.041 -33.92 -33.66 0.775.532 -27.21 -26.98 0.856.022 -21.35 -21.17 0.856.513 -16.54 -16.39 0.927.003 -11.59 -11.46 1.137.494 -7.59 -7.49 1.347.984 -4.53 -4.46 1.578.474 -1.64 -1.58 3.808.965 -0.44 -0.42 4.769.455 -0.08 -0.08 0.009.946 0.00 0.00 0.0010.436 0.00 0.00 0.00
Deltares 123 of 136

D-SHEET PILING, Verification Report
Table 5.15: Results of benchmark – Settlements due to sheet pile volume (during instal-lation)
Distance to sheet pile TRILDENS3 D-SHEET PILING Relative error[m] [mm] [mm] [%]0.191 58.28 58.28 0.000.627 46.73 46.73 0.001.118 34.86 34.86 0.001.608 27.86 27.86 0.002.099 25.19 25.19 0.002.589 20.85 20.85 0.003.079 17.37 17.37 0.003.57 15.87 15.87 0.004.06 13.20 13.20 0.004.551 10.89 10.89 0.005.041 9.84 9.84 0.005.532 7.91 7.91 0.006.022 6.18 6.18 0.006.513 4.60 4.60 0.007.003 3.87 3.86 0.267.494 2.48 2.48 0.007.984 1.20 1.19 0.848.474 0.59 0.59 0.008.965 0.00 0.00 0.009.455 0.00 0.00 0.009.946 0.00 0.00 0.0010.436 0.00 0.00 0.00
124 of 136 Deltares

Group 5: Benchmarks compared with other programs
Table 5.16: Results of benchmark 5-6 – Total settlements (during installation)
Distance to sheet pile TRILDENS3 D-SHEET PILING Relative error[m] [mm] [mm] [%]0.191 -140.32 -139.39 0.670.627 -103.48 -102.43 1.031.118 -92.76 -91.91 0.921.608 -82.06 -81.33 0.902.099 -67.42 -66.80 0.932.589 -59.13 -58.59 0.923.079 -52.22 -51.75 0.913.57 -42.47 -42.04 1.024.06 -36.57 -36.21 0.994.551 -30.56 -30.26 0.995.041 -24.09 -23.82 1.135.532 -19.30 -19.07 1.216.022 -15.17 -14.99 1.206.513 -11.94 -11.79 1.277.003 -7.73 -7.60 1.717.494 -5.11 -5.01 2.007.984 -3.34 -3.27 2.148.474 -1.05 -0.99 6.068.965 -0.44 -0.42 4.769.455 -0.08 -0.08 0.009.946 0.00 0.00 0.0010.436 0.00 0.00 0.00
Use D-SHEET PILING input files bm5-6a.shi until bm5-6e.shi to run this benchmark.
5.7 Settlement by vibration in homogeneous and unsaturated subsoil
5.7.1 Description
For the verification of the option Settlement by vibration, a comparison is made betweenthe results by the original program TRILDENS3 and the results by the implementation InD-SHEET PILING. The same situation as in the previous benchmark (section 5.6) is considered,the difference is that the ground water table is well below the tip of the sheet pile. In thisexample the situation of dry soil is thus considered.
Deltares 125 of 136
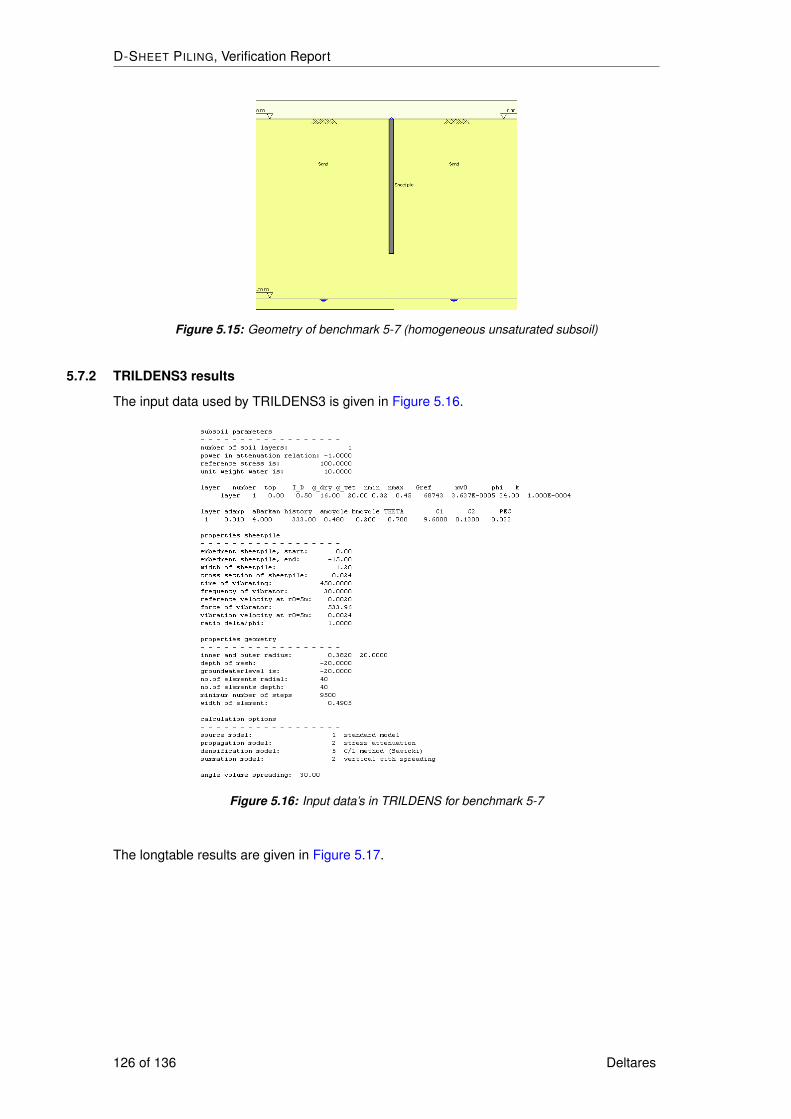
D-SHEET PILING, Verification Report
Figure 5.15: Geometry of benchmark 5-7 (homogeneous unsaturated subsoil)
5.7.2 TRILDENS3 results
The input data used by TRILDENS3 is given in Figure 5.16.
Figure 5.16: Input data’s in TRILDENS for benchmark 5-7
The longtable results are given in Figure 5.17.
126 of 136 Deltares
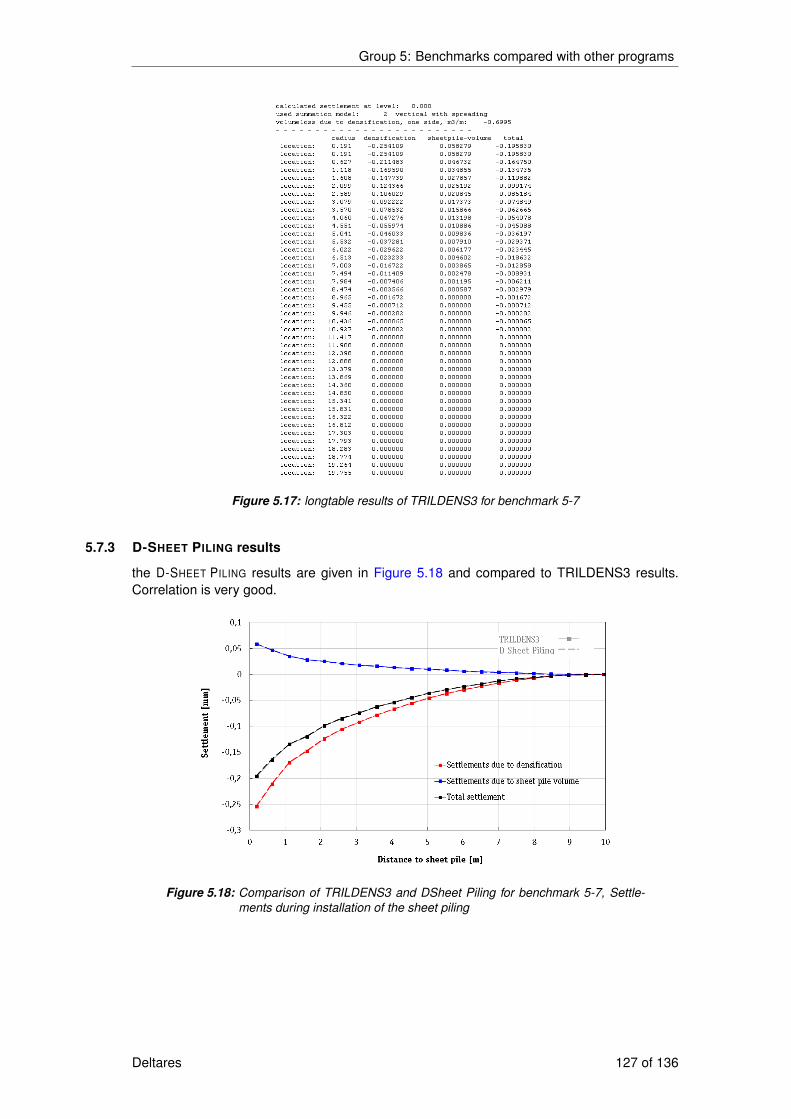
Group 5: Benchmarks compared with other programs
Figure 5.17: longtable results of TRILDENS3 for benchmark 5-7
5.7.3 D-SHEET PILING results
the D-SHEET PILING results are given in Figure 5.18 and compared to TRILDENS3 results.Correlation is very good.
Figure 5.18: Comparison of TRILDENS3 and DSheet Piling for benchmark 5-7, Settle-ments during installation of the sheet piling
Deltares 127 of 136
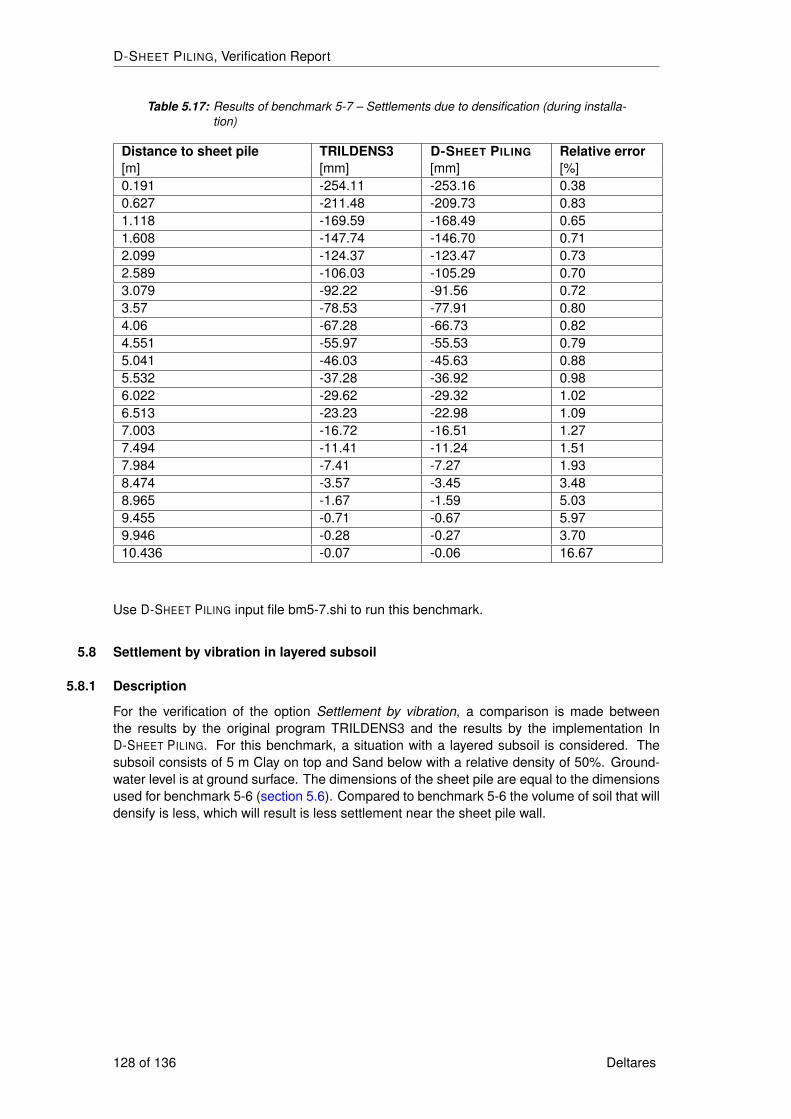
D-SHEET PILING, Verification Report
Table 5.17: Results of benchmark 5-7 – Settlements due to densification (during installa-tion)
Distance to sheet pile TRILDENS3 D-SHEET PILING Relative error[m] [mm] [mm] [%]0.191 -254.11 -253.16 0.380.627 -211.48 -209.73 0.831.118 -169.59 -168.49 0.651.608 -147.74 -146.70 0.712.099 -124.37 -123.47 0.732.589 -106.03 -105.29 0.703.079 -92.22 -91.56 0.723.57 -78.53 -77.91 0.804.06 -67.28 -66.73 0.824.551 -55.97 -55.53 0.795.041 -46.03 -45.63 0.885.532 -37.28 -36.92 0.986.022 -29.62 -29.32 1.026.513 -23.23 -22.98 1.097.003 -16.72 -16.51 1.277.494 -11.41 -11.24 1.517.984 -7.41 -7.27 1.938.474 -3.57 -3.45 3.488.965 -1.67 -1.59 5.039.455 -0.71 -0.67 5.979.946 -0.28 -0.27 3.7010.436 -0.07 -0.06 16.67
Use D-SHEET PILING input file bm5-7.shi to run this benchmark.
5.8 Settlement by vibration in layered subsoil
5.8.1 Description
For the verification of the option Settlement by vibration, a comparison is made betweenthe results by the original program TRILDENS3 and the results by the implementation InD-SHEET PILING. For this benchmark, a situation with a layered subsoil is considered. Thesubsoil consists of 5 m Clay on top and Sand below with a relative density of 50%. Ground-water level is at ground surface. The dimensions of the sheet pile are equal to the dimensionsused for benchmark 5-6 (section 5.6). Compared to benchmark 5-6 the volume of soil that willdensify is less, which will result is less settlement near the sheet pile wall.
128 of 136 Deltares
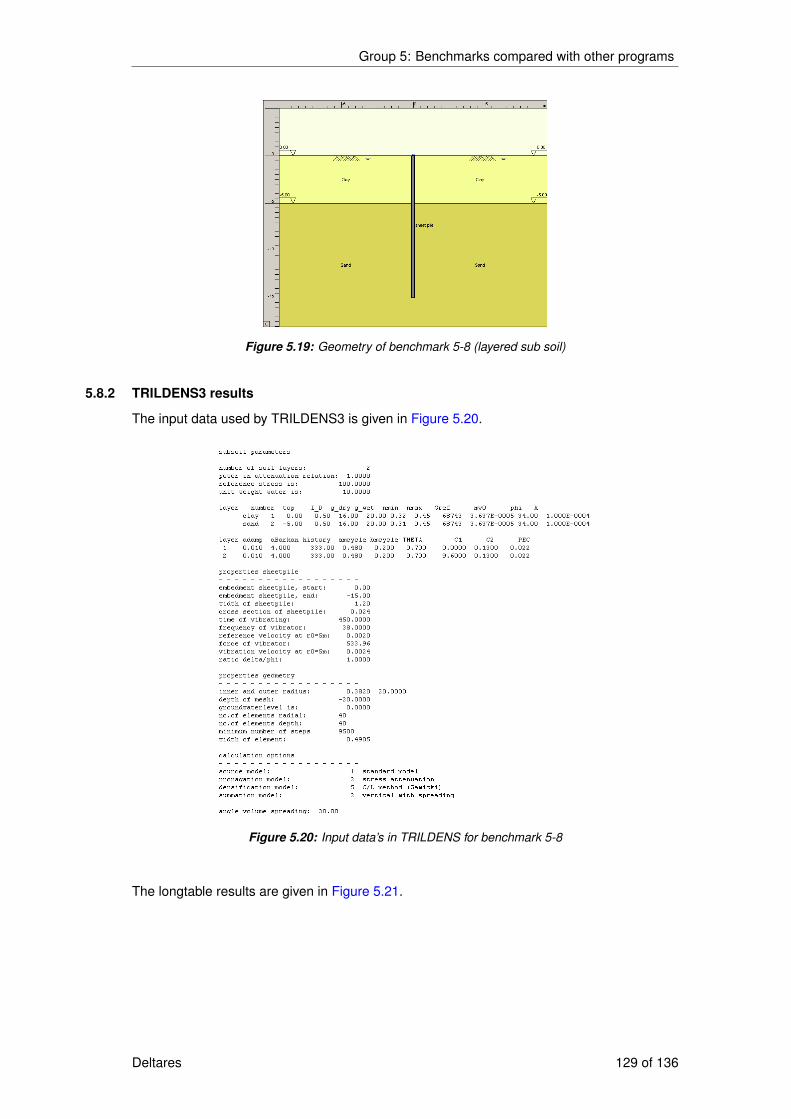
Group 5: Benchmarks compared with other programs
Figure 5.19: Geometry of benchmark 5-8 (layered sub soil)
5.8.2 TRILDENS3 results
The input data used by TRILDENS3 is given in Figure 5.20.
Figure 5.20: Input data’s in TRILDENS for benchmark 5-8
The longtable results are given in Figure 5.21.
Deltares 129 of 136
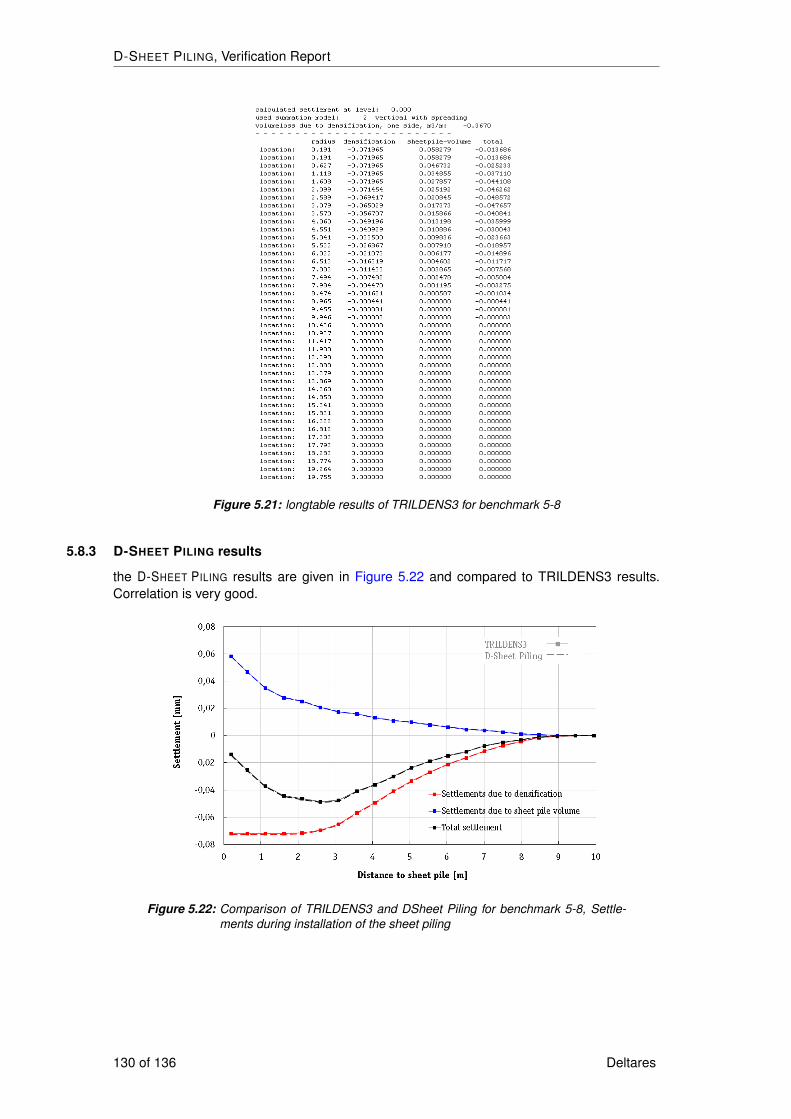
D-SHEET PILING, Verification Report
Figure 5.21: longtable results of TRILDENS3 for benchmark 5-8
5.8.3 D-SHEET PILING results
the D-SHEET PILING results are given in Figure 5.22 and compared to TRILDENS3 results.Correlation is very good.
Figure 5.22: Comparison of TRILDENS3 and DSheet Piling for benchmark 5-8, Settle-ments during installation of the sheet piling
130 of 136 Deltares

Group 5: Benchmarks compared with other programs
Table 5.18: Results of benchmark 5-8 – Settlements due to densification (during installa-tion)
Distance to sheet pile TRILDENS3 D-SHEET PILING Relative error[m] [mm] [mm] [%]0.191 -71.97 -72.61 0.880.627 -71.97 -72.61 0.881.118 -71.97 -72.61 0.881.608 -71.97 -72.61 0.882.099 -71.45 -72.11 0.922.589 -69.42 -70.09 0.963.079 -65.03 -65.67 0.973.57 -56.71 -57.20 0.864.06 -49.20 -49.61 0.834.551 -40.93 -41.27 0.825.041 -33.50 -33.75 0.745.532 -26.87 -27.04 0.636.022 -21.07 -21.20 0.616.513 -16.32 -16.41 0.557.003 -11.43 -11.47 0.357.494 -7.48 -7.49 0.137.984 -4.47 -4.46 0.228.474 -1.62 -1.59 1.898.965 -0.44 -0.42 4.769.455 -0.08 -0.08 0.009.946 0.00 0.00 0.0010.436 0.00 0.00 0.00
Use D-SHEET PILING input file bm5-8.shi to run this benchmark.
Deltares 131 of 136

D-SHEET PILING, Verification Report
132 of 136 Deltares
Bibliography
June 1999. MHORPILE UserŠs manual. GeoDelft, Delft.
Bouma, A. L., 1981. “Mechanica van constructies.” Bouma, A. L. Mechanica van constructies,college b13, Technische Hogeschool Delft, 1981.
Brinch-Hansen, J. and N. H. Christensen, 1961. “The Ultimate Resistance of Rigid PilesAgainst Transversal Forces.” Brinch-Hansen, J. and Christensen, N.H.; The Ultimate Resis-tance of Rigid Piles Against Transversal Forces, Bulletin no. 12 of the Geoteknisk Institut,1961.
CUR, 2005. “Publikatie 166: Damwanconstructies.” 4e druk (Design Guide Sheet Piling, inDutch) .
Kötter, F., 1903. “Die Bestimmung des Druckes an gekrümmten Gleitflächen.” SitzungsberichtKön. Preu. Ak. d. Wissenschaften, Berlin.
Kranz, E., 1953. “Über die Verankerung von Spundwänden.” Verlag Wilhelm Ernst & Sohn.
Ménard, L., 1971. “Méthode générale de calcul dŠun rideau ou dŠun pieu sollicité horizon-talement en fonction des résultats pressiomètriques.” Sols-soils VI: 22-23. Ménard, L., Et.Al.
Müller-Breslau, H., 1906. “Erddruck auf Stützmauern.” Verlag Kröner, Stuttgart.
Deltares 133 of 136

D-SHEET PILING, Verification Report
134 of 136 Deltares


PO Box 1772600 MH DelftRotterdamseweg 1852629 HD DelftThe Netherlands
+31 (0)88 335 81 [email protected]
Related Documents