Design of an energy efficient high performance drive train Loek Marquenie CST.2010.021 Master’s Thesis Supervisors: ir. Thijs van Keulen ir. Piet van Rens ir. Jacques van Rooij Master’s Thesis Committee: prof. dr. ir. Maarten Steinbuch (chairman) dr. ir. Igo Besselink dr. ir. Theo Hofman Eindhoven University of Technology Department of Mechanical Engineering Control Systems Technology Group Master track Automotive Engineering Science Eindhoven March 2010.

Welcome message from author
This document is posted to help you gain knowledge. Please leave a comment to let me know what you think about it! Share it to your friends and learn new things together.
Transcript
Design of an energy efficient
high performance drive train
Loek Marquenie
CST.2010.021
Master’s Thesis
Supervisors:
ir. Thijs van Keulen
ir. Piet van Rens
ir. Jacques van Rooij
Master’s Thesis Committee:
prof. dr. ir. Maarten Steinbuch (chairman)
dr. ir. Igo Besselink
dr. ir. Theo Hofman
Eindhoven University of Technology Department of Mechanical Engineering
Control Systems Technology Group
Master track Automotive Engineering Science
Eindhoven March 2010.
1
Summary
In modern day transportation there is an increased demand for energy efficient vehicles. This
trend is also noticable in certain classes of motorsport, a good example is the Formula Student
competition. Here, race cars are ranked on their dynamical performance and the fuel
consumption that results from the racing. A special class is launched within the Formula
Student framework, with the intention to let alternative drive trains compete with each other
in a racing environment. The emphasis of this class is to build a race car that uses a minimal
amount of energy, while still being as fast as possible on the track.
University Racing Eindhoven (URE) participates in this competition, however the
requirements for such a vehicle are contradicting. The main question is, what kind of drive
train suits the competition goals best. Furthermore, the implementation of the chosen drive
train concept requires a different design approach than the previous URE cars.
In the first part of this report a method is presented, that evaluates different drive train
topologies, in terms of performance and fuel economy. The method uses a mathematical
model, that is able to predict lap times and the accompanying energy consumption. This is
done with a simplified representation of the race car, namely a bicycle model, and an
efficiency based description of the drive train components. Subsequently, the following drive
train topologies are evaluated with this method:
• full electric
• series hybrid
• parallel hybrid
Besides, a conventional drive train, with an (petrol-powered) internal combustion engine is
analysed as a reference. The presented method enables the user to perform quantitative
research on aspects of interest, such as regenerative braking. Furthermore, drive train
parameters can be optimized, like the final drive ratio and component sizes. As a result of the
topology evaluation, and based on other practical arguments as well, a full electric drive train
is chosen for further development.
In the second part the electrical drive train is implemented in an overall vehicle concept. The
2009 race car, the URE05, serves as the donor vehicle for this development. With the help of
the competition rules, design criteria and the mathematical model, design specifications have
been proposed. On basis of this, suitable drive train components have been selected. The
concept has resulted in a rear-wheel-driven race car design with two independent permanent
magnet direct current motors, of 35kW peak power each. Furthermore, a battery package has
been selected, that consists of 78 high-quality Li-ion cells. All drive train components are
located inside the rear frame.
In the third part of this report the design of the battery, that has been engineered in full detail,
is presented. Different cooling techniques have been studied, and suitable materials that
comply with the requirements have been selected. The main goal was to keep the battery
construction as lightweight as possible, while still ensuring functionality and safety. The
resulting design is subsequently illustrated with comprehensive figures and information. A
thermal 2D finite element analysis is performed, with the intention of determining the highest
expected temperature during the endurance. Although this analysis predicts that no cell
temperature limits are exceeded, the battery must be cooled down for a sufficient period
before recharging and starting another race.
2
Contents
Summary 1
Contents 2
1 Introduction 5 1.1 Solutions for reduction of fuel consumption and emissions………………...….…5
1.2 Trends in motorsports………………………………………………….….……....5
1.3 Problem definition…………………………………………………………….…...6
1.3.1 Problem statement………………………………………………….…...6
1.3.2 Goals of this research…………………………………………...……....6
1.3.3 Main contributions of this report…………………………………..……6
1.4 Outline……………………………………………………………………..………7
Part I – Evaluation of drive train types 8
2 Method of approach 9 2.1 Introduction……………………………………………………..………...……….9
2.2 Goal of the method…………………………………………….………….……...10
2.3 Method structure…………………………………………………..…………..…11
3 Race car model 12 3.1 Introduction…………………………….………………………………………...12
3.2 Vehicle dynamics………………………………..………………………….…....12
3.2.1 Vehicle resistances………………………………………………….…12
3.2.2 Moving the vehicle………………………………..…………………..15
3.2.3 The track……………………………………………………………....16
3.2.4 Bicycle model….…………………………………………………..….17
3.2.5 Tyre modeling…………………………………………….………...…18
3.2.6 Acceleration….……………………………………………………..…19
3.2.7 Braking…..……………………………………………….………..…..19
3.2.8 Cornering …..………………………………………………………....19
3.3 Preliminary velocity profile……………………………………………………...20
3.4 Topologies………………………………………………………………………..23
3.4.1 Conventional drive train (ICE)…… ………………………..……...…24
3.4.2 Electric drive train…………….……………………………………....24
3.4.3 Hybrid drive trains……………………………………………….…....25
3.5 Components………………………..………………………………….………....26
3.5.1 Internal combustion engine……………………………………………26
3.5.2 Electric machine……….……………………………………………...27
3.5.3 Energy storage……………….……………………………………..…28
3.5.3.1 Fuel tank………..…..……………………………………....28
3.5.3.2 Batteries……….……………………………………………29
3.5.3.3 Ultracapacitors……….…………………………………..…31
3.5.4 Transmission…………….…….……………………………………....32
3.5.5 Power electronics…………………………………………………...…32
3.6 Drive train control strategies…………………………………………………..…32
3.6.1 ICE drive train………………………………..……………………….33
3.6.2 Full electric drive train……………………………………….……......33
3
3.6.3 Series hybrid drive train…………………………………………...…..34
3.6.4 Parallel hybrid drive train……….……………………………….…....35
4 Simulation 36 4.1 Introduction…………………………………..………………………..………....36
4.2 Simulation parameters……………………………………..…………………….36
4.3 Results……………………………………..……………………………………..37
4.3.1 Individual topology results………………………………………...….37
4.3.2 Comparison of topologies…………………………….………….…....43
4.4 Comparison with past events…………………………………….…………...….44
4.5 Discussion and topology choice………………………………….…………..….45
Part II – Vehicle design 47
5 Vehicle specification 48 5.1 Introduction………….………………………..…………………..………..…….48
5.2 Competition rules and requirements………………………………………..……48
5.3 Vehicle specification and design optimization……………………………..……49
5.4 Additional drive train features…….………………………………………..…....50
6 Component selection 52 6.1 Introduction………..………………………..………………………………...….52
6.2 Electric motor………..……………………………..………………….………....52
6.3 Final drive………..……………………………..………………………………..56
6.4 Motor controller……………………………………..…………………..…….....56
6.5 Battery cells………..……………………………..………………………..…….57
6.6 Electronics……….……………………………………………………….….…...60
7 Overall design 61 7.1 Introduction……………………………..…………………………………..……61
7.2 Electrical scheme……….……………………………..……………………..…..61
7.3 Location of drive train components………….………..…………………………63
7.4 Mass analysis………………………………………..…..……………………….64
7.5 Final drive design………..……………………………….………………………66
7.6 Rear frame modifications………..………………………..….…………….…….68
7.7 Conclusion……………………………………………………………………….68
Part III – Battery design 69
8 Battery concept and design 70 8.1 Introduction………………………………………………………………………70
8.2 Competition rules and design specification………….………..…………………70
8.3 Overall concept………….……………………………..………..……………….71
8.3.1 Thermal management………….………………………………..……………..71
8.3.2 Materials………..……………………………..…………………..…….……..72
8.3.3 Electrical configuration……………………………………………..….………73
8.4 Detailed design…………………………………………………………......….....73
8.4.1 Cell suspension………………………………………………….....…..74
8.4.2 Electrical connection……….……………………………………...…..75
8.4.3 Electrical insulation……………………………………………...…….75
8.4.4 Battery casing……………………………………………………...…..76
8.4.6 Auxiliary electrical components……….…………………………...….77
8.5 Overview of the final battery design……….………………………………….....77
4
9 Battery thermal analysis 78 9.1 Introduction………..……………………………………………………..………78
9.2 Goal of the analysis……….……………………………..……………….....……78
9.3 Modelling approach…….……………………………..…………………..….….79
9.4 2D Heat transfer model………….…………………………………………...…..79
9.5 Thermal properties and parameters…………………………………………...….81
9.5.1 Battery heat generation………….………………………………….…81
9.5.2 Material specific heat capacities…….…………………………..…….82
9.5.3 Material thermal conductivities……….…………………………..…..84
9.5.4 Convective heat transfer coefficient………………………………......84
9.6 Simulation results and discussion……..………………………………………....86
10 Closing 88 10.1 Conclusions………………………………………………………………..……88
10.2 Recommendations………………………………………………………………89
APPENDICES 91
A Formula Student class1A competition scoring and main rules……………...……….91
B How does a Formula SAE car drive on an endurance circuit?....................................92
C Calculation of acceleration, braking and cornering forces…………………..…..…..93
D Comparison of Li-ion battery and ultracapacitors for use in a hybrid race car…...…96
E.1 Motor & Controller specifications…………………………………………………...97
E.2 Motor test rig……….……………………………..………………………………….98
F Chain load case…………………………………..…………………………………..99
G Determination of weight distribution of URE05 without drive train………...……..101
H Bill of Material – battery……………………………………………………...….…102
I Calculation of Kokam internal cell resistance……………………………...………104
Bibliography 106
Nomenclature 112
Samenvatting 114
Nawoord en dankbetuiging 115
Digital appendix (CD-ROM):
- Vehicle model m-files
- Datasheet pdf-files
- COG_analysis.xls
- Cp_test.xls
- EV_battcells.xls
- Technical Drawings Battery.xls
5
Chapter 1
Introduction
This chapter introduces the research objective, which focusses on the development of an
alternative drive train for a Formula Student race car.
Beginning with a brief introduction on trends in alternative drive train applications, the
chapter proceeds with stating the problem definition and goals. Finally, the outline of the
report is given in the last section.
1.1 Solutions for reduction of fuel consumption and emissions
Recently, governments are putting more stringent rules on car fuel consumption and
emissions, and manufacturers try to meet these requirements by improving cars on a whole
range of aspects [42]. These include reducing the vehicle’s losses, such as aerodynamic and
rolling resistance, as well as internal drive train losses. The conventional petrol or diesel
driven powertrain has undergone many improvements, of which recent examples are “down-
sizing” and even more recent the application of the “MultiAir” valve mechanism [44]. The
addition of bio-fuel to conventional fossil fuels is also expected to gain more and more
interest and application [40,41]. Other, more radical, developments are for instance the
introduction of hybrid electric vehicles (such as the Toyota Prius), hydrogen fuel cell cars
(Honda FCX) and battery electric vehicles. The latter is expected to gain a great market-share
and, therefore, an increasing amount of research is on the development of these vehicle types.
However, debates are continuing, as it is still unclear what the best options are for future
transportation.
1.2 Trends in motorsports
For many years high octane fuels, which are derived from fossil oil, have been the dominant
fuel type in racing and motorsports. Petrol engines for instance are known for delivering
power with excellent response, and, when designed for performance, can be build extremely
lightweight.
A good example of this are Formula One engines, which at some point in history produced up
to 600kW, while weighing less than 100kg.
However, the trend towards more energy efficient transport has not gone unnoticed in the
world of motorsports. Competition committee’s have been asked to change their image, and
to spend more time on making their race cars environmentally friendly.
Furthermore, motorsports is seen as an opportunity to test new technologies under harsh
conditions. The Kinetic Energy Recovery System (KERS) in Formula One is an example of
this.
Hence, one can see a clear trend in the latest years towards the use of alternative fuels and
drive train technologies in motorsports. Although these new developments are slowly being
accepted by teams and fans, there are already a few examples of how alternative drive trains
beat the competition. Audi for instance opened the eyes of many, when they won the 24h of
Le Mans in 2006 with a diesel powered car, the R10 TDI. Another spectacular victory was
achieved by Toyota in 2007, when they won the Tokachi 24h endurance with a hybrid race
car, the Supra HV-R. The Formula SAE competition, a worldwide racing challenge between
universities, is also on the forefront of these developments; Dartmouth College started the
Formula Hybrid competition in the United States, 2005. Also, in 2007 the class1A “low-
6
carbon” competition was launched in the United Kingdom, where the focus is placed on the
application of energy efficient alternative drive trains. Soon, more Formula SAE competitions
followed with setting up new classes of “green motorsports”.
1.3 Problem definition
In the end of 2008 University Racing Eindhoven (URE) decided to take part in the Formula
Student class1A competition of 2010. Although there was great interest from several
departments and students, it was not clear what kind of race car had to be designed and built.
On the contrary, when the discussion evolved it soon became clear that the solution is not
straight-forward and that many vehicle requirements are contradicting.
1.3.1 Problem statement
Clearly, low energy comsumption and racing perfomance are difficult to combine. In
literature, several attempts to fuel efficient race technologies are proposed [56,57,59,60,73–75]
but these technologies often struggle with complexity, acceptance and other disadvantages.
The abundancy of requirements make the design process a challenging task. Moreover, a
systematic approach for designing an energy efficient race car is lacking in available literature,
as this is a fairly new development, and also due to the secretive nature of the racing world.
Formula Student is an exception in this secrecy, as the goal of the competition is to give
students a learning experience and allow new technologies to be applied and compared. As a
consequence, several racing drive train designs have been published by student teams
[51,52,54,55,58,61].
1.3.2 Goals of this research
The goals of the research described in this report are as follows:
• Investigate the various drive train lay-outs within the Formula Student class1A
framework, and identify the most suitable drive train topology.
• Perform a detailed selection of the required drive train component sizes and
characterisitics, and propose an overall vehicle specification and design.
• Design and analyze key systems, by performing an in-depth engineering task.
1.3.3 Main contributions of this report
The main contributions of this report are the following:
• A detailed method of approach is introduced, in which different drive trains can be
compared on several aspects, such as fuel economy, performance and component
requirements. This method is not only suitable for URE, but can also be adopted by
manufacturers of performance cars and other motorsports competitions.
• The method of approach is translated to a mathematical model, and 4 drive train
topologies are compared with each other using the model;
o conventional internal combustion engine (SI)
o full electric
o series hybrid
o parallel hybrid
• The proposed model has proven to lend itself well for the further design of the race car
drive train, as it is able to predict many important parameters. Hence the model can be
used to optimize the chosen concept and design.

7
• A light-weight battery design is proposed, including a thermal analysis, which will form
the basis of future URE electric race cars.
1.4 Outline
Due to the diversity of subjects discussed, the report is split up into three parts.
Part I covers the evaluation of the drive train types that are to be studied.
Chapter 2 contains general information on the competition and goals of the model, as well as
it’s structure. In Chapter 3 the build-up of the vehicle model is explained in detail.
The analysis results for URE specific parameters and decisions are being treated in Chapter 4.
Part II covers the overall design of the chosen drive train solution.
In Chapter 5 the desired vehicle specifications are being dealt with, while in Chapter 6 an
extensive component selection procedure is summarized. Finally, in Chapter 7 the overall
design of the race car is formed and presented.
In Part III the design of the battery system is treated (Chapter 8), and subsequently a thermal
analysis has been carried out, of which the results are presented in Chapter 9.
In Chapter 10, conclusions and an outlook for future improvements are given.
Additional information can be found in the appendices.

8
Part I
Evaluation of drive train types
9
Chapter 2
Method of approach
2.1 Introduction
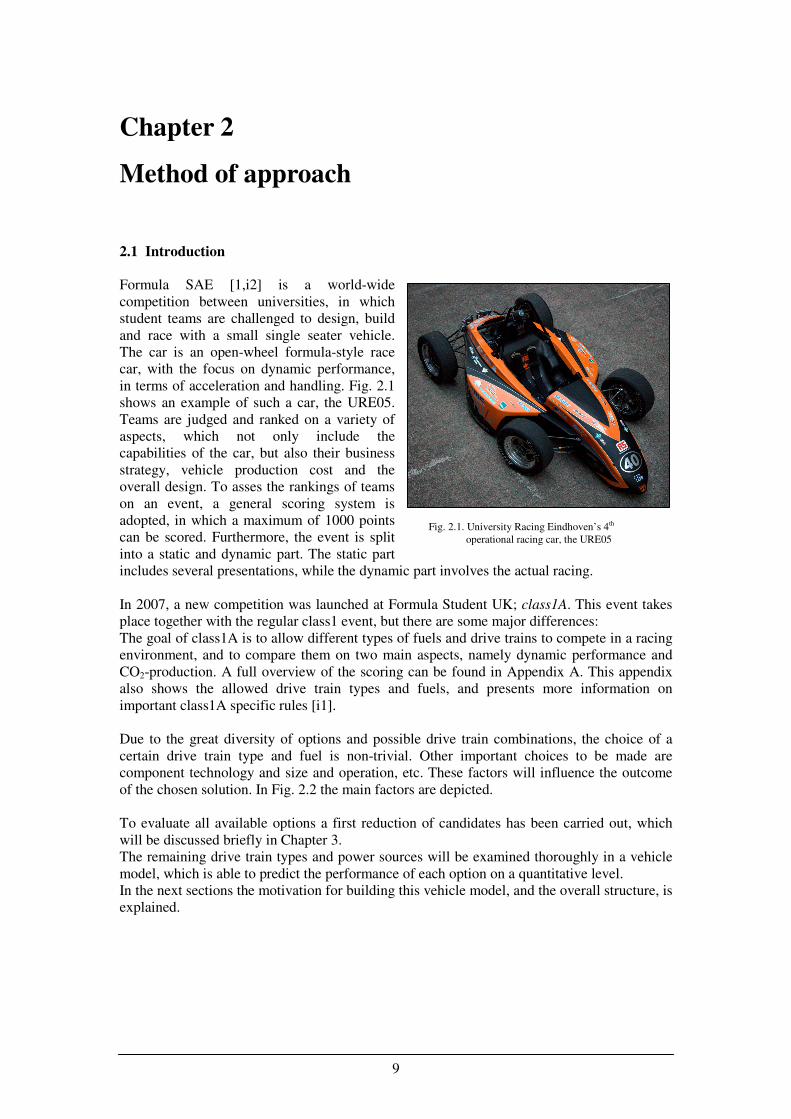
Formula SAE [1,i2] is a world-wide
competition between universities, in which
student teams are challenged to design, build
and race with a small single seater vehicle.
The car is an open-wheel formula-style race
car, with the focus on dynamic performance,
in terms of acceleration and handling. Fig. 2.1
shows an example of such a car, the URE05.
Teams are judged and ranked on a variety of
aspects, which not only include the
capabilities of the car, but also their business
strategy, vehicle production cost and the
overall design. To asses the rankings of teams
on an event, a general scoring system is
adopted, in which a maximum of 1000 points
can be scored. Furthermore, the event is split
into a static and dynamic part. The static part
includes several presentations, while the dynamic part involves the actual racing.
In 2007, a new competition was launched at Formula Student UK; class1A. This event takes
place together with the regular class1 event, but there are some major differences:
The goal of class1A is to allow different types of fuels and drive trains to compete in a racing
environment, and to compare them on two main aspects, namely dynamic performance and
CO2-production. A full overview of the scoring can be found in Appendix A. This appendix
also shows the allowed drive train types and fuels, and presents more information on
important class1A specific rules [i1].
Due to the great diversity of options and possible drive train combinations, the choice of a
certain drive train type and fuel is non-trivial. Other important choices to be made are
component technology and size and operation, etc. These factors will influence the outcome
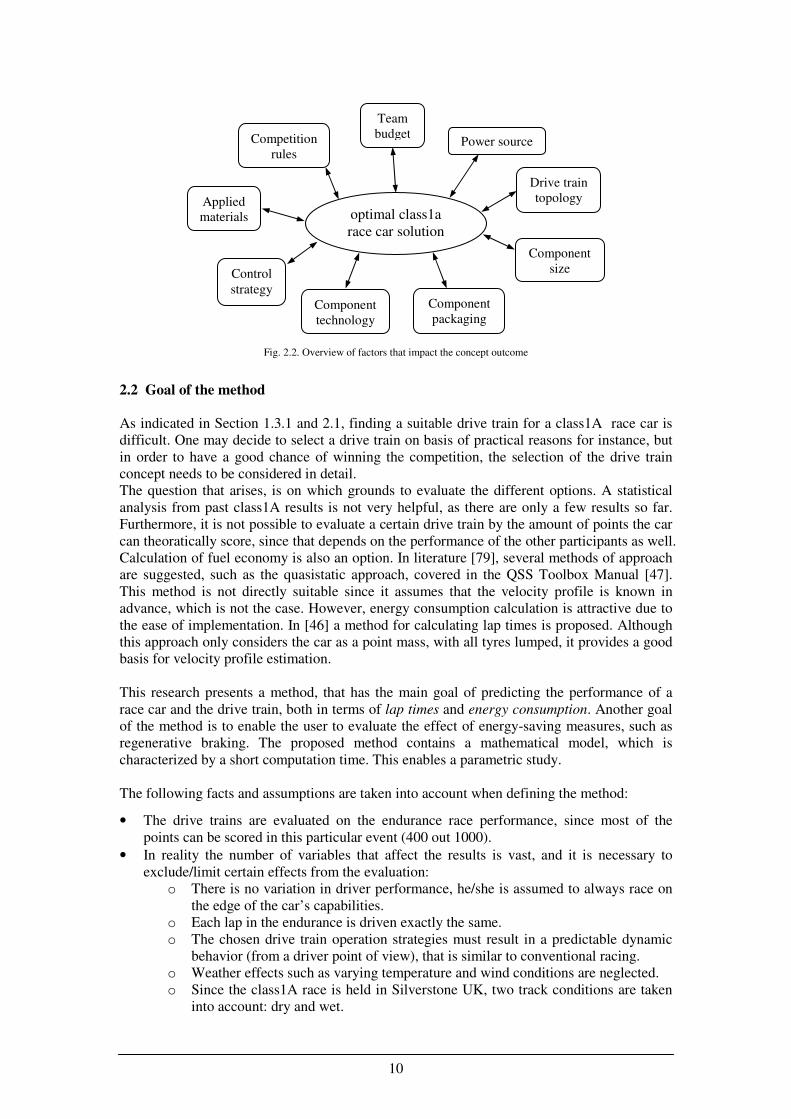
of the chosen solution. In Fig. 2.2 the main factors are depicted.
To evaluate all available options a first reduction of candidates has been carried out, which
will be discussed briefly in Chapter 3.
The remaining drive train types and power sources will be examined thoroughly in a vehicle
model, which is able to predict the performance of each option on a quantitative level.
In the next sections the motivation for building this vehicle model, and the overall structure, is
explained.
Fig. 2.1. University Racing Eindhoven’s 4th
operational racing car, the URE05
10
2.2 Goal of the method
As indicated in Section 1.3.1 and 2.1, finding a suitable drive train for a class1A race car is
difficult. One may decide to select a drive train on basis of practical reasons for instance, but
in order to have a good chance of winning the competition, the selection of the drive train
concept needs to be considered in detail.
The question that arises, is on which grounds to evaluate the different options. A statistical
analysis from past class1A results is not very helpful, as there are only a few results so far.
Furthermore, it is not possible to evaluate a certain drive train by the amount of points the car
can theoratically score, since that depends on the performance of the other participants as well.
Calculation of fuel economy is also an option. In literature [79], several methods of approach
are suggested, such as the quasistatic approach, covered in the QSS Toolbox Manual [47].
This method is not directly suitable since it assumes that the velocity profile is known in
advance, which is not the case. However, energy consumption calculation is attractive due to
the ease of implementation. In [46] a method for calculating lap times is proposed. Although
this approach only considers the car as a point mass, with all tyres lumped, it provides a good
basis for velocity profile estimation.
This research presents a method, that has the main goal of predicting the performance of a
race car and the drive train, both in terms of lap times and energy consumption. Another goal
of the method is to enable the user to evaluate the effect of energy-saving measures, such as
regenerative braking. The proposed method contains a mathematical model, which is
characterized by a short computation time. This enables a parametric study.
The following facts and assumptions are taken into account when defining the method:
• The drive trains are evaluated on the endurance race performance, since most of the
points can be scored in this particular event (400 out 1000).
• In reality the number of variables that affect the results is vast, and it is necessary to
exclude/limit certain effects from the evaluation:
o There is no variation in driver performance, he/she is assumed to always race on
the edge of the car’s capabilities.
o Each lap in the endurance is driven exactly the same.
o The chosen drive train operation strategies must result in a predictable dynamic
behavior (from a driver point of view), that is similar to conventional racing.
o Weather effects such as varying temperature and wind conditions are neglected.
o Since the class1A race is held in Silverstone UK, two track conditions are taken
into account: dry and wet.
optimal class1a
race car solution
Power source
Team
budget
Drive train
topology
Control
strategy
Component
size
Component
technology
Component
packaging
Applied
materials
Competition
rules
Fig. 2.2. Overview of factors that impact the concept outcome
11
o Suspension behavior is excluded.
o Other transient effects, such as corner entry / exit are neglected.
With these decisions the approach is simplified to an extent that it is possible to create a
model that adequately calculates the parameters of interest, within a short amount of time.
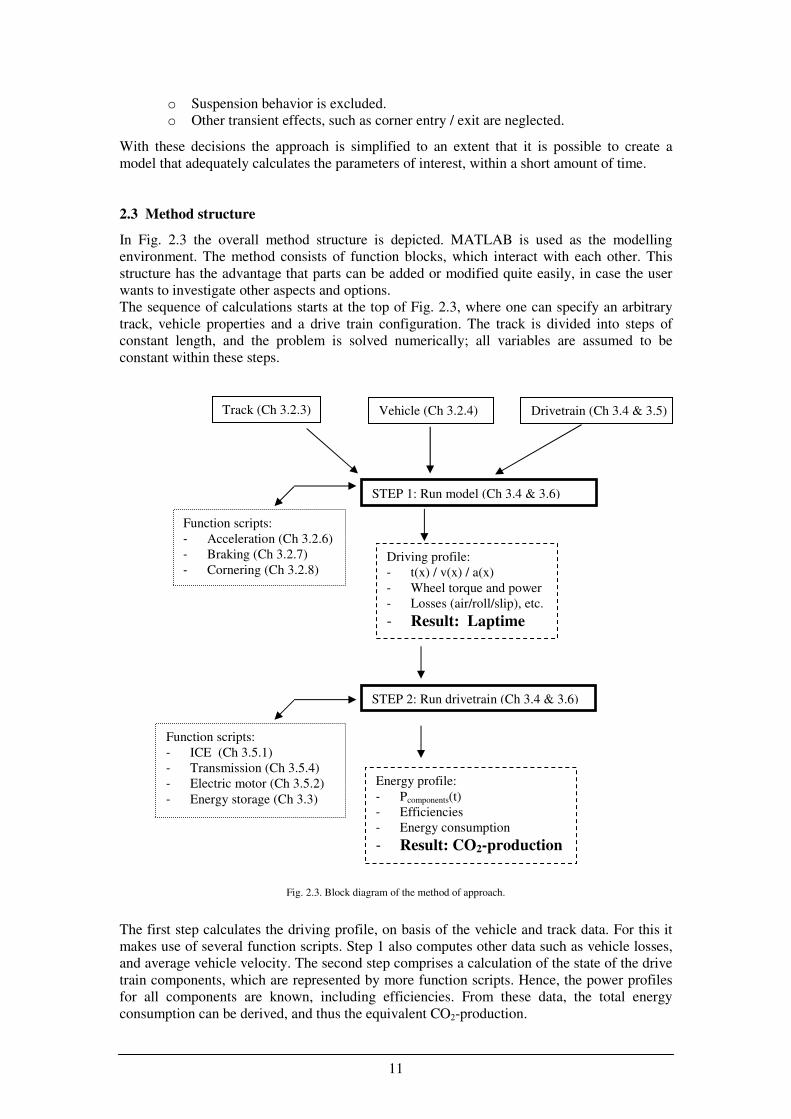
2.3 Method structure
In Fig. 2.3 the overall method structure is depicted. MATLAB is used as the modelling
environment. The method consists of function blocks, which interact with each other. This
structure has the advantage that parts can be added or modified quite easily, in case the user
wants to investigate other aspects and options.
The sequence of calculations starts at the top of Fig. 2.3, where one can specify an arbitrary
track, vehicle properties and a drive train configuration. The track is divided into steps of
constant length, and the problem is solved numerically; all variables are assumed to be
constant within these steps.
The first step calculates the driving profile, on basis of the vehicle and track data. For this it
makes use of several function scripts. Step 1 also computes other data such as vehicle losses,
and average vehicle velocity. The second step comprises a calculation of the state of the drive
train components, which are represented by more function scripts. Hence, the power profiles
for all components are known, including efficiencies. From these data, the total energy
consumption can be derived, and thus the equivalent CO2-production.
Track (Ch 3.2.3) Vehicle (Ch 3.2.4) Drivetrain (Ch 3.4 & 3.5)
STEP 1: Run model (Ch 3.4 & 3.6)
Function scripts:
- Acceleration (Ch 3.2.6)
- Braking (Ch 3.2.7)
- Cornering (Ch 3.2.8) Driving profile:
- t(x) / v(x) / a(x)
- Wheel torque and power
- Losses (air/roll/slip), etc.
- Result: Laptime
STEP 2: Run drivetrain (Ch 3.4 & 3.6)
Energy profile:
- Pcomponents(t)
- Efficiencies
- Energy consumption
- Result: CO2-production
Function scripts:
- ICE (Ch 3.5.1)
- Transmission (Ch 3.5.4)
- Electric motor (Ch 3.5.2)
- Energy storage (Ch 3.3)
Fig. 2.3. Block diagram of the method of approach.
12
Chapter 3
Race car model
3.1 Introduction
This chapter presents a detailed description of the proposed analysis method, which has the
objective of calculating lap times and CO2 production. First a simplified model of a race car is
provided in Section 3.2. Here, the relevant parameters and calculations required to model the
race car dynamics are derived from the forces that act on the vehicle. Secondly, Section 3.3
deals with the construction of a preliminary (maximum) velocity profile from the car’s grip
level and the lay-out of the racing circuit. In Section 3.4 the drive train topologies of interest
are discussed. This section also gives information on why particular types of power sources
and components are not considered in this report. The components of which the drive trains
consist, and the modelling is subject of Section 3.5. After that the operation strategy of each
drive train is discussed in Section 3.6. Once this is known, the final velocity profile of any of
the drive trains can be calculated, and subsequently also the accompanying energy
consumption. The main literature that is used for modelling and equations in this chapter is
[77,79,82].
3.2 Vehicle dynamics
Race drivers try to minimize lap times, by driving their cars as fast as possible on the track.
They are not only limited by the power the engine can deliver, but even more by the grip that
the tyres are able to deliver. The lap velocity profile that results from a race car is
consequently dictated by:
• the resistances that act on the vehicle
• the available tyre grip (longitudinal / lateral)
• the layout of the track
• the available power at the wheels (drive / brake)
To compute a velocity profile it is necessary to consider all four aspects.
3.2.1 Vehicle resistances
The elementary equation that describes the longitudinal dynamics of the vehicle is:
( ) ( ) ( )v t r
dm v t F t F t
dt= − . (3.1)
In this equation the left-hand part represents the inertial force induced by the mass of the
vehicle, where v is the vehicle forward velocity and mv it’s mass. This inertial force is in
equilibrium with the car’s net tractive force Ft minus the total vehicle resistance force Fr. Ft is
generated by the prime movers minus the force that is used to accelerate the rotating parts
inside the vehicle and minus all friction losses in the powertrain. Furthermore, the tractive
force Ft is limited by the amount of grip that the tyres are able to provide. The total vehicle
resistance force Fr is a summation of resistance forces and described as:
( )( ) ( ) ( ) ( ) ( )r air roll grade slip
F t F t F t F t F t= + + + . (3.2)
13
Here Fair is the aerodynamic friction, Froll the rolling resistance, Fgrade is the force caused by
gravity when driving on a non-horizontal road, and Fslip is the drag force caused by the tyres,
during cornering. The grade and rolling resistances can be computed with the following
equations:
cos( )roll r v
F c m g ϕ= , (3.3)
sin( )grade v
F m g ϕ= , (3.4)
in which cr is the rolling coefficient, g is the gravity constant and ϕ is the road inclination
angle. Since the circuit is assumed to have no significant inclinations, the contribution of (3.4)
to (3.2) is eliminated (sin(0)=0) and (3.3) transforms into:
roll r vF c m g= . (3.5)
The rolling coefficient cr is dependant on several factors such as tyre pressure and road
conditions, but is usually assumed to be constant. Typical values for normal passenger
vehicles are in the order of 0.01 – 0.015. However, the used racing tyres have a much softer
rubber compound and are also inflated to a lower pressure, ptyre, than tyres for normal cars
(Table 3.1):
Table 3.1. Tyre pressure differences.
Tyre pressure ptyre
Normal road car 1.8 bar (±)
Formula SAE car 0.65 bar
The softer compound and lower pressure are applied to enhance tyre grip, however at the
expence of increased rolling resistance and cr is therefore assumed to be 0.035.
The aerodynamic resistance force can be computed, using the following equation:
21( )
2air air f d
F v A c vρ= . (3.6)
Here, ρair is the air density, Af is the frontal area of the race car, and the aerodynamic drag
coefficient cd. The aerodynamic drag coefficient is often estimated by a comparison to similar
vehicles with known coefficient. The best method is, however, to measure the aerodynamic
behavior of a car in a windtunnel. From these data a corresponding drag coefficient can be
calculated. Another method is to fit a second-order polynomial to the measurement data,
relating drag force to wind speed. This last method is performed by the Monash Motorsport
Team (Australia), and for an unwinged car they provided the polynomial coefficients in [i3].
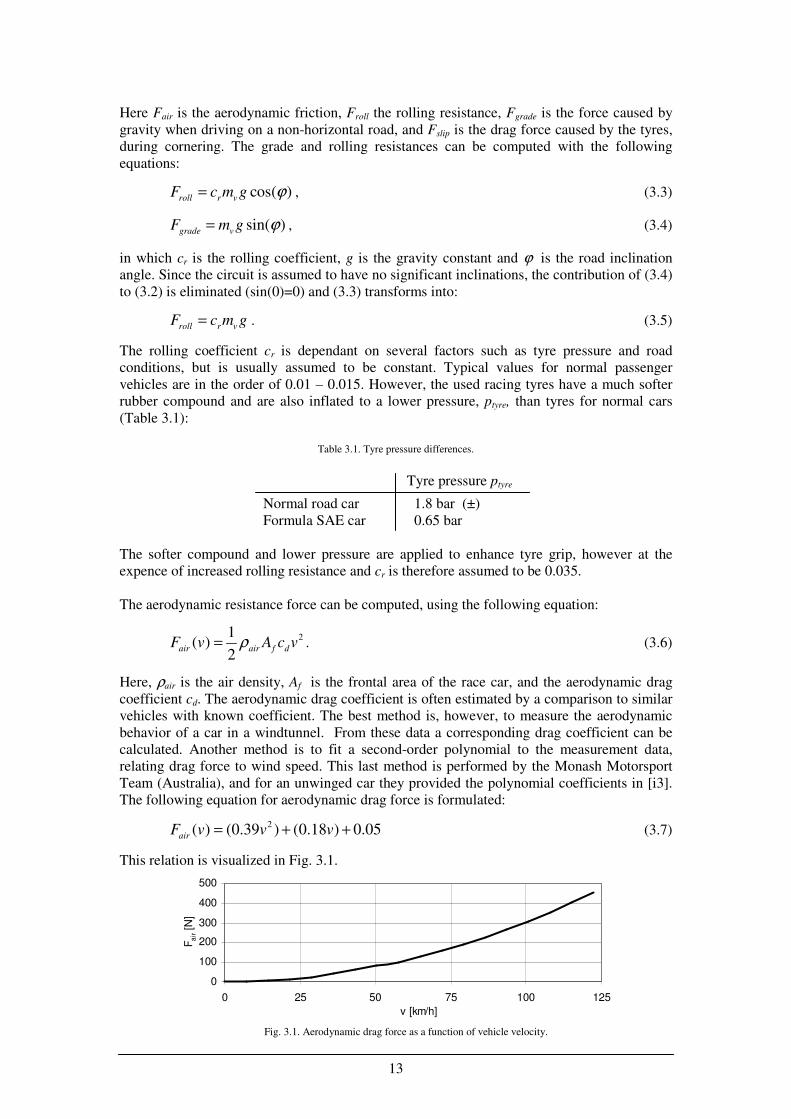
The following equation for aerodynamic drag force is formulated:
2( ) (0.39 ) (0.18 ) 0.05air
F v v v= + + (3.7)
This relation is visualized in Fig. 3.1.
0
100
200
300
400
500
0 25 50 75 100 125
v [km/h]
Fa
ir [N
]
Fig. 3.1. Aerodynamic drag force as a function of vehicle velocity.
14
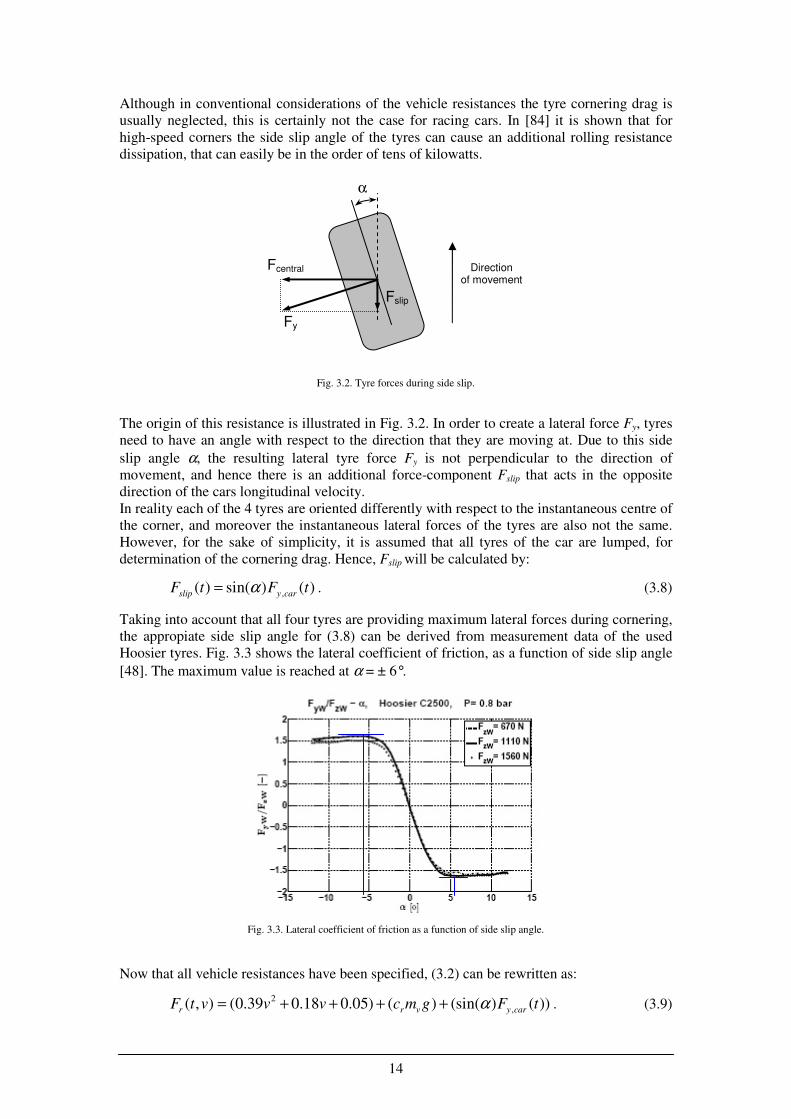
Although in conventional considerations of the vehicle resistances the tyre cornering drag is
usually neglected, this is certainly not the case for racing cars. In [84] it is shown that for
high-speed corners the side slip angle of the tyres can cause an additional rolling resistance
dissipation, that can easily be in the order of tens of kilowatts.
The origin of this resistance is illustrated in Fig. 3.2. In order to create a lateral force Fy, tyres
need to have an angle with respect to the direction that they are moving at. Due to this side
slip angle α, the resulting lateral tyre force Fy is not perpendicular to the direction of
movement, and hence there is an additional force-component Fslip that acts in the opposite
direction of the cars longitudinal velocity.
In reality each of the 4 tyres are oriented differently with respect to the instantaneous centre of
the corner, and moreover the instantaneous lateral forces of the tyres are also not the same.
However, for the sake of simplicity, it is assumed that all tyres of the car are lumped, for
determination of the cornering drag. Hence, Fslip will be calculated by:
,( ) sin( ) ( )slip y car
F t F tα= . (3.8)
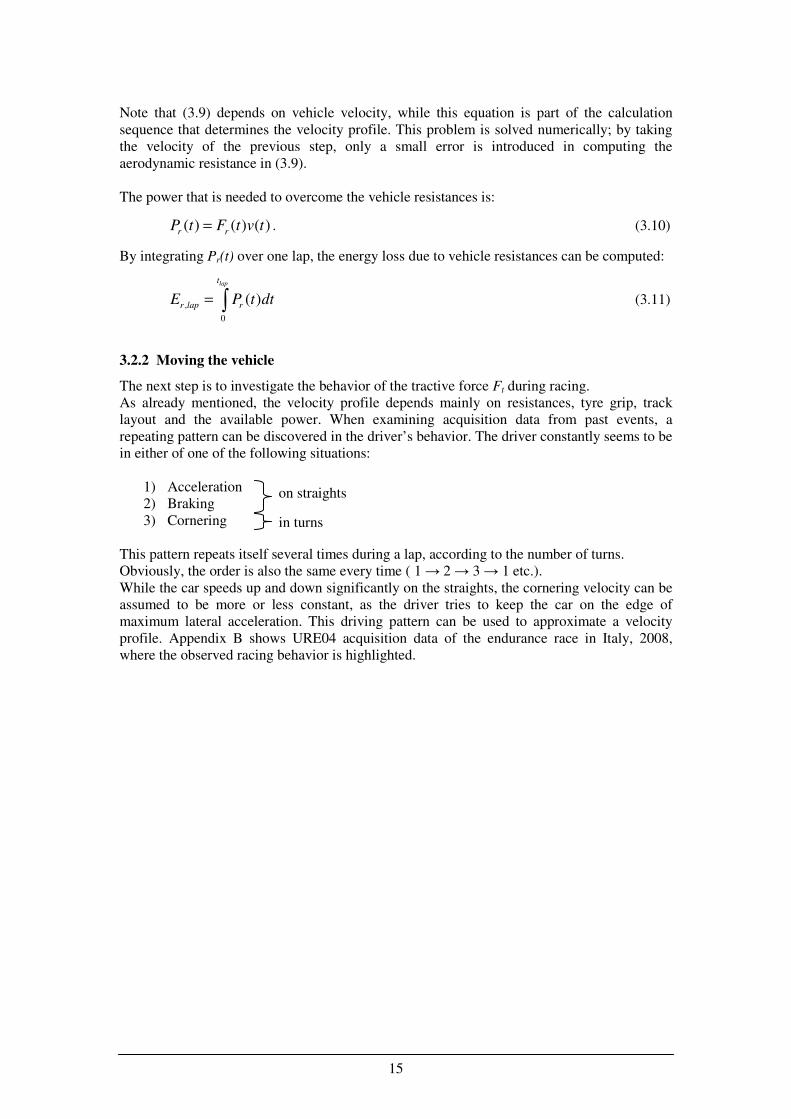
Taking into account that all four tyres are providing maximum lateral forces during cornering,
the appropiate side slip angle for (3.8) can be derived from measurement data of the used
Hoosier tyres. Fig. 3.3 shows the lateral coefficient of friction, as a function of side slip angle
[48]. The maximum value is reached at α = ± 6°.
Now that all vehicle resistances have been specified, (3.2) can be rewritten as:
2
,( , ) (0.39 0.18 0.05) ( ) (sin( ) ( ))r r v y carF t v v v c m g F tα= + + + + . (3.9)
α
Fcentral
Fy
Fslip
Direction of movement
Fig. 3.3. Lateral coefficient of friction as a function of side slip angle.
Fig. 3.2. Tyre forces during side slip.
15
Note that (3.9) depends on vehicle velocity, while this equation is part of the calculation
sequence that determines the velocity profile. This problem is solved numerically; by taking
the velocity of the previous step, only a small error is introduced in computing the
aerodynamic resistance in (3.9).
The power that is needed to overcome the vehicle resistances is:
( ) ( ) ( )r r
P t F t v t= . (3.10)
By integrating Pr(t) over one lap, the energy loss due to vehicle resistances can be computed:
,
0
( )
lapt
r lap rE P t dt= ∫ (3.11)
3.2.2 Moving the vehicle
The next step is to investigate the behavior of the tractive force Ft during racing.
As already mentioned, the velocity profile depends mainly on resistances, tyre grip, track
layout and the available power. When examining acquisition data from past events, a
repeating pattern can be discovered in the driver’s behavior. The driver constantly seems to be
in either of one of the following situations:
1) Acceleration
2) Braking
3) Cornering
This pattern repeats itself several times during a lap, according to the number of turns.
Obviously, the order is also the same every time ( 1 → 2 → 3 → 1 etc.).
While the car speeds up and down significantly on the straights, the cornering velocity can be
assumed to be more or less constant, as the driver tries to keep the car on the edge of
maximum lateral acceleration. This driving pattern can be used to approximate a velocity
profile. Appendix B shows URE04 acquisition data of the endurance race in Italy, 2008,
where the observed racing behavior is highlighted.
on straights
in turns
16
3.2.3 The track
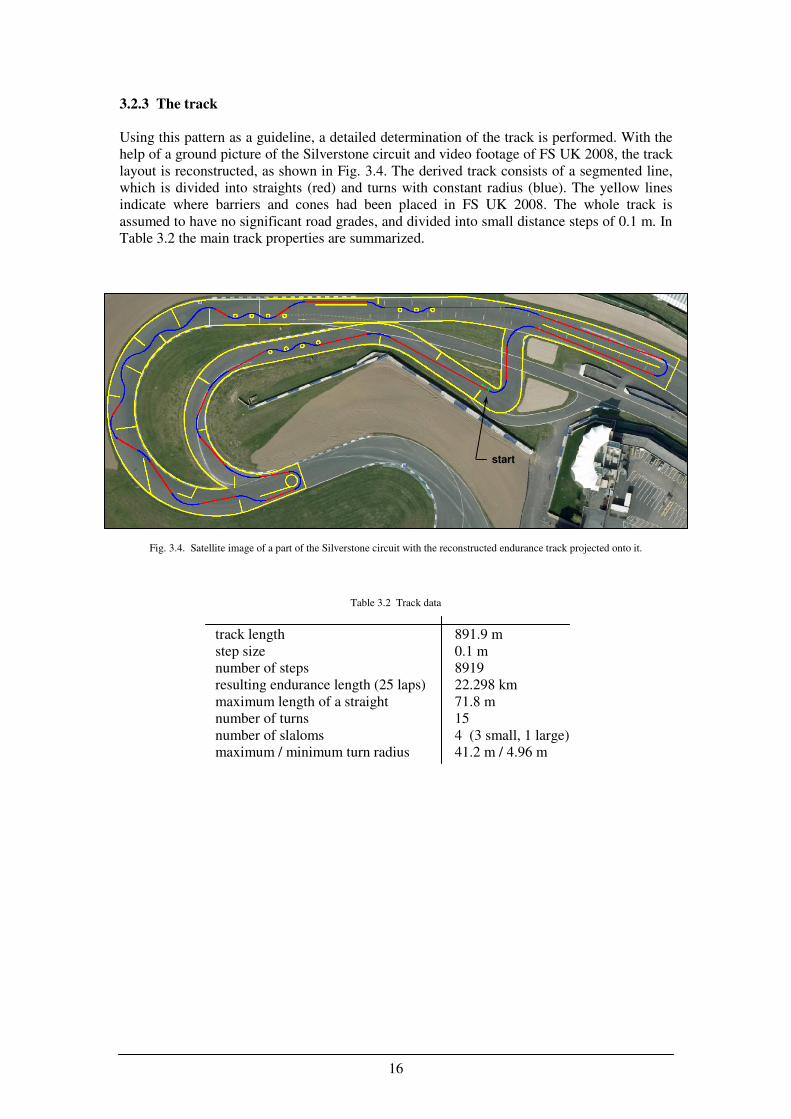
Using this pattern as a guideline, a detailed determination of the track is performed. With the
help of a ground picture of the Silverstone circuit and video footage of FS UK 2008, the track
layout is reconstructed, as shown in Fig. 3.4. The derived track consists of a segmented line,
which is divided into straights (red) and turns with constant radius (blue). The yellow lines
indicate where barriers and cones had been placed in FS UK 2008. The whole track is
assumed to have no significant road grades, and divided into small distance steps of 0.1 m. In
Table 3.2 the main track properties are summarized.
Table 3.2 Track data
track length 891.9 m
step size 0.1 m
number of steps 8919
resulting endurance length (25 laps) 22.298 km
maximum length of a straight 71.8 m
number of turns 15
number of slaloms 4 (3 small, 1 large)
maximum / minimum turn radius 41.2 m / 4.96 m
Fig. 3.4. Satellite image of a part of the Silverstone circuit with the reconstructed endurance track projected onto it.
start
17
3.2.4 Bicycle model
In the model the race car is represented as a bicycle [45,77], which means that the left and
right tyres are lumped together. The advantage of this type of model, is that the dynamics
remain quite simple, moreover it allows to incorporate an important aspect in the evaluation:
longitudinal load-transfer. Every car that is subject to acceleration will experience a shift in
wheel load, which is called load transfer. Because of this, more or less tyre traction force is
available at each wheel. In general, less load transfer provides a higher level of grip.
Although lateral load-transfer is also very important for race car handling, it is assumed that
the of drive train topology will not have much effect on it. Therefore it is not taken into
account. Longitudinal load transfer however, has an important influence since it limits the
amount of tractive force that can be applied by the drive train and braking system. Moreover,
Formula SAE cars have a fairly short wheelbase (needed for high manueverability), which
results in fairly large load transfer, when compared to other (race) vehicles.
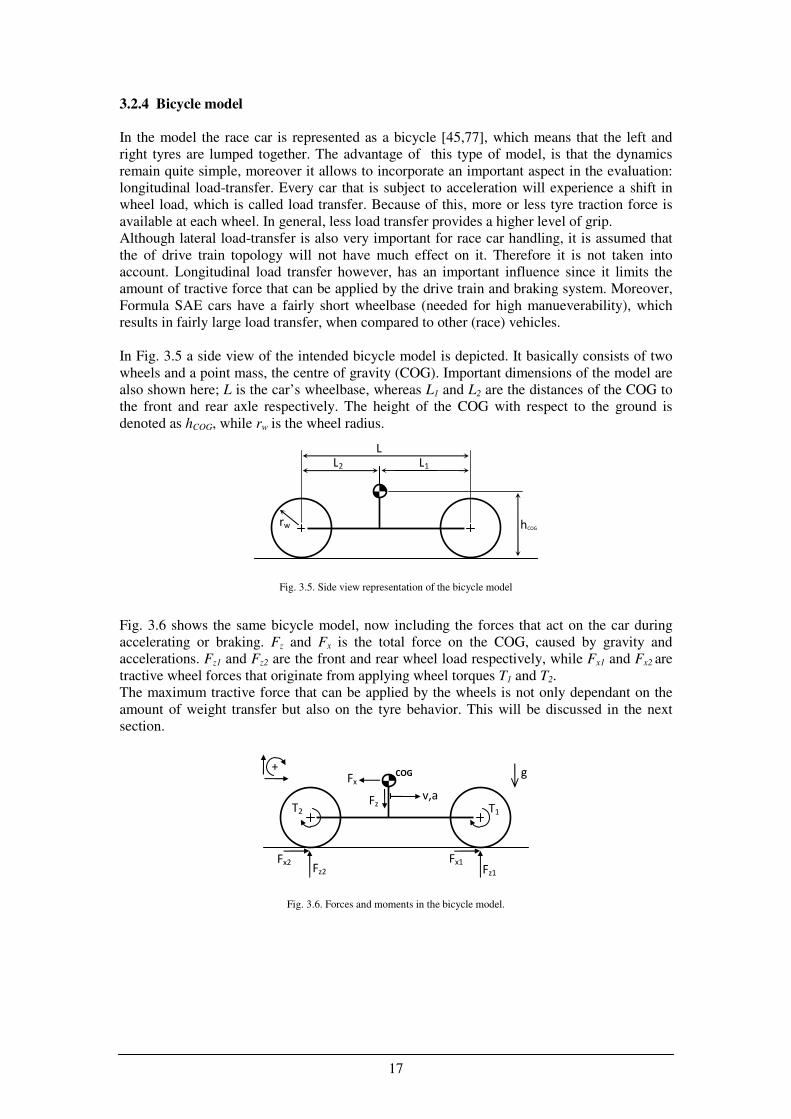
In Fig. 3.5 a side view of the intended bicycle model is depicted. It basically consists of two
wheels and a point mass, the centre of gravity (COG). Important dimensions of the model are
also shown here; L is the car’s wheelbase, whereas L1 and L2 are the distances of the COG to
the front and rear axle respectively. The height of the COG with respect to the ground is
denoted as hCOG, while rw is the wheel radius.
Fig. 3.6 shows the same bicycle model, now including the forces that act on the car during
accelerating or braking. Fz and Fx is the total force on the COG, caused by gravity and
accelerations. Fz1 and Fz2 are the front and rear wheel load respectively, while Fx1 and Fx2 are
tractive wheel forces that originate from applying wheel torques T1 and T2.
The maximum tractive force that can be applied by the wheels is not only dependant on the
amount of weight transfer but also on the tyre behavior. This will be discussed in the next
section.
L L2
hCOG rw
L1
Fig. 3.5. Side view representation of the bicycle model
COG
v,a
Fx2 Fz2
Fx1 Fz1
T2 T1
Fz
Fx g
+
Fig. 3.6. Forces and moments in the bicycle model.
18
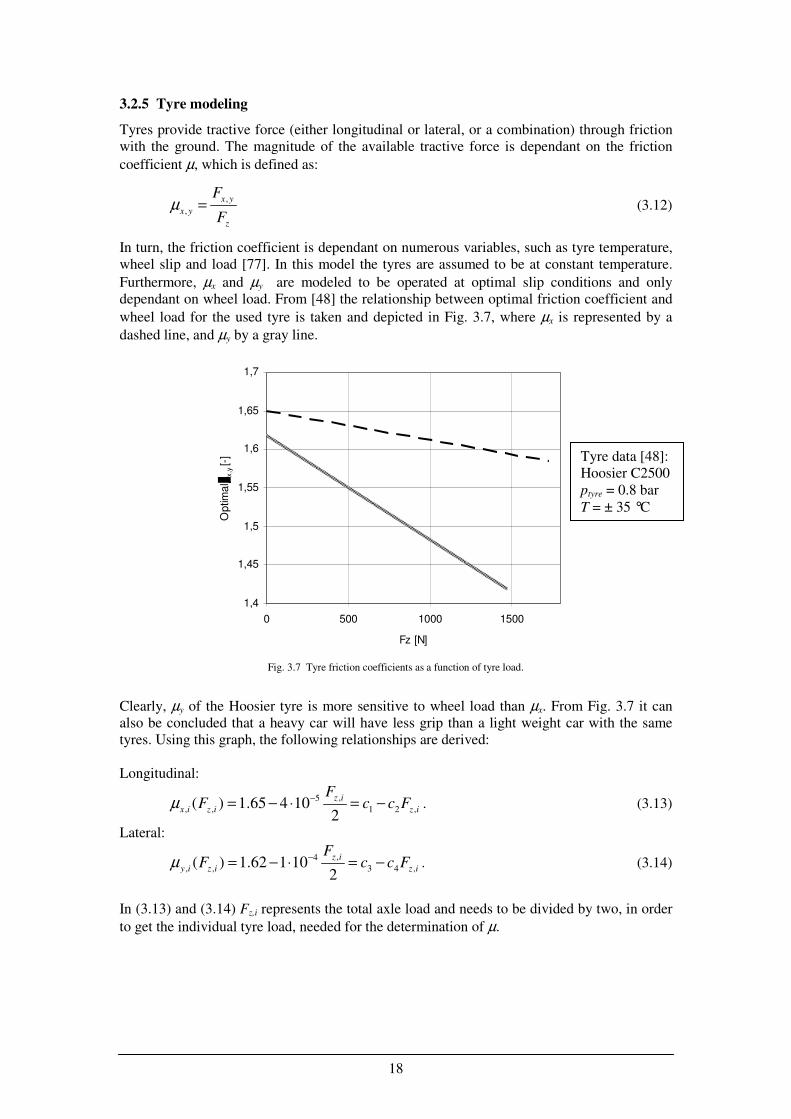
3.2.5 Tyre modeling
Tyres provide tractive force (either longitudinal or lateral, or a combination) through friction
with the ground. The magnitude of the available tractive force is dependant on the friction
coefficient µ, which is defined as:
,
,
x y
x y
z
F
Fµ = (3.12)
In turn, the friction coefficient is dependant on numerous variables, such as tyre temperature,
wheel slip and load [77]. In this model the tyres are assumed to be at constant temperature.
Furthermore, µx and µy are modeled to be operated at optimal slip conditions and only
dependant on wheel load. From [48] the relationship between optimal friction coefficient and
wheel load for the used tyre is taken and depicted in Fig. 3.7, where µx is represented by a
dashed line, and µy by a gray line.
Clearly, µy of the Hoosier tyre is more sensitive to wheel load than µx. From Fig. 3.7 it can
also be concluded that a heavy car will have less grip than a light weight car with the same
tyres. Using this graph, the following relationships are derived:
Longitudinal:
,5
, , 1 2 ,( ) 1.65 4 102
z i
x i z i z i
FF c c Fµ −= − ⋅ = − . (3.13)
Lateral:
,4
, , 3 4 ,( ) 1.62 1 102
z i
y i z i z i
FF c c Fµ −= − ⋅ = − . (3.14)
In (3.13) and (3.14) Fz,i represents the total axle load and needs to be divided by two, in order
to get the individual tyre load, needed for the determination of µ.
1,4
1,45
1,5
1,55
1,6
1,65
1,7
0 500 1000 1500
Fz [N]
Optim
al
x,y [-]
Fig. 3.7 Tyre friction coefficients as a function of tyre load.
Tyre data [48]:
Hoosier C2500
ptyre = 0.8 bar
T = ± 35 °C
19
3.2.6 Acceleration
The tractive force during acceleration can be calculated, by considering the situation in Fig.
3.6. All forces that act on the wheels and COG must in equilibrium, and with known vehicle
parameters and (3.13), the system can be solved for Fx,i. Since this research assumes that only
rear-wheel driven cars are to be evaluated, Fx1 consequently reduces to zero.
The acceleration force Fx2 is given by:
2
2 2 2 2 1 2 2 2( )x x z z z zF F F c F c Fµ= = − , (3.15)
where the value of Fz2 can be determined by the follwing equation;
2
1 2 1 1 2 1 2 1
2
2
( ) ( ) 4( )( )
2( )
COG COG COG
z
COG
L L c h L L c h c h L mgF
c h
− + − + + − − −= , (3.16)
which is only dependant on vehicle and tyre parameters. In Appendix C.1 the derivation of
(3.16) is presented.
3.2.7 Braking
Similarly, the tractive forces Fx2 and Fx2 during braking can be determined. Now both the
front and rear wheels contribute in decelerating the vehicle:
2
1 1 1 1 1 2 1x z z zF F c F c Fµ= = − (3.17)
2
2 2 2 1 2 2 2x z z zF F c F c Fµ= = − (3.18)
The values of Fz1 and Fz2 are determined by:
2 2 2
2 1 2 2 1 2 2 1 2 2
1
2
(2 ) (2 ) 4( 2 )( )
2( 2 )
COG v COG v COG COG v v COG v
z
COG
c h m g L L c h m g L L c h c h m g m gL c h m gF
c h
− − − + − − − − + −=
−
(3.19)
, and:
2 1 1( )z z z v zF F F m g F= − = − . (3.20)
In Appendix C.2. a derivation of (3.19) is given.
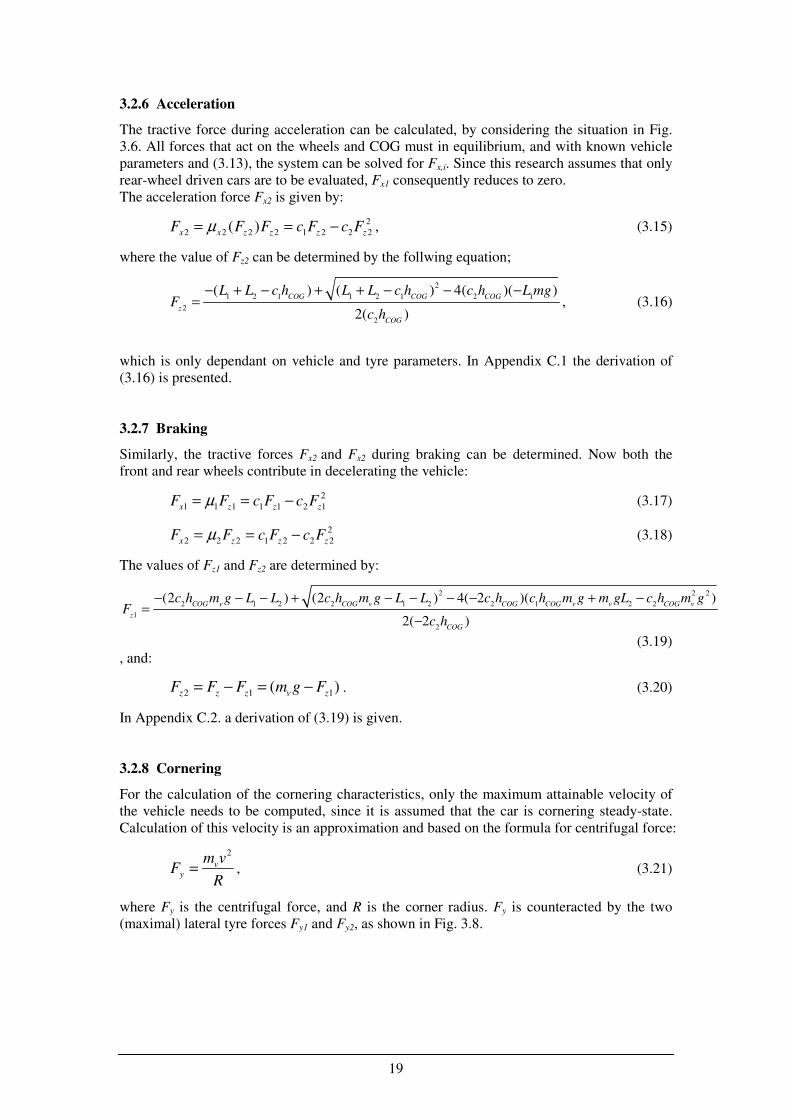
3.2.8 Cornering
For the calculation of the cornering characteristics, only the maximum attainable velocity of
the vehicle needs to be computed, since it is assumed that the car is cornering steady-state.
Calculation of this velocity is an approximation and based on the formula for centrifugal force:
2
vy
m vF
R= , (3.21)
where Fy is the centrifugal force, and R is the corner radius. Fy is counteracted by the two
(maximal) lateral tyre forces Fy1 and Fy2, as shown in Fig. 3.8.
20
The maximum velocity of the car in an arbitrary corner with constant radius is given by:
2 2
2 12 1max 3 4 3 42 2
v vm L g m L gL g L g
v R c c c cL L L L
= − + −
. (3.22)
Appendix C.3. shows how (3.22) is derived.
3.3 Preliminary velocity profile
Now all ingredients are available to calculate a preliminary velocity profile, that results from
the bicycle model driving on the proposed track. This velocity profile assumes that the drive
train and brakes have a surplus of power and that the tyres are the only limiting factor. The
total vehicle mass is given by:
v empty driver drivetrainm m m m= + + , (3.23)
where mempty is the car mass without a drive train installed, and mdriver and mdrivetrain are the
driver and drive train masses respectively. mdrivetrain is taken to be 80 kg for now. All necessary
parameters are based on the URE05 and shown in Table 3.3.
According to (3.1) the car’s acceleration a can be determined at every distance step by
evaluating:
, ,t i r i
i
v
F Fa
m
−= , (3.24)
where i denotes the step number. The new velocity vi of the car at the end of step i is
calculated by rearranging the equation for uniform acceleration:
2
1 2i i iv v a s−= − , (3.25)
where s is the stepsize (0.1m). This method of approximating the velocity makes use of the
trapezoidal rule for numerical interpolation. (3.25) needs the end velocity of the previous step,
but obviously this value is not yet generated at the start of the simulation. To solve this, the
lap end velocity is calculated first, where the car exits a corner with constant speed.
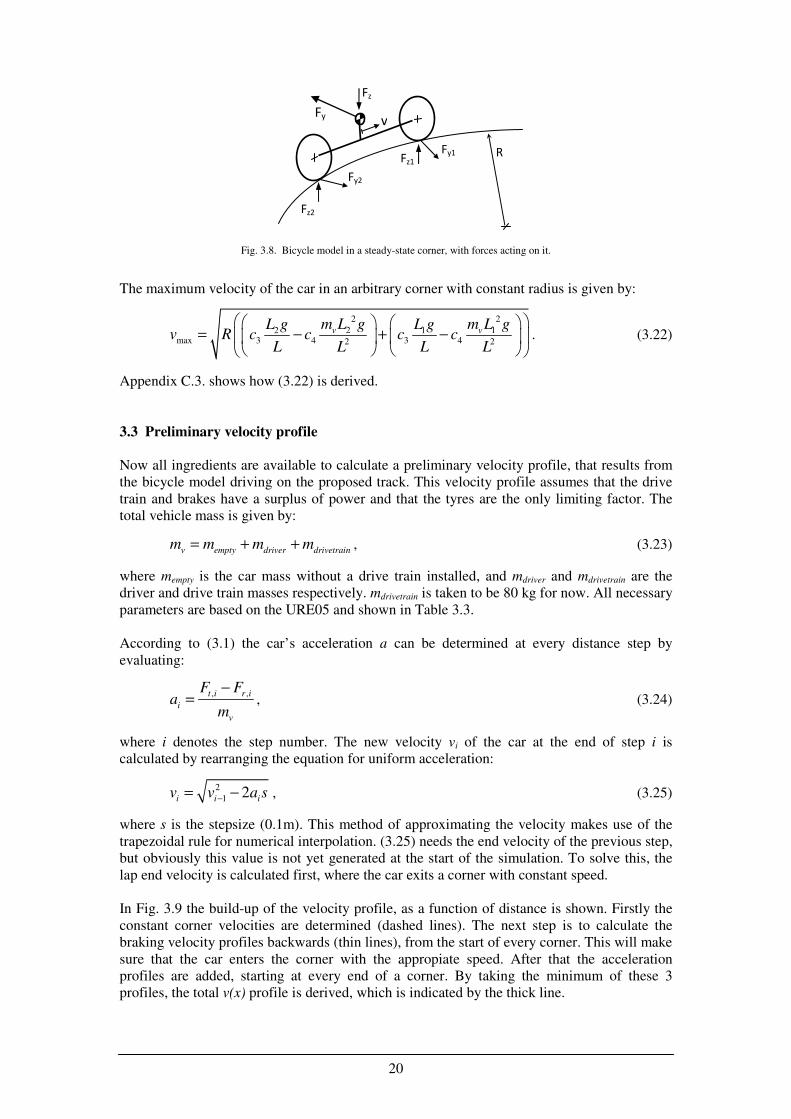
In Fig. 3.9 the build-up of the velocity profile, as a function of distance is shown. Firstly the
constant corner velocities are determined (dashed lines). The next step is to calculate the
braking velocity profiles backwards (thin lines), from the start of every corner. This will make
sure that the car enters the corner with the appropiate speed. After that the acceleration
profiles are added, starting at every end of a corner. By taking the minimum of these 3
profiles, the total v(x) profile is derived, which is indicated by the thick line.
R
Fy2
Fy1
Fy v
Fz2
Fz1
Fz
Fig. 3.8. Bicycle model in a steady-state corner, with forces acting on it.
21
Quantity Symbol Value Unit
Empty vehicle mass mempty 160 kg
Driver mass mdriver 68 kg
Drive train mass mdrivetrain 80 kg
Rolling coefficient cr 0.035 -
Wheel radius rw 0.25 m
Wheel base L 1.6 m
Distance front axle to COG L1 0.8 m
Distance rear axle to COG L2 0.8 m
COG height hCOG 0.28 m
Optimal tyre side slip angle αopt 0.1 rad
First longitudinal coefficient c1 1.65 -
Second longitudinal coefficient c2 2·10-5
-
First lateral coefficient c3 1.62 -
Second lateral coefficient c4 5·10-5
-
Table 3.3. Parameter values for the simulation model.
0
50
100
150
200
0 100 200 300 400 500 600 700 800 900
Distance x [m]
v [
km
/h]
v_corner
v_braking
v_final
Fig. 3.9. Construction of the preliminary velocity profile.
22
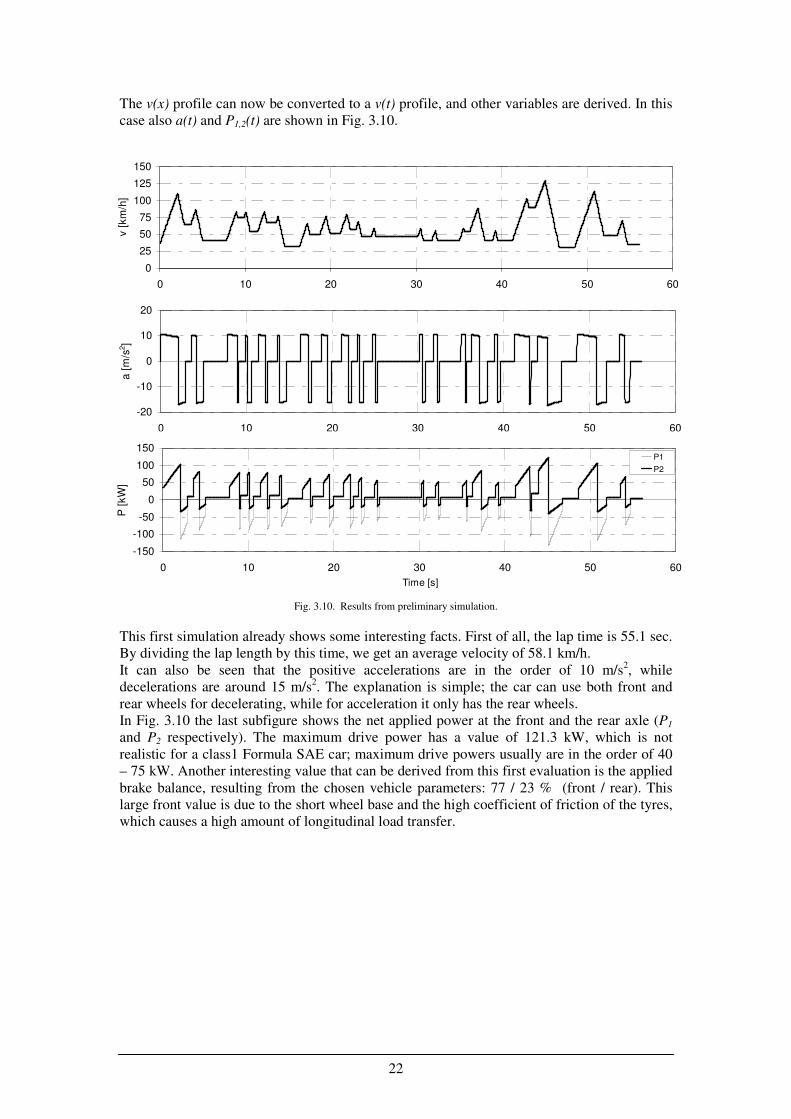
The v(x) profile can now be converted to a v(t) profile, and other variables are derived. In this
case also a(t) and P1,2(t) are shown in Fig. 3.10.
This first simulation already shows some interesting facts. First of all, the lap time is 55.1 sec.
By dividing the lap length by this time, we get an average velocity of 58.1 km/h.
It can also be seen that the positive accelerations are in the order of 10 m/s2, while
decelerations are around 15 m/s2. The explanation is simple; the car can use both front and
rear wheels for decelerating, while for acceleration it only has the rear wheels.
In Fig. 3.10 the last subfigure shows the net applied power at the front and the rear axle (P1
and P2 respectively). The maximum drive power has a value of 121.3 kW, which is not
realistic for a class1 Formula SAE car; maximum drive powers usually are in the order of 40
– 75 kW. Another interesting value that can be derived from this first evaluation is the applied
brake balance, resulting from the chosen vehicle parameters: 77 / 23 % (front / rear). This
large front value is due to the short wheel base and the high coefficient of friction of the tyres,
which causes a high amount of longitudinal load transfer.
0
25
50
75
100
125
150
0 10 20 30 40 50 60
v [
km
/h]
-20
-10
0
10
20
0 10 20 30 40 50 60
a [
m/s
2]
-150
-100
-50
0
50
100
150
0 10 20 30 40 50 60
Time [s]
P [
kW
]
P1
P2
Fig. 3.10. Results from preliminary simulation.
23
3.4 Topologies
In this section the drive train topologies of interest are discussed. As already highlighted in
Section 2.1, the number of allowed power sources, propulsion systems and drive train
topologies in class1A is vast and it is out of the scope of this report to evaluate them all.
Therefore a first reduction is made, which is based on practical arguments.
First of all, propulsion systems based on an Internal Combustion Engine (ICE); the main
choice to be made is about the type of fuel that it uses. In Appendix A the options are
summarized and furthermore the allowed amount of displacement is given. Since the engine is
preferably an off-the-shelf part, the selection is restricted to commercially available ICE’s up
to 250cc (with the exception of diesel: 310cc). Practically all engines with this displacement
are powered by petrol [50], so running them on another fuel type will require moderate to
extensive modifications. The displacement is also a concern; the allowed value of 250cc will
severly limit the available power (estimated to be about 23.5 kW maximally). Combining the
ICE with another propulsion system is therefore preferable, resulting in a hybrid drive train of
some form. However, the ICE drive train, powered by petrol, is modeled in this Master’s
thesis, since it will offer a benchmark for the other types, and can also be compared to results
from past events.
Another propulsion system with a single prime mover is the battery electric vehicle (BEV),
which is considered to be a good candidate for class1A. This type of vehicle is also in
development by many companies, due to it’s good energy efficiency and zero-emission
characteristics.
The other group of candidates for class1A is the hybrid vehicles. Possible combinations are
for instance:
1. ICE + electric system
2. ICE + hydraulic system
3. Fuel cell + electric system
4. ICE/FC + hydraulic system + electric system
Option 1 will be evaluated in this report in the form of both a conventional parallel and series
topology. More complex forms of option 1 are the mixed HEV’s [68,70], but are not taken
into account.
Option 2 is discarded, since it usually associated with heavy-duty vehicles [71] and a rather
poor efficiency for the hydraulic converters.
Option 3 is the subject of the Formula Zero competition [i8], but is deemed to be too complex
to start with, since it involves two completely unknown technologies for URE, that need to be
combined [58].
Option 4 indicates the group of hybrids with more than 2 combined propulsion systems
An example of such a system is presented in [51], but this group is also considered too
complex and is very likely to result in poor reliability.
Apart from these main propulsion systems there are many other allowed subsystems and setup
options in the class1A competition. These include:
• Transmission systems:
o Rear / Front / All wheel drive
o Fixed gear / Stepped gear / Continuous Variable
o Final drive: Chain / Belt / Shaft with bevel gear
o Differential: Open / Limited slip etc.
o Clutch: dry / wet / torque converter
• Internal Combustion Engine
o Naturally Aspirated
24
o Turbo charged
o Super charged
• Electric machine
o Coupled via drive shaft to wheels
o In-wheel
Since the intended car for class1A will be a conversion of the URE05, it is chosen to place all
drive components inside the existing rear frame. Furthermore it is chosen to keep all of-the-
shelf components as unmodified as possible. Final transmission systems are chosen to be
conventional, from a Formula SAE point of view (i.e. RWD with chain final reduction). This
will ensure reliability of components and the integrity of the the used car. In the next sections
the drive train topologies are explained.
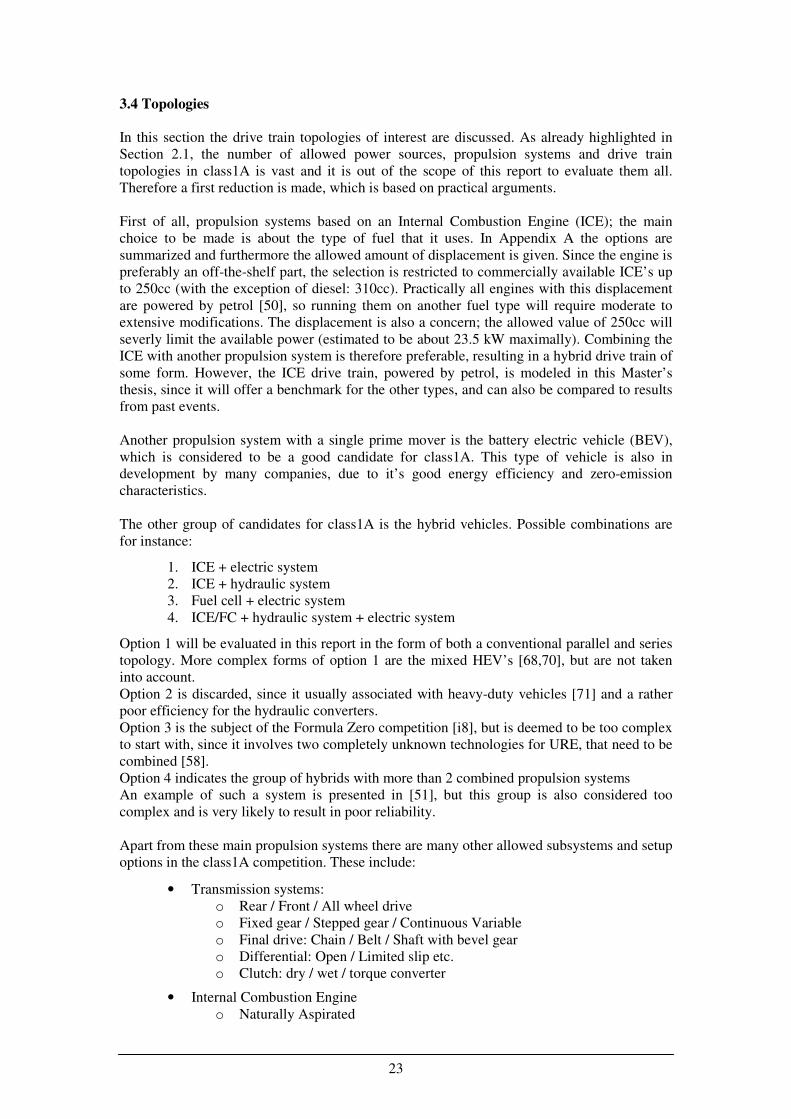
3.4.1 Conventional drive train (ICE)
As a benchmark, the standard ICE drive train is evaluated. In Fig. 3.11 the block diagram is
depicted. Fuel is directed from the fuel tank into the ICE. The ICE converts the energy of the
fuel into mechanical power. After that the mechanical power is transferred to the gearbox and
subsequently to the final drive, which drives the rear wheels. ICE’s in Formula SAE are
usually taken from motorcycles, due to their high specific power. These types of engines have
the stepped transmission incorporated into the engine housing.
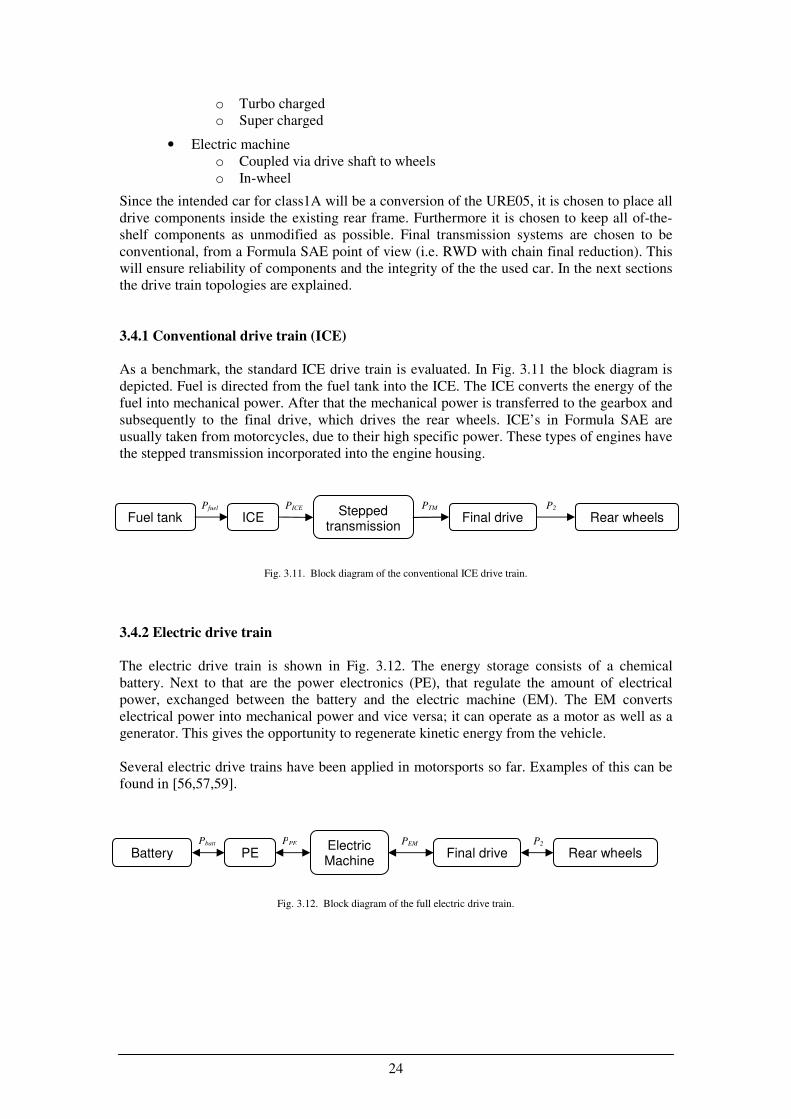
3.4.2 Electric drive train
The electric drive train is shown in Fig. 3.12. The energy storage consists of a chemical
battery. Next to that are the power electronics (PE), that regulate the amount of electrical
power, exchanged between the battery and the electric machine (EM). The EM converts
electrical power into mechanical power and vice versa; it can operate as a motor as well as a
generator. This gives the opportunity to regenerate kinetic energy from the vehicle.
Several electric drive trains have been applied in motorsports so far. Examples of this can be
found in [56,57,59].
Fig. 3.11. Block diagram of the conventional ICE drive train.
Fig. 3.12. Block diagram of the full electric drive train.
P2
Battery PE Electric Machine
Final drive Rear wheels Pbatt PPE PEM
Fuel tank ICE Stepped
transmission Final drive Rear wheels
Pfuel PICE PTM P2
25
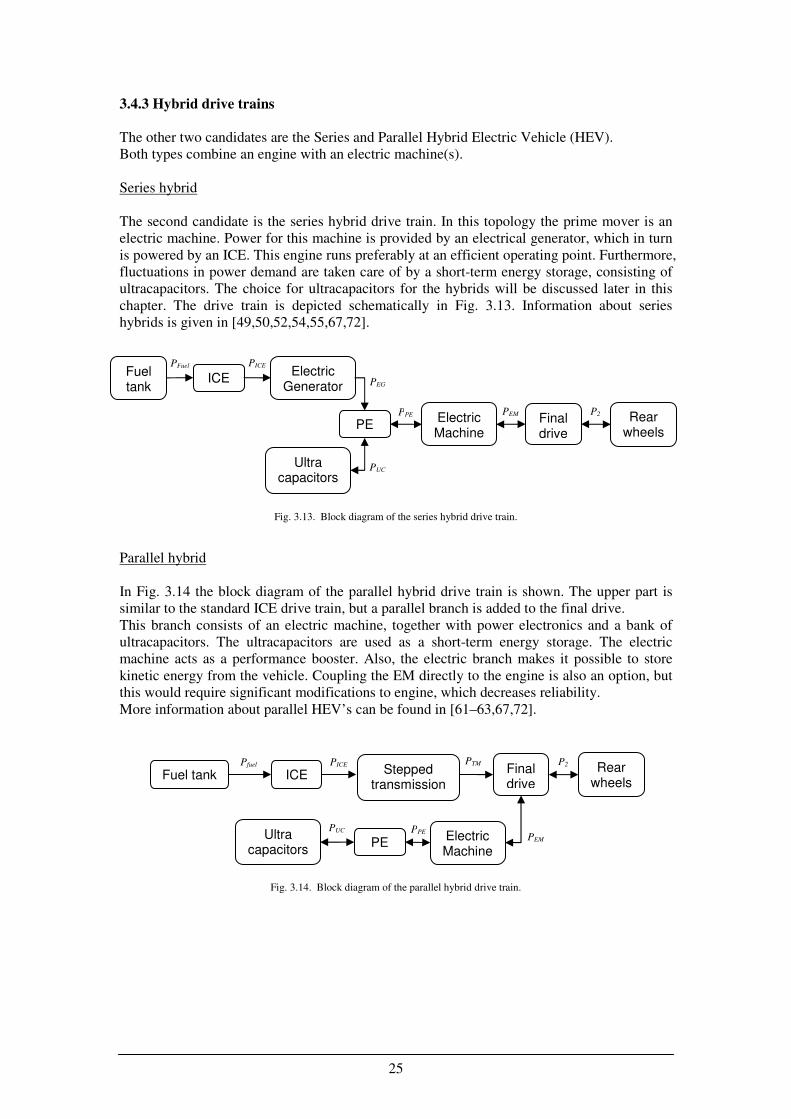
3.4.3 Hybrid drive trains
The other two candidates are the Series and Parallel Hybrid Electric Vehicle (HEV).
Both types combine an engine with an electric machine(s).
Series hybrid
The second candidate is the series hybrid drive train. In this topology the prime mover is an
electric machine. Power for this machine is provided by an electrical generator, which in turn
is powered by an ICE. This engine runs preferably at an efficient operating point. Furthermore,
fluctuations in power demand are taken care of by a short-term energy storage, consisting of
ultracapacitors. The choice for ultracapacitors for the hybrids will be discussed later in this
chapter. The drive train is depicted schematically in Fig. 3.13. Information about series
hybrids is given in [49,50,52,54,55,67,72].
Parallel hybrid
In Fig. 3.14 the block diagram of the parallel hybrid drive train is shown. The upper part is
similar to the standard ICE drive train, but a parallel branch is added to the final drive.
This branch consists of an electric machine, together with power electronics and a bank of
ultracapacitors. The ultracapacitors are used as a short-term energy storage. The electric
machine acts as a performance booster. Also, the electric branch makes it possible to store
kinetic energy from the vehicle. Coupling the EM directly to the engine is also an option, but
this would require significant modifications to engine, which decreases reliability.
More information about parallel HEV’s can be found in [61–63,67,72].
Fig. 3.14. Block diagram of the parallel hybrid drive train.
PE Electric Machine
Final drive
Rear wheels
PUC PPE
PTM P2
Ultra capacitors
ICE Fuel tank PICE Pfuel
PEM
Stepped transmission
Fig. 3.13. Block diagram of the series hybrid drive train.
PE Electric Machine
Final drive
Rear wheels
PUC
PPE PEM P2
Ultra capacitors
ICE Electric
Generator PEG
Fuel tank
PICE PFuel
26
3.5 Components
In this section all individual components are discussed, which are used in the drive trains of
interest. Suitable models are presented for determining the component characteristics and
efficiencies.
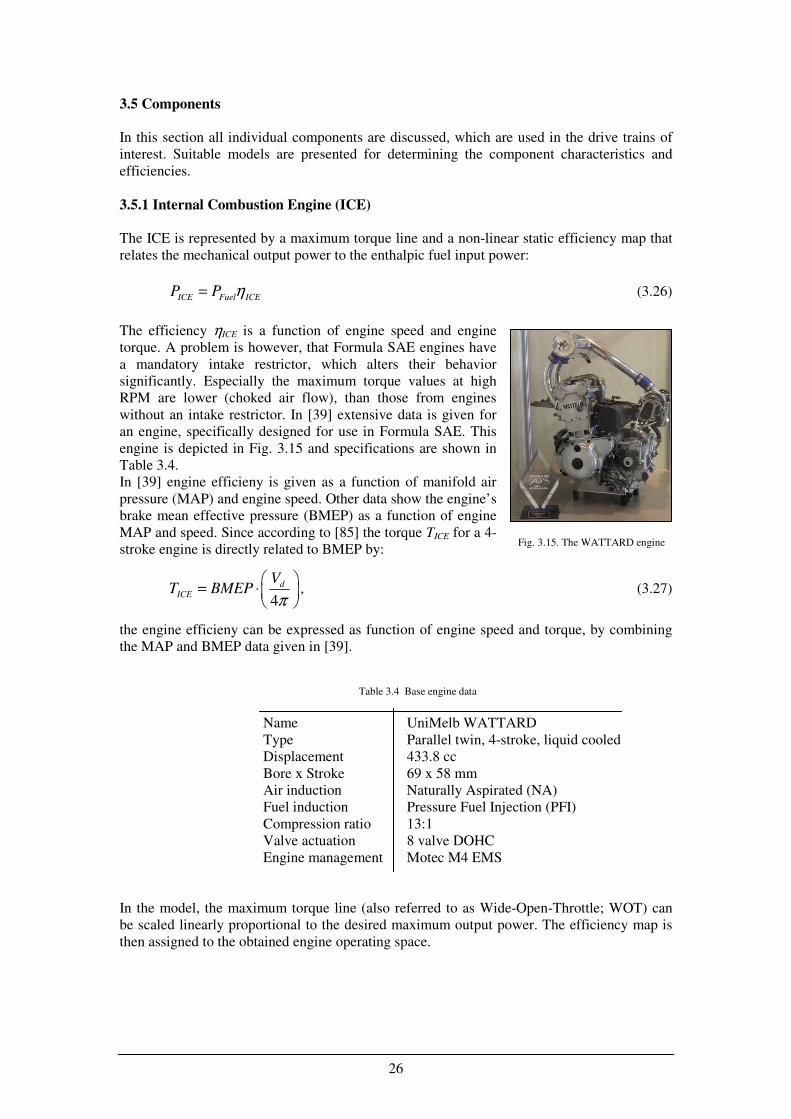
3.5.1 Internal Combustion Engine (ICE)
The ICE is represented by a maximum torque line and a non-linear static efficiency map that
relates the mechanical output power to the enthalpic fuel input power:
ICE Fuel ICEP P η= (3.26)
The efficiency ηICE is a function of engine speed and engine
torque. A problem is however, that Formula SAE engines have
a mandatory intake restrictor, which alters their behavior
significantly. Especially the maximum torque values at high
RPM are lower (choked air flow), than those from engines
without an intake restrictor. In [39] extensive data is given for
an engine, specifically designed for use in Formula SAE. This
engine is depicted in Fig. 3.15 and specifications are shown in
Table 3.4.
In [39] engine efficieny is given as a function of manifold air
pressure (MAP) and engine speed. Other data show the engine’s
brake mean effective pressure (BMEP) as a function of engine
MAP and speed. Since according to [85] the torque TICE for a 4-
stroke engine is directly related to BMEP by:
4
dICE
VT BMEP
π
= ⋅
, (3.27)
the engine efficieny can be expressed as function of engine speed and torque, by combining
the MAP and BMEP data given in [39].
Table 3.4 Base engine data
Name UniMelb WATTARD
Type Parallel twin, 4-stroke, liquid cooled
Displacement 433.8 cc
Bore x Stroke 69 x 58 mm
Air induction Naturally Aspirated (NA)
Fuel induction Pressure Fuel Injection (PFI)
Compression ratio 13:1
Valve actuation 8 valve DOHC
Engine management Motec M4 EMS
In the model, the maximum torque line (also referred to as Wide-Open-Throttle; WOT) can
be scaled linearly proportional to the desired maximum output power. The efficiency map is
then assigned to the obtained engine operating space.
Fig. 3.15. The WATTARD engine
27
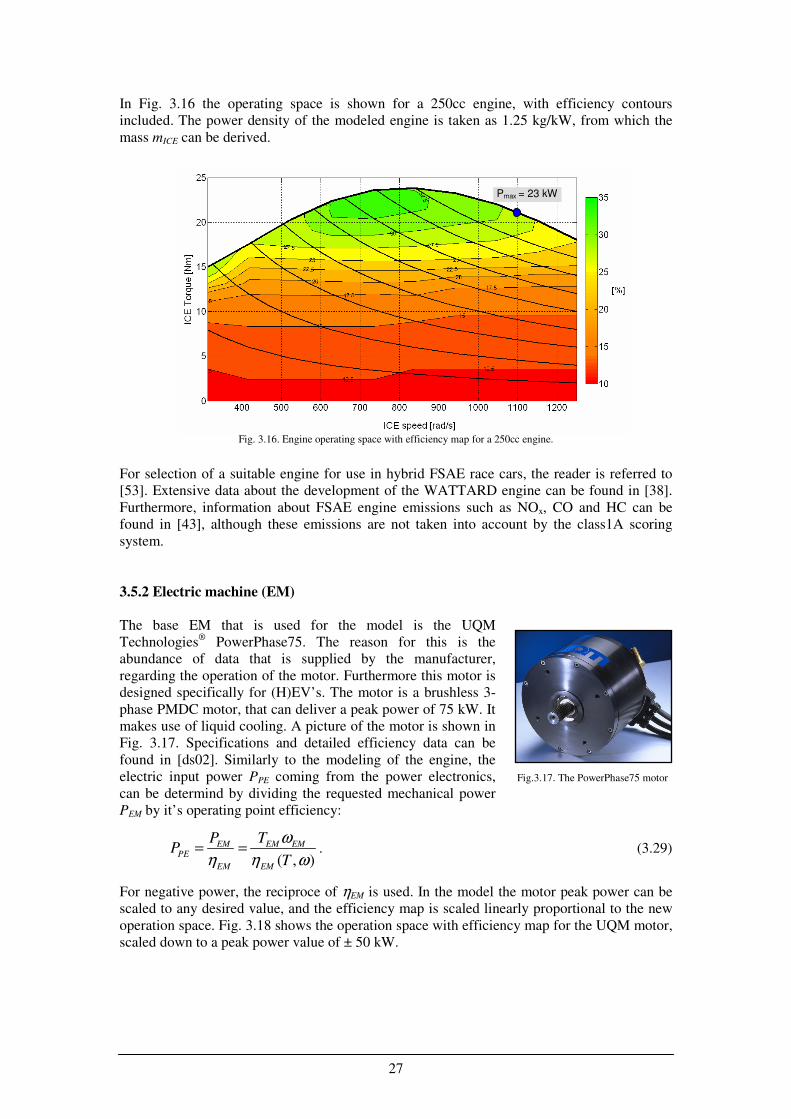
In Fig. 3.16 the operating space is shown for a 250cc engine, with efficiency contours
included. The power density of the modeled engine is taken as 1.25 kg/kW, from which the
mass mICE can be derived.
For selection of a suitable engine for use in hybrid FSAE race cars, the reader is referred to
[53]. Extensive data about the development of the WATTARD engine can be found in [38].
Furthermore, information about FSAE engine emissions such as NOx, CO and HC can be
found in [43], although these emissions are not taken into account by the class1A scoring
system.
3.5.2 Electric machine (EM)
The base EM that is used for the model is the UQM
Technologies® PowerPhase75. The reason for this is the
abundance of data that is supplied by the manufacturer,
regarding the operation of the motor. Furthermore this motor is
designed specifically for (H)EV’s. The motor is a brushless 3-
phase PMDC motor, that can deliver a peak power of 75 kW. It
makes use of liquid cooling. A picture of the motor is shown in
Fig. 3.17. Specifications and detailed efficiency data can be
found in [ds02]. Similarly to the modeling of the engine, the
electric input power PPE coming from the power electronics,
can be determind by dividing the requested mechanical power
PEM by it’s operating point efficiency:
( , )
EM EM EMPE
EM EM
P TP
T
ω
η η ω= = . (3.29)
For negative power, the reciproce of ηEM is used. In the model the motor peak power can be
scaled to any desired value, and the efficiency map is scaled linearly proportional to the new
operation space. Fig. 3.18 shows the operation space with efficiency map for the UQM motor,
scaled down to a peak power value of ± 50 kW.
Pmax = 23 kW
Fig. 3.16. Engine operating space with efficiency map for a 250cc engine.
Fig.3.17. The PowerPhase75 motor
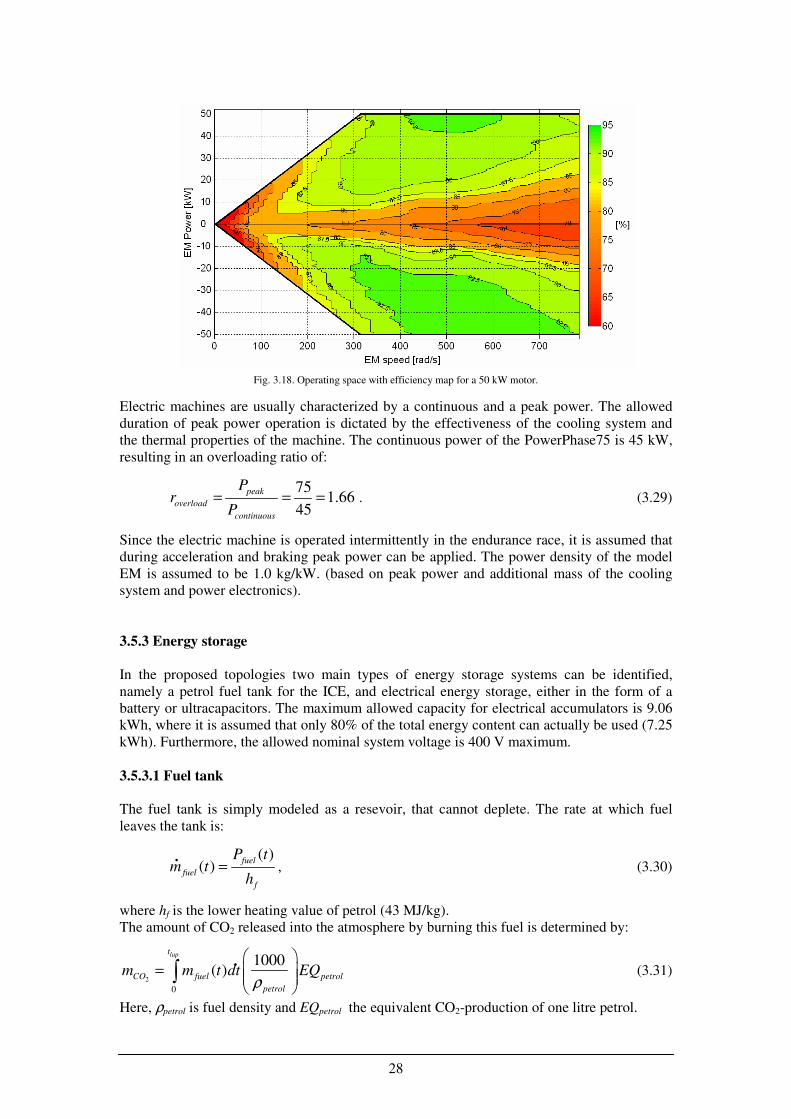
28
Electric machines are usually characterized by a continuous and a peak power. The allowed
duration of peak power operation is dictated by the effectiveness of the cooling system and
the thermal properties of the machine. The continuous power of the PowerPhase75 is 45 kW,
resulting in an overloading ratio of:
75
1.6645
peak
overload
continuous
Pr
P= = = . (3.29)
Since the electric machine is operated intermittently in the endurance race, it is assumed that
during acceleration and braking peak power can be applied. The power density of the model
EM is assumed to be 1.0 kg/kW. (based on peak power and additional mass of the cooling
system and power electronics).
3.5.3 Energy storage
In the proposed topologies two main types of energy storage systems can be identified,
namely a petrol fuel tank for the ICE, and electrical energy storage, either in the form of a
battery or ultracapacitors. The maximum allowed capacity for electrical accumulators is 9.06
kWh, where it is assumed that only 80% of the total energy content can actually be used (7.25
kWh). Furthermore, the allowed nominal system voltage is 400 V maximum.
3.5.3.1 Fuel tank
The fuel tank is simply modeled as a resevoir, that cannot deplete. The rate at which fuel
leaves the tank is:
( )( )
fuel
fuel
f
P tm t
h= , (3.30)
where hf is the lower heating value of petrol (43 MJ/kg).
The amount of CO2 released into the atmosphere by burning this fuel is determined by:
2
0
1000( )
lapt
CO fuel petrol
petrol
m m t dt EQρ
=
∫ (3.31)
Here, ρpetrol is fuel density and EQpetrol the equivalent CO2-production of one litre petrol.
Fig. 3.18. Operating space with efficiency map for a 50 kW motor.
.
.
29
3.5.3.2 Batteries
Batteries are electrochemical energy storage systems and are a key component in electric and
hybrid drive trains. Secondary batteries are rechargeable; chemical energy can be transformed
into electrical energy and vice versa. Chemistries that are applied most for secondary batteries
are lead-acid, nickel-metal hydride and lithium-ion. The latter has the highest energy density
of these three and is therefore regarded as the most suitable chemistry for a race car.
Batteries are characterized by their capacity Q0, which is the integral of the the current that
can be delivered under certain conditions. The charge level Qc of a battery is given by:
0
0
( )
t
c battQ Q I t dt= + ∫ . (3.32)
The state-of-charge SOC is a dimensionless parameter, representing the relative charge in the
battery:
0
100%cQ
SOCQ
= × . (3.33)
Since the component models are power based, the battery characteristic is modeled as:
, ,int ,batt eff batt batt lossP P P= − . (3.34)
Pbatt,eff is the effective power measured at the terminals, Pbatt,int the actual power stored in the
battery and Pbatt,loss is the internal loss power, generated as heat.
In this respect it is more appropiate to consider the energy stored in the battery by the state-of-
energy SOE, which is defined as:
0
100%sE
SOEE
= × , (3.35)
where Es is the remaining amount of battery energy and Eo the initial amount, defined as:
0 0 0( ) 3600E Q V= ⋅ . (3.36)
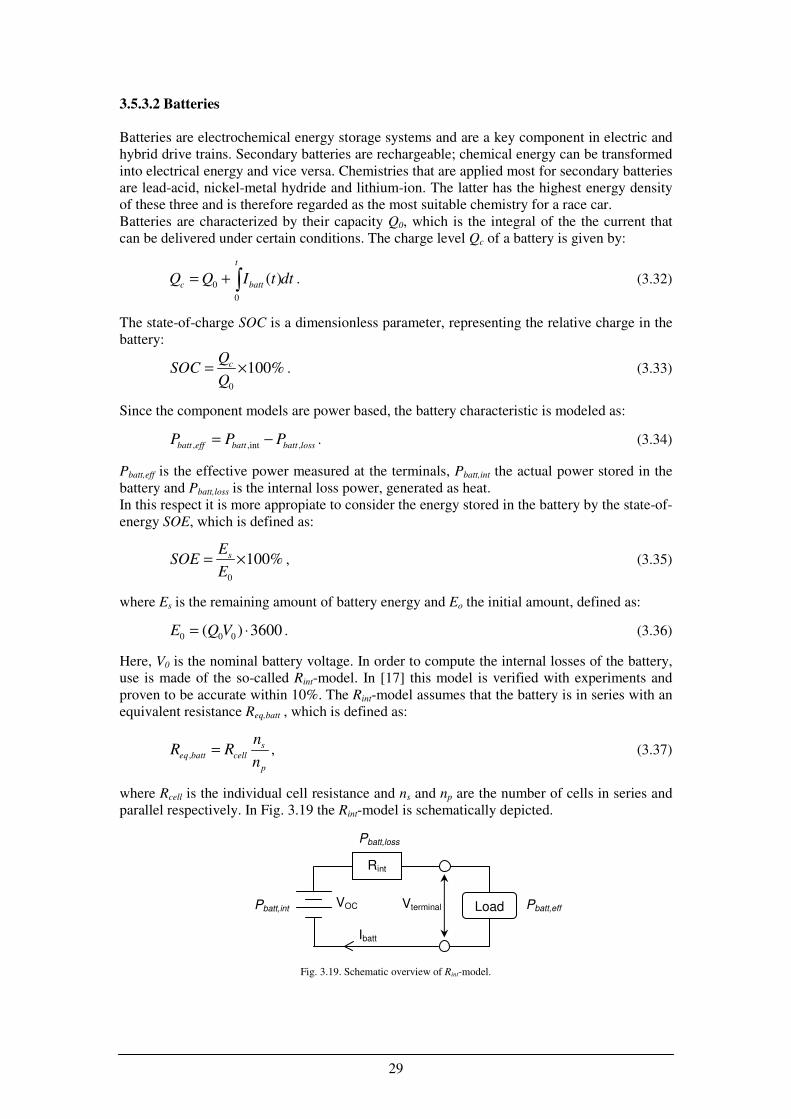
Here, V0 is the nominal battery voltage. In order to compute the internal losses of the battery,
use is made of the so-called Rint-model. In [17] this model is verified with experiments and
proven to be accurate within 10%. The Rint-model assumes that the battery is in series with an
equivalent resistance Req,batt , which is defined as:
,s
eq batt cell
p
nR R
n= , (3.37)
where Rcell is the individual cell resistance and ns and np are the number of cells in series and
parallel respectively. In Fig. 3.19 the Rint-model is schematically depicted.
Rint
Load
Ibatt
VOC Vterminal Pbatt,eff
Pbatt,loss
Pbatt,int
Fig. 3.19. Schematic overview of Rint-model.
30
The battery internal power Pbatt,int is:
,intbatt OC battP V I= , (3.38)
where VOC is the open-circuit voltage and Ibatt the battery current. VOC is determined by:
( )OC cell s
V V SOE n= . (3.39)
Furthermore, the internal loss power is given by:
2
, ,batt loss batt eq battP I R= . (3.40)
Combining (3.34), (3.38) and (3.40) yields:
2
, ( ) ( )batt eff OC batt batt battP V I I R= − . (3.41)
Here Ibatt can be computed by rearranging (3.41) to a quadratic equation and finding the root:
2
, ,
,
4
2
OC OC eq batt batt eff
batt
eq batt
V V R PI
R
− −= (3.42)
Once Ibatt is known, (3.34) can be solved. The battery efficiency for discharging is
consequently given by:
,
,
,int
batt eff
batt dc
batt
P
Pη = , (3.43)
and for charging:
,int
,
,
batt
batt c
batt eff
P
Pη = . (3.44)
The total energy taken from the battery can be determined by integrating the internal power
over one lap:
,int ,int
0
lapt
batt battE P dt= ∫ . (3.45)
Finally, the amount of CO2 that is generated in a power plant for supplying this amount of
battery energy is given by:
2
,int
63.6 10
batt
CO electric
Em EQ=
⋅ (3.46)
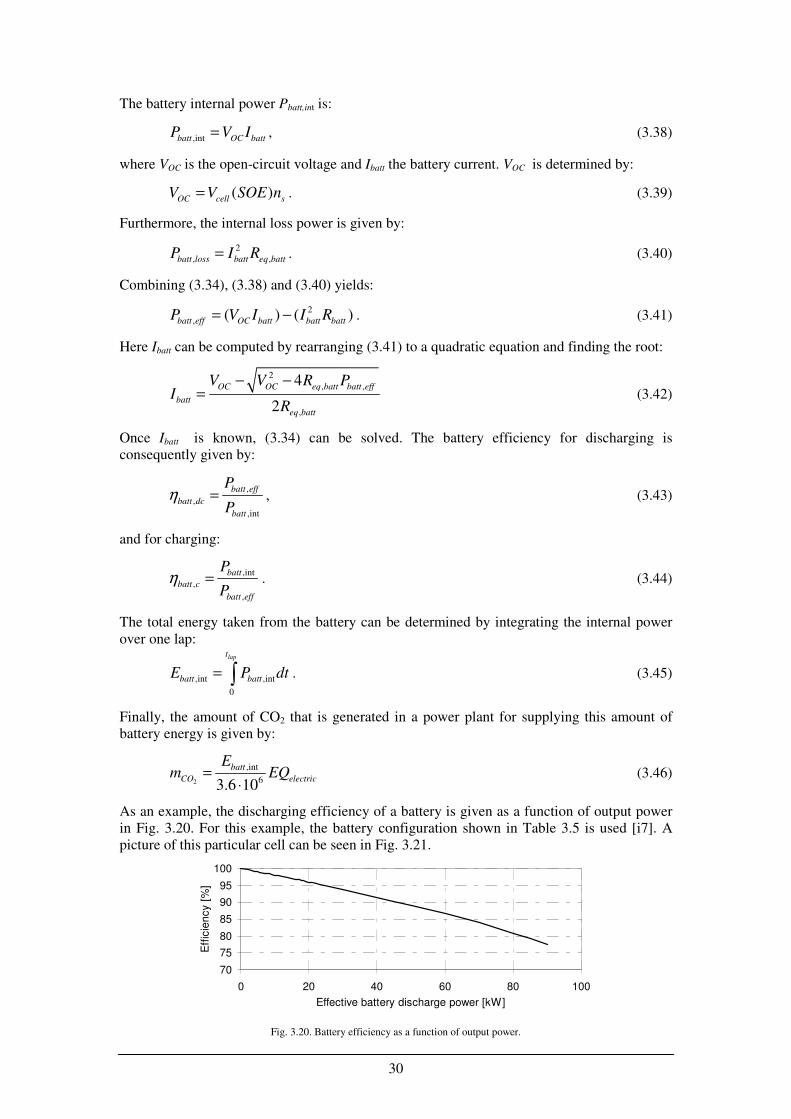
As an example, the discharging efficiency of a battery is given as a function of output power
in Fig. 3.20. For this example, the battery configuration shown in Table 3.5 is used [i7]. A
picture of this particular cell can be seen in Fig. 3.21.
70
75
80
85
90
95
100
0 20 40 60 80 100
Effective battery discharge power [kW]
Eff
icie
ncy [
%]
Fig. 3.20. Battery efficiency as a function of output power.
31
Table 3.5 Battery configuration
Cell type LiFeBatt 40138 10Ah
Cell chemistry LiFePO4
Cell resistance 6 mΩ
Battery configuration 102 series / 2 parallel
Nominal voltage 400 Volt
Total capacity 8 kWh
State-of-Energy 50 %
This cell type is used a base cell for the model and battery properties, such as total mass, are
determined from this unit cell.
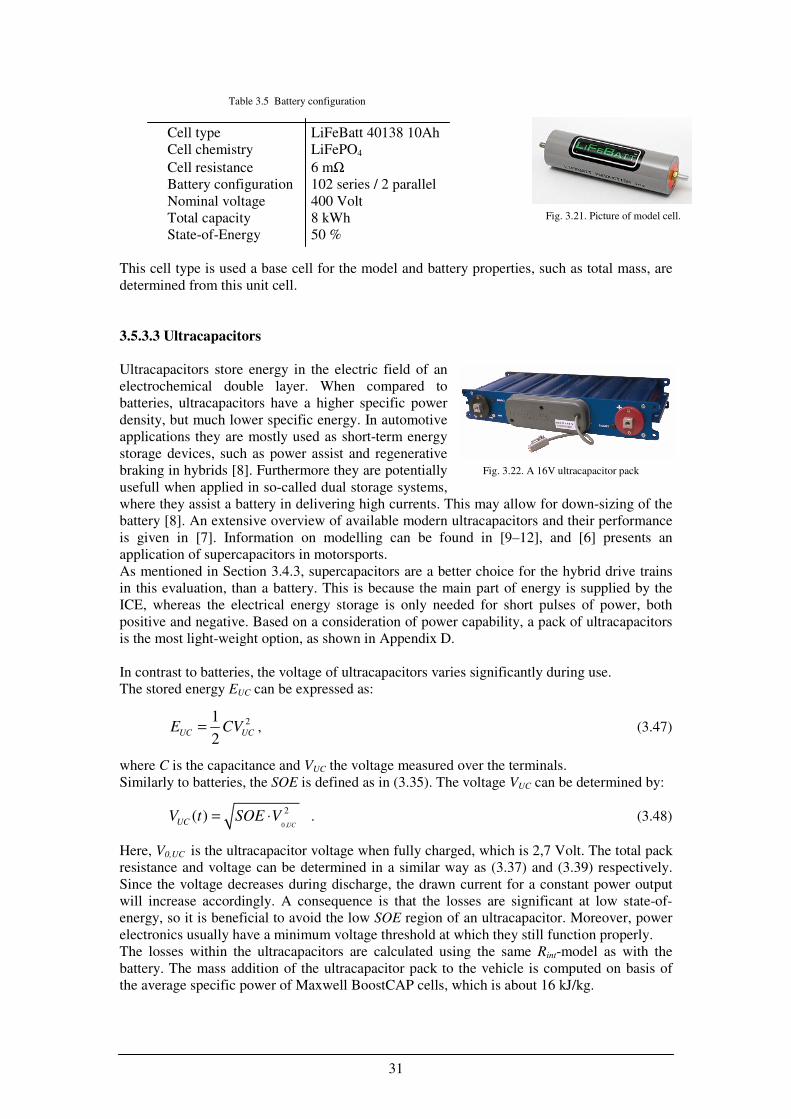
3.5.3.3 Ultracapacitors
Ultracapacitors store energy in the electric field of an
electrochemical double layer. When compared to
batteries, ultracapacitors have a higher specific power
density, but much lower specific energy. In automotive
applications they are mostly used as short-term energy
storage devices, such as power assist and regenerative
braking in hybrids [8]. Furthermore they are potentially
usefull when applied in so-called dual storage systems,
where they assist a battery in delivering high currents. This may allow for down-sizing of the
battery [8]. An extensive overview of available modern ultracapacitors and their performance
is given in [7]. Information on modelling can be found in [9–12], and [6] presents an
application of supercapacitors in motorsports.
As mentioned in Section 3.4.3, supercapacitors are a better choice for the hybrid drive trains
in this evaluation, than a battery. This is because the main part of energy is supplied by the
ICE, whereas the electrical energy storage is only needed for short pulses of power, both
positive and negative. Based on a consideration of power capability, a pack of ultracapacitors
is the most light-weight option, as shown in Appendix D.
In contrast to batteries, the voltage of ultracapacitors varies significantly during use.
The stored energy EUC can be expressed as:
21
2UC UC
E CV= , (3.47)
where C is the capacitance and VUC the voltage measured over the terminals.
Similarly to batteries, the SOE is defined as in (3.35). The voltage VUC can be determined by:
0,
2( )UCUC
V t SOE V= ⋅ . (3.48)
Here, V0,UC is the ultracapacitor voltage when fully charged, which is 2,7 Volt. The total pack
resistance and voltage can be determined in a similar way as (3.37) and (3.39) respectively.
Since the voltage decreases during discharge, the drawn current for a constant power output
will increase accordingly. A consequence is that the losses are significant at low state-of-
energy, so it is beneficial to avoid the low SOE region of an ultracapacitor. Moreover, power
electronics usually have a minimum voltage threshold at which they still function properly.
The losses within the ultracapacitors are calculated using the same Rint-model as with the
battery. The mass addition of the ultracapacitor pack to the vehicle is computed on basis of
the average specific power of Maxwell BoostCAP cells, which is about 16 kJ/kg.
Fig. 3.22. A 16V ultracapacitor pack
Fig. 3.21. Picture of model cell.
32
3.5.4 Transmission
Transmission systems adapt the tractive power provided by the power converter(s).
Transmission components mostly used in Fomula SAE are stepped gear transmissions, chain
reductions and differentials. Some teams have used continuous variable transmissions, of the
passive type (also known as variators). These have been adopted from snow scooters, due to
their light-weight design and automatic control.
The modeling of reductions and the transmission in this report is kept fairly simple. The
output torque is given by:
inout TR
TT
rη= , (3.49)
where r is the ratio and the efficiency ηTR is assumed to have a constant value of 0.99 for each
reduction.
Because a standard motorcycle engine will be used for the ICE and parallel hybrid topology, a
6-speed sequential transmission is already present. The respective ratio’s are taken from
Kawasaki’s 250cc Ninja engine, and listed in Table 3.6. The distribution of the gear steps is
progressive. The transmission has the selectable gears in series with a primary gear, so the
efficiency of the transmission is 0.992. Furthermore there is a final drive reduction, which can
be varied in the model.
Table 3.6 Kawasaki transmission ratio’s
rprimary r1 r2 r3 r4 r5 r6
0.309 0.384 0.558 0.709 0.862 1.000 1.120
Shifting between gears is modeled to be without any time delay. This is a fairly safe
assumption, since the gear boxes have a sequential selection mechanism and the actuator is
modified to a pneumatic system. Shifting times in the order of 20ms can be achieved using
this setup.
The selected gear is determined by assigning a maximum allowed angular velocity for the
ICE, and then taking the gear that produces the highest ICE speed under this value. This
method allows for avoiding high rpm regions (also referred to as ‘early-upshifting’), where
the ICE efficiency is slightly worse, but at the cost of reduced maximum power.
3.5.5 Power electronics
The power electronics that regulate the power to the electric machine is simply modeled with
a constant efficiency ηPE of 96%. The output power is given consequently by:
out PE inP Pη= , (3.50)
where Pout and Pin are determined by the direction of the power flow.
3.6 Drive train control strategies
In this section the control strategies for operating the different drive trains are discussed. In
literature [79], several types of control strategies are presented. These can be split up into
three main categories:
• Heuristic
• Sub-optimal
• Optimal
33
In this research the heuristic approach is adopted, in the form of a rule-based operation of the
drive train components. The main advantage of heuristic controllers is that they are intuitive
to conceive and rather easy to implement. Drawbacks are the fact that they need to be tuned to
get the best results, and that the results are not optimal. More information about specific
hybrid controllers can be found in [64,67,69,72,76].
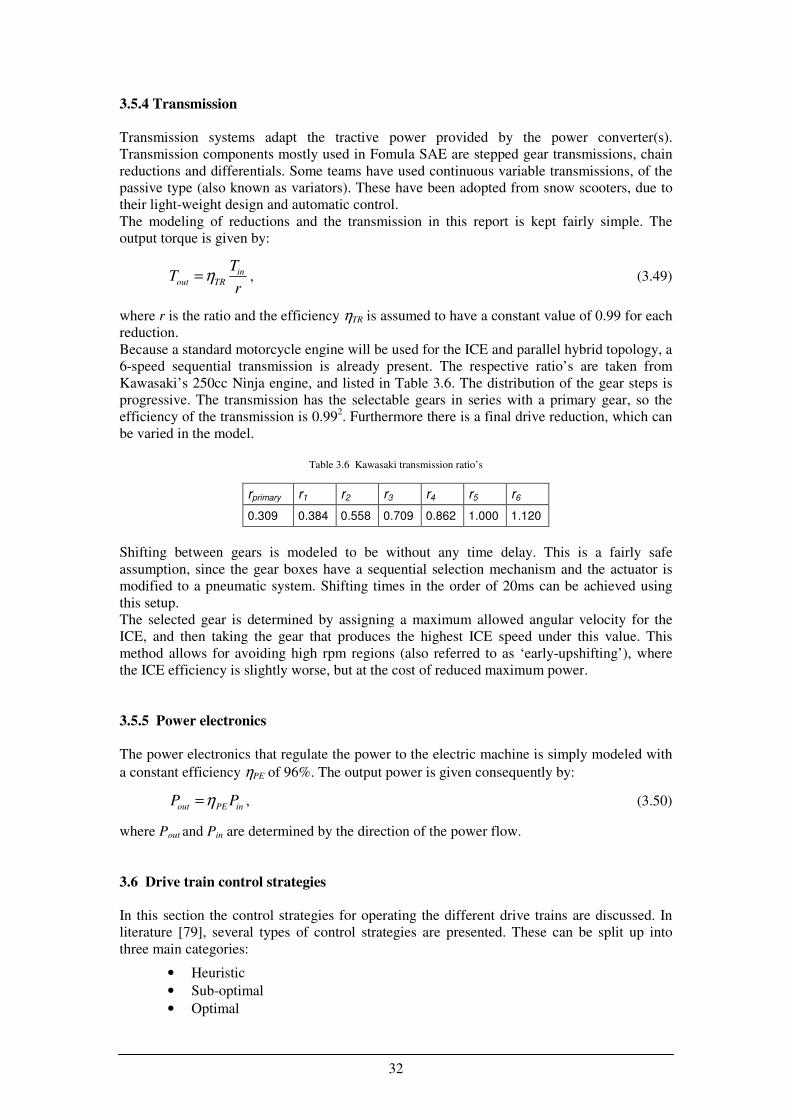
3.6.1 ICE drive train
The operation of the ICE drive train is straight-forward. Fig. 3.23 shows the applied ICE and
brake power as a function of the desired power. The driver indicates the desired power by
actuating the accelerator and brake pedal. In the case of braking, the driver always brakes
maximally (-100%), which corresponds with the optimal braking force, determined in Section
3.2.7.
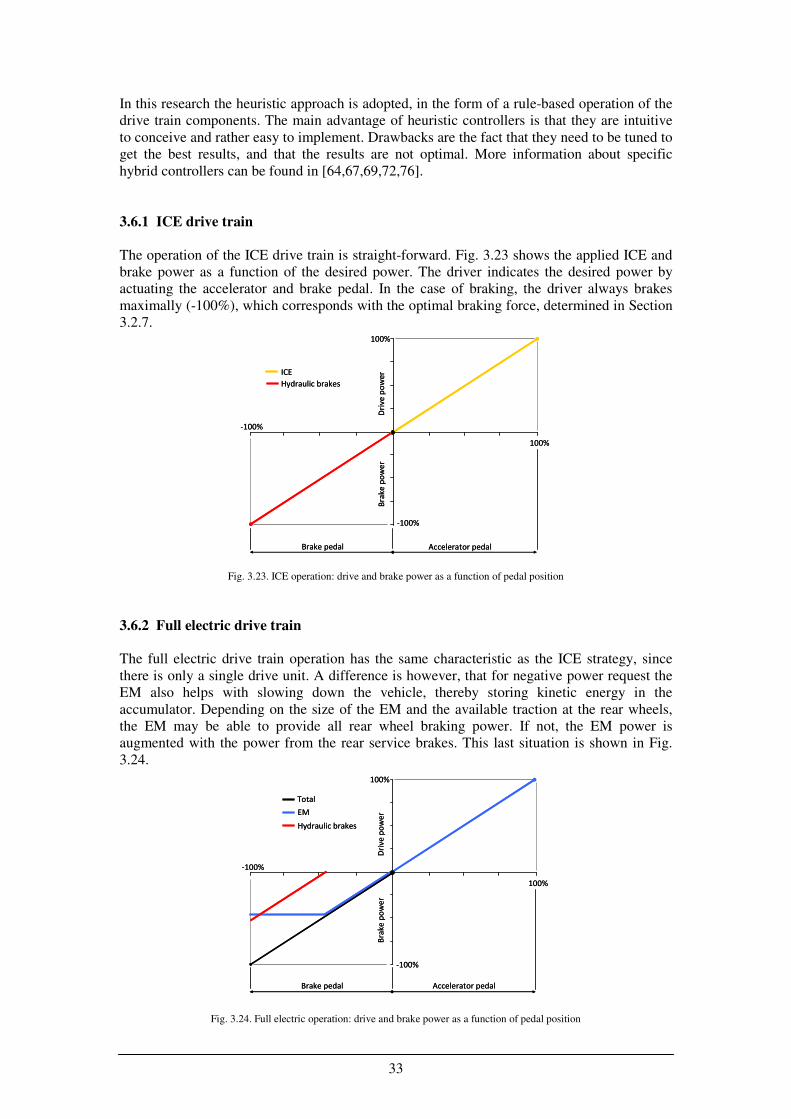
3.6.2 Full electric drive train
The full electric drive train operation has the same characteristic as the ICE strategy, since
there is only a single drive unit. A difference is however, that for negative power request the
EM also helps with slowing down the vehicle, thereby storing kinetic energy in the
accumulator. Depending on the size of the EM and the available traction at the rear wheels,
the EM may be able to provide all rear wheel braking power. If not, the EM power is
augmented with the power from the rear service brakes. This last situation is shown in Fig.
3.24.
Dri
ve
po
we
r
-100%
ICE
Hydraulic brakes
-100%
100%
100%
Accelerator pedalBrake pedal
Bra
ke
po
we
rD
riv
e p
ow
er
-100%
ICE
Hydraulic brakes
-100%
100%
100%
Accelerator pedalBrake pedal
Bra
ke
po
we
r
Fig. 3.23. ICE operation: drive and brake power as a function of pedal position
Total
EM
Hydraulic brakes
-100%
-100%
100%
100%
Accelerator pedalBrake pedal
Bra
ke
po
we
rD
riv
e p
ow
er
Total
EM
Hydraulic brakes
-100%
-100%
100%
100%
Accelerator pedalBrake pedal
Bra
ke
po
we
rD
riv
e p
ow
er
Fig. 3.24. Full electric operation: drive and brake power as a function of pedal position
34
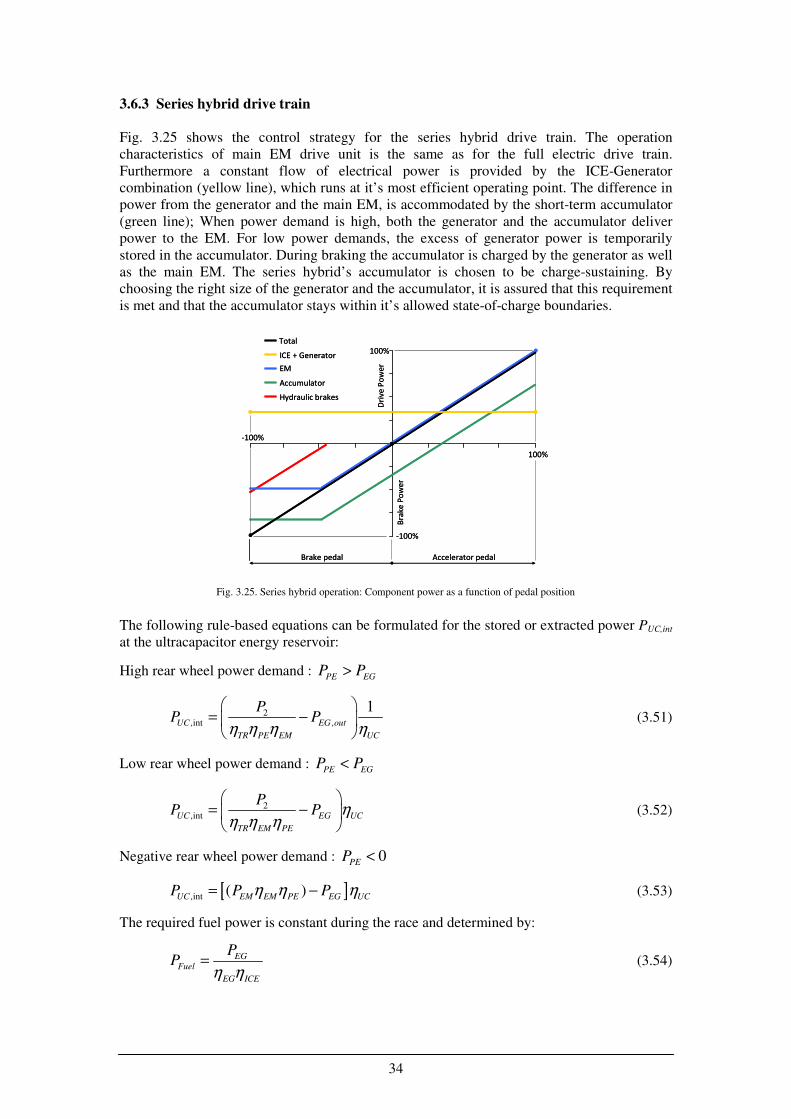
3.6.3 Series hybrid drive train
Fig. 3.25 shows the control strategy for the series hybrid drive train. The operation
characteristics of main EM drive unit is the same as for the full electric drive train.
Furthermore a constant flow of electrical power is provided by the ICE-Generator
combination (yellow line), which runs at it’s most efficient operating point. The difference in
power from the generator and the main EM, is accommodated by the short-term accumulator
(green line); When power demand is high, both the generator and the accumulator deliver
power to the EM. For low power demands, the excess of generator power is temporarily
stored in the accumulator. During braking the accumulator is charged by the generator as well
as the main EM. The series hybrid’s accumulator is chosen to be charge-sustaining. By
choosing the right size of the generator and the accumulator, it is assured that this requirement
is met and that the accumulator stays within it’s allowed state-of-charge boundaries.
The following rule-based equations can be formulated for the stored or extracted power PUC,int
at the ultracapacitor energy reservoir:
High rear wheel power demand : PE EG
P P>
2,int ,
1UC EG out
TR PE EM UC
PP P
η η η η
= −
(3.51)
Low rear wheel power demand : PE EG
P P<
2,intUC EG UC
TR EM PE
PP P η
η η η
= −
(3.52)
Negative rear wheel power demand : 0PE
P <
[ ],int ( )UC EM EM PE EG UCP P Pη η η= − (3.53)
The required fuel power is constant during the race and determined by:
EGFuel
EG ICE
PP
η η= (3.54)
-100%
-100%
100%
100%
Accelerator pedalBrake pedal
Bra
ke
Po
we
r
Total
ICE + Generator
EM
Accumulator
Hydraulic brakes
Dri
ve
Po
we
r
-100%
-100%
100%
100%
Accelerator pedalBrake pedal
Bra
ke
Po
we
r
Total
ICE + Generator
EM
Accumulator
Hydraulic brakes
Dri
ve
Po
we
r
Fig. 3.25. Series hybrid operation: Component power as a function of pedal position
35
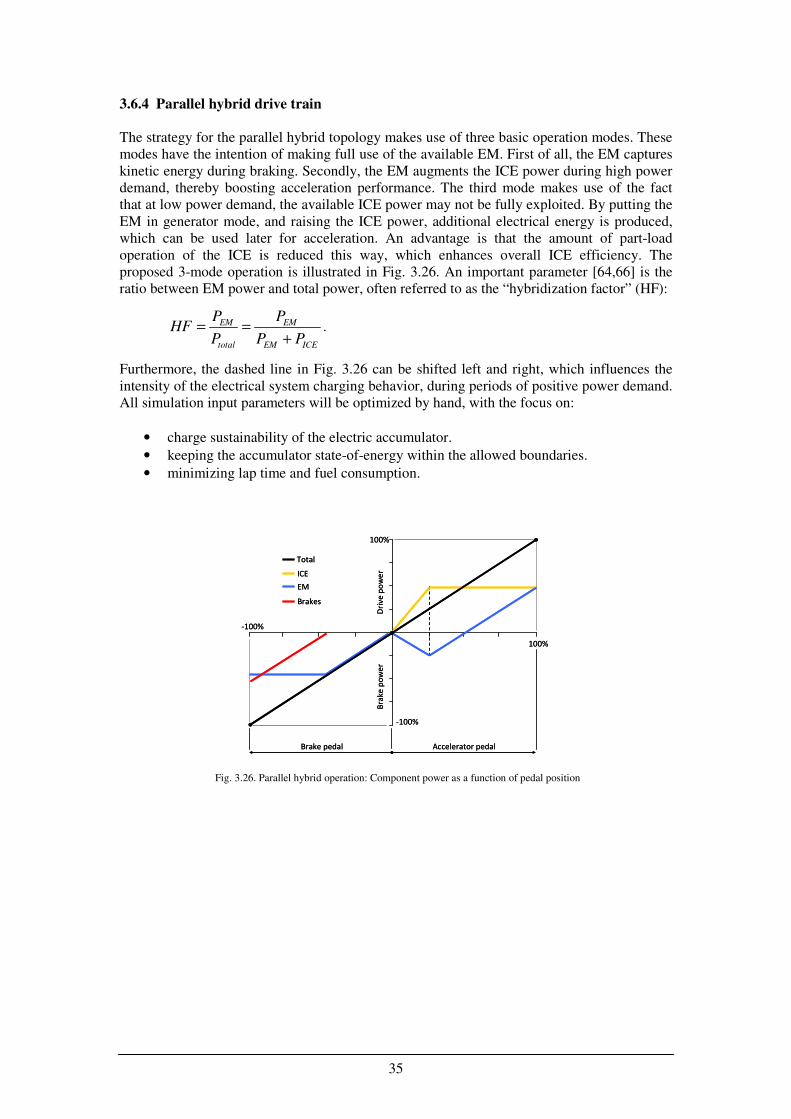
3.6.4 Parallel hybrid drive train
The strategy for the parallel hybrid topology makes use of three basic operation modes. These
modes have the intention of making full use of the available EM. First of all, the EM captures
kinetic energy during braking. Secondly, the EM augments the ICE power during high power
demand, thereby boosting acceleration performance. The third mode makes use of the fact
that at low power demand, the available ICE power may not be fully exploited. By putting the
EM in generator mode, and raising the ICE power, additional electrical energy is produced,
which can be used later for acceleration. An advantage is that the amount of part-load
operation of the ICE is reduced this way, which enhances overall ICE efficiency. The
proposed 3-mode operation is illustrated in Fig. 3.26. An important parameter [64,66] is the
ratio between EM power and total power, often referred to as the “hybridization factor” (HF):
EM EM
total EM ICE
P PHF
P P P= =
+.
Furthermore, the dashed line in Fig. 3.26 can be shifted left and right, which influences the
intensity of the electrical system charging behavior, during periods of positive power demand.
All simulation input parameters will be optimized by hand, with the focus on:
• charge sustainability of the electric accumulator.
• keeping the accumulator state-of-energy within the allowed boundaries.
• minimizing lap time and fuel consumption.
Fig. 3.26. Parallel hybrid operation: Component power as a function of pedal position
100%
Total
ICE
EM
Brakes
-100%
-100%
100%
Accelerator pedalBrake pedal
Dri
ve
po
we
rB
rake
po
we
r
100%
Total
ICE
EM
Brakes
-100%
-100%
100%
Accelerator pedalBrake pedal
Dri
ve
po
we
rB
rake
po
we
r
36
Chapter 4
Simulation
4.1 Introduction
In this chapter the 4 drive train topologies are simulated using the modelling method of
Chapter 2 and 3. The 2009 race car, the URE05, will be used for the vehicle parameters, as
stated in Table 3.3. The car is simulated on the endurance track of the Silverstone circuit. The
main parameter that will be varied is the maximum available drive power, Pmax,rear. This will
be discussed in the next section. After that, simulation results for each topology are presented.
At the end of this chapter, the drive train topologies are being evaluated both on the
quantitative results of the simulations, as well as on qualitative characteristics. Finally, a drive
train topology and preferred configuration is selected and motivated.
4.2 Simulation parameters
A race car’s lap time and energy consumption is to a large extent determined by the available
drive power. Obviously, a very powerfull car goes faster, but will also have an increased
energy usage. Therefore, each topology is evaluated for a range of drive powers:
Pmax,rear = [7,5 10 12,5 15 20 25 30 35 40 45 50] kW. (4.1)
Other parameters, for instance the final drive ratio rfinal, are of less influence.
For each value of Pmax,rear, other input parameters are optimized, with the focus on
minimization of lap time and energy consumption, subject to constraints, such as charge-
sustainability. Due to the short computation time of the model, this can be done on basis of
trial and error. This leads to 4 sets of 11 optimized “drive train configurations”, which can
then be analyzed with respect to each other, and to results from past events. To assess the
effect of a slippery track, the simulation is also done for wet conditions. By halving the tyre
µ-values, this track condition can be implemented. Regenerative braking is disabled for wet
track conditions, since in [49] it is suggested that this is likely to lead to vehicle instability.
In contrast to the preliminary simulation of Section 3.3., the available tractive force of each
drive train is taken into account as well, which results in slower acceleration phases.
( )2 2, 2,( ) min , ( )x x tyre x drivetrain
F t F F t= (4.2)
Deceleration phases remain the same, since it is assumed that the hydraulic brakes have
overcapacity. Furthermore, component sizes are now specified, so the drive train mass can be
determined accurately and added to the empty vehicle mass.
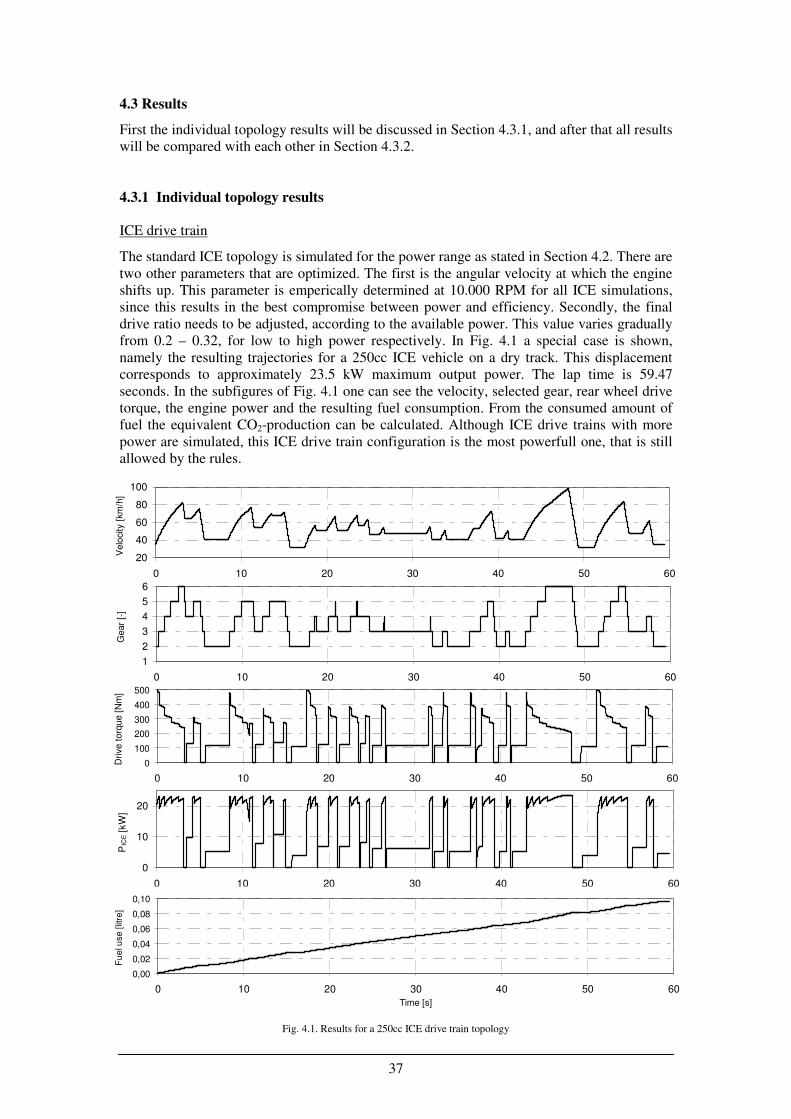
37
4.3 Results
First the individual topology results will be discussed in Section 4.3.1, and after that all results
will be compared with each other in Section 4.3.2.
4.3.1 Individual topology results
ICE drive train
The standard ICE topology is simulated for the power range as stated in Section 4.2. There are
two other parameters that are optimized. The first is the angular velocity at which the engine
shifts up. This parameter is emperically determined at 10.000 RPM for all ICE simulations,
since this results in the best compromise between power and efficiency. Secondly, the final
drive ratio needs to be adjusted, according to the available power. This value varies gradually
from 0.2 – 0.32, for low to high power respectively. In Fig. 4.1 a special case is shown,
namely the resulting trajectories for a 250cc ICE vehicle on a dry track. This displacement
corresponds to approximately 23.5 kW maximum output power. The lap time is 59.47
seconds. In the subfigures of Fig. 4.1 one can see the velocity, selected gear, rear wheel drive
torque, the engine power and the resulting fuel consumption. From the consumed amount of
fuel the equivalent CO2-production can be calculated. Although ICE drive trains with more
power are simulated, this ICE drive train configuration is the most powerfull one, that is still
allowed by the rules.
20
40
60
80
100
0 10 20 30 40 50 60
Velo
city
[km
/h]
1
2
3
4
5
6
0 10 20 30 40 50 60
Gear
[-]
0
100
200
300
400
500
0 10 20 30 40 50 60
Drive t
orq
ue [
Nm
]
0
10
20
0 10 20 30 40 50 60
PIC
E [
kW
]
0,00
0,02
0,04
0,06
0,08
0,10
0 10 20 30 40 50 60
Time [s]
Fu
el u
se
[lit
re]
Fig. 4.1. Results for a 250cc ICE drive train topology
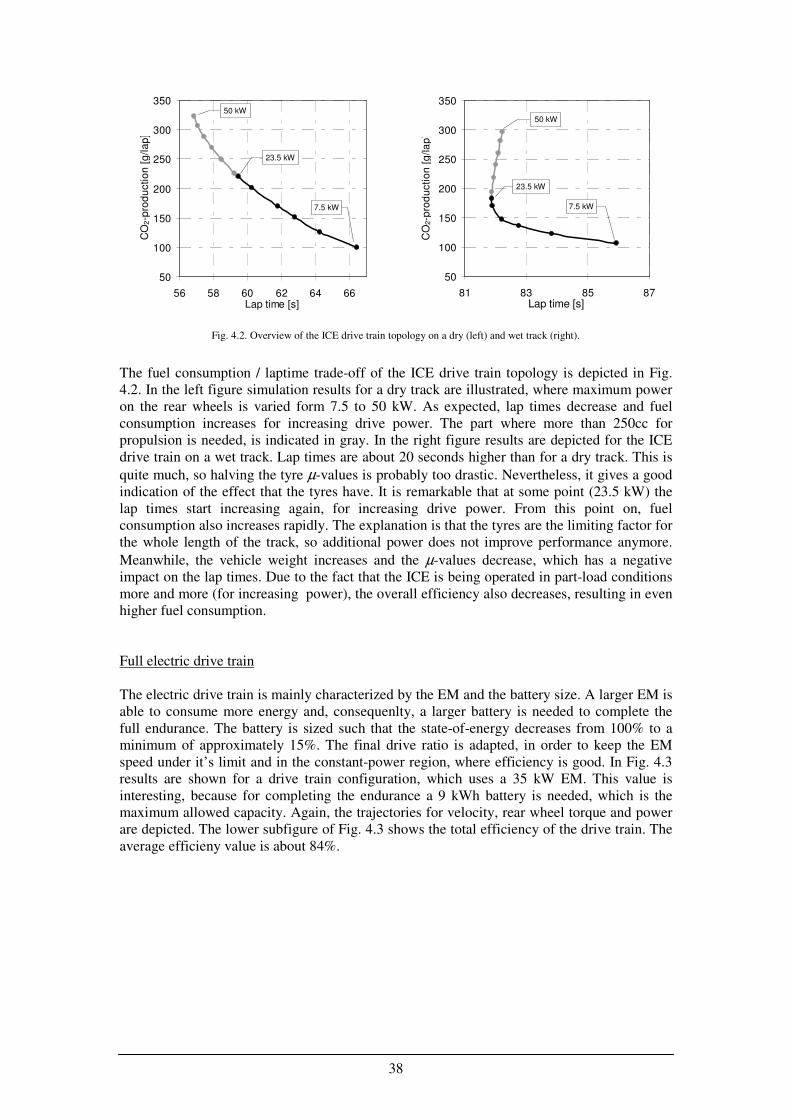
38
The fuel consumption / laptime trade-off of the ICE drive train topology is depicted in Fig.
4.2. In the left figure simulation results for a dry track are illustrated, where maximum power
on the rear wheels is varied form 7.5 to 50 kW. As expected, lap times decrease and fuel
consumption increases for increasing drive power. The part where more than 250cc for
propulsion is needed, is indicated in gray. In the right figure results are depicted for the ICE
drive train on a wet track. Lap times are about 20 seconds higher than for a dry track. This is
quite much, so halving the tyre µ-values is probably too drastic. Nevertheless, it gives a good
indication of the effect that the tyres have. It is remarkable that at some point (23.5 kW) the
lap times start increasing again, for increasing drive power. From this point on, fuel
consumption also increases rapidly. The explanation is that the tyres are the limiting factor for
the whole length of the track, so additional power does not improve performance anymore.
Meanwhile, the vehicle weight increases and the µ-values decrease, which has a negative
impact on the lap times. Due to the fact that the ICE is being operated in part-load conditions
more and more (for increasing power), the overall efficiency also decreases, resulting in even
higher fuel consumption.
Full electric drive train
The electric drive train is mainly characterized by the EM and the battery size. A larger EM is
able to consume more energy and, consequenlty, a larger battery is needed to complete the
full endurance. The battery is sized such that the state-of-energy decreases from 100% to a
minimum of approximately 15%. The final drive ratio is adapted, in order to keep the EM
speed under it’s limit and in the constant-power region, where efficiency is good. In Fig. 4.3
results are shown for a drive train configuration, which uses a 35 kW EM. This value is
interesting, because for completing the endurance a 9 kWh battery is needed, which is the
maximum allowed capacity. Again, the trajectories for velocity, rear wheel torque and power
are depicted. The lower subfigure of Fig. 4.3 shows the total efficiency of the drive train. The
average efficieny value is about 84%.
50
100
150
200
250
300
350
56 58 60 62 64 66Lap time [s]
CO
2-p
rod
uctio
n [
g/la
p]
7.5 kW
23.5 kW
50 kW
50
100
150
200
250
300
350
81 83 85 87Lap time [s]
CO
2-p
rod
uctio
n [
g/la
p]
7.5 kW
23.5 kW
50 kW
Fig. 4.2. Overview of the ICE drive train topology on a dry (left) and wet track (right).
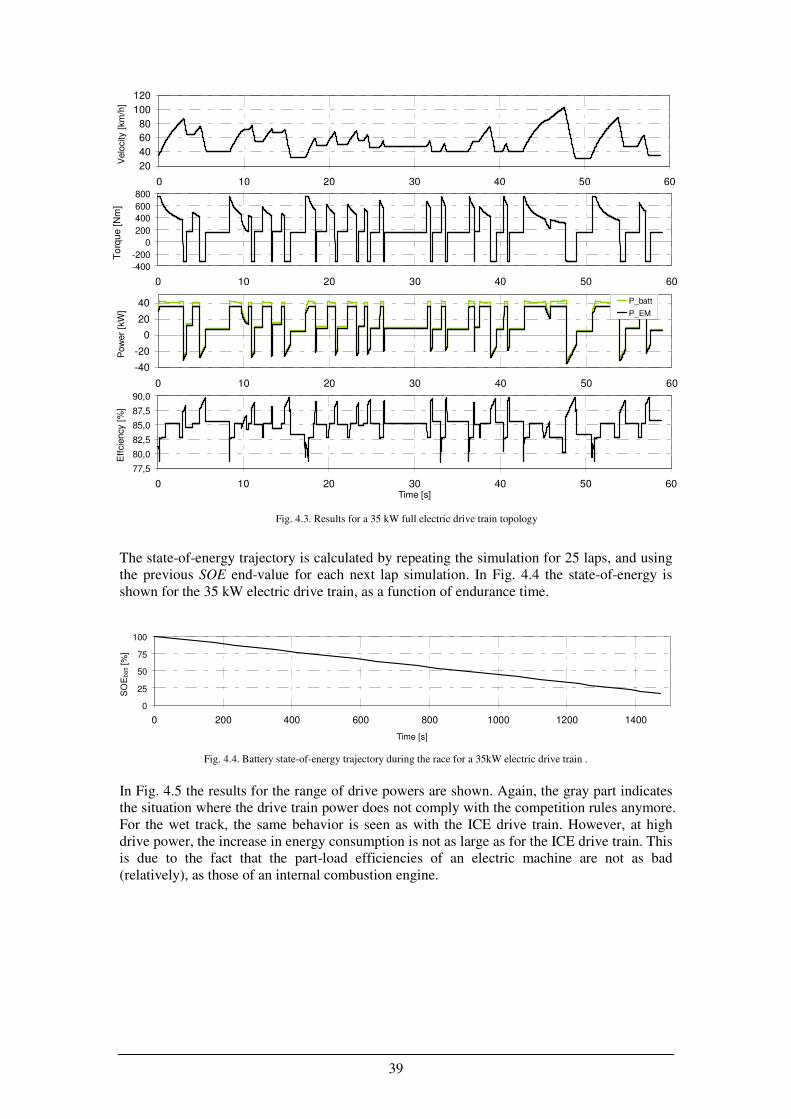
39
The state-of-energy trajectory is calculated by repeating the simulation for 25 laps, and using
the previous SOE end-value for each next lap simulation. In Fig. 4.4 the state-of-energy is
shown for the 35 kW electric drive train, as a function of endurance time.
In Fig. 4.5 the results for the range of drive powers are shown. Again, the gray part indicates
the situation where the drive train power does not comply with the competition rules anymore.
For the wet track, the same behavior is seen as with the ICE drive train. However, at high
drive power, the increase in energy consumption is not as large as for the ICE drive train. This
is due to the fact that the part-load efficiencies of an electric machine are not as bad
(relatively), as those of an internal combustion engine.
0
25
50
75
100
0 200 400 600 800 1000 1200 1400
Time [s]
SO
Eb
att
[%]
20
40
60
80
100
120
0 10 20 30 40 50 60
Velo
city
[km
/h]
-400
-200
0
200
400
600
800
0 10 20 30 40 50 60
To
rqu
e [
Nm
]
-40
-20
0
20
40
0 10 20 30 40 50 60
Pow
er
[kW
]
P_batt
P_EM
77,5
80,0
82,5
85,0
87,5
90,0
0 10 20 30 40 50 60Time [s]
Eff
cie
ncy [
%]
Fig. 4.4. Battery state-of-energy trajectory during the race for a 35kW electric drive train .
Fig. 4.3. Results for a 35 kW full electric drive train topology
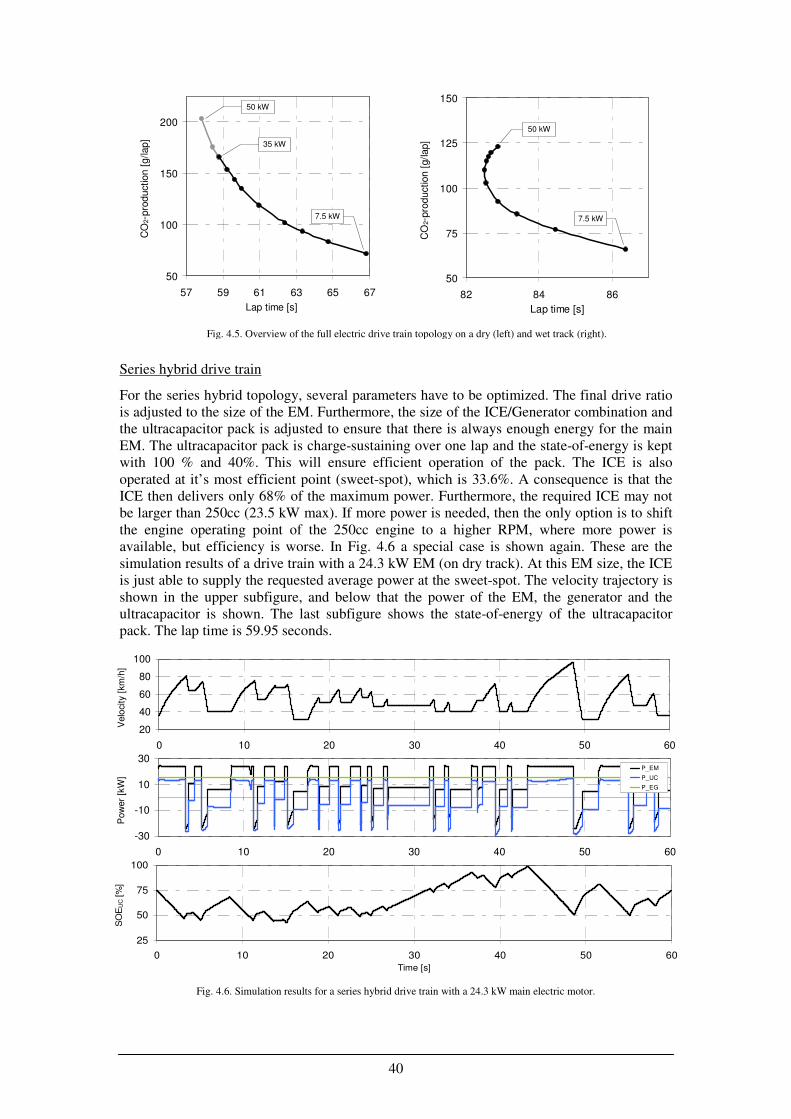
40
Series hybrid drive train
For the series hybrid topology, several parameters have to be optimized. The final drive ratio
is adjusted to the size of the EM. Furthermore, the size of the ICE/Generator combination and
the ultracapacitor pack is adjusted to ensure that there is always enough energy for the main
EM. The ultracapacitor pack is charge-sustaining over one lap and the state-of-energy is kept
with 100 % and 40%. This will ensure efficient operation of the pack. The ICE is also
operated at it’s most efficient point (sweet-spot), which is 33.6%. A consequence is that the
ICE then delivers only 68% of the maximum power. Furthermore, the required ICE may not
be larger than 250cc (23.5 kW max). If more power is needed, then the only option is to shift
the engine operating point of the 250cc engine to a higher RPM, where more power is
available, but efficiency is worse. In Fig. 4.6 a special case is shown again. These are the
simulation results of a drive train with a 24.3 kW EM (on dry track). At this EM size, the ICE
is just able to supply the requested average power at the sweet-spot. The velocity trajectory is
shown in the upper subfigure, and below that the power of the EM, the generator and the
ultracapacitor is shown. The last subfigure shows the state-of-energy of the ultracapacitor
pack. The lap time is 59.95 seconds.
20
40
60
80
100
0 10 20 30 40 50 60
Velo
city
[km
/h]
-30
-10
10
30
0 10 20 30 40 50 60
Pow
er
[kW
]
P_EM
P_UC
P_EG
25
50
75
100
0 10 20 30 40 50 60
Time [s]
SO
EU
C [%
]
Fig. 4.6. Simulation results for a series hybrid drive train with a 24.3 kW main electric motor.
50
100
150
200
57 59 61 63 65 67
Lap time [s]
CO
2-p
rod
uction [
g/lap]
.
50
75
100
125
150
82 84 86
Lap time [s]
CO
2-p
rod
uction [
g/lap]
.
7.5 kW
35 kW
50 kW
50 kW
7.5 kW
Fig. 4.5. Overview of the full electric drive train topology on a dry (left) and wet track (right).
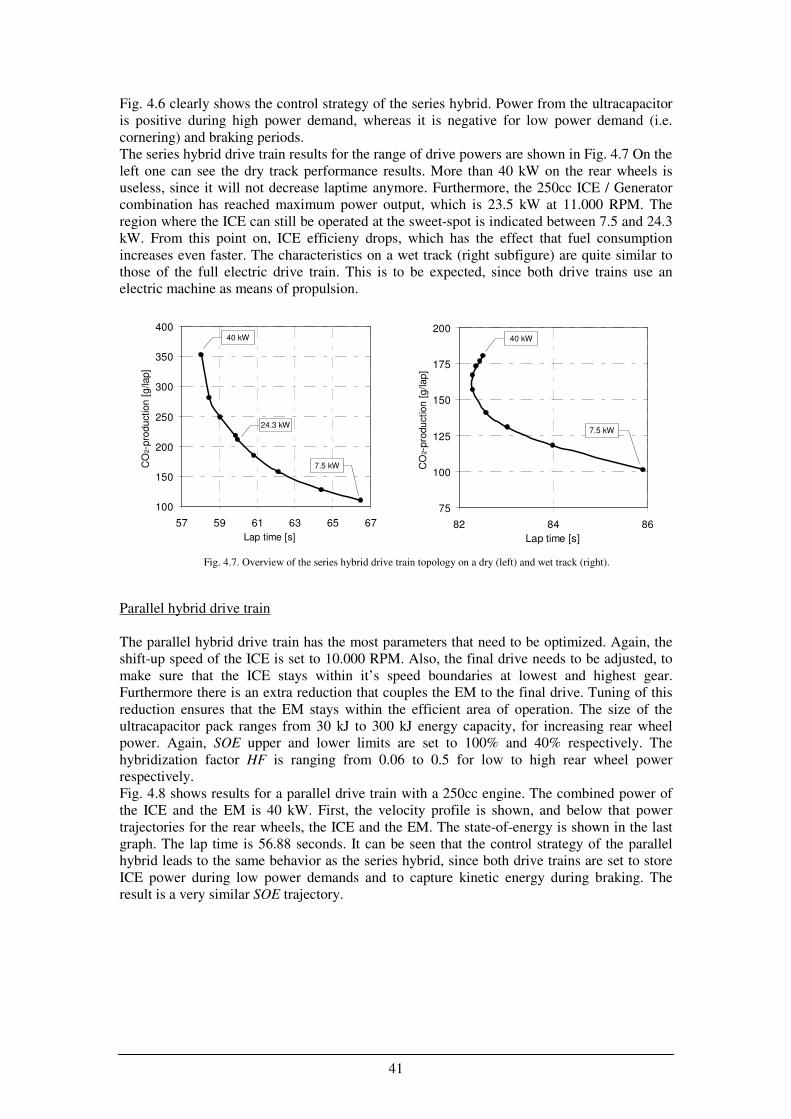
41
Fig. 4.6 clearly shows the control strategy of the series hybrid. Power from the ultracapacitor
is positive during high power demand, whereas it is negative for low power demand (i.e.
cornering) and braking periods.
The series hybrid drive train results for the range of drive powers are shown in Fig. 4.7 On the
left one can see the dry track performance results. More than 40 kW on the rear wheels is
useless, since it will not decrease laptime anymore. Furthermore, the 250cc ICE / Generator
combination has reached maximum power output, which is 23.5 kW at 11.000 RPM. The
region where the ICE can still be operated at the sweet-spot is indicated between 7.5 and 24.3
kW. From this point on, ICE efficieny drops, which has the effect that fuel consumption
increases even faster. The characteristics on a wet track (right subfigure) are quite similar to
those of the full electric drive train. This is to be expected, since both drive trains use an
electric machine as means of propulsion.
Parallel hybrid drive train
The parallel hybrid drive train has the most parameters that need to be optimized. Again, the
shift-up speed of the ICE is set to 10.000 RPM. Also, the final drive needs to be adjusted, to
make sure that the ICE stays within it’s speed boundaries at lowest and highest gear.
Furthermore there is an extra reduction that couples the EM to the final drive. Tuning of this
reduction ensures that the EM stays within the efficient area of operation. The size of the
ultracapacitor pack ranges from 30 kJ to 300 kJ energy capacity, for increasing rear wheel
power. Again, SOE upper and lower limits are set to 100% and 40% respectively. The
hybridization factor HF is ranging from 0.06 to 0.5 for low to high rear wheel power
respectively.
Fig. 4.8 shows results for a parallel drive train with a 250cc engine. The combined power of
the ICE and the EM is 40 kW. First, the velocity profile is shown, and below that power
trajectories for the rear wheels, the ICE and the EM. The state-of-energy is shown in the last
graph. The lap time is 56.88 seconds. It can be seen that the control strategy of the parallel
hybrid leads to the same behavior as the series hybrid, since both drive trains are set to store
ICE power during low power demands and to capture kinetic energy during braking. The
result is a very similar SOE trajectory.
100
150
200
250
300
350
400
57 59 61 63 65 67
Lap time [s]
CO
2-p
rodu
ction
[g
/lap]
.
7.5 kW
40 kW
24.3 kW
75
100
125
150
175
200
82 84 86
Lap time [s]
CO
2-p
rodu
ction
[g
/lap
]
.7.5 kW
40 kW
Fig. 4.7. Overview of the series hybrid drive train topology on a dry (left) and wet track (right).
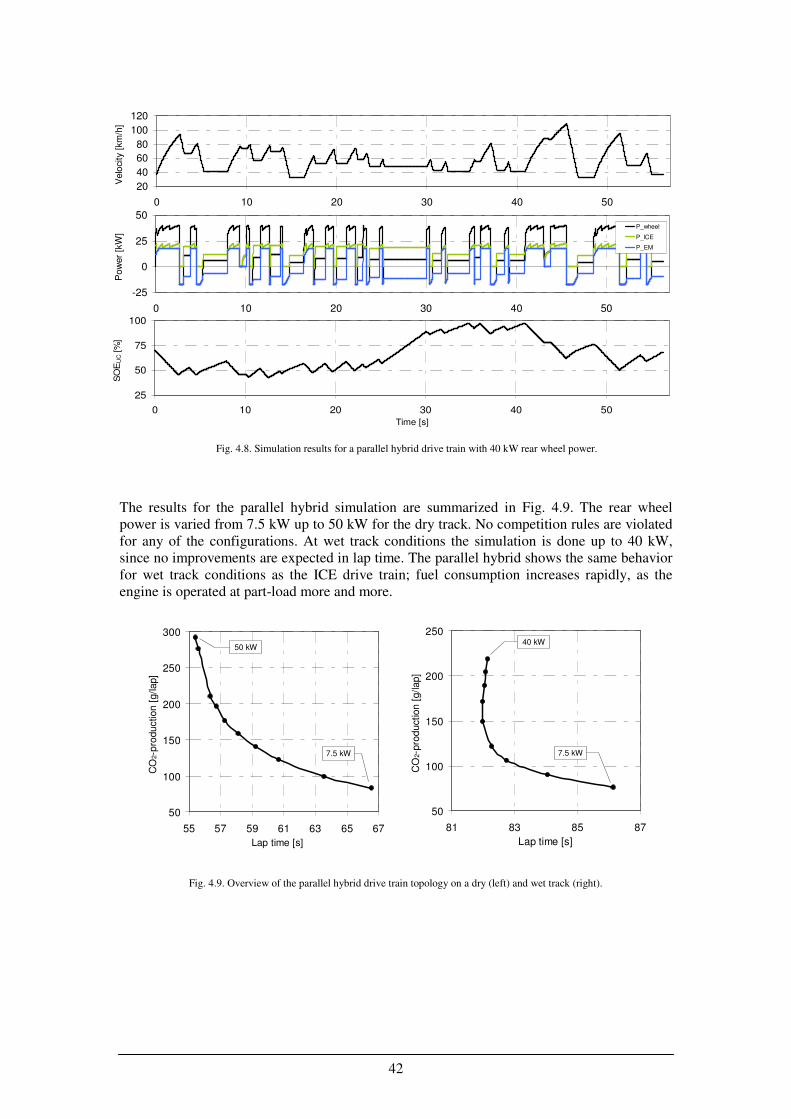
42
The results for the parallel hybrid simulation are summarized in Fig. 4.9. The rear wheel
power is varied from 7.5 kW up to 50 kW for the dry track. No competition rules are violated
for any of the configurations. At wet track conditions the simulation is done up to 40 kW,
since no improvements are expected in lap time. The parallel hybrid shows the same behavior
for wet track conditions as the ICE drive train; fuel consumption increases rapidly, as the
engine is operated at part-load more and more.
20
40
60
80
100
120
0 10 20 30 40 50
Velo
city
[km
/h]
-25
0
25
50
0 10 20 30 40 50
Pow
er
[kW
]
P_wheel
P_ICE
P_EM
25
50
75
100
0 10 20 30 40 50Time [s]
SO
EU
C [%
]
Fig. 4.8. Simulation results for a parallel hybrid drive train with 40 kW rear wheel power.
50
100
150
200
250
300
55 57 59 61 63 65 67
Lap time [s]
CO
2-p
roduction
[g/lap]
.
7.5 kW
50 kW
50
100
150
200
250
81 83 85 87
Lap time [s]
CO
2-p
rod
uction [
g/lap]
.
40 kW
7.5 kW
Fig. 4.9. Overview of the parallel hybrid drive train topology on a dry (left) and wet track (right).
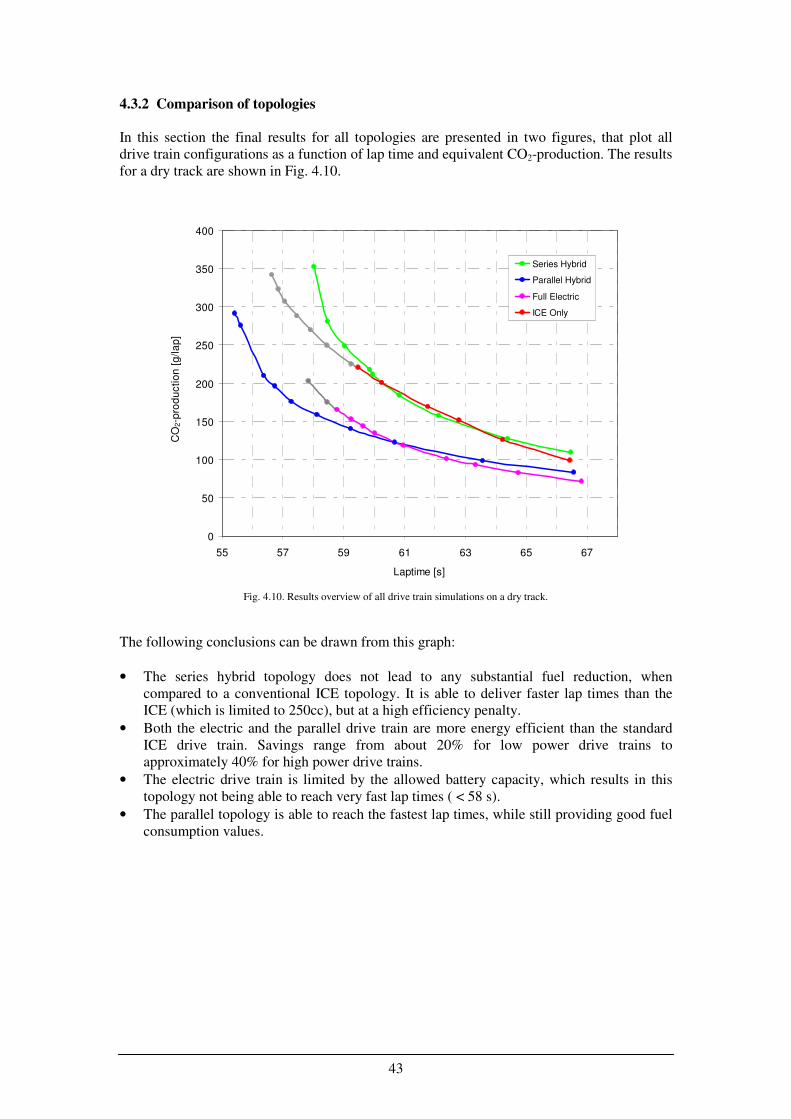
43
4.3.2 Comparison of topologies
In this section the final results for all topologies are presented in two figures, that plot all
drive train configurations as a function of lap time and equivalent CO2-production. The results
for a dry track are shown in Fig. 4.10.
The following conclusions can be drawn from this graph:
• The series hybrid topology does not lead to any substantial fuel reduction, when
compared to a conventional ICE topology. It is able to deliver faster lap times than the
ICE (which is limited to 250cc), but at a high efficiency penalty.
• Both the electric and the parallel drive train are more energy efficient than the standard
ICE drive train. Savings range from about 20% for low power drive trains to
approximately 40% for high power drive trains.
• The electric drive train is limited by the allowed battery capacity, which results in this
topology not being able to reach very fast lap times ( < 58 s).
• The parallel topology is able to reach the fastest lap times, while still providing good fuel
consumption values.
Fig. 4.10. Results overview of all drive train simulations on a dry track.
0
50
100
150
200
250
300
350
400
55 57 59 61 63 65 67
Laptime [s]
CO
2-p
rod
uctio
n [
g/la
p]
.
Series Hybrid
Parallel Hybrid
Full Electric
ICE Only
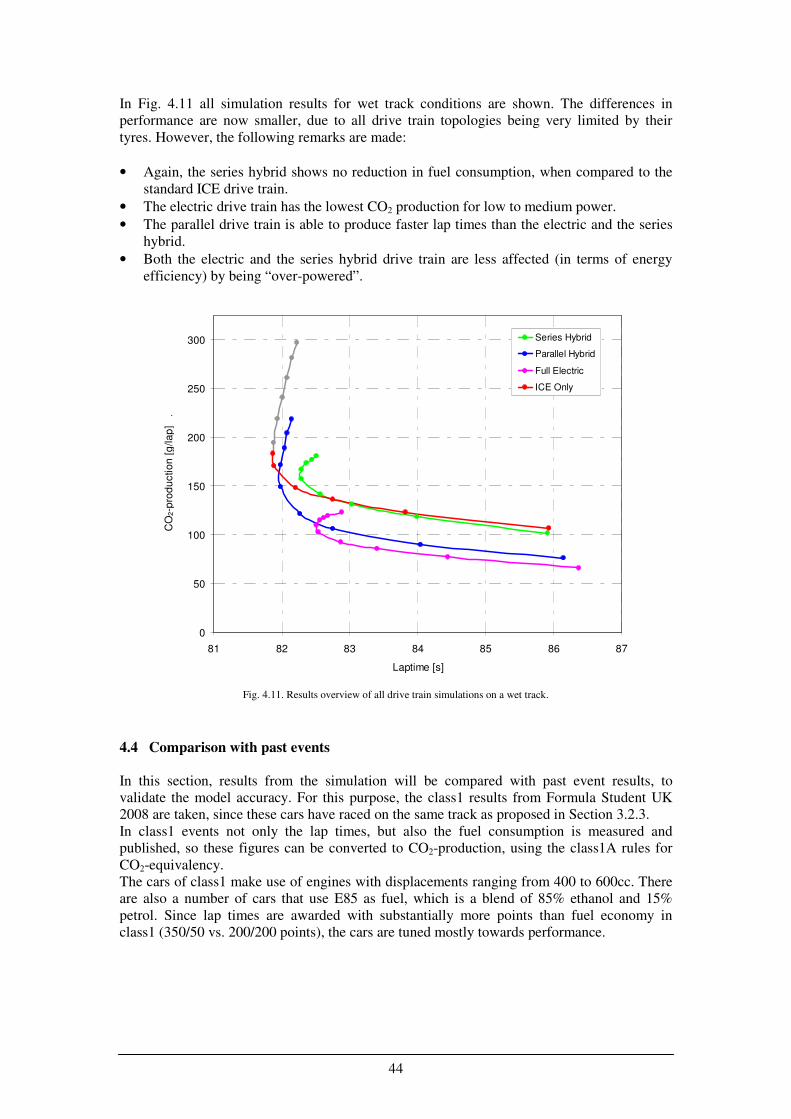
44
In Fig. 4.11 all simulation results for wet track conditions are shown. The differences in
performance are now smaller, due to all drive train topologies being very limited by their
tyres. However, the following remarks are made:
• Again, the series hybrid shows no reduction in fuel consumption, when compared to the
standard ICE drive train.
• The electric drive train has the lowest CO2 production for low to medium power.
• The parallel drive train is able to produce faster lap times than the electric and the series
hybrid.
• Both the electric and the series hybrid drive train are less affected (in terms of energy
efficiency) by being “over-powered”.
4.4 Comparison with past events
In this section, results from the simulation will be compared with past event results, to
validate the model accuracy. For this purpose, the class1 results from Formula Student UK
2008 are taken, since these cars have raced on the same track as proposed in Section 3.2.3.
In class1 events not only the lap times, but also the fuel consumption is measured and
published, so these figures can be converted to CO2-production, using the class1A rules for
CO2-equivalency.
The cars of class1 make use of engines with displacements ranging from 400 to 600cc. There
are also a number of cars that use E85 as fuel, which is a blend of 85% ethanol and 15%
petrol. Since lap times are awarded with substantially more points than fuel economy in
class1 (350/50 vs. 200/200 points), the cars are tuned mostly towards performance.
0
50
100
150
200
250
300
81 82 83 84 85 86 87
Laptime [s]
CO
2-p
rod
uctio
n [
g/la
p]
.
Series Hybrid
Parallel Hybrid
Full Electric
ICE Only
Fig. 4.11. Results overview of all drive train simulations on a wet track.
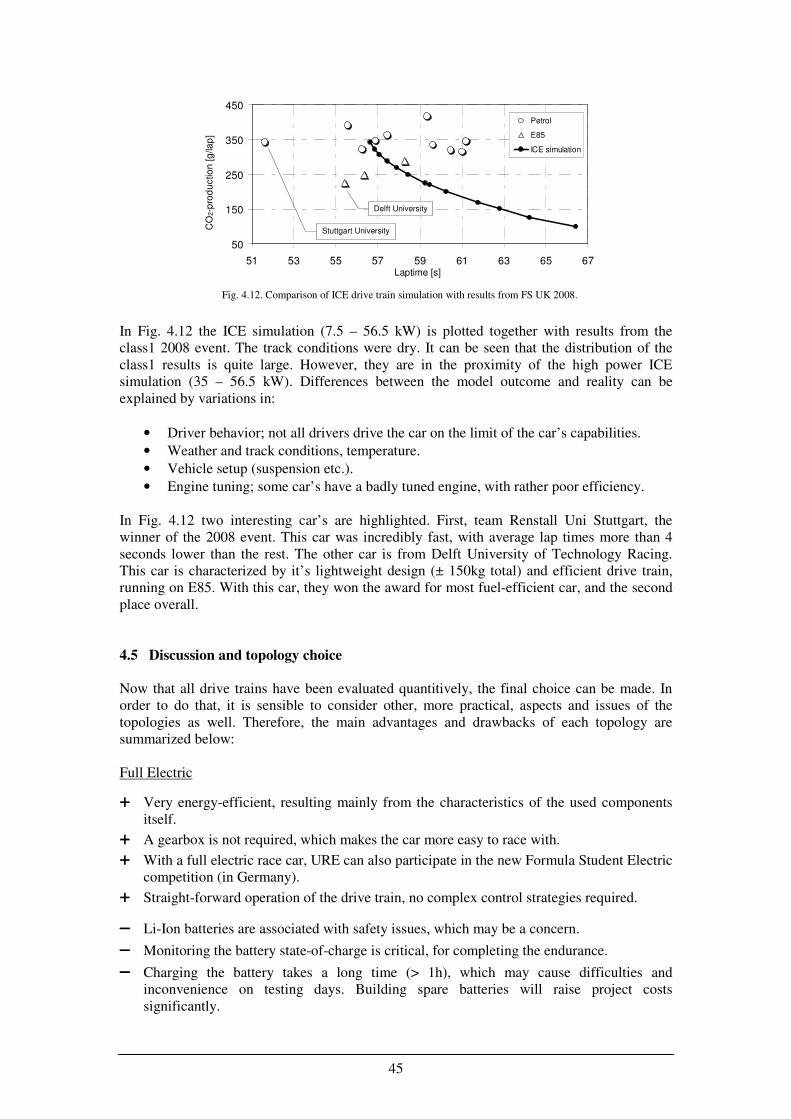
45
In Fig. 4.12 the ICE simulation (7.5 – 56.5 kW) is plotted together with results from the
class1 2008 event. The track conditions were dry. It can be seen that the distribution of the
class1 results is quite large. However, they are in the proximity of the high power ICE
simulation (35 – 56.5 kW). Differences between the model outcome and reality can be
explained by variations in:
• Driver behavior; not all drivers drive the car on the limit of the car’s capabilities.
• Weather and track conditions, temperature.
• Vehicle setup (suspension etc.).
• Engine tuning; some car’s have a badly tuned engine, with rather poor efficiency.
In Fig. 4.12 two interesting car’s are highlighted. First, team Renstall Uni Stuttgart, the
winner of the 2008 event. This car was incredibly fast, with average lap times more than 4
seconds lower than the rest. The other car is from Delft University of Technology Racing.
This car is characterized by it’s lightweight design (± 150kg total) and efficient drive train,
running on E85. With this car, they won the award for most fuel-efficient car, and the second
place overall.
4.5 Discussion and topology choice
Now that all drive trains have been evaluated quantitively, the final choice can be made. In
order to do that, it is sensible to consider other, more practical, aspects and issues of the
topologies as well. Therefore, the main advantages and drawbacks of each topology are
summarized below:
Full Electric
+ Very energy-efficient, resulting mainly from the characteristics of the used components
itself.
+ A gearbox is not required, which makes the car more easy to race with.
+ With a full electric race car, URE can also participate in the new Formula Student Electric
competition (in Germany).
+ Straight-forward operation of the drive train, no complex control strategies required.
−−−− Li-Ion batteries are associated with safety issues, which may be a concern.
−−−− Monitoring the battery state-of-charge is critical, for completing the endurance.
−−−− Charging the battery takes a long time (> 1h), which may cause difficulties and
inconvenience on testing days. Building spare batteries will raise project costs
significantly.
50
150
250
350
450
51 53 55 57 59 61 63 65 67Laptime [s]
CO
2-p
rod
uctio
n [g
/lap
] .
Petrol
E85
ICE simulation
Stuttgart University
Delft University
Fig. 4.12. Comparison of ICE drive train simulation with results from FS UK 2008.
46
Series hybrid
+ The control strategy is less complex to implement than the parallel hybrid strategy.
+ A series hybrid has a larger EM than a parallel hybrid with the same total power, which
results in an increased potential of regenerative braking.
−−−− Hybrids are essentially more complex systems to be developed by a FSAE team, than a
full electric drive train. This is due to the fact that there are two completely different
systems that need to function correctly, and moreover need to interact with each other.
−−−− Energy in a series hybrid is converted from mechanical to electrical, and back to
mechanical again. This is a fundamental drawback of the series hybrid topology. It is also
considered as the main reason why this topology does not offer a fuel reduction in the
simulation results.
−−−− The selected ICE needs to be examined and tuned thoroughly, in order to operate at the
efficient sweet-spot.
−−−− A series hybrid has two EM’s which increases weight and cost.
Parallel hybrid
+ The parallel hybrid is an efficient and fast option.
+ If the high voltage electrical system fails, the parallel hybrid is still able to continue the
endurance, by driving solely on the engine.
+ The parallel topology is, given a certain total power output, very likely to be the most
low-cost option.
−−−− See first drawback of series hybrid.
−−−− The potential of regenerative braking may be reduced by the size of the EM and the
additional friction losses of the engine (when not decoupled).
−−−− The control strategy is difficult to realize, since both propulsion systems are coupled to
the wheels. Charging and boosting may prove to be disturbing to the driver, if not
controlled properly. In this respect, producing electrical energy is more difficult than with
the series hybrid.
Taking all advantages and drawbacks into consideration, the final choice is made by the
complete team of URE (including previous board members). The drive train topology that
will be used for the 2010 race car, is Full Electric.
The following facts have been decisive for this choice:
• The option to participate in more than one race.
• The class1A competition in 2009 has been won by a race car with a full electric drive
train, proving the capabilities of this concept.
• The full electric drive train is a futuristic system, that is gaining a lot of interest. Much
publicity is to be expected, which is in favour of sponsorships, a critical factor for a race
team.

47
Part II
Vehicle design
48
Chapter 5
Vehicle specification
5.1 Introduction
In part I of this report, a full electric drive train is selected for the URE race car of 2010. In
this chapter an overview of the vehicle requirements is given, which is mainly dictated by the
competition rules and the intended purpose of the vehicle.
The car will be fielded in two competitions - class1A in the UK and at Formula Student
Electric - which complicates things. There are differences in the event rules, so it needs to be
taken into account that the car has to comply with both sets of rules.
After stating the requirements in Section 5.2, the model of part I is used to formulate a
preliminary vehicle specification, by providing key values for the the intended vehicle design
in Section 5.3. Furthermore, electric drive trains offer the possibility of incorporating some
innovative techniques that can be beneficial to racing. These are discussed in Section 5.4.
Since the new car will be an electric conversion of the URE05, it is consequently called the
“URE05e”.
5.2 Competition rules and requirements
First of all the most important vehicle design objectives, stated by the competition rules, are:
• The vehicle should adopt alternative powertrain technologies such that it is high
performance, whilst the amount of energy it consumes is as low as feasibly possible and
the CO2 and energy embedded in the vehicle is minimized.
• The vehicle should have high performance in terms of acceleration, braking and handling
and be sufficiently durable to successfully complete all the events described in the FSAE
rules.
• Additional design factors to be considered include: aesthetics, cost, ergonomics,
reliability, maintainability, manufacturability and recyclability.
The most important system constraints and mandatory / allowed features are:
1) Maximum allowed electrical power is 75 kW.
2) Maximum allowed voltage of the High Voltage system (HV) is 400 Volt DC or AC rms.
3) Maximum allowed battery capacity is 7.25 kWh (at 80% depth-of-discharge).
4) The chassis must fulfil at least the 2007 FSAE Rules.
5) All power train system components must lie within the surface defined by the top of the
roll bar and the outside edge of the four tires.
6) HV systems and HV wiring must be contained within the primary structure of the frame
and when located less than 350mm from the ground must be protected from side or rear
impacts.
7) Charging is allowed in the car.
8) An extensive safety system must be present and consist of at least the following:
a. Floating HV system (HV completely isolated from the car).
b. Battery contactor relays that disconnect the battery in case of any error.
c. Ground fault detector (GFD)
d. Battery management system (BMS)
Ch.6
Ch.7
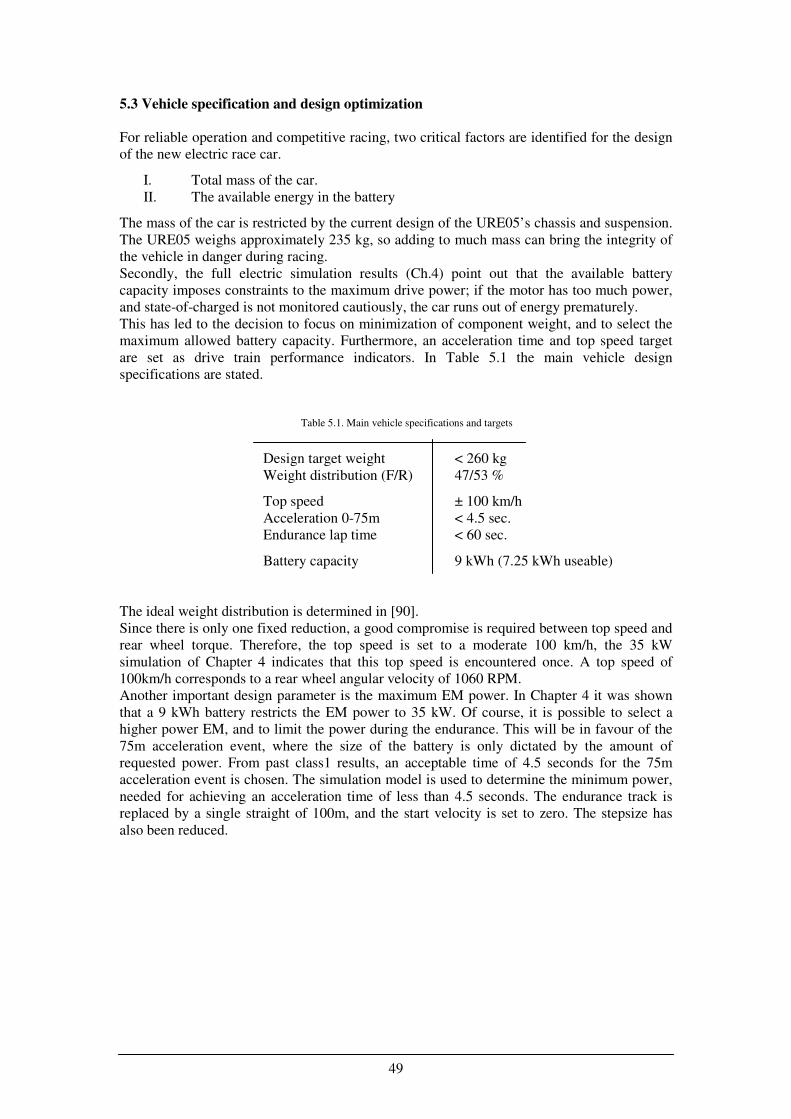
49
5.3 Vehicle specification and design optimization
For reliable operation and competitive racing, two critical factors are identified for the design
of the new electric race car.
I. Total mass of the car.
II. The available energy in the battery
The mass of the car is restricted by the current design of the URE05’s chassis and suspension.
The URE05 weighs approximately 235 kg, so adding to much mass can bring the integrity of
the vehicle in danger during racing.
Secondly, the full electric simulation results (Ch.4) point out that the available battery
capacity imposes constraints to the maximum drive power; if the motor has too much power,
and state-of-charged is not monitored cautiously, the car runs out of energy prematurely.
This has led to the decision to focus on minimization of component weight, and to select the
maximum allowed battery capacity. Furthermore, an acceleration time and top speed target
are set as drive train performance indicators. In Table 5.1 the main vehicle design
specifications are stated.
Design target weight < 260 kg
Weight distribution (F/R) 47/53 %
Top speed ± 100 km/h
Acceleration 0-75m < 4.5 sec.
Endurance lap time < 60 sec.
Battery capacity 9 kWh (7.25 kWh useable)
The ideal weight distribution is determined in [90].
Since there is only one fixed reduction, a good compromise is required between top speed and
rear wheel torque. Therefore, the top speed is set to a moderate 100 km/h, the 35 kW
simulation of Chapter 4 indicates that this top speed is encountered once. A top speed of
100km/h corresponds to a rear wheel angular velocity of 1060 RPM.
Another important design parameter is the maximum EM power. In Chapter 4 it was shown
that a 9 kWh battery restricts the EM power to 35 kW. Of course, it is possible to select a
higher power EM, and to limit the power during the endurance. This will be in favour of the
75m acceleration event, where the size of the battery is only dictated by the amount of
requested power. From past class1 results, an acceptable time of 4.5 seconds for the 75m
acceleration event is chosen. The simulation model is used to determine the minimum power,
needed for achieving an acceleration time of less than 4.5 seconds. The endurance track is
replaced by a single straight of 100m, and the start velocity is set to zero. The stepsize has
also been reduced.
Table 5.1. Main vehicle specifications and targets
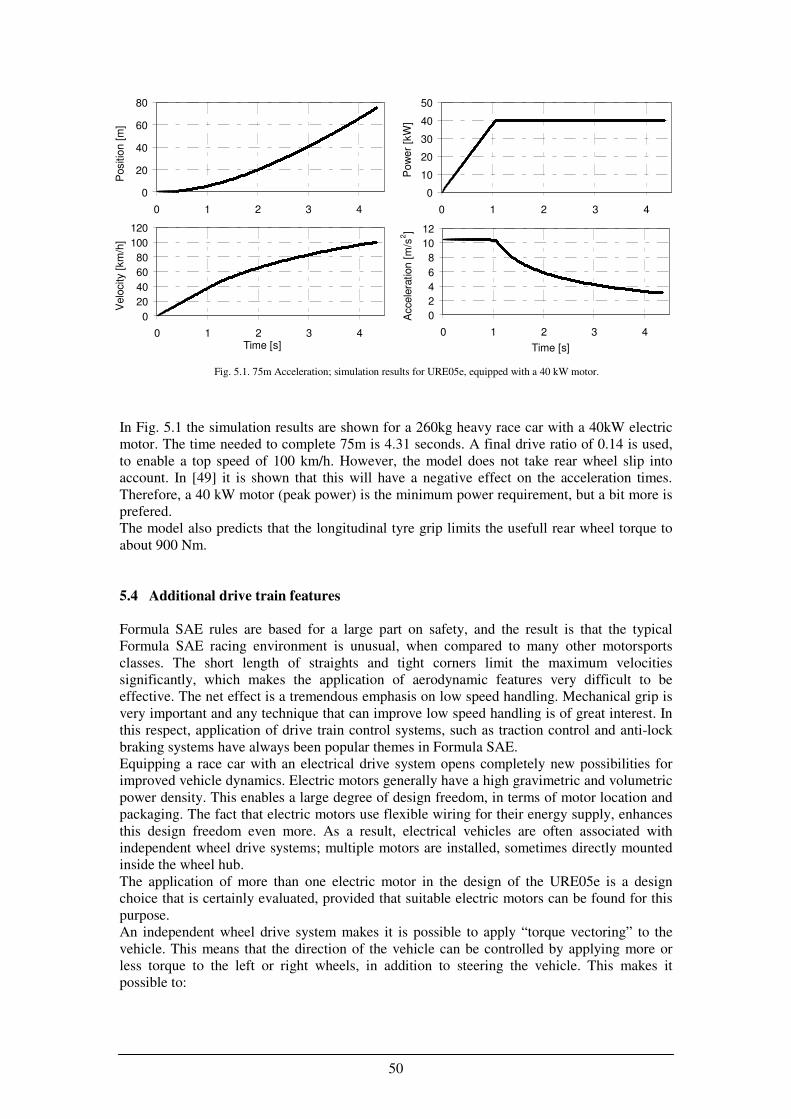
50
In Fig. 5.1 the simulation results are shown for a 260kg heavy race car with a 40kW electric
motor. The time needed to complete 75m is 4.31 seconds. A final drive ratio of 0.14 is used,
to enable a top speed of 100 km/h. However, the model does not take rear wheel slip into
account. In [49] it is shown that this will have a negative effect on the acceleration times.
Therefore, a 40 kW motor (peak power) is the minimum power requirement, but a bit more is
prefered.
The model also predicts that the longitudinal tyre grip limits the usefull rear wheel torque to
about 900 Nm.
5.4 Additional drive train features
Formula SAE rules are based for a large part on safety, and the result is that the typical
Formula SAE racing environment is unusual, when compared to many other motorsports
classes. The short length of straights and tight corners limit the maximum velocities
significantly, which makes the application of aerodynamic features very difficult to be
effective. The net effect is a tremendous emphasis on low speed handling. Mechanical grip is
very important and any technique that can improve low speed handling is of great interest. In
this respect, application of drive train control systems, such as traction control and anti-lock
braking systems have always been popular themes in Formula SAE.
Equipping a race car with an electrical drive system opens completely new possibilities for
improved vehicle dynamics. Electric motors generally have a high gravimetric and volumetric
power density. This enables a large degree of design freedom, in terms of motor location and
packaging. The fact that electric motors use flexible wiring for their energy supply, enhances
this design freedom even more. As a result, electrical vehicles are often associated with
independent wheel drive systems; multiple motors are installed, sometimes directly mounted
inside the wheel hub.
The application of more than one electric motor in the design of the URE05e is a design
choice that is certainly evaluated, provided that suitable electric motors can be found for this
purpose.
An independent wheel drive system makes it is possible to apply “torque vectoring” to the
vehicle. This means that the direction of the vehicle can be controlled by applying more or
less torque to the left or right wheels, in addition to steering the vehicle. This makes it
possible to:
0
20
40
60
80
0 1 2 3 4
Positio
n [
m]
0
10
20
30
40
50
0 1 2 3 4
Pow
er
[kW
]
0
20
40
60
80
100
120
0 1 2 3 4Time [s]
Velo
city [
km
/h]
0
2
4
6
8
10
12
0 1 2 3 4
Time [s]
Accele
ration [
m/s
2]
Fig. 5.1. 75m Acceleration; simulation results for URE05e, equipped with a 40 kW motor.
51
• improve vehicle stability (by counteracting over- and understeer)
• allow for higher manueverability (especially at low speeds)
• enable higher levels of combined grip, by exploiting the full grip potential of each
individual tyre. This is beneficial to corner entry and exit situations.
A downside of such a system is that it needs additional motor controllers, as well as a
supervisory controller that determines the set points for each motor controller. Furthermore,
smaller motors usually have a slightly worse efficiency than a large one. The increased weight
due to having more controllers and wiring is partially offset by the fact that a mechanical
differential is not needed anymore.
If a drive system with multiple motors is selected, the supervisory controller can also be
programmed to incorporate:
• launch control
• torque vectoring using both positive and negative torques.
For the URE05 the most viable solution for torque vectoring is to apply two motors; one at
each rear wheel. In order to keep the unsprung mass as low as possible, it is best to mount the
motors inside the rear frame, and to couple them via conventional drive shafts to the wheels.
Additional front wheel drives are assumed to be too drastic for the URE05 conversion; it
would require extensive modifications to the carbon fibre monocoque and involves even more
control complexity, which is not preferable at this moment. All-Wheel-Drive (AWD) is
however a very interesting option for future electric race cars of University Racing Eindhoven.
For more information about torque vectoring in (hybrid) electric vehicles, the reader is refered
to [86,87]. Applications in motorsports applications can be found in [88,89], although these
systems make use of mechanical differentials to realize torque vectoring.
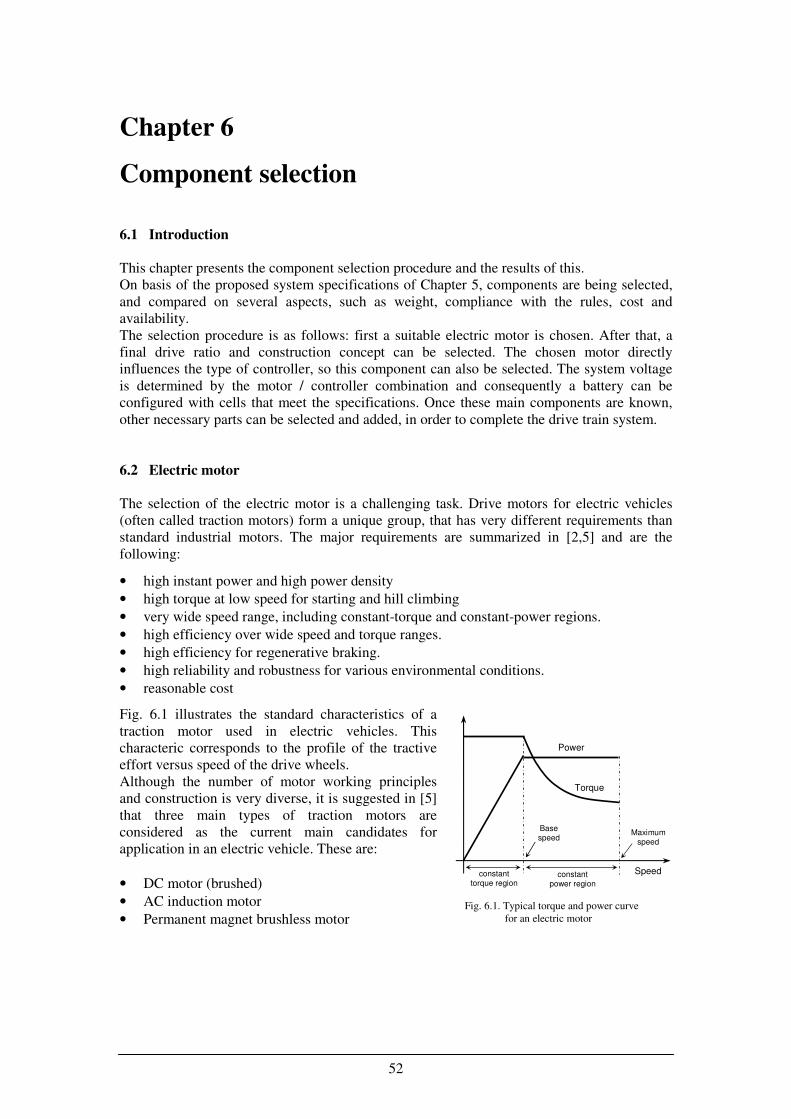
52
Chapter 6
Component selection
6.1 Introduction
This chapter presents the component selection procedure and the results of this.
On basis of the proposed system specifications of Chapter 5, components are being selected,
and compared on several aspects, such as weight, compliance with the rules, cost and
availability.
The selection procedure is as follows: first a suitable electric motor is chosen. After that, a
final drive ratio and construction concept can be selected. The chosen motor directly
influences the type of controller, so this component can also be selected. The system voltage
is determined by the motor / controller combination and consequently a battery can be
configured with cells that meet the specifications. Once these main components are known,
other necessary parts can be selected and added, in order to complete the drive train system.
6.2 Electric motor
The selection of the electric motor is a challenging task. Drive motors for electric vehicles
(often called traction motors) form a unique group, that has very different requirements than
standard industrial motors. The major requirements are summarized in [2,5] and are the
following:
• high instant power and high power density
• high torque at low speed for starting and hill climbing
• very wide speed range, including constant-torque and constant-power regions.
• high efficiency over wide speed and torque ranges.
• high efficiency for regenerative braking.
• high reliability and robustness for various environmental conditions.
• reasonable cost
Fig. 6.1 illustrates the standard characteristics of a
traction motor used in electric vehicles. This
characteric corresponds to the profile of the tractive
effort versus speed of the drive wheels.
Although the number of motor working principles
and construction is very diverse, it is suggested in [5]
that three main types of traction motors are
considered as the current main candidates for
application in an electric vehicle. These are:
• DC motor (brushed)
• AC induction motor
• Permanent magnet brushless motor
Power
Torque
Speed
Base speed
Maximum speed
constant power region
constant torque region
Fig. 6.1. Typical torque and power curve
for an electric motor
53
DC motors
DC motors is a term that refers to the group of motors, where the rotor windings are supplied
of electricity by a mechanical commutator. The commutator makes use of sliding brushes,
that need maintenance. Due to the presense of the mechanical commutator, these motors
usually have a limited voltage and speed range. DC motors use simple power electronics,
when compared to the other two motor types. Moreover, the technology is mature and well
available at low cost. DC motors that have windings on both the stator and the rotor are
catagorized as series and shunt DC motors. Another group is the PMDC motors, where the
stator windings are replaced by permanent magnets (PM). PMDC’s are characterized by a
higher power density and are mainly available in small to medium motor sizes (< 30 kW).
AC induction motors
This type of motor is widely accepted as one of the most potential candidates for electric
vehicles. It does not make use of a mechanical commutator, instead it supplies the rotor with
power by means of electromagentic induction. Induction motors are often used for industrial
motors, but have been obsolete in electric vehicles in the past, due to a number of drawbacks,
such as a relatively bad starting torque. With the advancement of semi-conductor electronics,
many obstacles for induction motor application in EV’s have been solved. However, the
control electronics are still expensive and therefore this motor type is mainly available in
medium and large sizes. (> 30 kW).
Permanent magnet brushless motors
By virtually inverting the stator and rotor of the PMDC motor, the brushless permanent
magnet motor is created. The stator windings are fed by a rectangular AC waveform. The
main advantages of this machine are the high power density and efficiency, as well as very
low levels of maintenance. Also, generated heat can easily be removed from the stator, which
is in favor of a high continuous power density. Drawbacks are a relatively high cost for the
electronics and the motor itself. Also, the technology is quite new and still in developement.
More information about motor types and how they work can be found in [3,78,83].
For the selection of the URE05 electric motor, the following requirements are set:
1. The power density must be as high as possible, to meet the 260kg vehicle mass target.
2. High zero-speed torque for good starting acceleration.
3. The maximum motor speed is preferably lower than 6000 RPM, which makes it possible
to use a single stage chain reduction (low weight and high efficiency)
4. Liquid cooling generally adds extra weight and increases complexity. This is not
preferable.
5. The cost of the motor and power electronics must fit in the team budget.
Due to the fact that the motor will be used in a racing application, the following aspects are
considered less important:
1. Maintenance. The service life of the URE05e is significantly less than for a passenger
vehicle.
2. Motor noise and torque smoothness.
A comprehensive overview has been made of available traction motors, in the range of 10 to
80 kW. Table 6.1 shows the motors and their respective performance figures.
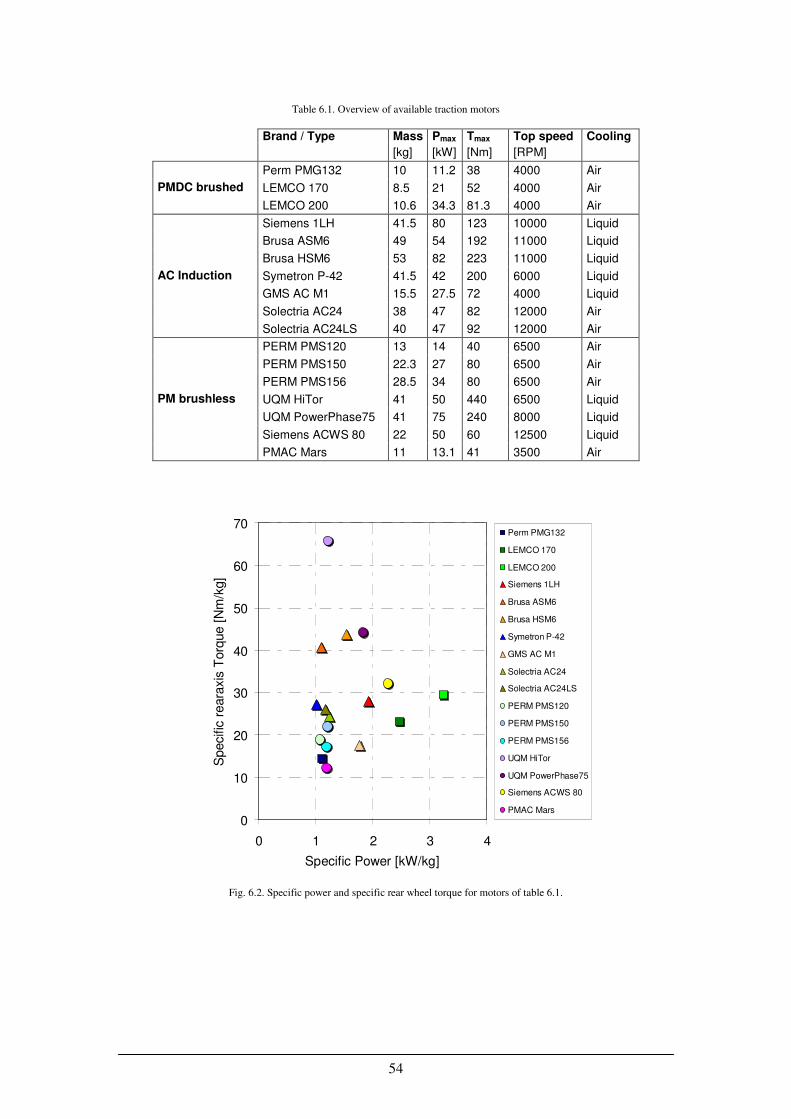
54
Brand / Type Mass Pmax Tmax Top speed Cooling
[kg] [kW] [Nm] [RPM]
Perm PMG132 10 11.2 38 4000 Air
LEMCO 170 8.5 21 52 4000 Air PMDC brushed
LEMCO 200 10.6 34.3 81.3 4000 Air
Siemens 1LH 41.5 80 123 10000 Liquid
Brusa ASM6 49 54 192 11000 Liquid
Brusa HSM6 53 82 223 11000 Liquid
Symetron P-42 41.5 42 200 6000 Liquid
GMS AC M1 15.5 27.5 72 4000 Liquid
Solectria AC24 38 47 82 12000 Air
AC Induction
Solectria AC24LS 40 47 92 12000 Air
PERM PMS120 13 14 40 6500 Air
PERM PMS150 22.3 27 80 6500 Air
PERM PMS156 28.5 34 80 6500 Air
UQM HiTor 41 50 440 6500 Liquid
UQM PowerPhase75 41 75 240 8000 Liquid
Siemens ACWS 80 22 50 60 12500 Liquid
PM brushless
PMAC Mars 11 13.1 41 3500 Air
Table 6.1. Overview of available traction motors
0
10
20
30
40
50
60
70
0 1 2 3 4
Specific Power [kW/kg]
Specific
reara
xis
Torq
ue [
Nm
/kg]
Perm PMG132
LEMCO 170
LEMCO 200
Siemens 1LH
Brusa ASM6
Brusa HSM6
Symetron P-42
GMS AC M1
Solectria AC24
Solectria AC24LS
PERM PMS120
PERM PMS150
PERM PMS156
UQM HiTor
UQM PowerPhase75
Siemens ACWS 80
PMAC Mars
Fig. 6.2. Specific power and specific rear wheel torque for motors of table 6.1.
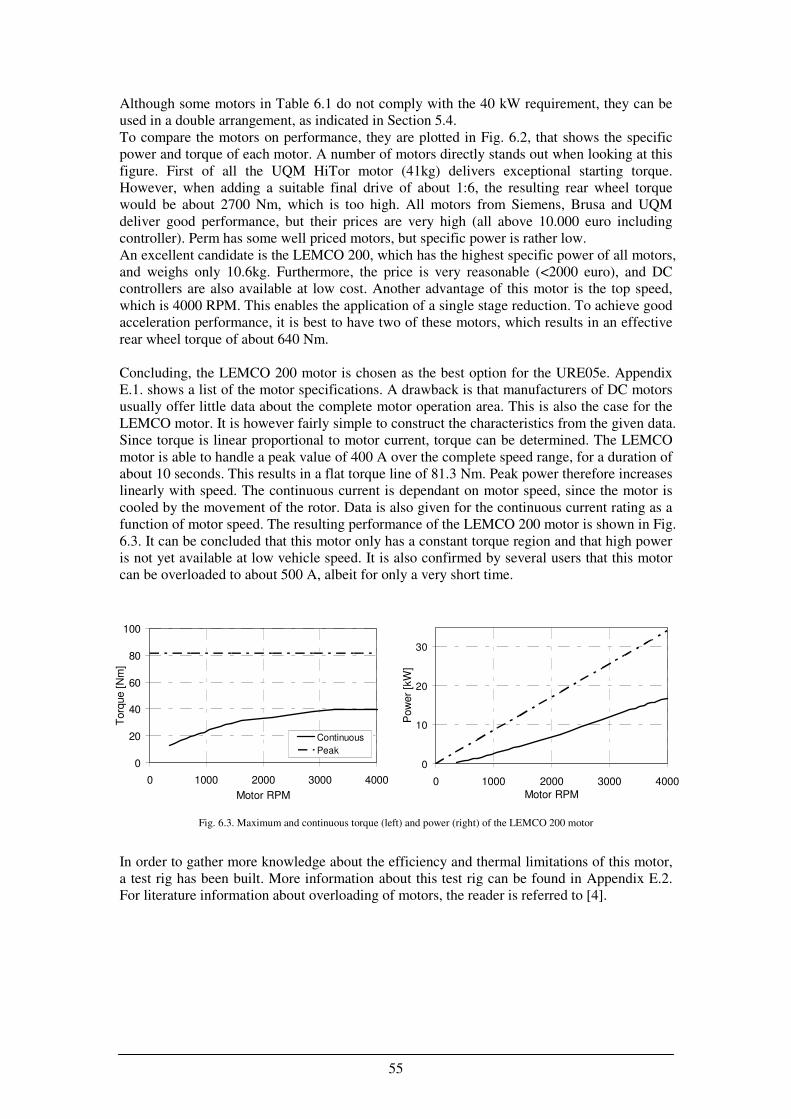
55
Although some motors in Table 6.1 do not comply with the 40 kW requirement, they can be
used in a double arrangement, as indicated in Section 5.4.
To compare the motors on performance, they are plotted in Fig. 6.2, that shows the specific
power and torque of each motor. A number of motors directly stands out when looking at this
figure. First of all the UQM HiTor motor (41kg) delivers exceptional starting torque.
However, when adding a suitable final drive of about 1:6, the resulting rear wheel torque
would be about 2700 Nm, which is too high. All motors from Siemens, Brusa and UQM
deliver good performance, but their prices are very high (all above 10.000 euro including
controller). Perm has some well priced motors, but specific power is rather low.
An excellent candidate is the LEMCO 200, which has the highest specific power of all motors,
and weighs only 10.6kg. Furthermore, the price is very reasonable (<2000 euro), and DC
controllers are also available at low cost. Another advantage of this motor is the top speed,
which is 4000 RPM. This enables the application of a single stage reduction. To achieve good
acceleration performance, it is best to have two of these motors, which results in an effective
rear wheel torque of about 640 Nm.
Concluding, the LEMCO 200 motor is chosen as the best option for the URE05e. Appendix
E.1. shows a list of the motor specifications. A drawback is that manufacturers of DC motors
usually offer little data about the complete motor operation area. This is also the case for the
LEMCO motor. It is however fairly simple to construct the characteristics from the given data.
Since torque is linear proportional to motor current, torque can be determined. The LEMCO
motor is able to handle a peak value of 400 A over the complete speed range, for a duration of
about 10 seconds. This results in a flat torque line of 81.3 Nm. Peak power therefore increases
linearly with speed. The continuous current is dependant on motor speed, since the motor is
cooled by the movement of the rotor. Data is also given for the continuous current rating as a
function of motor speed. The resulting performance of the LEMCO 200 motor is shown in Fig.
6.3. It can be concluded that this motor only has a constant torque region and that high power
is not yet available at low vehicle speed. It is also confirmed by several users that this motor
can be overloaded to about 500 A, albeit for only a very short time.
In order to gather more knowledge about the efficiency and thermal limitations of this motor,
a test rig has been built. More information about this test rig can be found in Appendix E.2.
For literature information about overloading of motors, the reader is referred to [4].
0
20
40
60
80
100
0 1000 2000 3000 4000
Motor RPM
Torq
ue [
Nm
]
Continuous
Peak
0
10
20
30
0 1000 2000 3000 4000Motor RPM
Pow
er
[kW
]
Fig. 6.3. Maximum and continuous torque (left) and power (right) of the LEMCO 200 motor
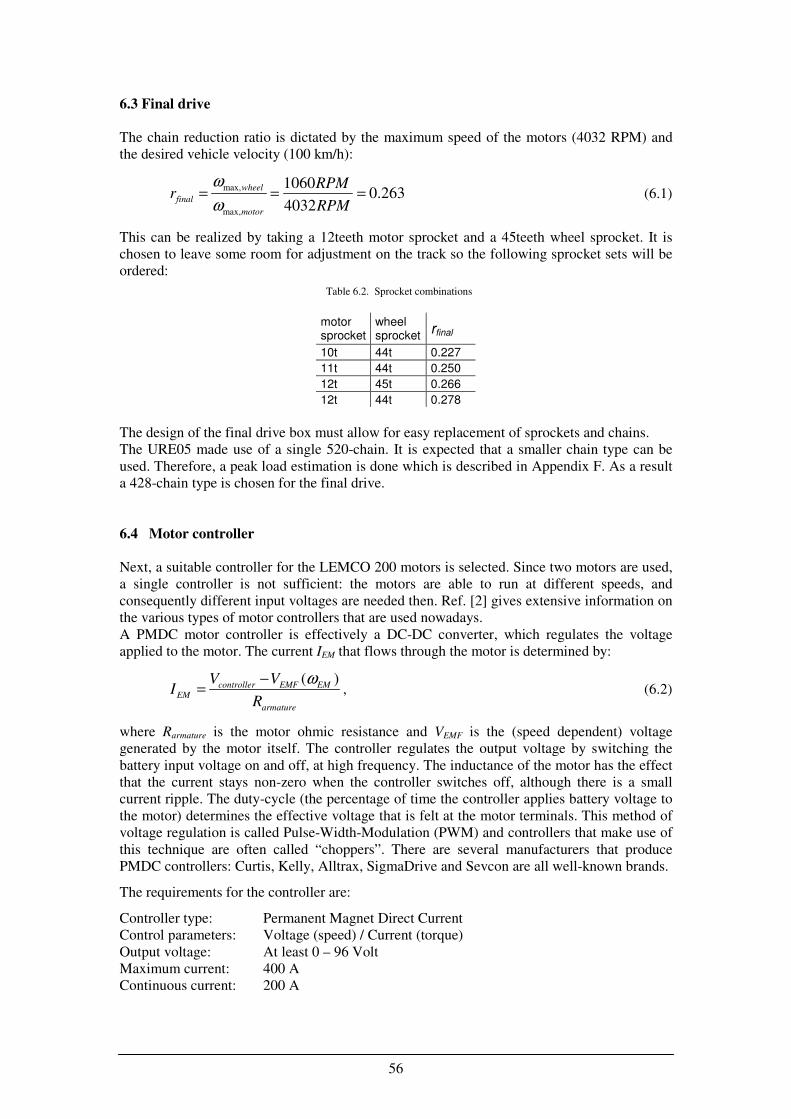
56
6.3 Final drive
The chain reduction ratio is dictated by the maximum speed of the motors (4032 RPM) and
the desired vehicle velocity (100 km/h):
max,
max,
10600.263
4032
wheel
final
motor
RPMr
RPM
ω
ω= = = (6.1)
This can be realized by taking a 12teeth motor sprocket and a 45teeth wheel sprocket. It is
chosen to leave some room for adjustment on the track so the following sprocket sets will be
ordered:
motor sprocket
wheel sprocket
rfinal
10t 44t 0.227
11t 44t 0.250
12t 45t 0.266
12t 44t 0.278
The design of the final drive box must allow for easy replacement of sprockets and chains.
The URE05 made use of a single 520-chain. It is expected that a smaller chain type can be
used. Therefore, a peak load estimation is done which is described in Appendix F. As a result
a 428-chain type is chosen for the final drive.
6.4 Motor controller
Next, a suitable controller for the LEMCO 200 motors is selected. Since two motors are used,
a single controller is not sufficient: the motors are able to run at different speeds, and
consequently different input voltages are needed then. Ref. [2] gives extensive information on
the various types of motor controllers that are used nowadays.
A PMDC motor controller is effectively a DC-DC converter, which regulates the voltage
applied to the motor. The current IEM that flows through the motor is determined by:
( )controller EMF EM
EM
armature
V VI
R
ω−= , (6.2)
where Rarmature is the motor ohmic resistance and VEMF is the (speed dependent) voltage
generated by the motor itself. The controller regulates the output voltage by switching the
battery input voltage on and off, at high frequency. The inductance of the motor has the effect
that the current stays non-zero when the controller switches off, although there is a small
current ripple. The duty-cycle (the percentage of time the controller applies battery voltage to
the motor) determines the effective voltage that is felt at the motor terminals. This method of
voltage regulation is called Pulse-Width-Modulation (PWM) and controllers that make use of
this technique are often called “choppers”. There are several manufacturers that produce
PMDC controllers: Curtis, Kelly, Alltrax, SigmaDrive and Sevcon are all well-known brands.
The requirements for the controller are:
Controller type: Permanent Magnet Direct Current
Control parameters: Voltage (speed) / Current (torque)
Output voltage: At least 0 – 96 Volt
Maximum current: 400 A
Continuous current: 200 A
Table 6.2. Sprocket combinations
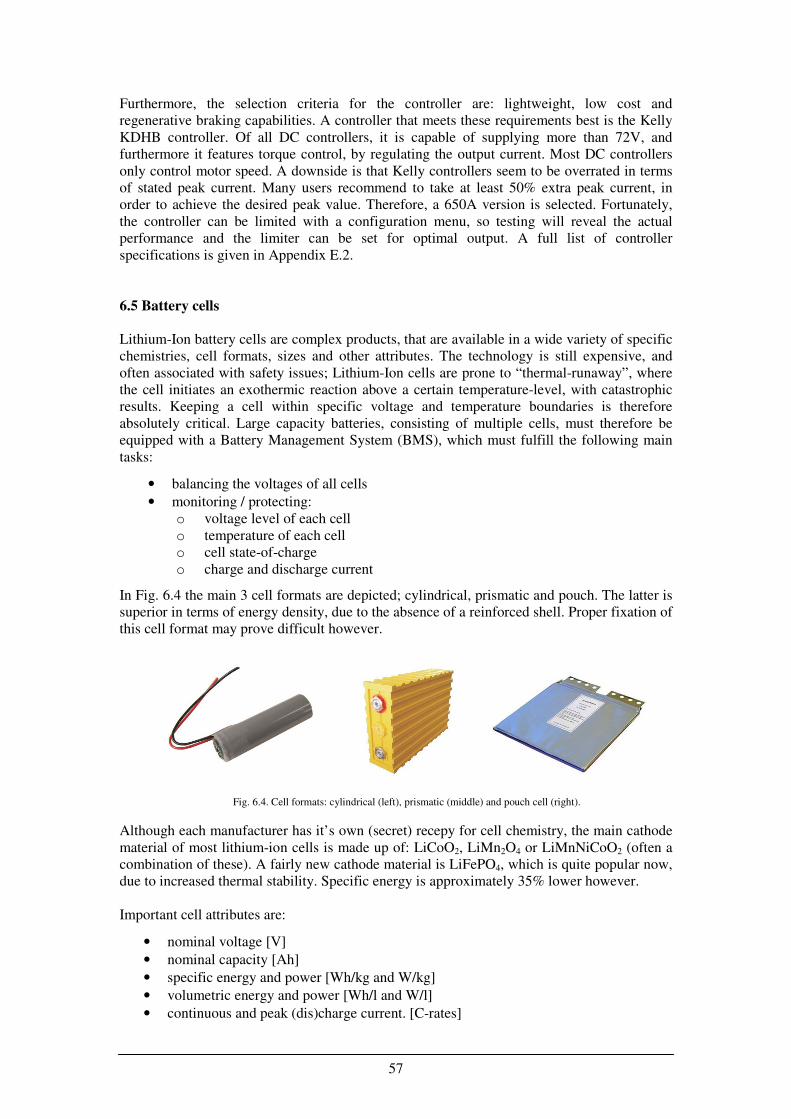
57
Furthermore, the selection criteria for the controller are: lightweight, low cost and
regenerative braking capabilities. A controller that meets these requirements best is the Kelly
KDHB controller. Of all DC controllers, it is capable of supplying more than 72V, and
furthermore it features torque control, by regulating the output current. Most DC controllers
only control motor speed. A downside is that Kelly controllers seem to be overrated in terms
of stated peak current. Many users recommend to take at least 50% extra peak current, in
order to achieve the desired peak value. Therefore, a 650A version is selected. Fortunately,
the controller can be limited with a configuration menu, so testing will reveal the actual
performance and the limiter can be set for optimal output. A full list of controller
specifications is given in Appendix E.2.
6.5 Battery cells
Lithium-Ion battery cells are complex products, that are available in a wide variety of specific
chemistries, cell formats, sizes and other attributes. The technology is still expensive, and
often associated with safety issues; Lithium-Ion cells are prone to “thermal-runaway”, where
the cell initiates an exothermic reaction above a certain temperature-level, with catastrophic
results. Keeping a cell within specific voltage and temperature boundaries is therefore
absolutely critical. Large capacity batteries, consisting of multiple cells, must therefore be
equipped with a Battery Management System (BMS), which must fulfill the following main
tasks:
• balancing the voltages of all cells
• monitoring / protecting:
o voltage level of each cell
o temperature of each cell
o cell state-of-charge
o charge and discharge current
In Fig. 6.4 the main 3 cell formats are depicted; cylindrical, prismatic and pouch. The latter is
superior in terms of energy density, due to the absence of a reinforced shell. Proper fixation of
this cell format may prove difficult however.
Although each manufacturer has it’s own (secret) recepy for cell chemistry, the main cathode
material of most lithium-ion cells is made up of: LiCoO2, LiMn2O4 or LiMnNiCoO2 (often a
combination of these). A fairly new cathode material is LiFePO4, which is quite popular now,
due to increased thermal stability. Specific energy is approximately 35% lower however.
Important cell attributes are:
• nominal voltage [V]
• nominal capacity [Ah]
• specific energy and power [Wh/kg and W/kg]
• volumetric energy and power [Wh/l and W/l]
• continuous and peak (dis)charge current. [C-rates]
Fig. 6.4. Cell formats: cylindrical (left), prismatic (middle) and pouch cell (right).
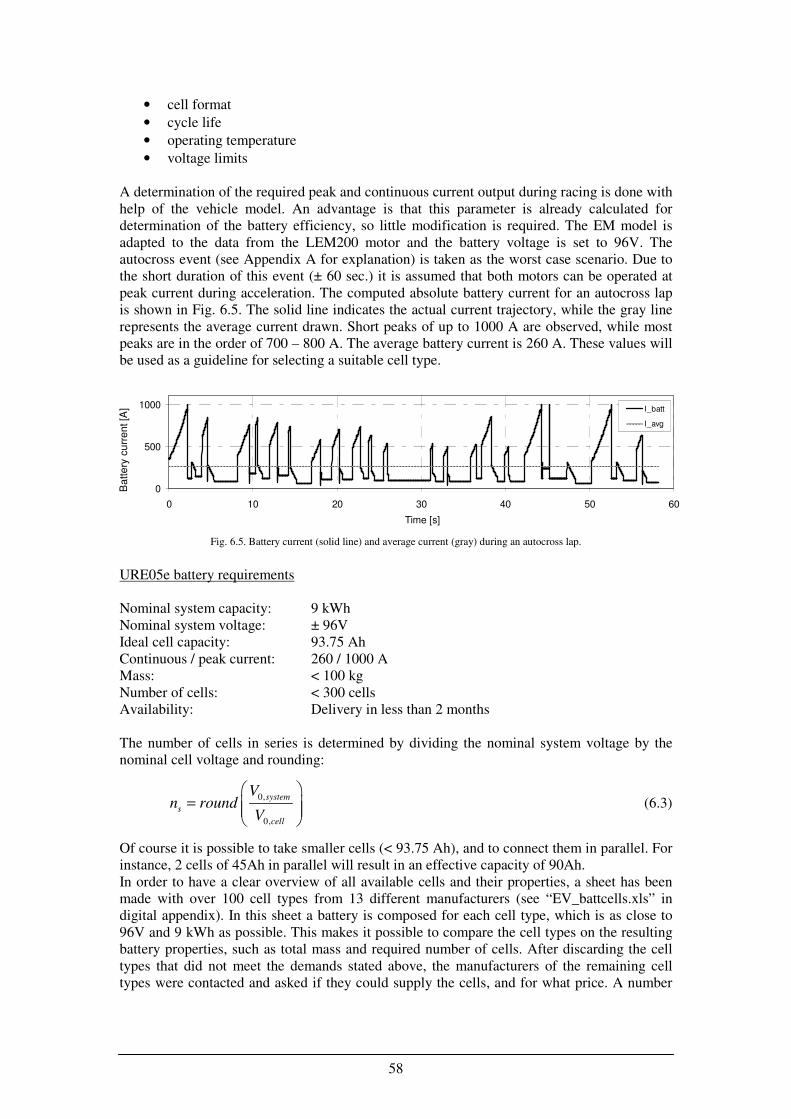
58
• cell format
• cycle life
• operating temperature
• voltage limits
A determination of the required peak and continuous current output during racing is done with
help of the vehicle model. An advantage is that this parameter is already calculated for
determination of the battery efficiency, so little modification is required. The EM model is
adapted to the data from the LEM200 motor and the battery voltage is set to 96V. The
autocross event (see Appendix A for explanation) is taken as the worst case scenario. Due to
the short duration of this event (± 60 sec.) it is assumed that both motors can be operated at
peak current during acceleration. The computed absolute battery current for an autocross lap
is shown in Fig. 6.5. The solid line indicates the actual current trajectory, while the gray line
represents the average current drawn. Short peaks of up to 1000 A are observed, while most
peaks are in the order of 700 – 800 A. The average battery current is 260 A. These values will
be used as a guideline for selecting a suitable cell type.
URE05e battery requirements
Nominal system capacity: 9 kWh
Nominal system voltage: ± 96V
Ideal cell capacity: 93.75 Ah
Continuous / peak current: 260 / 1000 A
Mass: < 100 kg
Number of cells: < 300 cells
Availability: Delivery in less than 2 months
The number of cells in series is determined by dividing the nominal system voltage by the
nominal cell voltage and rounding:
0,
0,
system
s
cell
Vn round
V
=
(6.3)
Of course it is possible to take smaller cells (< 93.75 Ah), and to connect them in parallel. For
instance, 2 cells of 45Ah in parallel will result in an effective capacity of 90Ah.
In order to have a clear overview of all available cells and their properties, a sheet has been
made with over 100 cell types from 13 different manufacturers (see “EV_battcells.xls” in
digital appendix). In this sheet a battery is composed for each cell type, which is as close to
96V and 9 kWh as possible. This makes it possible to compare the cell types on the resulting
battery properties, such as total mass and required number of cells. After discarding the cell
types that did not meet the demands stated above, the manufacturers of the remaining cell
types were contacted and asked if they could supply the cells, and for what price. A number
0
500
1000
0 10 20 30 40 50 60
Time [s]
Batte
ry c
urr
ent [A
] I_batt
I_avg
Fig. 6.5. Battery current (solid line) and average current (gray) during an autocross lap.
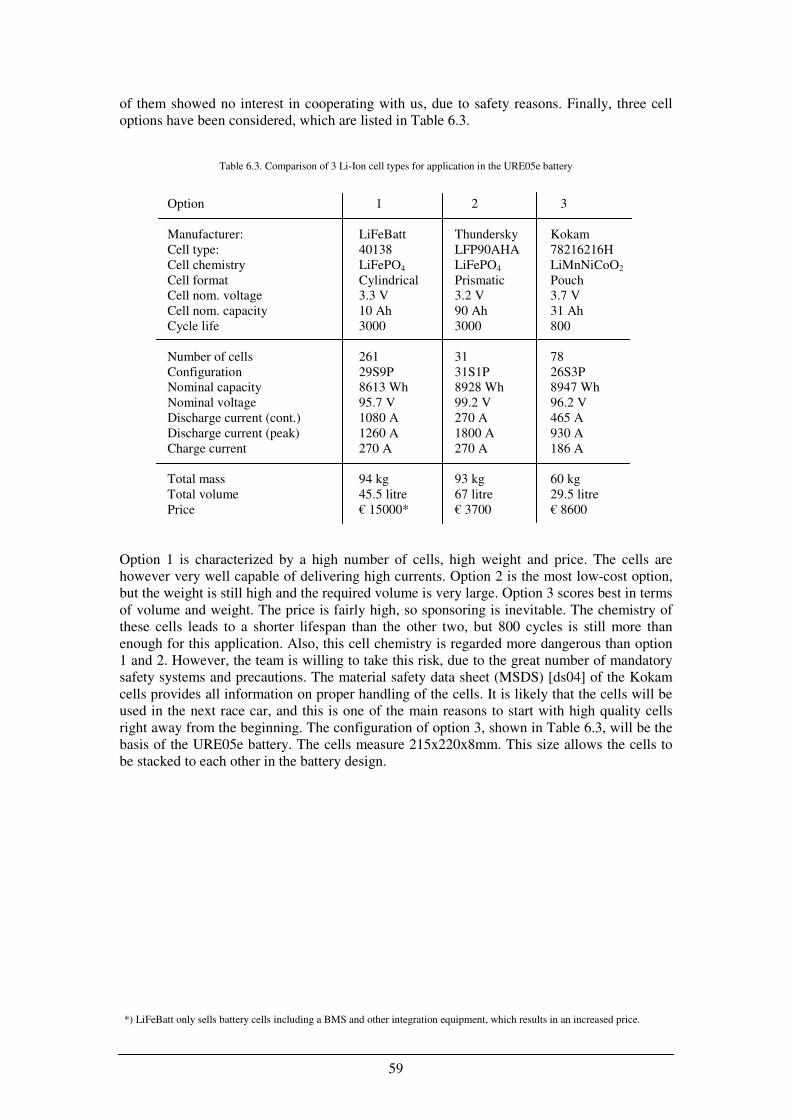
59
of them showed no interest in cooperating with us, due to safety reasons. Finally, three cell
options have been considered, which are listed in Table 6.3.
Option 1 2 3
Manufacturer: LiFeBatt Thundersky Kokam
Cell type: 40138 LFP90AHA 78216216H
Cell chemistry LiFePO4 LiFePO4 LiMnNiCoO2
Cell format Cylindrical Prismatic Pouch
Cell nom. voltage 3.3 V 3.2 V 3.7 V
Cell nom. capacity 10 Ah 90 Ah 31 Ah
Cycle life 3000 3000 800
Number of cells 261 31 78
Configuration 29S9P 31S1P 26S3P
Nominal capacity 8613 Wh 8928 Wh 8947 Wh
Nominal voltage 95.7 V 99.2 V 96.2 V
Discharge current (cont.) 1080 A 270 A 465 A
Discharge current (peak) 1260 A 1800 A 930 A
Charge current 270 A 270 A 186 A
Total mass 94 kg 93 kg 60 kg
Total volume 45.5 litre 67 litre 29.5 litre
Price € 15000* € 3700 € 8600
Option 1 is characterized by a high number of cells, high weight and price. The cells are
however very well capable of delivering high currents. Option 2 is the most low-cost option,
but the weight is still high and the required volume is very large. Option 3 scores best in terms
of volume and weight. The price is fairly high, so sponsoring is inevitable. The chemistry of
these cells leads to a shorter lifespan than the other two, but 800 cycles is still more than
enough for this application. Also, this cell chemistry is regarded more dangerous than option
1 and 2. However, the team is willing to take this risk, due to the great number of mandatory
safety systems and precautions. The material safety data sheet (MSDS) [ds04] of the Kokam
cells provides all information on proper handling of the cells. It is likely that the cells will be
used in the next race car, and this is one of the main reasons to start with high quality cells
right away from the beginning. The configuration of option 3, shown in Table 6.3, will be the
basis of the URE05e battery. The cells measure 215x220x8mm. This size allows the cells to
be stacked to each other in the battery design.
Table 6.3. Comparison of 3 Li-Ion cell types for application in the URE05e battery
*) LiFeBatt only sells battery cells including a BMS and other integration equipment, which results in an increased price.

60
6.6 Electronics
In this section a number of auxiliary components are discussed. These are essential for an
electric vehicle to keep working properly and safe.
Battery Management System
The BMS is selected from Elithion for it’s high flexibility, low
cost and extensive documentation, which is supplied on their
website [i4]. The Elithion BMS makes use of a main board
(depicted in Fig. 6.6) and multiple small cell boards, that
monitor individual cells. The Elition BMS requires little wiring,
thereby reducing the “spagetti” in the battery, when compared
to other systems. The Elithion BMS can be connected to a PC
for monitoring and configuration, and has also CAN
capabilities.
Ground Fault Detector
The GFD (also called insulation monitoring device) is a
mandatory system that checks if there are any insulation problems
with the HV system. If the device senses a leakage to low-voltage
ground it immediately shuts down the high voltage system by
opening the battery contactor relays. The GFD for the URE05e
will be a Bender IR155-2, which is depicted in Fig. 6.7. A full
overview of this device is shown in [ds08].
Charger
Of course a charger is needed for recharging the Lithium-Ion
battery. This charger will not be installed in the car. Li-Ion
cells must be charged with a so-called CCCV profile (constant
current, constant voltage). This means that the main amount of
energy is charged using a constant current supply, but when the
cells are nearing 100% state-of-charge (i.e. 4.2V), the charger
switches to a constant voltage supply. This will ensure that the
last part of charging is done more gradually, which is necessary
for safety. After this the BMS will balance the cells.
The chosen charger is a Zivan NG9, and is shown in Fig. 6.8.
This charger is able to supply about 8 kW (1C) to the battery.
The estimated charging time will be about 2 hours with this charger.
More information about the NG9 charger can be found in [ds14].
Fig. 6.6. Elithion main BMS board
Fig. 6.7. Graund Fault Detector
Fig. 6.8. Zivan NG9 battery charger
61
Chapter 7
Overall design
7.1 Introduction
This chapter presents and motivates the design of the URE05e, based upon the selected
components. The design has been made in the 3D modeller Unigraphics NX5.
One of the major design choices was the location of the battery. The result of this decision
affected the design of the complete drive train system. Another important aspect is that the
chassis and suspension of the car are already finished, since the old chassis of the URE05 will
be used. This posed strict constraints to the available space and arrangement of the drive train.
Firstly, the electrical scheme of the electric car will be presented in Section 7.2. In Section 7.3
the packaging of components is treated, where 2 main concepts are compared to each other.
This section presents a global overview of all the systems in the car, and their placement.
Furthermore, a detailed weight analysis is presented in Section 7.4, together with a
determination of the centre of gravity’s location. Section 7.5 deals with the final drive design.
Ofcourse, modifications have to be carried out, mainly on the URE05 rear frame. This is the
subject of Section 7.6. Conclusions are given in Section 7.7.
7.2 Electrical scheme
The electrical scheme is determined for a large part by the competition rules [i1,i9]. Fig. 7.1
shows the scheme with the main systems in it. The build up is as follows; in the center one
can see the HV battery. The HV supply wiring exits the battery containment and splits up to
the motor controllers. Each motor controller is connected to a motor. The pedalbox has
potmeters for both the throttle and brake pedal, which send signals to the motor controllers,
via the differential controller. Furthermore there is a safety loop which is indicated in blue.
This wiring energizes the two battery contactor relays. There are several devices placed in the
safety loop, that are able to interupt the energy supply to the contactor relays. These are the
master switch, the emergency buttons, the graund fault detector and the battery management
system. When the loop is interupted, power to the motors is shut down, and no high voltage
will be present outside the battery containment. The charger is also shown in the scheme. This
charger can be connected to the battery by temporarily disconnecting the motor controllers
from the battery and inserting the charger connectors in the battery.
Of course there are many smaller subsystemes and circuitry needed to complete the whole
wiring of the URE05e. It is however out of the scope of this report to discuss this.
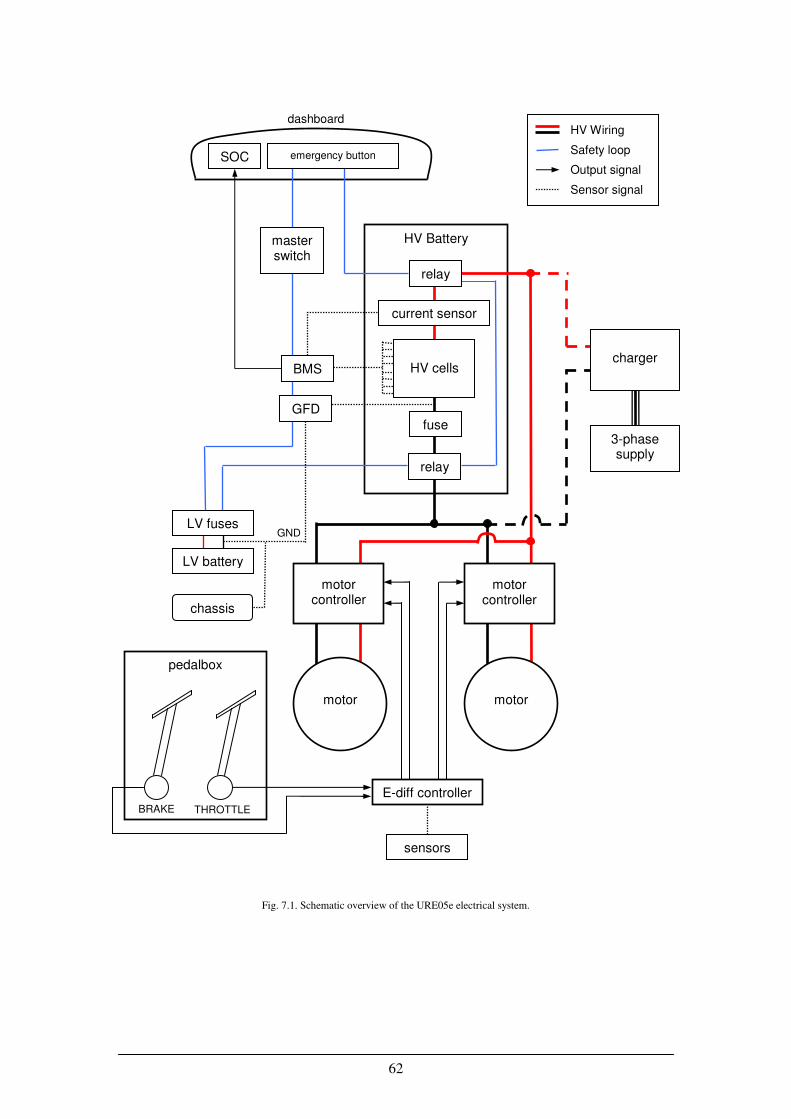
62
pedalbox
HV Battery
motor controller
motor
motor controller
motor
current sensor
SOC
sensors
fuse
relay
HV cells
master switch
BMS
emergency button
GND
GFD
dashboard
BRAKE THROTTLE
3-phase supply
relay
chassis
LV battery
LV fuses
E-diff controller
charger
HV Wiring
Safety loop
Output signal
Sensor signal
Fig. 7.1. Schematic overview of the URE05e electrical system.
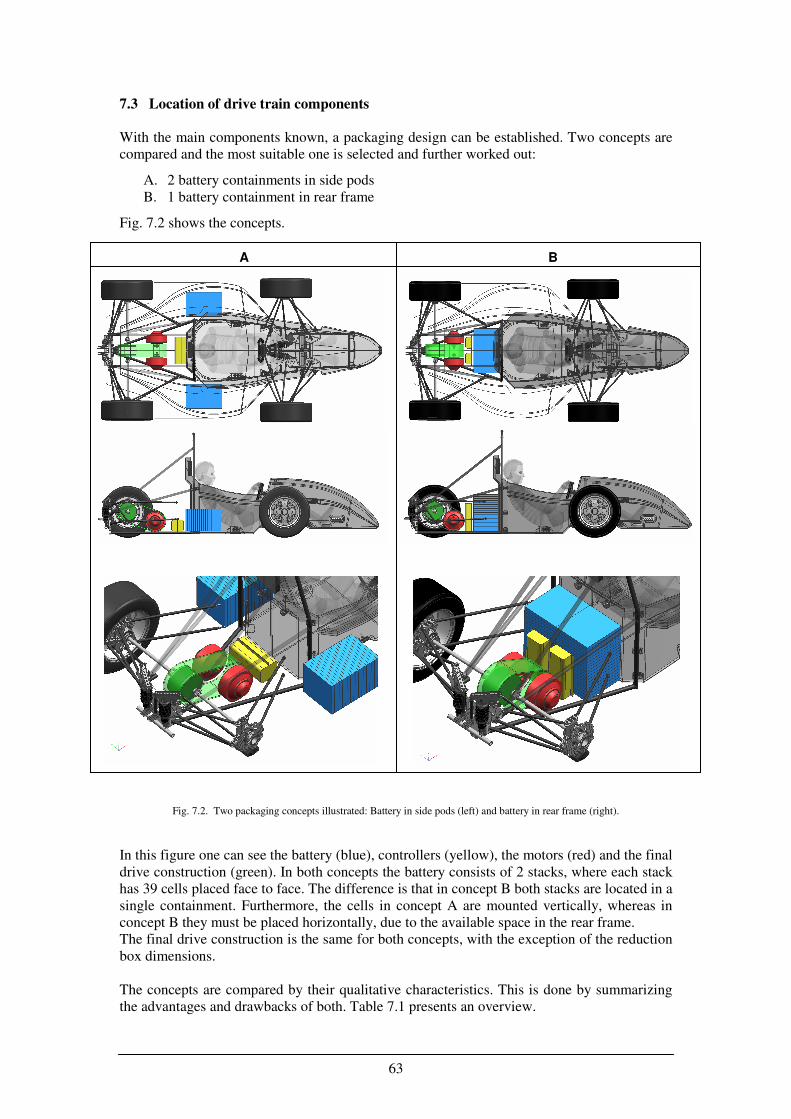
63
7.3 Location of drive train components
With the main components known, a packaging design can be established. Two concepts are
compared and the most suitable one is selected and further worked out:
A. 2 battery containments in side pods
B. 1 battery containment in rear frame
Fig. 7.2 shows the concepts.
In this figure one can see the battery (blue), controllers (yellow), the motors (red) and the final
drive construction (green). In both concepts the battery consists of 2 stacks, where each stack
has 39 cells placed face to face. The difference is that in concept B both stacks are located in a
single containment. Furthermore, the cells in concept A are mounted vertically, whereas in
concept B they must be placed horizontally, due to the available space in the rear frame.
The final drive construction is the same for both concepts, with the exception of the reduction
box dimensions.
The concepts are compared by their qualitative characteristics. This is done by summarizing
the advantages and drawbacks of both. Table 7.1 presents an overview.
A B
Fig. 7.2. Two packaging concepts illustrated: Battery in side pods (left) and battery in rear frame (right).
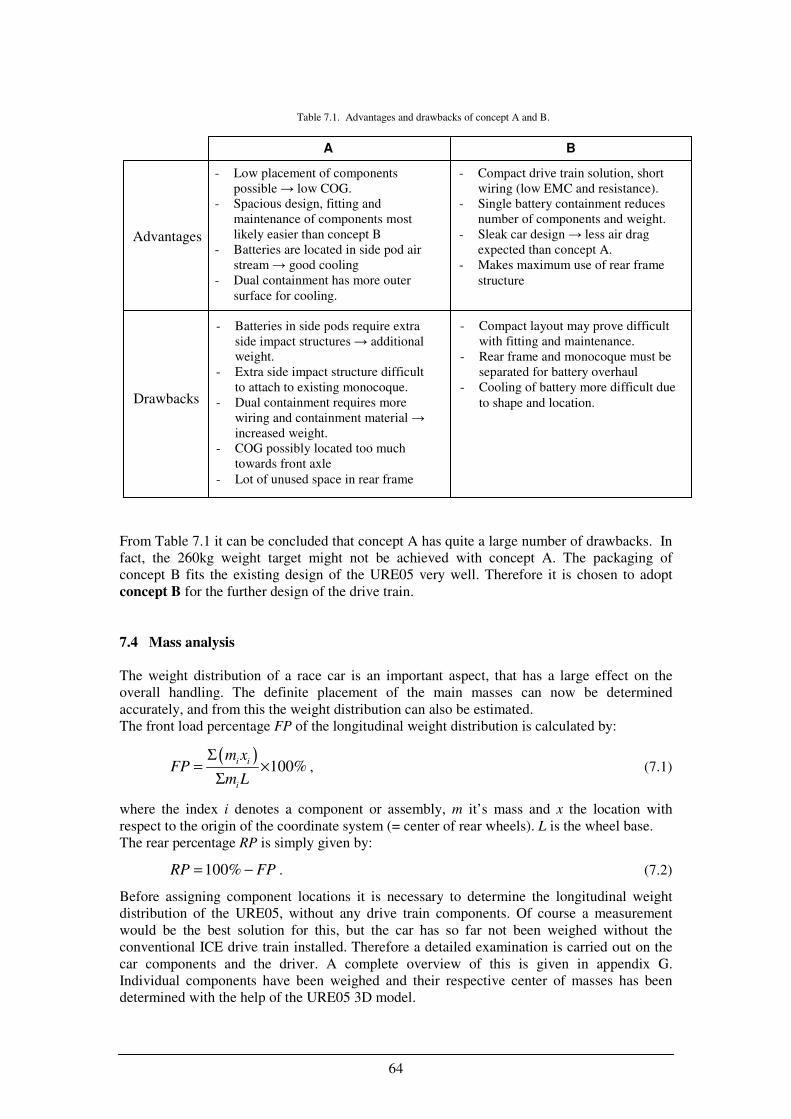
64
From Table 7.1 it can be concluded that concept A has quite a large number of drawbacks. In
fact, the 260kg weight target might not be achieved with concept A. The packaging of
concept B fits the existing design of the URE05 very well. Therefore it is chosen to adopt
concept B for the further design of the drive train.
7.4 Mass analysis
The weight distribution of a race car is an important aspect, that has a large effect on the
overall handling. The definite placement of the main masses can now be determined
accurately, and from this the weight distribution can also be estimated.
The front load percentage FP of the longitudinal weight distribution is calculated by:
( )100%
i i
i
m xFP
m L
Σ= ×
Σ, (7.1)
where the index i denotes a component or assembly, m it’s mass and x the location with
respect to the origin of the coordinate system (= center of rear wheels). L is the wheel base.
The rear percentage RP is simply given by:
100%RP FP= − . (7.2)
Before assigning component locations it is necessary to determine the longitudinal weight
distribution of the URE05, without any drive train components. Of course a measurement
would be the best solution for this, but the car has so far not been weighed without the
conventional ICE drive train installed. Therefore a detailed examination is carried out on the
car components and the driver. A complete overview of this is given in appendix G.
Individual components have been weighed and their respective center of masses has been
determined with the help of the URE05 3D model.
A B
Advantages
Drawbacks
- Low placement of components
possible → low COG.
- Spacious design, fitting and
maintenance of components most
likely easier than concept B
- Batteries are located in side pod air
stream → good cooling
- Dual containment has more outer
surface for cooling.
- Compact drive train solution, short
wiring (low EMC and resistance).
- Single battery containment reduces
number of components and weight.
- Sleak car design → less air drag
expected than concept A.
- Makes maximum use of rear frame
structure
- Batteries in side pods require extra
side impact structures → additional
weight.
- Extra side impact structure difficult
to attach to existing monocoque.
- Dual containment requires more
wiring and containment material →
increased weight.
- COG possibly located too much
towards front axle
- Lot of unused space in rear frame
- Compact layout may prove difficult
with fitting and maintenance.
- Rear frame and monocoque must be
separated for battery overhaul
- Cooling of battery more difficult due
to shape and location.
Table 7.1. Advantages and drawbacks of concept A and B.
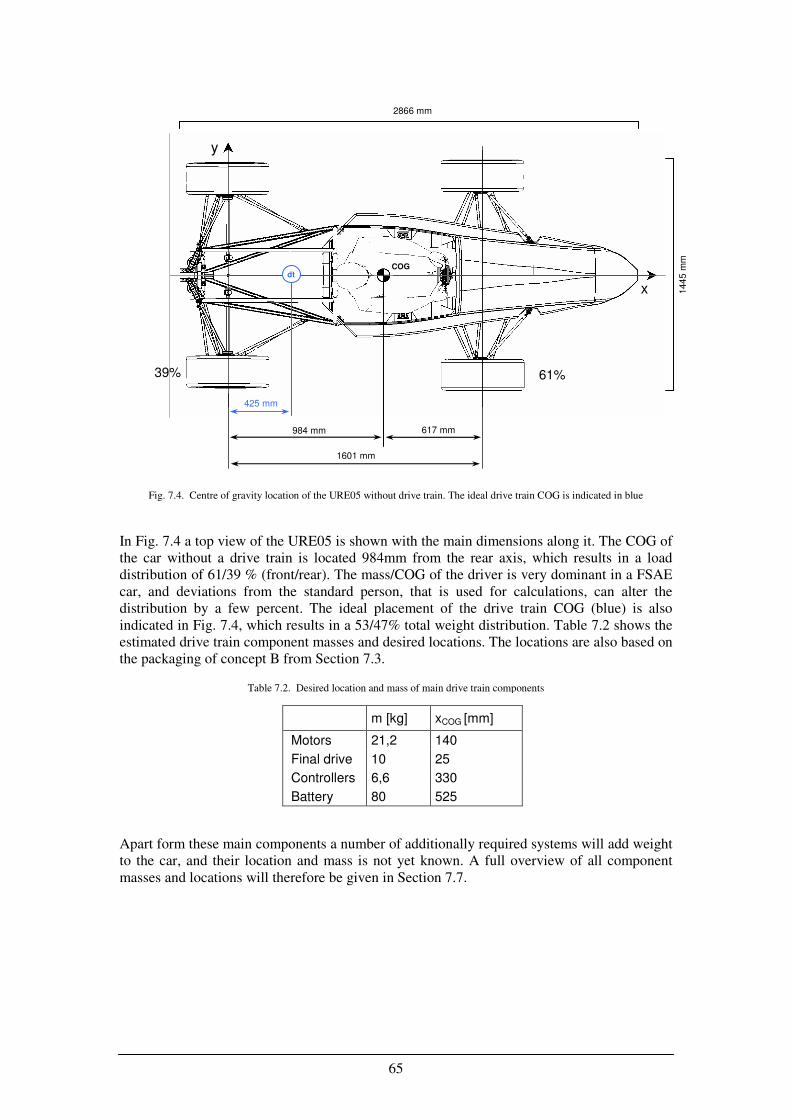
65
In Fig. 7.4 a top view of the URE05 is shown with the main dimensions along it. The COG of
the car without a drive train is located 984mm from the rear axis, which results in a load
distribution of 61/39 % (front/rear). The mass/COG of the driver is very dominant in a FSAE
car, and deviations from the standard person, that is used for calculations, can alter the
distribution by a few percent. The ideal placement of the drive train COG (blue) is also
indicated in Fig. 7.4, which results in a 53/47% total weight distribution. Table 7.2 shows the
estimated drive train component masses and desired locations. The locations are also based on
the packaging of concept B from Section 7.3.
Apart form these main components a number of additionally required systems will add weight
to the car, and their location and mass is not yet known. A full overview of all component
masses and locations will therefore be given in Section 7.7.
m [kg] xCOG [mm]
Motors 21,2 140
Final drive 10 25
Controllers 6,6 330
Battery 80 525
Table 7.2. Desired location and mass of main drive train components
x
y
2866 mm
144
5 m
m
1601 mm
984 mm 617 mm
61% 39%
dt
425 mm
Fig. 7.4. Centre of gravity location of the URE05 without drive train. The ideal drive train COG is indicated in blue
COG
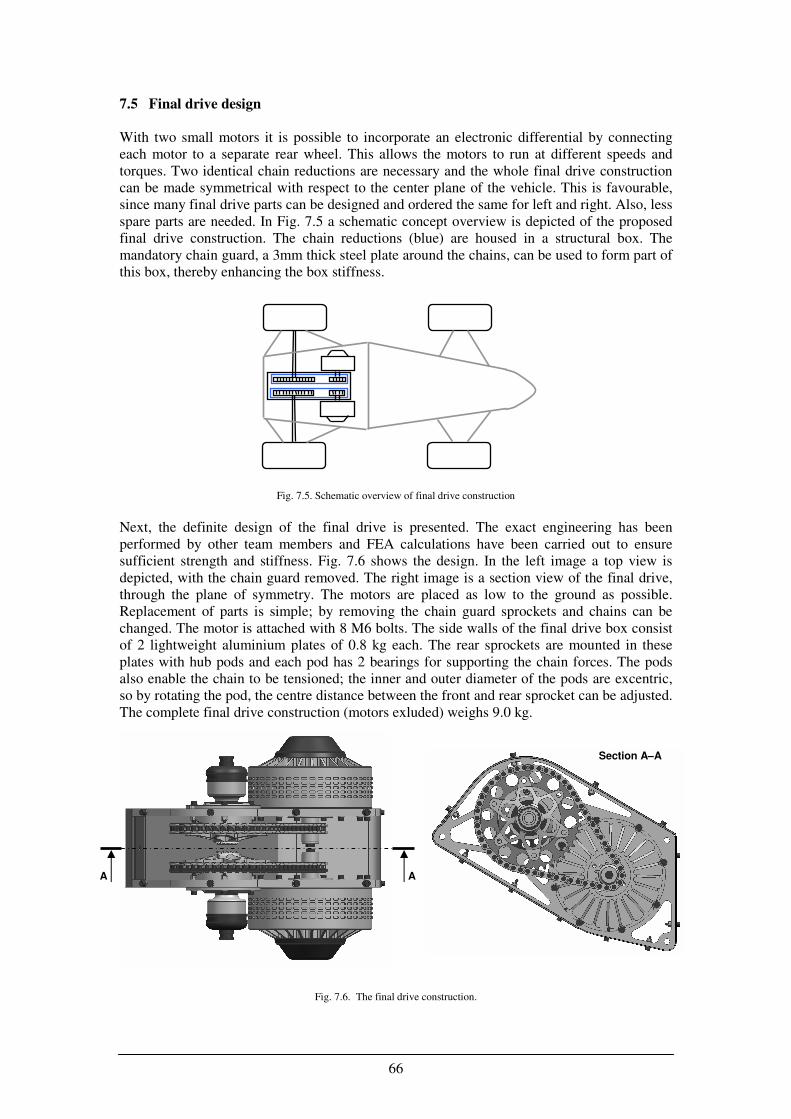
66
7.5 Final drive design
With two small motors it is possible to incorporate an electronic differential by connecting
each motor to a separate rear wheel. This allows the motors to run at different speeds and
torques. Two identical chain reductions are necessary and the whole final drive construction
can be made symmetrical with respect to the center plane of the vehicle. This is favourable,
since many final drive parts can be designed and ordered the same for left and right. Also, less
spare parts are needed. In Fig. 7.5 a schematic concept overview is depicted of the proposed
final drive construction. The chain reductions (blue) are housed in a structural box. The
mandatory chain guard, a 3mm thick steel plate around the chains, can be used to form part of
this box, thereby enhancing the box stiffness.
Fig. 7.5. Schematic overview of final drive construction
Next, the definite design of the final drive is presented. The exact engineering has been
performed by other team members and FEA calculations have been carried out to ensure
sufficient strength and stiffness. Fig. 7.6 shows the design. In the left image a top view is
depicted, with the chain guard removed. The right image is a section view of the final drive,
through the plane of symmetry. The motors are placed as low to the ground as possible.
Replacement of parts is simple; by removing the chain guard sprockets and chains can be
changed. The motor is attached with 8 M6 bolts. The side walls of the final drive box consist
of 2 lightweight aluminium plates of 0.8 kg each. The rear sprockets are mounted in these
plates with hub pods and each pod has 2 bearings for supporting the chain forces. The pods
also enable the chain to be tensioned; the inner and outer diameter of the pods are excentric,
so by rotating the pod, the centre distance between the front and rear sprocket can be adjusted.
The complete final drive construction (motors exluded) weighs 9.0 kg.
Fig. 7.6. The final drive construction.
A A
Section A–A
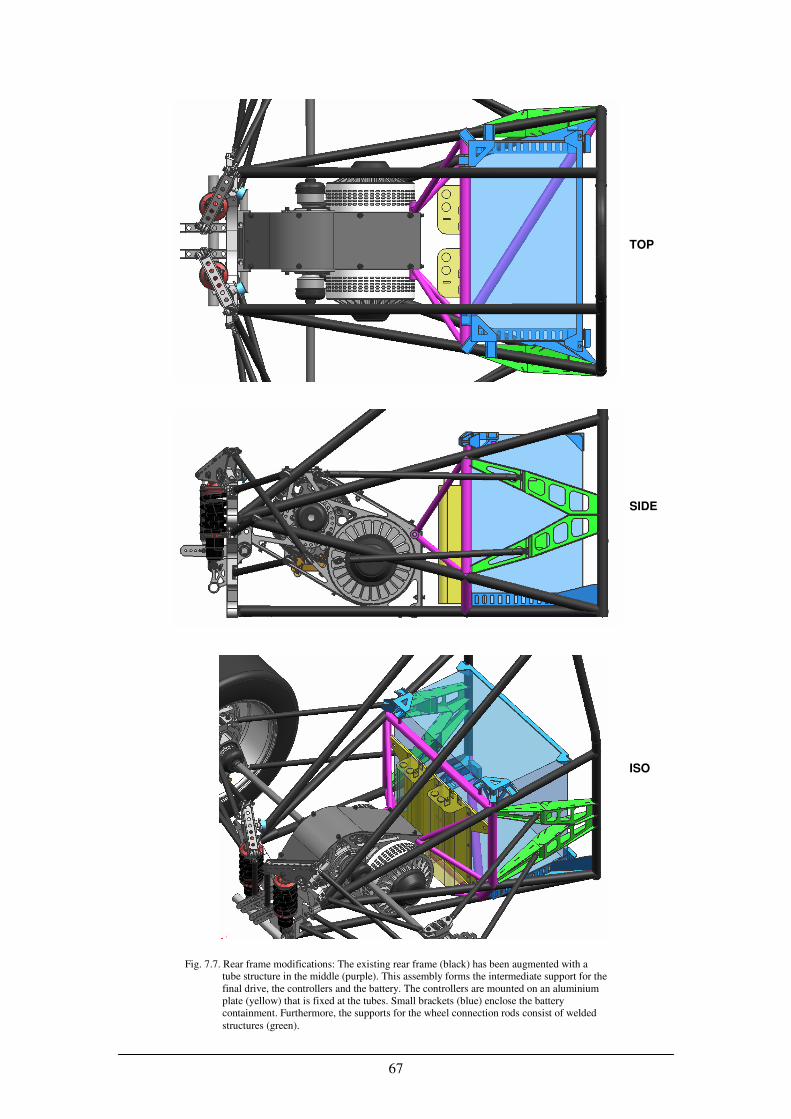
67
TOP SIDE ISO
Fig. 7.7. Rear frame modifications: The existing rear frame (black) has been augmented with a
tube structure in the middle (purple). This assembly forms the intermediate support for the
final drive, the controllers and the battery. The controllers are mounted on an aluminium
plate (yellow) that is fixed at the tubes. Small brackets (blue) enclose the battery
containment. Furthermore, the supports for the wheel connection rods consist of welded
structures (green).
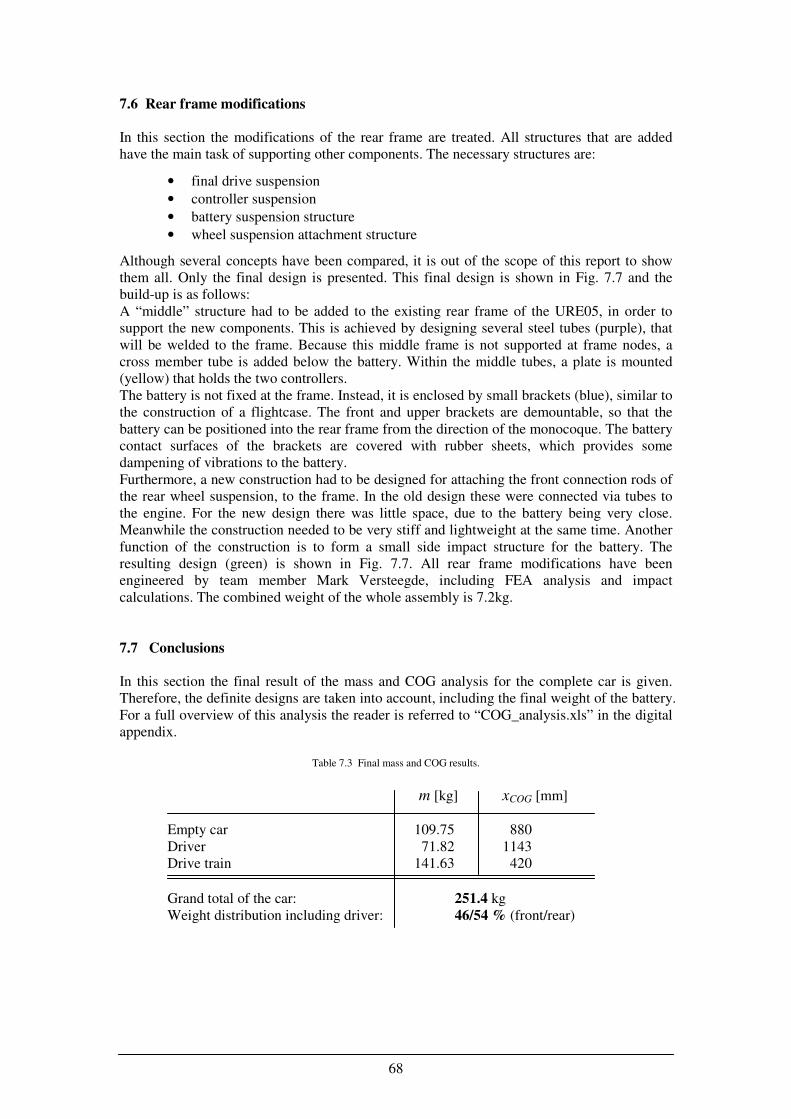
68
7.6 Rear frame modifications
In this section the modifications of the rear frame are treated. All structures that are added
have the main task of supporting other components. The necessary structures are:
• final drive suspension
• controller suspension
• battery suspension structure
• wheel suspension attachment structure
Although several concepts have been compared, it is out of the scope of this report to show
them all. Only the final design is presented. This final design is shown in Fig. 7.7 and the
build-up is as follows:
A “middle” structure had to be added to the existing rear frame of the URE05, in order to
support the new components. This is achieved by designing several steel tubes (purple), that
will be welded to the frame. Because this middle frame is not supported at frame nodes, a
cross member tube is added below the battery. Within the middle tubes, a plate is mounted
(yellow) that holds the two controllers.
The battery is not fixed at the frame. Instead, it is enclosed by small brackets (blue), similar to
the construction of a flightcase. The front and upper brackets are demountable, so that the
battery can be positioned into the rear frame from the direction of the monocoque. The battery
contact surfaces of the brackets are covered with rubber sheets, which provides some
dampening of vibrations to the battery.
Furthermore, a new construction had to be designed for attaching the front connection rods of
the rear wheel suspension, to the frame. In the old design these were connected via tubes to
the engine. For the new design there was little space, due to the battery being very close.
Meanwhile the construction needed to be very stiff and lightweight at the same time. Another
function of the construction is to form a small side impact structure for the battery. The
resulting design (green) is shown in Fig. 7.7. All rear frame modifications have been
engineered by team member Mark Versteegde, including FEA analysis and impact
calculations. The combined weight of the whole assembly is 7.2kg.
7.7 Conclusions
In this section the final result of the mass and COG analysis for the complete car is given.
Therefore, the definite designs are taken into account, including the final weight of the battery.
For a full overview of this analysis the reader is referred to “COG_analysis.xls” in the digital
appendix.
Table 7.3 Final mass and COG results.
m [kg] xCOG [mm]
Empty car 109.75 880
Driver 71.82 1143
Drive train 141.63 420
Grand total of the car: 251.4 kg
Weight distribution including driver: 46/54 % (front/rear)

69
Part III
Battery design
70
Chapter 8
Battery concept and design
8.1 Introduction
This chapter describes the design of the URE05e battery. The battery is a key-element in any
electric vehicle, and has a large influence on the performance of the vehicle. The quality of a
battery is not only determined by the cell characteristics itself, but also by the integration of
the cells into a complete system. To minimize the volume and weight of the URE05e battery,
a dedicated cell packaging is presented that offers enough cooling capabilities to cover the
endurance race. Besides, design constraints due to mechanical and electrical safety are
accounted for. In [37] a comprehensive overview is presented of batteries in electric vehicles.
In the next section the requirements for the battery are summed up. After that the overall
design is presented in Section 8.3. and more detailed engineering is covered in Section 8.4.
Finally, the complete battery design is shown in Section 8.5.
8.2 Competition rules and design specification
From the class1A and the FS Electric competition the requirements are combined and as
follows:
Containment:
• Mechanically robust and fireproof material
• Rain proof (> IP45 [i13])
• Rugged fixation of cells within containment
• Insulation of all electrical live parts(*
)
• Removable (transparant) cover
Electrical:
• BMS monitoring: voltage, current and temperature
• Galvanic separation of low and high voltage
• Contactor relays (normally-open) at positive and negative end.
• Fuse
• HV Connectors with inter-lock
• Strain-relief for all electric wiring
For the design the next specification targets are set:
o Dimensions (LxWxH): 255x455x390 mm (Packaging, Section 7.3)
o Weight: < 80kg (Mass analysis, Section 7.4)
o Temperature: < 60°C (MSDS [ds04])
o Maximum current: 1000 A (Cell specification, Section 6.5)
o Continuous current: 250 A ( ,, )
Furthermore the design is preferably easy to manufacture, (dis)assemble and as low-cost as
possible.
*) Electrical live parts are electrical conductors, with the intention of carrying electricity, i.e. wiring and busbars.
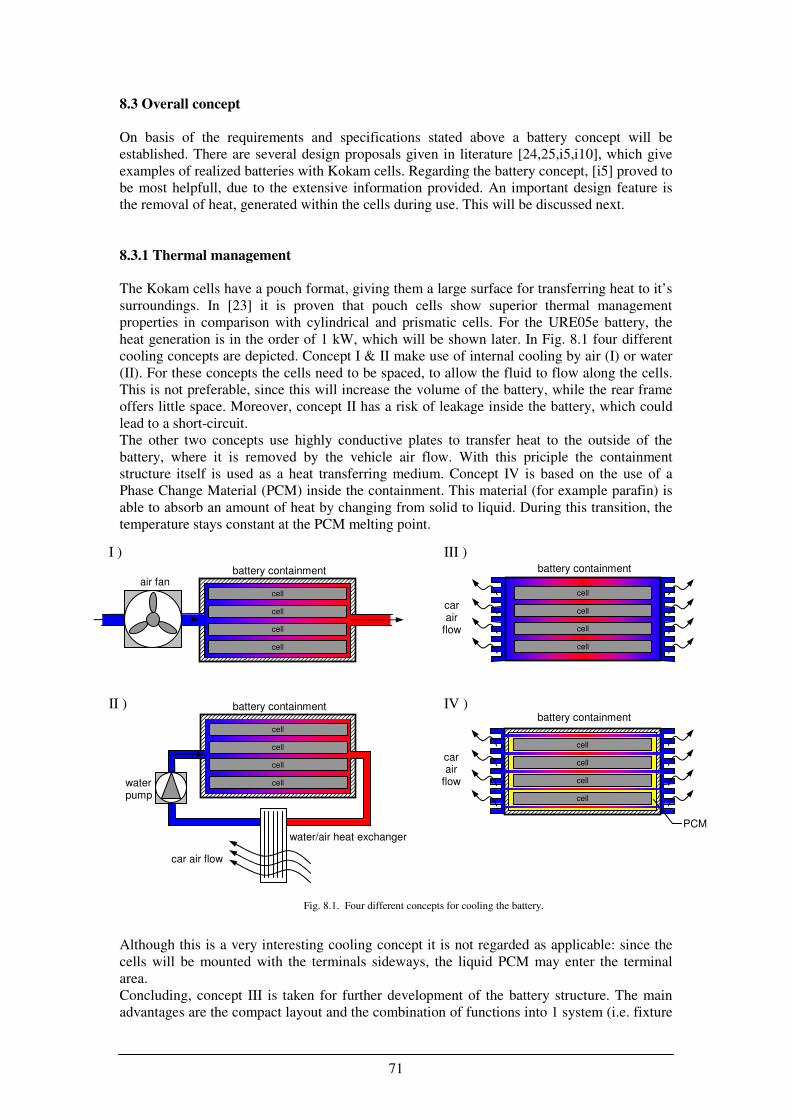
71
8.3 Overall concept
On basis of the requirements and specifications stated above a battery concept will be
established. There are several design proposals given in literature [24,25,i5,i10], which give
examples of realized batteries with Kokam cells. Regarding the battery concept, [i5] proved to
be most helpfull, due to the extensive information provided. An important design feature is
the removal of heat, generated within the cells during use. This will be discussed next.
8.3.1 Thermal management
The Kokam cells have a pouch format, giving them a large surface for transferring heat to it’s
surroundings. In [23] it is proven that pouch cells show superior thermal management
properties in comparison with cylindrical and prismatic cells. For the URE05e battery, the
heat generation is in the order of 1 kW, which will be shown later. In Fig. 8.1 four different
cooling concepts are depicted. Concept I & II make use of internal cooling by air (I) or water
(II). For these concepts the cells need to be spaced, to allow the fluid to flow along the cells.
This is not preferable, since this will increase the volume of the battery, while the rear frame
offers little space. Moreover, concept II has a risk of leakage inside the battery, which could
lead to a short-circuit.
The other two concepts use highly conductive plates to transfer heat to the outside of the
battery, where it is removed by the vehicle air flow. With this priciple the containment
structure itself is used as a heat transferring medium. Concept IV is based on the use of a
Phase Change Material (PCM) inside the containment. This material (for example parafin) is
able to absorb an amount of heat by changing from solid to liquid. During this transition, the
temperature stays constant at the PCM melting point.
Although this is a very interesting cooling concept it is not regarded as applicable: since the
cells will be mounted with the terminals sideways, the liquid PCM may enter the terminal
area.
Concluding, concept III is taken for further development of the battery structure. The main
advantages are the compact layout and the combination of functions into 1 system (i.e. fixture
cell
cell
cell
cell
car air
flow
battery containment
PCM
cell
cell
cell
cell
car air
flow
battery containment
cell
cell
cell
cell
car air flow
battery containment
water/air heat exchanger
water pump
cell
cell
cell
cell
air fan battery containment
I ) III )
II ) IV )
Fig. 8.1. Four different concepts for cooling the battery.
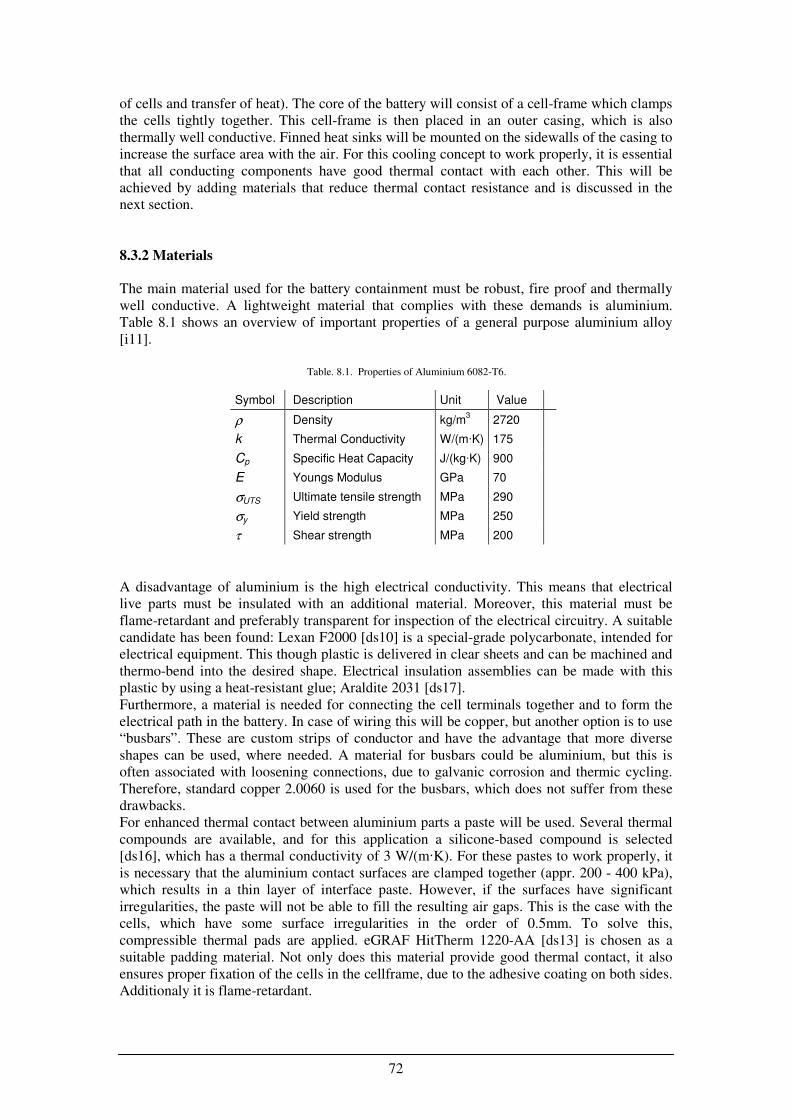
72
of cells and transfer of heat). The core of the battery will consist of a cell-frame which clamps
the cells tightly together. This cell-frame is then placed in an outer casing, which is also
thermally well conductive. Finned heat sinks will be mounted on the sidewalls of the casing to
increase the surface area with the air. For this cooling concept to work properly, it is essential
that all conducting components have good thermal contact with each other. This will be
achieved by adding materials that reduce thermal contact resistance and is discussed in the
next section.
8.3.2 Materials
The main material used for the battery containment must be robust, fire proof and thermally
well conductive. A lightweight material that complies with these demands is aluminium.
Table 8.1 shows an overview of important properties of a general purpose aluminium alloy
[i11].
Symbol Description Unit Value
ρ Density kg/m3 2720
k Thermal Conductivity W/(m·K) 175
Cp Specific Heat Capacity J/(kg·K) 900
E Youngs Modulus GPa 70
σUTS Ultimate tensile strength MPa 290
σy Yield strength MPa 250
τ Shear strength MPa 200
A disadvantage of aluminium is the high electrical conductivity. This means that electrical
live parts must be insulated with an additional material. Moreover, this material must be
flame-retardant and preferably transparent for inspection of the electrical circuitry. A suitable
candidate has been found: Lexan F2000 [ds10] is a special-grade polycarbonate, intended for
electrical equipment. This though plastic is delivered in clear sheets and can be machined and
thermo-bend into the desired shape. Electrical insulation assemblies can be made with this
plastic by using a heat-resistant glue; Araldite 2031 [ds17].
Furthermore, a material is needed for connecting the cell terminals together and to form the
electrical path in the battery. In case of wiring this will be copper, but another option is to use
“busbars”. These are custom strips of conductor and have the advantage that more diverse
shapes can be used, where needed. A material for busbars could be aluminium, but this is
often associated with loosening connections, due to galvanic corrosion and thermic cycling.
Therefore, standard copper 2.0060 is used for the busbars, which does not suffer from these
drawbacks.
For enhanced thermal contact between aluminium parts a paste will be used. Several thermal
compounds are available, and for this application a silicone-based compound is selected
[ds16], which has a thermal conductivity of 3 W/(m·K). For these pastes to work properly, it
is necessary that the aluminium contact surfaces are clamped together (appr. 200 - 400 kPa),
which results in a thin layer of interface paste. However, if the surfaces have significant
irregularities, the paste will not be able to fill the resulting air gaps. This is the case with the
cells, which have some surface irregularities in the order of 0.5mm. To solve this,
compressible thermal pads are applied. eGRAF HitTherm 1220-AA [ds13] is chosen as a
suitable padding material. Not only does this material provide good thermal contact, it also
ensures proper fixation of the cells in the cellframe, due to the adhesive coating on both sides.
Additionaly it is flame-retardant.
Table. 8.1. Properties of Aluminium 6082-T6.
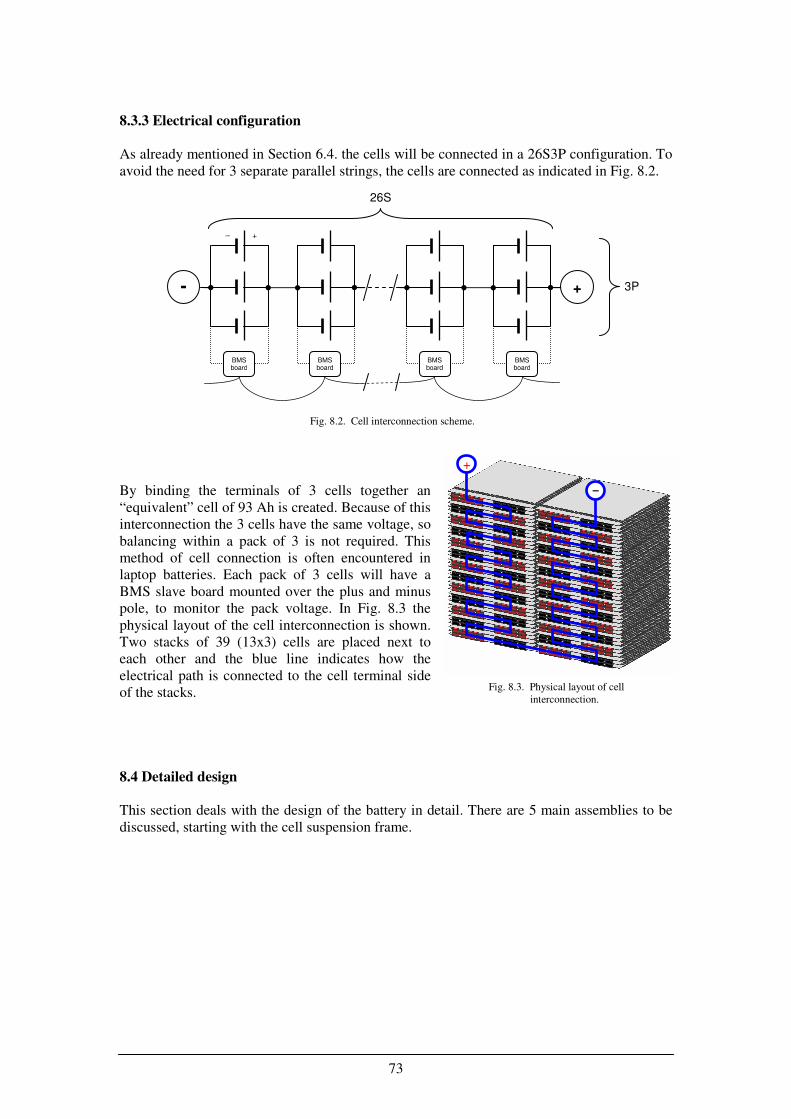
73
8.3.3 Electrical configuration
As already mentioned in Section 6.4. the cells will be connected in a 26S3P configuration. To
avoid the need for 3 separate parallel strings, the cells are connected as indicated in Fig. 8.2.
By binding the terminals of 3 cells together an
“equivalent” cell of 93 Ah is created. Because of this
interconnection the 3 cells have the same voltage, so
balancing within a pack of 3 is not required. This
method of cell connection is often encountered in
laptop batteries. Each pack of 3 cells will have a
BMS slave board mounted over the plus and minus
pole, to monitor the pack voltage. In Fig. 8.3 the
physical layout of the cell interconnection is shown.
Two stacks of 39 (13x3) cells are placed next to
each other and the blue line indicates how the
electrical path is connected to the cell terminal side
of the stacks.
8.4 Detailed design
This section deals with the design of the battery in detail. There are 5 main assemblies to be
discussed, starting with the cell suspension frame.
- +
– +
26S
3P
BMS board
BMS board
BMS board
BMS board
Fig. 8.2. Cell interconnection scheme.
+
–
Fig. 8.3. Physical layout of cell
interconnection.
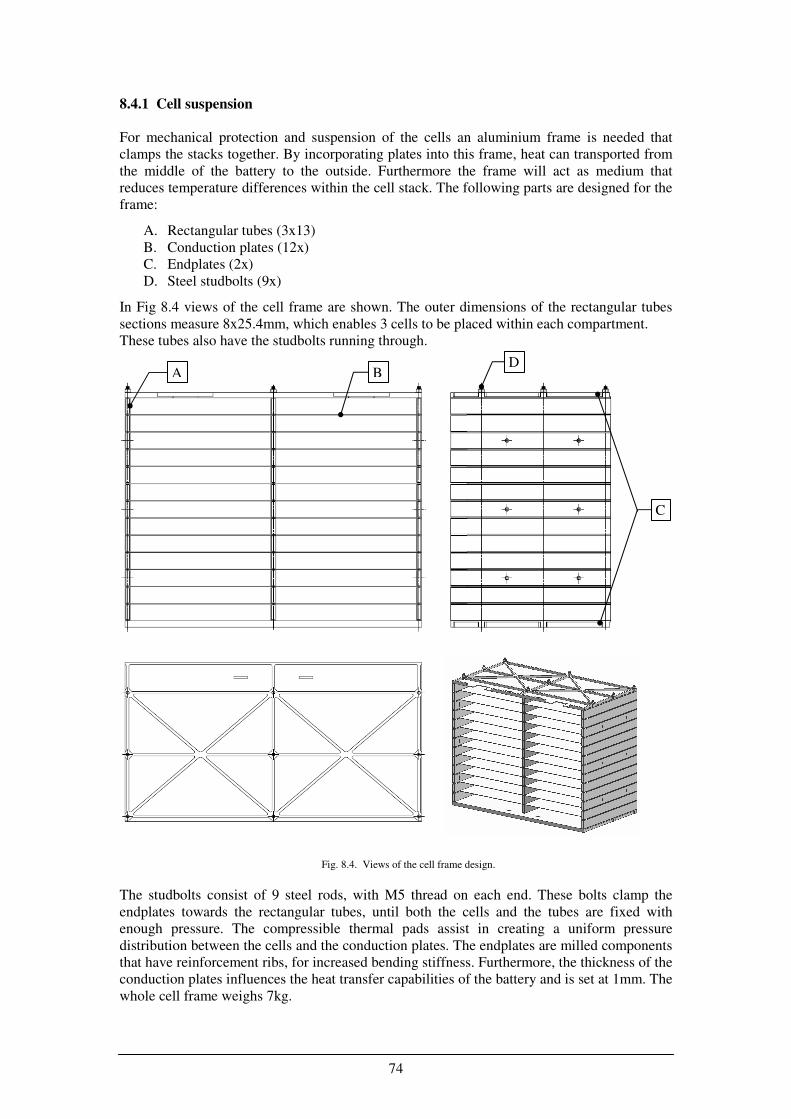
74
8.4.1 Cell suspension
For mechanical protection and suspension of the cells an aluminium frame is needed that
clamps the stacks together. By incorporating plates into this frame, heat can transported from
the middle of the battery to the outside. Furthermore the frame will act as medium that
reduces temperature differences within the cell stack. The following parts are designed for the
frame:
A. Rectangular tubes (3x13)
B. Conduction plates (12x)
C. Endplates (2x)
D. Steel studbolts (9x)
In Fig 8.4 views of the cell frame are shown. The outer dimensions of the rectangular tubes
sections measure 8x25.4mm, which enables 3 cells to be placed within each compartment.
These tubes also have the studbolts running through.
The studbolts consist of 9 steel rods, with M5 thread on each end. These bolts clamp the
endplates towards the rectangular tubes, until both the cells and the tubes are fixed with
enough pressure. The compressible thermal pads assist in creating a uniform pressure
distribution between the cells and the conduction plates. The endplates are milled components
that have reinforcement ribs, for increased bending stiffness. Furthermore, the thickness of the
conduction plates influences the heat transfer capabilities of the battery and is set at 1mm. The
whole cell frame weighs 7kg.
Fig. 8.4. Views of the cell frame design.
A B
C
D
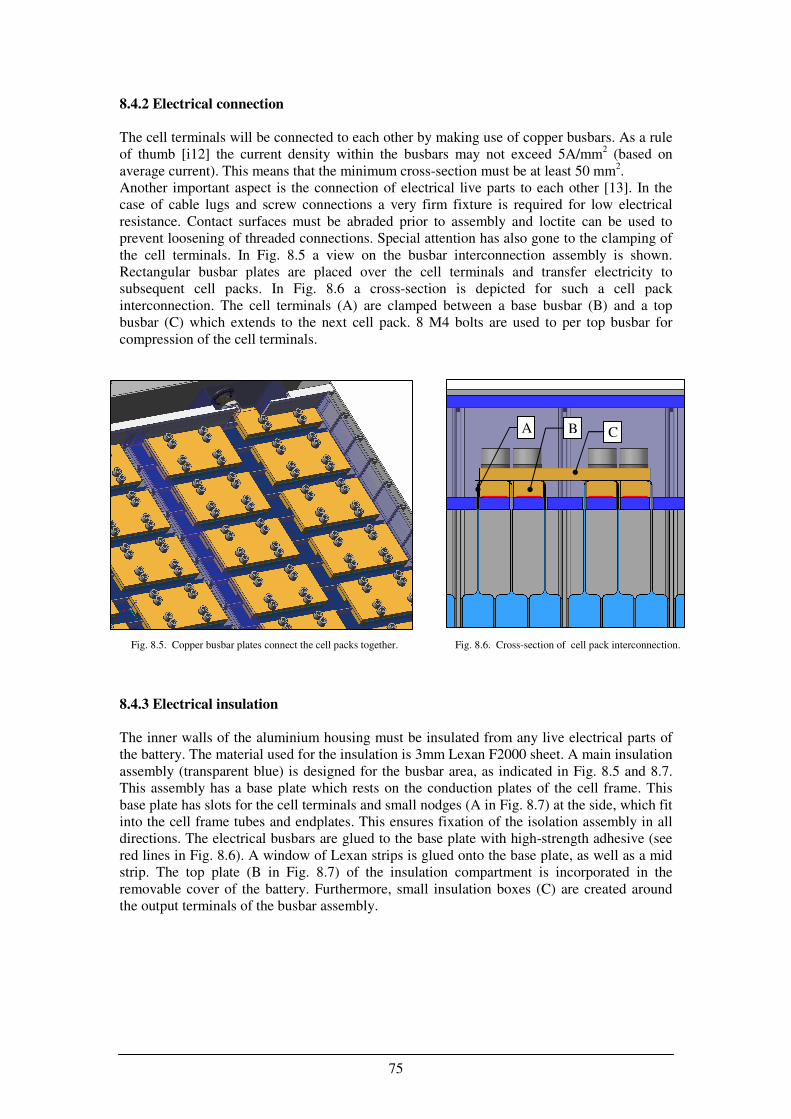
75
8.4.2 Electrical connection
The cell terminals will be connected to each other by making use of copper busbars. As a rule
of thumb [i12] the current density within the busbars may not exceed 5A/mm2 (based on
average current). This means that the minimum cross-section must be at least 50 mm2.
Another important aspect is the connection of electrical live parts to each other [13]. In the
case of cable lugs and screw connections a very firm fixture is required for low electrical
resistance. Contact surfaces must be abraded prior to assembly and loctite can be used to
prevent loosening of threaded connections. Special attention has also gone to the clamping of
the cell terminals. In Fig. 8.5 a view on the busbar interconnection assembly is shown.
Rectangular busbar plates are placed over the cell terminals and transfer electricity to
subsequent cell packs. In Fig. 8.6 a cross-section is depicted for such a cell pack
interconnection. The cell terminals (A) are clamped between a base busbar (B) and a top
busbar (C) which extends to the next cell pack. 8 M4 bolts are used to per top busbar for
compression of the cell terminals.
8.4.3 Electrical insulation
The inner walls of the aluminium housing must be insulated from any live electrical parts of
the battery. The material used for the insulation is 3mm Lexan F2000 sheet. A main insulation
assembly (transparent blue) is designed for the busbar area, as indicated in Fig. 8.5 and 8.7.
This assembly has a base plate which rests on the conduction plates of the cell frame. This
base plate has slots for the cell terminals and small nodges (A in Fig. 8.7) at the side, which fit
into the cell frame tubes and endplates. This ensures fixation of the isolation assembly in all
directions. The electrical busbars are glued to the base plate with high-strength adhesive (see
red lines in Fig. 8.6). A window of Lexan strips is glued onto the base plate, as well as a mid
strip. The top plate (B in Fig. 8.7) of the insulation compartment is incorporated in the
removable cover of the battery. Furthermore, small insulation boxes (C) are created around
the output terminals of the busbar assembly.
Fig. 8.5. Copper busbar plates connect the cell packs together. Fig. 8.6. Cross-section of cell pack interconnection.
C B A
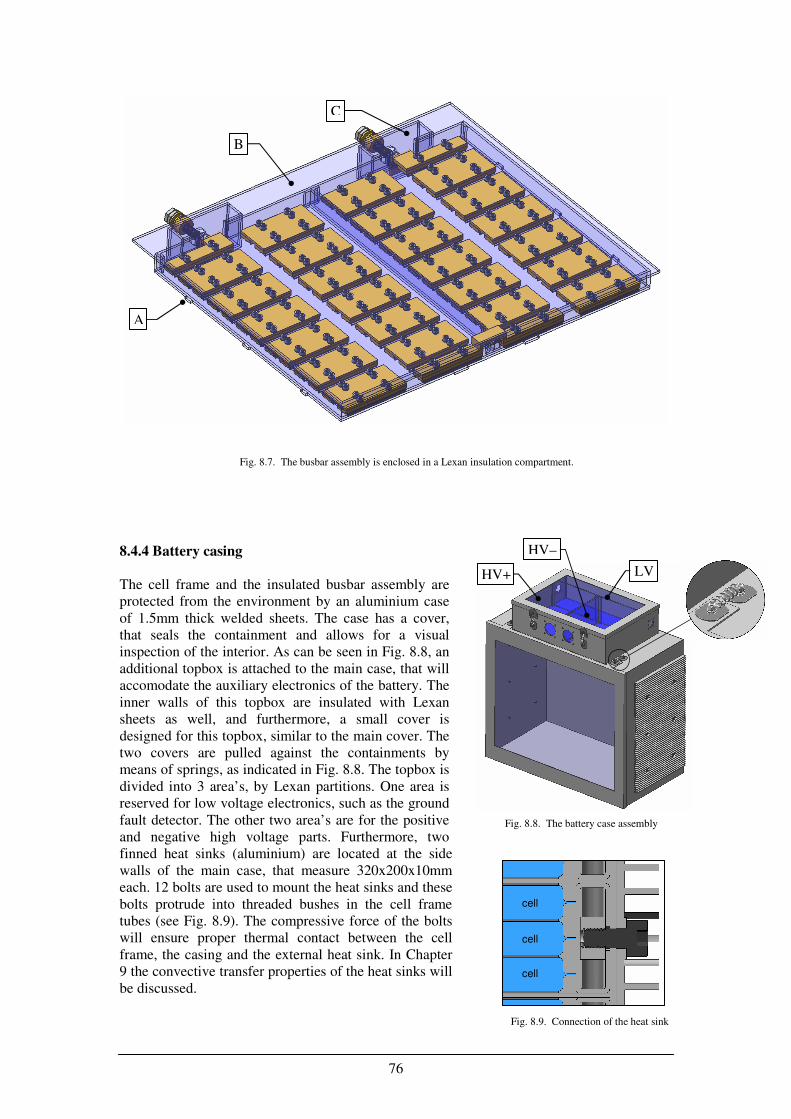
76
8.4.4 Battery casing
The cell frame and the insulated busbar assembly are
protected from the environment by an aluminium case
of 1.5mm thick welded sheets. The case has a cover,
that seals the containment and allows for a visual
inspection of the interior. As can be seen in Fig. 8.8, an
additional topbox is attached to the main case, that will
accomodate the auxiliary electronics of the battery. The
inner walls of this topbox are insulated with Lexan
sheets as well, and furthermore, a small cover is
designed for this topbox, similar to the main cover. The
two covers are pulled against the containments by
means of springs, as indicated in Fig. 8.8. The topbox is
divided into 3 area’s, by Lexan partitions. One area is
reserved for low voltage electronics, such as the ground
fault detector. The other two area’s are for the positive
and negative high voltage parts. Furthermore, two
finned heat sinks (aluminium) are located at the side
walls of the main case, that measure 320x200x10mm
each. 12 bolts are used to mount the heat sinks and these
bolts protrude into threaded bushes in the cell frame
tubes (see Fig. 8.9). The compressive force of the bolts
will ensure proper thermal contact between the cell
frame, the casing and the external heat sink. In Chapter
9 the convective transfer properties of the heat sinks will
be discussed.
A
B
C
Fig. 8.7. The busbar assembly is enclosed in a Lexan insulation compartment.
Fig. 8.8. The battery case assembly
HV+
HV–
LV
Fig. 8.9. Connection of the heat sink
cell
cell
cell
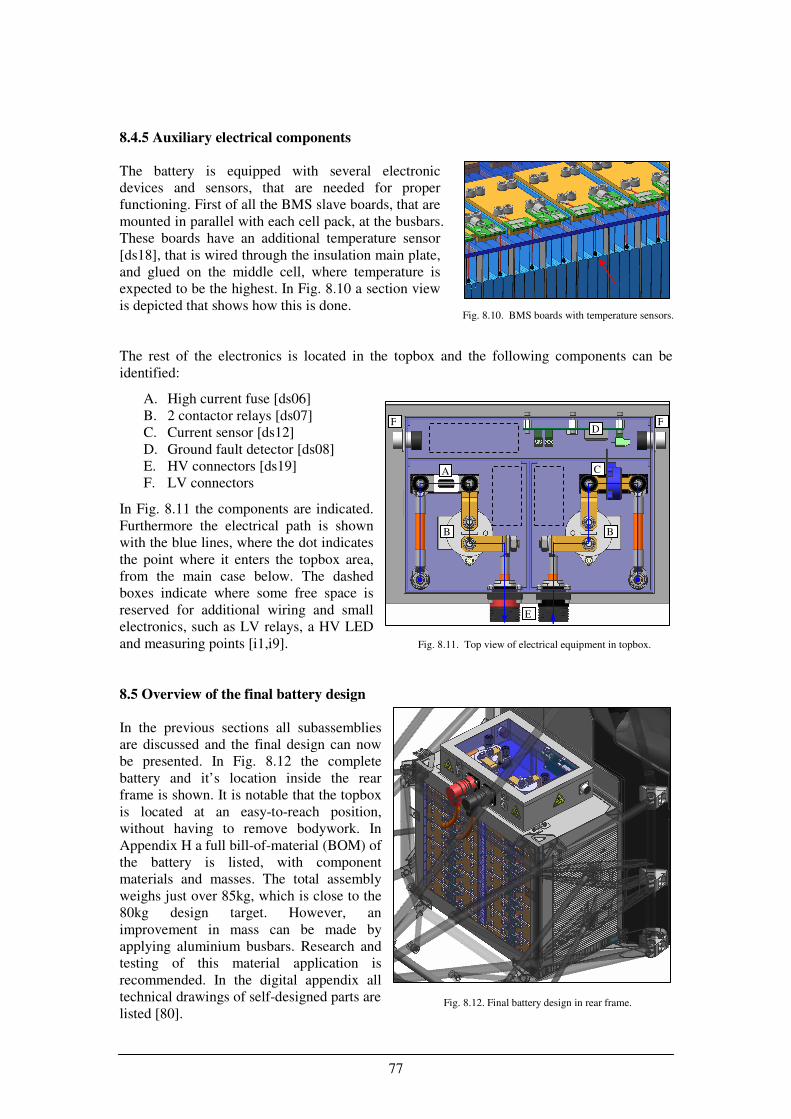
77
8.4.5 Auxiliary electrical components
The battery is equipped with several electronic
devices and sensors, that are needed for proper
functioning. First of all the BMS slave boards, that are
mounted in parallel with each cell pack, at the busbars.
These boards have an additional temperature sensor
[ds18], that is wired through the insulation main plate,
and glued on the middle cell, where temperature is
expected to be the highest. In Fig. 8.10 a section view
is depicted that shows how this is done.
The rest of the electronics is located in the topbox and the following components can be
identified:
A. High current fuse [ds06]
B. 2 contactor relays [ds07]
C. Current sensor [ds12]
D. Ground fault detector [ds08]
E. HV connectors [ds19]
F. LV connectors
In Fig. 8.11 the components are indicated.
Furthermore the electrical path is shown
with the blue lines, where the dot indicates
the point where it enters the topbox area,
from the main case below. The dashed
boxes indicate where some free space is
reserved for additional wiring and small
electronics, such as LV relays, a HV LED
and measuring points [i1,i9].
8.5 Overview of the final battery design
In the previous sections all subassemblies
are discussed and the final design can now
be presented. In Fig. 8.12 the complete
battery and it’s location inside the rear
frame is shown. It is notable that the topbox
is located at an easy-to-reach position,
without having to remove bodywork. In
Appendix H a full bill-of-material (BOM) of
the battery is listed, with component
materials and masses. The total assembly
weighs just over 85kg, which is close to the
80kg design target. However, an
improvement in mass can be made by
applying aluminium busbars. Research and
testing of this material application is
recommended. In the digital appendix all
technical drawings of self-designed parts are
listed [80].
Fig. 8.10. BMS boards with temperature sensors.
Fig. 8.11. Top view of electrical equipment in topbox.
Fig. 8.12. Final battery design in rear frame.
A
B B
C
D
E
F F
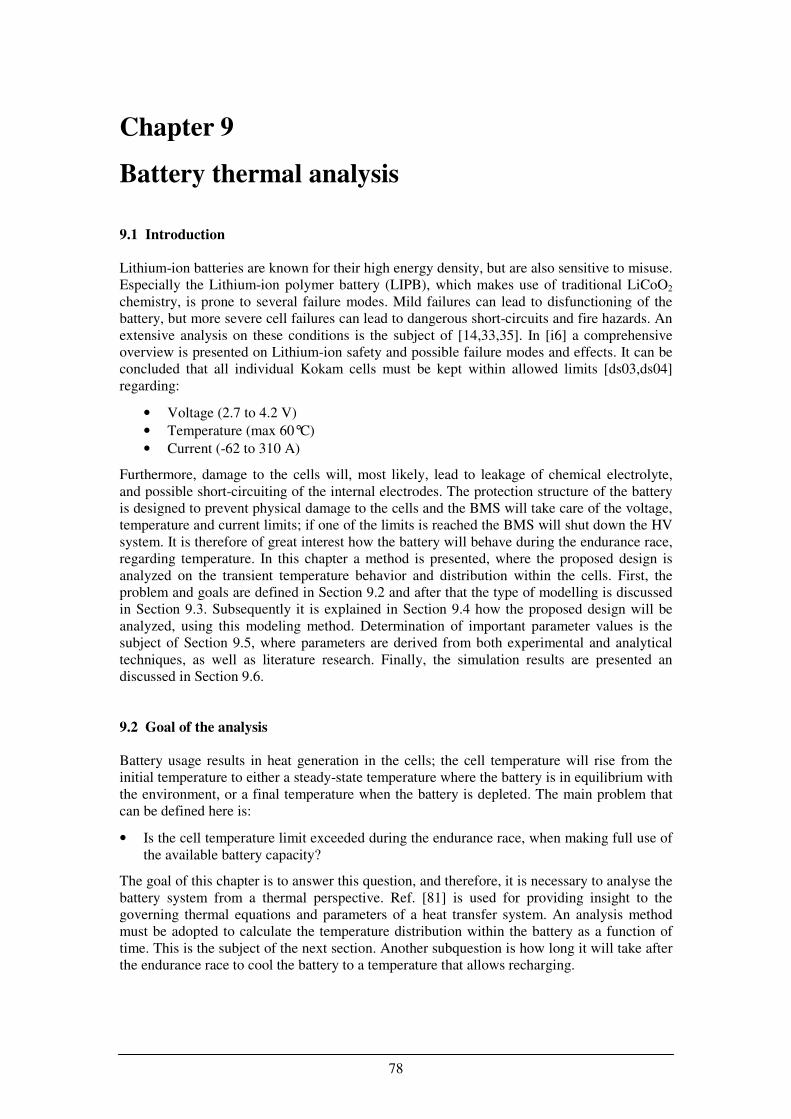
78
Chapter 9
Battery thermal analysis
9.1 Introduction
Lithium-ion batteries are known for their high energy density, but are also sensitive to misuse.
Especially the Lithium-ion polymer battery (LIPB), which makes use of traditional LiCoO2
chemistry, is prone to several failure modes. Mild failures can lead to disfunctioning of the
battery, but more severe cell failures can lead to dangerous short-circuits and fire hazards. An
extensive analysis on these conditions is the subject of [14,33,35]. In [i6] a comprehensive
overview is presented on Lithium-ion safety and possible failure modes and effects. It can be
concluded that all individual Kokam cells must be kept within allowed limits [ds03,ds04]
regarding:
• Voltage (2.7 to 4.2 V)
• Temperature (max 60°C)
• Current (-62 to 310 A)
Furthermore, damage to the cells will, most likely, lead to leakage of chemical electrolyte,
and possible short-circuiting of the internal electrodes. The protection structure of the battery
is designed to prevent physical damage to the cells and the BMS will take care of the voltage,
temperature and current limits; if one of the limits is reached the BMS will shut down the HV
system. It is therefore of great interest how the battery will behave during the endurance race,
regarding temperature. In this chapter a method is presented, where the proposed design is
analyzed on the transient temperature behavior and distribution within the cells. First, the
problem and goals are defined in Section 9.2 and after that the type of modelling is discussed
in Section 9.3. Subsequently it is explained in Section 9.4 how the proposed design will be
analyzed, using this modeling method. Determination of important parameter values is the
subject of Section 9.5, where parameters are derived from both experimental and analytical
techniques, as well as literature research. Finally, the simulation results are presented an
discussed in Section 9.6.
9.2 Goal of the analysis
Battery usage results in heat generation in the cells; the cell temperature will rise from the
initial temperature to either a steady-state temperature where the battery is in equilibrium with
the environment, or a final temperature when the battery is depleted. The main problem that
can be defined here is:
• Is the cell temperature limit exceeded during the endurance race, when making full use of
the available battery capacity?
The goal of this chapter is to answer this question, and therefore, it is necessary to analyse the
battery system from a thermal perspective. Ref. [81] is used for providing insight to the
governing thermal equations and parameters of a heat transfer system. An analysis method
must be adopted to calculate the temperature distribution within the battery as a function of
time. This is the subject of the next section. Another subquestion is how long it will take after
the endurance race to cool the battery to a temperature that allows recharging.
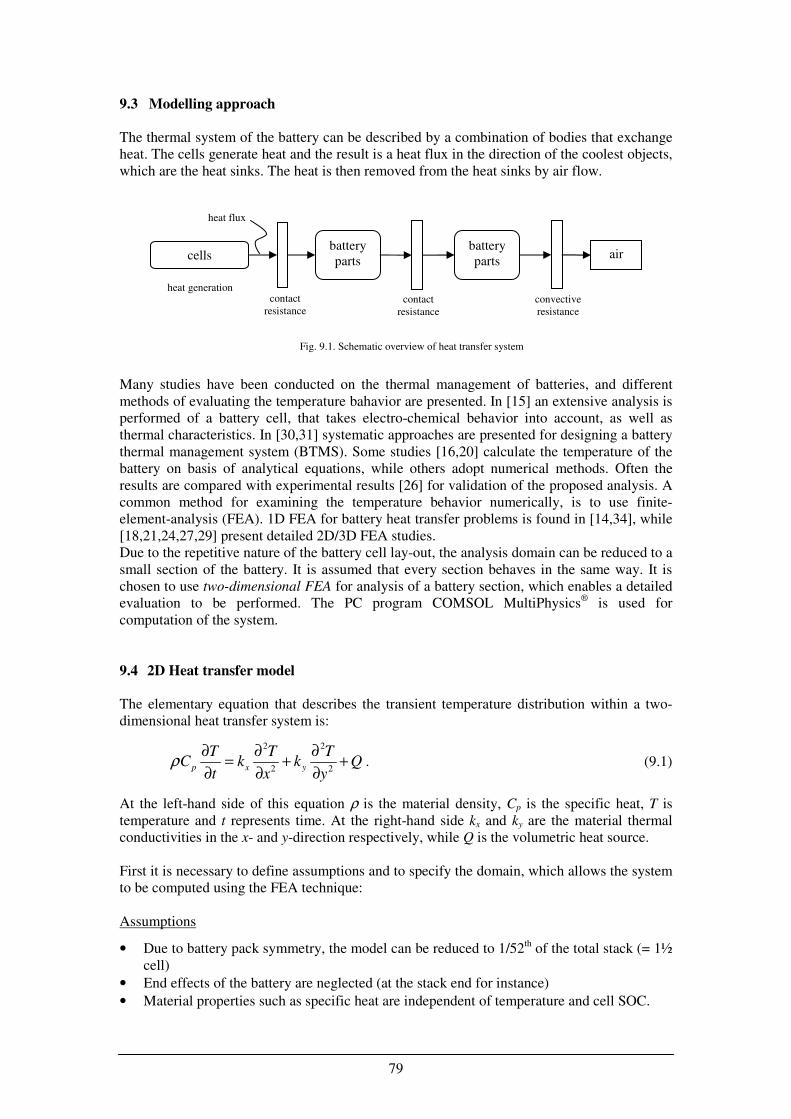
79
9.3 Modelling approach
The thermal system of the battery can be described by a combination of bodies that exchange
heat. The cells generate heat and the result is a heat flux in the direction of the coolest objects,
which are the heat sinks. The heat is then removed from the heat sinks by air flow.
Many studies have been conducted on the thermal management of batteries, and different
methods of evaluating the temperature bahavior are presented. In [15] an extensive analysis is
performed of a battery cell, that takes electro-chemical behavior into account, as well as
thermal characteristics. In [30,31] systematic approaches are presented for designing a battery
thermal management system (BTMS). Some studies [16,20] calculate the temperature of the
battery on basis of analytical equations, while others adopt numerical methods. Often the
results are compared with experimental results [26] for validation of the proposed analysis. A
common method for examining the temperature behavior numerically, is to use finite-
element-analysis (FEA). 1D FEA for battery heat transfer problems is found in [14,34], while
[18,21,24,27,29] present detailed 2D/3D FEA studies.
Due to the repetitive nature of the battery cell lay-out, the analysis domain can be reduced to a
small section of the battery. It is assumed that every section behaves in the same way. It is
chosen to use two-dimensional FEA for analysis of a battery section, which enables a detailed
evaluation to be performed. The PC program COMSOL MultiPhysics® is used for
computation of the system.
9.4 2D Heat transfer model
The elementary equation that describes the transient temperature distribution within a two-
dimensional heat transfer system is:
2 2
2 2p x y
T T TC k k Q
t x yρ
∂ ∂ ∂= + +
∂ ∂ ∂. (9.1)
At the left-hand side of this equation ρ is the material density, Cp is the specific heat, T is
temperature and t represents time. At the right-hand side kx and ky are the material thermal
conductivities in the x- and y-direction respectively, while Q is the volumetric heat source.
First it is necessary to define assumptions and to specify the domain, which allows the system
to be computed using the FEA technique:
Assumptions
• Due to battery pack symmetry, the model can be reduced to 1/52th of the total stack (= 1½
cell)
• End effects of the battery are neglected (at the stack end for instance)
• Material properties such as specific heat are independent of temperature and cell SOC.
cells battery
parts air
battery
parts
heat generation contact
resistance contact
resistance
convective
resistance
heat flux
Fig. 9.1. Schematic overview of heat transfer system
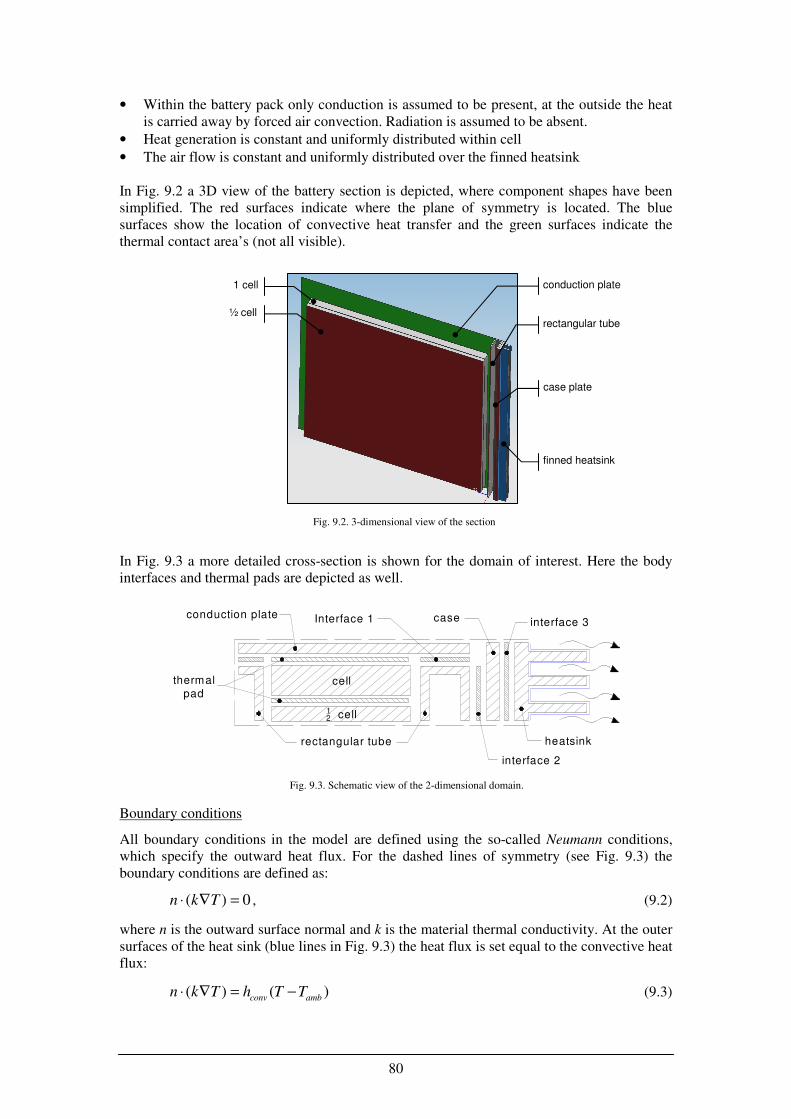
80
• Within the battery pack only conduction is assumed to be present, at the outside the heat
is carried away by forced air convection. Radiation is assumed to be absent.
• Heat generation is constant and uniformly distributed within cell
• The air flow is constant and uniformly distributed over the finned heatsink
In Fig. 9.2 a 3D view of the battery section is depicted, where component shapes have been
simplified. The red surfaces indicate where the plane of symmetry is located. The blue
surfaces show the location of convective heat transfer and the green surfaces indicate the
thermal contact area’s (not all visible).
In Fig. 9.3 a more detailed cross-section is shown for the domain of interest. Here the body
interfaces and thermal pads are depicted as well.
Boundary conditions
All boundary conditions in the model are defined using the so-called Neumann conditions,
which specify the outward heat flux. For the dashed lines of symmetry (see Fig. 9.3) the
boundary conditions are defined as:
( ) 0n k T⋅ ∇ = , (9.2)
where n is the outward surface normal and k is the material thermal conductivity. At the outer
surfaces of the heat sink (blue lines in Fig. 9.3) the heat flux is set equal to the convective heat
flux:
( ) ( )conv amb
n k T h T T⋅ ∇ = − (9.3)
conduction plate
finned heatsink
½ cell
1 cell
rectangular tube
case plate
Fig. 9.2. 3-dimensional view of the section
Fig. 9.3. Schematic view of the 2-dimensional domain.
conduction plate
rectangular tube
case
heatsink
Interface 1
interface 2
interface 3
cell
12 cell
thermalpad
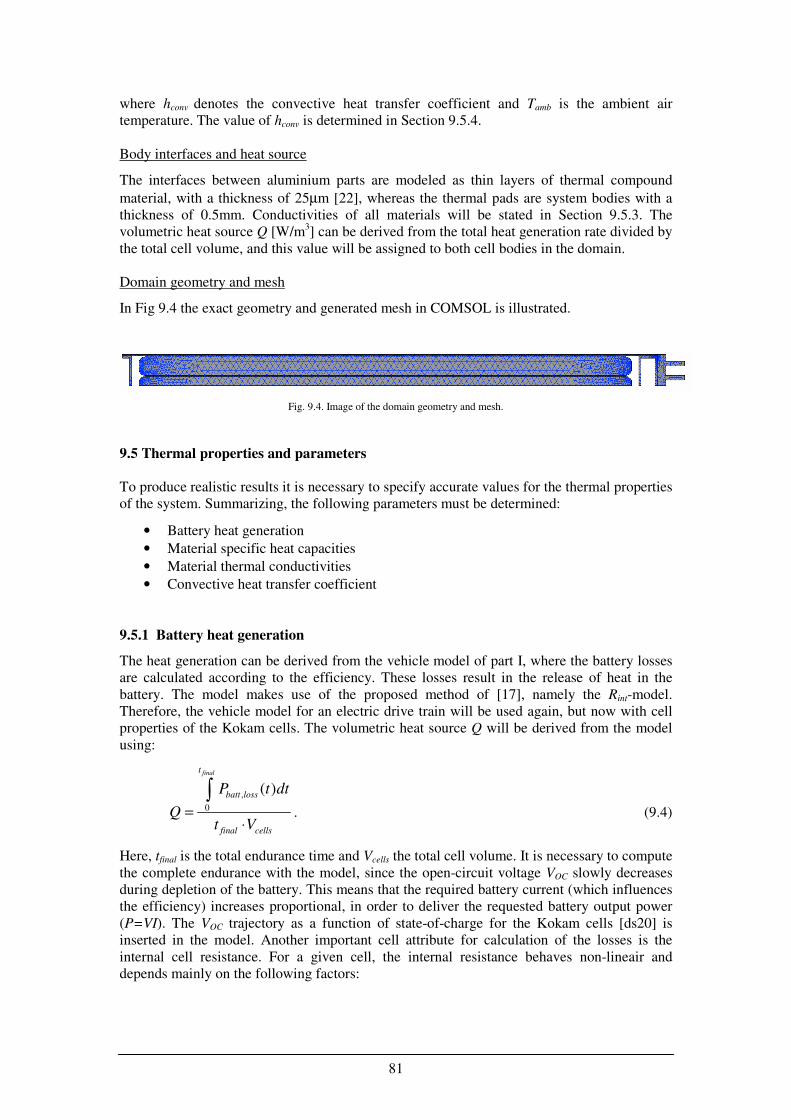
81
where hconv denotes the convective heat transfer coefficient and Tamb is the ambient air
temperature. The value of hconv is determined in Section 9.5.4.
Body interfaces and heat source
The interfaces between aluminium parts are modeled as thin layers of thermal compound
material, with a thickness of 25µm [22], whereas the thermal pads are system bodies with a
thickness of 0.5mm. Conductivities of all materials will be stated in Section 9.5.3. The
volumetric heat source Q [W/m3] can be derived from the total heat generation rate divided by
the total cell volume, and this value will be assigned to both cell bodies in the domain.
Domain geometry and mesh
In Fig 9.4 the exact geometry and generated mesh in COMSOL is illustrated.
9.5 Thermal properties and parameters
To produce realistic results it is necessary to specify accurate values for the thermal properties
of the system. Summarizing, the following parameters must be determined:
• Battery heat generation
• Material specific heat capacities
• Material thermal conductivities
• Convective heat transfer coefficient
9.5.1 Battery heat generation
The heat generation can be derived from the vehicle model of part I, where the battery losses
are calculated according to the efficiency. These losses result in the release of heat in the
battery. The model makes use of the proposed method of [17], namely the Rint-model.
Therefore, the vehicle model for an electric drive train will be used again, but now with cell
properties of the Kokam cells. The volumetric heat source Q will be derived from the model
using:
,
0
( )
finalt
batt loss
final cells
P t dt
Qt V
=⋅
∫. (9.4)
Here, tfinal is the total endurance time and Vcells the total cell volume. It is necessary to compute
the complete endurance with the model, since the open-circuit voltage VOC slowly decreases
during depletion of the battery. This means that the required battery current (which influences
the efficiency) increases proportional, in order to deliver the requested battery output power
(P=VI). The VOC trajectory as a function of state-of-charge for the Kokam cells [ds20] is
inserted in the model. Another important cell attribute for calculation of the losses is the
internal cell resistance. For a given cell, the internal resistance behaves non-lineair and
depends mainly on the following factors:
Fig. 9.4. Image of the domain geometry and mesh.
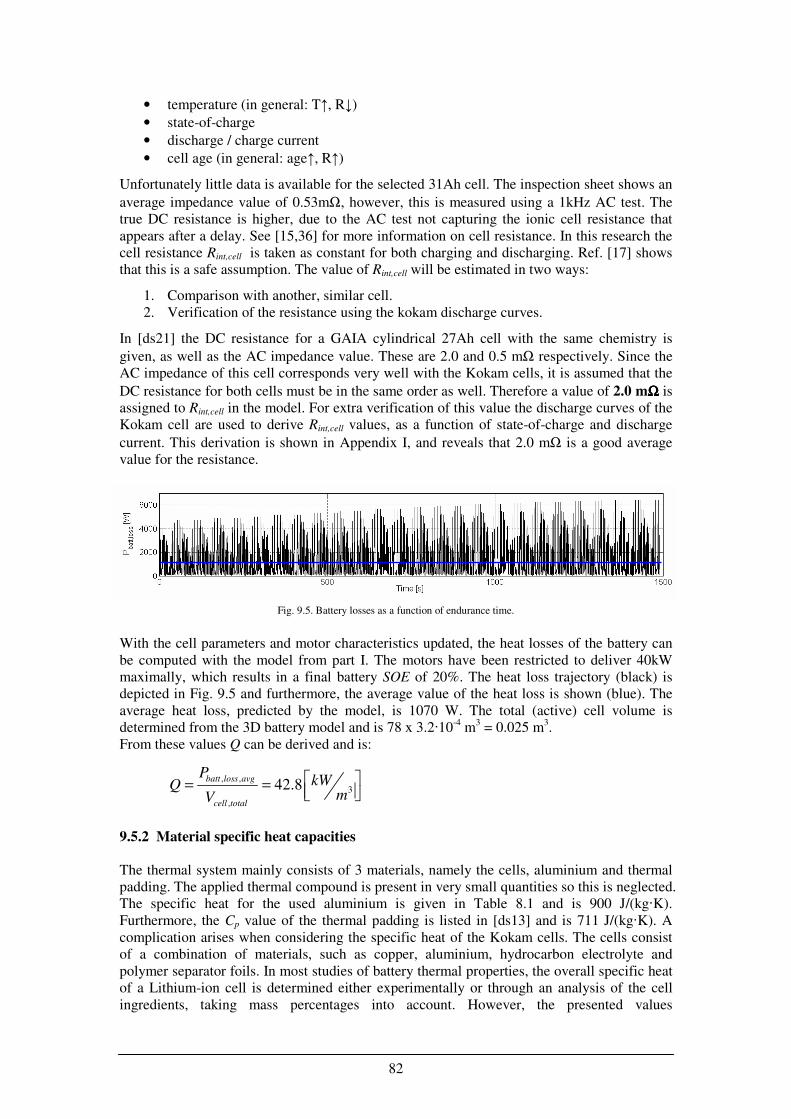
82
• temperature (in general: T↑, R↓)
• state-of-charge
• discharge / charge current
• cell age (in general: age↑, R↑)
Unfortunately little data is available for the selected 31Ah cell. The inspection sheet shows an
average impedance value of 0.53mΩ, however, this is measured using a 1kHz AC test. The
true DC resistance is higher, due to the AC test not capturing the ionic cell resistance that
appears after a delay. See [15,36] for more information on cell resistance. In this research the
cell resistance Rint,cell is taken as constant for both charging and discharging. Ref. [17] shows
that this is a safe assumption. The value of Rint,cell will be estimated in two ways:
1. Comparison with another, similar cell.
2. Verification of the resistance using the kokam discharge curves.
In [ds21] the DC resistance for a GAIA cylindrical 27Ah cell with the same chemistry is
given, as well as the AC impedance value. These are 2.0 and 0.5 mΩ respectively. Since the
AC impedance of this cell corresponds very well with the Kokam cells, it is assumed that the
DC resistance for both cells must be in the same order as well. Therefore a value of 2.0 mΩΩΩΩ is
assigned to Rint,cell in the model. For extra verification of this value the discharge curves of the
Kokam cell are used to derive Rint,cell values, as a function of state-of-charge and discharge
current. This derivation is shown in Appendix I, and reveals that 2.0 mΩ is a good average
value for the resistance.
With the cell parameters and motor characteristics updated, the heat losses of the battery can
be computed with the model from part I. The motors have been restricted to deliver 40kW
maximally, which results in a final battery SOE of 20%. The heat loss trajectory (black) is
depicted in Fig. 9.5 and furthermore, the average value of the heat loss is shown (blue). The
average heat loss, predicted by the model, is 1070 W. The total (active) cell volume is
determined from the 3D battery model and is 78 x 3.2·10-4
m3 = 0.025 m
3.
From these values Q can be derived and is:
, ,
3
,
42.8batt loss avg
cell total
PkWQ
mV = =
9.5.2 Material specific heat capacities
The thermal system mainly consists of 3 materials, namely the cells, aluminium and thermal
padding. The applied thermal compound is present in very small quantities so this is neglected.
The specific heat for the used aluminium is given in Table 8.1 and is 900 J/(kg·K).
Furthermore, the Cp value of the thermal padding is listed in [ds13] and is 711 J/(kg·K). A
complication arises when considering the specific heat of the Kokam cells. The cells consist
of a combination of materials, such as copper, aluminium, hydrocarbon electrolyte and
polymer separator foils. In most studies of battery thermal properties, the overall specific heat
of a Lithium-ion cell is determined either experimentally or through an analysis of the cell
ingredients, taking mass percentages into account. However, the presented values
Fig. 9.5. Battery losses as a function of endurance time.
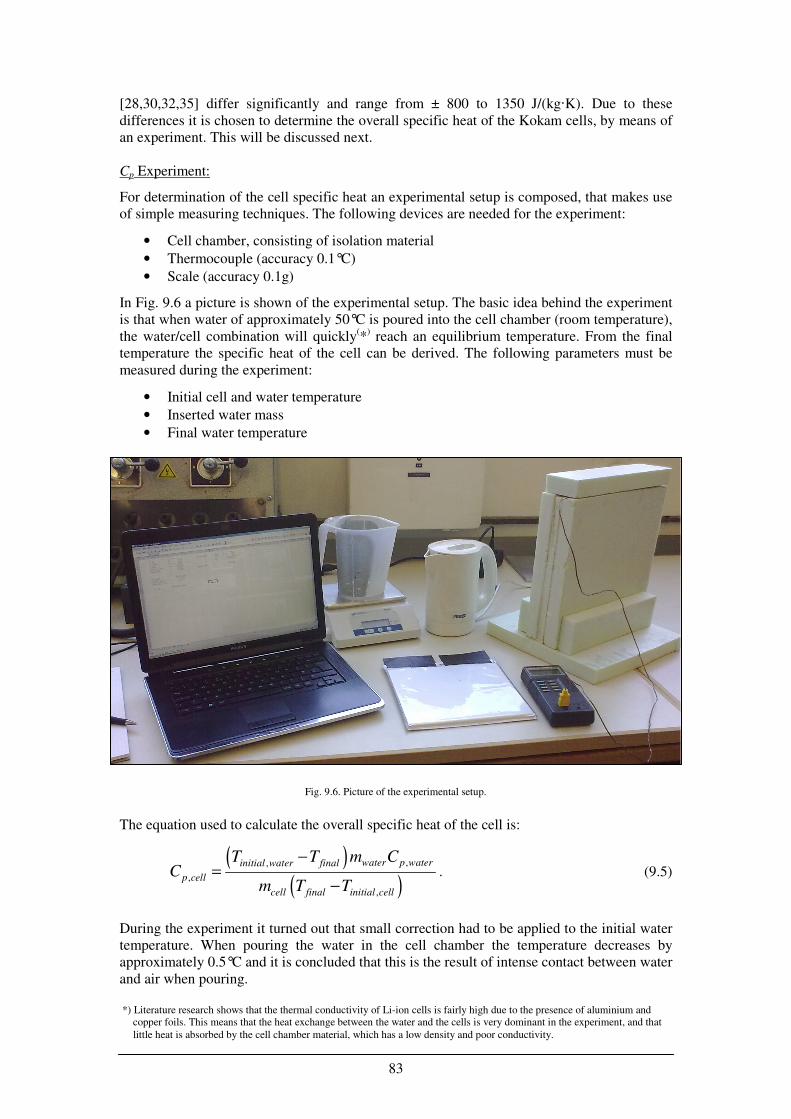
83
[28,30,32,35] differ significantly and range from ± 800 to 1350 J/(kg·K). Due to these
differences it is chosen to determine the overall specific heat of the Kokam cells, by means of
an experiment. This will be discussed next.
Cp Experiment:
For determination of the cell specific heat an experimental setup is composed, that makes use
of simple measuring techniques. The following devices are needed for the experiment:
• Cell chamber, consisting of isolation material
• Thermocouple (accuracy 0.1°C)
• Scale (accuracy 0.1g)
In Fig. 9.6 a picture is shown of the experimental setup. The basic idea behind the experiment
is that when water of approximately 50°C is poured into the cell chamber (room temperature),
the water/cell combination will quickly(*
) reach an equilibrium temperature. From the final
temperature the specific heat of the cell can be derived. The following parameters must be
measured during the experiment:
• Initial cell and water temperature
• Inserted water mass
• Final water temperature
The equation used to calculate the overall specific heat of the cell is:
( )( )
,,
,
,
water p waterinitial water final
p cell
cell final initial cell
T T m CC
m T T
−=
−. (9.5)
During the experiment it turned out that small correction had to be applied to the initial water
temperature. When pouring the water in the cell chamber the temperature decreases by
approximately 0.5°C and it is concluded that this is the result of intense contact between water
and air when pouring.
Fig. 9.6. Picture of the experimental setup.
*) Literature research shows that the thermal conductivity of Li-ion cells is fairly high due to the presence of aluminium and
copper foils. This means that the heat exchange between the water and the cells is very dominant in the experiment, and that
little heat is absorbed by the cell chamber material, which has a low density and poor conductivity.
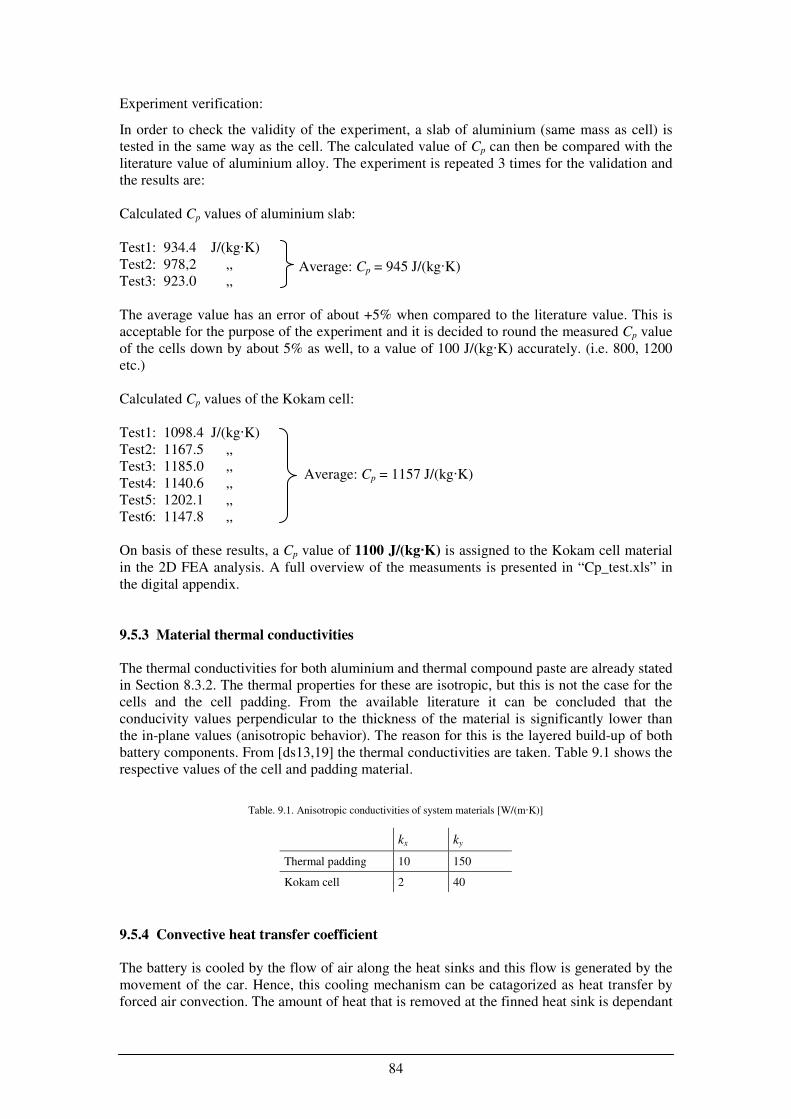
84
Experiment verification:
In order to check the validity of the experiment, a slab of aluminium (same mass as cell) is
tested in the same way as the cell. The calculated value of Cp can then be compared with the
literature value of aluminium alloy. The experiment is repeated 3 times for the validation and
the results are:
Calculated Cp values of aluminium slab:
Test1: 934.4 J/(kg·K)
Test2: 978,2 ,,
Test3: 923.0 ,,
The average value has an error of about +5% when compared to the literature value. This is
acceptable for the purpose of the experiment and it is decided to round the measured Cp value
of the cells down by about 5% as well, to a value of 100 J/(kg·K) accurately. (i.e. 800, 1200
etc.)
Calculated Cp values of the Kokam cell:
Test1: 1098.4 J/(kg·K)
Test2: 1167.5 ,,
Test3: 1185.0 ,,
Test4: 1140.6 ,,
Test5: 1202.1 ,,
Test6: 1147.8 ,,
On basis of these results, a Cp value of 1100 J/(kg·K) is assigned to the Kokam cell material
in the 2D FEA analysis. A full overview of the measuments is presented in “Cp_test.xls” in
the digital appendix.
9.5.3 Material thermal conductivities
The thermal conductivities for both aluminium and thermal compound paste are already stated
in Section 8.3.2. The thermal properties for these are isotropic, but this is not the case for the
cells and the cell padding. From the available literature it can be concluded that the
conducivity values perpendicular to the thickness of the material is significantly lower than
the in-plane values (anisotropic behavior). The reason for this is the layered build-up of both
battery components. From [ds13,19] the thermal conductivities are taken. Table 9.1 shows the
respective values of the cell and padding material.
kx ky
Thermal padding 10 150
Kokam cell 2 40
9.5.4 Convective heat transfer coefficient
The battery is cooled by the flow of air along the heat sinks and this flow is generated by the
movement of the car. Hence, this cooling mechanism can be catagorized as heat transfer by
forced air convection. The amount of heat that is removed at the finned heat sink is dependant
Average: Cp = 945 J/(kg·K)
Average: Cp = 1157 J/(kg·K)
Table. 9.1. Anisotropic conductivities of system materials [W/(m·K)]
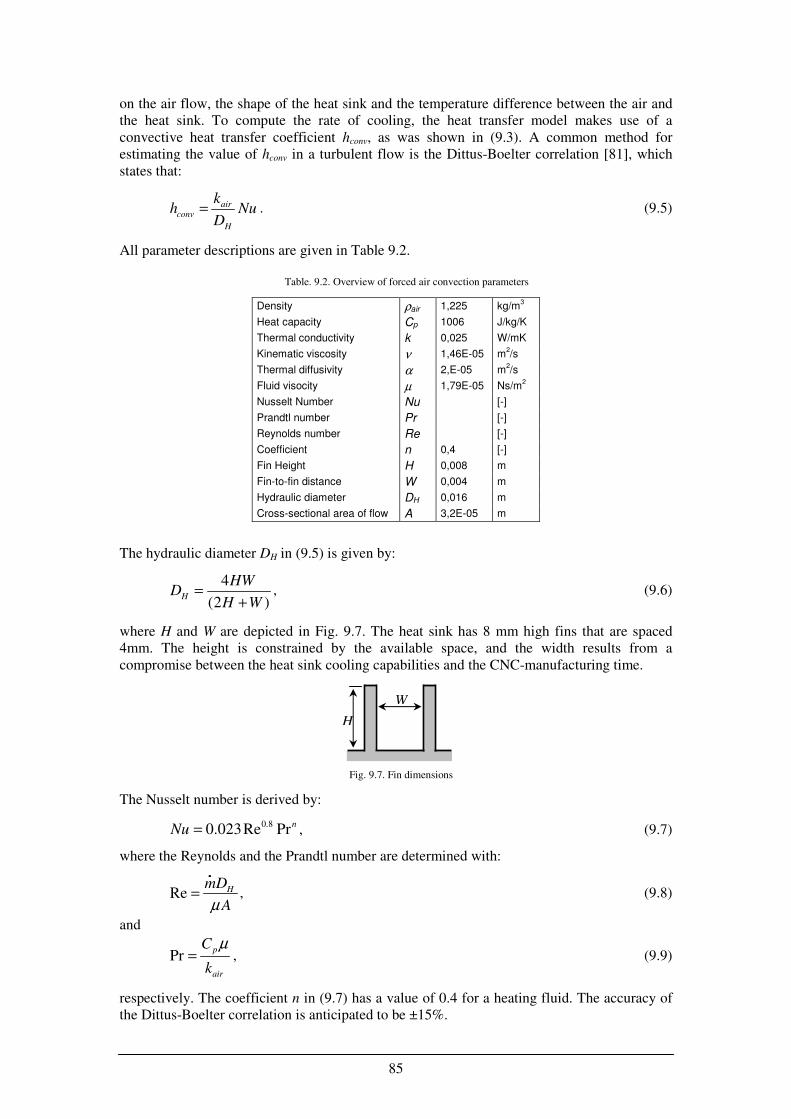
85
on the air flow, the shape of the heat sink and the temperature difference between the air and
the heat sink. To compute the rate of cooling, the heat transfer model makes use of a
convective heat transfer coefficient hconv, as was shown in (9.3). A common method for
estimating the value of hconv in a turbulent flow is the Dittus-Boelter correlation [81], which
states that:
airconv
H
kh Nu
D= . (9.5)
All parameter descriptions are given in Table 9.2.
The hydraulic diameter DH in (9.5) is given by:
4
(2 )H
HWD
H W=
+, (9.6)
where H and W are depicted in Fig. 9.7. The heat sink has 8 mm high fins that are spaced
4mm. The height is constrained by the available space, and the width results from a
compromise between the heat sink cooling capabilities and the CNC-manufacturing time.
The Nusselt number is derived by:
0.80.023Re PrnNu = , (9.7)
where the Reynolds and the Prandtl number are determined with:
Re HmD
Aµ= , (9.8)
and
Prp
air
C
k
µ= , (9.9)
respectively. The coefficient n in (9.7) has a value of 0.4 for a heating fluid. The accuracy of
the Dittus-Boelter correlation is anticipated to be ±15%.
Density ρair 1,225 kg/m3
Heat capacity Cp 1006 J/kg/K
Thermal conductivity k 0,025 W/mK
Kinematic viscosity ν 1,46E-05 m2/s
Thermal diffusivity α 2,E-05 m2/s
Fluid visocity µ 1,79E-05 Ns/m2
Nusselt Number Nu [-]
Prandtl number Pr [-]
Reynolds number Re [-]
Coefficient n 0,4 [-]
Fin Height H 0,008 m
Fin-to-fin distance W 0,004 m
Hydraulic diameter DH 0,016 m
Cross-sectional area of flow A 3,2E-05 m
W
H
Fig. 9.7. Fin dimensions
Table. 9.2. Overview of forced air convection parameters
.
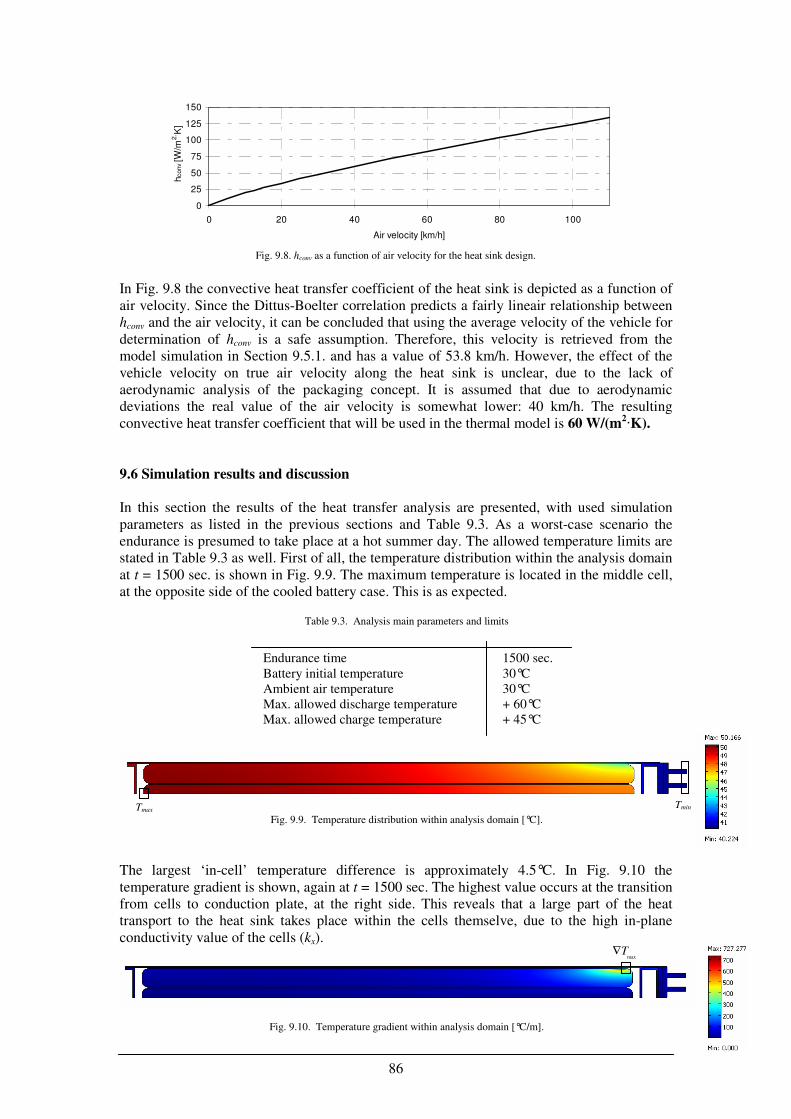
86
In Fig. 9.8 the convective heat transfer coefficient of the heat sink is depicted as a function of
air velocity. Since the Dittus-Boelter correlation predicts a fairly lineair relationship between
hconv and the air velocity, it can be concluded that using the average velocity of the vehicle for
determination of hconv is a safe assumption. Therefore, this velocity is retrieved from the
model simulation in Section 9.5.1. and has a value of 53.8 km/h. However, the effect of the
vehicle velocity on true air velocity along the heat sink is unclear, due to the lack of
aerodynamic analysis of the packaging concept. It is assumed that due to aerodynamic
deviations the real value of the air velocity is somewhat lower: 40 km/h. The resulting
convective heat transfer coefficient that will be used in the thermal model is 60 W/(m2·K).
9.6 Simulation results and discussion
In this section the results of the heat transfer analysis are presented, with used simulation
parameters as listed in the previous sections and Table 9.3. As a worst-case scenario the
endurance is presumed to take place at a hot summer day. The allowed temperature limits are
stated in Table 9.3 as well. First of all, the temperature distribution within the analysis domain
at t = 1500 sec. is shown in Fig. 9.9. The maximum temperature is located in the middle cell,
at the opposite side of the cooled battery case. This is as expected.
Endurance time 1500 sec.
Battery initial temperature 30°C
Ambient air temperature 30°C
Max. allowed discharge temperature + 60°C
Max. allowed charge temperature + 45°C
The largest ‘in-cell’ temperature difference is approximately 4.5°C. In Fig. 9.10 the
temperature gradient is shown, again at t = 1500 sec. The highest value occurs at the transition
from cells to conduction plate, at the right side. This reveals that a large part of the heat
transport to the heat sink takes place within the cells themselve, due to the high in-plane
conductivity value of the cells (kx).
Table 9.3. Analysis main parameters and limits
0
25
50
75
100
125
150
0 20 40 60 80 100
Air velocity [km/h]
hconv [W
/m2. K
]
Fig. 9.8. hconv as a function of air velocity for the heat sink design.
Fig. 9.9. Temperature distribution within analysis domain [°C].
Tmax Tmin
Fig. 9.10. Temperature gradient within analysis domain [°C/m].
maxT∇
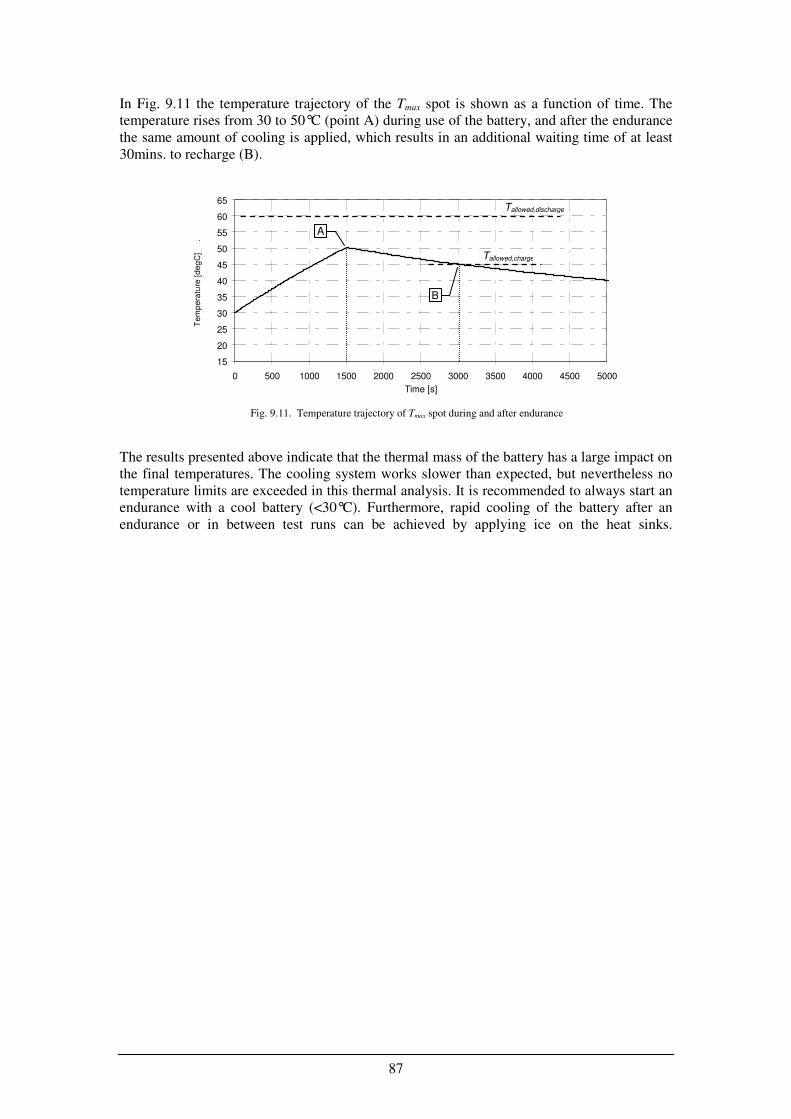
87
In Fig. 9.11 the temperature trajectory of the Tmax spot is shown as a function of time. The
temperature rises from 30 to 50°C (point A) during use of the battery, and after the endurance
the same amount of cooling is applied, which results in an additional waiting time of at least
30mins. to recharge (B).
The results presented above indicate that the thermal mass of the battery has a large impact on
the final temperatures. The cooling system works slower than expected, but nevertheless no
temperature limits are exceeded in this thermal analysis. It is recommended to always start an
endurance with a cool battery (<30°C). Furthermore, rapid cooling of the battery after an
endurance or in between test runs can be achieved by applying ice on the heat sinks.
Fig. 9.11. Temperature trajectory of Tmax spot during and after endurance
15
20
25
30
35
40
45
50
55
60
65
0 500 1000 1500 2000 2500 3000 3500 4000 4500 5000
Time [s]
Tem
pera
ture
[d
eg
C]
.
A
Tallowed,discharge
Tallowed,charge
B
88
Chapter 10
Closing
Inspired by the decision of University Racing Eindhoven to take part in the class1A Formula
Student competition, this report presents an extensive study on the development of an energy
efficient high performance drive train. The conclusions of this study are presented in this
chapter, and recommendations for future research and development are given.
10.1 Conclusions
The report is split up into three parts, and hence conclusions will be given accordingly:
Part I
Three alternative drive train topologies have been evaluated as possible candidates for the
new race car and are:
• Full electric
• Parallel hybrid
• Series hybrid
Furthermore, a standard drive train based on a petrol-powered internal combustion engine, is
used as a benchmark. For this purpose a method is developed that compares the drive trains,
by calculation of both lap time and energy consumption. Because of the absence of a
prescribed driving cycle, the method incorporates computation of the velocity profile on a
predetermined track, by describing the race car as a bicycle model and calculating the vehicle
dynamics numerically. The energy usage is determined through evaluation of drive train
component efficiencies. By varying the maximum available drive power, an overview is
created of the capabilities of each drive train, which allows the user to compare the candidates
of interest effectively.
In this research, the full electric and parallel hybrid drive train scored best, with estimated fuel
savings in the order of 20 – 40%, in comparison with the benchmark ICE drive train. On basis
of the evaluation results and practical arguments the decision is made to develop a rear-wheel-
driven electric race car.
Besides being used as a tool for the comparison of the drive trains stated above, the modeling
method can also be used to evaluate for instance:
• different component technologies
• energy saving methods and strategies
Furthermore optimization studies can be done for different circuits, as well simulating
acceleration times. These features make the proposed method not only helpful for use within
the URE team, but also for other parties that conduct research on performance vehicles, where
energy consumption plays a role.
89
Part II
The chosen drive train concept is translated in Part II to a complete vehicle concept, where the
URE05 race car chassis serves as a starting point. Firstly, important design specification have
been defined, and are:
• vehicle mass: < 260kg
• load distribution: 47/53% (front/rear)
• top speed: 100km/h
• acceleration 0-75m: < 4.5 seconds.
From these specifications and the competition rules, suitable components have been searched
for, that are able to realize the desired concept. The selected main components that form the
electric drive train are:
• 2 independant 35 kW PMDC drive motors
• 2 matching controllers, with torque control capabilities
• A 9kWh battery package, consisting of 78 Lithium-ion polymer cells, with a pouch
format.
With these components, a packaging lay-out has been designed, in which all components are
located in the steel tube rear frame. The result is a compact and lightweight drive train that
weighs 140 kg, including rear frame modifications. The new race car is expected to have a
mass of approximately 250 kg and is called the URE05e. Furthermore, calculations show that
the final weight distribution is very close (± 2%) to the design target.
Part III
Finally, a battery is designed and thermally analysed in detail, where again the model of Part I
served as a tool for parameter extraction. The main guidelines for design were the competition
rules and selected design targets. The battery design is characterized by an aluminium
containment, in combination with polycarbonate insulation parts and vital electronics.
Cooling is taken care of by internal conduction through aluminium plates and external
removal of heat by air cooled heatsinks. It is expected that the battery will have a mass of
85kg.
Subsequently, the battery design has been analyzed thermally, with the intent of determining
the highest temperature during the endurance. For this purpose a two-dimensional heat
transfer model has been composed, that is able to compute the battery design’s time-
dependant thermal behavior. It can be concluded that the battery will stay within the allowed
temperature limits (60°C), although the cooling system was anticipated to be more effective
than the simulation results predicted. The expected maximum temperature rise in the battery
is approximately 20°C.
10.2. Recommendations
Some open issues and other suggestions for improvements are the following.
Part I
The model can be adapted in several ways to produce more accurate results. These are:
• Include longitudinal wheel slip, which results in an additional loss factor.
• The bicycle model may be replaced by a two-track model (i.e. 4 wheels). This will enable
to incorporate lateral load transfer, which has a reducing effect on the cornering velocity.
90
• Addition of corners with a variable curvature; calculate tyre forces with combined slip
conditions at each step. This results in a more realistic velocity profile and drive train
operation points.
• The ICE internal losses during braking are not taken into account. This can be added and
will have a reducing effect on the amount of regenerative braking for the parallel hybrid
topology.
• The HV electrical wiring also introduces drive train losses, but are not modeled in this
report. It is advised to perform research on a suitable method to implement this.
• The modeling in Part I uses an empty URE05 mass, that was estimated too high. A more
accurate determination is necessary before starting to simulate results.
• The drive train inertia’s have not been modeled. It is recommended to implement this,
either by an additional vehicle mass factor, or direct calculation of the induced inertia
torque.
In general, a method for model validation must be searched for. With this validation, aspects
that absolutely must be taken into account, can be identified. Meanwhile, other aspects may
be excluded. In my opinion, the goal is to have an uncomplicated model, that is still able to
provide the results of interest accurately.
Part II
• A difficult issue during the design stage was the following; the URE05e makes use of a
rear frame that was originally intended for an internal combustion engine. Furthermore,
this particular rear frame design was not fully matched with the rear suspension design,
which originated from the URE04. These circumstances have lead to some design
compromises. It is therefore recommended to start an extensive research on a new design
concept, that fully focusses on an electric drive train. This concept can be applied to
succesors of the URE05e. For instance, an improvement can be a battery suspension, that
allows for quick replacement of the battery. All-Wheel-Drive is also a very interesting
option to investigate.
• It appeared that an enhanced version of the LEM200 motor is available; the AGNI 95R.
Although this motor has the same maximum power output, it employs a maximum speed
of 6000 RPM, which allows for a higher continuous current, due to increased air cooling.
• An advantage of drive trains is the ability to test them in advance on a test bench, without
having to wait for a fully finished vehicle. It is therefore advised to further optimize the
test bench at the EPE lab, by incorporating a high current supply and a fully automated
operation of the setup.
Part III
• The cooling of the current battery design can be enhanced by applying air ventilation in
the busbar area. However, waterproofness must be guaranteed.
• It is recommended to build a small test setup for battery cells, where experiments on the
thermal and electrical behavior can be conducted. Simulation of an endurance in a cell
test setup is an interesting option in this regard.
• For a new chassis design more space must be reserved for the battery. This allows for
internal air cooling, which is expected to be the most effective (and still lightweight)
cooling method.
• To reduce the battery weight, the following materials are advised to utilize in the next
design:
o Carbon Fibre Reinforced Plastic (CFRP) containment, with flame-retardant resin.
o Aluminium busbar material, using safe and robust interconnection methods.
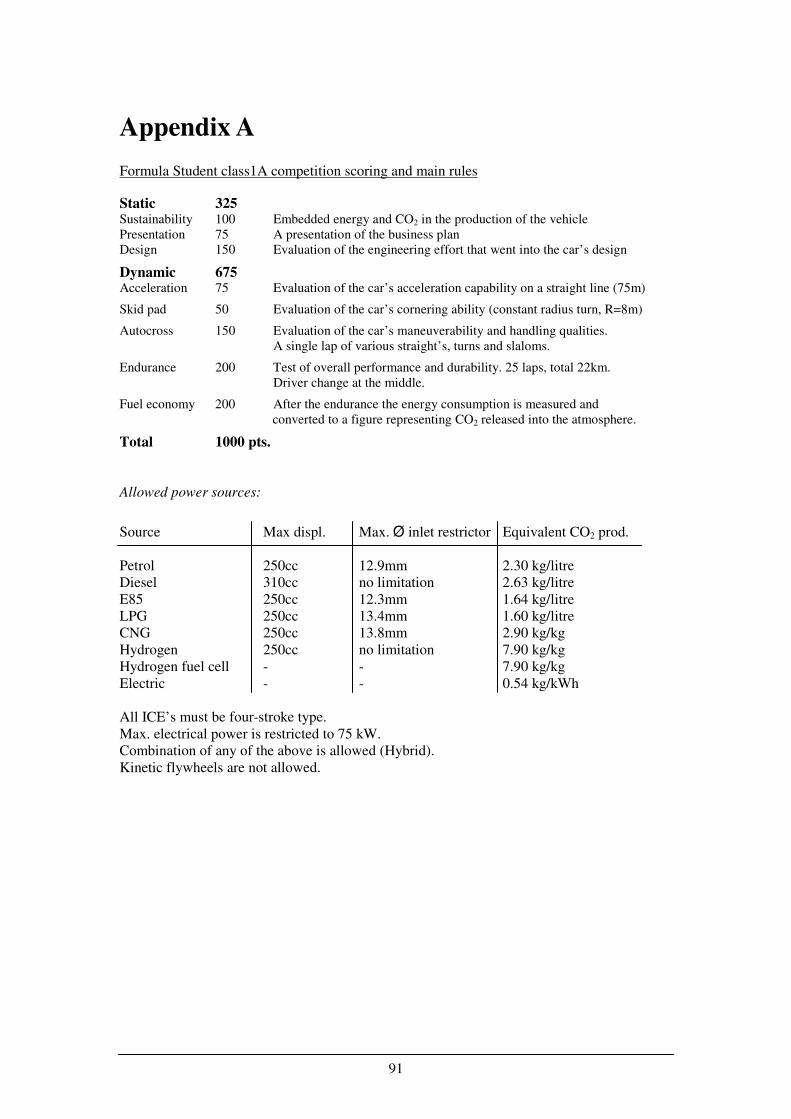
91
Appendix A
Formula Student class1A competition scoring and main rules
Static 325 Sustainability 100 Embedded energy and CO2 in the production of the vehicle
Presentation 75 A presentation of the business plan
Design 150 Evaluation of the engineering effort that went into the car’s design
Dynamic 675 Acceleration 75 Evaluation of the car’s acceleration capability on a straight line (75m)
Skid pad 50 Evaluation of the car’s cornering ability (constant radius turn, R=8m)
Autocross 150 Evaluation of the car’s maneuverability and handling qualities.
A single lap of various straight’s, turns and slaloms.
Endurance 200 Test of overall performance and durability. 25 laps, total 22km.
Driver change at the middle.
Fuel economy 200 After the endurance the energy consumption is measured and
converted to a figure representing CO2 released into the atmosphere.
Total 1000 pts.
Allowed power sources:
Source Max displ. Max. Ø inlet restrictor Equivalent CO2 prod.
Petrol 250cc 12.9mm 2.30 kg/litre
Diesel 310cc no limitation 2.63 kg/litre
E85 250cc 12.3mm 1.64 kg/litre
LPG 250cc 13.4mm 1.60 kg/litre
CNG 250cc 13.8mm 2.90 kg/kg
Hydrogen 250cc no limitation 7.90 kg/kg
Hydrogen fuel cell - - 7.90 kg/kg
Electric - - 0.54 kg/kWh
All ICE’s must be four-stroke type.
Max. electrical power is restricted to 75 kW.
Combination of any of the above is allowed (Hybrid).
Kinetic flywheels are not allowed.
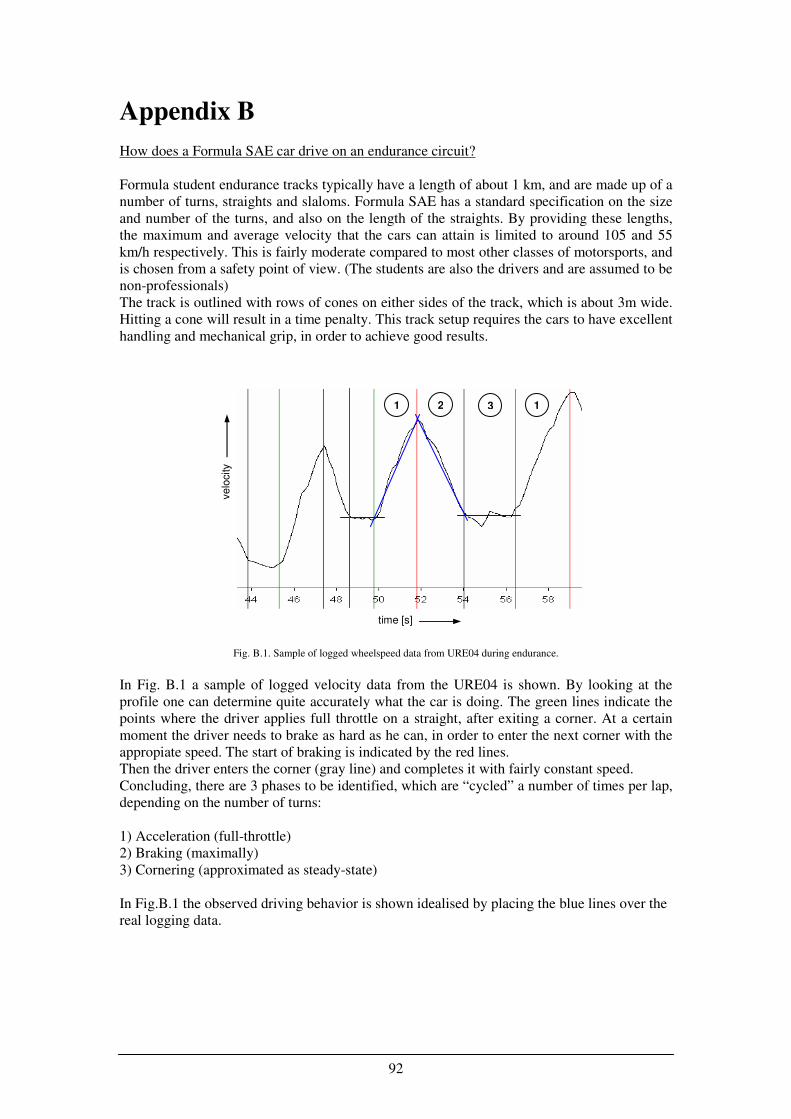
92
Appendix B
How does a Formula SAE car drive on an endurance circuit?
Formula student endurance tracks typically have a length of about 1 km, and are made up of a
number of turns, straights and slaloms. Formula SAE has a standard specification on the size
and number of the turns, and also on the length of the straights. By providing these lengths,
the maximum and average velocity that the cars can attain is limited to around 105 and 55
km/h respectively. This is fairly moderate compared to most other classes of motorsports, and
is chosen from a safety point of view. (The students are also the drivers and are assumed to be
non-professionals)
The track is outlined with rows of cones on either sides of the track, which is about 3m wide.
Hitting a cone will result in a time penalty. This track setup requires the cars to have excellent
handling and mechanical grip, in order to achieve good results.
Fig. B.1. Sample of logged wheelspeed data from URE04 during endurance.
In Fig. B.1 a sample of logged velocity data from the URE04 is shown. By looking at the
profile one can determine quite accurately what the car is doing. The green lines indicate the
points where the driver applies full throttle on a straight, after exiting a corner. At a certain
moment the driver needs to brake as hard as he can, in order to enter the next corner with the
appropiate speed. The start of braking is indicated by the red lines.
Then the driver enters the corner (gray line) and completes it with fairly constant speed.
Concluding, there are 3 phases to be identified, which are “cycled” a number of times per lap,
depending on the number of turns:
1) Acceleration (full-throttle)
2) Braking (maximally)
3) Cornering (approximated as steady-state)
In Fig.B.1 the observed driving behavior is shown idealised by placing the blue lines over the
real logging data.
time [s]
1 3 2 1
velo
city
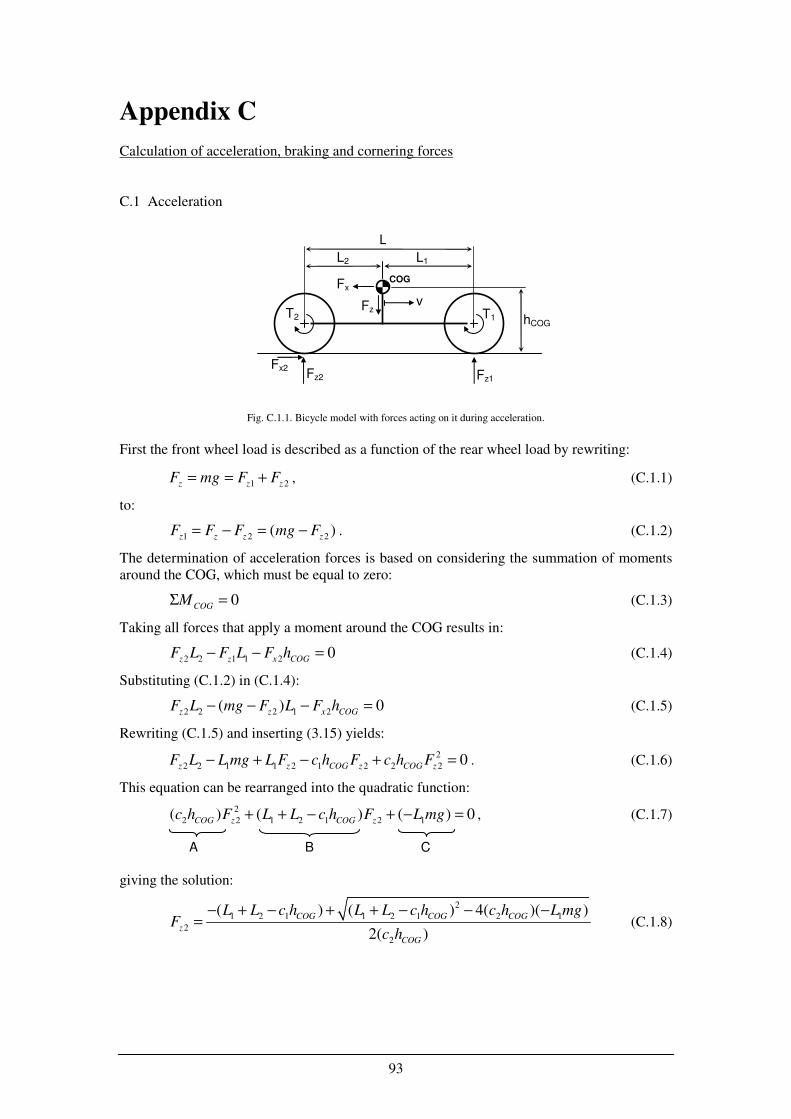
93
Appendix C
Calculation of acceleration, braking and cornering forces
C.1 Acceleration
Fig. C.1.1. Bicycle model with forces acting on it during acceleration.
First the front wheel load is described as a function of the rear wheel load by rewriting:
1 2z z zF mg F F= = + , (C.1.1)
to:
1 2 2( )z z z z
F F F mg F= − = − . (C.1.2)
The determination of acceleration forces is based on considering the summation of moments
around the COG, which must be equal to zero:
0COG
MΣ = (C.1.3)
Taking all forces that apply a moment around the COG results in:
2 2 1 1 2 0z z x COG
F L F L F h− − = (C.1.4)
Substituting (C.1.2) in (C.1.4):
2 2 2 1 2( ) 0z z x COG
F L mg F L F h− − − = (C.1.5)
Rewriting (C.1.5) and inserting (3.15) yields:
2
2 2 1 1 2 1 2 2 2 0z z COG z COG z
F L L mg L F c h F c h F− + − + = . (C.1.6)
This equation can be rearranged into the quadratic function:
2
2 2 1 2 1 2 1( ) ( ) ( ) 0COG z COG z
c h F L L c h F L mg+ + − + − = , (C.1.7)
A B C
giving the solution:
2
1 2 1 1 2 1 2 1
2
2
( ) ( ) 4( )( )
2( )
COG COG COG
z
COG
L L c h L L c h c h L mgF
c h
− + − + + − − −= (C.1.8)
COG
L
L2
hCOG
v
Fx2 Fz2 Fz1
T2 T1 Fz
Fx
L1
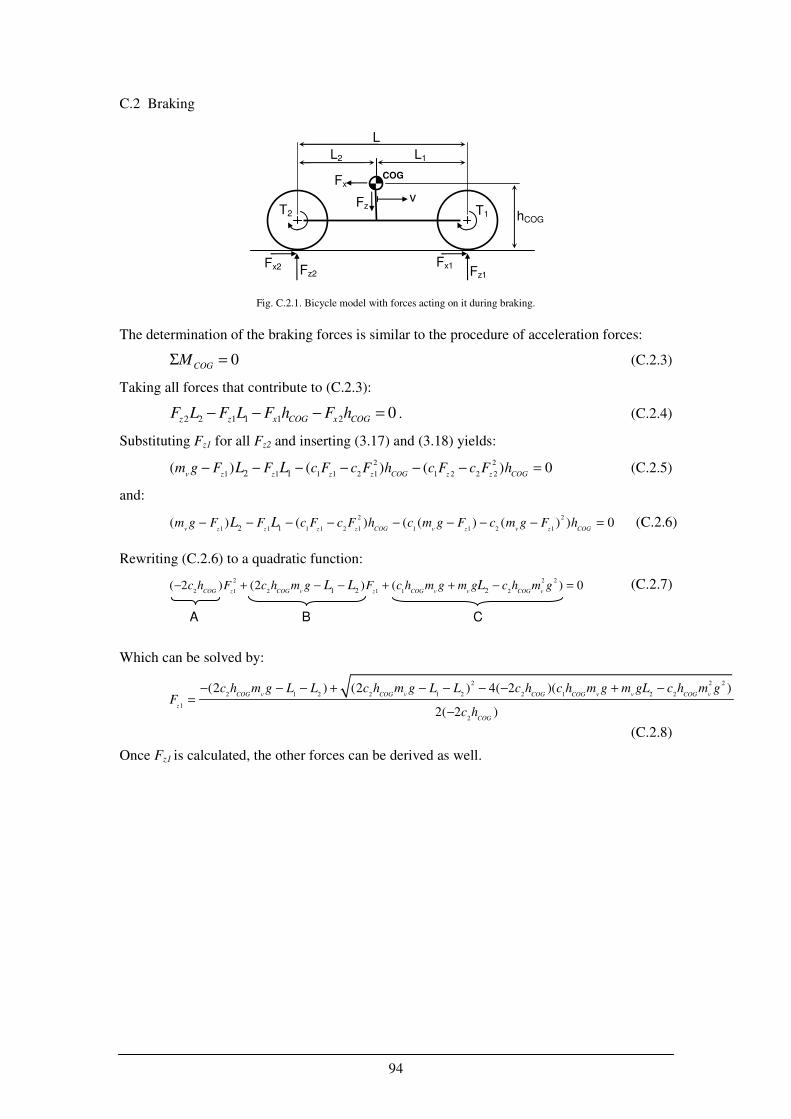
94
C.2 Braking
Fig. C.2.1. Bicycle model with forces acting on it during braking.
The determination of the braking forces is similar to the procedure of acceleration forces:
0COG
MΣ = (C.2.3)
Taking all forces that contribute to (C.2.3):
2 2 1 1 1 2 0z z x COG x COGF L F L F h F h− − − = . (C.2.4)
Substituting Fz1 for all Fz2 and inserting (3.17) and (3.18) yields:
2 2
1 1 1 1 2 1 1 2 2 22 1( ) ( ) ( ) 0v z z z z COG z z COG
m g F F c F c F h c F c F hL L− − − − − − = (C.2.5)
and:
2 2
1 1 1 1 2 1 1 1 2 12 1( ) ( ) ( ( ) ( ) ) 0
v z z z z COG v z v z COGm g F F c F c F h c m g F c m g F hL L− − − − − − − − = (C.2.6)
Rewriting (C.2.6) to a quadratic function:
2 2 2
2 1 2 1 1 21 2 2( 2 ) (2 ) ( ) 0
COG z COG v z COG v v COG vc h F c h m g F c h m g m g c h m gL L L− + − − + + − = (C.2.7)
A B C
Which can be solved by:
2 2 2
2 1 2 2 1 2 2 1 2 2
1
2
(2 ) (2 ) 4( 2 )( )
2( 2 )
COG v COG v COG COG v v COG v
z
COG
c h m g L L c h m g L L c h c h m g m gL c h m gF
c h
− − − + − − − − + −=
−
(C.2.8)
Once Fz1 is calculated, the other forces can be derived as well.
COG
L
L2
hCOG
v
Fx2 Fz2 Fx1
Fz1
T2 T1 Fz
Fx
L1
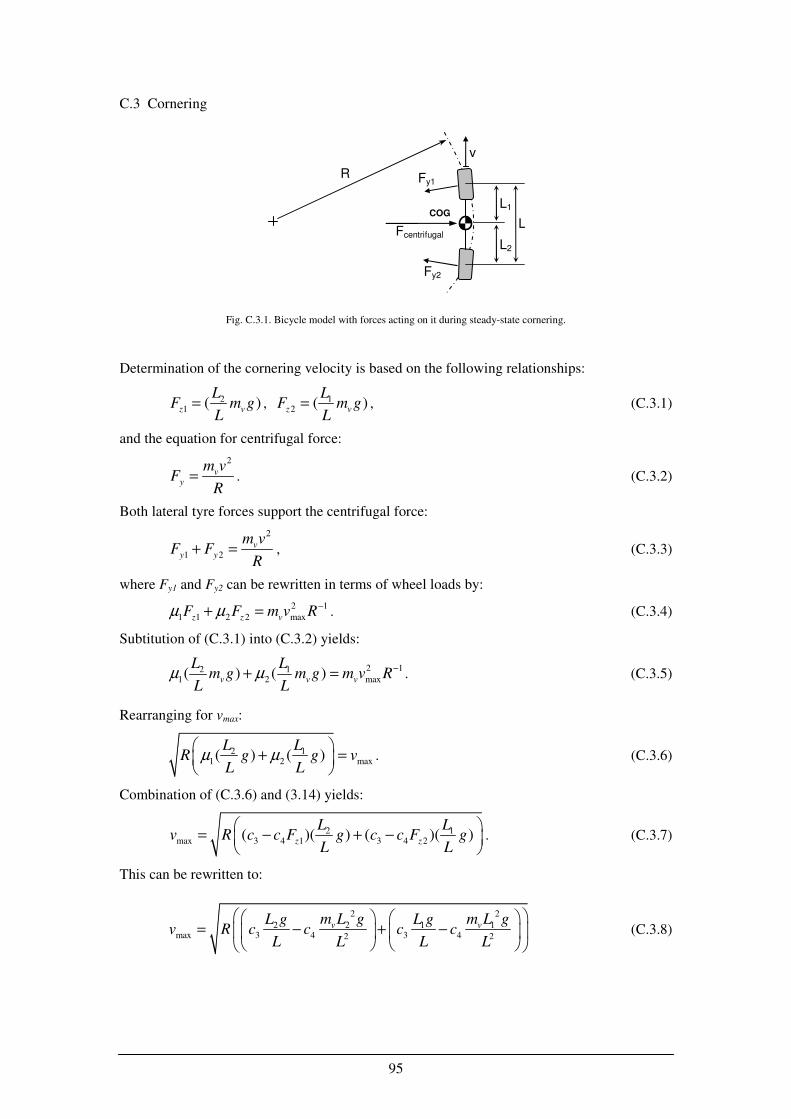
95
C.3 Cornering
Fig. C.3.1. Bicycle model with forces acting on it during steady-state cornering.
Determination of the cornering velocity is based on the following relationships:
21 ( )
z v
LF m g
L= , 1
2 ( )z v
LF m g
L= , (C.3.1)
and the equation for centrifugal force:
2
vy
m vF
R= . (C.3.2)
Both lateral tyre forces support the centrifugal force:
2
1 2v
y y
m vF F
R+ = , (C.3.3)
where Fy1 and Fy2 can be rewritten in terms of wheel loads by:
2 1
1 1 2 2 maxz z vF F m v Rµ µ −+ = . (C.3.4)
Subtitution of (C.3.1) into (C.3.2) yields:
2 12 11 2 max( ) ( )
v v v
L Lm g m g m v R
L Lµ µ −+ = . (C.3.5)
Rearranging for vmax:
2 11 2 max( ) ( )
L LR g g v
L Lµ µ
+ =
. (C.3.6)
Combination of (C.3.6) and (3.14) yields:
2 1max 3 4 1 3 4 2( )( ) ( )( )
z z
L Lv R c c F g c c F g
L L
= − + −
. (C.3.7)
This can be rewritten to:
2 2
2 12 1max 3 4 3 42 2
v vm L g m L gL g L g
v R c c c cL L L L
= − + −
(C.3.8)
L
v
COG
Fcentrifugal
R
Fy2
L1
L2
Fy1
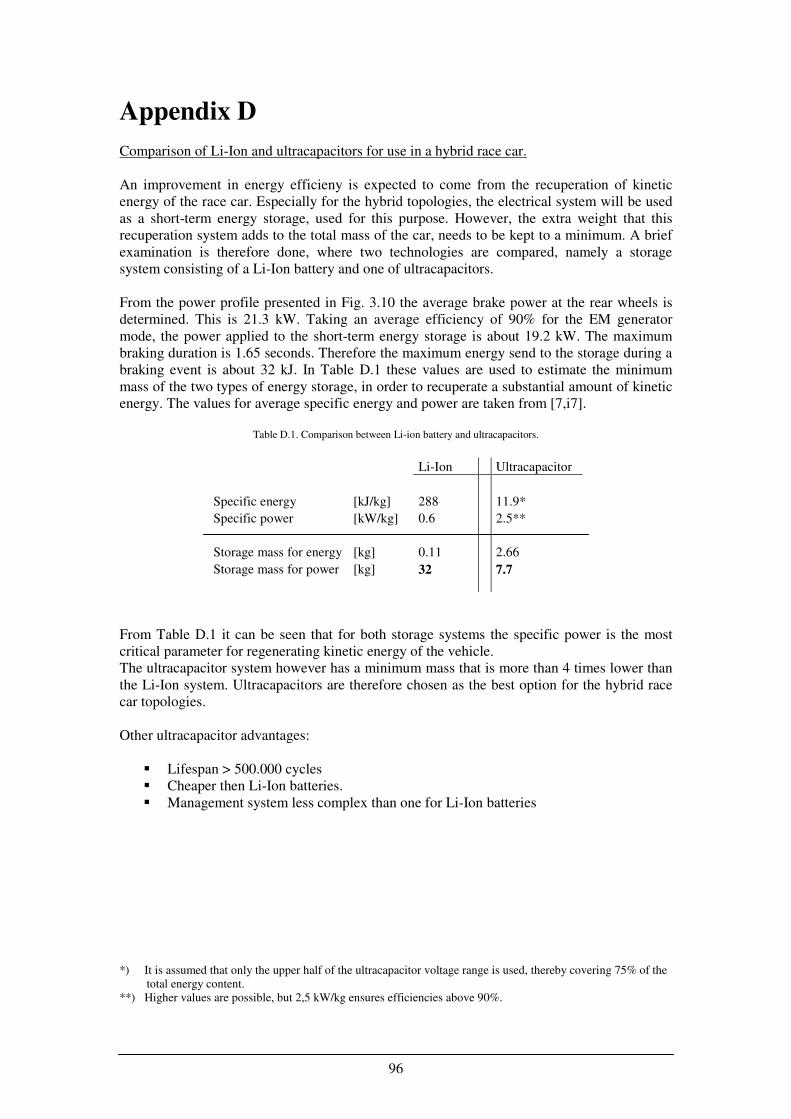
96
Appendix D
Comparison of Li-Ion and ultracapacitors for use in a hybrid race car.
An improvement in energy efficieny is expected to come from the recuperation of kinetic
energy of the race car. Especially for the hybrid topologies, the electrical system will be used
as a short-term energy storage, used for this purpose. However, the extra weight that this
recuperation system adds to the total mass of the car, needs to be kept to a minimum. A brief
examination is therefore done, where two technologies are compared, namely a storage
system consisting of a Li-Ion battery and one of ultracapacitors.
From the power profile presented in Fig. 3.10 the average brake power at the rear wheels is
determined. This is 21.3 kW. Taking an average efficiency of 90% for the EM generator
mode, the power applied to the short-term energy storage is about 19.2 kW. The maximum
braking duration is 1.65 seconds. Therefore the maximum energy send to the storage during a
braking event is about 32 kJ. In Table D.1 these values are used to estimate the minimum
mass of the two types of energy storage, in order to recuperate a substantial amount of kinetic
energy. The values for average specific energy and power are taken from [7,i7].
Table D.1. Comparison between Li-ion battery and ultracapacitors.
Li-Ion Ultracapacitor
Specific energy [kJ/kg] 288 11.9*
Specific power [kW/kg] 0.6 2.5**
Storage mass for energy [kg] 0.11 2.66
Storage mass for power [kg] 32 7.7
From Table D.1 it can be seen that for both storage systems the specific power is the most
critical parameter for regenerating kinetic energy of the vehicle.
The ultracapacitor system however has a minimum mass that is more than 4 times lower than
the Li-Ion system. Ultracapacitors are therefore chosen as the best option for the hybrid race
car topologies.
Other ultracapacitor advantages:
Lifespan > 500.000 cycles
Cheaper then Li-Ion batteries.
Management system less complex than one for Li-Ion batteries
*) It is assumed that only the upper half of the ultracapacitor voltage range is used, thereby covering 75% of the
total energy content.
**) Higher values are possible, but 2,5 kW/kg ensures efficiencies above 90%.
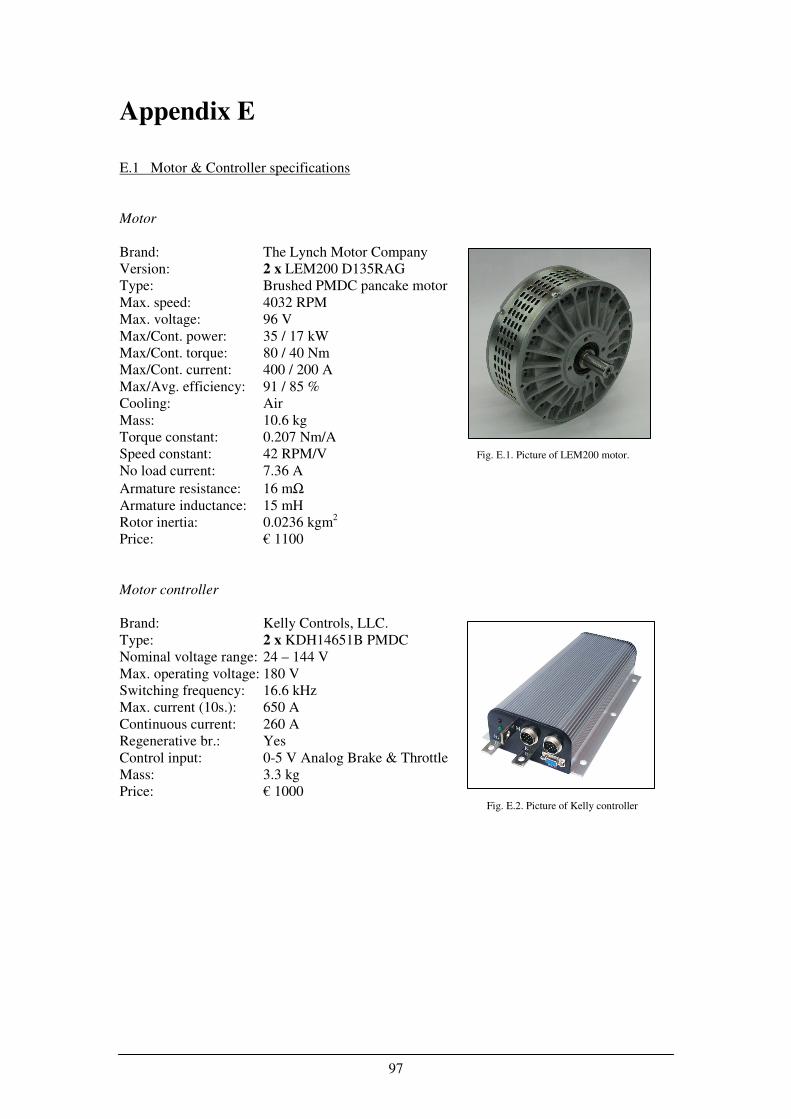
97
Appendix E
E.1 Motor & Controller specifications
Motor
Brand: The Lynch Motor Company
Version: 2 x LEM200 D135RAG
Type: Brushed PMDC pancake motor
Max. speed: 4032 RPM
Max. voltage: 96 V
Max/Cont. power: 35 / 17 kW
Max/Cont. torque: 80 / 40 Nm
Max/Cont. current: 400 / 200 A
Max/Avg. efficiency: 91 / 85 %
Cooling: Air
Mass: 10.6 kg
Torque constant: 0.207 Nm/A
Speed constant: 42 RPM/V Fig. E.1. Picture of LEM200 motor.
No load current: 7.36 A
Armature resistance: 16 mΩ
Armature inductance: 15 mH
Rotor inertia: 0.0236 kgm2
Price: € 1100
Motor controller
Brand: Kelly Controls, LLC.
Type: 2 x KDH14651B PMDC
Nominal voltage range: 24 – 144 V
Max. operating voltage: 180 V
Switching frequency: 16.6 kHz
Max. current (10s.): 650 A
Continuous current: 260 A
Regenerative br.: Yes
Control input: 0-5 V Analog Brake & Throttle
Mass: 3.3 kg
Price: € 1000 Fig. E.2. Picture of Kelly controller
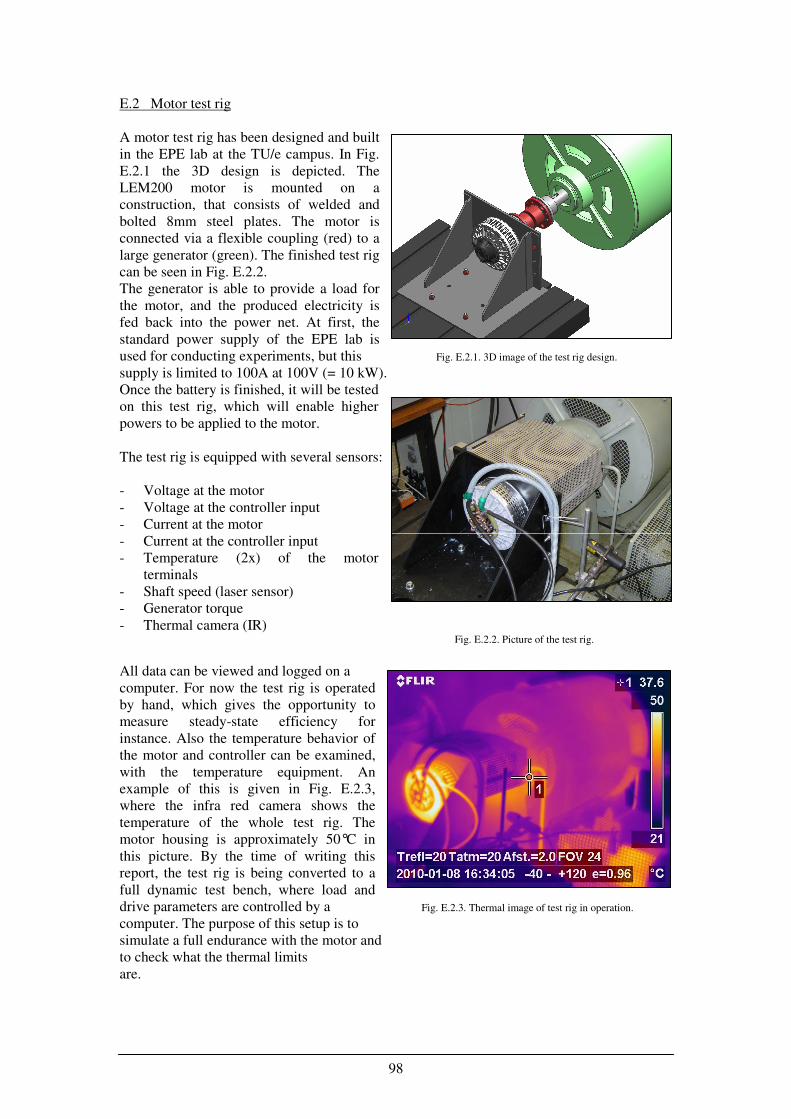
98
E.2 Motor test rig
A motor test rig has been designed and built
in the EPE lab at the TU/e campus. In Fig.
E.2.1 the 3D design is depicted. The
LEM200 motor is mounted on a
construction, that consists of welded and
bolted 8mm steel plates. The motor is
connected via a flexible coupling (red) to a
large generator (green). The finished test rig
can be seen in Fig. E.2.2.
The generator is able to provide a load for
the motor, and the produced electricity is
fed back into the power net. At first, the
standard power supply of the EPE lab is
used for conducting experiments, but this Fig. E.2.1. 3D image of the test rig design.
supply is limited to 100A at 100V (= 10 kW).
Once the battery is finished, it will be tested
on this test rig, which will enable higher
powers to be applied to the motor.
The test rig is equipped with several sensors:
- Voltage at the motor
- Voltage at the controller input
- Current at the motor
- Current at the controller input
- Temperature (2x) of the motor
terminals
- Shaft speed (laser sensor)
- Generator torque
- Thermal camera (IR) Fig. E.2.2. Picture of the test rig.
All data can be viewed and logged on a
computer. For now the test rig is operated
by hand, which gives the opportunity to
measure steady-state efficiency for
instance. Also the temperature behavior of
the motor and controller can be examined,
with the temperature equipment. An
example of this is given in Fig. E.2.3,
where the infra red camera shows the
temperature of the whole test rig. The
motor housing is approximately 50°C in
this picture. By the time of writing this
report, the test rig is being converted to a
full dynamic test bench, where load and
drive parameters are controlled by a Fig. E.2.3. Thermal image of test rig in operation.
computer. The purpose of this setup is to
simulate a full endurance with the motor and
to check what the thermal limits
are.
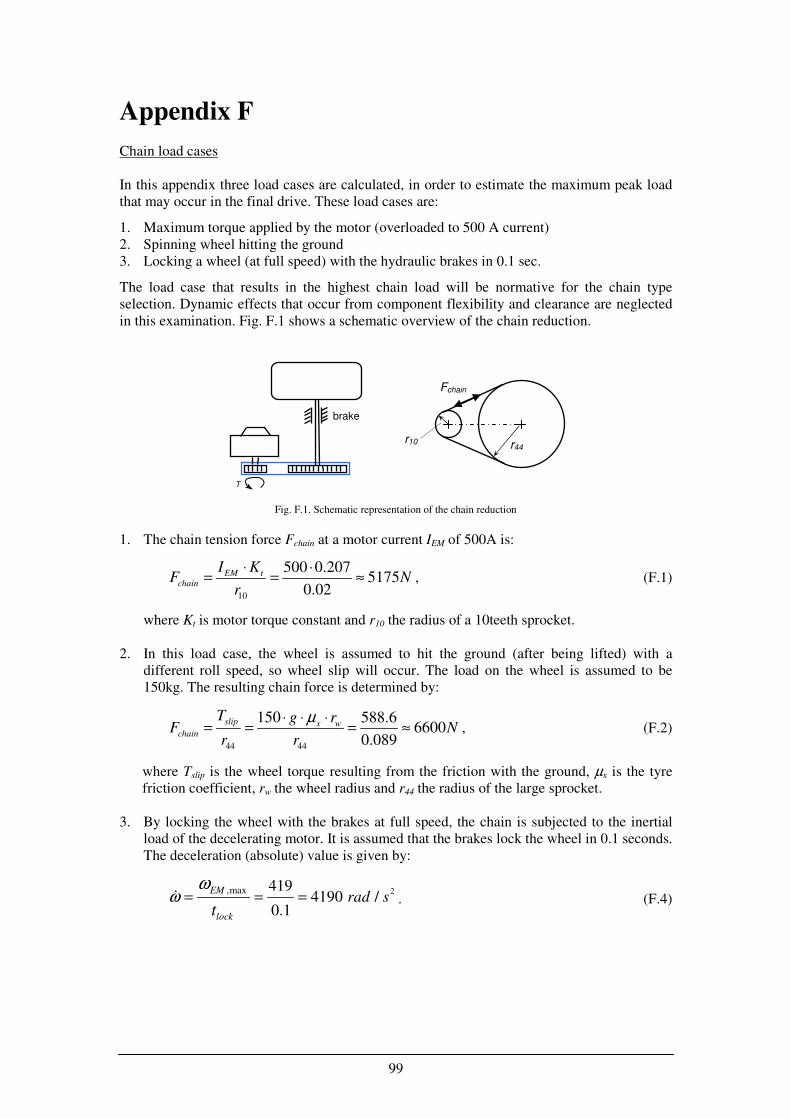
99
Appendix F
Chain load cases
In this appendix three load cases are calculated, in order to estimate the maximum peak load
that may occur in the final drive. These load cases are:
1. Maximum torque applied by the motor (overloaded to 500 A current)
2. Spinning wheel hitting the ground
3. Locking a wheel (at full speed) with the hydraulic brakes in 0.1 sec.
The load case that results in the highest chain load will be normative for the chain type
selection. Dynamic effects that occur from component flexibility and clearance are neglected
in this examination. Fig. F.1 shows a schematic overview of the chain reduction.
1. The chain tension force Fchain at a motor current IEM of 500A is:
10
500 0.2075175
0.02
EM tchain
I KF N
r
⋅ ⋅= = ≈ , (F.1)
where Kt is motor torque constant and r10 the radius of a 10teeth sprocket.
2. In this load case, the wheel is assumed to hit the ground (after being lifted) with a
different roll speed, so wheel slip will occur. The load on the wheel is assumed to be
150kg. The resulting chain force is determined by:
44 44
150 588.66600
0.089
slip x wchain
T g rF N
r r
µ⋅ ⋅ ⋅= = = ≈ , (F.2)
where Tslip is the wheel torque resulting from the friction with the ground, µx is the tyre
friction coefficient, rw the wheel radius and r44 the radius of the large sprocket.
3. By locking the wheel with the brakes at full speed, the chain is subjected to the inertial
load of the decelerating motor. It is assumed that the brakes lock the wheel in 0.1 seconds.
The deceleration (absolute) value is given by:
2,max 4194190 /
0.1
EM
lock
rad st
ωω
= = = . (F.4)
Fchain
r10
T
r44
brake
Fig. F.1. Schematic representation of the chain reduction
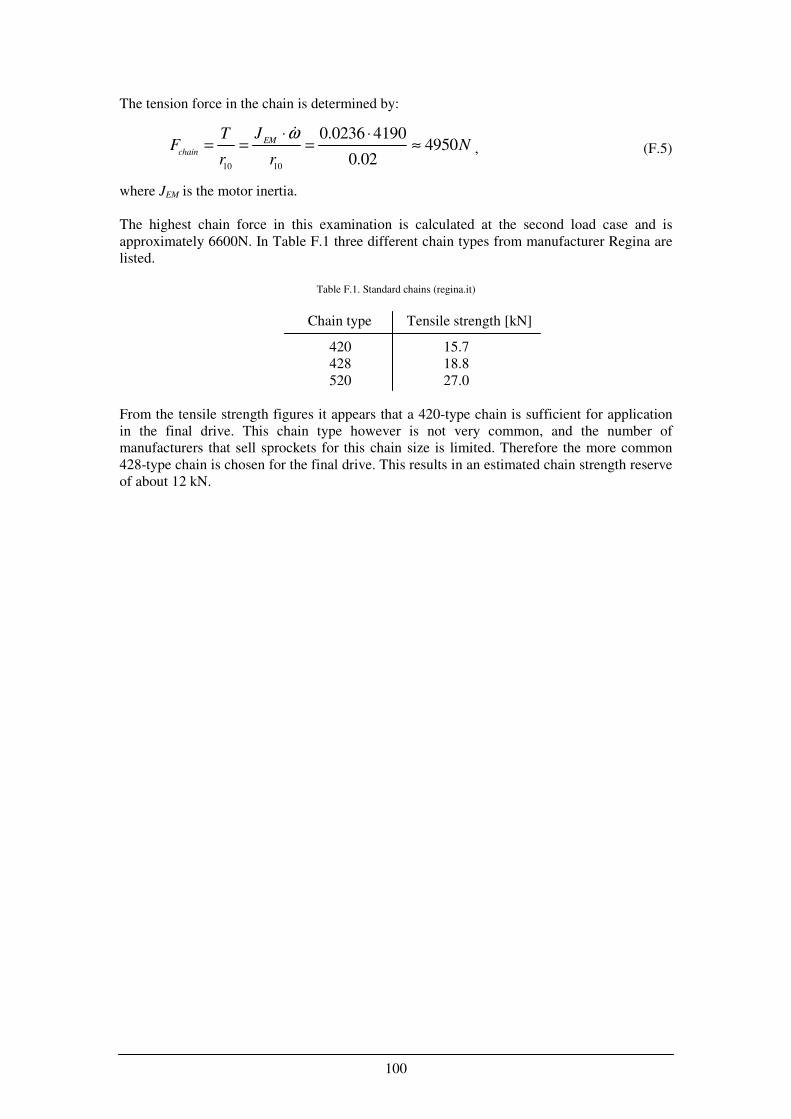
100
The tension force in the chain is determined by:
10 10
0.0236 41904950
0.02
EM
chain
JTF N
r r
ω⋅ ⋅= = = ≈
, (F.5)
where JEM is the motor inertia.
The highest chain force in this examination is calculated at the second load case and is
approximately 6600N. In Table F.1 three different chain types from manufacturer Regina are
listed.
Table F.1. Standard chains (regina.it)
Chain type Tensile strength [kN]
420 15.7
428 18.8
520 27.0
From the tensile strength figures it appears that a 420-type chain is sufficient for application
in the final drive. This chain type however is not very common, and the number of
manufacturers that sell sprockets for this chain size is limited. Therefore the more common
428-type chain is chosen for the final drive. This results in an estimated chain strength reserve
of about 12 kN.
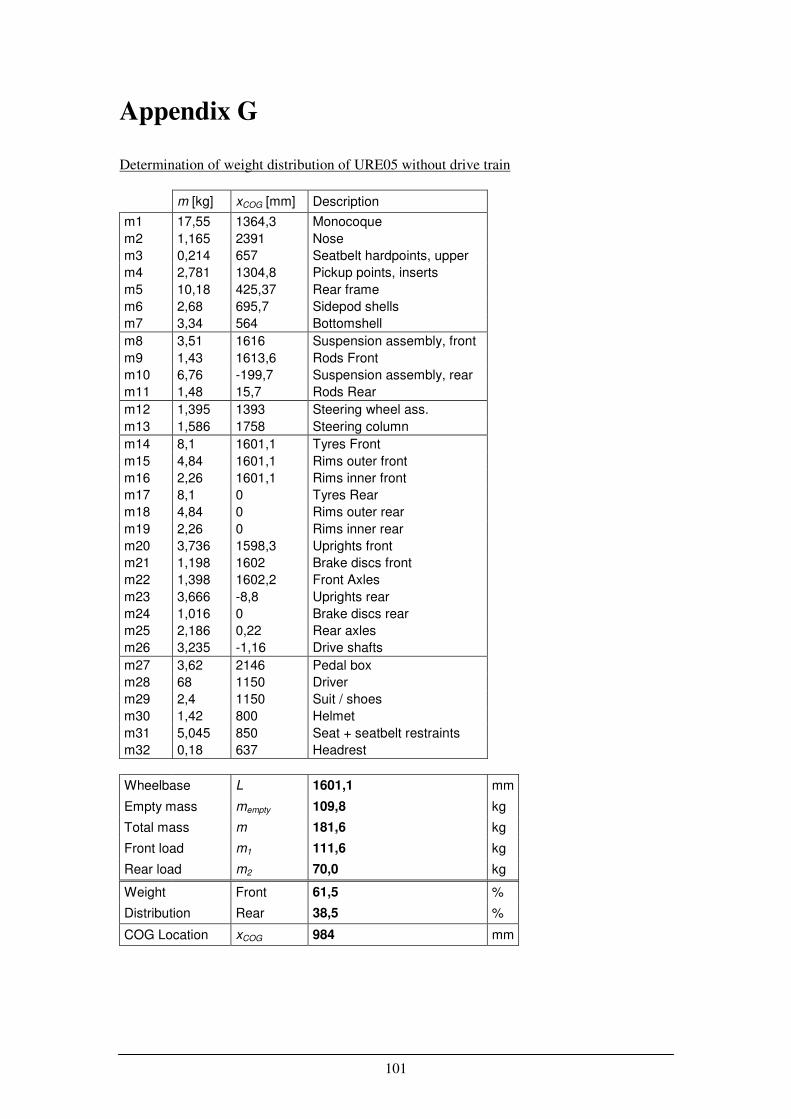
101
Appendix G
Determination of weight distribution of URE05 without drive train
m [kg] xCOG [mm] Description
m1 17,55 1364,3 Monocoque
m2 1,165 2391 Nose
m3 0,214 657 Seatbelt hardpoints, upper
m4 2,781 1304,8 Pickup points, inserts
m5 10,18 425,37 Rear frame
m6 2,68 695,7 Sidepod shells
m7 3,34 564 Bottomshell
m8 3,51 1616 Suspension assembly, front
m9 1,43 1613,6 Rods Front
m10 6,76 -199,7 Suspension assembly, rear
m11 1,48 15,7 Rods Rear
m12 1,395 1393 Steering wheel ass.
m13 1,586 1758 Steering column
m14 8,1 1601,1 Tyres Front
m15 4,84 1601,1 Rims outer front
m16 2,26 1601,1 Rims inner front
m17 8,1 0 Tyres Rear
m18 4,84 0 Rims outer rear
m19 2,26 0 Rims inner rear
m20 3,736 1598,3 Uprights front
m21 1,198 1602 Brake discs front
m22 1,398 1602,2 Front Axles
m23 3,666 -8,8 Uprights rear
m24 1,016 0 Brake discs rear
m25 2,186 0,22 Rear axles
m26 3,235 -1,16 Drive shafts
m27 3,62 2146 Pedal box
m28 68 1150 Driver
m29 2,4 1150 Suit / shoes
m30 1,42 800 Helmet
m31 5,045 850 Seat + seatbelt restraints
m32 0,18 637 Headrest
Wheelbase L 1601,1 mm
Empty mass mempty 109,8 kg
Total mass m 181,6 kg
Front load m1 111,6 kg
Rear load m2 70,0 kg
Weight Front 61,5 %
Distribution Rear 38,5 %
COG Location xCOG 984 mm
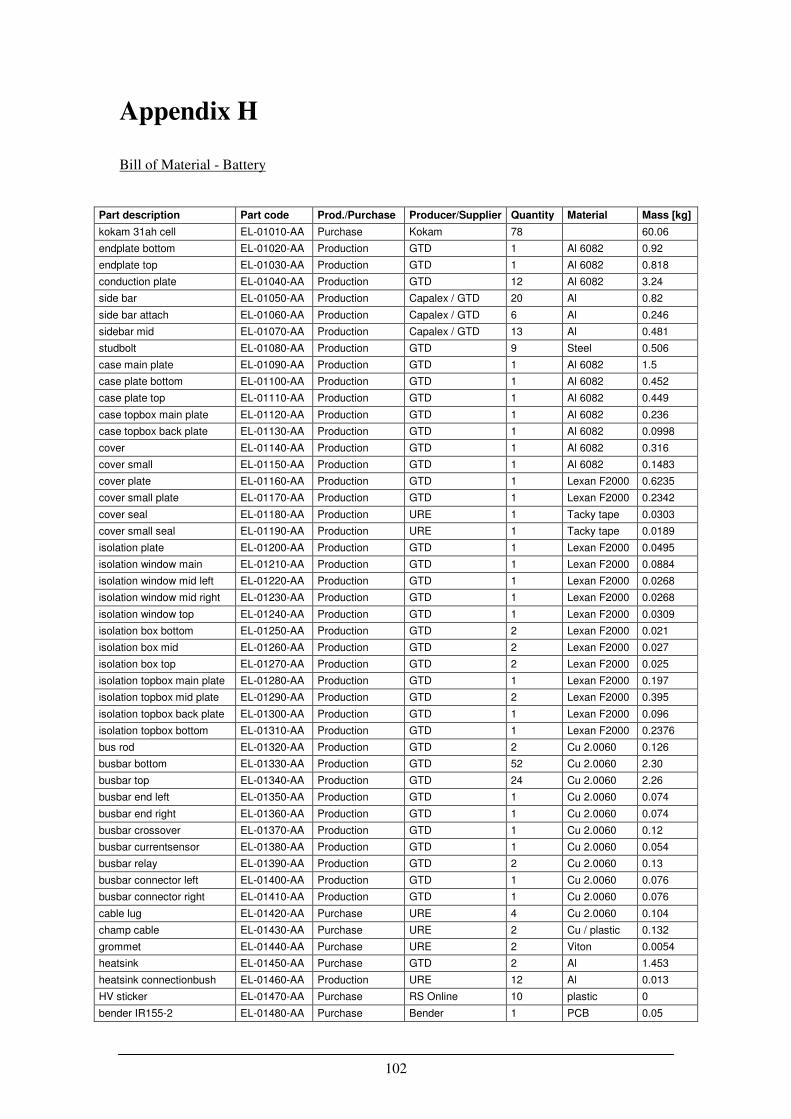
102
Appendix H
Bill of Material - Battery
Part description Part code Prod./Purchase Producer/Supplier Quantity Material Mass [kg]
kokam 31ah cell EL-01010-AA Purchase Kokam 78 60.06
endplate bottom EL-01020-AA Production GTD 1 Al 6082 0.92
endplate top EL-01030-AA Production GTD 1 Al 6082 0.818
conduction plate EL-01040-AA Production GTD 12 Al 6082 3.24
side bar EL-01050-AA Production Capalex / GTD 20 Al 0.82
side bar attach EL-01060-AA Production Capalex / GTD 6 Al 0.246
sidebar mid EL-01070-AA Production Capalex / GTD 13 Al 0.481
studbolt EL-01080-AA Production GTD 9 Steel 0.506
case main plate EL-01090-AA Production GTD 1 Al 6082 1.5
case plate bottom EL-01100-AA Production GTD 1 Al 6082 0.452
case plate top EL-01110-AA Production GTD 1 Al 6082 0.449
case topbox main plate EL-01120-AA Production GTD 1 Al 6082 0.236
case topbox back plate EL-01130-AA Production GTD 1 Al 6082 0.0998
cover EL-01140-AA Production GTD 1 Al 6082 0.316
cover small EL-01150-AA Production GTD 1 Al 6082 0.1483
cover plate EL-01160-AA Production GTD 1 Lexan F2000 0.6235
cover small plate EL-01170-AA Production GTD 1 Lexan F2000 0.2342
cover seal EL-01180-AA Production URE 1 Tacky tape 0.0303
cover small seal EL-01190-AA Production URE 1 Tacky tape 0.0189
isolation plate EL-01200-AA Production GTD 1 Lexan F2000 0.0495
isolation window main EL-01210-AA Production GTD 1 Lexan F2000 0.0884
isolation window mid left EL-01220-AA Production GTD 1 Lexan F2000 0.0268
isolation window mid right EL-01230-AA Production GTD 1 Lexan F2000 0.0268
isolation window top EL-01240-AA Production GTD 1 Lexan F2000 0.0309
isolation box bottom EL-01250-AA Production GTD 2 Lexan F2000 0.021
isolation box mid EL-01260-AA Production GTD 2 Lexan F2000 0.027
isolation box top EL-01270-AA Production GTD 2 Lexan F2000 0.025
isolation topbox main plate EL-01280-AA Production GTD 1 Lexan F2000 0.197
isolation topbox mid plate EL-01290-AA Production GTD 2 Lexan F2000 0.395
isolation topbox back plate EL-01300-AA Production GTD 1 Lexan F2000 0.096
isolation topbox bottom EL-01310-AA Production GTD 1 Lexan F2000 0.2376
bus rod EL-01320-AA Production GTD 2 Cu 2.0060 0.126
busbar bottom EL-01330-AA Production GTD 52 Cu 2.0060 2.30
busbar top EL-01340-AA Production GTD 24 Cu 2.0060 2.26
busbar end left EL-01350-AA Production GTD 1 Cu 2.0060 0.074
busbar end right EL-01360-AA Production GTD 1 Cu 2.0060 0.074
busbar crossover EL-01370-AA Production GTD 1 Cu 2.0060 0.12
busbar currentsensor EL-01380-AA Production GTD 1 Cu 2.0060 0.054
busbar relay EL-01390-AA Production GTD 2 Cu 2.0060 0.13
busbar connector left EL-01400-AA Production GTD 1 Cu 2.0060 0.076
busbar connector right EL-01410-AA Production GTD 1 Cu 2.0060 0.076
cable lug EL-01420-AA Purchase URE 4 Cu 2.0060 0.104
champ cable EL-01430-AA Purchase URE 2 Cu / plastic 0.132
grommet EL-01440-AA Purchase URE 2 Viton 0.0054
heatsink EL-01450-AA Purchase GTD 2 Al 1.453
heatsink connectionbush EL-01460-AA Production URE 12 Al 0.013
HV sticker EL-01470-AA Purchase RS Online 10 plastic 0
bender IR155-2 EL-01480-AA Purchase Bender 1 PCB 0.05
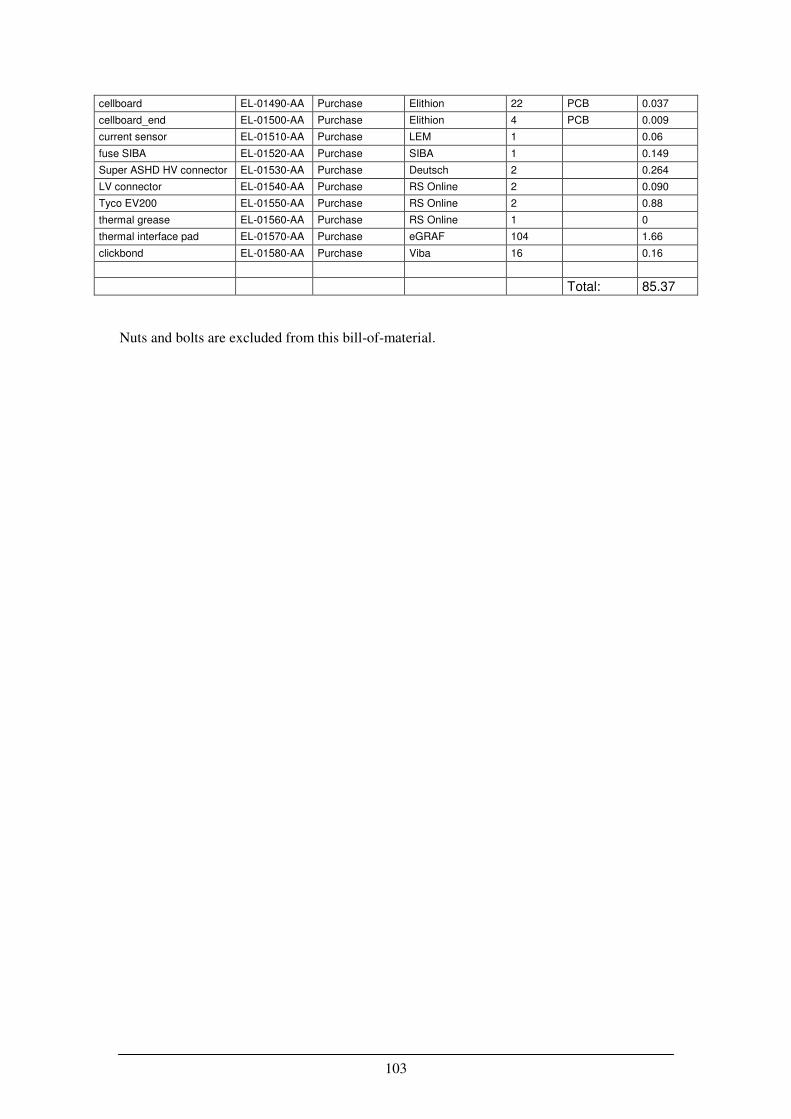
103
cellboard EL-01490-AA Purchase Elithion 22 PCB 0.037
cellboard_end EL-01500-AA Purchase Elithion 4 PCB 0.009
current sensor EL-01510-AA Purchase LEM 1 0.06
fuse SIBA EL-01520-AA Purchase SIBA 1 0.149
Super ASHD HV connector EL-01530-AA Purchase Deutsch 2 0.264
LV connector EL-01540-AA Purchase RS Online 2 0.090
Tyco EV200 EL-01550-AA Purchase RS Online 2 0.88
thermal grease EL-01560-AA Purchase RS Online 1 0
thermal interface pad EL-01570-AA Purchase eGRAF 104 1.66
clickbond EL-01580-AA Purchase Viba 16 0.16
Total: 85.37
Nuts and bolts are excluded from this bill-of-material.
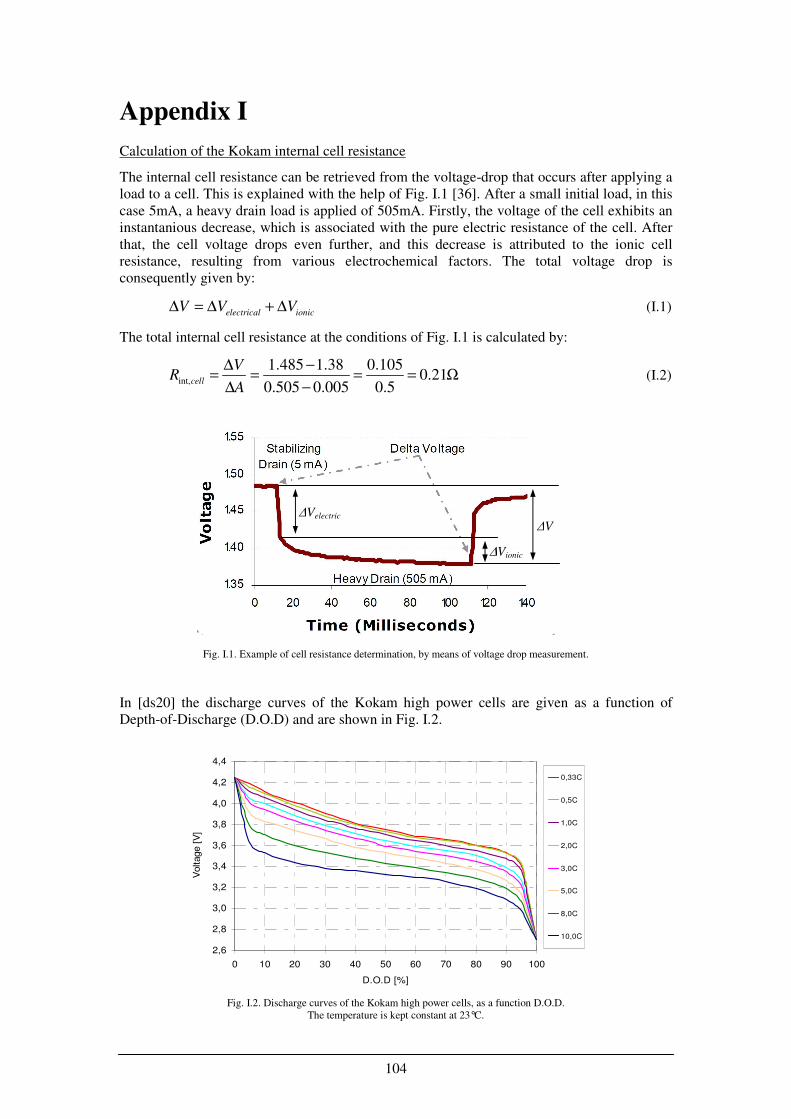
104
Appendix I
Calculation of the Kokam internal cell resistance
The internal cell resistance can be retrieved from the voltage-drop that occurs after applying a
load to a cell. This is explained with the help of Fig. I.1 [36]. After a small initial load, in this
case 5mA, a heavy drain load is applied of 505mA. Firstly, the voltage of the cell exhibits an
instantanious decrease, which is associated with the pure electric resistance of the cell. After
that, the cell voltage drops even further, and this decrease is attributed to the ionic cell
resistance, resulting from various electrochemical factors. The total voltage drop is
consequently given by:
electrical ionicV V V∆ = ∆ + ∆ (I.1)
The total internal cell resistance at the conditions of Fig. I.1 is calculated by:
int,
1.485 1.38 0.1050.21
0.505 0.005 0.5cell
VR
A
∆ −= = = = Ω
∆ − (I.2)
Fig. I.1. Example of cell resistance determination, by means of voltage drop measurement.
In [ds20] the discharge curves of the Kokam high power cells are given as a function of
Depth-of-Discharge (D.O.D) and are shown in Fig. I.2.
Fig. I.2. Discharge curves of the Kokam high power cells, as a function D.O.D.
The temperature is kept constant at 23°C.
∆V
∆Vionic
∆Velectric
2,6
2,8
3,0
3,2
3,4
3,6
3,8
4,0
4,2
4,4
0 10 20 30 40 50 60 70 80 90 100
D.O.D [%]
Voltage [V
]
0,33C
0,5C
1,0C
2,0C
3,0C
5,0C
8,0C
10,0C
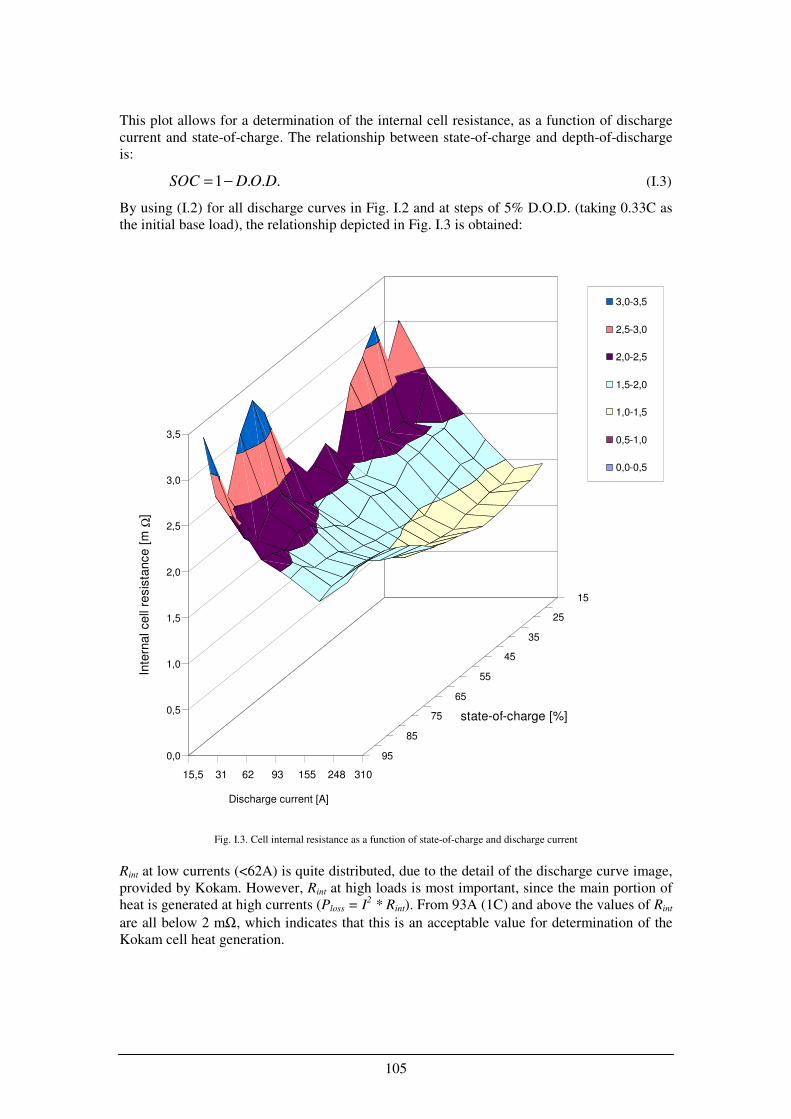
105
This plot allows for a determination of the internal cell resistance, as a function of discharge
current and state-of-charge. The relationship between state-of-charge and depth-of-discharge
is:
1 . . .SOC D O D= − (I.3)
By using (I.2) for all discharge curves in Fig. I.2 and at steps of 5% D.O.D. (taking 0.33C as
the initial base load), the relationship depicted in Fig. I.3 is obtained:
Fig. I.3. Cell internal resistance as a function of state-of-charge and discharge current
Rint at low currents (<62A) is quite distributed, due to the detail of the discharge curve image,
provided by Kokam. However, Rint at high loads is most important, since the main portion of
heat is generated at high currents (Ploss = I2 * Rint). From 93A (1C) and above the values of Rint
are all below 2 mΩ, which indicates that this is an acceptable value for determination of the
Kokam cell heat generation.
0,0
0,5
1,0
1,5
2,0
2,5
3,0
3,5
Inte
rna
l ce
ll re
sis
tance
[m
Ω]
15,5 31 62 93 155 248
95
85
75
65
55
45
35
25
15
state-of-charge [%]
3,0-3,5
2,5-3,0
2,0-2,5
1,5-2,0
1,0-1,5
0,5-1,0
0,0-0,5
15,5 31 62 93 155 248 310
Discharge current [A]
106
Bibliography
Documents and papers
General
[1] FSAE Competition History 1981 – 2004
Electric Motors
[2] K.T. Chau, Z. Wang. Overview of Power Electronic Drives for Electric Vehicles. Department of
Electrical and Electronic Engineering, The University of Hong Kong, China, 2005
[3] John C. Compter. Electrical drives for precision engineering designs. SpecAmotor. Eindhoven,
2007.
[4] E. Hage. Keuze elektromotor - Voorkom oververhitting en over-dimensionering. SpecAmotor,
Eindhoven
[5] M. Zeraoulia1, M.E.H. Benbouzid, D. Diallo. Electric Motor Drive Selection Issues for HEV
Propulsion Systems - A Comparative Study. 0-7803-9280-9/05 IEEE, 2005.
Ultracapacitors
[6] J. Baxter, P. Carter, T. Erekson, R. Todd. UltraCapacitor Power for a Drag Racecar. Brigham
Young University. SAE Technical Paper. November 2004.
[7] A. Burke, M. Miller. Electrochemical Capacitors as Energy Storage in Hybrid-Electric Vehicles.
University of California-Davis, Institute of Transportation Studies. EVS24, Norway, May 2009.
[8] G. Guidi, T.M. Undeland, Y. Hori. Effectiveness of Supercapacitors as Power-Assist in Pure EV
Using a Sodium-Nickel Chloride Battery as Main Energy Storage. Norwegian University of
Science and Technology, Dept. of Electric Power Engineering. EVS24, May 2009.
[9] J.M. Miller, U. Deshpande, M. Rosu, CarbonCarbon Ultracapacitor Equivalent Circuit Model,
Parameter Extraction, and Application, Maxwell Technologies Inc. 2007
[10] J.M. Miller, D. Nebrigic, M. Everett, Ultracapacitor Distributed Model Equivalent Circuit for
Power Electronic Circuit Simulation, Maxwell Technologies Inc. 2006
[11] Design considerations for Ultracapacitors. Maxwell Technologies. White Paper.
[12] Ultracapacitor Cell Sizing. Maxwell Technologies Inc. Nr. 10073627, Version 3, 2009.
[13] Ultracapacitor Interconnection. Maxwell Technologies Inc. White Paper. 2004
Batteries
[14] S. Al Hallaj, H. Maleki, J.S. Hong, J.R. Selman. Thermal modeling and design considerations of
lithium-ion batteries. Center for Electrochemical Science and Engineering, Illinois Institute of
Technology, Chicago, USA, 1999.
[15] P. Andersson, O. Collin. Parameterization of a 14.5 Ah LiFePO4-battery cell. Master´s Thesis.
Electric Power Engineering. Chalmers University of Technology. Goteborg, Sweden, 2009
[16] P. Baudry, M. Neri, M. Gueguen, G. Lonchampt. Electro-thermal modelling of polymer lithium
batteries for starting period and pulse power. Journal of Power Sources 54 (1995) 393-396.
[17] S. Boyd, J. Lee, D.J. Nelson. A Simplified Battery Model for Hybrid Vehicle Technology
Assessment. SAE Technical Paper. World Congress Detroit, Michigan, April, 2007.
[18] Y. Chen, J.W. Evans. Thermal Analysis of Lithium Polymer Electrolyte Batteries By a Two
Dimensional Model. Electrochimica Acta, Vol. 39. No. 4. p.511-526, 1994.
[19] Y. Chen, J.W. Evans. Thermal Management of Lithium/Polymer electrolyte Batteries for electric
vehicle operation. Material Science Division, The Electro-Chemical Society Proceedings 94-28.
1995
107
[20] J.P. Fellner, G.J. Loeber, S.S. Sandhu, Testing of lithium-ion 18650 cells and characterizing cell
performance. Journal of Power Sources 81–82(1999)867–871. 1999.
[21] D. Ghosh, P.D. Maguire, D.X. Zhu, Design and CFD Simulation of a Battery Module for a
Hybrid Electric Vehicle Battery Pack. SAE Technical Paper, 2009-01-1386, 2009.
[22] M. Grujicic, C.L. Zhao, E.C. Dusel. The effect of thermal contact resistance on heat management
in the electronic packaging. Department of Mechanical Engineering, Program in Materials
Science and Engineering, Clemson University, USA, 2005.
[23] Y. Hisamitsu, T. Abe, T. Kinoshita, H. Miyakubo, H. Horie. Research and Development Work on
High-performance Lithium-ion Batteries for EV Application. SAE Technical Paper 2008-01-1332.
World Congress Detroit, Michigan, April, 2008.
[24] S. Jagsch, C. Kussmann. Integrated Simulation Process for the Thermal Management of Li-Ion
Batteries in Automotive Applications. SAE Technical Paper 2009-01-3078.
[25] D. Karner, J. Francfort. KATECH 4-Passenger NEV Range and Battery Testing Report. US
Department of Energy, FreedomCAR & Vehicle Technologies Program. INL/EXT-05-00479.
July 2005.
[26] M.A. Keyser, A. Pesaran, M.M.S Yu, S.R. Kim, M. Alamgir, D. Rivers. Thermal
Characterization of Advanced Lithium-Ion Polymer Cells. Third Advanced Automotive Battery
Conference, June 2003.
[27] G.H. Kim and A. Pesaran. Battery Thermal Management System Design Modeling. 22nd
International Battery, Hybrid and Fuel Cell Electric Vehicle Conference and Exhibition (EVS-22)
Yokohama, Japan October, 2006.
[28] H. Maleki, S. Al Hallaj, J.R. Selman, R.B. Dinwiddie, H. Wang. Thermal properties of lithium
ion battery and components. Electrochemical Society, Pennington, NJ, USA, 1999.
[29] J. Payne, M. Niedzwiecki, S. Ketkar, I. Isayev. Thermal Characterization & Management of
PHEV Battery Packs. SAE Technical Paper 2009-01-3069.
[30] A.A. Pesaran. Battery Thermal Management in EVs and HEVs - Issues and Solutions. Advanced
Automotive Battery Conference. Las Vegas, Nevada. February, 2001.
[31] A.A. Pesaran, S. Burch, and M. Keyser. An Approach for Designing Thermal Management
Systems for Electric and Hybrid Vehicle Battery Packs. National Renewable Energy Laboratory,
January 1999.
[32] A.A. Pesaran, M. Keyser. Thermal Characteristics of Selected EV and HEV Batteries. Annual
Battery Conference: Advances and Applications, Long Beach, California, January, 2001.
[33] E.P. Roth. Thermal Characterization of Li-ion Cells Using Calorimetric Techniques. Lithium
Battery R&D Dept. 2521 Sandia National Laboratories, AIAA-2000-2972, 2000.
[34] K. Smith, C.Y. Wang. Power and thermal characterization of a lithium-ion battery pack for
hybrid-electric vehicles. Electrochemical Engine Center, Department of Mechanical and Nuclear
Engineering, The Pennsylvania State University, USA, 2006.
[35] Y. Zeng, K. Wu, D. Wang, Z. Wang, L. Chen. Overcharge investigation of lithium-ion polymer
batteries. Laboratory for Solid State Ionics, Institute of Physics, Chinese Academy of Sciences,
Beijing, China. Journal of Power Sources 160 (2006) 1302–1307. 2006.
[36] Battery Internal Resistance. Energizer Holdings Inc. Technical Bulletin, December 2005.
[37] Electric Vehicle Batteries, North Bay Chapter of the Electric Auto Association, 2009.
108
Engines
[38] W. Attard, Small Engine Performance Limits – Turbocharging, Combustion or Design. PhD.
Thesis. Dept. of Mechanical and Manufacturing Engineering, The University of Melbourne, 2007.
[39] W. Attard, H.C. Watson, S. Konidaris, M.A. Khan. Comparing the Performance and Limitations
of a Downsized Formula SAE Engine in Normally Aspirated, Supercharged and Turbocharged
Modes. Small Engine Technology Conference and Exhibition San Antonio, Texas, November
2006.
[40] A. Demirbas. Biofuels securing the planet’s future energy needs. Sila Science, University Mah,
Trabzon, Turkey, 2009.
[41] K. Dwyer. Cost effective Sustainable Fuels for performance vehicles. SAE Technical Paper 2008-
01-2954. Motorsports Engineering Conference Concord, North Carolina, December, 2008.
[42] G. Fontaras, Z. Samaras. On the way to 130g CO2/km - Estimating the future characteristics of
the average European passenger car. Laboratory of Applied Thermodynamics, Aristotle
University Thessaloniki, Greece, 2009.
[43] A.C. Ragatz, J.J. Swanson, D.B. Kittelson, W.F. Watts. Particle and Gaseous Emission
Characteristics of a Formula SAE race car engine. SAE Technical Paper 2009-01-1400.
[44] MultiAir, The Ultimate Air Management Strategy - Press Release Fiat Powertrains Group.
FS Modeling
[45] A. van Berkum. Chassis and suspension design FSRTE02. Master’s Thesis, DCT2006.23.
Department of Mechanical Engineering, Technical University of Eindhoven, 2006
[46] C.H.A. Criens, T. ten Dam, H.J.C. Luijten, T. Rutjes. Building a MATLAB Based FS simulator.
DCT 2006.069 Master Team Project, Department of Mechanical Engineering, Technical
University of Eindhoven, 2006.
[47] L. Guzzella, A. Amstutz. QSS Toolbox Manual. Swiss Federal Institute of Technology Zurich,
2005
[48] J.A.M. Hopmans. Analysis and development of Formula Student racing tyres. Master's Thesis.
DCT2010.003, Department of Mechanical Engineering, Technical University of Eindhoven, 2010.
[90] J.T. Spierings. Performance Analysis for Formula Student Vehicles. Bachelor Thesis, Dept. of
Mechanical Engineering, Eindhoven University of Technology. 2010 (not yet published).
FS Team reports
[49] K.W. Benson, D.A. Fraser, S.L. Hatridge, C.A. Monaco, R.J. Ring, C.R. Sullivan, P.C. Taber.
The Hybridization of a Formula Race Car. Thayer School of Engineering, Dartmouth College.
[50] K.W. Benson, S. Hatridge, P. Taber. Hybrid Race Car Phase 2. ENGS 290 Final Report,
Dartmouth Formula Racing. 2005.
[51] S. Frost, D. Farley, J. Hoyt. Hybrid Racing Team Presentation. Vermont Technical College. 2007.
[52] J. Goodman, A. Kepp. Electrical Team report. ENGS 199: Hybrid Vehicle Technology.
Dartmouth Formula Racing. 2006.
[53] D. Haffner. Hybrid Design. Final report. ENGS 199 – Hybrid Vehicle Technology. Dartmouth
Formula Racing, 2006.
[54] C. Monaco, R.J. Ring. High-performance Hybrid Drive investigation. ENGS 290 Final Report.
Dartmouth Formula Racing. 2004.
[55] McGill University Hybrid Design review, 2008.
109
Green Motorsports
[56] J. Baxter. Design of the world’s fastest E1 class electric car. Motorsports Engineering Conference
& Exhibition, Michigan, December 2006.
[57] M. Borremans, P. Bossche, B. Verbrugge, F. Van Mulders, M. Bottiglieri, A. Van Steendam, J.
Van Mierlo. The Electric Endeavour - Engineering formation through SYNECTRIC electric race
car development. EVS24 International Battery, Hybrid and Fuel Cell Electric Vehicle Symposium,
2009.
[58] R. Clague, G. Offer, M. Matian, T. Priestly, T. Schulz, I. Lawrence, M. Cordner, N. Brandon.
Fuel Cell Racing - Imperial College London Presents the Racing Green Team. EVS24
International Battery, Hybrid and Fuel Cell Electric Vehicle Symposium, 2009.
[59] E. Heil, C. Jordan, K.J. Nasr, K.M. Plagens, M. Tavakoli, M. Thompson, J.T. Wolak. An Electric
Vehicle with Racing Speeds. SAE Technical Paper. International Congress and Exposition, Detroit,
Michigan, February 1998.
[60] T. Knoke, T. Schneider, J. Böcker. Construction of a Hybrid Electrical Racing Kart as a Student
Project. Institute of Power Electronics and Electrical Drives, Paderborn University, 2007.
[61] E.A. Loveless, T.J. Ludikar, S. Meghnath, P.J. Samson. Design, Optimization and Control of
open wheel hybrid race car. Gryphon Racing Team, University of Guelph, Proceedings of the
ENGG 3100: Design III projects, 2007.
Hybrid technology
[62] D.M. Blackketter, F. Albrecht. A Parallel Hybrid Electric Sport Utility Vehicle - Futuretruck
2003. N03-06. National Institute for Advanced Transportation Technology, University of Idaho,
September 2003.
[63] D.M. Blackketter, S.W. Beyerlein, F. Albrecht. University of Idaho Futuretruck 2004. N04-09.
National Institute for Advanced Transportation Technology, University of Idaho, October 2004.
[64] E. Cacciatori, N.D. Vaughan, J. Marco. Energy Management Strategies for a Parallel Hybrid
Electric Powertrain. Cranfield University.
[65] D. Edwards, J. Richards. A High Performance Auxiliary Power Unit for a Series Hybrid Electric
Vehicle. N01-22. National Institute for Advanced Transportation Technology, University of
Idaho, November 2000.
[66] C. Forgez, G. Friedrich, J.M. Biedinger.. Method to find the hybridization rate for a parallel
hybrid electrical vehicle. Université de Technologie de Compiègne.
[67] T. Hofman. Framework for Combined Control and Design Optimization of Hybrid Vehicle
Propulsion Systems. PhD. Thesis, Eindhoven University of Technology, 2007.
[68] M.U. Lampérth, A. Beaudet , M. Jaensch. Series-Parallel Hybrid Using Axial Flux Motors.
EVS24 International Battery, Hybrid and Fuel Cell Electric Vehicle Symposium, 2009.
[69] S. Pekarek, K. Uthaichana, S. Bengea, R. DeCarlo, M. Zefran. Modeling of an Electric Drive for
a HEV Supervisory Level Power Flow Control Problem. 0-7803-9280-9/05 ©2005 IEEE.
[70] C. Pronovost, J. Xu. A Reconfigurable Series-Parallel Hybrid Powertrain for Plug-in Vehicles.
EVS24 International Battery, Hybrid and Fuel Cell Electric Vehicle Symposium, 2009.
[71] R. Wiegers, F. Albrecht, D. Blackketter. Hydraulic Hybrid Vehicle. Final Report KLK348 N06-
17, National Institute for Advanced Transportation Technology, University of Idaho, December
2006.
[72] Y. Zhu, C. Ozturk, S. Yildiz, K. Konuk, K. Broeksteeg, P. Mentink, T. vd Sande, L. v Eeuwijk.
A comparison between series and parallel hybrid cars. Department of Mechanical Engineering,
Technical University of Eindhoven, 2008.
110
Regenerative braking
[73] D. Cross, C. Brockbank. Mechanical Hybrid System Comprising a Flywheel and CVT for
Motorsport and Mainstream Automotive Applications. SAE Technical Paper 2009-01-1312.
[74] D. Cross. Optimization of Hybrid Kinetic Energy Recovery Systems (KERS) for Different Racing
Circuits. SAE Technical Paper 2008-01-2956, Motorsports Engineering Conference Concord,
North Carolina, December 2008.
[75] A. Sorniotti, M. Curto. Racing Simulation of a Formula 1 Vehicle with Kinetic Energy Recovery
System. SAE Technial Paper 2008-01-2964. Motorsports Engineering Conference Concord, North
Carolina, December 2008.
[76] H. Yeo, D. Kim, S. Hwang, H. Kim. Regenerative Braking Algorithm for a HEV with CVT Ratio
Control During Deceleration. 04CVT-41. School of Mechanical Engineering, Sungkyunkwan
University.
Torque vectoring
[86] F.J. Perez-Pinal, C. Nuniezt, R. Alvarezt, I. Cervantes, A. Emadi. Electric Differential for
Traction Applications. O-7803-9761-4/07 ©2007 IEEE
[87] R.J. Rieveley, B.P. Minaker. Variable Torque Distribution Yaw Moment Control for Hybrid
Powertrains. World Congress, Detroit, 2007
[88] M. Bentz, T. Becker, D. Cox, C. Janota, R. Tarlton, S. Ward, N. Miller. An Application of
Traction Vectoring to a Formula SAE Car. Motorsports Engineering Conference. North Carolina
2008.
[89] Mitsubishi EVO, Technical Review, 2003.
Books & Readers
[77] I.J.M. Besselink. Vehicle Dynamics 4L150. Dept. Mechanical Engineering – Dynamics & Control.
Eindhoven University of Technology. 2005.
[78] H. Groenhuis. Aandrijftechniek deel 3, Vrij programmeerbare elektrische aandrijvingen. Faculteit
Werktuigbouwkunde, Vakgroep Konstruktietechniek en Automatisering, Fontys Hogescholen,
augustus 1998.
[79] A. Guzzella, A. Sciarretta. Vehicle Propulsion Systems, Introduction to Modeling and
Optimization. Published by Springer, 1st Edition, ISBN-10: 3540251952. 2005.
[80] J. La Heij, L.A. de Bruijn, J. Veerman. Werkbouwkundig tekenen. Published by Stam Techniek,
17th Edition, ISBN: 9040103410. 1997.
[81] F. Kreith. The CRC Handbook of Thermal Engineering. CRC Press LLC, 2000
[82] G. Lechner, H. Naunheimer. Automotive Transmission, Fundamentals, Selection, Design and
Application. Published by Springer, 1st Edition, ISBN-10: 354065903X. 1999.
[83] N. Mohan. Electric Drives, an Integrative Approach. Published by MnPere, ISBN-10:
0971529256. June 2003.
[84] C. Rouelle. Vehicle Dynamics, Race Car Engineering and Data Acquisition Seminar Reader.
Published by OPTIMUMG, Denver, USA. 2009.
[85] W.W. Pulkrabek. Engineering Fundamentals of the Internal Combustion Engine. Published by
Pearson Prentice Hall, 2nd
Edition. ISBN 0131918559. 2004.
111
Internet
[i1] Class1a rules
http://www.formulastudent.com/
[i2] Official Formula SAE Website
http://www.fsae.com
[i3] Windtunnel measurement of drag force on Formula SAE car. http://fsae.com/eve/forums/a/tpc/f/125607348/m/48210724421?r=48210724421#48210724421
[i4] Official website ELithion
http://liionbms.com/php/index.php
[i5] Kokam design example
http://www.metricmind.com/audi/14-battery.htm
[i6] Lithium battery failures overview
http://www.mpoweruk.com/lithium_failures.htm
[i7] LiFeBatt 40138 Cell Overview
http://www.lifebatt.co.uk/technical_overview.html
[i8] Formula Zero Official Website
http://www.formulazero.nl/
[i9] Formula Student Electric rules
http://www.formulastudentelectric.de/
[i10] Electric Imp race car kokam battery
http://www.proev.com/P1Batt.htm
[i11] MatWeb Material Property Database – Aluminium 6082-T6 http://www.matweb.com/search/DataSheet.aspx?MatGUID=fad29be6e64d4e95a241690f1f6e1eb7
[i12] Wikipedia - Copper
http://en.wikipedia.org/wiki/Copper
[i13] Wikipedia – IP Code
http://en.wikipedia.org/wiki/IP_Code
Datasheets
[ds01] Maxwell Ultracapacitor Overview
[ds02] UQM PowerPhase75 motor
[ds03] Kokam 31Ah HighPower cell
[ds04] Kokam MSDS (Material Safety Data Sheet)
[ds05] Kelly Controller Manual
[ds06] SIBA 90-058-05 Fuse
[ds07] Tyco EV-200 contactor relay
[ds08] Bender IR155-2 Insulation Monitoring Device
[ds09] HV Wiring
[ds10] Lexan F2000 polycarbonate sheet
[ds11] L.M.C. Datasheet
[ds12] LEM Current sensor
[ds13] E-Graf Thermal pad (HT-1220-AA)
[ds14] Zivan NG9 Battery Charger
[ds15] Aluminium 6082
[ds16] Heat transfer compound
[ds17] Araldite 2031 Adhesive
[ds18] BMS temperature sensor
[ds19] Deutsch HV connector
[ds20] Kokam Catalog
[ds21] GAIA 27Ah cell datasheet

112
Nomenclature
Acronyms
Abbreviation Description
AWD All Wheel Drive
AC Alternating Current
BEV Battery Electric Vehicle
BMEP Brake Mean Effective Pressure
BMS Battery Management System
BTMS Battery Thermal Management System
CFRP Carbon Fibre Reinforced Plastic
CI Compression Ignition
COG Centre of Gravity
DC Direct Current
DOD Depth of Discharge
DOHC Dual Over Head Camshaft
EM Electrical machine
FC Fuel Cell
FEA Finite Element Analysis
FS Formula Student
GFD Graund Fault Detector
ICE Internal Combustion Engine
LIPB Lithium Ion Polymer Battery
MAP Manifold Air Pressure
MSDS Material Safety Data Sheet
NA Naturally Aspirated
PE Power Electronics
PFI Pressure Fuel Injection
PM Permanent Magnet
RWD Rear Wheel Drive
SAE Society of American Engineers
SI Spark Ignition
UC Ultracapacitor
URE University Racing Eindhoven
WOT Wide Open Throttle

113
Symbols
Symbol Description Unit
t time s
x position m
v velocity m/s
a acceleration m/s2
m mass kg
ω rotational speed rad/s
T torque Nm
F force N
µ coefficient of friction -
L length m
A surface m2
V volume m3
mf fuel rate kg/s
n number -
E energy J
P power W
V voltage V
I current A
R resistance Ω SOE state of energy %
η efficiency -
k conductivity W/m/K
Cp specific heat J/kg/K
T temperature K
hconv convective heat transfer coefficient W/m2K
Q heat source W/m3
.
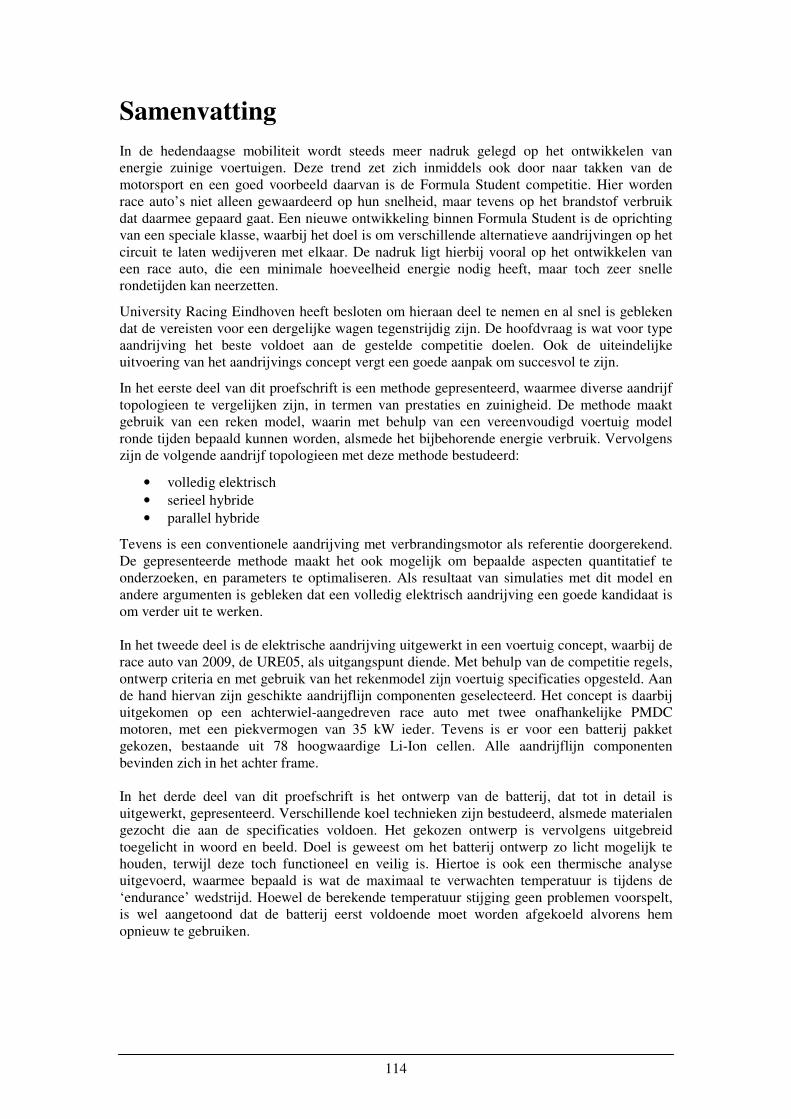
114
Samenvatting
In de hedendaagse mobiliteit wordt steeds meer nadruk gelegd op het ontwikkelen van
energie zuinige voertuigen. Deze trend zet zich inmiddels ook door naar takken van de
motorsport en een goed voorbeeld daarvan is de Formula Student competitie. Hier worden
race auto’s niet alleen gewaardeerd op hun snelheid, maar tevens op het brandstof verbruik
dat daarmee gepaard gaat. Een nieuwe ontwikkeling binnen Formula Student is de oprichting
van een speciale klasse, waarbij het doel is om verschillende alternatieve aandrijvingen op het
circuit te laten wedijveren met elkaar. De nadruk ligt hierbij vooral op het ontwikkelen van
een race auto, die een minimale hoeveelheid energie nodig heeft, maar toch zeer snelle
rondetijden kan neerzetten.
University Racing Eindhoven heeft besloten om hieraan deel te nemen en al snel is gebleken
dat de vereisten voor een dergelijke wagen tegenstrijdig zijn. De hoofdvraag is wat voor type
aandrijving het beste voldoet aan de gestelde competitie doelen. Ook de uiteindelijke
uitvoering van het aandrijvings concept vergt een goede aanpak om succesvol te zijn.
In het eerste deel van dit proefschrift is een methode gepresenteerd, waarmee diverse aandrijf
topologieen te vergelijken zijn, in termen van prestaties en zuinigheid. De methode maakt
gebruik van een reken model, waarin met behulp van een vereenvoudigd voertuig model
ronde tijden bepaald kunnen worden, alsmede het bijbehorende energie verbruik. Vervolgens
zijn de volgende aandrijf topologieen met deze methode bestudeerd:
• volledig elektrisch
• serieel hybride
• parallel hybride
Tevens is een conventionele aandrijving met verbrandingsmotor als referentie doorgerekend.
De gepresenteerde methode maakt het ook mogelijk om bepaalde aspecten quantitatief te
onderzoeken, en parameters te optimaliseren. Als resultaat van simulaties met dit model en
andere argumenten is gebleken dat een volledig elektrisch aandrijving een goede kandidaat is
om verder uit te werken.
In het tweede deel is de elektrische aandrijving uitgewerkt in een voertuig concept, waarbij de
race auto van 2009, de URE05, als uitgangspunt diende. Met behulp van de competitie regels,
ontwerp criteria en met gebruik van het rekenmodel zijn voertuig specificaties opgesteld. Aan
de hand hiervan zijn geschikte aandrijflijn componenten geselecteerd. Het concept is daarbij
uitgekomen op een achterwiel-aangedreven race auto met twee onafhankelijke PMDC
motoren, met een piekvermogen van 35 kW ieder. Tevens is er voor een batterij pakket
gekozen, bestaande uit 78 hoogwaardige Li-Ion cellen. Alle aandrijflijn componenten
bevinden zich in het achter frame.
In het derde deel van dit proefschrift is het ontwerp van de batterij, dat tot in detail is
uitgewerkt, gepresenteerd. Verschillende koel technieken zijn bestudeerd, alsmede materialen
gezocht die aan de specificaties voldoen. Het gekozen ontwerp is vervolgens uitgebreid
toegelicht in woord en beeld. Doel is geweest om het batterij ontwerp zo licht mogelijk te
houden, terwijl deze toch functioneel en veilig is. Hiertoe is ook een thermische analyse
uitgevoerd, waarmee bepaald is wat de maximaal te verwachten temperatuur is tijdens de
‘endurance’ wedstrijd. Hoewel de berekende temperatuur stijging geen problemen voorspelt,
is wel aangetoond dat de batterij eerst voldoende moet worden afgekoeld alvorens hem
opnieuw te gebruiken.

115
Nawoord en dankbetuiging
Dit proefschrift is het hoogtepunt van drie en een half jaar studie, waarvan ik twee jaar heb
doorgebracht bij het studenten race team van de Technische Universiteit Eindhoven. Het is
dan ook tot stand gekomen met de hulp van velen om mij heen. Niet alleen heb ik enorm veel
kennis en ervaring opgedaan in deze periode, maar ook een uiterst spannende en leuke tijd
gehad samen met alle team leden en andere mensen om mij heen. Het werk bij URE heeft mij
altijd enorm geboeid, mede door de intense gang van zaken, met alle ups en downs van dien.
Hoogtepunten waren het behalen van de 1e prijs voor de ontwerp wedstrijd in Engeland en bij
Audi in Duitsland. Ook de gezellige avonden, waarbij wij allen aan de auto werkten of juist
uitgelaten feest vierden, zal ik nooit vergeten. Dieptepunten zijn er ook geweest; het verliezen
van team lid en vriend Sven was een zware klap voor mij. Maar ook het uitvallen van de auto
tijdens een endurance is een onthutsende gebeurtenis waarbij de moed diep in de schoenen
wegzakt. Ondanks de moeilijke momenten kijk ik met een zeer positief gevoel terug op mijn
tijd bij de faculteit in eindhoven. Ik hoop dan ook velen die ik heb leren kennen later nog
tegen te komen.
Allereerst wil ik mijn afstudeer begeleiders Thijs van Keulen, Jacques van Rooij en Piet van
Rens zeer hartelijk bedanken voor hun inzet, om mij van het begin tot het einde van deze
afstudeer periode te ondersteunen en vooruit te helpen. Ik heb veel geleerd van jullie
wetenschappelijke kennis en benadering, en mag mij gelukkig prijzen dat ik zo’n uitgebreide
begeleiding en prettige samenwerking heb gehad.
Ook Maarten Steinbuch, Theo Hofman en Igo Besselink ben ik erkentelijk voor hun
betrokkenheid bij mijn afstudeer opdracht en het team.
Verder dank ik alle leden van URE voor de goede sfeer en mooie momenten, waarbij ik in het
speciaal Bas Verhappen, Marijn Humellink, Jan Loof, Mark Tullemans, Tim Bouwens en
Ronnie Rommens wil noemen voor de interessante discussie’s, die zeker hebben bij gedragen
aan de kwaliteit van dit proefschrift.
Graag wil ik ook mijn ouders grote dank betuigen. Pap en mam, zonder jullie steun en
vertrouwen had ik het nooit zover gebracht. Ondanks dat het soms moeilijk was om uit te
leggen met welke inhoudelijke problemen ik worstelde, hebben jullie je altijd positief en
meedenkend opgesteld en het mogelijk gemaakt voor mij om deze studie af te maken.
Tenslotte, maar zeker niet op de laatste plaats, wil ik Iris bedanken. Ik ben trots op je geduld
in deze zware eindperiode, en dat je me door dik en door dun steunt in waar ik mee bezig ben.
Ik heb aan jou altijd een luisterend oor gehad en hulp gekregen in de dagelijkse dingen, wat
goud waard was.
Loek Marquenie
Maart 2010.
Related Documents