358 IEEE TRANSACTIONS ON SYSTEMS, MAN, AND CYBERNETICS—PART C:APPLICATIONS AND REVIEWS, VOL. 40, NO. 3, MAY2010 Design of an Automatic Wood Types Classification System by Using Fluorescence Spectra Vincenzo Piuri and Fabio Scotti Abstract—The classification of wood types is needed in many industrial sectors, since it can provide relevant information concerning the features and characteristics of the final product (appearance, cost, mechanical prop- erties, etc.). This analysis is typical in the furniture industries and the wood panel production. Usually, the analysis is performed by human experts, is not rapid, and has a nonuniform accuracy related mainly to the operator’s experience and attention. This paper presents a methodology to effectively cope with the design of an automatic wood types classification system based on the analysis of the fluorescence spectra suitable for real-time applica- tions. This paper presents an experimental set up based on a laser source, a spectrometer, and a processing system, and then, it discusses a set of techniques suitable to extract features from the spectra and how to exploit the extracted feature to train an inductive classification system capable to properly classify the wood types. Obtained experimental results show that the proposed approach can achieve a good accuracy in the classification and requires a limited computational power, hence allowing for the application in real-time industrial processes. Index Terms—Automatic spectra analysis, automatic wood classification, computational intelligence. I. INTRODUCTION T HE AUTOMATIC wood classification is a problem that is present in many industrial contests such as the furniture industries and the wood panel production [1]. Different woods have different aspects, properties, and costs. The correct classification of the wood type is very important to guarantee that the final product has the required features and characteristics. For example, in the production of wood panels, the wood type influences the quantity of the glue that must be used in the panel to guarantee the proper mechanical properties. On the other side, the glue has a great impact on the final cost of the panel and effects the overall environmental impact. In the paper industry, the wood type influences the final quantity of the cellulose in the paper, and hence, the quality of the paper [2]. Usually, the analysis of the wood type in the wood industries is performed by human experts by visual inspection, but this procedure is not rapid and presents a nonuniform accuracy due to the operator’s capabilities and tiredness. More expensive chemical tests are available, but they are slow and can be done only on small samples of the produc- tion. It is known that the wood kind can be estimated from the wood emitted spectrum, but, unfortunately, the interpretation of the wood fluorescence spectrum is not a simple task that can be easily achieved by an operator in real-time industrial application. In fact, in the case of the wood-type identification, there are no unique set of peaks in the spectrum for each wood type and even small differences in the spectrum pattern are meaningful. As a results, the human identifica- tion of the wood type is not accurate and/or repeatable. In addition, more and more applications in the wood panel industry requires the usage of enormous quantities of recycled wood as a basic material, Manuscript received July 5, 2009; revised October 19, 2009. First published February 5, 2010; current version published April 14, 2010. This work was supported by the Regional Programme for Industrial Research, Innovation and Technology Transfer (PRRIITT) project Emilia-Romagna nr. 703. This paper was recommended by Associate Editor M. Last. The authors are with the Department of Information Technologies, Universit` a degli Studi di Milano, Crema CR 26013, Italy (e-mail: [email protected]). Color versions of one or more of the figures in this paper are available online at http://ieeexplore.ieee.org. Digital Object Identifier 10.1109/TSMCC.2009.2039479 even in chopped and mixed slices (a recent plant can produce up to 3000 m 3 /day of panels). In this applicative context, this kind of basic material is not suitable to be classified with a manned system, and the usage of a fast and accurate automatic identification system capable to control a continuous flow of samples coming from the feeding line of the plant is strongly required. To the best of our knowledge, no com- mercial systems are available in the market and no studies on automatic wood classification systems based on fluorescence spectra are present in the literature. This paper describes the design of an accurate and continuously uniform method for the automated classification of the wood types by a contactless measurement and classification of the wood by visible and near-IR (NIR) spectra. Experiments has been made in order to test a classification capability up to 21 different wood types. Preliminary results has been presented in [3]. This paper is structured as follows. Section II describes the state of the art of automatic wood analysis and classification, while Section III focuses on the proposed design methodology and the creation of each module composing the system. The section describes how to extract a proper feature set, and create and train different models of inductive classification systems, as well as the creation of the training and testing datasets of wood spectra. The presented methodology has shown effec- tive results with different classification models such as the k-nearest neighbor classifiers, linear, quadratic Bayesian classification systems, and supported vector machines (SVMs). Finally, it follows with the discussion of the accuracy and the performances of the overall system. II. STATE OF THE ART OF THE AUTOMATIC WOOD-TYPE ANALYSIS In the literature, the automatic analysis of timbers is achieved by following two main approach: image-based processing systems and spectrum-based processing systems. In the first category, the specific wood patterns, colors, and surface properties are analyzed by means of a specific illumination system and one or more cameras. In the latter category, a proper source of radiation is used to excite the wood surface in order to analyze the emitted spectrum. In the literature, most systems based on image processing techniques deal with the identification of surface defects (for example, knots, resin drops, cracks, broken board edges, etc.) in order to classify the boards in different quality classes during the production [4]–[7]. A system for tracking single wood board during the production is presented in [8]. This system exploits a source of light and a color camera to acquire and store the specific wood pattern of the surface of each single wood board. This system processes the images in a very similar fashion to the systems used for the human fingerprints, since the input image patterns are normalized, warped, and then converted into a compress representation (called image packet) capable to identify the board in a large repository. a similar approach capable to identity a single board based on the peculiar signal pattern produced by the local microwave absorption is presented In [9]. The paper demonstrated that this signal is discriminant, since each board has different knots and densities along the three dimensions. The identification of the wood species by image processing has been effectively addressed by the classification of the wood surface patterns. For example, the species of rain forest woods are recognized in [10] by using extracting textural wood features by using a co-occurrence matrix approach, then a trained neural network is used to achieve the final classification of the sample. The system had been tested with a dataset of 20 species obtaining a classification accuracy of 95% (tests had been carried out with only ten samples for each wood kind during the validation). A very similar approach had been tested in [11] on 1094-6977/$26.00 © 2010 IEEE

Welcome message from author
This document is posted to help you gain knowledge. Please leave a comment to let me know what you think about it! Share it to your friends and learn new things together.
Transcript

358 IEEE TRANSACTIONS ON SYSTEMS, MAN, AND CYBERNETICS—PART C: APPLICATIONS AND REVIEWS, VOL. 40, NO. 3, MAY 2010
Design of an Automatic Wood Types Classification Systemby Using Fluorescence Spectra
Vincenzo Piuri and Fabio Scotti
Abstract—The classification of wood types is needed in many industrialsectors, since it can provide relevant information concerning the featuresand characteristics of the final product (appearance, cost, mechanical prop-erties, etc.). This analysis is typical in the furniture industries and the woodpanel production. Usually, the analysis is performed by human experts, isnot rapid, and has a nonuniform accuracy related mainly to the operator’sexperience and attention. This paper presents a methodology to effectivelycope with the design of an automatic wood types classification system basedon the analysis of the fluorescence spectra suitable for real-time applica-tions. This paper presents an experimental set up based on a laser source,a spectrometer, and a processing system, and then, it discusses a set oftechniques suitable to extract features from the spectra and how to exploitthe extracted feature to train an inductive classification system capable toproperly classify the wood types. Obtained experimental results show thatthe proposed approach can achieve a good accuracy in the classification andrequires a limited computational power, hence allowing for the applicationin real-time industrial processes.
Index Terms—Automatic spectra analysis, automatic wood classification,computational intelligence.
I. INTRODUCTION
T HE AUTOMATIC wood classification is a problem that is presentin many industrial contests such as the furniture industries and
the wood panel production [1]. Different woods have different aspects,properties, and costs. The correct classification of the wood type is veryimportant to guarantee that the final product has the required featuresand characteristics. For example, in the production of wood panels, thewood type influences the quantity of the glue that must be used in thepanel to guarantee the proper mechanical properties. On the other side,the glue has a great impact on the final cost of the panel and effectsthe overall environmental impact. In the paper industry, the wood typeinfluences the final quantity of the cellulose in the paper, and hence,the quality of the paper [2].
Usually, the analysis of the wood type in the wood industries isperformed by human experts by visual inspection, but this procedureis not rapid and presents a nonuniform accuracy due to the operator’scapabilities and tiredness. More expensive chemical tests are available,but they are slow and can be done only on small samples of the produc-tion. It is known that the wood kind can be estimated from the woodemitted spectrum, but, unfortunately, the interpretation of the woodfluorescence spectrum is not a simple task that can be easily achievedby an operator in real-time industrial application. In fact, in the caseof the wood-type identification, there are no unique set of peaks inthe spectrum for each wood type and even small differences in thespectrum pattern are meaningful. As a results, the human identifica-tion of the wood type is not accurate and/or repeatable. In addition,more and more applications in the wood panel industry requires theusage of enormous quantities of recycled wood as a basic material,
Manuscript received July 5, 2009; revised October 19, 2009. First publishedFebruary 5, 2010; current version published April 14, 2010. This work wassupported by the Regional Programme for Industrial Research, Innovation andTechnology Transfer (PRRIITT) project Emilia-Romagna nr. 703. This paperwas recommended by Associate Editor M. Last.
The authors are with the Department of Information Technologies, Universitadegli Studi di Milano, Crema CR 26013, Italy (e-mail: [email protected]).
Color versions of one or more of the figures in this paper are available onlineat http://ieeexplore.ieee.org.
Digital Object Identifier 10.1109/TSMCC.2009.2039479
even in chopped and mixed slices (a recent plant can produce up to3000 m3 /day of panels). In this applicative context, this kind of basicmaterial is not suitable to be classified with a manned system, and theusage of a fast and accurate automatic identification system capable tocontrol a continuous flow of samples coming from the feeding line ofthe plant is strongly required. To the best of our knowledge, no com-mercial systems are available in the market and no studies on automaticwood classification systems based on fluorescence spectra are presentin the literature.
This paper describes the design of an accurate and continuouslyuniform method for the automated classification of the wood types bya contactless measurement and classification of the wood by visibleand near-IR (NIR) spectra. Experiments has been made in order to testa classification capability up to 21 different wood types. Preliminaryresults has been presented in [3].
This paper is structured as follows. Section II describes the state ofthe art of automatic wood analysis and classification, while Section IIIfocuses on the proposed design methodology and the creation of eachmodule composing the system. The section describes how to extract aproper feature set, and create and train different models of inductiveclassification systems, as well as the creation of the training and testingdatasets of wood spectra. The presented methodology has shown effec-tive results with different classification models such as the k-nearestneighbor classifiers, linear, quadratic Bayesian classification systems,and supported vector machines (SVMs). Finally, it follows with thediscussion of the accuracy and the performances of the overall system.
II. STATE OF THE ART OF THE AUTOMATIC
WOOD-TYPE ANALYSIS
In the literature, the automatic analysis of timbers is achieved byfollowing two main approach: image-based processing systems andspectrum-based processing systems. In the first category, the specificwood patterns, colors, and surface properties are analyzed by means ofa specific illumination system and one or more cameras. In the lattercategory, a proper source of radiation is used to excite the wood surfacein order to analyze the emitted spectrum.
In the literature, most systems based on image processing techniquesdeal with the identification of surface defects (for example, knots, resindrops, cracks, broken board edges, etc.) in order to classify the boardsin different quality classes during the production [4]–[7]. A system fortracking single wood board during the production is presented in [8].This system exploits a source of light and a color camera to acquireand store the specific wood pattern of the surface of each single woodboard. This system processes the images in a very similar fashion tothe systems used for the human fingerprints, since the input imagepatterns are normalized, warped, and then converted into a compressrepresentation (called image packet) capable to identify the board in alarge repository. a similar approach capable to identity a single boardbased on the peculiar signal pattern produced by the local microwaveabsorption is presented In [9]. The paper demonstrated that this signalis discriminant, since each board has different knots and densities alongthe three dimensions.
The identification of the wood species by image processing has beeneffectively addressed by the classification of the wood surface patterns.For example, the species of rain forest woods are recognized in [10]by using extracting textural wood features by using a co-occurrencematrix approach, then a trained neural network is used to achieve thefinal classification of the sample. The system had been tested with adataset of 20 species obtaining a classification accuracy of 95% (testshad been carried out with only ten samples for each wood kind duringthe validation). A very similar approach had been tested in [11] on
1094-6977/$26.00 © 2010 IEEE
IEEE TRANSACTIONS ON SYSTEMS, MAN, AND CYBERNETICS—PART C: APPLICATIONS AND REVIEWS, VOL. 40, NO. 3, MAY 2010 359
a dataset composed of six wood species, achieving a classificationaccuracy of 80%.
A second approach for wood-type analysis is based on the the spec-trum analysis. In this paper, we present an innovative methodologyfor the automatic characterization of wood samples has been carriedout by fluorescence spectroscopy. Such approach presents some advan-tages in comparison with those proposed in literature that are mainlybased on vibrational spectroscopic methods: such NIR [15], mid-IR(MIR) [16], [17], and Fourier-transform Raman spectroscopies [18],[19]. In particular, the Raman spectrum had been processed in [18]with genetic algorithms in order to identify the relevant lines in theRaman wood spectrum, and differentiate softwoods, hardwoods, andtropical woods, while in [19], a simple neural network was used toclassify temperate hardwoods from softwoods. Unfortunately, despitethe richness of the providing information, the vibrational spectroscopypresents several drawbacks for the industrial application both for costsand experimental difficulties for its implementation in online and real-time measurement systems operating in industrial environment. Forexample, all these techniques require normally long integration timesand expensive cooled detectors. In particular, IR measurements are af-fected by some environmental variables that are not easily controllablein the production line, such as the presence of thermal sources, dust,and humidity. As a matter of fact, the tail of the thermal radiation in thedetectors sensitivity range produces a noisy background, the randompresence of dust produces several artifacts in a long-time measurement,and some water vapor absorption bands overlap the wood spectral fea-tures useful for the recognition.
Differently from the techniques based on vibrational spectroscopy,fluorescence spectroscopy, on other hand, working in the visible spec-tral region has a higher SNR, which is unaffected by thermal noise orwater absorption, and furthermore, the high sample rate, for example,allows to reject measurement on flying particles. Fluorescence alsorepresents convenient choice due to the availability of lower cost com-ponents, such as the modern high-performance silicon-based charge-coupled device (CCD) detector and high-power diode-pumped solid-state (DPSS) laser. The use of the modulation capability DPSS laser(up to 100 KHz), together with a synchronous detection, allows a fur-ther improving of the SNR, fast measurements, and subtraction of theenvironmental light. All these features make fluorescence spectroscopyparticularly suited for real-time measurement system operating in anindustrial environment. In the next section, we propose a new method-ology based on the fluorescence spectroscopy to effectively cope withthe automatic wood-type classification.
III. MEASUREMENT SYSTEM
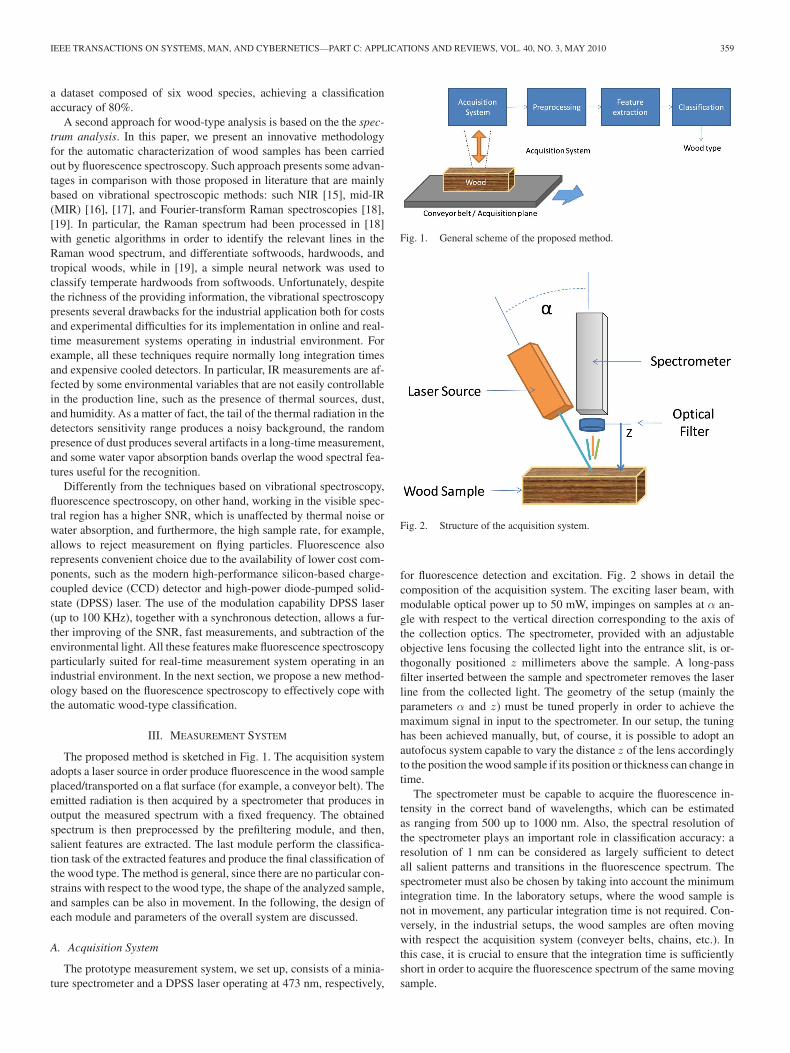
The proposed method is sketched in Fig. 1. The acquisition systemadopts a laser source in order produce fluorescence in the wood sampleplaced/transported on a flat surface (for example, a conveyor belt). Theemitted radiation is then acquired by a spectrometer that produces inoutput the measured spectrum with a fixed frequency. The obtainedspectrum is then preprocessed by the prefiltering module, and then,salient features are extracted. The last module perform the classifica-tion task of the extracted features and produce the final classification ofthe wood type. The method is general, since there are no particular con-strains with respect to the wood type, the shape of the analyzed sample,and samples can be also in movement. In the following, the design ofeach module and parameters of the overall system are discussed.
A. Acquisition System
The prototype measurement system, we set up, consists of a minia-ture spectrometer and a DPSS laser operating at 473 nm, respectively,
Fig. 1. General scheme of the proposed method.
Fig. 2. Structure of the acquisition system.
for fluorescence detection and excitation. Fig. 2 shows in detail thecomposition of the acquisition system. The exciting laser beam, withmodulable optical power up to 50 mW, impinges on samples at α an-gle with respect to the vertical direction corresponding to the axis ofthe collection optics. The spectrometer, provided with an adjustableobjective lens focusing the collected light into the entrance slit, is or-thogonally positioned z millimeters above the sample. A long-passfilter inserted between the sample and spectrometer removes the laserline from the collected light. The geometry of the setup (mainly theparameters α and z) must be tuned properly in order to achieve themaximum signal in input to the spectrometer. In our setup, the tuninghas been achieved manually, but, of course, it is possible to adopt anautofocus system capable to vary the distance z of the lens accordinglyto the position the wood sample if its position or thickness can change intime.
The spectrometer must be capable to acquire the fluorescence in-tensity in the correct band of wavelengths, which can be estimatedas ranging from 500 up to 1000 nm. Also, the spectral resolution ofthe spectrometer plays an important role in classification accuracy: aresolution of 1 nm can be considered as largely sufficient to detectall salient patterns and transitions in the fluorescence spectrum. Thespectrometer must also be chosen by taking into account the minimumintegration time. In the laboratory setups, where the wood sample isnot in movement, any particular integration time is not required. Con-versely, in the industrial setups, the wood samples are often movingwith respect the acquisition system (conveyer belts, chains, etc.). Inthis case, it is crucial to ensure that the integration time is sufficientlyshort in order to acquire the fluorescence spectrum of the same movingsample.

360 IEEE TRANSACTIONS ON SYSTEMS, MAN, AND CYBERNETICS—PART C: APPLICATIONS AND REVIEWS, VOL. 40, NO. 3, MAY 2010
Fig. 3. Structure of the proposed classification system.
An optical long-pass filter has been inserted between the sampleand spectrometer (see Fig. 2) in order to remove the laser line from thecollected light and avoid saturation effects in the spectrometer. As such,only the fluorescence spectrum and two others lines (the subharmonicof the laser and the line produced by the pumping system) will bepresent in the collected radiation by the spectrometer allowing for abetter exploitation of the dynamics of the device.
B. Preprocessing System
The exact relationship between the shape of the spectra and the woodtypes is not well known, hence it is not possible to directly design analgorithm for a classification system. On the contrary, the capabilityof the inductive classifiers to learn input–output relationships fromexamples can be exploited to create a proper classification system [20],[21]. The usage of an inductive classifier also implies the choice of aproper method to extract salient features from the input signal to beused as an input to the classifier.
In this paper, we propose a structure of the classification systempartitioned in four main modules (see Fig. 3) achieving the followingphases:
1) acquisition of the input spectra and preprocessing (N samplevectors);
2) integration of the spectrum in M contiguous bands;3) feature selection/extraction of the L values;4) classification of the wood using the L values.In the following section, the design steps required to achieve the
modules are given and compared with different techniques known inthe literature.
C. Preprocessing Algorithms
Under the described assumptions, the typical output spectra obtainedby the described acquisition system is composed by three main parts(see Fig. 4). On the bottom part of the wavelength axis, no informationis present, since the optical filter cuts the principal laser line and allother contributions. In the second part, which starts from about 500 nm,the wood fluorescence is present and it represents the salient part of thesignal. In the third part of the acquired spectrum, a laser subharmonic
Fig. 4. Prefiltering of the input signal by cropping and normalization.
can be present, typically superimposed to the right tail of the woodspectrum (together with lines of the laser optical pumping system).The preprocessing module aims to extract and normalize the segmentcontaining the wood fluorescence from the overall acquired spectrum.
Since the wavelength range of the wood fluorescence does not de-pend on experiment conditions, but is related only on the material, noparticular algorithms have to be used to adaptively select the partitionof the spectrum. In our experiments, we fixed the region of interest ofthe spectrum from λ1 = 490 nm to λ2 = 750 nm.
All parts of the spectrum signal can also be differently employed asfeedback for an autofocus system, or can be used to manually tune thesetup during the experiment, as described in the previous section, inorder to maximize the spectral power of the fluorescence.
In any case, to correctly classify the wood sample, the intensity ofthe fluorescence spectra must be normalized in order to correct theeffects related to the sample absorption, which can be very differentfrom point to point. A first approach encompassed the usage of theintensity signal of laser subharmonic (at 946 nm) or of the pumpingdiode (at 808 nm) as reference for a normalization operation. As such,given the output of the spectrometer I(λ) at different wavelength λ,the normalized spectral power P1 (λ) is given by
P1 (λ) =I(λ)
maxλ2 ≤λ(I(λ))
. (1)
Another approach that can be used to normalize the input signalI(λ) uses as reference the maximum value of the fluorescence range.In this case, the normalized spectral power P (λ) is given by
P2 (λ) =I(λ)
maxλ1 ≤λ≤λ2(I(λ))
. (2)
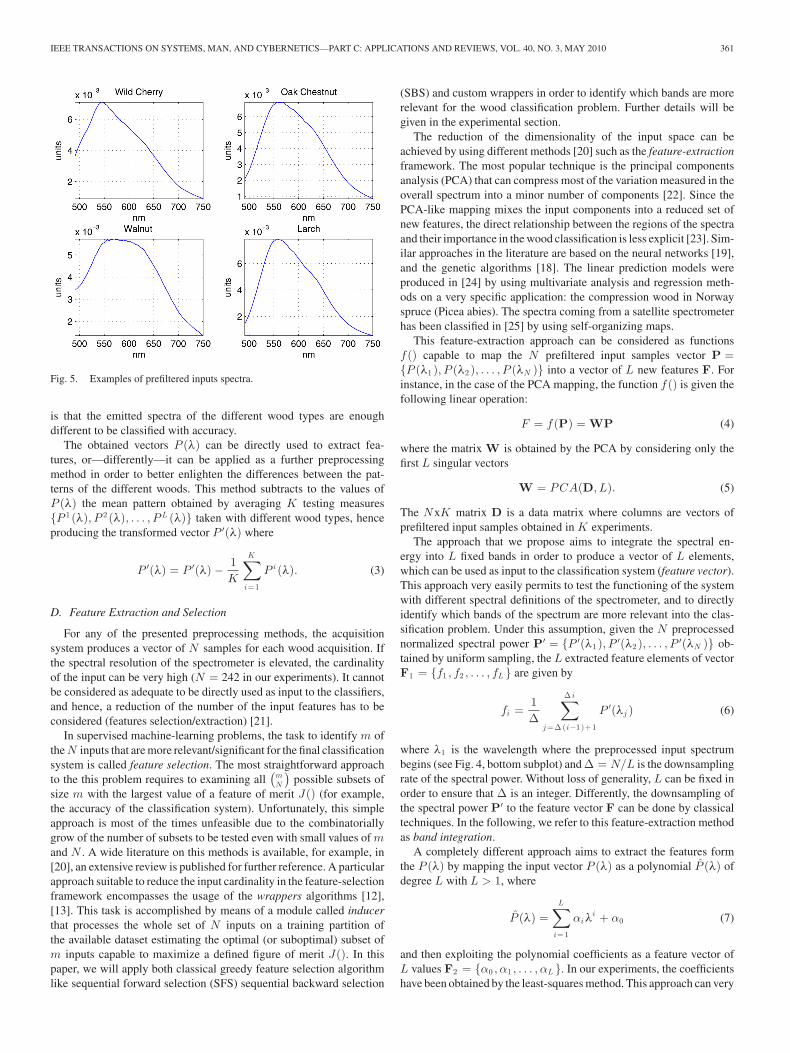
Fig. 5 plots the results of the application of this prefiltering methodapplied to the input spectra of the following wood types: Wild Cherry,Oak Chestnut, Walnut, and Larch. The main assumption that we assume
IEEE TRANSACTIONS ON SYSTEMS, MAN, AND CYBERNETICS—PART C: APPLICATIONS AND REVIEWS, VOL. 40, NO. 3, MAY 2010 361
Fig. 5. Examples of prefiltered inputs spectra.
is that the emitted spectra of the different wood types are enoughdifferent to be classified with accuracy.
The obtained vectors P (λ) can be directly used to extract fea-tures, or—differently—it can be applied as a further preprocessingmethod in order to better enlighten the differences between the pat-terns of the different woods. This method subtracts to the values ofP (λ) the mean pattern obtained by averaging K testing measures{P 1 (λ), P 2 (λ), . . . , P L (λ)} taken with different wood types, henceproducing the transformed vector P ′(λ) where
P ′(λ) = P ′(λ) − 1K
K∑
i=1
P i (λ). (3)
D. Feature Extraction and Selection
For any of the presented preprocessing methods, the acquisitionsystem produces a vector of N samples for each wood acquisition. Ifthe spectral resolution of the spectrometer is elevated, the cardinalityof the input can be very high (N = 242 in our experiments). It cannotbe considered as adequate to be directly used as input to the classifiers,and hence, a reduction of the number of the input features has to beconsidered (features selection/extraction) [21].
In supervised machine-learning problems, the task to identify m ofthe N inputs that are more relevant/significant for the final classificationsystem is called feature selection. The most straightforward approachto the this problem requires to examining all
(mN
)possible subsets of
size m with the largest value of a feature of merit J() (for example,the accuracy of the classification system). Unfortunately, this simpleapproach is most of the times unfeasible due to the combinatoriallygrow of the number of subsets to be tested even with small values of mand N . A wide literature on this methods is available, for example, in[20], an extensive review is published for further reference. A particularapproach suitable to reduce the input cardinality in the feature-selectionframework encompasses the usage of the wrappers algorithms [12],[13]. This task is accomplished by means of a module called inducerthat processes the whole set of N inputs on a training partition ofthe available dataset estimating the optimal (or suboptimal) subset ofm inputs capable to maximize a defined figure of merit J(). In thispaper, we will apply both classical greedy feature selection algorithmlike sequential forward selection (SFS) sequential backward selection
(SBS) and custom wrappers in order to identify which bands are morerelevant for the wood classification problem. Further details will begiven in the experimental section.
The reduction of the dimensionality of the input space can beachieved by using different methods [20] such as the feature-extractionframework. The most popular technique is the principal componentsanalysis (PCA) that can compress most of the variation measured in theoverall spectrum into a minor number of components [22]. Since thePCA-like mapping mixes the input components into a reduced set ofnew features, the direct relationship between the regions of the spectraand their importance in the wood classification is less explicit [23]. Sim-ilar approaches in the literature are based on the neural networks [19],and the genetic algorithms [18]. The linear prediction models wereproduced in [24] by using multivariate analysis and regression meth-ods on a very specific application: the compression wood in Norwayspruce (Picea abies). The spectra coming from a satellite spectrometerhas been classified in [25] by using self-organizing maps.
This feature-extraction approach can be considered as functionsf () capable to map the N prefiltered input samples vector P ={P (λ1 ), P (λ2 ), . . . , P (λN )} into a vector of L new features F. Forinstance, in the case of the PCA mapping, the function f () is given thefollowing linear operation:
F = f (P) = WP (4)
where the matrix W is obtained by the PCA by considering only thefirst L singular vectors
W = PCA(D, L). (5)
The NxK matrix D is a data matrix where columns are vectors ofprefiltered input samples obtained in K experiments.
The approach that we propose aims to integrate the spectral en-ergy into L fixed bands in order to produce a vector of L elements,which can be used as input to the classification system (feature vector).This approach very easily permits to test the functioning of the systemwith different spectral definitions of the spectrometer, and to directlyidentify which bands of the spectrum are more relevant into the clas-sification problem. Under this assumption, given the N preprocessednormalized spectral power P′ = {P ′(λ1 ), P ′(λ2 ), . . . , P ′(λN )} ob-tained by uniform sampling, the L extracted feature elements of vectorF1 = {f1 , f2 , . . . , fL } are given by
fi =1∆
∆ i∑
j=∆ (i−1)+1
P ′(λj ) (6)
where λ1 is the wavelength where the preprocessed input spectrumbegins (see Fig. 4, bottom subplot) and ∆ = N/L is the downsamplingrate of the spectral power. Without loss of generality, L can be fixed inorder to ensure that ∆ is an integer. Differently, the downsampling ofthe spectral power P′ to the feature vector F can be done by classicaltechniques. In the following, we refer to this feature-extraction methodas band integration.
A completely different approach aims to extract the features formthe P (λ) by mapping the input vector P (λ) as a polynomial P (λ) ofdegree L with L > 1, where
P (λ) =L∑
i=1
αiλi + α0 (7)
and then exploiting the polynomial coefficients as a feature vector ofL values F2 = {α0 , α1 , . . . , αL }. In our experiments, the coefficientshave been obtained by the least-squares method. This approach can very

362 IEEE TRANSACTIONS ON SYSTEMS, MAN, AND CYBERNETICS—PART C: APPLICATIONS AND REVIEWS, VOL. 40, NO. 3, MAY 2010
effectively reduce the dimensionality of the input space, but, otherwise,it is not possible to further extract the significance of each extractedwavelength band since the information present in the input sample hasbeen embedded in the L coefficients. Large values of L should beavoided due to the high possibility to have a bad-conditioned inversionmatrix in the least-square procedure. In the following, we refer to thisfeature-extraction method as polynomial coefficients.
A large number of features extraction and selection methods areavailable in the literature, but their comprehensive description is be-yond the scope of the presented paper. A very good review of suchmethods can be found in [20], where main available approaches arecategorized and compared. In the experimental section, the three pre-sented extraction methods are compared and discussed when adoptedto identify the different wood types by using a supervised classifier.
E. Creation and Testing of the Classification System
In this section, the last four phases of the design will be described:the creation of the dataset, the creation of the classifiers, the trainingphase of the classifiers, and the accuracies estimation of the proposedclassification systems.
As previously described, since a model for classifying the woodtypes from their spectrum patterns is not available, the usage of in-ductive classifiers has been introduced. Such classifiers can learn theclassification rules from a proper dataset of examples previously clas-sified from a supervisor by using a learning algorithm. The estimationof the accuracy of the inductive classifiers is mostly achieved by cross-validation techniques [27], and, as a consequence, it is required todivide the examples dataset in (almost) two partitions.
The first partition (the training dataset) is used to tune the system’sparameters and train the inductive classifier. In some approaches, thetraining dataset is split in more parts, each used for one of these tasks:parameters tuning and classifiers learning will be performed by usingseparated subsets of data [28]. For example, a subset of the trainingdataset can be used to test the generalization capability of the classifierdirectly during the learning phase, as it is typical in neural networksapplications [28]. The second partition (validation dataset) is used onlyonce to estimate the system classification error. More accurate tech-niques for classification error estimation can be used (e.g., the N -foldvalidation and the leave-one-out), but their computational complexitybecomes very high for large datasets [20], [28].
It is worth noting that, in order to guarantee the generality of theclassification results, all the described operations that extract param-eters from the available dataset (in this paper, the prefiltering methoddescribed in (3) and the PCA method) must be processed with a sepa-rate dataset or by considering only the training partition of the availabledataset. Differently, any usage of the validation dataset to calibrate thesystem or to process parameters of the algorithms can lead to poorgenerality of the results, in particular, to an optimistic estimation [29]of the classification error. In the literature, a great number of inductiveclassification systems are available [20] with very different peculiari-ties. In this paper, we propose and compare classifiers belonging to fourmain families: the nearest neighbor classifiers, the linear and quadraticclassifiers, and the SVMs.
The first model that we adopted is the linear Bayes normal classifier(LDA in the following), a method that builds a linear classifier betweenthe classes of the dataset by assuming normal densities with equal co-variance matrices in the input data [26]. Based on similar hypothesis,but, instead, using a second-order mapping of the input, we consideredthe quadratic Bayes normal classifier (QDC) [12], [16]. As third familyof classifier systems, we adopted the well-known k-nearest neighborclassifier with odd values of the parameter k (1,3, and 5). These clas-
sifiers store in their memory the training samples and, each time that aunclassified sample is put in input, the corresponding class is estimatedby selecting the k stored samples that are closer to the input regardingthe selected metric (the Euclidean metric in our experiments). A votingprocess is then performed, and the unclassified sample is assigned tothe class with the majority within the classes of the k selected samples.
A different approach can be considered by adopting SVMs [30].SVMs are capable to separate a training-labeled dataset with a hyper-plane that is maximally distant from the different classes present in thefeature space. In case of dataset that are not linearly separable, kernelfunctions are adopted in order to realize a nonlinear mapping of thefeature space capable to separate the classes. By this point of view, theSVM hyperplane expressed in the transformed feature space can beconsidered as a nonlinear boundary function in the input space. With-out loss of generality, let us assume that the training dataset contains nfeatures vectors F labeled with values yi ∈ {−1, +1}, k() is a kernelfunction capable to map the input features vectors F into a transformedfeature space T ∈ �N , and b is a constant real value, then the decisionboundaries of the SVM can be represented as follows:
SVM(F) = sign (〈w, k(F)〉 − b) (8)
where 〈, 〉 is the inner product. The parameters of the SVM (the hy-perplane (w, b)) can be found by maximizing the following quantitycalled margin
γ = mini
yi (〈w, k(F)〉 − b) (9)
where the quantity (〈w, k(F)〉 − b) represents the distance betweenthe feature points F and the decision boundary of the SVM. In (9),the product yi (〈w, k(F)〉 − b) is positive for correctly classified sam-ple and vice versa, and hence, the maximization operation allows forfinding the coefficients that better separate the classes by searching thelarger margin value.
SVMs have the characteristic to successfully deal with high dimen-sional feature spaces better than traditional learning paradigms [30].This property can be of great help in our context, since the extractedfeature elements (vector F) have high dimensionality, especially byusing the feature-extraction method in (6). On the contrary, the trainingprocedures are very slow, and the choice of parameters and kernels ofthe SVMs are not trivial. In our experiments, we focused on SVMsbased on Gaussian kernels, and considered the linear and the quadraticform.
The classification error of the presented classifiers has been esti-mated by using the cross-validation technique with R rotations [15].In this case, the error estimation is produced by averaging the errorobtained with R different training phases where only a portion of 1/Rof the sample is used in validation and the remaining samples in thetraining phase. After each training–validation phase, the portion of1/R sample used in the training phase is rotated in validation and newsamples will be used in the training phase. After R rotations, the pro-cess is then stopped and the mean classification error is computed. Theadvantages of this method are that all samples have been used to testthe systems in training and validation, and the obtained error gives arealistic estimation of the final performance of the classification systemwhen it will work in similar conditions in the applicative context.
If the final operative conditions will be different, a new error-estimation procedure should be considered in order to control thevariations in performances occurred. In this case, a new dataset ofclassified sample has to be collected and a new cross-validation sessionis required. It is worth noting that R different classification systems willbe created for each of the R phases of the test, and hence, a criterionto select the final classifier to be embedded in the classification systemis required. Unfortunately, the theory of inductive classifiers gives no

IEEE TRANSACTIONS ON SYSTEMS, MAN, AND CYBERNETICS—PART C: APPLICATIONS AND REVIEWS, VOL. 40, NO. 3, MAY 2010 363
general method in order to select the “proper” classifier between the Rthat have been tested [29]. As a rule of thumb, the one with the lowerclassification error can be selected. Notably, when R is high (morethen 10, for example), the size of the dataset is very large (hundredsof samples) and when the samples are randomly mixed in the dataset,the differences between the trained classifiers tend to be strongly re-duced. In order to test the real advantage of using feature-extractiontechniques in this applicative case, we considered the application ofthe PCA technique as preprocessing for the LDA, QDC, and kNN (k= 1, 2, and 3) classifiers. In the following, we refer to these systems asPCA+LDA, PCA+QDC, and PCA+1NN, respectively.
IV. EXPERIMENTAL RESULTS
A. Setup of the Acquisition Module
The prototype measurement system that we have set up consists ofa miniature spectrometer (Ocean Optics USB2000) and a frequency-doubled DPSS laser operating at 473 nm, respectively, for fluorescencedetection and excitation. Fig. 2 shows in detail the composition of theacquisition system. The exciting laser beam, with modulable opticalpower up to 50 mW, impinges on samples at α angle with respect tothe vertical direction corresponding to the axis of the collection optics.The spectrometer, provided with an adjustable objective lens focusingthe collected light into the entrance slit, is orthogonally positioned zmillimeters above the sample. A long-pass filter, with cutoff wavelengthof 500 nm inserted between the sample and the spectrometer, removesthe laser line from the collected light.
The fluorescence intensity is then measured in the spectral range be-tween 500 and 1000 nm at 1 nm resolution and with 10 ms of integrationtime. The intensity of fluorescence spectra have been normalized usingas reference signal the intensity of laser subharmonic (at 946 nm) orof the pumping diode (at 808 nm), in order to correct the effects dueto sample absorption. Such reference signals, which will be employedas feedback for an autofocus system, have been manually maximizedduring the experiment. The procedure aims to empirically identify thebetter angle α and distance z capable to maximize the overall power ofthe signal fluorescence captured by the spectrometer according to thefocal length of its objective lens. In our experiments, best results havebeen obtained with α = 45◦ and z = 12 mm. Fig. 6 reports the finalacquisition system used for the experiments.
B. Datasets and Classification Systems
The datasets have been created by using a set of the 21 differentwood types (of certified origin purchased at Woodtechnology Gmbh)belonging to the most common species. Twenty spectra for each samplehave been acquired in different points by moving the samples underirradiation. During the measurements, we ensured to probe all woodzones, namely, heartwood, sapwood, and growth ring. The 21 woodtypes belonging to the dataset with the caption number assigned by theprovider are the following: 1) Wild Cherry; 2) Oak Chestnut; 3) Walnut;4) Larch; 5) Wild Pear Tree; 6) Poplar; 7) Cembar Pine; 8) Beech Tree;9) Alnus incana; 10) Linden Tree; 11) Fraxinus xanthoxyloides; 12)Scots Pine; 13) Oak Tree; 14) Spruce; 15) Maple; 16) Taxus baccata;17) Elm; 18) Silver Fir; 19) Birch Tree; 20) Black Locust;21) Carpinus betulus.
The first classification problem that we considered-problem A—isthe binary classification between the conifer and broad-leaved woodspectra. This problem is related to the fact that, in some specific ap-plications such as the wood panel production, the properties of thewood types belonging to the same class (conifer or broad-leaved) canbe considered as similar. The second classification problem that we
Fig. 6. Picture of the acquisition system. (Left) DPSS laser of 473 nm excites(bottom right) fluorescence of wood sample, while the miniature spectrometerabove acquires the emission spectrum. The laser line is blocked by an opticallong-pass filter placed on the spectrometer.
considered—problem B—is the classification of the 21 different woodtypes. Problem B can be considered as more difficult than problem A,since the number of classes is ten time more with the same input data.
The classification error of the cited systems has been estimated usingthe cross-validation technique (using ten rotations). The test has beenapplied to all cited classifiers producing the mean classification errorand its standard deviations. For the sake of comparison, in the results oftables and figures, when a classifier X has been trained by exploiting theprincipal component analysis, it is reported as a new different classifierwith the label PCA+X.
As first step, we applied three different methods for feature selectiondirectly on the row dataset produced from the sensor. The goal was toidentify if some specific bands in the spectrum are more relevant to theclassification problem. In particular, the dataset were processed with theSFS and SBS algorithms described in [20] (adopting as kernel the k-NNclassifier with k = 1, 3, and 5 tested with the ten-fold cross-validationtechnique), and with the wrapper algorithm (W) specifically designedfor classification in industrial application proposed in [14]. Resultsindicate that there is not a specific subset of bands that are particularlyrelevant for the classification task; in fact, many different sets of featuresproduce classifiers with very similar final accuracies, and, in the caseof dataset mixing, the selected subsets are different. Results indicatethat the relevant information is probably distributed along the entirespectrum range and is not concentrated in specific bands or subbands.
As a second step, we considered the effect of the two differentprefiltering methods presented in (1) and (2). Experiments showed thatthe latter normalization method tend to better preserve the peculiarpatterns of the same wood sample during different acquisitions, andhence, it has been preferred, since it tends to reduce the intraclassseparation of the samples without particularly worsening the interclassseparation.
The application of the method expressed in (3) aims to better sepa-rate the spectrum patterns of different woods by subtracting the meanspectrum processed on a subset of wood samples. The application ofthis method allows for enlarging the interclass separation of the woodsample, although a small worsening of the intraclass neighborhood isadded. Fig. 7 shows the application of the two method (also in differentorder) to five examples of wood spectra. As can be seen, the applica-tion of the prefiltering methods can greatly improve the separation of

364 IEEE TRANSACTIONS ON SYSTEMS, MAN, AND CYBERNETICS—PART C: APPLICATIONS AND REVIEWS, VOL. 40, NO. 3, MAY 2010
Fig. 7. Application of the techniques of normalization and suppression of themean wood spectrum to five different wood spectra. The methods labeled asnormalization and mean suppression corresponds to (2) and (3), respectively.The application of the prefiltering methods increases the interclass separationof the wood samples.
Fig. 8. Classification error of the proposed classifiers on the conifer/broad-leaved problem (dataset A) by using the prefiltering methods (2) and (3) withfeature extraction (6).
interclass separations of the wood samples. Experiments showed thatthe overall effect obtained by combining the prefiltering (2) and (3) canbe considered as positive, since the accuracy of all classifiers testedwith and without these two prefiltering methods has been enhancedor, at least, did not worsen. For this reason, in the following, we willadopt this configuration of the prefiltering module. The feature selec-tion analysis (SFS, BFS, and W methods) has been repeated again afterthe application of the prefiltering methods (1), (2), and (3), without anysignificative enhancement in the final accuracy of the classifier.
1) Feature Extraction by Band Integration: In order to understandthe effect of the spectral resolution of the available power spectra, thevalues of spectral power have been integrated in M bands of the samesize, as discussed in the previous section in (6). Figs. 8 and 9 plot theaccuracy results of the tested classifiers with respect to the numberbands M used as input to the classification systems. Concerning thedataset A (the conifer/croad-leaved problem), the best classifier has
Fig. 9. Classification error of the proposed classifiers on the 21-types problem(dataset B) by using the prefiltering methods (2) and (3) with feature extraction(6).
been the SVM model with a 1.07% accuracy on dataset A with an errorstandard deviation of 0.2% when 32 spectral bands are used. Notably,most tested classifiers show comparable performance in the range of2%–4% classification error for a spectrum bar of N sample, whereN ranges from 5 to 25 for dataset A. Figs. 5 and 6 do not report theclassification error of the PCA+LDA and PCA+1NN classifiers, sincethe application of the PCA does not significantly affect the classificationerrors with respect to the LDA and 1NN classifiers.
Results indicate that the classification between conifer and broad-leaved woods can be suitably achieved with different classificationsystems with the proposed method with a remarkable accuracy. Theresults of the classification of the 21 wood types show that the classifi-cation can be achieved with a classification error of 6.4% with a 0.9%standard deviation by the QDC algorithm when 16 spectral bands areused.
The errors related to the two classification problems are very promis-ing, since they are obtained by using a single spectrum acquisition. Asecond method can also be considered: more than one spectrum acqui-sition can be taken from the same point (or considering points that arein a narrow neighborhood of the same wood sample). In this case, it ispossible to achieve different operations of classification from the samepoints/area of the sample, and then, to process an average/voting oper-ation on the class outputs. The averaging/voting method can probablyfurther reduce the classification errors effectively.
2) Feature Extraction by Polynomial Interpolation: The results ofthe feature-extraction method based on the polynomial representationof the input spectra in (7) are plotted in Figs. 10 and 11, wherethe classification error of the tested classifiers is plotted against thenumber L of the interpolation coefficients. This compact spectralrepresentation offers a good classification error in the conifer/broad-leaved problem (dataset A) arriving to the minimum value of 2.9% byusing the QDC classification system with an error standard deviationof 0.2%. In particular, three classification system presented similaraccuracy (QDC, PCA+LDC, and LDC classifiers). This best threeclassifiers produced an error that is comparable to the one achievedwith the feature extraction by band integration. The approach offeature extraction by polynomial interpolation is less accurate in the21-wood-types problem (dataset B) achieving a classification errorof 8.9% with a error standard deviation of 0.2%. In this case, mostclassifiers produced an accuracy above 10%, probably because this

IEEE TRANSACTIONS ON SYSTEMS, MAN, AND CYBERNETICS—PART C: APPLICATIONS AND REVIEWS, VOL. 40, NO. 3, MAY 2010 365
Fig. 10. Classification error of the proposed classifiers on the conifer/broad-leaved problem (dataset A) by using the prefiltering (2) and (3) with featureextraction (7).
Fig. 11. Classification error of the proposed classifiers on the 21-types prob-lem (dataset B) by using the prefiltering (2) and (3) with feature extraction(7).
feature-extraction method is less performing than the other twomethods that we presented in the identification of the complex classboundaries that are present in dataset B.
Table I resumes the obtained results on the different datasets andexperimental conditions. All the tested classifiers achieve the classifi-cation in a computational time, which ranges between 1 and 45 ms,depending on the number of inputs (the M bands) and the complex-ity of the algorithms. LDCs and 5NNs classifiers have the minimumcomputational times and the maximum computational times, respec-tively. All tests have been performed using a Pentium 1, 7-GHz, 1-GBRAM, using Windows XP Professional. The whole system has beenimplemented in MATLAB by exploiting the available toolboxes. Theobtained computational times suggest that is possible to adopt the pro-posed classification method in real-time applications.
TABLE IMAIN EXPERIMENTAL RESULTS
V. CONCLUSION
This paper presented a method for the automated classification ofwood types based on the analysis of fluorescence spectra. The proposedmethod partitions the input spectra in different bands equally spaced.The energy contained in each band is used in input to an inductive clas-sifier. Results show a good classification accuracy up to 21 differentwood types. The presented approach has a general validity, and it canbe used with spectrometers of different resolutions and with differentclassification systems, encompassing k-nearest neighbor classifiers,and linear and quadratic Bayesian classification systems. The simpleexperimental set setup and the limited overall computational complex-ity permit the adoption of the proposed method in real-time applica-tions.
ACKNOWLEDGMENT
The authors would like to thank IMAL s.r.l., San Damaso (Modena),Italy, and Dr. P. Camorani (University of Parma, Italy) for their prof-itable cooperation in the data provided and the careful classification ofsamples.
REFERENCES
[1] S. Radovan, P. George, M. Panagiotis, G. Manos, A. Robert, and D. Igor,“An approach for automated inspection of wood boards,” in Proc. Int.Conf. Image Process., 2001, pp. 798–801.
[2] H. Furumoto, “Method and device for process control in cellulose andpaper manufacture,” U.S. Patent 6 398 914, Apr. 6, 2002..
[3] P. Camorani, M. Badiali, D. Francomacaro, M. Gamassi, V. Piuri, F. Scotti,and M. Zanasi, “A classification method for wood types using fluorescencespectra,” presented at the IMTC 2008, Victoria, BC, Canada, May 12–15.
[4] S. Radovan, P. George, M. Panagiotis, and G. Manos, “An approach forautomated inspection of wood boards,” in Proc. Int. Conf. Image Process.,2001, vol. 1, pp. 798–801.
[5] P. Cavalin, L. S. Oliveira, A. L. Koerich, and A. S. Britto, Jr., “Wooddefect detection using grayscale images and an optimized feature set,” inProc. IEEE Ind. Electron. (IECON 2006), pp. 3408–3412.
[6] Z. Zhang, N. Ye, D. Wu, and Q. Ye, “Locating the wood defects withtypical features and SVM,” presented at the Int. Conf. Comput. Vis.,Pattern Recognit. Image Process., Shenzhen, China, 2008.
[7] G. A. Ruz, P. A. Estevez, and P. A. Ramirez, “Automated visual inspectionsystem for wood defect classification using computational intelligencetechniques,” in Int. J. Syst. Sci., Bristol, PA, vol. 40, pp. 163–172, 2009.
[8] G. M. Carman, P. S. Freeman, O. Heyman, and W. J. Briskey, “Woodtracking by identification of surface characteristics,” U.S. Patent 7 426 422,Sep. 16, 2008..
[9] C. Fuentealba, C. Simon, D. Choffel, P. Charpentier, and D. Masson, “Thek-nearest neighbor method for automatic identification of wood products,”presented at the Int. Conf. Electron., Commun., Comput., Los Alamitos,CA, 2004.
[10] M. Khalid, E. L. Y. Lee, R. Yusof, and M. Nadaraj, “Design of an intelligentwood species recognition system,” Int. J. Simul. Syst., Sci. Technol., vol. 9,no. 3, pp. 9–19, 2008.
[11] J. Y. Tou, Y. H. Tay, and P. Y. Lau, “Rotational invariant wood speciesrecognition through wood species verification,” in Proc. Asian Conf. Intell.Inf. Database Syst., pp. 115–120, 2009.
[12] R. Kohavi and G. H. John, “Wrappers for feature subset selection,” Artif.Intell., vol. 97, no. 1/2, pp. 273–324, Dec. 1997.
366 IEEE TRANSACTIONS ON SYSTEMS, MAN, AND CYBERNETICS—PART C: APPLICATIONS AND REVIEWS, VOL. 40, NO. 3, MAY 2010
[13] I. Guyon and A. Elisseeff, “An introduction to variable and feature selec-tion,” J. Mach. Learn. Res., vol. 3, pp. 1157–1182, 2010.
[14] C. Alippi, P. Braione, V. Piuri, and F. Scotti, “A methodological approachto multisensor classification for innovative laser material processing unit,”in Proc. IEEE Instrum. Meas. Technol. Conf. (IMTC 2001), Budapest,Hungary, vol. 3, pp. 1762–1767.
[15] S. Tsuchikawa, Y. Hirashima, Y. Sasaki et al., “A near-infrared spec-troscopic study of the physical and mechanical properties of wood withmeso- and micro-scale anatomical observation,” Appl. Spectrosc., vol. 59,pp. 86–93, 2005.
[16] M. H. Nuopponen, G. M. Birch, R. J. Sykes, S. J. Lee, and D. J.Stewart, “Estimation of wood density and chemical composition by meansof diffuse reflectance mid-infrared Fourier transform (DRIFT-MIR) spec-troscopy,” Agric. Food Chem., vol. 54, pp. 34–40, 2006.
[17] C. R. Orton, D. Y. Parkinson, P. D. Evans, and N. L. Owen, “Fouriertransform infrared studies of heterogeneity, photodegradation, andlignin/hemicellulose ratios within hardwoods and softwood,” Appl. Spec-trosc., vol. 55, pp. 960–966, 2001.
[18] B. K. Lavine, C. E. Davidson, A. J. Moores, and P. R. Griffiths, “Ramanspectroscopy and genetic algorithms for the classification of wood types,”Appl. Spectrosc., vol. 55, pp. 960–966, 2001.
[19] H. Yang, I. R. Lewis, and P. R. Griffiths, “Raman spectrometry and neuralnetworks for the classification of wood types,” Spectrochim. Acta A, Mol.Biomol. Spectrosc., vol. 55, no. 14, pp. 2783–2791, Dec. 1999.
[20] A. K. Jain, R. P. W. Duin, and J. Mao, “Statistical pattern recognition: Areview,” IEEE Trans. Pattern Anal. Mach. Intell., vol. 22, no. 1, pp. 4–37,Jan. 2000.
[21] A. Blum and P. Langley, “Selection of relevant features and examples inmachine learning,” Artif. Intell., vol. 97, no. 1/2, pp. 245–271, 1997.
[22] L. R. Schimleck, A. J. Michell, and P. Vinden, “Eucalypt wood classifi-cation by NIR spectroscopy and principal components analysis,,” AppitaJ., vol. 49, no. 5, pp. 319–324, 1996.
[23] A. Webb, Statistical Pattern Recognition. New York: Wiley, 2002.[24] J. Nystrom and O. Hagman, “Real-time spectral classification of compres-
sion wood inPicea abies,” J. Wood Sci., vol. 45, no. 1, pp. 30–37, Jan.1999.
[25] T. L. Roush and R. Hogan, “Automated classification of visible and near-infrared spectra using self-organizing maps,” in Proc. IEEE Aerosp. Conf.,2007, pp. 1–10.
[26] L. Rueda and B. J. Oommen, “On optimal pairwise linear classifiers fornormal distributions: The two-dimensional case,” Trans. Pattern Anal.Mach. Intell., vol. 24, no. 2, pp. 274–280, 2002.
[27] R. O. Duda, P. E. Hart, and D. G. Stork, Pattern Classification. NewYork: Wiley, 2001.
[28] K. Fukunaga, Introduction to Statistical Pattern Recognition. New York:Academic, 1990.
[29] C. Alippi and P. Braione, “Classification methods and inductive learningrules: What we may learn from theory,” IEEE Trans. Syst., Man, Cybern.C, Appl. Rev., vol. 36, no. 5, pp. 649–655, Sep. 2006.
[30] N. Cristianini and J. Shawe-Taylor, An Introduction to Support Vector Ma-chines and Other Kernel-Based Learning Methods. Cambridge, U.K.:Cambridge Univ. Press, 2000.
Related Documents