Clemson University TigerPrints All eses eses 5-2014 DESIGN OF A HIGH TEMPETURE SUBSURFACE THERMAL ENERGY STOGE SYSTEM Qi Zheng Clemson University, [email protected] Follow this and additional works at: hps://tigerprints.clemson.edu/all_theses Part of the Geology Commons , Power and Energy Commons , and the Sustainability Commons is esis is brought to you for free and open access by the eses at TigerPrints. It has been accepted for inclusion in All eses by an authorized administrator of TigerPrints. For more information, please contact [email protected]. Recommended Citation Zheng, Qi, "DESIGN OF A HIGH TEMPETURE SUBSURFACE THERMAL ENERGY STOGE SYSTEM" (2014). All eses. 2008. hps://tigerprints.clemson.edu/all_theses/2008

Welcome message from author
This document is posted to help you gain knowledge. Please leave a comment to let me know what you think about it! Share it to your friends and learn new things together.
Transcript

Clemson UniversityTigerPrints
All Theses Theses
5-2014
DESIGN OF A HIGH TEMPERATURESUBSURFACE THERMAL ENERGYSTORAGE SYSTEMQi ZhengClemson University, [email protected]
Follow this and additional works at: https://tigerprints.clemson.edu/all_theses
Part of the Geology Commons, Power and Energy Commons, and the Sustainability Commons
This Thesis is brought to you for free and open access by the Theses at TigerPrints. It has been accepted for inclusion in All Theses by an authorizedadministrator of TigerPrints. For more information, please contact [email protected].
Recommended CitationZheng, Qi, "DESIGN OF A HIGH TEMPERATURE SUBSURFACE THERMAL ENERGY STORAGE SYSTEM" (2014). AllTheses. 2008.https://tigerprints.clemson.edu/all_theses/2008
DESIGN OF A HIGH TEMPERATURE SUBSURFACE THERMAL ENERGY
STORAGE SYSTEM
A Thesis
Presented to
the Graduate School of
Clemson University
In Partial Fulfillment
of the Requirements for the Degree
Master of Science
Hydrogeology
by
Qi Zheng
May 2014
Accepted by:
Dr. Ronald Falta, Committee Chair
Dr. Lawrence Murdoch
Dr. James Castle

ii
ABSTRACT
Solar thermal energy is taking up increasing proportions of future power
generation worldwide. Thermal energy storage technology is a key method for
compensating for the inherent intermittency of solar resources and solving the time
mismatch between solar energy supply and electricity demand. However, there is
currently no cost-effective high-capacity compact storage technology available (Bakker
et al., 2008). The goal of this work is to propose a high temperature subsurface thermal
energy storage (HSTES) technology and demonstrate its potential energy storage
capability by developing a solar-HSTES-electricity generation system. In this work, main
elements of the proposed system and their related state-of-art technologies are reviewed.
A conceptual model is built to illustrate the concept, design, operating procedure and
application of such a system. A numerical base model is built within the TOUGH2-EOS1
multiphase flow simulator for the evaluation of system performance. Additional models
are constructed and simulations are done to identify the effect of different operational and
geological influential factors on the system performance.
Our work shows that when the base model is run with ten years operation of
alternate injection and production processes - each for a month - with a thermal power
input of 10.85 MW, about 83% of the injected thermal energy could be recovered within
each working cycle from a stabilized HSTES system. After the final conversion into
electrical energy, a relative (compared with the direct use of hot water) electricity
generation efficiency of 73% is obtained. In a typical daily storage scenario, the
simulated thermal storage efficiency could exceed 78% and the relative electricity

iii
generation efficiency is over 66% in the long run. In a seasonal storage scenario, these
two efficiencies reach 69% and 53% respectively by the end of the simulation period of
10 years.
Additional simulations reveal a thinner storage aquifer with a higher horizontal-
to-vertical permeability ratio is favored by the storage system. A basin-shape reservoir is
more favored than a flat reservoir, while a flat reservoir is better than a dome-shape
reservoir. The effect of aquifer stratification is variable: it depends on the relative
position of the well screen and the impermeable lenses within the reservoir. From the
operational aspect, the well screen position is crucial and properly shortening the screen
length can help heat recovery. The proportion of the injection/storage/recovery processes
within a cycle, rather than their exact lengths, affects the storage efficiency. Reservoir
preheating helps improve the energy storage efficiency for the first several cycles.
However, it does not contribute much to the system performance in the long run.
Simulations also indicate that buoyancy effect is of significant importance in heat
distribution and the plume migration. Reducing the gravity override effect of the heat
plume could be an important consideration in efficiency optimization.

iv
ACKNOWLEDGMENTS
I would like to take this opportunity to thank all the supervising committee
members, Dr. Ronald Falta, Dr. James Castle and Dr. Lawrence Murdoch, for their time,
guidance and support throughout the course of this work. I would especially like to
acknowledge Dr. Falta for his knowledge, wisdom, great patience and willingness to help.
I also want to thank Dr. Falta for providing me the opportunity and finical support to
work on such an interesting project.
The work presented here would not have been possible without the love and
support of my family. Specifically, I want to thank my parents. I would not have made it
this far without them.
Finally, I would like to express gratitude to Mr. Zhou, for his understanding,
continuous support from every aspect, and the encouragement during my time here.

v
TABLE OF CONTENTS
Page
TITLE PAGE .................................................................................................................... i
ABSTRACT ..................................................................................................................... ii
ACKNOWLEDGMENTS .............................................................................................. iv
TABLE OF CONTENTS ................................................................................................. v
LIST OF TABLES ........................................................................................................ viii
LIST OF FIGURES ........................................................................................................ ix
1 INTRODUCTION ................................................................................................... 1
2 TECHNOLOGY DESCRIPTION ........................................................................... 7
2.1 Research Objectives ................................................................................. 7
2.2 Technology Overviews ............................................................................ 7
2.2.1 Solar Thermal Steam Generators ...................................................... 7
2.2.2 Groundwater Heat Storage Well ..................................................... 11
2.2.3 Electricity Generation Facility. ....................................................... 12
3 EXISTING SOLAR THERMAL STORAGE METHODS ................................... 16
3.1 Main Concepts ....................................................................................... 16
3.2 Sensible TES Techniques ...................................................................... 18
3.2.1 Water ............................................................................................... 18
3.2.2 Rock Beds/Gravel ........................................................................... 22
3.2.3 Ground ............................................................................................ 23
3.2.4 Molten Salt ...................................................................................... 26
4 HSTES SYSTEM................................................................................................... 31
4.1 Important Concepts of HSTES .............................................................. 31
4.1.1 Boiling Temperature and Hydrostatic Pressure .............................. 31
4.1.2 Storage Formation .......................................................................... 32
4.1.3 Location .......................................................................................... 33

vi
Table of Contents (Continued)
Page
4.1.4 Energy Conversion ......................................................................... 36
4.2 Learning from ATES and Geological CO2 Sequestration ..................... 39
4.2.1 CO2 sequestration ........................................................................... 39
4.2.2 ATES .............................................................................................. 40
5 BASE CASE MODEL ........................................................................................... 42
5.1 Overview ................................................................................................ 42
5.2 Conceptual Model .................................................................................. 43
5.2.1 Geographical Setting ...................................................................... 43
5.2.2 Conceptual Model ........................................................................... 46
5.3 Operating Procedure .............................................................................. 49
5.4 Numerical Model Set-up ........................................................................ 52
5.5 Simulation and Analyses........................................................................ 57
5.5.1 Water Production Driving Force .................................................... 57
5.5.2 Simulation and Results ................................................................... 62
5.5.3 Wellbore Heat Loss ........................................................................ 71
5.5.4 Comparing HSTES to Other Existing Energy Storage
Methods .......................................................................................... 74
6 SYSTEM CHARACTERIZATION ...................................................................... 77
6.1 System Performance under Different Injection
Temperatures.......................................................................................... 77
6.2 System Performance in Short-term and Long-term Storages ................ 79
7 STUDY OF INFLUENTIAL FACTORS .............................................................. 85
7.1 Scenario 1: Effect of Screen Location ................................................... 87
7.2 Scenario 2: Effect of Cycle Length and I/S/P Proportion ...................... 90
7.3 Scenario 3: Effect of Preheating ............................................................ 92
7.4 Scenario 4: Effect of Storage Formation Thickness .............................. 94
7.5 Scenario 5: Effect of Permeability Anisotropy ...................................... 97
7.6 Scenario 6: Effect of Storage Formation Shape ..................................... 99

vii
Table of Contents (Continued)
Page
7.7 Scenario 7: Effect of Stratification ...................................................... 103
7.7.1 Stratification in a Half Screened System ...................................... 103
7.7.2 Stratification in a Fully Screened System ..................................... 107
8 SUMMARY ......................................................................................................... 110
9 CLOSING ............................................................................................................ 113
REFERENCE ............................................................................................................... 116

viii
LIST OF TABLES
Page
Table 1: Comparing renewable (shown as yearly potential) and
finite (shown as total recoverable reserves) planetary
energy reserves (Terawatt-years), and world’s annual
consumption (Terawatt-years) ........................................................................... 2
Table 2: Characteristics of current concentrating solar power (CSP)
technologies used in power plants ................................................................... 10
Table 3: Existing and under-construction concentrated solar
thermal power plants with thermal energy storage systems ............................ 29
Table 4: Solar thermal plants in the United States ......................................................... 34
Table 5: Base case model dimensions and general parameters ..................................... 55
Table 6: Material properties for the base case numerical model ................................... 56
Table 7: Vertical discretization of the base case numerical model ................................ 56
Table 8: Comparison of current electricity storage methods ......................................... 75
Table 9: Model settings for different cases in 7 scenarios ............................................. 86
Table 10: Operation settings for Cases 2, 3, 4 and the base case .................................. 90

ix
LIST OF FIGURES
Page
Figure 1: Main components and work flow for a solar thermal
electricity generation system with the high temperature
subsurface thermal energy storage design ........................................................... 5
Figure 2: Four types of solar collecting systems in use: a. Parabolic
Trough; b. Linear Fresnel; c. Parabolic Dish; d. Solar
Tower ................................................................................................................... 9
Figure 3: Schematic Profile of the ground thermal well ................................................ 12
Figure 4: Single flash steam power conversion system scheme .................................... 15
Figure 5: Binary power conversion system scheme ...................................................... 15
Figure 6: A simple scheme of hot water tank design ..................................................... 19
Figure 7: Principle ATES configuration ........................................................................ 20
Figure 8: Solar pond structure........................................................................................ 21
Figure 9: Cross-section of the gravel/water storage unit in Steinfurt ............................ 22
Figure 10: Two principle borehole thermal energy storage system
designs................................................................................................................ 24
Figure 11: Three basic types of borehole heat exchangers ............................................ 24
Figure 12: The aerial view of a borehole thermal energy storage
(BTES) system ................................................................................................... 25
Figure 13: Simplified scheme of a solar power plant with direct
molten salt storage system ................................................................................. 27
Figure 14: Simplified scheme of a solar power plant with indirect
molten salt storage system ................................................................................. 27
Figure 15: Boiling temperature of water as a function of
underground depth ............................................................................................. 32

x
List of Figures (Continued)
Page
Figure 16: Heat engine efficiency as a function of fluid
temperature, showing the theoretic maximum engine
conversion efficiency (Carnot efficiency and CA efficiency,
respectively) under different working fluid temperatures
(assume Tsink = 25°C) ......................................................................................... 39
Figure 17: Density of saturated liquid water is a function of
temperature ........................................................................................................ 48
Figure 18: Schematic base case conceptual model ........................................................ 48
Figure 19: Solar thermal power generation and energy demand of
the facility base in the base case scenario .......................................................... 50
Figure 20: Typical power generation from a solar field within a
day ...................................................................................................................... 50
Figure 21: Illustration of the operating procedure in the base case
model.................................................................................................................. 52
Figure 22: Base case numerical model scheme (radial cross-
sectional profile) ................................................................................................ 54
Figure 23: Wellbore grid profile showing the setting of DELV
condition at the wellhead ................................................................................... 60
Figure 24: Recovery flow rate under different outlet pressures with
PI=2×10-12
m3 .................................................................................................... 61
Figure 25: Recovery flow rate under different outlet pressures with
PI=5×10-12
m3 .................................................................................................... 62
Figure 26: Truncated radial cross-sections showing evolution of
the hot zone around the well: Left column shows the
temperature distribution after the injection period and right
column after the recovery period within the same cycle.
Pictures in the same column compare hot zone profiles at
the same stage of different cycles. ..................................................................... 64

xi
List of Figures (Continued)
Page
Figure 27: Formation temperature distribution and evolution
around the wellbore for the base case model. (Rescaled
with a horizontal exaggeration factor of 25) ...................................................... 66
Figure 28: Averaged efficiencies for each cycle over 60 cycles (10
years) with a preheating time of 2 months ......................................................... 71
Figure 29: Thermal energy storage efficiency plots comparing
system performance with and without the wellbore based
on the base case model ....................................................................................... 74
Figure 30: Thermal energy storage efficiency of cases with
different injection temperature ........................................................................... 78
Figure 31: Engine efficiency and relative electricity generation
efficiency of the storage system under different injection
temperatures ....................................................................................................... 79
Figure 32: Energy efficiency of the daily I-S-P-S cyclic case ....................................... 81
Figure 33: Thermal energy storage efficiency plot as a function of
time for the seasonal storage case with a ten-year time span ............................ 84
Figure 34: Cross-sectional profiles showing the evolution of the
heat plume within the ......................................................................................... 84
Figure 35: A screen location scheme: cross-sectional profiles
showing the design of both half screened and fully screened
cases ................................................................................................................... 88
Figure 36: Thermal energy storage efficiency plots for Scenario 1:
comparing system performance between the half screened
and the fully screened case. ............................................................................... 89
Figure 37: Reservoir cross-sectional profiles at the end of the
injection and production processes of the 60th
cycle
showing the difference in two cases .................................................................. 89
Figure 38: Thermal energy storage efficiency for cases with
different cycle lengths and I/S/P proportions..................................................... 91

xii
List of Figures (Continued)
Page
Figure 39: Thermal energy storage efficiency plots and cumulative
thermal energy storage efficiency plots comparing system
performance with and without preheating ......................................................... 93
Figure 40: Cross-sectional profiles showing the evolution of the
heat plume in the reservoir in cases with and without
preheating ........................................................................................................... 93
Figure 41: Thermal energy storage efficiency as a function of time
for cases with different storage formation thickness ......................................... 96
Figure 42: Cross-sectional profiles showing different temperature
distribution and evolution in reservoirs of different
thicknesses ......................................................................................................... 96
Figure 43: System thermal energy storage efficiency as a function
of time under different horizontal anisotropy .................................................... 98
Figure 44: Cross-sectional profiles showing different temperature
distribution and evolution in storage reservoirs with
different horizontal permeability anisotropy factors .......................................... 99
Figure 45: Schemes of three formation shapes: Vertical and radial
cross-sections illustrate the construction of these formation
shapes in the models ........................................................................................ 101
Figure 46: Thermal energy storage efficiency as a function of time
for cases with different storage formation shape ............................................. 102
Figure 47: Cross-sectional profiles showing different temperature
distribution at the end of the 30th cycle for cases with
different formation shape ................................................................................. 103
Figure 48: Thermal energy storage efficiency as a function of time
for cases with different stratification under scenario of half
screen ............................................................................................................... 105
Figure 49: Cross-sectional profiles showing different temperature
distribution at the end of the injection and production
period of the 30th cycle.................................................................................... 106

xiii
List of Figures (Continued)
Page
Figure 50: Thermal energy storage efficiency as a function of time
for cases with different stratification under the scenario of
full screen ......................................................................................................... 107
Figure 51: Cross-sectional profiles showing different temperature
distribution at the end of the injection and production
period of the 30th cycle for the fully screened cases with
different stratification....................................................................................... 109

1
1 INTRODUCTION
Fossil fuels including crude oil, coal and gas, play a crucial role in the global
economy. The modern world relies on them to produce electricity for a variety of
industrial and residential usage. However, they are finite and nonrenewable resources.
While the supply is limited (Table 1), the world energy consumption is huge and
continually growing. According to the report of EIA and DOE (2013), with world GDP
rising by 3.6% per year, world energy use will grow by 56% between 2010 and 2040.
Total world energy use will rise from 17.7 Twy (terawatt-years) in 2010 to 21.2 Twy in
2020 and up to 27.6 Twy in 2040.
Due to the perceived scarcity of fossil fuels, there has been continuous research
over decades for the economic and efficient use of alternative energy. They are
becoming even more popular in recent years due to the rise in the cost of fossil fuels,
concerns about air pollution and global warming and the caution on nuclear power after
the 2011 nuclear disaster at Fukushima, Japan. Being clean and abundant (Table 1),
renewable power sources bring both environmental benefits and energy security.
Among the renewables, solar energy is the most abundant and accessible
candidate. The amount of solar energy our earth receives from the sun in just one hour is
already more than what we consume in the whole world for one year (Perez and Perez,
2009). Solar power is the only known candidate to have the technical potential to greatly
exceed the present final energy consumption of non-renewable energies (Park et al.,
2014). The potential of other individual renewable resources all seem to be limited to
much lower values. Being a clean energy, it can also significantly reduce the greenhouse

2
gas emissions. Assessments reveal that the lifecycle greenhouse gas emission for typical
solar PV electricity generation is averaged to be 49.9g CO2-eq/kWh (Nugent and
Sovacool, 2014) while it is about 440g CO2-eq/kWh on average for natural gas power
plants in US (Middleton and Eccles, 2013). On the other hand, given current policies and
regulations, worldwide energy-related carbon dioxide emissions are projected to increase
46% by 2040, reaching 45 billion metric tons in 2040 (DOE, 2013). A sustainable, low-
carbon future requires such renewable energy transition.
Table 1: Comparing renewable (shown as yearly potential) and finite (shown as total recoverable
reserves) planetary energy reserves (Terawatt-years), and world’s annual consumption (Terawatt-
years) [Source: Perez and Perez (2009); DOE (2013) ]
Renewable
Finite
World Energy Consumption
(Twy/year) (Twy) (Twy)
Solar 33,000
Coal 900
2010 17.7
Wind 25-70
Petroleum 240
2030 21.2
OTEC[1] 3 -11
Natural Gas 215
2050 27.6
Biomass 2-6
Uranuium 90-300
Hydro 3-4
Geothermal 0.3-2
Tides 0.3
[1] OTEC: Ocean thermal energy conversion
However, just as for most other types of renewable energies, inherent
intermittency makes achieving the potential of solar energy more difficult. Solar output
varies throughout the day and through the seasons, and is affected by weather conditions.
The bulk of solar power is produced during summer, whereas the electricity demand is

3
high in winter and summer. Throughout a day, the sunlight is most intensive and
productive around midday while the peak electricity demand occurs in the evening during
summer, and in both morning and evening during winter (Soirce: Pasic Power). The cost
of generating, distributing and maintaining electricity by the utility companies
during peak hours is higher that during non-peak periods (Agyenim et al., 2010).
Currently, most ―peak‖ loads in US are gas-fired because they are able to quickly ramp
up and down generation. As a consequence, electricity generation is becoming one of the
fastest growing uses of natural gas. Accordingly, many power companies have adopted
―Time-of-Day‖ price plans, raising electricity rates during ―on-peak‖ hours and
rewarding customers with credits for ―off-peak‖ use to reduce the peak stress. Hence,
there is a great potential for effective energy storage systems that can shift excess power
produced at times of low-demand, low-generation cost or from intermittent renewable
energy sources for release at times of high-demand, high-generation cost or when the
intermittent power source is cut off.
Dispatchable power generation could have more advantages when applied in
developing countries. Most developing countries have rich renewable energy sources and
relatively labor-intensive systems that could harness them. By developing appropriate
energy storage methods, those countries could reduce their dependency on fossil fuels,
creating energy supply structures that are less vulnerable to price rises in fuels (Martinot
et al., 2002). The same thing applies to off-grid remote regions and isolated areas as well.
In the case of scattered populations, extending the grid may not be an economic option.
Local power production and mini-scale grids can provide a more sustainable and cost
4
effective alternative (Nieuwenhout et al., 2001). The increase in the continuity and
dispatchability of electricity from renewable sources calls for effective energy storage.
Appropriate energy storage methods are not only pursued by power stations to
serve the purpose of regular diurnal and seasonal buffers for dispatchable power
generation but are also favored by public institutions and manufacturers as backups to
energy supply disruption. Without them, power outages can cause severe consequences to
places like hospitals or military bases. Grid energy disruptions, such as the one faced by
the Japanese economy after the earthquake and tsunami in 2011, emphasize the need for
reliable, hardened energy storage systems that can support large installations for a period
of days or weeks. However, conventional backup power is limited and very expensive.
For example, a cost effective grid scale energy storage system with the ability to provide
1000 megawatt-hours (MW-h) of electrical generation capacity would represent a
significant breakthrough in energy security for installations of large institutions. This
equates to delivery of 1.34 megawatt (MW) of electricity continuously over a one-month
period (enough to support a town of ~3000 people). To generate this amount of
electricity from diesel backup generators would require consumption of 90,000 gallons of
diesel fuels.
In this study, we propose and demonstrate a high-temperature subsurface energy
grid scale storage system: the high-temperature subsurface thermal energy storage
(HSTES) system. This type of system could be used as a buffer for small to medium size
solar power stations to match the intermittent production with grid demand. It could also
serve as a backup source, even ―strategic energy reserve‖ for a particular building, system,

5
or even an entire base or installation to maintain the critical functions of facilities there in
the event of grid disruption. The system could store energy from traditional high-
temperature solar collectors, other renewable sources, and eliminates the need for fossil
fuel supply. Take the storage of solar thermal energy for example: the hot water heated
by solar collectors can be injected through an underground well into a permeable
confined formation, where it is stored. When electricity is needed, the hot water is
recovered from the well and flashed into steam to drive a turbine. The steam is
subsequently condensed and can be reused as the solar thermal absorbent medium in the
solar collector field. The main components and basic work flow are illustrated in Figure 1.
This energy production from hot water is identical to conventional geothermal power
production, except in our case, the heat has been harvested from the sun. Once the
desired amount of heat storage in the formation is obtained, the solar thermal system can
be used to directly generate electricity, with only intermittent ―topping off‖ of the
subsurface heat storage system.
Figure 1: Main components and work flow for a solar thermal electricity generation system with
the high temperature subsurface thermal energy storage design

6
Another advantage of the HSTES system is the reuse of unproductive geothermal
wells. Although geothermal has many proven technologies, only one in five deep
geothermal-exploration wells historically have become commercially viable (Taylor,
2007). For example, the Twentynine Palms Marine Corps Base in California drilled an
exploratory 3000-foot-deep well in 2011, in order to evaluate the geothermal energy
potential. Unfortunately, the downhole temperature in this well was only about 90°C,
which is too low to support geothermal production of electricity. However, these kinds
of wells would likely be ideal for our proposed technology, where we would seek to
increase the water temperature up to levels where electricity could be efficiently
produced.
7
2 TECHNOLOGY DESCRIPTION
2.1 Research Objectives
By conducting detailed research, we want to:
1) Illustrate the complete process from solar energy collecting, to subsurface
solar thermal energy storage, through final power generation;
2) Provide the technology options for the major components of such a system
(solar thermal systems, groundwater heat wells, and electricity generation equipment);
3) Compare energy storage efficiency to conventional alternatives, such as stored
diesel fuel, pumped water, batteries, or compressed air systems;
2.2 Technology Overviews
The proposed system will have three main elements: high temperature solar
thermal steam generators, a groundwater heat storage well and the solar thermal
electricity generation facility. All three components are mature with a great amount of
practical experience. Little to no new technology will be required to enable a HSTES
system.
2.2.1 Solar Thermal Steam Generators
Solar collectors are used to gather the solar energy, transform its radiation into
heat, and then transfer that heat to a fluid. There are mainly four types of solar collecting
systems in use. Parabolic trough technology is currently the most commercially mature
large-scale solar power technology (Price et al., 2002).
1) Parabolic Trough Technology:

8
The parabolic trough collectors use a curved, mirrored trough to reflect the direct
solar radiation onto a receiver tube containing a heat transfer fluid placed in the trough’s
focal line (Figure 2a). The troughs are designed to be able to track the sun along one axis
(Fernández-García et al., 2010; Price et al., 2002; Yogi Goswami, 1998).
2) Linear Fresnel technology:
Linear Fresnel reflectors (Figure 2b) make use of the Fresnel lens effect which
enables the reflecting mirrors to have large apertures and short focal lengths, reducing the
amount of material needed. Long, flat or slightly curved mirrors focus sunlight onto a
linear absorber running across all the reflectors’ common focal points (Mills and
Morrison, 2000). Working thermal fluid is thus heated in the absorber. The Linear
Fresnel technology is a competitive alternative to parabolic troughs. Its advantages
include simplified plant design and minimized internal energy losses. Also, its lower
structural costs and the feature of low wind loads have reduced the investment and
maintenance costs, respectively (Häberle et al., 2006).
3) Parabolic Dish Technology:
Within a Parabolic dish collector system, small parabolic dishes form a large
overall dish-shape collector (Figure 2c). All these small dishes concentrate solar energy
at a single focal point. A stirling engine coupled to a dynamo is placed at the focus to
convert energy adsorbed into electricity directly (Yogi Goswami, 1998).
4) Solar Power Tower:
A significant advantage of central solar tower systems comparing with linear
systems is their ability to produce high temperature fluid or steam. In such a system,

9
well-arranged flat heliostats (sun-tracking mirrors) reflect sunlight right on to the receiver
located on the top of the tower (Figure 2d). The working fluid in the receiver is thus
heated and will be used to generate electricity later (Segal and Epstein, 2001; Yogev et al.,
1998; Yogi Goswami, 1998).
Figure 2: Four types of solar collecting systems in use: a. Parabolic Trough; b. Linear Fresnel; c.
Parabolic Dish; d. Solar Tower [Modified from Quaschning (2003)]
Table 2 provides the characteristics and performance data for the four main types
of concentrating solar power (CSP) technologies.

10
Table 2: Characteristics of current concentrating solar power (CSP) technologies used in power
plants [Data source: Müller-Steinhagen and Trieb (2004); Trieb (2009)]
Concentration Method Line Concentrating System Point Concentrating System
Solar Field Type Parabolic Trough Linear Fresnel Central Receiver Parabolic
Dish
State of the Art commercial pre-commercial demonstrated Demonstrated
Typical Unite Size (MW) 10-200 10-200 10-150 0.01-0.4
Operating Temperature (°F) 390-550 270-550 550-1000 800-900
Concentration 70-80 25-100 300-1000 1000-3000
Heat Transfer Fluid synthetic oil,
water/steam
synthetic oil,
water/steam
air, molten salt,
water/steam Air
Themodynamic Power Cycle Rankine Rankine Brayton, Rankine Stirling,
Brayton
Power Unit steam turbine steam turbine gas turbine, steam
turbine
Sterling
engine
Cost of Solar Field ($/m2) 275-350 200-275 350-400 > 475
Land Use (m2·MW·h-1·y-1) 6-8 4-6 8-12 8-12
Capacity Factor [1] 24% (d)
25-70% (p) 25-70% (p) 25% (p) 25-70% (p)
Peak Solar Efficiency [2] 21% (d) 20% (p) 20% (d)
29% (d) 35% (p)
Annual Solar Efficiency 10-15% (d)
9-11% (p) 8-10% (d) 16-18% (d)
17-18% (p) 15-25% (p)
Thermal Cycle Efficiency 30-40% ST 30-40% ST 30-40% ST 30-40% Stirl
45-55% CC 20-30% GT
Experience high low moderate Moderate
Reliability high unknown moderate High
Interation to the Environment difficult simple moderate Moderate
Construction Requirements demanding simple demanding Moderate
Operating Requirements demanding simple demanding Simple
(d) = demonstrated; (p) = projected; ST = steam turbine; GT = gas turbine; CC = combined cycle.
solar operating hours per year[1] Capacity Factor
8760 hours per year
net power generation[2] Solar Efficiency
incident beam radiation
In our system, we would use the Linear Fresnel Reflectors for relatively lower
temperature (130°C-290°C) steam generation due to their significantly low cost and easy
operation requirements and Parabolic Trough Reflectors for higher temperature (200°C-
300°C) steam production.

11
There are several vendors available to provide this element. Take the Compact
Linear Fresnel reflectors provided by Areva Solar for example, pressurized hot water
could be generated directly from a one-pass water stream as the working fluid, or
generated from heat transfer fluids and heat exchangers. The cycling water would be
supplied from a groundwater supply well (resulting in no net water demand), or from
waste water. The collectors can generate up to 2050 MWh of heat per acre, per year of
collection (Source: Areva Solar webpage). Fluid temperatures up to 480°C are possible
with this type of solar thermal system, with pressures up to 16.7 MPa (~1700 meters of
water pressure).
2.2.2 Groundwater Heat Storage Well
In our thermal storage system, a groundwater well would need to be installed into
a confined reservoir: an underground permeable stratum bounded by upper and lower
impermeable layers. Such a deep formation under high hydrostatic pressure is like a
naturally pressurized vessel which can be used to prevent the formation of steam vapor
and maintain the temperature of the injected hot water. A schematic profile is provided in
Figure 3 for the case of storing 250°C hot water. It is a single well system. The well is
screened inside the aquifer and hot water is injected and recovered from the same well.
This element of the system is not difficult to obtain. The design requirements of
such a well are very similar to those of a high-temperature geothermal well. Hence, a
high-temperature geothermal well can be directly used as a groundwater heat storage well
with slight modification.

12
A more detailed illustration of the storage mechanism and formation is provided
in Section 5.
Figure 3: Schematic Profile of the ground thermal well
2.2.3 Electricity Generation Facility
Depending on the temperature, phases of water produced and chemical properties of the
storage formation, there are three basic technologies available to convert the steam to
electricity:
1) Flash Systems
High hydrostatic pressure keeps high-temperature water as liquid deep in the
ground. However, as the hot water moves up along the wellbore during the producing

13
process, when the pressure drops to the vapor pressure, sudden boiling happens. Liquid
water ―flashes‖ to steam which increases the pressure until a dynamic equilibrium is
achieved. Hence a mixture of liquid water and steam is produced from the well. In a
Flash System, steam is separated from the mixture in a separator under a low pressure
and then runs the turbine to power the generator. This is called a ―Single Flash‖ system
(DiPippo, 2012b). A ―Double Flash‖ system includes two steam separators and turbines
(DiPippo, 2012a). Steam flashes twice and turns two turbines. It is more effective than a
single flash system and is used more widely today. A schematic illustration of a typical
flash system is provided in Figure 4.
This type of system often applies when the source temperature is between 170°C
and 260°C.
2) Binary Cycle Systems
For sources with temperatures lower than those in flash steam systems, a
technology known as ―Binary Cycle‖ (also known as ―Rankine Cycle‖) can make use of
fluids of relatively lower temperatures (74°C-177°C) to produce electricity. These
systems are now being used for low-temperature geothermal applications, such as a
system in Alaska that generates 200 kW of electricity from a geothermal water stream
with a temperature as low as 74°C (Taylor, 2007). A graphic illustration of a binary
system is shown in Figure 5. It contains four main components: a boiler, a turbine, a
cooling tower and a feed pump. Besides the geothermal fluid, it often uses an organic
fluid with a much lower boiling point than water is used as the working fluid (hence,
known as ―organic‖ Rankine cycle). In such a system, the two fluids do not mix with

14
each other throughout the whole process. Heat transfers from the geothermal fluid
(dominantly hot water, steam or the mixture of the two) to the working fluid (a
hydrocarbon such as isopentane, or a refrigerant) through a heat exchanger where the
working fluid flashes to vapor and drives the turbines. The cooled geothermal fluid is
then injected back into the ground through another well at a different location so the
cycle can begin anew. Theoretically, 100% of the geothermal fluid can be retrieved
(Taylor, 2007). This closed cycle reduces the emissions to near zero and contributes to
the conservation of the reservoir pressure, thereby extending project lifetime.
3) Combined Systems
To make use of a larger portion of the thermal energy, a flash/binary combined
cycle is sometimes used. In such a system, geothermal fluid first flashes to generate the
steam to drive the turbine. Then the low-pressure steam exiting the backpressure turbine
is turbine is condensed in a binary system.
In our case, a flash system could be used if the temperature of fluid produced after
storage is high and a binary system could be applied if the temperature is lower. Complex
systems intergrading different processes can also be used. Once the commercial energy
grid is disrupted, a self-sustaining system utilizing conventional geothermal energy
technology could provide electrical power for a site (pending full system start-up, a small
diesel or battery powered generator may be used to pump the hot water out of the heat
storage well).

15
Figure 4: Single flash steam power conversion system scheme [Modified from Taylor (2007)]
Figure 5: Binary power conversion system scheme [Modified from Taylor (2007)]
16
3 EXISTING SOLAR THERMAL STORAGE METHODS
3.1 Main Concepts
One of the main issues impeding solar thermal technologies from fully achieving
their potential is the development of efficient and cost-effective means for thermal
storage. Before looking into the HSTES system we proposed, a brief review of the
existing solar thermal storage methods is given in this section to introduce the concepts
and techniques of solar thermal energy storage.
Current thermal energy storage (TES) methods are classified into three main
categories according to different storage mechanisms: chemical heat storage, latent heat
storage and sensible heat storage.
1) The chemical heat storage method makes use of the character of some
chemicals that they can absorb/release a large amount of thermal energy when they
break/form certain chemical bonds. It can be subdivided into chemical reactions method
which stores heat in reversible reactions and thermo-chemical method which stores heat
by an endothermic desorption process and release heat through an exothermic process
(Pinel et al., 2011). Chemical storage has the highest storage capacity, but the problems
such as the requirement of complicated reactors for specific chemical reactions, weak
long-term durability (reversibility) and the uncertain stability of chemicals restrict its
application (Tian and Zhao, 2013).
2) The latent heat storage (LHS) methods store energy in some kinds of materials
with a high heat of fusion known as Phase Change Materials (PCM). This method takes
advantage of the fact that at the fusion temperature, substances undergo a phase change

17
associated with a large amount of energy absorption/release without changes in
temperature. The PCMs may undergo solid–solid, solid–liquid and liquid–gas phase
transformations (Cárdenas and León, 2013). They are capable of storing and releasing
large amounts of heat while they are melting and solidifying at a specific temperature.
Research on PCM materials and storage design is increasing in interest in recent years
because of its potential in improving energy storage efficiency and the fact that it can
store and release thermal energy at nearly constant temperature (Aceves-Saborio et al.,
1994). Since the phase-transition enthalpy of PCMs are usually much higher (100-200
times depending on the materials) than sensible heat (Tian and Zhao, 2013), latent heat
storage usually has very high storage density. However, the weak heat transfer
performance is a big limitation. The system usually needs enhancement in design through
the application of fins, enhancing thermal conductivity, application of tube-in-shell
TES technology, and application of micro-capsulation (Agyenim et al., 2009; Akgün et
al., 2008).
Liu et al. (2012) provided a detailed review on storage materials and performance
enhancement for high temperature PCM systems. In this review, inorganic salts and salt
composites as well as metals and metal alloys used or with the potential to be used as
PCMs are provided which could be referred to for more information.
3) Finally, the sensible heat storage method utilizes an increase or decrease of the
storage material temperature. It stores heat as internal energy without phase change. It is
usually much simpler and cheaper than other storage methods. According to Gil et al.
(2010), current sensible heat storage materials have a wide range of working

18
temperatures (200°C-1200°C), and excellent thermal conductivities: 1.0 W/(m∙K) to 7.0
W/(m∙K) for sand-rock minerals, concrete and fire bricks, 37.0 W/(m∙K) to 40.0 W/(m∙K)
for ferroalloy materials. However, they have a big disadvantage of low heat capacities,
typically range from 0.56 kJ/(kg∙°C) to 1.3 kJ/(kg∙°C). This will result in huge storage
units if they are constructed above ground.
Pinel et al. (2011) summarized the main sensible heat storage methods available
today and categorize them by the different storage median they use: water, rock beds
(gravel) and soil.
3.2 Sensible TES Techniques
3.2.1 Water
The simplest method is to use water itself as a heat storage medium directly.
Because of its simplicity, cheap price and wide availability, there are a significant amount
of published data on the design criteria for various water heat storage media (Abhat, 1980;
Duffie et al., 1976; Garg et al., 1985; Wyman et al., 1980). Using heat-insulated water
tanks is the most straightforward way. The water tank can either be an open system in
which heat is transported along with water flowing through the tank or more commonly,
a closed system in which heat is transferred between two separate (inside and outside)
cycles through a heat exchanger. One such design is shown in Figure 6.

19
Figure 6: A simple scheme of hot water tank design
Aquifer thermal energy storage (ATES) systems make use of underground water
and the substrate it occupies to store the thermal energy. They use groundwater for the
heat transport into and out of an aquifer via a well doublet or a multi-well system.
Aquifers hold great promise for underground energy storage. In many systems, the heat
source for aquifer thermal energy storage (ATES) is solar collectors. Several large-scale
projects related to low to medium temperature underground storage of waste heat from
co-generation plants and incineration plants are in planning in Europe and the US (Sanner
and Knoblich, 1998). As illustrated in Figure 7, its main components include surface
facilities and two thermal wells. The basic working process is: during winter time, warm
ground water is pumped out from a warm store region and is pumped through a heat
exchanger to provide heat for residential space heating. Then the cooled water will be
injected back into the specific region for cold storage in the aquifer. When hot summer
comes, the stored cold water will be used to cool the space. The warmed water will be

20
injected to the underground warm store region in the aquifer. Hereby, a seasonal repeated
cycle forms. ATES is a very promising technology today due to its high storage capacity.
It is especially suitable for large scale and longtime storage and it has been successfully
applied to a number of sites. Dincer and Rosen (2002) have provided a very
comprehensive review to this technology. Other review of the state-of-the-art can be
found in Kranz and Frick (2013); Lee (2010); Novo et al. (2010) and Paksoy et al. (2009).
Some large scale ATES projects in practice are provided in the work of Desmedt et al.
(2007); Paksoy et al. (2004); Vanhoudt et al. (2011) and Wigstrand (2010). However,
currently proposed ATES technologies and projects in application or under construction
are all relatively low temperature thermal energy storage systems and are not useful for
electricity generation.
Figure 7: Principle ATES configuration [Modified from Andersson (2007)]

21
Surface water can also be used for thermal storage. Some natural or artificially
constructed ponds (known as solar ponds) take advantage of a vertical salinity gradient to
trap solar thermal energy at the bottom of the pond. As is shown in Figure 8, a solar pond
is a pool of saltwater. Salt concentration is highest at the bottom and decreases upward.
Such a gradient impedes heat convection in the pond and thus highly reduces heat loss to
the atmosphere.
Most such water-storing methods are simple and cheap. However, they experience
the problem of temperature limitations due to water’s low boiling point (100°C at the
atmosphere pressure). This limits their applications in electricity generation. Except for
the hot water/steam tank, water as the thermal storage medium, is mostly applied in low-
to-medium temperature systems such as space heating and cooling.
Figure 8: Solar pond structure
22
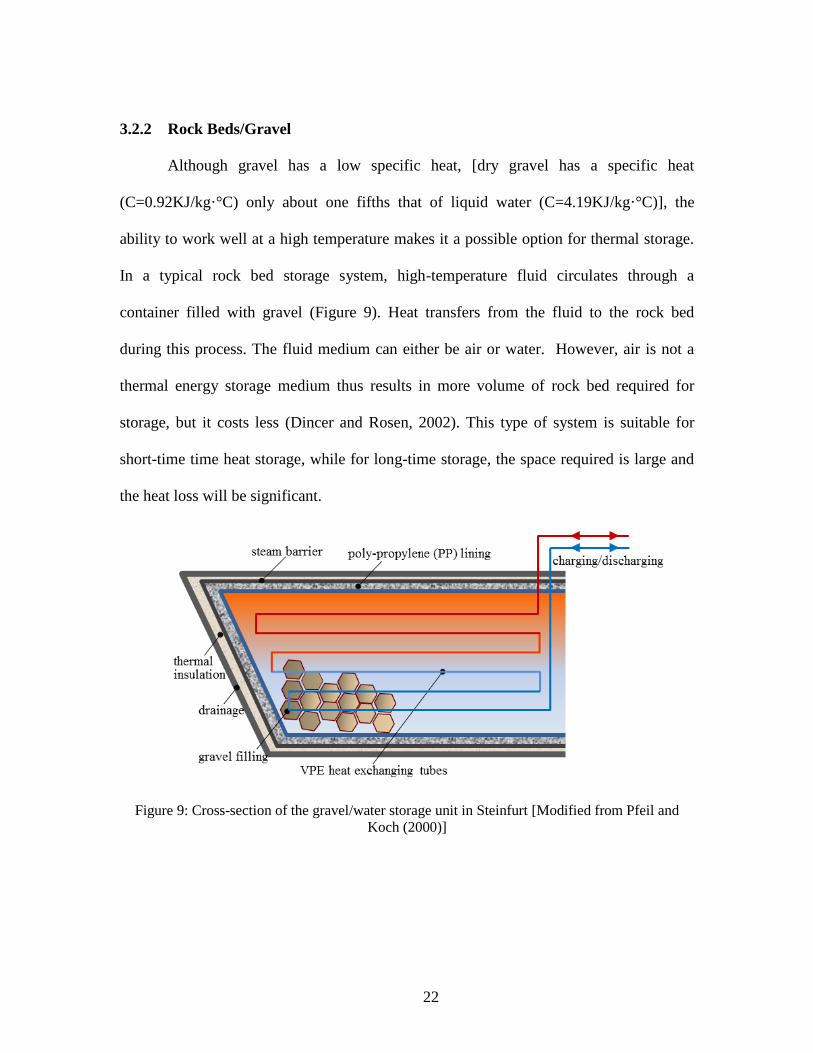
3.2.2 Rock Beds/Gravel
Although gravel has a low specific heat, [dry gravel has a specific heat
(C=0.92KJ/kg·°C) only about one fifths that of liquid water (C=4.19KJ/kg·°C)], the
ability to work well at a high temperature makes it a possible option for thermal storage.
In a typical rock bed storage system, high-temperature fluid circulates through a
container filled with gravel (Figure 9). Heat transfers from the fluid to the rock bed
during this process. The fluid medium can either be air or water. However, air is not a
thermal energy storage medium thus results in more volume of rock bed required for
storage, but it costs less (Dincer and Rosen, 2002). This type of system is suitable for
short-time time heat storage, while for long-time storage, the space required is large and
the heat loss will be significant.
Figure 9: Cross-section of the gravel/water storage unit in Steinfurt [Modified from Pfeil and
Koch (2000)]

23
3.2.3 Ground
Ground can also be used to store thermal energy. A common means of ground
source thermal energy storage is to insert tubes (vertical boreholes or horizontal pipes) in
the ground and circulating hot water in the soils. Such system is also called the borehole
thermal energy storage (BTES) system. In a BTES system, since heat is stored directly
into the ground, the storage system does not have an exactly separated storage volume.
The heat is transferred to the underground by means of conductive flow from a number of
closely spaced boreholes (Pavlov and Olesen, 2011). Generally, boreholes are backfilled
with high thermal conductivity materials (known as grouting materials) to provide good
thermal contact with the surrounding soil and prevent contamination of the ground water.
There are two basic borehole designs: open system and closed system, as
illustrated in Figure 10. In an open system, the injecting pipe has its opening near the
bottom while the opening of the extraction pipe closes at the top. The two pipes do not
connect to each other directly. The closed system uses u-pipes as heat exchangers. Fluid
circulates in a closed loop.
The borehole can be equipped with different kinds of borehole heat exchangers,
making the borehole act as a large heat exchanger between the system and the ground
(Figure 11). The most common borehole heat exchanger is the U-tube. It can be further
optimized to a more efficient multiple U-tube system. Heat is charged or discharged by
these vertical borehole heat exchangers. At charging, the flow direction is from the center
to the boundaries of the system to obtain high temperatures in the center and lower ones
at the boundaries. At discharging the flow direction is reversed (Schmidt et al., 2004).

24
An aerial view of such a borehole thermal energy storage (BTES) system is shown in
Figure 12. Heat or cold is delivered or extracted from the underground by circulating a
fluid in a closed loop through the boreholes.
Figure 10: Two principle borehole thermal energy storage system designs
Figure 11: Three basic types of borehole heat exchangers
For ground thermal storage, systems of all sizes have been built, from a building
scale to very large. The requirements of such a system are not restrict. The strata can be
most type of soils and rocks and the depth has a wide range from 50 to 300 m. Also such

25
a can exist under a variety of land covers. It can serve the purpose of inter-seasonal heat
transfer.
Another application of the ground in thermal energy storage is as the insulator for
hot water tanks. Normally, underground hot water tanks have higher efficiency than
surface tanks and require almost no surface land use.
However, although ground thermal storage method is a commercially mature
technology, it is mainly applied in low-to-medium temperature water storage. Such
systems are generally used to serve the purpose of space heating and cooling. To our
knowledge, there is no ground thermal storage system applied in large-scale power
generation so far.
Figure 12: The aerial view of a borehole thermal energy storage (BTES) system (After DLSC,
available at http://www.dlsc.ca/)

26
3.2.4 Molten Salt
Molten salt could be used both as PCM as well as sensible TES material. At
present, it is more commonly used as sensible thermal storage material in practice.
Molten salt storage is a very important TES concept as well as a major storage trend in
solar thermal power plants. For systems with temperature above 100°C, molten salts are
attractive candidates for sensible heat storage in liquids. The major advantages of molten
salts are high heat capacity, high density, high thermal stability, relatively low cost, high
viscosity, nonflammability, and low vapor pressure (Bauer et al., 2013). In general, there
is experience with molten nitrate salts from a number of industrial processes related to the
heat treatment of metals and heat transfer fluid (HTF) usage. The use of molten salts or
steam as a HTF and storage material at the same time eliminates the need for expensive
heat exchangers. It allows the solar field to be operated at higher temperatures than
current heat transfer fluids allow.
At present, the two-tank molten salt storage is the only commercially available
technology for large thermal capacities being suitable for solar thermal power plants.
There are two concepts of molten salt storage systems: direct molten salt storage system
and indirect molten storage system. The direct system uses molten salt as both heat
transfer fluid and heat storage medium as illustrated in Figure 13. Such a system is in use
at Solar Tres, Archimede Sicily and some other solar thermal power plants. The other
concept is the indirect system, which allows the separation of the storage medium and
HTF via a heat exchanger. A simplified scheme of such an indirect system is illustrated in
Figure 14. The two-tank active indirect molten salt storage system is widely used in

27
parabolic trough solar thermal plants such as Andasol, Arcosol 50, El Reboso III, and
Manchasol-1. Table 3 provides more information on different thermal energy storage
systems in existing and under-construction concentrated solar thermal power plants .
Figure 13: Simplified scheme of a solar power plant with direct molten salt storage system
[Modified from Ortega et al. (2008)]
Figure 14: Simplified scheme of a solar power plant with indirect molten salt storage system
[Modified from Pacheco et al. (2002)]

28
Besides the above most common sensible TES methods, there are also other
methods and materials proposed, such as the direct storage of synthetic oil, storing in
ionic liquids or storage in solid materials such as alumina, alloys and concrete.
Overall, although there are a great number of TES methods proposed and tested,
some of them can only be used in systems of low-to-medium temperature, which are not
suitable for the application in electrical power generation. Among the high temperature
storage methods, oil storage can lead to dangerous fires. The major storage trend - molten
salt- experiences the problem of unwanted freezing during operation as a result of their
high freezing points. Other limitations might include relative high costs, corrosion, and
the hygroscopic property of some salts (Bauer et al., 2013).
Cost-effective high temperature solid TES are demonstrated but have not been put
in large scale power generation applications. At present, they have drawbacks of high
cost, low efficiency, limited storage capacity and other problems depending on the
material.

29
Table 3: Existing and under-construction concentrated solar thermal power plants with thermal energy storage systems [Modified from Liu
et al. (2012)]
Project and location
Total capacity
Solar
collecting
technology
HTF in solar field Storage concept
Storage capacity
Full load
storage time Storage material
Storage temp
(°C)
(MWe) (MWh) (h) Cold Hot
SEGS I-IX Mojave Desert, California, USA
354 Parabolic trough
Mineral oil (SEGS
I); Synthetic oil
(SEGS II-IX)
Two-tank active direct (SEGS I)
120
(SEGS I) 0.3
Mineral oil (SEGS I)
240 307
Andasol Andalusia, Spain 200 (4×50) Parabolic
trough Synthetic oil
Two-tank active
indirect 1010 5
28,500 tons
molten salt 291 384
Extresol Torre de Miguel
Sesmero,
Spain
100 (2×50) Parabolic trough
Synthetic oil Two-tank active indirect
1010 10 28,500 tons molten salt
N.A. N.A.
Nevada Solar One Boulder City, Nevada, USA
64 Parabolic trough
Synthetic oil N.A. 32 0.5 N.A. N.A. N.A.
Arcosol 50 San José del
Valle, Spain 50
Parabolic
trough Synthetic oil
Two-tank active
indirect 1010 20
28,500 tons
molten salt N.A. N.A.
La Florida Badajoz, Spain 50 Parabolic
trough Synthetic oil
Two-tank active
indirect 1010 20
29,000 tons
molten salt N.A. N.A.
El Reboso III Sevilla, Spain 50 Parabolic trough
Synthetic oil Two-tank active indirect
116 2.3 Molten salt N.A. N.A.
La Dehesa La Garrovilla,
Spain 50
Parabolic
trough Synthetic oil
Two-tank active
indirect 1010 20
29,000 tons
molten salt N.A. N.A.
Manchasol-1 Alcazar de San
Juan, Spain 50
Parabolic
trough Synthetic oil
Two-tank active
indirect 375 7.5
28,500 tons
molten salt N.A. N.A.
Archimede Sicily, Italy 5 Parabolic
trough Molten salt
Two-tank active
direct 100 20
1580 tons
molten salt N.A. N.A.
Puerto Errado 1 Calasparra,
Spain 1.4 Linear Fresnel Water
Single-tank
(thermocline) N.A. N.A. N.A. N.A. N.A.
Puerto Errado 2 Calasparra, Spain
30 Linear Fresnel Water Single-tank (thermocline)
N.A. N.A. N.A. N.A. N.A.
Gemasolar (Solar Tres)
Fuentes de Andalucía, Spain 15 Power Tower Molten salt
Two-tank active
direct 600 40
6250 tons
Molten salt 290 565
Planta Solar 10 Sevilla, Spain 11 Power Tower Water Active direct 20 1.8 Pressured water 285oC at
50 bar 250-300
Planta Solar 20 Sevilla, Spain 20 Power Tower Water Active direct N.A. N.A. Steam-ceramic N.A. N.A.
31
4 HSTES SYSTEM
4.1 Important Concepts of HSTES
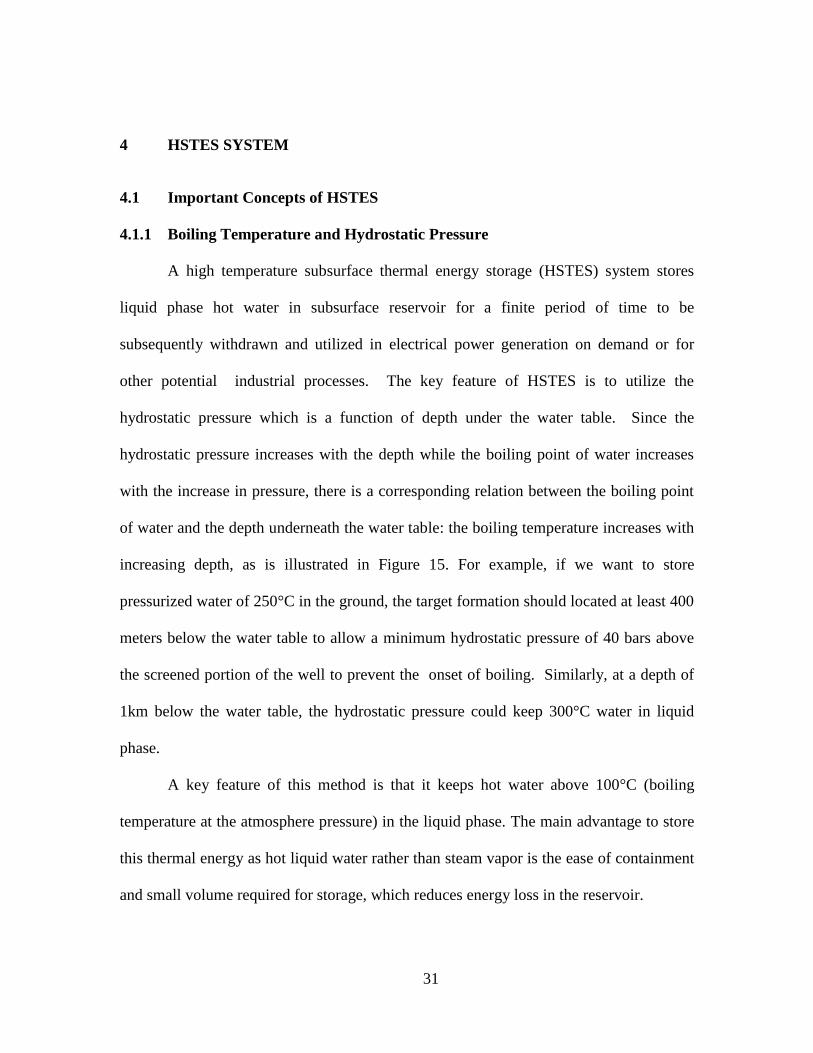
4.1.1 Boiling Temperature and Hydrostatic Pressure
A high temperature subsurface thermal energy storage (HSTES) system stores
liquid phase hot water in subsurface reservoir for a finite period of time to be
subsequently withdrawn and utilized in electrical power generation on demand or for
other potential industrial processes. The key feature of HSTES is to utilize the
hydrostatic pressure which is a function of depth under the water table. Since the
hydrostatic pressure increases with the depth while the boiling point of water increases
with the increase in pressure, there is a corresponding relation between the boiling point
of water and the depth underneath the water table: the boiling temperature increases with
increasing depth, as is illustrated in Figure 15. For example, if we want to store
pressurized water of 250°C in the ground, the target formation should located at least 400
meters below the water table to allow a minimum hydrostatic pressure of 40 bars above
the screened portion of the well to prevent the onset of boiling. Similarly, at a depth of
1km below the water table, the hydrostatic pressure could keep 300°C water in liquid
phase.
A key feature of this method is that it keeps hot water above 100°C (boiling
temperature at the atmosphere pressure) in the liquid phase. The main advantage to store
this thermal energy as hot liquid water rather than steam vapor is the ease of containment
and small volume required for storage, which reduces energy loss in the reservoir.

32
Figure 15: Boiling temperature of water as a function of underground depth
4.1.2 Storage Formation
To reduce heat loss under free convection, sandwich-like formations below the
required depth are selected for heat storage. This type of formation would consist of a
permeable layer (e.g., a sedimentary stratum) bounded by two impermeable strata
(confining layers). A groundwater well would be installed into the permeable layer with
screen open to the permeable storage formation (reservoir) for hot water injection and
recovery.
-2500
-2000
-1500
-1000
-500
0
0 50 100 150 200 250 300 350 400
Wat
er
De
pth
(m
)
Boiling Temperasture (°C)

33
4.1.3 Location
The HSTES system could be constructed at a variety of sites. For the application
in solar power generation, two key factors that should be considered are suitable geology
and abundant solar resource.
1) Solar resource
Overall, the United States has abundant solar resources. Solar insolation in the
southwestern US is excellent, equivalent to that of Africa (Bugaje, 2006) and Australia
(Hutchinson et al., 1984), which contain the best solar resources in the world. Among the
three countries with most industrialized solar power generation in the world at present
(US, Germany and Spain), the majority of the States has batter solar resource than Spain
which is considered the best in Europe, and is much higher than Germany (Price, 2010).
According to the solar technologies market report of DOE (Price, 2010), the solar
insolation levels in US range from about 1,250-2,500 kWh/m2/year. The variation of
solar resource only has a factor of 2, which is relatively homogeneous compared to other
renewable resources. Overall, a large portion of the United States has abundant solar
resources and could meet the first requirement of the solar-hybrid HSTES system.
California, Nevada, Texas, Utah, Colorado and Florida are most favorable for the
system’s development. Currently, most US solar thermal power plants are concentrated in
the southwest (Table 4).

34
Table 4: Solar thermal plants in the United States [Modified from Tian and Zhao (2013)]
Capacity
(MW) Name Location
Solar collecting
technology
Heat transfer fluid Thermal storage Notes
400 Ivanpah solar
power facility
San
Bernardino County, CA
Solar power
tower
Water (249°C–
566°C)
No storage, using
natural gas as backup
3 units: Ivanpah 1, 2 and 3.
Ivanpah 1 and 2:
100 MW each Ivanpah 3: 200
MW; completed
in 2013
354 SEGS I-IX
Mojave
Desert,
CA
Parabolic trough
Mineral oil
(SEGS I)
synthetic oil (SEGS
II-IX)
(349°C–390°C)
Two-tank active
direct storage
(SEGS I)
9 units,
completed in
1984
280
Solana
generating
station
West of Gila Bend, AZ
Parabolic trough
Material: N.A. up to 371°C
6 h heat storage molten salts
Completed in 2013
250 Genesis solar Blythe, CA Parabolic trough
Therminol VP-1; up to 393°C
No storage, using
natural gas as
backup
2 units: 125 MW
each, under
construction
75
Martin next generation
solar energy
center
Florida Parabolic
trough, ISCC Thermal oil N.A.
Integrated Solar Combined Cycle,
completed in
2010
64 Nevada solar one
Boulder City, NV
Parabolic trough
Synthetic oil
0.5 h of heat
storage; storage type: N.A.
Completed in 2007
5
Kimberlina
solar thermal energy plant
Bakersfield,
CA
Fresnel
reflector Water No storage
Completed in
2008
5 Sierra sun
tower
Lancaster,
CA
Solar power
tower
Water (218°C–
440°C) No storage
Completed in
2009
2 Keahole solar power
Keahole Point , HI
Parabolic trough
Xceltherm-600 (93°C–176°C)
2 h of heat
storage;
storage type: N.A.
Completed in 2009
1.5 Maricopa
solar Peoria, AZ
Parabolic dish
stirling N.A. No storage
Completed in
2010
1 Saguaro solar
power
Red Rock,
AZ
Parabolic
trough
Xceltherm-600 and n-pentane
(120°C–300°C)
No storage, using natural gas as
backup
Completed in
2006

35
2) Geology
The basic geologic requirement for the storage system is a confined permeable
stratum at a depth where the hydrostatic pressure is enough to prevent boiling of the
stored hot water. Just like geological CO2 sequestration, sedimentary basins are very
attractive candidates. Sedimentary basins are regions of long-term subsidence creating
accommodation space for infilling by sediments (Allen and Allen, 2009). They are of
tectonic origin and are gradually filled with deposition such as sandstones, mudrocks,
limestone, etc., and compaction of sediments eroded from surrounding mountains. They
range in size from as small as hundreds of meters to large parts of ocean basins.
Typically, sedimentary basins consist of alternating layers of coarse or porous and
fine-textured sediments (Benson and Orr, 2008). Permeable and impermeable layers are
interbedded with each other. Highly porous sediments such as sandstone, limestone and
dolomite are highly permeable and thus have great storage potential for the injected hot
water. Some fine sediments with very low permeability such as clay and shale are
suitable for sealing the storage formation to prevent rapid vertical flow of the injected hot
water.
There are a number of sedimentary basins in the United States. Coleman and
Cahan (2012) listed 142 main basins in their USGS report Preliminary catalog of the
sedimentary basins of the United States. Those basins provide plenty of potential
capacities to develop HSTES systems over the country. Being a basin does not ensure the
suitability for the development of the storage system. Further study of geological
requirements and influential factors that may affect the system performance is provided

36
in Section 7. However, in practical operation, there are still far more factors than what are
discussed in this thesis that need to be taken into consideration, according to the real site
conditions.
4.1.4 Energy Conversion
The thermal energy stored in a HSTES system will finally be converted to
electrical energy on demand via a heat engine. In thermodynamics, the Second Law of
Thermodynamics limits the energy conversion from heat into work.
The most efficient work-producing engine theoretically possible is the reversible
heat engine, or namely, the Carnot engine. The highest conversion efficiency possible is
thus the Carnot efficiency. In the efficiency calculation of thermal power plants, either
flash or binary, Carnot efficiency is usually taken as a rough estimation of the upper limit
of efficiency (Mendrinos et al., 2012). In 1824, Nicolas Léonard Sadi Carnot introduced
an ideal engine which operates on a cycle in a reversible way and described the principle
(later known as Carnot’s theorem) that specifies the limits on the maximum efficiency
that any heat engine can obtain, which thus solely depends on the difference between the
hot and cold temperature reservoirs.
Carnot's theorem states (Sonntag et al., 1998):
1) All ideal engines operating between a pair of heat reservoirs (thermostats) of
temperatures sin kT and sourceT , with sin kT < sourceT , is equally efficient, regardless of the
working substance employed or the operation details.
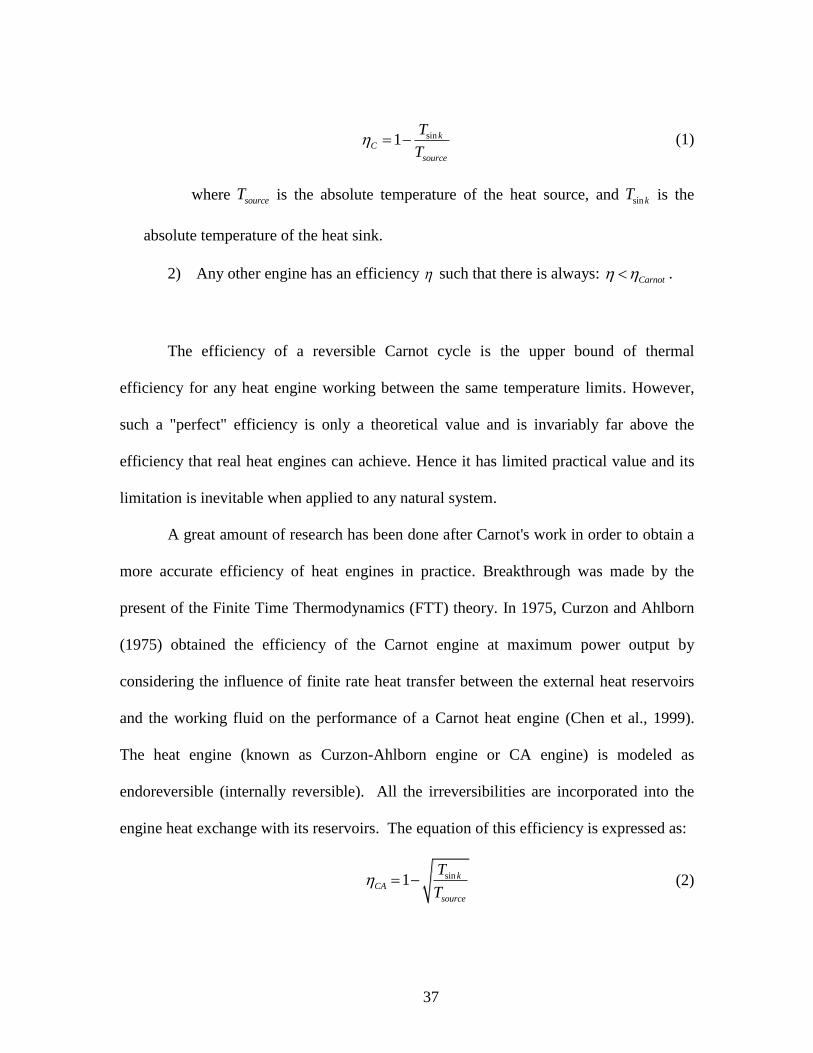
This efficiency (Carnot efficiency) can be expressed as:
37
sin1 kC
source
T
T (1)
where sourceT is the absolute temperature of the heat source, and sin kT is the
absolute temperature of the heat sink.
2) Any other engine has an efficiency such that there is always: Carnot .
The efficiency of a reversible Carnot cycle is the upper bound of thermal
efficiency for any heat engine working between the same temperature limits. However,
such a "perfect" efficiency is only a theoretical value and is invariably far above the
efficiency that real heat engines can achieve. Hence it has limited practical value and its
limitation is inevitable when applied to any natural system.
A great amount of research has been done after Carnot's work in order to obtain a
more accurate efficiency of heat engines in practice. Breakthrough was made by the
present of the Finite Time Thermodynamics (FTT) theory. In 1975, Curzon and Ahlborn
(1975) obtained the efficiency of the Carnot engine at maximum power output by
considering the influence of finite rate heat transfer between the external heat reservoirs
and the working fluid on the performance of a Carnot heat engine (Chen et al., 1999).
The heat engine (known as Curzon-Ahlborn engine or CA engine) is modeled as
endoreversible (internally reversible). All the irreversibilities are incorporated into the
engine heat exchange with its reservoirs. The equation of this efficiency is expressed as:
sin1 kCA
source
T
T (2)

38
It is not difficult to see by comparing Eqs. (1) and (2) that the CA efficiency is
always lower than the Carnot efficiency under the same condition. For example, assume a
25°C heat sink (cooling tower, etc.), engine efficiencies under different heat source
temperatures calculated from two processes respectively, are plotted in Figure 16. As is
shown in the figure, the CA efficiency is much lower than the Carnot efficiency with the
same source and sink temeprature. Curzon and Ahlborn (1975) emphasized that Eq. (2)
could serve as quite an accurate guide to the best observed performance of real heat
engines. In study of this theory, Bejan (1988) obtained practical thermal efficiency data
from ten fossil fueled and nuclear power plants, plotted them with the theoretical values
of CA efficiency and Carnot efficiency. Very good agreement between the CA results
and experimental data was found. Further research work in non-equilibrium
thermodynamics of practical systems confirmed the importance of the CA process for
evaluating the bounds on the production or consumption of the mechanical energy from
thermal energy in a finite time (Sieniutycz, 2009). Overall, research proved that the CA
process provides a far more realistic bound than the Carnot process for the efficiency
estimation of heat engines operating at maximum power. Hence in this paper, the CA
process is adopted to estimate the efficiency of electrical power generation from thermal
energy.
From Figure 16, it is not difficult to see the heat engine efficiency is a nonlinear
function of the temperature. Both plots show the general trend that the higher the heat
source temperature, the more efficient the energy conversion will be. At low source
temperatures, the maximum efficiency is low yet increases rapidly with increasing

39
temperature, while as source temperature increases higher, the increasing trend flattens. It
can also be obtained that when use hot water directly from the solar collectors at 250°C,
the heat engine efficiency is about 25%.
Figure 16: Heat engine efficiency as a function of fluid temperature, showing the theoretic
maximum engine conversion efficiency (Carnot efficiency and CA efficiency, respectively) under
different working fluid temperatures (assume Tsink = 25°C)
4.2 Learning from ATES and Geological CO2 Sequestration
There are some parallels between HSTES and geological CO2 sequestration and
aquifer thermal energy storage (ATES).
4.2.1 CO2 sequestration
For subsurface CO2 storage and hot water storage, the principal requirements of
the geological storage formation are the same: a large permeable storage stratum and an
impermeable sealing formation to prevent the escape of stored fluid. Moreover, the
densities and viscosities of the injected supercritical CO2 and superheated water are all
0%
10%
20%
30%
40%
50%
60%
70%
80%
90%
100%
0 50 100 150 200 250 300 350 400
Effi
cie
ncy
Temperature (°C)
Heat engine efficiency under different temperatures
Carnot efficiency
CA efficiency
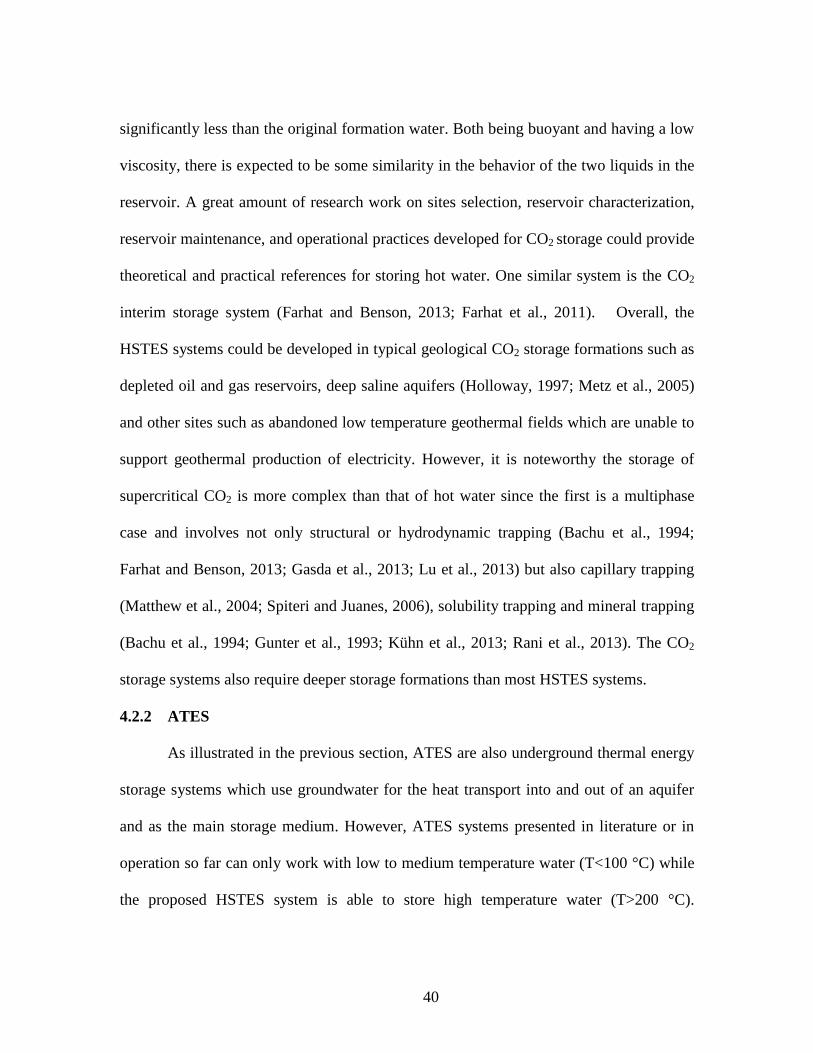
40
significantly less than the original formation water. Both being buoyant and having a low
viscosity, there is expected to be some similarity in the behavior of the two liquids in the
reservoir. A great amount of research work on sites selection, reservoir characterization,
reservoir maintenance, and operational practices developed for CO2 storage could provide
theoretical and practical references for storing hot water. One similar system is the CO2
interim storage system (Farhat and Benson, 2013; Farhat et al., 2011). Overall, the
HSTES systems could be developed in typical geological CO2 storage formations such as
depleted oil and gas reservoirs, deep saline aquifers (Holloway, 1997; Metz et al., 2005)
and other sites such as abandoned low temperature geothermal fields which are unable to
support geothermal production of electricity. However, it is noteworthy the storage of
supercritical CO2 is more complex than that of hot water since the first is a multiphase
case and involves not only structural or hydrodynamic trapping (Bachu et al., 1994;
Farhat and Benson, 2013; Gasda et al., 2013; Lu et al., 2013) but also capillary trapping
(Matthew et al., 2004; Spiteri and Juanes, 2006), solubility trapping and mineral trapping
(Bachu et al., 1994; Gunter et al., 1993; Kühn et al., 2013; Rani et al., 2013). The CO2
storage systems also require deeper storage formations than most HSTES systems.
4.2.2 ATES
As illustrated in the previous section, ATES are also underground thermal energy
storage systems which use groundwater for the heat transport into and out of an aquifer
and as the main storage medium. However, ATES systems presented in literature or in
operation so far can only work with low to medium temperature water (T<100 °C) while
the proposed HSTES system is able to store high temperature water (T>200 °C).

41
Generally, ATES is used in space heating and cooling and has not been used in thermal
energy storage for power generation. Another difference between the two storage systems
is that most ATES systems are composed of a well doublet or a multi-well system. It has
a warm zone and a separate cold zone under the ground: the hot water and the cold water
do not mix. Despite these differences, the storage medium, storage mechanism and even
the operation of these two underground thermal energy storage systems are almost the
same. In that regard, the extensive research on ATES could offer quite a number of
references to the development and assessment of the proposed HSTES system. This will
be further discussed in Section 7.

42
5 BASE CASE MODEL
5.1 Overview
Assessing the technical feasibility and predicting the performance of the
technology is the first and foremost task before developing the HSTES system in reality.
Hence, there is the need to develop a base case model for the demonstration of the design
and the evaluation of the system performance. Due to the complexity of the problem, and
lack of experimental study and field data from similar cases, numerical modeling is used
to simulate the behavior of the storage system in this study.
In this section, sections 5.2 and 5.3 will provide a detailed illustration on the
development of a conceptual base case model of the HSTES system and the basic
operating process used in this model. Section 5.4 -5.5 will focus on the development of a
numerical model based on the conceptual model using the TOUGH2 multiphase flow
simulator (Pruess et al., 1999) and the quantitative analysis based on the numerical
simulation results.
With the conceptual model and the simulation tools, we will be able to conduct an
assessment of the system. In this study, the technology assessment will be composed of
three key components:
1) Computing the recovery rate of the injected thermal energy to evaluate the
energy efficiency of the storage system;
2) Assessing the pressure reaction during injection and production;

43
3) Simulating the spatial and temporal distributions of the thermal plume;
analyzing the evolution of injected hot water in the aquifer, explaining the observed
phenomenon and further predicting the long term performance of the system;
5.2 Conceptual Model
5.2.1 Geographical Setting
In this section, a base case model will be constructed to assess the performance of
the proposed HSTES system.
As described in Section 4, HSTES systems would be developed at locations with
both abundant solar resource and deep (h>400 m in this case) confined aquifers. In the
base case model, we consider applying it in California, where 11 out of 18 announced
solar thermal power plants in the United States are located. California has five major
aquifer systems, four of which consist primarily of basin-fill deposits occupying tectonic
depressions (Planert and Williams, 1995): the Basin and Range basins, the Central Valley,
the Coastal Basins, and the northern California basin-fill aquifers. The Ground Water
Atlas of the United States (Harris and Baker, 2012) has provided detailed illustration of
these aquifers.
1) Central Valley
Central Valley comprises a huge aquifer filled with a large amount of
sediments. The overall thickness of the filling sediments ranges from approximately
32,000 feet in the Tulare Basin to about 50,000 feet in the Sacramento Valley (Planert
and Williams, 1995). The single large aquifer there (Central Valley Aquifer) is primarily
sand and gravel with significant amounts of silt and clay eroded from mountains at the

44
boundaries of the valley. Depending on the location, deposits of such fine-grained
materials-mostly clay and silt-make up as much as about 50% of the whole thickness of
the valley-fill sediments. These fine materials form a large number of lenses and some
part of the aquifer beds with minimal permeability.
2) Basin and Range basins
The Basin and Range basins comprise an assemblage of multiple sedimentary
basin systems. The set of basins comprise a large portion of Nevada and the southern
California desert. In this large region, aquifers are not regional or continuous because of
the complex faulting. There are three principal aquifer types collectively referred to as the
"Basin and Range aquifers". They are volcanic-rock aquifers which are primarily tuff,
rhyolite, or basalt; carbonate-rock aquifers which are primarily limestones and dolomites;
and basin-fill aquifers which are primarily unconsolidated sand and gravel (Planert and
Williams, 1995). The main water-yielding materials in this area are unconsolidated
alluvial-fan deposits. From the margins towards the centers, ground water generally turns
from unconfined to confined condition as the unconsolidated deposits become finer
grained. There are also other rock types within this physiographic province of low
permeability and act as boundaries and insulating layers.
3) Coastal Basins
The Coastal Basins are a sequence of basins in the coastal areas. They very
similar structures. All of them are filled with marine and alluvial sediments. In this region,
two or more vertically sequential aquifers can be present in a basin, separated by
confining units but hydraulically connected.
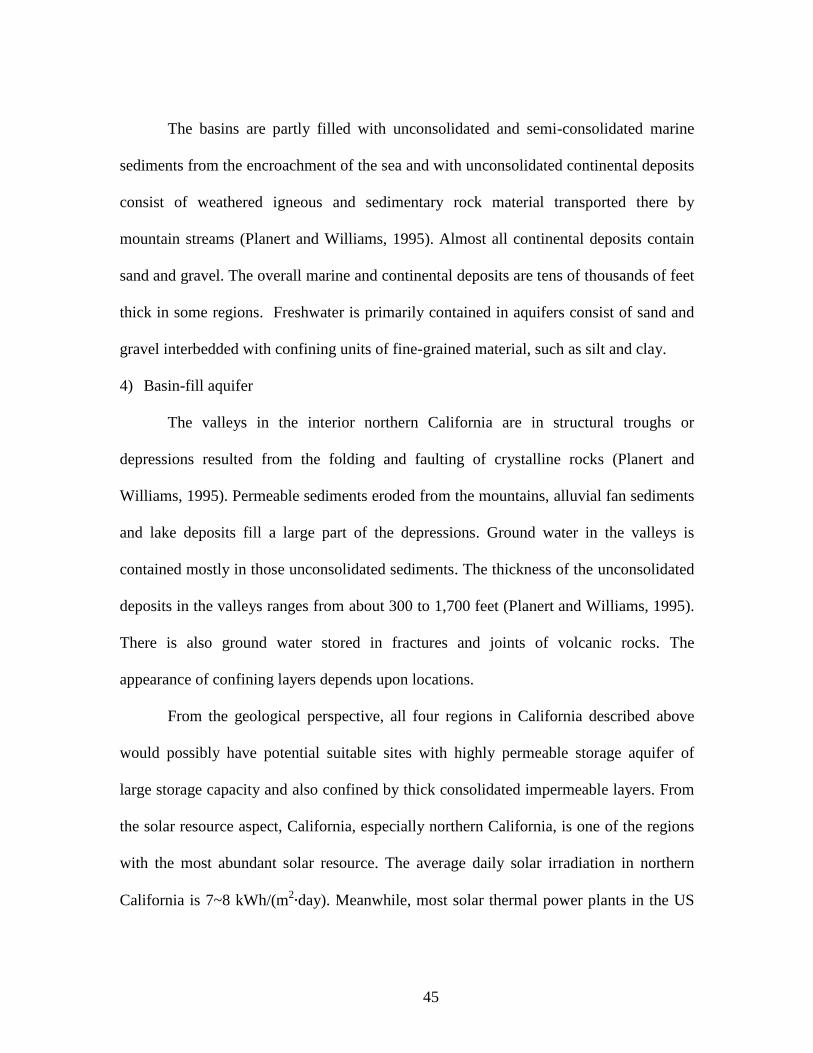
45
The basins are partly filled with unconsolidated and semi-consolidated marine
sediments from the encroachment of the sea and with unconsolidated continental deposits
consist of weathered igneous and sedimentary rock material transported there by
mountain streams (Planert and Williams, 1995). Almost all continental deposits contain
sand and gravel. The overall marine and continental deposits are tens of thousands of feet
thick in some regions. Freshwater is primarily contained in aquifers consist of sand and
gravel interbedded with confining units of fine-grained material, such as silt and clay.
4) Basin-fill aquifer
The valleys in the interior northern California are in structural troughs or
depressions resulted from the folding and faulting of crystalline rocks (Planert and
Williams, 1995). Permeable sediments eroded from the mountains, alluvial fan sediments
and lake deposits fill a large part of the depressions. Ground water in the valleys is
contained mostly in those unconsolidated sediments. The thickness of the unconsolidated
deposits in the valleys ranges from about 300 to 1,700 feet (Planert and Williams, 1995).
There is also ground water stored in fractures and joints of volcanic rocks. The
appearance of confining layers depends upon locations.
From the geological perspective, all four regions in California described above
would possibly have potential suitable sites with highly permeable storage aquifer of
large storage capacity and also confined by thick consolidated impermeable layers. From
the solar resource aspect, California, especially northern California, is one of the regions
with the most abundant solar resource. The average daily solar irradiation in northern
California is 7~8 kWh/(m2∙day). Meanwhile, most solar thermal power plants in the US

46
are built within California (Tian and Zhao, 2013). All these conditions are very favorable
for the construction of HSTES systems in California.
5.2.2 Conceptual Model
The conceptual model constructed is composed of a sandwich-like storage
formation and a groundwater well. The piezometric surface of the storage formation is
initially at the ground surface. The reservoir is a 50-meter-thick confined aquifer located
at a depth of 1000 m below the surface. The aquifer is assumed homogeneous with a
horizontal permeability (kh) of 1.0×10⁻¹²
m2 and a vertical permeability (kv) of 1.0×10
-13
m2 (within the range of sandstone, limestone and dolomite). The upper and lower
confining layers are also assumed homogeneous with much lower permeability
(kh=1.0×10⁻¹⁹
m2, kv=1.0×10
-20 m
2, within the range of shale and clay). Since the
confining layers are thick and impermeable, there is no fluid flow between the sandwich-
like storage formation and the other geological formations above or below, however there
is still heat transfer by thermal conduction. The well casing is also impermeable such that
there is no mass transfer and limited heat transfer between the wellbore and the
surrounding formations by conduction. The thermal properties of different strata are
simplified to be the same while the hydraulic properties are different. Overall, the
modeled system is composed of three layers in total: a 1000 m impermeable cap rock, a
50 m permeable storage aquifer and a 50 m lower confining layer. All three layers are
homogeneous and assumed infinite horizontal areas.
Another important element of the proposed HSTES system is a groundwater well
for hot water injection and recovery. In the base case model, the well is 1025 m in length,
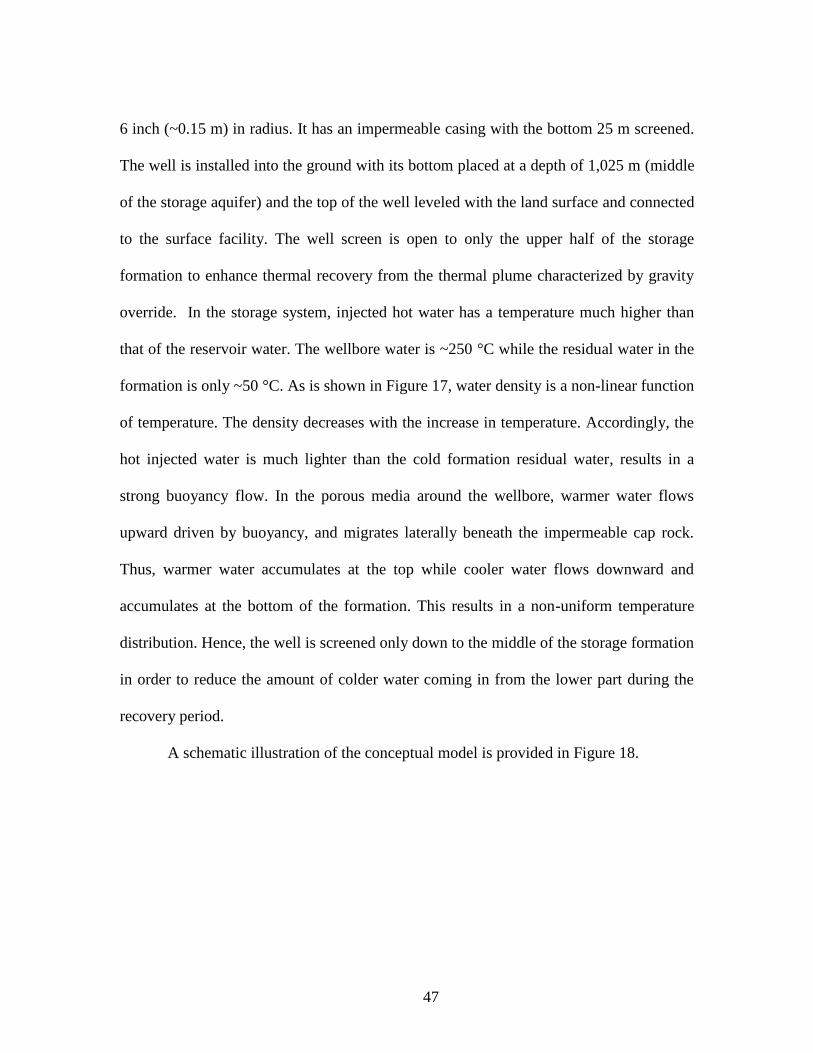
47
6 inch (~0.15 m) in radius. It has an impermeable casing with the bottom 25 m screened.
The well is installed into the ground with its bottom placed at a depth of 1,025 m (middle
of the storage aquifer) and the top of the well leveled with the land surface and connected
to the surface facility. The well screen is open to only the upper half of the storage
formation to enhance thermal recovery from the thermal plume characterized by gravity
override. In the storage system, injected hot water has a temperature much higher than
that of the reservoir water. The wellbore water is ~250 °C while the residual water in the
formation is only ~50 °C. As is shown in Figure 17, water density is a non-linear function
of temperature. The density decreases with the increase in temperature. Accordingly, the
hot injected water is much lighter than the cold formation residual water, results in a
strong buoyancy flow. In the porous media around the wellbore, warmer water flows
upward driven by buoyancy, and migrates laterally beneath the impermeable cap rock.
Thus, warmer water accumulates at the top while cooler water flows downward and
accumulates at the bottom of the formation. This results in a non-uniform temperature
distribution. Hence, the well is screened only down to the middle of the storage formation
in order to reduce the amount of colder water coming in from the lower part during the
recovery period.
A schematic illustration of the conceptual model is provided in Figure 18.

48
Figure 17: Density of saturated liquid water is a function of temperature
Figure 18: Schematic base case conceptual model
400
500
600
700
800
900
1000
0 100 200 300 400
Wat
er
den
sity
(kg
/m3)
Temperature (°C)
Density of saturated liquid water

49
5.3 Operating Procedure
A complete working cycle consists of a maximum of three processes: an injection
process (denoted by ―I‖), a storage process without any operation (denoted by ―S‖) and a
production process (denoted by ―P‖). Sometimes, there is no storage process as the
situation dictates.
One main purpose of developing the HSTES system is to solve the time mismatch
between the solar energy supply and the actual electricity demand. In the base case
model, we consider a simple scenario of shifting surplus solar thermal energy (stored in
hot water) produced at times of low-demand to high-demand.
In this base case model, we assume a facility base runs on a step function
electricity demand as is shown in Figure 19. It is powered by a small solar thermal field
with an inlet working fluid (water) temperature of 25 °C and an outlet fluid temperature
of 250 °C. To match the demand and supply, a sequence of periodic two-month
injection-production (I-P) working cycles is run on an HSTES system: during a low-
demand month, the surplus hot water generated from the solar field is injected into the
storage formation continuously, at a rate of 10 kg/s (12.5L/s). When the following high-
demand month comes, hot water is recovered from storage at the same rate. Here we
simplify the simulation by use a constant injection rate over a month. As a matter of fact,
solar irradiation changes with time such that the amount of hot water generated from the
solar field varies from hour to hour as is shown in Figure 20. The peak output occurs
around the noon while there is zero output during night. Hence the flow from the field is
not constant or continuous. So actually, we are using a flow rate that is the result of the

50
total amount of hot water injected into the ground within an injection month by the total
time (30 days). In this process, the total mass and energy are conserved. Meanwhile, it
allows us to run a continuous injection simulation throughout the whole month.
Figure 19: Solar thermal power generation and energy demand of the facility base in the base case
scenario
Figure 20: Typical power generation from a solar field within a day
0 6 12 18 24
Ge
ne
rati
on
rat
e
Time (o'clock)
Solar thermal power generation within a day
Real-time hot water generation from the solar fieldAverage generation rate
00 1 2 3 4 5 6 7 8
Ener
gy
Time (month)
Energy supply vs. demand
solar thermal energy demand solar thermal energy supply
shortage
surplus
shift

51
In this work, the thermal energy density of liquid water at 273.15 K (0°C) where
its standard enthalpy of formation equals to zero is taken as the reference point of zero.
Thus thermal energy density of liquid water at a temperature of 250°C is 1085.3 kJ/kg. In
the base case, hot water at a temperature of 250°C is injected through the well at a rate of
10 kg/s during each injection month. The total thermal energy injected for storage is
7,812 MWh in each cycle. The corresponding thermal power is up to 10.85 MW. Use a
daily solar insolation (averaged over the year) of 7 kWh/ (m2·day) and a typical solar
collector efficiency of 40% (Jedensjö, 2005; Kalogirou, 2004; Müller-Steinhagen and
Trieb, 2004) and assume an inlet water (to the solar field) temperature of 25 °C, to heat
that amount of water to 250 °C requires a total solar collector surface of 84,000 m2 (~21
acre). If use the commercial Compact Linear Fresnel Reflectors (CLFR) field provided
by Areva Solar with an annual heat generation efficiency of 2050 MWh/(acre·yr), it
requires a field area of 41 acre.
In the base case model, a two-month preheating process is also included to heat
up the storing environment and minimize the heat loss due to convection and conduction
between injected hot water and the surrounding. During this process, hot water with the
same temperature is injected at the same rate of 10 kg/s into the storage formation to
create a large hot zone. A total thermal energy of 14,112 MWh is consumed throughout
this preheating process. Figure 21 illustrates the complete operation procedure of the base
case model.

52
Figure 21: Illustration of the operating procedure in the base case model
5.4 Numerical Model Set-up
Based on the conceptual model, a numerical model is set up using the TOUGH2-
EOS1 multiphase flow simulator (Pruess et al., 1999) with the PetraSim graphic user
interface (Alcott et al., 2006; Yamamoto, 2008) for further quantitative study on the base
case. Equation of State 1 module (EOS1: Water, non-isothermal) (Pruess et al., 1999) is a
basic module for geothermal applications and can deal with water, water with tracer and
heat. It also allows phase change between aqueous and gas phase, with boiling and heat
transfer. Like other members of the TOUGH/MULKOM family of codes, TOUGH2 uses
the ―integral finite difference‖ (IFDM) method to calculate the numerical solutions of
certain problems (Pruess et al., 1999). Space discretization in IFDM is made directly
from the integral form of the basic conservation equations, without converting them into
partial differential equations (Edwards, 1972). Time is discretized as a first-order
-10
-5
0
5
10
0 1 2 3 4 5 6 7 8 9 10 11 12
Flo
w R
ate
(kg
/s)
Time (month)
Operating procedure
Real working cycles start here 2 months' preheating

53
backward finite difference, which is fully implicitly, together with the 100 % upstream
weighting of flux terms at interfaces. It offers the benefits of avoiding impractical time
step limitations in flow problems involving phase appearance/disappearance and
achieving unconditional stability (Peaceman, 1977). For systems of regular grid blocks
referred to a global coordinate system, the IFDM is completely equivalent to
conventional FDM.
In the setting of the numerical model, a radially symmetric grid is used to model
the wellbore and surrounding formations (Figure 22). The radial cross-section of the
model is 10,000 meters in radius and 1,100 meters in height (Table 5). The outmost
radius is set to be sufficiently large to avoid possible errors caused by boundary effects.
In the vertical direction, the model is composed of three parallel formations top-down as
illustrated in the conceptual model. The corresponding material properties are listed in
Table 6.
54
Figure 22: Base case numerical model scheme (radial cross-sectional profile)
Within the model, grids are refined in and around the well and the storage aquifer
to provide more accuracy. The top two layers are also refined to ensure more realistic
pressure values and wellhead conditions (Table 7). A similar process is done to the radial
discretization: The innermost column of cells represents the wellbore and is assigned a
radius of 0.15 m. Then the grid spacing gradually increases outward from 1.85 m to 200
m along the radius. The outmost column of cells is assigned a radius of 20 m and is given
a ―fixed state‖ condition to further minimize the boundary effects. It means that cells at
the outmost boundary will maintain the initial (T, P) conditions throughout the simulation.

55
Table 5: Base case model dimensions and general parameters
Model Dimensions
Radial Dimension R=10,000 m Radius is set to be large enough to
eliminate the numerical boundary effects.
A fixed boundary condition applied on the
outmost boundary.
Vertical Dimension Z=1,100 m The top of the model is set to be the
ground surface and the base is 1,100 m
below the surface.
A 1,000m-thick upper impermeable layer
and a 50m-thick lower impermeable layer
are separated by a 50m-thick storage
formation.
Well Dimension R=0.15m, Z=1,025m The base of the screen is 1,025m below
the land surface while the wellhead is
right at the ground surface.
Initial Conditions
Pressure Atmosphere pressure +
hydrostatics pressure
An atmosphere pressure of 1.01×10⁵ Pa is
assumed to be the surface pressure of the
model. From hydrostatic equilibrium, a
pressure gradient of 9.8×10³ Pa/m is used
to represent the groundwater.
Temperature Geothermal gradient
=30°C/km
A geothermal gradient of 30°C/km
(typical value in the North
American(Blackwell et al., 1991)) is used.
With a surface temperature of 25°C, the
bottom temperature of the model is
around 58°C.

56
Table 6: Material properties for the base case numerical model
Entire Model
Thermal Conductivity (W/m∙°C) 2.51
Rock Grain Specific Heat (J/Kg∙°C) 920
Rock Density (Kg/m3) 2600
Impermeable Layer
Horizontal Permeability (m2) 1.0×10
-19
Vertical Permeability (m2) 1.0×10
-20
Porosity 0.004
Storage Formation
Horizontal Permeability (m2) 1.0×10
-12
Vertical Permeability (m2) 1.0×10
-13
Porosity 0.25
Wellbore
Permeability (m2) 1.0×10
-7
Porosity 0.98
Table 7: Vertical discretization of the base case numerical model
Number of
Layers
Thickness
(m) Comments
2 10 Surface layers.
46 20
10 5.5 Refined near the storage formation (upper).
10 5 Storage formation.
8 6.25 Refined near the storage formation (lower).

57
The wellbore is modeled by assigning very high permeability (1.0×10⁻⁷
m2) to the
corresponding cells (leftmost column in the radial cross-section). The well starts from the
land surface and reaches down to the middle of the storage formation (25 m below the
upper confining cap rock) with the bottom 25-meter portion fully screened. Since the cap
rock is highly impermeable, the model does not include another impermeable layer as the
well casing.
For the entire model, a set of initial conditions are imposed. A geothermal
gradient of 30°C/km is used which is a typical geothermal gradient of North America
(Blackwell et al., 1991). A pressure gradient of 9.8×10³ Pa/m is used to introduce the
initial hydrostatic pressure. The model is then run for 1000 years to achieve the
equilibrium pressure. The surface temperature is set to be 25°C. These global conditions
will be the same for all following models.
5.5 Simulation and Analyses
For the sake of simplicity, one month is assumed to comprise 30 days in all the
simulations in this thesis. To clarify the expression, we count months from the start of the
real working cycles and denote the first month of the first working cycle the 1st month.
The preheating two months are referred to as the 1st and 2
nd preheating months.
5.5.1 Water Production Driving Force
As illustrated, the density of liquid water is a function of temperature. Reservoir
water with a temperature around 50°C has a density of 988 kg/m3, while the density of
the injected water (250°C) is only 799 kg/m3. The density difference of 189 kg/m
3,
results in a pressure difference up to 1.85×10⁶ Pa (~18 atm) between the wellbore fluid

58
and the reservoir water at a depth of 1000m. It is possible for the hot water to flow up
spontaneously along the wellbore under its own pressure gradient without using down-
hole pumps.
In order to study the possibility of hot water flowing up the surface without
artificial lifting, the fluid production ability from the well is studied using a well
deliverability model with different productivity indices (PI). Study on the well
deliverability models could be found at Coats (1977); Durlofsky (2000); Kiryukhin and
Miroshnik (2012) and Porras et al. (2007). The concept of productivity index was
introduced based on the theory that production wells operate on deliverability against a
prescribed flowing well pressure ( wbP ) with a productivity index (PI) (Muskat and
Wyckoff, 1946). More specifically, in a bounded reservoir depleted by a well, the ratio of
the flow rate to the pressure drawdown (the pressure drop between reservoir and wellbore)
will stabilize to a constant value such that the flow rate can be calculated from:
( )wb aq PI P P (3)
where q denotes the rate of fluid flow from the well, Pwb is the bottom-hole
pressure, and Pa represents the average pressure of the fluid in the reservoir.
The TOUGH2 codes provide a ―Well on Delivery‖ (DELV) package to simulate
such well deliverability model (Pruess et al., 1999). In TOUGH2, the mass production
rate of phase from a grid block with phase pressure P > Pwb is calculated from:
(P P )r
wb
kq PI
(4)
59
Here, q denotes the flow rate from the well, rk is the relative permeability of
phase , is the viscosity of phase , is the density of phase , wbP denotes the
bottom-hole pressure, and P represents the average pressure of phase in the reservoir.
In the TOUGH2 codes, the DELV condition is usually applied to the wellbore
when the well is a single unite.
In our model, the wellbore is modeled as a column of grids as is shown in Figure
23. Known from hydrodynamics, flow rate between the adjacent grids is a linear function
of the pressure difference between the two (upper and lower) grids. At the wellhead, if
simplify the resistance effect from the surface facility (e.g., piping loss) to an overall
resistance term, then the flow rate out of the well ( wq ) could be expressed as:
( )w wh outq k P P (5)
Where k is a resistance coefficient, representing the above ground resistance
including viscous resistance loss. The higher the resistance, the lower the k value would
be. whP is the wellhead pressure and outP denotes the outlet environment pressure at the
surface.
With Eqs.(3) and (5) being of the same form, flow out of the top of the well could
be modeled by assigning a specified ―well‖ at the top of the wellbore (Figure 23) in the
base model, against a prescribed outlet pressure ( outP ) with a prescribed resistance at the
ground surface. Different surface loss can be modeled by adjusting the PI value in the
model.

60
Figure 23: Wellbore grid profile showing the setting of DELV condition at the wellhead
In the simulation, a PI value of 5×10-12
m3
is used, which is similar to values used
in modeling geothermal well flows (Alcott et al., 2012; Battistelli et al., 1997; Bhat et al.,
2005). The model is then run for two months: one month injection at a rate of 10 kg/s
followed by another month of production with the DELV condition assigned to the
wellhead grid and an outlet pressure ( outP ) of 1.01×10⁵ Pa (1 atm). According to the
simulation (Figure 24 and Figure 25), recovery flow could happen spontaneously without
artificial lifting. Hot water flows out from the wellhead at a decreasing rate (from ~18
kg/s at the very beginning to ~6 kg/s at the end of the production month) with the
decreasing pressure difference within the system. It indicates that it is applicable for the
HSTES system to produce hot water without complex lifting facilities.

61
With a certain pipe resistance, the recovery flow rate could be adjusted by
adjusting the outlet pressure. Simulations are conducted to study the recovery flow rates
under different outlet pressures in two cases with different surface resistance. As is
shown in Figures 24 and 25, recovery rates increase with the decrease in surface
resistance or outlet pressure. In reality, recovery of the stored hot water is mostly
operated with constant production rates. Facilities will be installed at the ground surface
to adjust the resistance force and outlet pressure to keep a stable outflow rate with
assistant flow meters.
Figure 24: Recovery flow rate under different outlet pressures with PI=2×10-12
m3
0
2
4
6
8
10
12
14
16
18
20
0 5 10 15 20 25 30
Ou
tflo
w r
ate
(kg/
s)
Time (day)
Recovery flow rate under different outlet pressure (PI=2×10-12 m3)
Injection
P=0.1 atm
P=1 atm
P=5 atm

62
Figure 25: Recovery flow rate under different outlet pressures with PI=5×10
-12 m
3
5.5.2 Simulation and Results
5.5.3.1 Subsurface Storage
1) Qualitative Analysis
Within a working cycle, 250°C water is injected into the storage formation at a
constant flow rate of 10 kg/s for a month (30 days). Then the injection stops and the
production starts. Hot water is recovered from storage at the same flow rate of 10 kg/s.
An equal injection and production rate is set to provide a net zero mass loss. This helps
sustain the geological situation of the storage system and maintain the reservoir pressure.
0
2
4
6
8
10
12
14
16
18
20
0 5 10 15 20 25 30
Re
cove
ry f
low
rate
(kg
/s)
Time (day)
Recovery flow rate under different outlet pressure (PI=5×10-12 m3)
Injection
P=0.1 atm
P=1 atm
P=3 atm
P=5 atm

63
An example of such cycles for the first year was illustrated in Figure 21 in the
previous texts. In the figure, positive a flow rate refers to injection while negative means
production.
Figure 26 shows the simulated spatial distribution and temporal evolution of the
injected hot water in the reservoir. As expected, a heat plume characterized by gravity
override forms around the well screen. The lighter hot water overrides the denser cold
water and remains in the upper portion of the aquifer underneath the sealing cap rock.
Also since the viscosity of hot water is lower than that of cold water, the flow velocity of
hot water is larger than that of the cold groundwater. Hence, the portion of the heat plume
that near the cap rock (which is hottest) migrates faster than other portions, creating a
peak in the flow pattern under the cap rock. Also it can be viewed that the temperature of
the plume is highest around the well screen, as depicted by red, and then gradually
decreases away from the injection well, as depicted by yellow and blue.

64
Figure 26: Truncated radial cross-sections showing evolution of the hot zone around the well:
Left column shows the temperature distribution after the injection period and right column after
the recovery period within the same cycle. Pictures in the same column compare hot zone profiles
at the same stage of different cycles.
In this study, the heat-concentrated region (red zone in the cross-sectional profile)
is denoted as ―heat core‖ and the surrounding medium temperature region (yellow to blue
zone) is denoted as ―heat fringe‖. Comparing the heat plume profiles throughout the 10
years’ operation (Figure 26), within the same working cycle, the heat core is always
refilled during the injection period and depleted in the production period. The volume and
65
shape of the heat core at the same stage of different cycles do not change much from
cycle to cycle (except for the first few cycles as a result of preheating). The depletion
does not affect the heat fringe much and there is no obvious change in the overall plume
shape within a cycle. The heat fringe gradually expands with time due to thermal
conduction, resulting in an overall expansion of the heat plume. This gradual heat loss
prevents the working fluid from having direct contact with the cold formation during a
cycle. It also buffers changes within the heat core or the surrounding formation from
affecting each other, so it helps keep the stability of the storage environment.
Throughout the subsurface process, heat loss happens not only by convection
within the reservoir, but also by heat conduction between the well and the surrounding
formation. Figure 27 shows the change of formation temperature along the well from
cycle to cycle at different radii from the wellbore. The formation around the wellbore is
gradually heated due to heat conduction from the line source (thermal well).
The temperature distribution is relatively uniform along the wellbore except the
portion near the storage formation. The heat loss from the wellbore is a nonnegligible
factor when evaluating the efficiency of the storage system and thus will be studied later
in the thesis.

66
Figure 27: Formation temperature distribution and evolution around the wellbore for the base
case model. (Rescaled with a horizontal exaggeration factor of 25)
2) Quantitative Analysis
To quantify the effectiveness of energy recovery, we define several efficiencies to
count for energy loss during different process. The Thermal Storage Efficiency (ηs) is
defined as the ratio of the total amount of thermal energy recovered from the well to the
67
total amount of thermal energy injected into the well over a certain period. It counts in
the heat loss from both the wellbore and the reservoir storage. Then for a single injection-
storage-production (I-S-P) process, namely, a working cycle, ηs can be calculated from:
prod
s
inj
M
M
(6)
where prodM is the total thermal energy produced from the well in a cycle, and
injM is the total thermal energy injected into the well in a cycle.
From the simulation output, prodM and injM can be calculated from flow rates and
the corresponding enthalpies:
2
1
( )t
inj inj tt
M q h dt
(7)
where t1 and t2 are the starting and ending time of the injection period in a cycle
respectively, injq is the injection mass flow rate which is 10 kg/s in the base case model,
and th represents the specific enthalpy of the injected fluid. Define the enthalpy of liquid
water equals to zero at the temperature of 0 °C as the reference condition, thus the th in
the base case mode (i.e., the enthalpy of liquid water at a temperature of 250°C) is
1.085×10⁶ J/kg.
Similarly, for heat recovery, there is:
2
1
( )t
prod prod tt
M q h dt
(8)

68
To count in the preheating period, we define a Cumulative Thermal Storage
Efficiency ( CS ) as the ratio of cumulative thermal energy produced up to a specific time
over the cumulative thermal energy injected up to that time.
5.5.3.2 Surface Process
After storage, the fluid recovered from the well can be hot liquid, a mixture of
liquid and steam vapor, or purely steam vapor, depending on the pressure. In the surface
treatment stage, the produced hot fluid goes into a flash system if the temperature is
moderate to high or a binary system if the temperature is relatively low. Then either the
vaporized steam separated from the liquid (in a flash system) or another working fluid
with lower boiling point vaporized by the hot water (in a binary system) is used to run a
turbine. The steam turbine extracts thermal energy from the hot vapor and drive the
electricity generator on a rotating output shaft.
Since a solar thermal plant operates on the same thermodynamic principals and
goes through the same energy conversion process from thermal energy to electrical power,
it does not matter where the hot water (thermal energy carrier) comes from. The hot water
used to generate electricity can either be obtained directly from solar collectors, or
recovered from a constructed geological reservoir. In either case, the same equipment
can take the hot water, and convert it into electrical energy, using standard steam turbines
or binary Rankine cycle generators.
In the HSTES system, there is always a temperature drop after storage. According
to Carnot’s theorem, lower temperature results in lower thermal-to-electrical energy
conversion efficiency, which results in further efficiency differences between the two

69
cases (before and after storage). Hence, energy conversion efficiency should be taken into
consideration when evaluating the performance of the proposed storage system
To compare efficiency of electrical power generation potential before and after
the storage, we define a Relative Electricity Generation Efficiency (re ) as the ratio of the
maximun amount of electrical energy that can be produced theoretically by the hot water
recovered after storage to which could be produced by the hot water directly from the
solar collectors. It can be calculated from the Thermal Storage Efficiency ( s ) and the
Relative CA efficiency ( rCA ) using:
re s rCA
(9)
rCA is a normalized efficiency which is the ratio of the two theorical CA
efficiencies using hot water before and after storage
1 1( ) ( )
s srCA
o prod o inj
T T
T T
(10)
where Ts is the heat sink temperature and To is the temperature of the hot water
entering the electricity generation system. Both are absolute temperatures in units of
Kelvin.
Figure 28 shows a 10-year plot of three efficiencies ( s , re and cs ) averaged
over each cycle respectively in the base case model. On the whole, the thermal storage
efficiency plot and the relative electricity generation efficiency plot change
synchronously. They decrease at the beginning until the 6th
cycle (after about one year
operation), and then start going up continuously in the following cycles. However, the

70
increment between the efficiencies for adjacent two months gets smaller and smaller. All
three efficiency plots level off with time. The averaged thermal energy storage
efficiencies for each cycle is all above 80%. It is 87.2% for the first cycle and then
quickly decreases to a lowest value of 80.4% at the end of the first year, followed by a
smooth and continuous increase afterwards. The s value finally reaches 82.7% by the
end of the simulation period of 10 years (60 cycles). The relative electricity generation
efficiency is lower than the thermal storage efficiency. The re is high (80.6%) for the
first cycle and it decreases to a low value of 69.7% after 1 year (6 cycles) and afterwards,
gradually increases to 73.3% after 10 years operation. The increments drop below 0.1%
after 2 years for thermal storage efficiency and after 5 years for relative electricity
generation efficiency. The cumulative thermal storage efficiency plot experiences a
constant increasing trend with a decreasing rate of change throughout the simulation. The
cs plot finally levels out with time. It will approach the thermal storage efficiency plot
given enough time.

71
Figure 28: Averaged efficiencies for each cycle over 60 cycles (10 years) with a preheating time
of 2 months
5.5.3 Wellbore Heat Loss
During storage, there is an inevitable portion of thermal energy lost into the
surrounding formations via heat conduction. Considering that the operation well in the
HSTES system is long (typically>500m), the heat lost into the surrounding through the
wellbore might be significant.
In geothermal engineering, there is a great amount of research conducted on
wellbore-fluid temperature distribution and wellbore heat loss analysis since the
pioneering work of Ramey (1962). In Ramey’s work, he provided a fundamental
analytical model to address the problem of a single-phase flow through a single conduit
0%
10%
20%
30%
40%
50%
60%
70%
80%
90%
100%
0 12 24 36 48 60 72 84 96 108 120
Effi
cie
ncy
Time (month)
Base Case Efficiency Plots over 10 years
Thermal storage efficiency Relative electricity generation efficiencyCumutative thermal storage efficiency
72
within a line-source well. Subsequently, Alves et al. (1992), Hasan and Kabir (1994),
Sagar et al. (1991) and Hasan et al. (2003) further generalized these models by allowing
two-phase flow, changes in well deviation, variable thermal properties, kinetic energy
and Joule-Thompson effects, etc.
While great advances have occurred in analytical solutions towards wellbore-fluid
temperature modeling, there is also significant development in numerical wellbore heat
modeling. Early in the 1970s, Raymond (1969) offered a numerical solution for fluid
temperature in the well. Later, a number of other fully-coupled numerical models were
also presented to simulate more complex scenarios or to serve the general purpose of
reservoir simulation, such as those of Arnold (1990), Stone et al. (1989), .Kabir et al.
(1996), and Pourafshary et al. (2009).
In our study, heat loss through the wellbore is estimated by modeling another
parallel scenario with hot water directly injected into the reservoir through the screen
without the wellbore above the reservoir. The simulated thermal energy storage
efficiency of this case is provided in Figure 29 together with the plot from the base case
model with the complete well. From the plot, it can be noted that these is only a small
portion of the injected thermal energy lost into the formation through the wellbore.
When injecting hot water into the screen directly, ~87% of the injected heat could be
recovered in a cycle after the stability of the system, while injecting from the wellhead,
~83% of the thermal energy input could be recovered. Energy lost from the wellbore is
only ~4% in this case. This is because the temperature difference between the injected
and the recovered water is small, hence the wellbore temperature is relatively stable

73
without much cool-down during production. The thermal gradient between the fluid in
the wellbore and the surrounding impermeable formation decreases with time as that zone
heats up, which further slows down the heat transfer.
The relative electricity generation efficiency plots, to some degree, amplify the
difference with/without the wellbore. While there is ~4% extra thermal energy loss from
the wellbore, there is ~6% overall potential electrical energy loss (through the whole
process from injecting hot water into the reservoir untill the final electricity generation)
due to the wellbore heat loss. The further efficiency drop is a result of the lower
conversion rate from thermal energy to mechanical energy as a result of the temperature
drop.
As is shown in the simulation results, the heat loss from the wellbore is about ~30%
that from the reservoir. Meanwhile, since the wellbore does not affect the storage aquifer
characterization and the study of the effect of geological and operational factors on the
system performance, following simulations will get rid of the wellbore above the storage
aquifer. Simulation time is greatly reduced accordingly. The model with a complete
wellbore requires several days to a week to run the 10 years case while without wellbore,
it only needs about a day to simulate. The focus will be on the reservoir and the operaion.
Correspondingly, this simplified base case model without the complete wellbore
simulated above will be used as the new base case model in following studies to ensure a
single-factor-variable comparison. Note that this simplification will cause a slight
increase in the simulated efficiencies.

74
Figure 29: Thermal energy storage efficiency plots comparing system performance with and
without the wellbore based on the base case model
5.5.4 Comparing HSTES to Other Existing Energy Storage Methods
Currently, electrical energy can only be stored after the conversion into other
forms of energy (Simbolotti and Kempener, 2012). Table 8 listed some key factors of
electricity storage methods that are currently available. Conventional commercial storage
methods such as pumped hydro power storage and compressed air energy storage.
Electrical batteries can achieve high efficiency. However, they are expensive and have
the problem of short life time when applied in long-term storage system. Other novel
0%
10%
20%
30%
40%
50%
60%
70%
80%
90%
100%
0 12 24 36 48 60 72 84 96 108 120
Ener
gy e
ffic
ien
cy
Time (month)
Efficiency plots with/without wellbore
Thermal energy storage efficiency (without wellbore)
Thermal energy storage efficiency (with wellbore)
Relative electricity generation efficiency (without wellbore)
Relative electricity generation efficiency (with wellbore)

75
energy storage methods include flywheels, supercapacitor and superconducting magnetic
storage, etc., most of them are still in the pre-commercial stage. Furthermore, some of
them have the problem of limited output capacity or being economically unattractive.
There is still requirement for further R&D work before their full commercialization.
Table 8: Comparison of current electricity storage methods [Data source: Simbolotti and
Kempener (2012)]
Storage methods Status Typical power
output, MWe
Typical storage
capacity
Energy storage
efficiency, %
Life time, yr
(cycles)
Pumped Hydro[1] commercial 250-1000 50-150 MWh 70-80 >30
CAES[2] commercial 100-300 0-150 MWh 45-60 30
Fly Wheels[3] pre-
commercial 0.01-10 N.A. >85 20
Supercapacitors[4] R&D; pre-
commercial 0.1-10 N.A. 90 5×10⁴ cycles
Li-ion battery[5] pre-
commercial 0.1-5 (<10) 250-500 90 DC 8-15
Lead battery[6] pre-
commercial 3-20 N.A.
75/80 DC; 79/75
AC 4-8
NaS battery[7] pre-
commercial 30-35 50-150 MWh 80/85 DC 15
VRB[8] pre-
commercial 0.01-10 250-300 MWh
75/80 DC; 60/70
AC 5-15
SMES[9] R&D; demo 0.1-10+ N.A. >90 > 5×10¹⁰
cycles
TES[10]
STES[11] 25 10-50 kWh/t 50-90 10~30+
(depending
on storage
cycles,
temperature
and
operating
conditions)
PCM[12] 0.5 50-150 kWh/t 75-90
TCS[13] 100 120-250 kWh/t 75-100
[1] Pumped hydro power storage method converts surplus electricity to gravitational potential energy by
pumping water from a lower reservoir to an upper reservoir. The stored energy will be used to produce hydropower on
demand.
[2] Compressed air energy storage (CAES) systems store energy by compressing air. The compressed air is
stored in large, low-cost natural buffers (e.g. caverns) and then used in gas-fired turbines to generate electricity.
[3] Flywheels store electricity as mechanical energy and then convert mechanical energy back to electricity
on demand.
[4] Supercapacitor, also named ultracapacitor, is the generic term for a family of electrochemical capacitors.
It stores electricity as electrostatic energy and is often combined with batteries.

76
[5-8] Electrical batteries and vanadium redox flow cells/batteries (VRB) store electricity as chemical energy.
Novel battery concepts (e.g. NaS batteries) and vanadium redox flow cells have already been used in small-to-mid size
renewable power systems.
[9] Superconducting magnetic storage (SMES) uses superconducting technology to store electricity.
[10] Thermal energy storage (TES) method stores potential electrical energy as thermal energy. It has already
been demonstrated in concentrating solar power (CSP) plants where excess daily solar heat is stored and then used to
generate electricity at sunset.
[11] Sensible thermal energy storage (STES) is type of TES, it stores heat as internal energy in the storage
medium without phase change.
[12] Phase change material (PCM) stores thermal energy as latent heat.
[13] Thermo-chemical storage (TCS) uses chemical reactions to store and release thermal energy.
In the base case model, the thermal energy storage efficiency of the proposed
HSTES system is estimated to be >73% in the long run. With possible optimization and
more suitable geological storage formation, the energy efficiency could be further
improved. Also since the system occupies little surface space, it has a wide range storage
capacity from thousands of kWh to tens of thousands of MWh of electrical energy
equivalent, wider than most storage methods in the table would have. As a type of
thermal energy storage (TES) methods for electricity energy storage, HSTES
demonstrates great performance, higher than average efficiency, and possibly longer life
time than most other methods.

77
6 SYSTEM CHARACTERIZATION
6.1 System Performance under Different Injection Temperatures
A major feature that distinguishes the proposed HSTES system from other
existing aquifer or ground source thermal storage systems is its ability for storing hot
water at a temperature higher than the standard boiling point of water. Storing high
temperature water has its advantage in the energy conversion process because the
efficiency of a heat engine increases with an increasing source temperature. However, the
relationship between the source temperature and the thermal storage efficiency of the
proposed system is still unknown. In this section, the performance of the HSTES system
is studied under different injection temperatures. We keep all the other settings in the
base case model constant, change the temperature of injected water to 200 °C and 300 °C
respectively and simulate two new cases. Results from simulation are presented in
Figures 30 and 31 by means of three different efficiency plots.
Within the simulation range, an increase in the temperature of injected hot water
results in a decrease in the storage efficiency of thermal energy (Figure 30). After about 5
years , s is 90% for the case with an injection temperature of 200 °C, 86% for the base
case with an injection temperature of 250 °C and 80% for the last case with an injection
temperature of 300 °C. On the other hand, the situation of heat engine efficiency is just
the opposite (Figure 31): the CA efficiency is highest for the 300 °C case and is lowest
for the 200 °C case, coincides with Carnot’s theorem. The relative electricity generation
efficiency represents heat losses from both storing and energy conversion. Its relationship
with the temperature of injected hot water depends on specific situation. In the cases
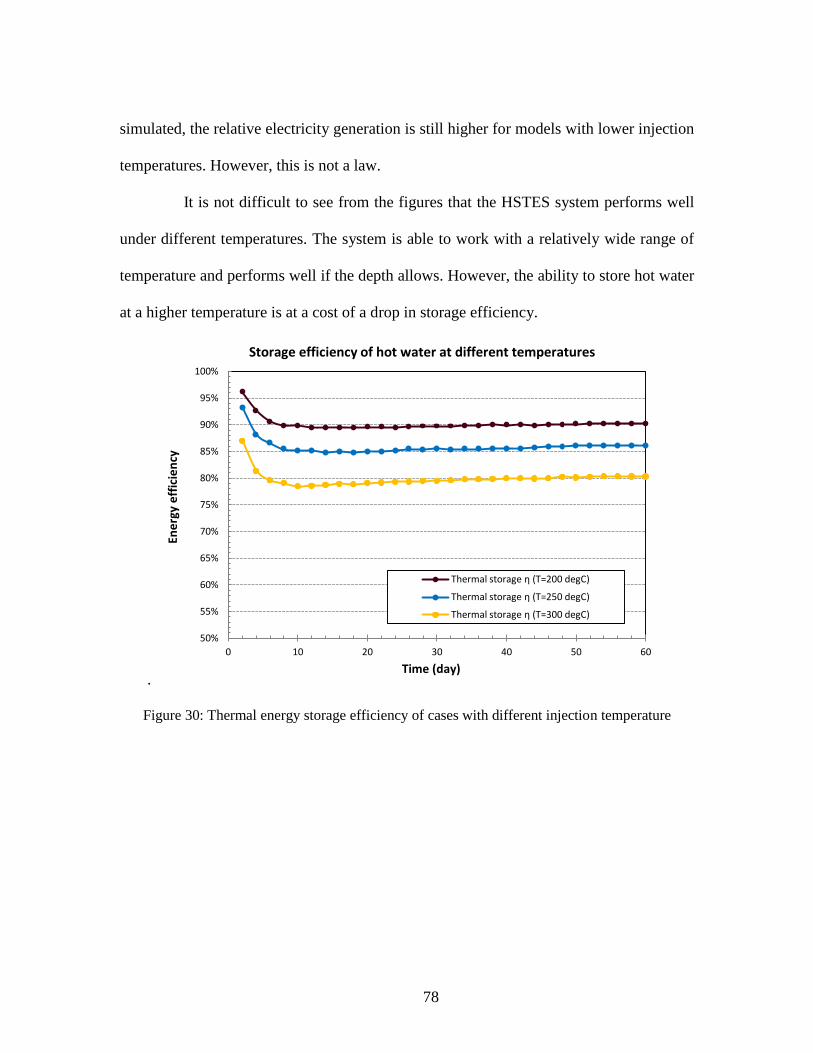
78
simulated, the relative electricity generation is still higher for models with lower injection
temperatures. However, this is not a law.
It is not difficult to see from the figures that the HSTES system performs well
under different temperatures. The system is able to work with a relatively wide range of
temperature and performs well if the depth allows. However, the ability to store hot water
at a higher temperature is at a cost of a drop in storage efficiency.
.
Figure 30: Thermal energy storage efficiency of cases with different injection temperature
50%
55%
60%
65%
70%
75%
80%
85%
90%
95%
100%
0 10 20 30 40 50 60
Ene
rgy
eff
icie
ncy
Time (day)
Storage efficiency of hot water at different temperatures
Thermal storage η (T=200 degC)
Thermal storage η (T=250 degC)
Thermal storage η (T=300 degC)

79
Figure 31: Engine efficiency and relative electricity generation efficiency of the storage system
under different injection temperatures
6.2 System Performance in Short-term and Long-term Storages
Offering scalable energy storage and satisfying flexible energy utilization rate are
two main purposes of proposing the HSTES system. In this section, the model is tested
with daily and seasonal storage cases to assess its performance in both short-term and
long-term heat storage.
In a typical daily storage scenario, a HSTES system could be used to shift surplus
thermal energy generated during peak hours (typically around noon) to high demand
0%
10%
20%
30%
40%
50%
60%
70%
80%
90%
100%
0 10 20 30 40 50 60
Ene
rgy
eff
icie
ncy
Time (day)
Engine efficiency and relative efficiency of the storage system under different injection temperatures
Engine η (T=200 degC) Relative electricity generation η (T=200 degC) Engine η (T=250 degC) Relative electricity generation η (T=250 degC) Engine η (T=300 degC) Relative electricity generation η (T=300 degC)

80
hours at evening without solar insolation. In the simulation of such a short-term storage, a
daily (24 hours) working cycle composes a four hours (10 am - 2 pm) injection process, a
four hours (2 pm - 6 pm) storage period, another four hours (6 pm - 10 pm) recovery
process, and finally twelve hours (6 pm - 10 am next day) without any processing. The
four processes form a complete I-S-P-S working cycle. Both injection and production
rates are 10 kg/s and the water temperature is 250 °C, the same as that in the base case.
There is no preheating in this simulation.
The model has been simulated for 80 days, which is equivalent to 80 cycles.
According to the simulated results (Figure 32), the daily I-S-P-S cyclic case yields a
thermal energy storage efficiency of ~78% and a relative electricity generation efficiency
of ~66% at the end of the simulation. Both two efficiency values have been stabilized.
Since this model only simulates the major heat loss - the unrecovered thermal energy lost
in the reservoir - the actually system efficiency will be a little lower if the wellbore heat
loss is considered.

81
Figure 32: Energy efficiency of the daily I-S-P-S cyclic case
In the seasonal storage case, the HSTES system is used to alleviate the uneven
seasonal distribution of solar energy. The surplus hot water generated in summer will be
injected into the subsurface reservoir for storage. When winter comes and there is not
enough solar energy to sustain the power generation to meet the demand, the stored hot
water will be recovered to supplement the power generation. During fall and spring, the
solar radiant power is about right to meet the demand. Hence, there is no heat injection or
recovery in these two seasons. Accordingly, in the simulation of the seasonal storage, a
complete cycle is composed of 3 months injection (injT =250 °C,
injq =10 kg/s) which
corresponds to the summer, followed by 3 months storage (corresponding to the storage
through autumn) followed by 3 months’ production at the same rate (corresponding to the
heat recovery during winter) and finally, another 3 months without operation
0%
10%
20%
30%
40%
50%
60%
70%
80%
90%
100%
0 10 20 30 40 50 60 70 80
Ene
rgy
eff
icie
ncy
Time (day)
System Performance of the Daily I-S-P-S Cyclic Case
Thermal energy storage efficiency Relative electricity generation efficiency

82
(corresponding to the spring). The model is run for 10 years with a preheating time of 2
months. Figure 33 shows the system performance as a function of time. The thermal
energy storage efficiency plot shows a similar pattern as that of the base case model. It
experiences a short period decrease followed by a continuous slow increase. Comparing
with the base case, the energy efficiency is lower. With the recovery water temperature
being lower, energy loss through the heat engine is higher. The end-time thermal energy
storage efficiency is ~69% and the relative electricity generation efficiency is only 53%
in this seasonal storage scenario, not including the wellbore heat losses. These two
efficiencies are lower than those of in previous cases. For one reason, it is because that
unlike the base case, there are two storage periods in each working cycle in this seasonal
storage case during which more heat is lost into the reservoir and the confining
formations. For another reason, cases with longer working cycles require a longer time to
stabilize. The underground storage condition may still have not been stabilized after 10
years’ operation in this case. The energy efficiency will continue to increase with further
simulation for at least several cycles.
However, a thermal energy storage efficiency of ~70% is still high for such a
long-term storage. This storage requires almost no more maintenance and cost compared
with the short-term storage while for most other storage methods, long-term storage
usually requires a large amount of extra cost.
The cross-sectional profiles of the heat plume at different stages in a typical cycle
(Cycle 5 in this case) are provided in Figure 34. We can clearly see the evolution of the
plume within a year: during summer, the injected hot water refills the heat core and

83
slightly expands the heat plume; in the autumn, both injection and production are shut
down and the hot water is sealed in the reservoir under the cap rock. Through the storage
period, heat gradually conducts into the adjacent formations. However, because of the
buffering zone, the diffusion process is slow. This results in a slight drop of the heat core
temperature, which is shown on the profile as a shrinking of the red (core) region.
However, the main heat plume does not change much after storage; the majority of the
heat loss happens between the heat core and the heat plume. During the winter time, the
stored thermal energy is recovered from the reservoir. The depletion of the heat core can
be clearly viewed comparing the cross sectional reservoir profiles at the end of autumn
and winter, respectively. In the spring that follows the winter, the reservoir is at rest. It
can be seen from the profiles that the formation condition is quite stable throughout the
last three months. After the depletion in winter, thermal gradient is much smaller in the
reservoir. This further reduces heat loss from the hot zone.

84
Figure 33: Thermal energy storage efficiency plot as a function of time for the seasonal storage
case with a ten-year time span
Figure 34: Cross-sectional profiles showing the evolution of the heat plume within the
5th year
0%
10%
20%
30%
40%
50%
60%
70%
80%
90%
100%
1 2 3 4 5 6 7 8 9 10
Ene
rgy
eff
icie
ncy
Time (year)
System Performance in the Seasonal Storage Case
Thermal energy storage efficiency
Relative electricity generation efficiency

85
7 STUDY OF INFLUENTIAL FACTORS
From the existing experience, the efficiency of geological storage systems
depends on the geological and hydraulic properties of the reservoir and the operating
process (Bridger and Allen, 2005; Lee, 2010; Paksoy, 2007). To further study the effects
of different parameters on the storage performance, in this section, seven sets of scenarios
will be simulated, each set with variable parameters. The study uses a single-variable
method. Section 7.1 to 7.3 will focus on studying three operational factors [screen
location, working cycle length (including the I/S/P proportion), and preheating period].
Section 7.4 to 7.7 will study geological factors with regard to reservoir characteristics
(storage formation thickness, anisotropy, stratification and stratum shape and inclination).
A summary of the model settings used in Section 7 is provided in Table 9. In all these
scenarios, it is assumed that the aquifer is of constant thickness and porosity, and
perfectly confined.

86
Table 9: Model settings for different cases in 7 scenarios
[1] kh: horizontal permeability; [2] kv: vertical permeability; [3] b: formation thickness
Scenario Base
case 1 2 3 4 5 6 7
Case Base
settings 1 2 3 4 5 6 7 8 9 10 11
Half screened
system Fully screened system
12 13 14 15 16 17 18
Influential
factor
Screen location
Cycle length & I/S/P proportion
Preheating
Formation thickness
Permeability anisotropy
Formation shape
Stratification
kh [1](m2) 1×10-12 1×10-12
kv [2](m2) 1×10-13 1×10-13 1×10-12 1×10-14 1×10-13
b[3] (m) 50 50 25 100 50
Impermeable
lenses None None 1 2 3 None 1 2 3
Shape Flat Flat Basin Dome Flat
Screen Half
screened Fully
screened Half screened
Fully screened
Cycle length 2mon 2mon 2d
1:0:1
3mon
1:1:1
3d
1:1:1 2mon
Preheating 2mon 2mon 2d 2mon 2d None 2mon

87
7.1 Scenario 1: Effect of Screen Location
In previous sections, we have discussed the buoyant heat plume formed in the
reservoir during operation and our intention not to install the well down to the bottom of
the aquifer because of the gravity override effect of the plume. To verify if this can
actually reduce the cold water intrusion into the well and thus enhance the efficiency of
heat recovery, a fully screened model will be simulated in this section and compared with
the half screened base case model. The effect of screen length and location will also be
studied.
Figure 35 provides a graphic illustration of the half screened model (the base case)
and the fully screened model (Case 1). The only difference is that in the base case model,
the well screen only reaches the middle of the reservoir while in Case 1, the well screen
reaches the bottom of the reservoir. All other settings and operations are the same as
those in the base case model. Two months preheating and ten years cyclic I-P processes
are simulated for both models.

88
Figure 35: A screen location scheme: cross-sectional profiles showing the design of both half
screened and fully screened cases
The changes in thermal energy storage efficiency are plotted as a function of time
in Figure 36 for these two cases. Results from simulation confirmed our assumption. By
injecting and producing from the upper half of the reservoir, the storage system can
recover 10% more thermal energy than operating throughout the whole aquifer thickness.
Figure 37 provides the reservoirs’ cross-sectional profiles in the two models during the
60th
working cycle (at the end of the 5th
year). It is not difficult to see that there is more
residual heat after production in the aquifer in Case 1.
In the fully screened model, hot water moves upward under the buoyancy force,
so there is much less hot water in the lower part of the aquifer than in the upper part.
During production, hot water in the lower portion is soon depleted. As a result, cold
reservoir water starts to flow into the wellbore, which consequently lowers the storage
efficiency.

89
Figure 36: Thermal energy storage efficiency plots for Scenario 1: comparing system
performance between the half screened and the fully screened case.
Figure 37: Reservoir cross-sectional profiles at the end of the injection and production processes
of the 60th
cycle showing the difference in two cases
50%
55%
60%
65%
70%
75%
80%
85%
90%
95%
100%
0 12 24 36 48 60 72 84 96 108 120
The
rmal
En
erg
y St
ora
ge E
ffic
ien
cy
Time (month)
Effect of screen location on system performance
Fully screened
Half screened

90
7.2 Scenario 2: Effect of Cycle Length and I/S/P Proportion
Each working cycle in the base case model is two months in length which
contains one month injection followed by another month production. The time proportion
of the injection, storage and production processes (referred to as ―I/S/P proportion‖ or
―I:S:P‖) of the base case model is 1:0:1. In this section, three new models are built,
together with the base case model, to study the effect of both working cycle length and
the I/S/P proportion within a cycle on the system performance. The settings of all four
simulations are listed in Table 10. Models in the same group have the same I/S/P
proportion. Besides, in simulation, each model is assigned with a preheating period twice
the length of its own injection process within a single cycle.
Table 10: Operation settings for Cases 2, 3, 4 and the base case
Base case Case 2 Case 3 Case 4
Group # 1 2
Working cycle length 2 months 2 days 3 months 3 days
I:S:P proportion 1:0:1 1:0:1 1:1:1 1:1:1
Preheating time 2 months 2 days 2 months 2 days
The thermal energy storage efficiencies for all four cases are plotted as a function
of cycle numbers in Figure 38. Despite the large difference in cycle lengths (up to a
factor of 30), models with the same I/S/P proportion value have similar system
performance and yield very close energy efficiencies.
The thermal energy storage efficiency ( s ) plots of models in Group 1
(I:S:P=1:0:1) converge to 87% and in Group 2 (I:S:P=1:1:1) converge to 82%. The
difference is no more than 1% between models in the same group.

91
These simulations indicate that the I/S/P proportion is more important than the
exact time spans in influencing the efficiency of heat recovery. Cases with the same I/S/P
proportion have almost the same thermal storage efficiency after the stabilization of
system performance, despite the big difference in the exact cycle length or the time span
of each individual process within a cycle.
1). Base Case 2). Case 2
3). Case 3 4). Case 4
Figure 38: Thermal energy storage efficiency for cases with different cycle lengths and I/S/P
proportions
50%
60%
70%
80%
90%
100%
0 10 20 30 40 50 60
Eff
icie
ncy
Cycle
Two-month cyclic case ( I:S:P=1:0:1)
50%
60%
70%
80%
90%
100%
0 10 20 30 40 50 60
Eff
icie
ncy
Cycle
Two-day cyclic case ( I:S:P=1:0:1)
50%
60%
70%
80%
90%
100%
0 10 20 30 40
Eff
icie
ncy
Cycle
Three-month cyclic case (I:S:P=1:1:1)
50%
60%
70%
80%
90%
100%
0 10 20 30 40
Eff
icie
ncy
Cycle
Three-day cyclic case (I:S:P=1:1:1)

92
7.3 Scenario 3: Effect of Preheating
The preheating process is conducted to heat the reservoir before real working
cycles start. From previous simulations, it is not difficult to see that the preheating
process helps increase the thermal storage efficiency at least for the first few cycles.
However, it decreases the cumulative thermal energy storage efficiency as a trade-off.
In this section, the effect, especially the long term effect of preheating on the
system performance will be studied. The model in Case 5 has the same settings as the
base case model except it does not have a preheating process. Figure 39 shows both the
thermal energy storage efficiency and the cumulative thermal energy storage efficiency
as a function of time for both Case 5 and the base case. Figure 40 provides a graphic
comparison of the heat plumes in two cases. Without preheating, the s is low at the very
beginning. The first cycle s is only 76.5% in Case 5 while it is 93.3% in the base case.
However, the difference in s between two cases gets smaller and smaller. The difference
is only 2% after 1 year. About two and a half years later, the difference drops below 1%.
Unlike the thermal energy storage efficiency, the cumulative storage efficiency ( cs ) of
the base case model is much lower than that of Case 5 at the beginning of simulation, but
it increases sharply. The cs plots of two cases also converge quickly. According to these
results, the effect of preheating on system performance does not last long.
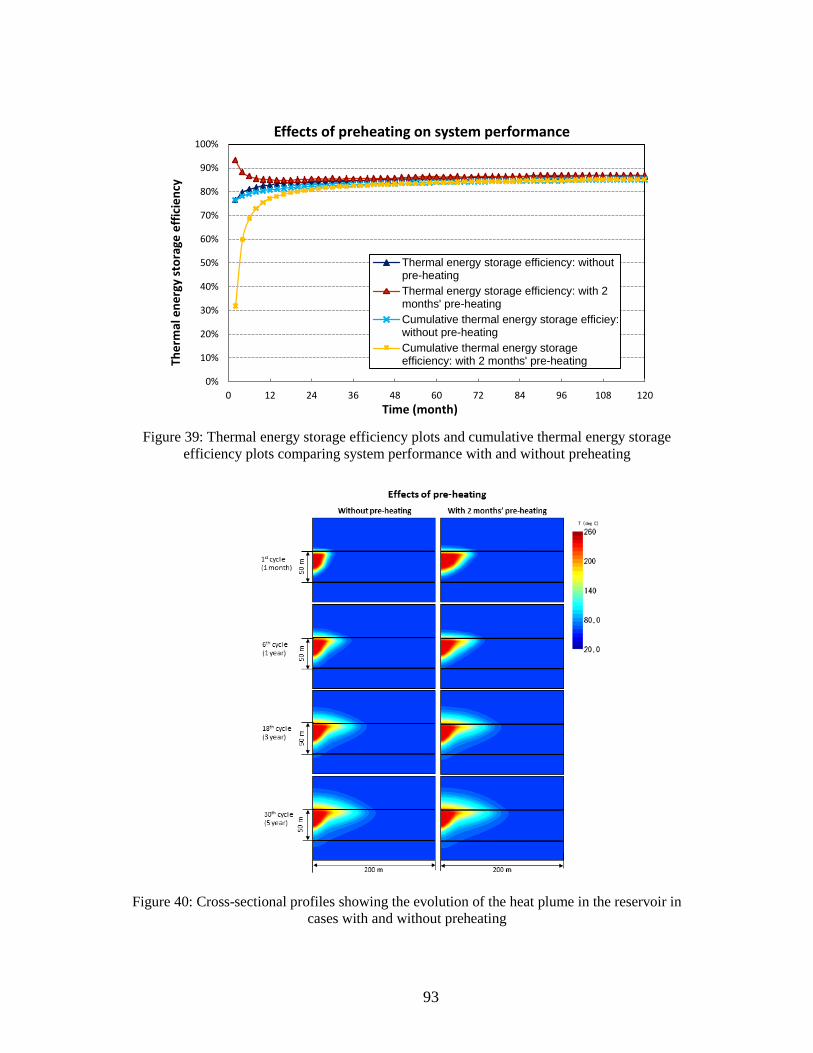
93
Figure 39: Thermal energy storage efficiency plots and cumulative thermal energy storage
efficiency plots comparing system performance with and without preheating
Figure 40: Cross-sectional profiles showing the evolution of the heat plume in the reservoir in
cases with and without preheating
0%
10%
20%
30%
40%
50%
60%
70%
80%
90%
100%
0 12 24 36 48 60 72 84 96 108 120
The
rmal
en
erg
y st
ora
ge e
ffic
ien
cy
Time (month)
Effects of preheating on system performance
Thermal energy storage efficiency: withoutpre-heating
Thermal energy storage efficiency: with 2months' pre-heating
Cumulative thermal energy storage efficiey:without pre-heating
Cumulative thermal energy storageefficiency: with 2 months' pre-heating

94
To conclude, the simulation indicates a tendency of convergence between cases
with and without preheating. After a certain period of time (~2.5 years), there is not much
difference in performance between two cases. In other words, the preheating process
does not make a big difference in the long run.
7.4 Scenario 4: Effect of Storage Formation Thickness
In this section, two cases with different storage formation thicknesses are
simulated. With all other geological and operational settings being the same, the aquifer
thickness is 25 m in Case 6 and 100 m in Case 7. These two thicknesses are ½ and twice
that of the base case model, respectively.
Throughout the 10 years operation, differences in system performance are
presented among them (Figure 41): within the range we studied, the thermal energy
storage efficiency of the system increases with the decrease in storage formation
thickness. After 60 cycles, the s is 90.0% in Case 6 (h=25 m), 86.7% in the base case
(h=50 m), and 77.0% in Case 7 (h=100 m). Overall, the thicker the reservoir is, the lower
the storage efficiency will be. This phenomenon is very similar to what obtained from
studies of the storage and recovery of freshwater in deep saline aquifer: a smaller
formation thickness leads to more favorable recoveries (Kumar and Kimbler, 1970).
Figure 42 provides a further look into the efficiency differences with regard to the
reservoir thickness. With hot water injected into the upper half of the reservoir, the cold
reservoir water around the well is displaced by hot water in Case 6 (h=25 m). The heat
core develops and covers the full thickness of the reservoir in this case. However, in the

95
base case model, the heat core formed around the well has a vertical extension only about
2/3 the aquifer thickness. Finally in Case 7, only a limited region in the upper half aquifer
has been heated by the injected hot water. As a consequence, the buoyancy effect on the
plume is most significant in Case 7 (h=100 m).
One explanation of the observed phenomenon is that when the injected hot water
comes out of the screen (especially from the bottom of the screen), it has a downward
vertical velocity component initially. On the other hand, there is the upward buoyancy
force which resists the downward flow and will possibly reverse the flow direction finally.
In the 25 m-thick reservoir, the downward hot water flow is able to reach the bottom of
the reservoir and displace the cold reservoir water around the well along the whole
aquifer thickness. The vertical temperature gradient in the aquifer near the injection
position is relatively small. In the 100 m-thick reservoir, the injected hot water only flows
down half the aquifer thickness. The lower half of the reservoir is still cold. This results
in a relatively large vertical temperature gradient and correspondingly, a large density
gradient. Therefore, the buoyancy effect is much stronger in Case 6 than that in Case 7.
This explains the fact that both the heat core and the overall heat plume are more compact
around the well in Case 6 while in Case 7, the gravity override effect is stronger and the
plume is sparser. It is much easier to recover thermal energy from a compact heat core,
such that the storage system is more efficient in this scenario. This can be confirmed by
comparing the residual heat in the reservoir after production in three cases from Figure 42.

96
Figure 42: Cross-sectional profiles showing different temperature distribution and evolution in
reservoirs of different thicknesses
50%
55%
60%
65%
70%
75%
80%
85%
90%
95%
100%
0 12 24 36 48 60 72 84 96 108 120
The
rmal
en
erg
y st
ora
ge e
ffic
ien
cy
Time (month)
Effects of storage formation thickness
h=25m h=50m h=100m
Figure 41: Thermal energy storage efficiency as a function of time for cases with different
storage formation thickness

97
7.5 Scenario 5: Effect of Permeability Anisotropy
Geologic formations are generally anisotropic. The linear convective flow in an
anisotropic porous medium was first studied by Castinel and Combarnous (1977) with
anisotropy in permeability only. Later, Epherre (1977) proposed his study on cases with
permeability and thermal conductivity both being anisotropic. Degan et al. (1995)
expended the previous research work and provided both analytical and numerical
solutions to convective heat transfer in a hydrodynamically and thermally anisotropic
porous layer. Years later, Straughan and Walker (1996) studied the convection in an
anisotropic porous medium with oblique principal axis. Further study under specific
conditions is conducted by other researchers using advanced computer technologies. A
common point of these researches is they all reveal that in a variety of scenarios, the
horizontal-to-vertical (or the inverse) permeability ratio is an important parameter in
determining the convective heat transfer in an anisotropic porous media.
In this section, we define a normalized number – the horizontal anisotropy factor
( h ) as the ratio of horizontal permeability over vertical permeability – to express the
hydrodynamic anisotropy of the aquifer medium. By changing the vertical permeability
of the reservoir material in the base case, two new cases could be simulated with different
h ’s. The horizontal anisotropy factors used in three models are 1.0 in Case 8, 10 in the
base case and 100 in Case 9.
The thermal energy storage efficiency calculated from the simulation results is
plotted as a function of time under different horizontal anisotropy factors in Figure 43.
From the efficiency plots, Case 9 with the highest h yields the highest efficiency. Its
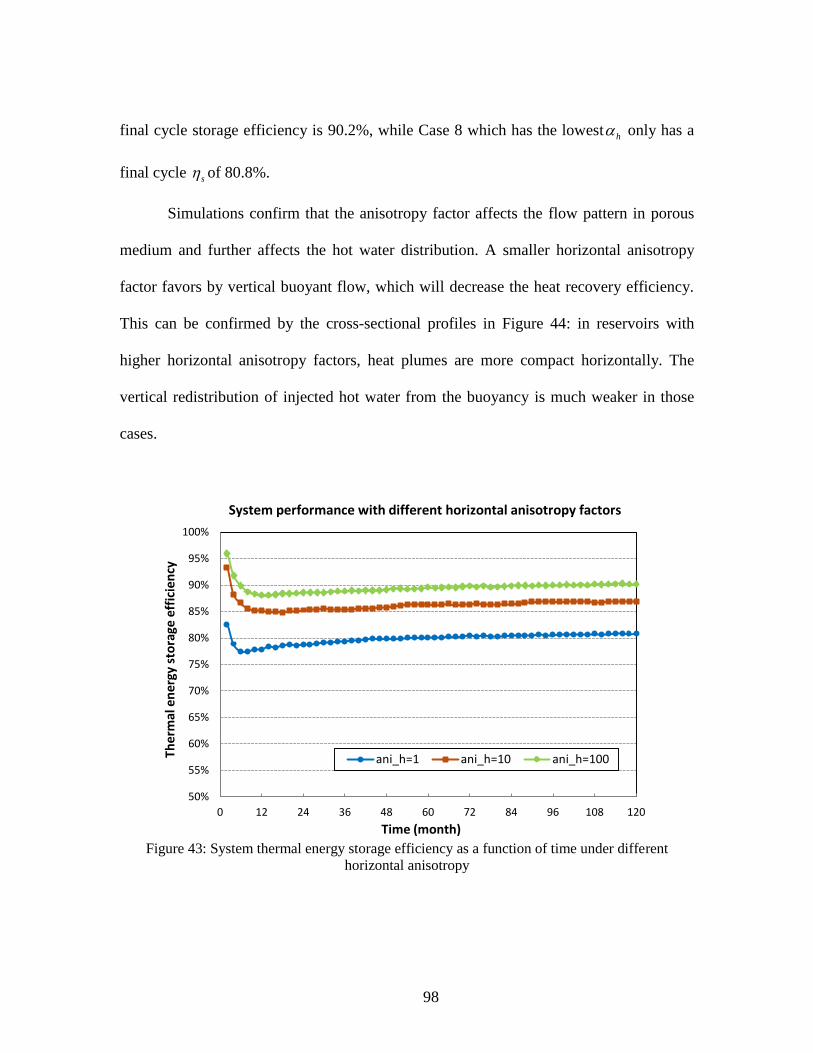
98
final cycle storage efficiency is 90.2%, while Case 8 which has the lowest h only has a
final cycle s of 80.8%.
Simulations confirm that the anisotropy factor affects the flow pattern in porous
medium and further affects the hot water distribution. A smaller horizontal anisotropy
factor favors by vertical buoyant flow, which will decrease the heat recovery efficiency.
This can be confirmed by the cross-sectional profiles in Figure 44: in reservoirs with
higher horizontal anisotropy factors, heat plumes are more compact horizontally. The
vertical redistribution of injected hot water from the buoyancy is much weaker in those
cases.
Figure 43: System thermal energy storage efficiency as a function of time under different
horizontal anisotropy
50%
55%
60%
65%
70%
75%
80%
85%
90%
95%
100%
0 12 24 36 48 60 72 84 96 108 120
Ther
mal
en
ergy
sto
rage
eff
icie
ncy
Time (month)
System performance with different horizontal anisotropy factors
ani_h=1 ani_h=10 ani_h=100

99
Figure 44: Cross-sectional profiles showing different temperature distribution and evolution in
storage reservoirs with different horizontal permeability anisotropy factors
7.6 Scenario 6: Effect of Storage Formation Shape
In previous sections, the storage strata are all flat layers. However, in reality, few
rock strata are really flat. They can be tilted, folded (multi-folded) and faulted, resulting
in complex geological structures. The structures of the reservoir and adjacent strata can
significantly affect the trapping of the injected fluid, as well as the evolution or migration
of the stored fluid. Natural underground reservoirs (e.g., oil and gas reservoirs) typically
exist in predictable places - such as at the tops of anticlines, next to faults, beneath
unconformities or in the updip pinchouts of sandstone beds.
A great amount of research work has been done on such topics. Bories and
Combarnous (1973) proposed their experimental and theoretical study early in the 70’s,

100
on the natural convection in a sloping porous layer bounded by two parallel impermeable
planes. Later, Vasseur et al. (1987) studied the natural convection in a thin, inclined,
porous layer exposed to a constant heat flux and proposed an analytical prediction and a
numerical solution with a good agreement. Bjørlykke et al. (1988) did the modeling of
thermal convection in sedimentary basins using a porous three-layer model to simulate
pore-water flow in a sedimentary basin with layers of different permeabilities. More
recently, Mbaye et al. (1993) studied the heat transfer in an inclined porous layer
bounded by a finite-thickness wall; Laouadi and Atif (2001) developed the model of
convective heat transfer within multi-layer domes; Simms and Garven (2004)
investigated the thermal convection in faulted extensional sedimentary basins.
In this work, three reservoir shapes, simple but typical in natural, will be modeled.
They are flat layers (base case model), basins (Case 10) and underground domes (Case
11).

101
Figure 45: Schemes of three formation shapes: Vertical and radial cross-sections illustrate the
construction of these formation shapes in the models
Figure 45 provides a schematic illustration of three reservoir models. The basin
and the dome are modeled as a cone and an inverted cone respectively, both with a radius
of 98 m and an apex angle of 126°. All three cases are half screened. The total operation
period is 10 years with two months preheating. The corresponding thermal energy storage
efficiencies are plotted as a function of time in Figure 46. According to the results from
modeling, storing hot water in the dome yields the highest thermal energy storage
efficiency while storing in the basin yields the lowest. However, although the dome-
shape reservoir and basin-shape reservoir in our models have the same apex angle, the
efficiency gap between the base case and the dome case is larger than that between the

102
base case and the basin case. There is more than 5% difference between the first pair
while there is only ~2% between the second pair. Storing hot water in a dome reservoir
can improve the storage efficiency to ~92%. This is because the dome can limit the
lateral migration of hot water away from the well and helps trap the heat around the well
screen. On the contrary, in a basin reservoir, it is convenience for the injected hot water
to migrate away from the well and lost into the sounding while it is very hard for the hot
water to flow back to the well against buoyancy during production. Therefore, as is
shown in Figure 47, the heat plume is the dome is the most compact among three while
the plume in the basin reservoir is the sparsest.
Figure 46: Thermal energy storage efficiency as a function of time for cases with different storage
formation shape
50%
55%
60%
65%
70%
75%
80%
85%
90%
95%
100%
0 12 24 36 48 60 72 84 96 108 120
The
rmal
en
erg
y st
ora
ge e
ffic
ien
cy
Time (month)
Effects of storage formation shape
Flat Dome Basin
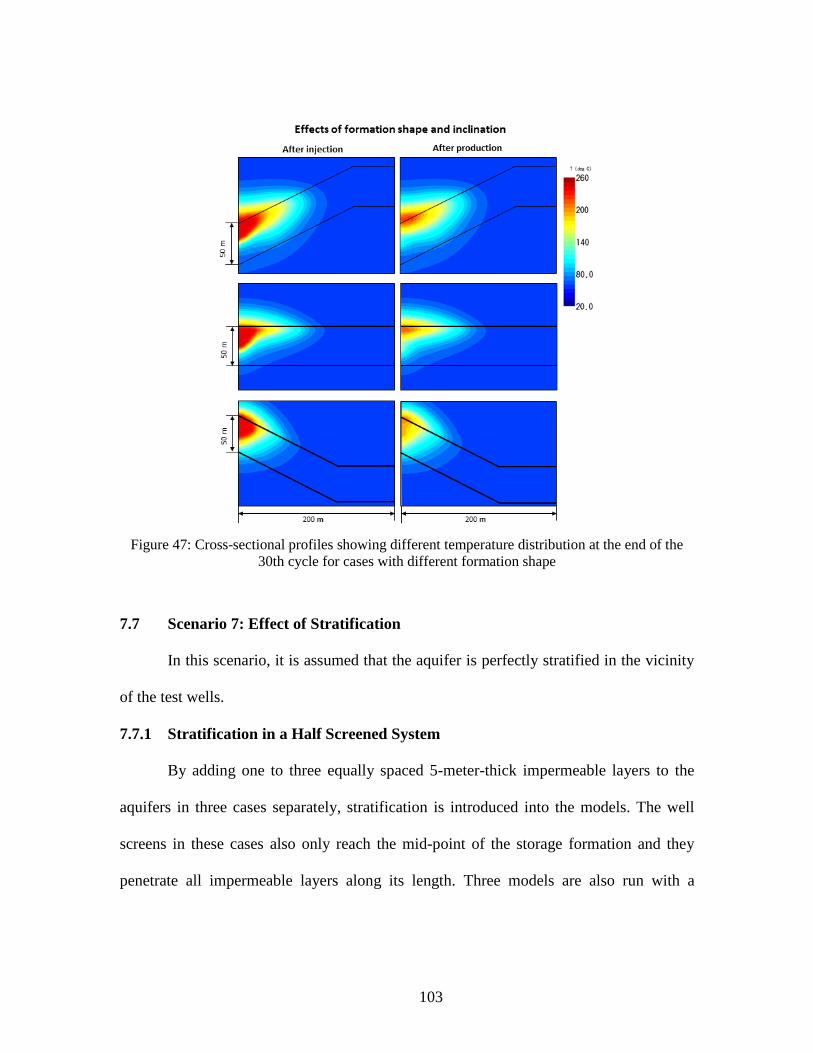
103
Figure 47: Cross-sectional profiles showing different temperature distribution at the end of the
30th cycle for cases with different formation shape
7.7 Scenario 7: Effect of Stratification
In this scenario, it is assumed that the aquifer is perfectly stratified in the vicinity
of the test wells.
7.7.1 Stratification in a Half Screened System
By adding one to three equally spaced 5-meter-thick impermeable layers to the
aquifers in three cases separately, stratification is introduced into the models. The well
screens in these cases also only reach the mid-point of the storage formation and they
penetrate all impermeable layers along its length. Three models are also run with a

104
preheating process for two months and a sequence of two-month working cycles for ten
years.
The thermal energy storage efficiencies from simulation are plotted as a function
of time for three stratified cases as well as the base case in Figure 48. The heat plume
evolution within the 30th
cycle is taken as a representative evolution process and is
presented in Figure 49 for all four cases.
The efficiency plots show an irregular relationship between the storage efficiency
and the stratification. Looking into the heat plume evolution profiles, in Case 12 (with
one impermeable layer) and Case 14 (with three impermeable layers), there is almost no
gravity override effect presented. On the contrary, there is a ―tail‖ of the heat plume
trapped under lower impermeable layers in these two cases. After the production stage,
these plume tails still could not be depleted. Correspondingly, the systems in Cases 12
and 13 are less efficient than that in the base case. However, Case 13 with two
impermeable layers has higher efficiency than the base case. The heat plume and the heat
core in this case are also the most compact among all four cases.

105
Figure 48: Thermal energy storage efficiency as a function of time for cases with different
stratification under scenario of half screen
One explanation of the above phenomenon is due to the relative position of the
well screen and the impermeable layers. Stratification divides the whole highly
permeable aquifer into thin permeable layers (sub storing layers) interbedded with
impermeable layers (lenses). In the half screened scenario, since the bottom of the well is
not sealed and does not reach the bottom of the aquifer, water can flow out freely from
the well bottom at a large rate. If there is a thin and confined (by the impermeable lenses
in the stratified aquifer) permeable layer located around the well bottom, it might cause a
large amount of hot water flow into this thin layer (shown as the long plume ―tails‖ in
Cases 11 and 13). In a thin permeable layer, it is difficult for heat in such a long tail to be
50%
55%
60%
65%
70%
75%
80%
85%
90%
95%
100%
0 12 24 36 48 60 72 84 96 108 120
Ther
mal
En
ergy
Sto
rage
Eff
icie
ncy
Time (month)
Thermal energy storage efficiency with different formation strafication (half screened)
Without impermeable layer With 1 impermeable layer
With 2 impermeable layers With 3 impermeable layers

106
recovered during production. Hence, the storage efficiency is relatively low in such a
case.
From these models, in a half-screened scenario, the relative position of
stratification and the well screen is an important factor when considering the effect of
stratification on the storage system performance.
Figure 49: Cross-sectional profiles showing different temperature distribution at the end of the
injection and production period of the 30th cycle for cases with different stratification under the
half-screened scenario. The little vertical purple lines indicate the well screen positions

107
7.7.2 Stratification in a Fully Screened System
To further study the effect of reservoir stratification and exclude the influence
from the well screen position, another set of fully screened cases (Cases 15~18) are
studied. In these cases, the well screen has the same length as the aquifer thickness. The
bottom of the well reaches the bottom of the aquifer.
Figure 50: Thermal energy storage efficiency as a function of time for cases with different
stratification under the scenario of full screen
In such a fully screened scenario, there is a clear relationship between the system
thermal energy storage efficiency and the stratification pattern of the reservoir: aquifer
stratification will enhance the system performance. Within the simulation range, s
increases with the increase in system stratification (Figure 50). Without any stratification
(Case 15), the s is only 77.7% but with three 5-meter-thick impermeable layers, the s
50%
55%
60%
65%
70%
75%
80%
85%
90%
95%
100%
0 12 24 36 48 60 72 84 96 108 120
The
rmal
sto
rage
eff
icie
ncy
Time (month)
Thermal energy storage efficiency with different formation strafication (fully screened)
Without stratification Stratified by 1 impermeable layerStratified by 2 impermeable layers Stratified by 3 impermeable layers

108
increases to 87.7%. Figure 51 provides the cross-sectional profiles of the heat plume in
different stages within the final working cycle. It can be clearly viewed that the
impermeable layers within the storage formation act as the barriers for vertical flow.
Stratification reduces the influence of buoyancy and helps improve thermal recovery.
Based on the results from Sections 7.7.1 and 7.7.2, it can be concluded that
generally, appropriate stratification of the storage formation can reduce the effect of
buoyancy on the thermal distribution and the heat plume evolution. However, the effect
of stratification on storage efficiency depends on the position of the well screen in the
stratified reservoir.
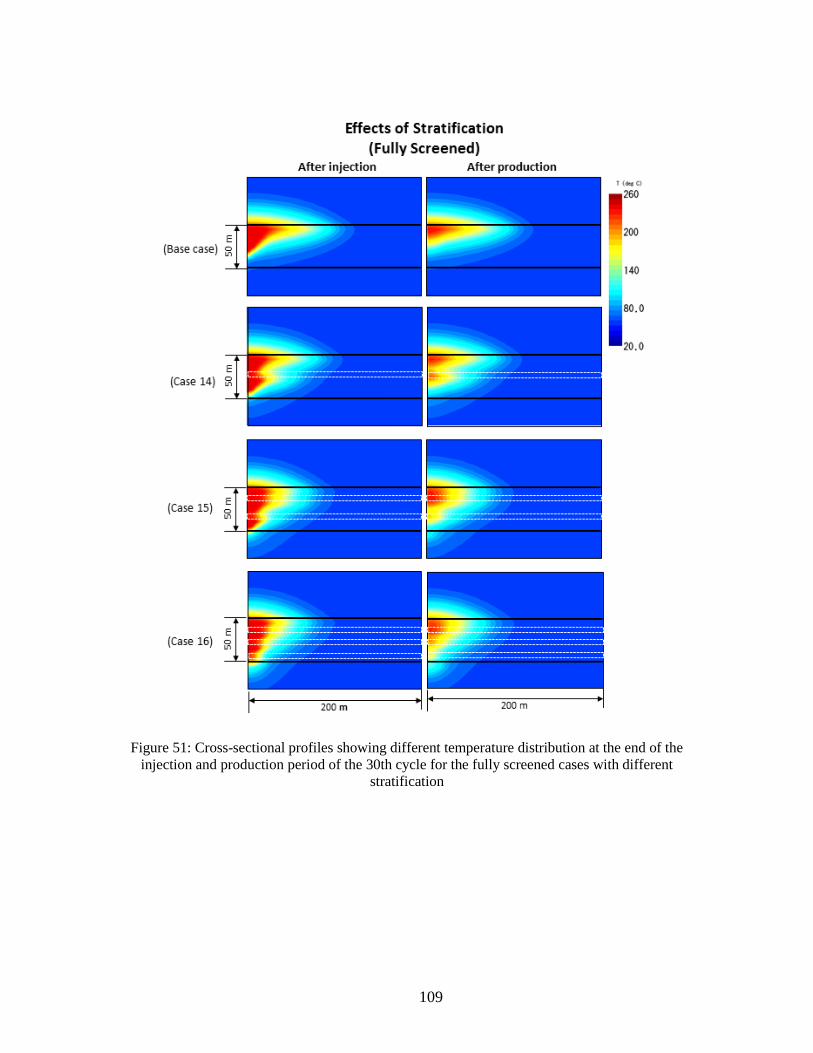
109
Figure 51: Cross-sectional profiles showing different temperature distribution at the end of the
injection and production period of the 30th cycle for the fully screened cases with different
stratification

110
8 SUMMARY
This work proposes a new concept of storing high temperature water in a deep
confined aquifer under high hydrostatic pressure as an alternative for conventional
thermal or electrical energy storage methods.
Major results and conclusions from numerical simulations are summarized as
following:
1) In a scenario of running cyclic injection-production alternating processes for
10 years with a cycle length of two months, an equal I/P rate of 10 kg/s, and a constant
heat source temperature of 250°C, 83% of the injected thermal energy could be recovered
and the relative electricity generation efficiency ( re ) can reach ~73%. The reservoir
heat loss is about 3.25 times the wellbore heat loss.
2) The thermal energy storage efficiency ( s ) of a HSTES system is inversely
correlated with the injection temperature while the heat engine efficiency (CA efficiency)
is positive correlated with the source temperature. The relationship between the
temperature of hot water injected for storage and the relative electricity generation
efficiency which reflects heat losses from both storage and the heat engine depends on
the specific situation.
3) In a typical daily storage scenario with the purpose of shifting the surplus hot
water produced at peak-production hours (10 am - 2 pm) to peak-demand hours without
sunshine (6 pm -10 pm), the HSTES system has good performance with a thermal energy

111
storage efficiency ( s ) of 78% and a relative electricity generation efficiency ( re ) of
66%.
4) In a typical seasonal scenario with the purpose of shifting thermal energy from
summer to winter with expand storage in fall, the s of the storage system is ~69% and
the re reaches ~53% by the end of the simulation period of 10 years.
5) Injecting and producing hot water from the upper half of the reservoir can
recover 10% more thermal energy than operating throughout the whole aquifer thickness
for the case studied.
6) Cases simulated with the same I/S/P proportion have almost the same
efficiency performance, despite the big difference in the exact time spans of injection,
storage or production processes.
7) Simulations indicate that a few months of preheating does not make much of a
contribution to system performance in the long run though it could increase the storage
efficiency for the first few cycles.
8) A HSTES system with a thinner reservoir has better performance than that
with a thicker reservoir. The simulated thermal energy storage efficiency is 90% for the
25-meter-thick aquifer case, 87% for the 50-meter-thick aquifer case and 77% for the
100-meter-thick aquifer case. The inverse correlation between reservoir thickness and
efficiency is a result of the fact that the buoyancy effect on the heat distribution is weaker
in a thinner confined aquifer than that in a thicker confined aquifer.
9) Permeability anisotropy is an important influential factor. With a fixed
horizontal permeability, an increase in horizontal anisotropy factor will result in a

112
decrease in vertical flow, and thus, result in a weaker gravity override effect, thus
enhancing the heat recovery.
10) The storage formation shape affects the heat distribution within the reservoir.
In a dome-shape reservoir, the injected hot water forms a relatively compact heat plume
around the well screen while in a basin-shape reservoir, hot water flows away from the
well easily, which increases the difficulty in recovery.
11) The effect of aquifer stratification on the storage system is complex.
Generally, impermeable lenses around the well screen reduce the local buoyancy effect,
which is favored by heat recovery. However, it is also possible for these impermeable
lenses to act as obstacles to hot water recovery by trapping the hot water underneath them
when they happen to appear at some specific locations.

113
9 CLOSING
To conclude, according to this work, the proposed HSTES system has following
advantages:
1) Extremely reliable, robust and safe
Due to the depth of the energy repository (at least 400 m below ground surface),
the reliability and safety of the subsurface storage system is much higher than fossil fuel
energy storage systems such as large diesel tanks or compressed natural gas bullets
located on or near the surface.
2) Scalable energy storage capacity
The energy storage system can likely handle a wide range of energy storage
amounts from a several thousand kWh to tens of thousands of MWh of electrical energy
equivalent.
3) Application in isolated areas
The system could be used to support off-grid power generation in remote areas or
severe environments such as deserts.
4) Potential to store extremely large amounts of energy for long period of time
Solar power plants are badly in need of high-capacity and cost-effective seasonal
energy storage systems. Such systems can significantly increase the annual electricity
production efficiency and ensure the full operation of solar power plants throughout the
year without depending on fossil fuels. Generally, efficiency increases and the specific
construction cost decreases with size. Sillman (1981) evaluated the performance of solar

114
energy systems with long-term storage capacity and announced that it increased linearly
as the storage size increased up to the point of unconstrained operation.
Using the concepts and technologies proposed in this work, very large storage
systems comprised of multiple wells, solar systems, and electrical generation systems, are
possible. For example, a 100,000 MWh system (capable of sustaining 300,000 people for
a month) only takes a core storage volume of about100 m thick and 172 m in diameter.
This is equivalent to the energy from about 9 million gallons of diesel. Also, since the
storage is deep underground, it has little or no impact on the surface buildings and
facilities, and the influence of landscape on location selection should not be a problem.
5) Flexible Energy Utilization Rate
This system can produce a large quantity of electricity quickly (over a span of
several hours, days, or weeks), or a smaller amount of electricity over a longer period of
time (over a span of several months) depending on the needs and anticipated grid outage.
6) Renewable Energy Generation
Thermal energy storage technology is a method of great potential for compensating for
the inherent intermittency of renewable resources in power generation and solving the
time mismatch between the renewable energy supply and electricity demand.
7) Large Cycle Life
The system is easily refilled once the heat is removed from the system.
8) High Electrical Energy Storage Efficiency
The ability to store high temperature water contributes to improving the engine
efficiency during energy conversion. The energy storage efficiency of our proposed

115
system is competitive with that of high-performance electrical batteries, and may exceed
the typical efficiencies of pumped water and cavern compressed air storage.

116
REFERENCE
Abhat, A., 1980. Short term thermal energy storage. Revue de physique appliquee, 15(3):
477-501.
Aceves-Saborio, S., Nakamura, H. and Reistad, G., 1994. Optimum efficiencies and
phase change temperatures in latent heat storage systems. Journal of Energy
Resources Technology;(United States), 116(1).
Agyenim, F., Eames, P. and Smyth, M., 2009. A comparison of heat transfer
enhancement in a medium temperature thermal energy storage heat exchanger
using fins. Solar Energy, 83(9): 1509-1520.
Agyenim, F., Knight, I. and Rhodes, M., 2010. Design and experimental testing of the
performance of an outdoor LiBr/H2O solar thermal absorption cooling system
with a cold store. Solar Energy, 84(5): 735-744.
Akgün, M., Aydın, O. and Kaygusuz, K., 2008. Thermal energy storage performance of
paraffin in a novel tube-in-shell system. Applied Thermal Engineering, 28(5–6):
405-413.
Alcott, A., Swenson, D. and Hardeman, B., 2006. Using petrasim to create, execute, and
post-process TOUGH2 models, Proceedings of the TOUGH Symposium,
Lawrence Berkeley National Laboratory, Berkeley, California, May, pp. 15-17.
Alcott, A., Swenson, D. and Hardeman, B., 2012. Conceptual tools in the PetraSim
graphical user interface for the TOUGH2 suite of simulators.
Allen, P.A. and Allen, J.R., 2009. Basin analysis: principles and applications. Wiley.
com.
Alves, I., Alhanati, F. and Shoham, O., 1992. A Unified Model for Predicting Flowing
Temperature Distribution. in Wellbores and Pipelines. SPE production
engineering, 7(4): 363-367.
Andersson, O., 2007. Aquifer thermal energy storage (ATES), Thermal Energy Storage
for Sustainable Energy Consumption. Springer, pp. 155-176.
Arnold, F., 1990. Temperature variation in a circulating wellbore fluid. Journal of energy
resources technology, 112(2): 79-83.
Bachu, S., Gunter, W.D. and Perkins, E.H., 1994. Aquifer disposal of CO2:
Hydrodynamic and mineral trapping. Energy Conversion and Management, 35(4):
269-279.

117
Bakker, M., van Helden, W. and Hauer, A., 2008. Advanced materials for compact
thermal energy storage: a new Joint IEA SHC/ECES Task, 1st International
Conference on Solar Heating, Cooling and Buildings.
Battistelli, A., Calore, C. and Pruess, K., 1997. The simulator TOUGH2/EWASG for
modelling geothermal reservoirs with brines and non-condensible gas.
Geothermics, 26(4): 437-464.
Bauer, T., Pfleger, N., Breidenbach, N., Eck, M., Laing, D. and Kaesche, S., 2013.
Material aspects of Solar Salt for sensible heat storage. Applied Energy, 111(0):
1114-1119.
Bejan, A., 1988. Advanced engineering thermodynamics. John Wiley & Sons.
Benson, S.M. and Orr, F.M., 2008. Carbon dioxide capture and storage. Mrs Bulletin,
33(04): 303-305.
Bhat, A., Swenson, D. and Gosavi, S., 2005. Coupling the HOLA wellbore simulator
with TOUGH2, Proceedings of the 20th workshop on geothermal reservoir
engineering. Stanford University, Stanford, California.
Bjørlykke, K., Mo, A. and Palm, E., 1988. Modelling of thermal convection in
sedimentary basins and its relevance to diagenetic reactions. Marine and
Petroleum Geology, 5(4): 338-351.
Blackwell, D.D., Steele, J.L. and Carter, L., 1991. Heat flow patterns of the North
American continent: A discussion of the DNAG geothermal map of North
America. Neotectonics of North America: Geological Society of America DNAG
Decade Map, 1: 423-437.
Bories, S. and Combarnous, M., 1973. Natural convection in a sloping porous layer.
Journal of Fluid Mechanics, 57: 63-79.
Bridger, D.W. and Allen, D.M., 2005. Designing aquifer thermal energy storage systems.
ASHRAE JOURNAL, 47(9): S32.
Bugaje, I., 2006. Renewable energy for sustainable development in Africa: a review.
Renewable and Sustainable Energy Reviews, 10(6): 603-612.
Cárdenas, B. and León, N., 2013. High temperature latent heat thermal energy storage:
Phase change materials, design considerations and performance enhancement
techniques. Renewable and Sustainable Energy Reviews, 27(0): 724-737.
Castinel, G. and Combarnous, M., 1977. Natural convection in an anisotropic porous
layer. Int. Chem. Eng, 17(4): 605-614.

118
Chen, L., Wu, C. and Sun, F., 1999. Finite time thermodynamic optimization or entropy
generation minimization of energy systems. Journal of Non-Equilibrium
Thermodynamics, 24(4): 327-359.
Coats, K., 1977. Geothermal reservoir modelling, SPE Annual Fall Technical Conference
and Exhibition.
Coleman, J.L., Jr. and Cahan, S.M., 2012. Preliminary catalog of the sedimentary basins
of the United States. 2012-1111, Reston, VA.
Curzon, F. and Ahlborn, B., 1975. Efficiency of a Carnot engine at maximum power
output. American Journal of Physics, 43(1): 22-24.
Degan, G., Vasseur, P. and Bilgen, E., 1995. Convective heat transfer in a vertical
anisotropic porous layer. International journal of heat and mass transfer, 38(11):
1975-1987.
Desmedt, J., Hoes, H. and Lemmens, B., 2007. Shallow geothermal applications in
Belgium, Proceedings European Geothermal Congress.
Dincer, I. and Rosen, M., 2002. Thermal energy storage: systems and applications.
Wiley. com.
DiPippo, R., 2012a. Double-Flash Steam Power Plants. In: R. DiPippo (Editor),
Geothermal Power Plants (Third Edition). Butterworth-Heinemann, Boston, pp.
111-130.
DiPippo, R., 2012b. Single-Flash Steam Power Plants. In: R. DiPippo (Editor),
Geothermal Power Plants (Third Edition). Butterworth-Heinemann, Boston, pp.
81-109.
DOE, U., 2013. International Energy outlook 2013, Technical Report No. DOE/EIA-
0484(2013), available at: http://www.eia.gov/forecasts/ieo/pdf/0484(2013).pdf.
Duffie, J., Beckman, W.A., Winston, R. and Kreith, F., 1976. Solar‐Energy Thermal
Processes. Physics Today, 29: 62.
Durlofsky, L.J., 2000. An approximate model for well productivity in heterogeneous
porous media. Mathematical geology, 32(4): 421-438.
Edwards, A.L., 1972. TRUMP: a computer program for transient and steady-state
temperature distributions in multidimensional systems, CALIFORNIA UNIV.,
LIVERMORE. LAWRENCE LIVERMORE LAB.
Epherre, J.F., 1977. Criterion for the appearance of natural convection in an anisotropic
porous
119
layer. Intl Chem Eng 17: 615–616.
Farhat, K. and Benson, S.M., 2013. A technical assessment of CO2 Interim Storage in
deep saline aquifers. International Journal of Greenhouse Gas Control, 15(0): 200-
212.
Farhat, K., Brandt, A. and Benson, S.M., 2011. CO2 Interim storage: Technical
characteristics and potential role in CO2 market development. Energy Procedia,
4(0): 2628-2636.
Fernández-García, A., Zarza, E., Valenzuela, L. and Pérez, M., 2010. Parabolic-trough
solar collectors and their applications. Renewable and Sustainable Energy
Reviews, 14(7): 1695-1721.
Garg, H., Mullick, S. and Bhargava, A., 1985. Solar thermal energy storage. Springer.
Gasda, S.E., Nilsen, H.M. and Dahle, H.K., 2013. Impact of structural heterogeneity on
upscaled models for large-scale CO2 migration and trapping in saline aquifers.
Advances in Water Resources, 62(0): 520-532.
Gil, A., Medrano, M., Martorell, I., Lázaro, A., Dolado, P., Zalba, B. and Cabeza, L.F.,
2010. State of the art on high temperature thermal energy storage for power
generation. Part 1—Concepts, materials and modellization. Renewable and
Sustainable Energy Reviews, 14(1): 31-55.
Gunter, W.D., Perkins, E.H. and McCann, T.J., 1993. Aquifer disposal of CO2-rich
gases: Reaction design for added capacity. Energy Conversion and Management,
34(9–11): 941-948.
Häberle, A., Berger, M., Luginsland, F., Zahler, C., Baitsch, M., Henning, H.-M. and
Rommel, M., 2006. Linear concentrating Fresnel collector for process heat
applications, Proceedings of the 13th International Symposium on Concentrated
Solar Power and Chemical Energy Technologies.
Harris, P.T. and Baker, E.K., 2012. 64 - GeoHab Atlas of Seafloor Geomorphic Features
and Benthic Habitats: Synthesis and Lessons Learned. In: P.T. Harris and E.K.
Baker (Editors), Seafloor Geomorphology as Benthic Habitat. Elsevier, London,
pp. 871-890.
Hasan, A. and Kabir, C., 1994. Aspects of Wellbore Heat Transfer During Two-Phase
Flow (includes associated papers 30226 and 30970). Old Production & Facilities,
9(3): 211-216.
Hasan, A., Kabir, C.S. and Lin, D., 2003. Analytic wellbore temperature model for
transient gas-well testing, SPE Annual Technical Conference and Exhibition.

120
Holloway, S., 1997. An overview of the underground disposal of carbon dioxide. Energy
Conversion and Management, 38, Supplement(0): S193-S198.
Hutchinson, M., Booth, T., McMahon, J. and Nix, H., 1984. Estimating monthly mean
valuesof daily total solar radiation for Australia. Solar Energy, 32(2): 277-290.
Jedensjö, T., 2005. A technical evaluation of the thermal solar collector systems at Bo01
in Malmö.
Kühn, M., Stanjek, H., Peiffer, S. and Clauser, C., 2013. Mineral Trapping of CO2 in
Operated Geothermal Reservoirs – Numerical Simulations on Various Scales.
Energy Procedia, 40(0): 454-463.
Kabir, C., Hasan, A., Jordan, D. and Wang, X., 1996. A wellbore/reservoir simulator for
testing gas wells in high-temperature reservoirs. SPE Formation Evaluation,
11(2): 128-134.
Kalogirou, S.A., 2004. Solar thermal collectors and applications. Progress in Energy and
Combustion Science, 30(3): 231-295.
Kiryukhin, A. and Miroshnik, O., 2012. A 20 YEAR PROGRESS IN THE TOUGH2
MODELING OF THE MUTNOVSKY GEOTHERMAL FIELD,
KAMCHATKA, RUSSIA, TOUGH Symposium, Lawrence Berkeley National
Laboratory, Berkeley, California.
Kranz, S. and Frick, S., 2013. Efficient cooling energy supply with aquifer thermal
energy storages. Applied Energy, 109(0): 321-327.
Kumar, A. and Kimbler, O.K., 1970. Effect of dispersion, gravitational segregation, and
formation stratification on the recovery of freshwater stored in saline aquifers.
Water Resources Research, 6(6): 1689-1700.
Laouadi, A. and Atif, M.R., 2001. Natural convection heat transfer within multi-layer
domes. International Journal of Heat and Mass Transfer, 44(10): 1973-1981.
Lee, K.S., 2010. A review on concepts, applications, and models of aquifer thermal
energy storage systems. Energies, 3(6): 1320-1334.
Liu, M., Saman, W. and Bruno, F., 2012. Review on storage materials and thermal
performance enhancement techniques for high temperature phase change thermal
storage systems. Renewable and Sustainable Energy Reviews, 16(4): 2118-2132.
Lu, J., Kordi, M., Hovorka, S.D., Meckel, T.A. and Christopher, C.A., 2013. Reservoir
characterization and complications for trapping mechanisms at Cranfield CO2
injection site. International Journal of Greenhouse Gas Control, 18(0): 361-374.

121
Müller-Steinhagen, H. and Trieb, F., 2004. Concentrating solar power. A review of the
technology. Ingenia Inform QR Acad Eng, 18: 43-50.
Martinot, E., Chaurey, A., Lew, D., Moreira, J.R. and Wamukonya, N., 2002. Renewable
energy markets in developing countries*. Annual Review of Energy and the
Environment, 27(1): 309-348.
Matthew, F., Randal, G. and Ian, T., 2004. The function of gas-water relative
permeability hysteresis in the sequestration of carbon dioxide in saline
formations, SPE Asia Pacific Oil and Gas Conference and Exhibition.
Mbaye, M., Bilgen, E. and Vasseur, P., 1993. Natural-convection heat transfer in an
inclined porous layer boarded by a finite-thickness wall. International Journal of
Heat and Fluid Flow, 14(3): 284-291.
Mendrinos, D., Kontoleontos, E. and Karytsas, C., 2012. Geothermal binary plants: water
or air cooled, Presented during the ENGINE workshop.
Metz, B., Davidson, O., de Coninck, H., Loos, M. and Meyer, L., 2005. IPCC special
report on carbon dioxide capture and storage, Intergovernmental Panel on Climate
Change, Geneva (Switzerland). Working Group III.
Middleton, R.S. and Eccles, J.K., 2013. The complex future of CO2 capture and storage:
Variable electricity generation and fossil fuel power. Applied Energy, 108(0): 66-
73.
Mills, D.R. and Morrison, G.L., 2000. Compact Linear Fresnel Reflector solar thermal
powerplants. Solar Energy, 68(3): 263-283.
Muskat, M. and Wyckoff, R.D., 1946. The flow of homogeneous fluids through porous
media. JW Edwards Ann Arbor.
Nieuwenhout, F., Van Dijk, A., Lasschuit, P., Van Roekel, G., Van Dijk, V., Hirsch, D.,
Arriaza, H., Hankins, M., Sharma, B. and Wade, H., 2001. Experience with solar
home systems in developing countries: a review. Progress in Photovoltaics:
Research and Applications, 9(6): 455-474.
Novo, A.V., Bayon, J.R., Castro-Fresno, D. and Rodriguez-Hernandez, J., 2010. Review
of seasonal heat storage in large basins: Water tanks and gravel–water pits.
Applied Energy, 87(2): 390-397.
Nugent, D. and Sovacool, B.K., 2014. Assessing the lifecycle greenhouse gas emissions
from solar PV and wind energy: A critical meta-survey. Energy Policy, 65(0):
229-244.
122
Ortega, J.I., Burgaleta, J.I. and Tellez, F.M., 2008. Central receiver system solar power
plant using molten salt as heat transfer fluid. Journal of Solar Energy Engineering,
130(2): 24501.
Pacheco, J.E., Showalter, S.K. and Kolb, W.J., 2002. Development of a molten-salt
thermocline thermal storage system for parabolic trough plants.
TRANSACTIONS-AMERICAN SOCIETY OF MECHANICAL ENGINEERS
JOURNAL OF SOLAR ENERGY ENGINEERING, 124(2): 153-159.
Paksoy, H., Gürbüz, Z., Turgut, B., Dikici, D. and Evliya, H., 2004. Aquifer thermal
storage (ATES) for air-conditioning of a supermarket in Turkey. Renewable
energy, 29(12): 1991-1996.
Paksoy, H., Snijders, A. and Stiles, L., 2009. State-of-the-art review of aquifer thermal
energy storage systems for heating and cooling buildings. Proceedings of
Effstock.
Paksoy, H.Ö., 2007. Thermal energy storage for sustainable energy consumption:
fundamentals, case studies and design, 234. Springer.
Park, S.R., Pandey, A.K., Tyagi, V.V. and Tyagi, S.K., 2014. Energy and exergy analysis
of typical renewable energy systems. Renewable and Sustainable Energy
Reviews, 30(0): 105-123.
Peaceman, D.W., 1977. Fundamentals of numerical reservoir simulation. Elsevier.
Perez, R. and Perez, M., 2009. A fundamental look at energy reserves for the planet. The
IEA SHC Solar Update, 50: 2-3.
Pfeil, M. and Koch, H., 2000. High performance–low cost seasonal gravel/water storage
pit. Solar Energy, 69(6): 461-467.
Pinel, P., Cruickshank, C.A., Beausoleil-Morrison, I. and Wills, A., 2011. A review of
available methods for seasonal storage of solar thermal energy in residential
applications. Renewable and Sustainable Energy Reviews, 15(7): 3341-3359.
Planert, M. and Williams, J.S., 1995. Ground Water Atlas of the United States. Segment
1, California, Nevada. US Geological Survey.
Porras, E.A., Tanaka, T., Fujii, H. and Itoi, R., 2007. Numerical modeling of the
Momotombo geothermal system, Nicaragua. Geothermics, 36(4): 304-329.
Pourafshary, P., Varavei, A., Sepehrnoori, K. and Podio, A., 2009. A compositional
wellbore/reservoir simulator to model multiphase flow and temperature
distribution. Journal of Petroleum Science and Engineering, 69(1): 40-52.

123
Price, H., Lüpfert, E., Kearney, D., Zarza, E., Cohen, G., Gee, R. and Mahoney, R., 2002.
Advances in parabolic trough solar power technology. Journal of solar energy
engineering, 124(2): 109-125.
Price, S., 2010. 2008 Solar Technologies Market Report. LBNL-3490E, Lawrence
Berkeley National Laboratory.
Pruess, K., Moridis, G. and Oldenburg, C., 1999. TOUGH2 user's guide, version 2.0.
Lawrence Berkeley National Laboratory Berkeley.
Quaschning, V., 2003. Technology fundamentals. Solar thermal power plants. Renew
Energy World, 6(6): 109-13.
Ramey, H., 1962. Wellbore heat transmission. Journal of Petroleum Technology, 14(4):
427-435.
Rani, N., Pathak, V. and Shrivastava, J.P., 2013. CO2 Mineral Trapping: An
Experimental Study on the Carbonation of Basalts from the Eastern Deccan
Volcanic Province, India. Procedia Earth and Planetary Science, 7(0): 806-809.
Raymond, L., 1969. Temperature distribution in a circulating drilling fluid. Journal of
Petroleum Technology, 21(3): 333-341.
Sagar, R., Doty, D. and Schmidt, Z., 1991. Predicting temperature profiles in a flowing
well. SPE production engineering, 6(4): 441-448.
Sanner, B. and Knoblich, K., 1998. NEW IEA-ACTIVITY ECES ANNEX 12" HIGH
TEMPERATURE UNDERGROUND THERMAL ENERGY STORAGE,
Proceedings of The Second Stockton International Geothermal Conference, pp.
16-17.
Schmidt, T., Mangold, D. and Müller-Steinhagen, H., 2004. Central solar heating plants
with seasonal storage in Germany. Solar energy, 76(1): 165-174.
Segal, A. and Epstein, M., 2001. The optics of the solar tower reflector. Solar Energy, 69:
229-241.
Sieniutycz, S., 2009. Dynamic bounds for power and efficiency of non-ideal energy
converters under nonlinear transfer laws. Energy, 34(3): 334-340.
Sillman, S., 1981. Performance and economics of annual storage solar heating systems.
Solar Energy, 27(6): 513-528.
Simbolotti, G. and Kempener, R., 2012. Electricity storage: technology brief. IEA-
ETSAP and IRENA.

124
Simms, M. and Garven, G., 2004. Thermal convection in faulted extensional sedimentary
basins: theoretical results from finite‐element modeling. Geofluids, 4(2): 109-130.
Sonntag, R.E., Borgnakke, C., Van Wylen, G.J. and Van Wyk, S., 1998. Fundamentals of
thermodynamics. Wiley New York.
Spiteri, E.J. and Juanes, R., 2006. Impact of relative permeability hysteresis on the
numerical simulation of WAG injection. Journal of Petroleum Science and
Engineering, 50(2): 115-139.
Stone, T., Edmunds, N. and Kristoff, B., 1989. A comprehensive wellbore/reservoir
simulator, SPE Symposium on Reservoir Simulation.
Straughan, B. and Walker, D., 1996. Anisotropic porous penetrative convection.
Proceedings of the Royal Society of London. Series A: Mathematical, Physical
and Engineering Sciences, 452(1944): 97-115.
Taylor, M.A., 2007. The State of Geothermal Technology. Geothermal Energy
Association. Pennsylvania.
Tian, Y. and Zhao, C.Y., 2013. A review of solar collectors and thermal energy storage in
solar thermal applications. Applied Energy, 104: 538-553.
Trieb, F., 2009. Global potential of concentrating solar power, Conference Proceedings.
Vanhoudt, D., Desmedt, J., Van Bael, J., Robeyn, N. and Hoes, H., 2011. An aquifer
thermal storage system in a Belgian hospital: Long-term experimental evaluation
of energy and cost savings. Energy and Buildings, 43(12): 3657-3665.
Vasseur, P., Satish, M.G. and Robillard, L., 1987. Natural convection in a thin, inclined,
porous layer exposed to a constant heat flux. International Journal of Heat and
Mass Transfer, 30(3): 537-549.
Wigstrand, I., 2010. The ATES project–a sustainable solution for Stockholm-Arlanda
airport. renewable energy, 2010(30).
Wyman, C., Castle, J. and Kreith, F., 1980. A review of collector and energy storage
technology for intermediate temperature applications. Solar Energy, 24(6): 517-
540.
Yamamoto, H., 2008. PetraSim: A graphical user interface for the TOUGH2 family of
multiphase flow and transport codes. Ground Water, 46(4): 525-528.
Yogev, A., Kribus, A., Epstein, M. and Kogan, A., 1998. Solar ―tower reflector‖ systems:
a new approach for high-temperature solar plants. International journal of
hydrogen energy, 23(4): 239-245.

125
Yogi Goswami, D., 1998. Solar thermal power technology: present status and ideas for
the future. Energy Sources, 20(2): 137-145.
Related Documents