International Journal of Automotive Technology, Vol. 15, No. 2, pp. 191−201 (2014) DOI 10.1007/s12239−014−0021−y Copyright © 2014 KSAE/ 076-03 pISSN 1229-9138/ eISSN 1976-3832 191 DESIGN OF A COMPRESSOR-POWER-BASED EXHAUST MANIFOLD PRESSURE ESTIMATOR FOR DIESEL ENGINE AIR MANAGEMENT H. JIN, S. CHOI * and S. KIM Mechanical Engineering, KAIST, Daejeon 305-701, Korea (Received 26 October 2013; Revised 30 November 2013; Accepted 31 December 2013) ABSTRACT−In accordance with the development of hardware configurations in diesel engines, research on model-based control for these systems has been conducted for years. To control the air management system of a diesel engine, the exhaust manifold pressure should be selected as one of the control targets due to its internal dynamic stability and its physical importance in model-based control. However, it is difficult to measure exhaust pressure using sensors due to gas flow oscillation in the exhaust manifold in a reciprocated diesel engine. Moreover, the sensor is too costly to be equipped on production engines. Hence, the estimation strategies for exhaust manifold pressure have been regarded as a primary issue in diesel engine air management control. This paper proposes a new estimation method for determining the exhaust manifold pressure based on compressor power dynamics. With its simple and robust structure, this estimation leads to improved control performance compared with that of general observers. To compensate for the compressor efficiency error that varies with turbine speed, some correction maps are adopted in the compressor power equation. To verify the control system performance with the new estimator, a HiLS (hardware in the loop simulation) of the NRTC mode is performed. Experimental verification is also conducted using a test bench for the C1-08 mode. KEY WORDS : HP-EGR VGT diesel engine model, Exhaust manifold pressure observer, Compressor power, Model-based sliding mode control, HiLS (hardware in the loop simulation) NOMENCLATURE EGR : exhaust gas recirculation VGT : variable geometry turbocharger MAP : manifold absolute pressure sensor MAF : mass air flow sensor A EGR : egr valve effective area, [m 2 ] F i : air fraction in intake manifold, [-] F x : air fraction in exhaust manifold, [-] F e : air fraction in cylinder, [-] m i : intake manifold mass, [kg] m x : exhaust manifold mass, [kg] N e : engine speed, [rpm] N tc : turbocharger rotational speed, [rpm] p a : ambient pressure, [kpa] p i : intake manifold pressure, [kpa] P x : exhaust manifold pressure, [kpa] P c : compressor power, [kw] P t : turbine power, [kw] R a : specific gas constant, [kj/kg·k] C p : specific heat at constant pressure [kj/kg·k] T a : ambient temperature, [k] T i : intake manifold temperature, [k] T x : exhaust manifold temperature, [k] T e : engine out temperature, [k] T ci : intercooler outlet temperature, [k] τ tc turbine to compressor power transfer time constant (turbocharger time constant), [s] J t : turbine inertia, [kg·m 2 ] V i : volume of intake manifold, [m 3 ] V x : volume of exhaust manifold, [m 3 ] V d : total displacement volume, [m 3 ] W ie : mass flow rate from intake manifold to cylinder, [kg/s] W EGR : egr mass flow rate, [kg/s] W VGT : turbine mass flow rate, [kg/s] W ci : mass flow rate from compressor to intake manifold, [kg/s] W f : injected fuel mass flow into cylinder, [kg/s] η vol : volumetric efficiency, [-] λ 1 , λ 2 : model uncertainties bounded gains, [-] η c : compressor efficiency, [-] η t : turbine efficiency, [-] η m : turbocharger mechanical efficiency, [-] γ : specific heat ratio 1. INTRODUCTION Exhaust gas regulations are gradually improving to reduce NOx and Particulate Matter (PM) in diesel engines. Regarding USA environmental rules, the non-road diesel *Corresponding author. e-mail: [email protected]

Welcome message from author
This document is posted to help you gain knowledge. Please leave a comment to let me know what you think about it! Share it to your friends and learn new things together.
Transcript

International Journal of Automotive Technology, Vol. 15, No. 2, pp. 191−201 (2014)
DOI 10.1007/s12239−014−0021−y
Copyright © 2014 KSAE/ 076−03
pISSN 1229−9138/ eISSN 1976−3832
191
DESIGN OF A COMPRESSOR-POWER-BASED EXHAUST MANIFOLD
PRESSURE ESTIMATOR FOR DIESEL ENGINE AIR MANAGEMENT
H. JIN, S. CHOI*
and S. KIM
Mechanical Engineering, KAIST, Daejeon 305-701, Korea
(Received 26 October 2013; Revised 30 November 2013; Accepted 31 December 2013)
ABSTRACT−In accordance with the development of hardware configurations in diesel engines, research on model-based
control for these systems has been conducted for years. To control the air management system of a diesel engine, the exhaust
manifold pressure should be selected as one of the control targets due to its internal dynamic stability and its physical
importance in model-based control. However, it is difficult to measure exhaust pressure using sensors due to gas flow
oscillation in the exhaust manifold in a reciprocated diesel engine. Moreover, the sensor is too costly to be equipped on
production engines. Hence, the estimation strategies for exhaust manifold pressure have been regarded as a primary issue in
diesel engine air management control. This paper proposes a new estimation method for determining the exhaust manifold
pressure based on compressor power dynamics. With its simple and robust structure, this estimation leads to improved control
performance compared with that of general observers. To compensate for the compressor efficiency error that varies with
turbine speed, some correction maps are adopted in the compressor power equation. To verify the control system performance
with the new estimator, a HiLS (hardware in the loop simulation) of the NRTC mode is performed. Experimental verification
is also conducted using a test bench for the C1-08 mode.
KEY WORDS : HP-EGR VGT diesel engine model, Exhaust manifold pressure observer, Compressor power, Model-based
sliding mode control, HiLS (hardware in the loop simulation)
NOMENCLATURE
EGR : exhaust gas recirculation
VGT : variable geometry turbocharger
MAP : manifold absolute pressure sensor
MAF : mass air flow sensor
AEGR : egr valve effective area, [m2]
Fi : air fraction in intake manifold, [-]
Fx : air fraction in exhaust manifold, [-]
Fe : air fraction in cylinder, [-]
mi : intake manifold mass, [kg]
mx : exhaust manifold mass, [kg]
Ne : engine speed, [rpm]
Ntc : turbocharger rotational speed, [rpm]
pa : ambient pressure, [kpa]
pi : intake manifold pressure, [kpa]
Px : exhaust manifold pressure, [kpa]
Pc : compressor power, [kw]
Pt : turbine power, [kw]
Ra : specific gas constant, [kj/kg·k]
Cp : specific heat at constant pressure [kj/kg·k]
Ta : ambient temperature, [k]
Ti : intake manifold temperature, [k]
Tx : exhaust manifold temperature, [k]
Te : engine out temperature, [k]
Tci : intercooler outlet temperature, [k]
τtc turbine to compressor power transfer time constant
(turbocharger time constant), [s]
Jt : turbine inertia, [kg·m2]
Vi : volume of intake manifold, [m3]
Vx : volume of exhaust manifold, [m3]
Vd : total displacement volume, [m3]
Wie : mass flow rate from intake manifold to cylinder,
[kg/s]
WEGR : egr mass flow rate, [kg/s]
WVGT : turbine mass flow rate, [kg/s]
Wci : mass flow rate from compressor to intake manifold,
[kg/s]
Wf : injected fuel mass flow into cylinder, [kg/s]
ηvol : volumetric efficiency, [-]
λ1, λ2 : model uncertainties bounded gains, [-]
ηc : compressor efficiency, [-]
ηt : turbine efficiency, [-]
ηm : turbocharger mechanical efficiency, [-]
γ : specific heat ratio
1. INTRODUCTION
Exhaust gas regulations are gradually improving to reduce
NOx and Particulate Matter (PM) in diesel engines.
Regarding USA environmental rules, the non-road diesel*Corresponding author. e-mail: [email protected]

192 H. JIN, S. CHOI and S. KIM
engine is faced with regulations that began at Tier 1 in 1996
and will escalate to Tier 4 final in 2014 under the
Environmental Protection Agency (EPA). Tier 4 final
regulations suggest that NOx and PM be reduced by 96%
compared to Tier 1 levels, making it more difficult to
manage emission boundaries.
To counteract emissions regulations, precise diesel
engine control methods are required for the development of
engine configurations. General issues related to the control
and modeling of engines have been investigated in (Kao et
al., 1995; Moskwa and Hedrick, 1992; Zeng, 1999).
Furthermore, engineers and scientists can easily study the
engine system due to the development of software for
engine system simulations (Inman and Sara, 2002; Brian et
al., 2004). With respect to air management systems,
nonlinear properties, such as the coupling effect between
the exhaust gas recirculation (EGR) and the variable
geometry turbine (VGT), have been analyzed via a variety
of mathematical approaches to promote the development of
model-based control (Jung, 2003; Bengea et al., 2002;
Pfeifer et al., 2002; Ammann et al., 2003; Shamma and
Athans, 1991). For the single-loop EGR (HP EGR) and
VGT system, a 3rd-order reduced model has been designed
mathematically to represent the primary dynamic
properties of the actual system and has been validated in
many papers (Zheng, 1999; Jung, 2003; Kullkarni et al.,
1992).
Recently, such a model-based control concept has been
expanded to the latest engine configurations, including
dual-loop EGR systems (Gautier et al., 2009; Olivier and
Philippe, 2009; Park et al., 2010; Galindo et al., 2009).
Moreover, modern control skills, such as the adaptation
and state observer design, have been incorporated into the
control algorithm to enhance engine performance (Storset
et al., 2000; Stefanopoulou, 2004; Wang, 2008; Swartling,
2005). Regarding the control algorithm itself, the exhaust
manifold pressure estimation or measurement method is
one of the main issues for developing model-based control.
The exhaust pressure value must be known for control
because its value is the dominant influence not only for the
power dynamics of a turbocharger but also for the main
flow dynamics, such as the EGR and turbine flows.
Moreover, the exhaust manifold pressure must be one of
the control states to guarantee the stability of the internal
dynamics in model-based control (Upadhyay, 2001).
However, the exhaust pressure is difficult to measure due
to unfavorable conditions, such as the high pressure,
temperature and pulsation of the engine combustion
(Fredriksson and Egardt, 2002; Lee, 2012; Castillo, 2013).
The price of sensors is sufficiently expensive to render
them unsuitable for production engines.
In estimation methods of the exhaust pressure, observer
algorithms have been suggested (Fredriksson and Egardt,
2002; Lee, 2012). However, upon analysis of the observer
form, there are some structural problems that make the
performance of the observers vulnerable to model
uncertainties. For example, the model of a diesel air
management system uses inverse models of the orifice
equation (describing the behavior of the flows controlled
by valves or throttles, such as EGR and VGT flows), which
converts the commands of the flows into the corresponding
valve positions. Uncertainties in the inverse model cause
abnormal observer behavior. As a result, these uncertainties
ruin the control performance, which will be discussed in
detail below. To solve the chronic problems related to the
observer, this paper proposes a new exhaust pressure
estimation method that models uncertainties and is simple
and robust. This estimation method uses information about
the compressor power dynamics rather than other pressures
or flow dynamics, in contrast to exisiting approaches.In the
design process, the exhaust pressure is treated as a time-
varying parameter, not a state parameter, which results in
simple calculations. Most importantly, complicated analysis
of the global observer criterion in nonlinear observer-based
controllers is no longer needed.
Additionally, partial modified turbine and compressor
maps are considered to compensate for the modeling errors
associated with the efficiency values. With regard to the
compressor map, further corrective work is also completed
to provide a more accurate estimation.
The model-based controller is a sliding-mode controller,
which is a representative robust controller in a nonlinear
system. The process of control design, based on the 3rd
order engine model, is based on a previous paper
(Upadhyay, 2001).
To validate the control performance of the exhaust
pressure estimator, both a HiLS (hardware in the loop
simulation) and test bench experiments are performed. The
HiLS system is composed of a valid engine model and
Rapid Control Prototyping (RCP) equipment. Real ECU is
connected to LABCAR and RCP by a Controller Area
Network (CAN). The test mode is a Nonroad Transient
Cycle (NRTC) that is used for verification of the system in
transient states. Additionally, experimental verifications are
conducted for the C1-08 mode using the test bench. The
experimental results show that by using the new estimator,
the control performance and robustness of the system are
highly enhanced. This paper is organized as follows. In
section two, the main model equations of the diesel engine
air management system, which is used as a plant model in
the HiLS, are introduced. In section three, the design
process of the model-based-sliding-mode control, with the
compressor flow and the exhaust pressure as the output, is
described. In section four, the new exhaust pressure
estimator, based on the compressor power and efficiency
map design, is introduced.
Overall control performance results and analysis are
shown in section five. Finally, we provide a discussion of

DESIGN OF A COMPRESSOR-POWER-BASED EXHAUST MANIFOLD PRESSURE ESTIMATOR FOR DIESEL 193
the results and conclusions in section six.
2. MEAN VALUE DIESEL ENGINE MODELING
The engine model is implemented based on a heavy-duty
6000cc diesel engine equipped with an HP EGR and VGT
system. Considering the thermodynamic properties of
adiabatic air flow, the mean value model of the air
management system is implemented and validated via test
bench experiments. Additionally, a filling and emptying
method in which all sub-systems of the engine are
represented as a series of control volumes is utilized. The
model diagram of the air management system is presented
in Figure 1. The system is composed of six mechanical
parts: an intake manifold, cylinders, an exhaust manifold,
an EGR valve, a compressor, and a turbine.
The mathematical model of the engine configured in
Figure 1 is described in equations (1) − (7). The mass flow
conservation law is used to derive the flow dynamics
represented in equations (1) and (2) (Kao et al., 1995).
(1)
(2)
In equations (3) and (4), the gas fraction dynamics are
derived from the oxygen concentration of the control
volumes and the mass conservation condition (Kao et al.,
1995; Moskwa and Hedrick, 1992).
(3)
(4)
Intake and exhaust manifold dynamics are described by
equations (5) and (6) based on the ideal gas law with gas
mass flow (Kao et al., 1995; Moskwa and Hedrick, 1992).
(5)
(6)
The compressor power dynamics are expressed as in
equation (7) using the turbine power and total system
efficiency (Upadhyay, 2001).
(7)
Where
Pt is the power delivered by the turbine, and Pc is the
power generated by the compressor.
These modeling methods have been described in more
detail (Kao et al.,1995; Moskwa and Hedrick, 1992; Zeng,
1999; Upadhyay, 2001).
2.1. HiLS System Description
To verify the model and the controller, a HiLS system is
implemented. The overall control and verification system
is shown in Figure 2. The diesel engine air management
system, implemented in Matlab/Simulink, is tuned using
real experiments and WAVE simulation. This model is
embedded on an RTPC and connected to an ECU via a
dmi
dt-------- Wci WEGR Wie–+=
dmx
dt--------- Wie Wf WEGR WVGT––+=
F·i
WEGR Fx Fi–( ) FiWci–
mi
-----------------------------------------------=
F·x
Wie Fe Fx–( ) Wie Wf+( ) Fi Fx–( )–
mx
-------------------------------------------------------------------------=
p· iγRVi
------ TciWci TxWEGR TieWie–+( )=
p·xγRVx
------ Te Wie Wf+( ) Tx WEGR WVGT+( )–( )=
dPc
dt--------
1
τtc----- Pc– ηmPt+( )=
Pt ηmηtCpTx 1pa
px
----⎝ ⎠⎛ ⎞
µ
–⎝ ⎠⎛ ⎞WVGT≈
Figure 1. Diesel engine model and test bench description.
Figure 2. HiLS system diagram.
Figure 3. Engine RPM (upper) and torque (lower)
trajectories of the NRTC mode.

194 H. JIN, S. CHOI and S. KIM
CAN bus system. The other sub-models of the diesel
engine, except for the air management system, such as the
fuel injection and valve timing, are implemented in
LABCAR. Calibration of the measurement data is
conducted by the INCA tool. For controller verification,
AUTOBOX is also connected to the RTPC via the CAN
bus system.
Total system verification is conducted for the NRTC
mode, which is a representative transient driving cycle for
mobile non-road diesel engines. The total driving time is
approximately 1200 seconds. As shown in Figure 3, the
engine RPM and load are independently varied during the
entire engine operation. Because of these properties, the
NRTC mode is widely known for its function verifying the
control performance in transient situations.
2.2. Test Mode Description
To verify the system experimentally with a test bench
under steady state conditions, the C1-08 test mode, with
fixed RPM and load operating points, is adopted. In the test
bench, the intake pressure, compressor flow, RPM and fuel
flow data are received from the CAN signals, which are
connected to the engine cell ECU and sensors. Controllers
are imbedded in AUTOBOX, which is connected to the
CAN bus system. The C1-08 mode is depicted in Figure 4.
The rated torque and RPM are set at 1400 and 1800 RPM,
respectively. Each steady state mode is maintained for 20
seconds. Mode transition was conducted with a linear
shape. Each steady mode has a transition time of 5 seconds.
The RPM transition between modes 7 and 8 is activated for
30 seconds.
3. MULTIVARIABLE SLIDING MODE
CONTROLLER
The control-oriented model of this paper is the well-known
3rd order model for the air management system of a diesel
engine equipped with a VGT and HP-EGR system. The 3rd
order model is as follows.
(8)
(9)
(10)
Where .
This model comprises three dynamics: the intake,
exhaust manifold pressure and compressor power
dynamics. The 3rd order model is obtained from the full
order models (1) ~ (7) with the following assumptions.
- Air fraction states, which are difficult to measure and are
not directly coupled with other dynamic equations, are
ignored.
- Residual gas mass states, which are difficult to measure
and to control independently of the intake and exhaust
manifold, are ignored.
- Temperature is invariant at the same operating points.
Based on the 3rd order model, a sliding mode controller is
designed using the multivariable input-output linearization
method (Upadhyay, 2001). Upon analysis of a variety of
output sets, the compressor flow and exhaust pressure
states are chosen as the control states because they are
appropriate for state error regulation problems. Other
output cases of controllers and their internal dynamics
stabilities are analyzed in (Upadhyay, 2001). The present
paper focuses on exhaust pressure estimation methods.
Hence, we will briefly describe the controller design
process in the next section.
3.1. Control Design with the Compressor Flow and the
Exhaust Manifold Pressure as the Output Set
In the control with this output set, it is shown that the
internal dynamics are stable, and the resulting EGR flow
can satisfy emissions regulations. The siding surfaces are
designed as follows:
(11)
(12)
Differentiating S1 and S2
(13)
p· i ki
ηc
CpTa
-----------Pc
pi
pa
----⎩ ⎭⎨ ⎬⎧ ⎫
µ
1–⎝ ⎠⎜ ⎟⎛ ⎞------------------------- WEGR kepi–+
⎝ ⎠⎜ ⎟⎜ ⎟⎜ ⎟⎜ ⎟⎜ ⎟⎛ ⎞
=
p·x k2 kepi Wf WEGR WVGT––+( )=
P·c
1
τ--- Pc ηmηtCpTx 1
pa
px
----⎝ ⎠⎛ ⎞
µ
–⎝ ⎠⎛ ⎞WVGT+–⎝ ⎠
⎛ ⎞=
k1
RTi
Vi
-------- ke
ηeNVd
120RTi
----------------- k2
RTi
Vx
--------=,=,=
S1 px pxd
–=
S2 Wci Wcid
–=
Figure 4. C1-08 mode (upper), trajectories of the engine
RPM (middle left) and the fuel flow (middle right), and
mode procedure (lower).
DESIGN OF A COMPRESSOR-POWER-BASED EXHAUST MANIFOLD PRESSURE ESTIMATOR FOR DIESEL 195
(14)
where
u1 = WEGR
u2 = WVGT
In equation (13), k2_model is the known modeled portion of
k2, and ∆k2 is the unknown portion with values bounded by
δ1, as described in (15).
(15)
In the same manner, αmodel and βmodel are the known
modeled parts of α and β, and ∆α and ∆β are the unknown
parts with bounded values as follows:
(16)
(17)
The control laws u1 and u2 that satisfy the and
conditions are designed as follows:
(18)
(19)
The positive constants are chosen such that
(20)
(21)
where c1 and c2 are positive constant stability margins. φ1
and φ2 are the error bounds of the first and second surfaces,
respectively. The and terms are omitted because
they do not critically affect the system characteristics.
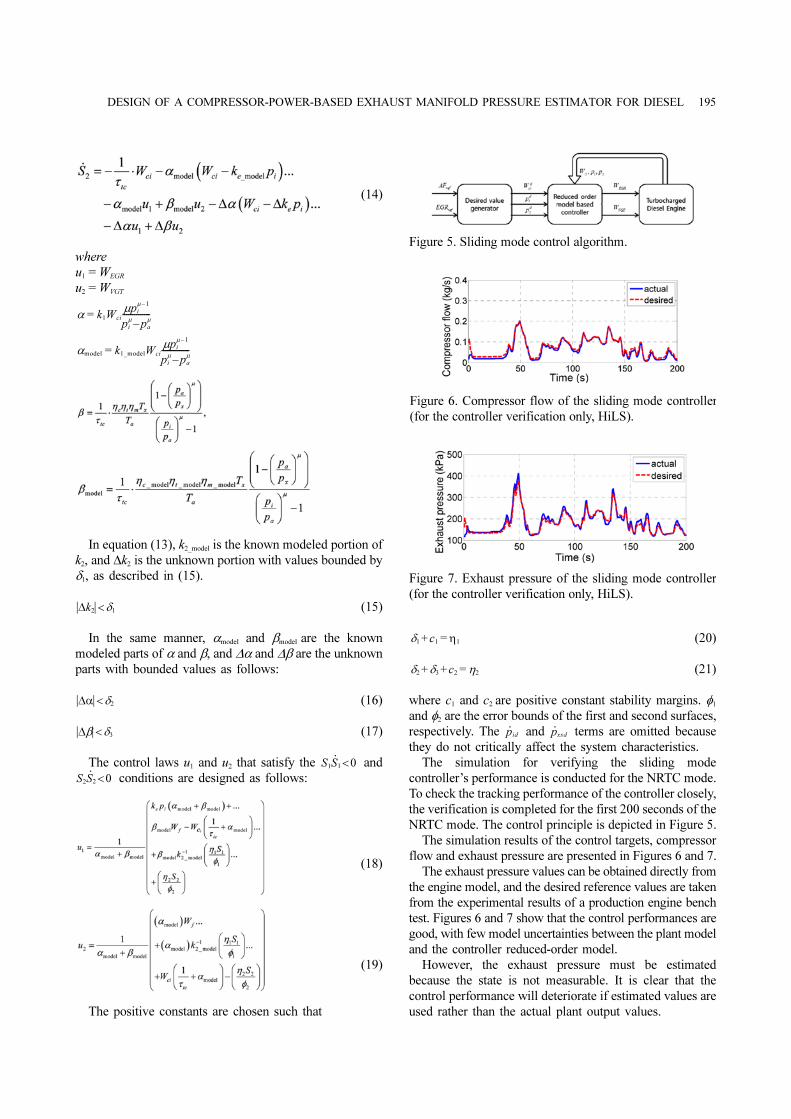
The simulation for verifying the sliding mode
controller’s performance is conducted for the NRTC mode.
To check the tracking performance of the controller closely,
the verification is completed for the first 200 seconds of the
NRTC mode. The control principle is depicted in Figure 5.
The simulation results of the control targets, compressor
flow and exhaust pressure are presented in Figures 6 and 7.
The exhaust pressure values can be obtained directly from
the engine model, and the desired reference values are taken
from the experimental results of a production engine bench
test. Figures 6 and 7 show that the control performances are
good, with few model uncertainties between the plant model
and the controller reduced-order model.
However, the exhaust pressure must be estimated
because the state is not measurable. It is clear that the
control performance will deteriorate if estimated values are
used rather than the actual plant output values.
α k1Wci
µpiµ 1–
piµ
paµ
–--------------=
αmodel k1_modelWci
µpiµ 1–
piµ
paµ
–--------------=
k2∆ δ1<
α∆ δ2<
β∆ δ3<
S1S·1 0<
S2S·2 0<
δ1 c1 η1=+
δ2 δ3 c2 η2=+ +
p· id p·xsd
Figure 5. Sliding mode control algorithm.
Figure 6. Compressor flow of the sliding mode controller
(for the controller verification only, HiLS).
Figure 7. Exhaust pressure of the sliding mode controller
(for the controller verification only, HiLS).
196 H. JIN, S. CHOI and S. KIM
4. EXHAUST PRESSURE ESTIMATION
4.1. Conventional Exhaust Pressure Observer
Observer gains are generally designed in consideration of
the sensor bandwidth. Moreover, the engine characteristics
responding to the controller gains must be analyzed. The 3rd
order model-based observer is generally developed as
follows:
(22)
(23)
(24)
This observer form is based on the Luenberger observer.
Each estimated state has the observer gain, Li, with an
estimation error term. The estimated intake pressure (22) is
computed from MAP sensor data, pi. The compressor
power can be calculated with high precision from the
compressor flow, Wci, which is measured using a MAF
sensor. When the observability of this system is determined
using the Lie derivative of (22) ~ (24), the rank is found to
be three. This result indicates that the system is locally
observable. However, it is not easy to tune the observer
gains, L2 and L3, if the actual exhaust pressure value is
unknown. Moreover, the observer system has critical
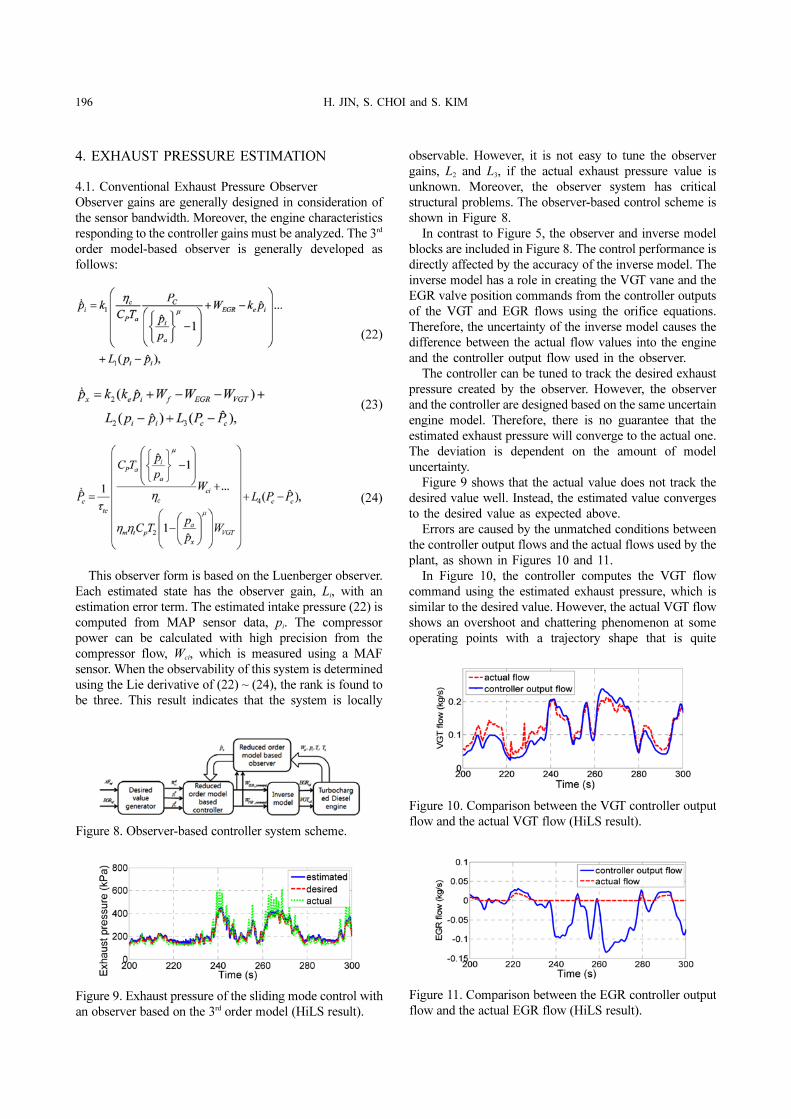
structural problems. The observer-based control scheme is
shown in Figure 8.
In contrast to Figure 5, the observer and inverse model
blocks are included in Figure 8. The control performance is
directly affected by the accuracy of the inverse model. The
inverse model has a role in creating the VGT vane and the
EGR valve position commands from the controller outputs
of the VGT and EGR flows using the orifice equations.
Therefore, the uncertainty of the inverse model causes the
difference between the actual flow values into the engine
and the controller output flow used in the observer.
The controller can be tuned to track the desired exhaust
pressure created by the observer. However, the observer
and the controller are designed based on the same uncertain
engine model. Therefore, there is no guarantee that the
estimated exhaust pressure will converge to the actual one.
The deviation is dependent on the amount of model
uncertainty.
Figure 9 shows that the actual value does not track the
desired value well. Instead, the estimated value converges
to the desired value as expected above.
Errors are caused by the unmatched conditions between
the controller output flows and the actual flows used by the
plant, as shown in Figures 10 and 11.
In Figure 10, the controller computes the VGT flow
command using the estimated exhaust pressure, which is
similar to the desired value. However, the actual VGT flow
shows an overshoot and chattering phenomenon at some
operating points with a trajectory shape that is quite
Figure 8. Observer-based controller system scheme.
Figure 9. Exhaust pressure of the sliding mode control with
an observer based on the 3rd order model (HiLS result).
Figure 10. Comparison between the VGT controller output
flow and the actual VGT flow (HiLS result).
Figure 11. Comparison between the EGR controller output
flow and the actual EGR flow (HiLS result).

DESIGN OF A COMPRESSOR-POWER-BASED EXHAUST MANIFOLD PRESSURE ESTIMATOR FOR DIESEL 197
different from the VGT flow provided by the controller. As
shown in Figure 11, due to the inaccurate exhaust pressure
values from the observer, the EGR controller output flows
have negative values, indicating that the flow is in the
reverse direction. However, the actual EGR flow does not
exist because the EGR valve is fully closed. These
differences between the controller output and actual plant
flows disturb the system balance and eventually destroy the
control performance.
4.2. Compressor Power Based Exhaust Pressure Estimation
4.2.1. Estimator design
To solve the structural problem and to enhance the
robustness of our approach, a compressor power-based
exhaust pressure estimation method is proposed. In this
estimation method, the exhaust pressure is regarded as a
time-varying parameter rather than the control state. Using
the compressor power dynamics with the turbine power
equation (7), the exhaust pressure can be derived as (25).
(25)
where
As noted above, the estimated value is at risk of
chattering due to the unexpected VGT controller output
flow present in some operating points. To avoid the
chattering phenomenon, the VGT flow value is replaced by
the sum of the compressor flow and the fuel flow,
( ), which can be measured by the MAF
sensor and the fuel flow signal of the ECU, respectively.
The turbine and compressor efficiency can be regarded
simply as constant values or calculated from the turbine
map data to improve the accuracy.
4.2.2. Turbine efficiency map design
Assuming the turbine efficiency is a constant value does
not affect the system stability or robustness; however, it
gives rise to estimation errors because the estimator is
based on the turbocharger power dynamics. Hence, the
efficiency values must be tuned properly, or correction
factors are added to the calculation process of (25).
The turbine efficiency is simply updated as a function of
the turbine pressure ratio and the VGT vane position. There
are several reasons for creating a simple turbine efficiency
map without considering the turbine speed (Gamma
Technologies GT-SUITE, 2008).
The first reason is that it is not possible to measure actual
efficiency values directly, and it is clear that for the ranges
of data on the map, extrapolation does not provide
reasonable values. The second reason is that the turbine
data for extremely high or low pressure ratios are not
appropriate for a fitting algorithm. The third reason is that
the speed line is generally noisy with more than one local
maximum efficiency. Thus, measurement of the turbine
speed is not practical.
Therefore, turbine efficiency maps using the vane
position and the pressure ratio as the input values can be
designed, as shown in Figure 12. Except the vane position
of 0.1, the majority of the efficiency values are near
60~70%, and the variations of the turbine efficiency values
are influenced more by the vane position than by the
pressure ratio. Using these map data, the optimal operating
points can be easily derived. Moreover, the modifications
made to the turbine efficiency play an important role in
turbine speed correction when estimating turbine speeds
(using the turbocharger power dynamics in the next
section).
4.2.3. Compressor efficiency map design
The compressor efficiency value can be determined using
the manufacturer’s map data. In the design process,
analysis of the surge and choke lines must be completed
first. The surge line defines the limits of the compressor to
compress air at a given speed and compressor ratio.
Therefore, when the values of the pressure ratio or the
turbine speed are located to the left of the surge line,
unstable compressor flow will occur; this instability must
be avoided in a turbocharger system. Another undesired
operating line is the choke line. Choking of the compressor
occurs when the compressor is operating at a low pressure
WVGT Wci Wfuel+≈
Figure 12. Simplified turbine efficiency map.
Figure 13. General compressor efficiency map.
198 H. JIN, S. CHOI and S. KIM
ratio and a very high compressor flow. This leads to a
significant increase in the flow velocity of the compressor,
which can even reach a sonic velocity.
The compressor efficiency can also be obtained from the
efficiency map, as shown in Figure 13. Using the surge and
choke lines, each compressor efficiency with the same
turbine speed has a convex form.
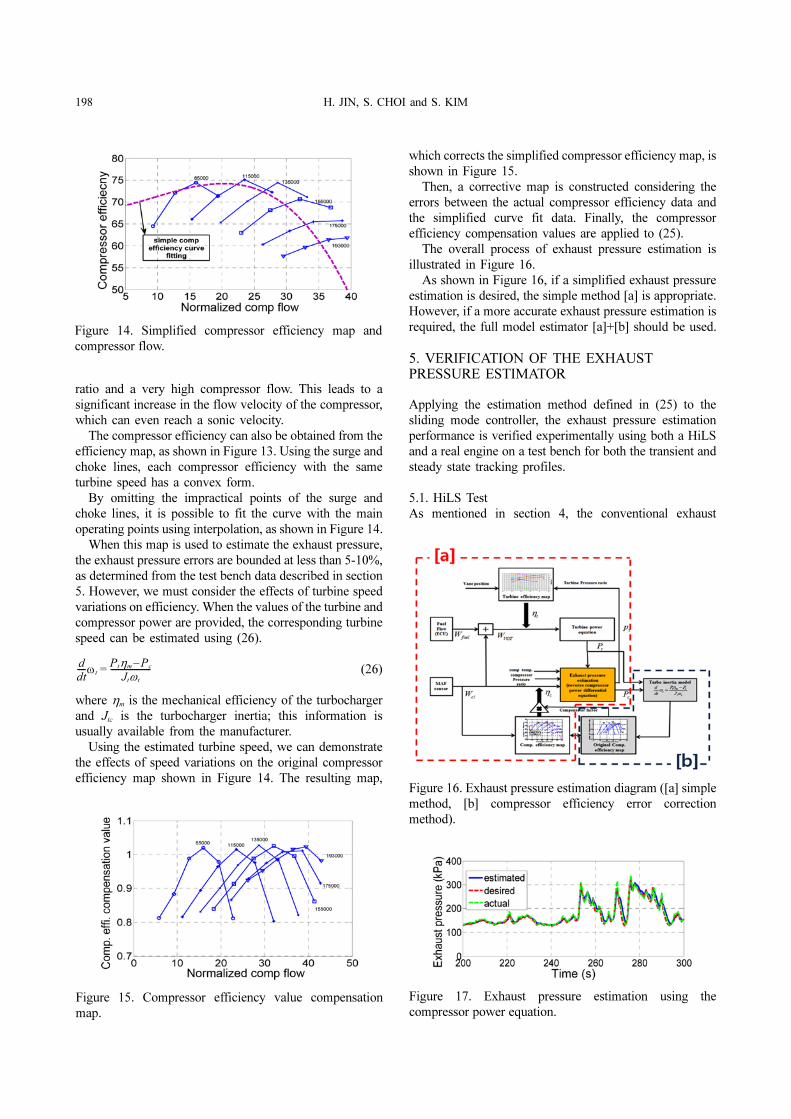
By omitting the impractical points of the surge and
choke lines, it is possible to fit the curve with the main
operating points using interpolation, as shown in Figure 14.
When this map is used to estimate the exhaust pressure,
the exhaust pressure errors are bounded at less than 5-10%,
as determined from the test bench data described in section
5. However, we must consider the effects of turbine speed
variations on efficiency. When the values of the turbine and
compressor power are provided, the corresponding turbine
speed can be estimated using (26).
(26)
where ηm is the mechanical efficiency of the turbocharger
and Jtc is the turbocharger inertia; this information is
usually available from the manufacturer.
Using the estimated turbine speed, we can demonstrate
the effects of speed variations on the original compressor
efficiency map shown in Figure 14. The resulting map,
which corrects the simplified compressor efficiency map, is
shown in Figure 15.
Then, a corrective map is constructed considering the
errors between the actual compressor efficiency data and
the simplified curve fit data. Finally, the compressor
efficiency compensation values are applied to (25).
The overall process of exhaust pressure estimation is
illustrated in Figure 16.
As shown in Figure 16, if a simplified exhaust pressure
estimation is desired, the simple method [a] is appropriate.
However, if a more accurate exhaust pressure estimation is
required, the full model estimator [a]+[b] should be used.
5. VERIFICATION OF THE EXHAUST
PRESSURE ESTIMATOR
Applying the estimation method defined in (25) to the
sliding mode controller, the exhaust pressure estimation
performance is verified experimentally using both a HiLS
and a real engine on a test bench for both the transient and
steady state tracking profiles.
5.1. HiLS Test
As mentioned in section 4, the conventional exhaust
d
dt----ω t
Ptηm Pc–
Jtω t
--------------------=
Figure 14. Simplified compressor efficiency map and
compressor flow.
Figure 15. Compressor efficiency value compensation
map.
Figure 16. Exhaust pressure estimation diagram ([a] simple
method, [b] compressor efficiency error correction
method).
Figure 17. Exhaust pressure estimation using the
compressor power equation.

DESIGN OF A COMPRESSOR-POWER-BASED EXHAUST MANIFOLD PRESSURE ESTIMATOR FOR DIESEL 199
pressure observer causes chattering in the actual exhaust
pressure value due to the errors between the controller and
actual plant flows. To demonstrate the performance
improvement, the HiLS test of the controller with the new
compressor power-based estimator is performed, as shown
in Figures 17 ~ 19.
In Figure 17, the estimated exhaust pressure based on the
compressor power tracks the actual exhaust pressure, not
the desired value. Compared to Figure 9, Figure 17 shows a
significant tracking performance improvement. In Figure
18, the trajectory of the command VGT flows is nearly
identical to that of the actual values. In Figure 19, the two
EGR flows have nearly the same shapes, with errors in an
acceptable range. These results are from enhancement of
the overall control system performance. The expected
behavior of the VGT and EGR flows ensures acceptable
mass flow balances in the exhaust manifold.
To verify the performance of the exhaust pressure
estimation under steady state conditions, a test bench
experiment is performed using a real engine. The effects of
efficiency errors on the estimation results can be seen
clearly under steady state conditions. Hence, we must
experiment with the conditions to verify the effectiveness
of the efficiency corrective maps.
5.2. Test Bench Experiments
The actual exhaust pressure value is measured using a
sensor in the engine test bench.
The control results that use the new exhaust pressure
estimator, but without the compressor efficiency correction
factors, are shown in Figure 20.
In Figure 20, the estimated exhaust pressure follows the
actual values without the chattering phenomenon, and the
actual values also track the desired values. However, there
are some steady state errors at 1800 RPM and the 100%
load condition. These are also apparent at 1400 RPM and
the 75% load condition. We assume that these steady state
errors stem from the efficiency errors. Therefore, the
proposed efficiency maps are used for the estimation
algorithm instead of the simplified maps. The bench test
results using the maps are shown in Figures 21 ~ 23.
Figure 21 shows that the control and estimation
performances are enhanced significantly compared to the
previous results. The improvement of the estimation
Figure 18. Comparison between the VGT controller output
flow and the VGT actual flow (using the compressor
power-based exhaust pressure estimation).
Figure 19. Comparison between the EGR controller output
flow and the EGR actual flow (using the compressor
power-based exhaust pressure estimation).
Figure 20. Compressor power-based exhaust pressure
estimation without correction factors.
Figure 21. Compressor power-based exhaust pressure
estimation with correction factors.
Figure 22. Comparison of the VGT controller output flow
and the VGT actual flow (using the correction factors).

200 H. JIN, S. CHOI and S. KIM
performance can be explained by the results of the VGT
and EGR flows shown in Figures 22 ~ 23.
These results show that both the VGT and EGR flows
follow the controller output flows reasonably well. At
operating points between 280 and 450 seconds, there are
some steady state errors caused by model uncertainties,
such as compressor and turbine efficiency, which are
assumed to be constant values. However, these flow errors
do not affect the exhaust pressure estimator substantially,
which indicates that the exhaust pressure estimator is
robust to the model uncertainties.
Figure 23 shows that 5~20% of the EGR rates are
maintained for the overall operating points. Considering
that the flow is relatively small, it can be assumed that the
errors in Figure 23 are acceptable for EGR rate evaluation,
thus indicating that accurate estimation of the exhaust
pressure enables the engine output torque to track the
driver’s intention at a high bandwidth, and emissions
regulations are met due to proper EGR control.
6. CONCLUSION
This paper investigates an exhaust pressure estimation
method for a VGT- and HP-EGR-based diesel engine.
Using the compressor power equation, the exhaust
pressure can be estimated with high precision while
maintaining robustness. For the conventional observers
that are based on a 3rd order model, the estimation accuracy
is poor, particularly for transient conditions, due to the
model uncertainties, including flow errors. In contrast, the
compressor power-based exhaust pressure estimation
method is very robust and uses only reliable values
acquired from actual sensors, such as the compressor and
fuel flows. As expected, this method shows remarkable
improvement in estimation accuracy.
Additionally, corrective efficiency maps, which are
simplified to be independent of the turbine speeds, are
incorporated into the system to compensate for the turbine
and compressor dynamics efficiency errors.
In real applications, the compressor power dynamics are
rarely used because it is difficult to calculate the compressor
power values accurately. The power values are determined
from the time-varying values of turbocharger efficiency.
These values may need to include turbine speed data.
Hence, an additional corrective map of the compressor
efficiency, which includes information about the turbine
speed variations, is created. For the corrective map, the
turbine speed is estimated from the 1st order lagged model
of turbocharger power dynamics.
In conclusion, the exhaust pressure can be estimated
with high accuracy and robustness. Therefore, the engine
control system using the proposed estimation method can
satisfy both control performance specifications and
environmental regulation requirements.
ACKNOWLEDGEMENT–This research was supported by the
MKE (The Ministry of Knowledge Economy), Korea, under the
CITRC (Convergence Information Technology Research Center)
support program (NIPA-2013-H0401-13-1009), which is
supervised by the NIPA (National IT Industry Promotion Agency).
REFERENCES
Ammann, M. and Fekete, N. P., Guzzella, L. and
Glattfelder, A. H. (2003). Model based control of the
VGT and EGR in a turbocharged common-rail diesel
engines: Theory and passenger car implementation. SAE
Paper No. 2003-01-0357.
Bengea, S., DeCarlo, R., Corless, M. and Giorgio, R.
(2002). A Polytopic System Approach for the Hybrid
Control of a Diesel Engine using VGT/EGR. Technical
Report. Purdue University.
Brian, D. F. (2004). Diesel Engine Modeling in WAVE.
Pennsylvania State University. The Graduate School.
College of Engineering.
Castillo, F. (2013). Exhaust manifold estimation diesel
equipped with a VGT turbocharger. SAE Paper No.
2013-01-1752.
Fredriksson, J. and Egardt, B. (2002). Estimating exhaust
manifold pressure in a turbocharged diesel engine. Proc.
2002 IEEE Int. Conf. Control Applications, 2, 701−706.
Galindo, J., Climent, H., Guardiola, C. and Domenech, J.
(2009). Strategies for improving the mode transition in a
sequential parallel turbocharged automotive diesel
engine. Int. J. Automotive Technology 10, 2, 141−149.
Gautier, P., Albrecht, A. and Chasse, A. (2009). A
simulation study of the impact of LP EGR on a two-
stage turbocharged diesel engine. Oil & Gas Science and
Technology 64 , 3, 361−379.
GT-SUITE (2008). Flow Theory Manual. Chapter3:
Turbines, Compressors and Boosting. Version7.2.
Gamma Technologies.
Inman, S., Haworth, D. and El-Gindy, M. (2002). Integration
of WAVE and Advisor Simulations for Optimization of a
Hybrid Electric Sport Utility Vehicle. Pennsylvania State
University. The Graduate School. College of Engineering.
Jung, M. (2003). Mean-value Modeling and Robust
Control of the Airpath of a Turbocharged Diesel Engine.
Ph.D. Dissertation. Cambridge University. Cambridge.
Figure 23. Comparison of the EGR controller output flow
and the EGR actual flow (using the correction factors).

DESIGN OF A COMPRESSOR-POWER-BASED EXHAUST MANIFOLD PRESSURE ESTIMATOR FOR DIESEL 201
U.K.
Kao, Minghui and Moskwa, J. J. (1995). Turbocharged
diesel engine modeling for nonlinear engine control and
state estimation. Trans. ASME J. Dynamics Systems,
Measurements and Control, 117, 1−11.
Kulkarni, M. M., Sinha, R. P. and Dhaliwal, H. C. (1992).
Reduced order model of turbocharged diesel engine.
Proc. 1992 American Control Conf., 2, 927−931.
Lee, J. (2012). Sliding mode observer for exhaust pressure
estimation in light-duty diesel engines equipped with
VGT and EGR system. KSAE 2012 Annual Conf. and
Exhibition Proc., 31−36.
Moskwa, J. J. and Hedrick, J. K. (1992). Modeling and
validation of automotive engines for control algorithm
development. Trans. ASME J. Dynamic Systems,
Measurements and Control, 114, 228−285.
Olivier, G. and Philippe, M. (2009). Control of a
turbocharged diesel engine fitted with high pressure and
low pressure exhaust gas recirculation systems. Joint
48th IEEE Conf. Decision and Control and 28th Chinese
Control Conf., 6582−6589.
Park, J., Lee, K. S., Song, S. and Chun, K. M. (2010).
Numerical study of a light-duty diesel engine with a
dual-loop EGR system under frequent engine operating
conditions using the DOE method. Int. J. Automotive
Technology 11, 5, 617−623.
Pfeifer, A., Smeets, M., Herrmann, H.-O., Tomazic, D. R.,
Felix, R. and Schlober, A. (2002). A new approach to
boost pressure and EGR rate control development for
HD truck engines with VGT. SAE Paper No. 2002-01-
0964.
Shamma, J. S. and Athans, M. (1991). Guaranteed
properties of gain scheduled control for linear
parameter-varying plants. Automatica 27, 3, 559−564.
Stefanopoulou, A. (2004). Pressure and temperature-based
adaptive observer of air charge for turbocharged diesel
engines. Int. J. Robust and Nonlinear Control 14, 6,
543− 560.
Storset, O. F. and Stefanopoulou, A. and Smith, R. (2000).
Air charge estimation for turbocharged diesel engines.
Proc. American Control Conf., 1, 39−44.
Swartling, F. (2005). Gas Flow Observer for Diesel Engine
with EGR. M.S. Thesis. Vehicular Systems, Dept.
Electrical Engineering at Linkõpings Universitet.
Upadhyay, D. (2001). Modeling and Model Based Control
Design of the VGT-EGR System for Intake Flow
Regulation in Diesel Engines. Ph.D. Dissertation. The
Ohio University.
Wang, J. (2008). Air fraction estimation for multiple
combustion mode diesel engines with dual-loop EGR
systems. Control Engineering Practice, 16, 1479−1486.
Zheng, Q. (1999). Modeling and Control Issues with
Neutral Idle Shift in Transmissions. Ph.D. Dissertation.
The Ohio-State Univerisity.
Related Documents