DESIGN, FABRICATION AND EVALUATION OF A BENISEED (Sesamum indicum L.) OIL EXPELLER BY Tajudeen Muraina Adeniyi OLÁYANJÚ B. Sc., M.Sc. Agric. Engineering (Ibadan) M.N.S.A.E., M.N.S.E., M.N.I.F.S.T., R.Engr. (COREN) A Thesis in the Department of AGRICULTURAL ENGINEERING Submitted to the Faculty of Technology, in Partial Fulfilment of the Requirements for the Degree of DOCTOR OF PHILOSOPHY of the UNIVERSITY OF IBADAN February, 2002

Welcome message from author
This document is posted to help you gain knowledge. Please leave a comment to let me know what you think about it! Share it to your friends and learn new things together.
Transcript

DESIGN, FABRICATION AND EVALUATION OF A
BENISEED (Sesamum indicum L.) OIL EXPELLER
BY
Tajudeen Muraina Adeniyi OLÁYANJÚ
B. Sc., M.Sc. Agric. Engineering (Ibadan)
M.N.S.A.E., M.N.S.E., M.N.I.F.S.T., R.Engr. (COREN)
A Thesis in the Department of
AGRICULTURAL ENGINEERING
Submitted to the Faculty of Technology, in Partial Fulfilment
of the Requirements for the Degree of
DOCTOR OF PHILOSOPHY
of the
UNIVERSITY OF IBADAN
February, 2002

2
ABSRACT
Some physical and mechanical properties of two Nigerian beniseed accessions
(Yandev-55 and E8) were determined at 5 moisture content levels of 5.3, 10.6, 16.1, 22.4, and
28.3 per cent (wet basis). These were used as inputs into designing a beniseed oil expeller, as
available ones could not perform effectively with the seed.
The determined physical properties were linear dimensions, size, sphericity, bulk and
true densities, porosity, thousand kernel weight and coefficient of friction between the seed
and different structural surfaces while the determined mechanical properties were the
required force, sustained deformation and energy needed to rupture and express oil from the
seed.
The linear dimensions in terms of major, intermediate and minor diameters were
found to be 2.80, 1.83 and 0.66mm for Yandev-55; 3.30, 2.13 and 0.75mm for E8
respectively. The corresponding geometric mean sizes were 1.49 and 1.73mm for the two
accessions at 5.3% moisture content levels. These parameters were found to increase with
increase in moisture content. The sphericity values for the two accessions were determined to
be in the range 0.52 to 0.55 (0.03). It was found that moisture content had no significant effect
on sphericity.
The bulk and true densities decreased from 688 to 613kg/m3 and 1042 to 981kg/m3
for Yandev-55; 674 to 528kg/m3 and 1050 to 988kg/m3 for E8 respectively with increase in
moisture content from 5.3 to 28.3% wb. The porosity and thousand kernel weight increased
with the increase in moisture content from 5.3 to 28.3% and are within the range of 34.52 to
46.56% and 2.63 to 3.50g respectively. The static coefficients of friction between beniseed

3
and four structural surfaces show that glass has the least value of 0.32, while for mild steel,
plywood and concrete, frictional coefficients with beniseed were between 0.39 to 0.59 within
the 5.3 and 22.4% moisture content levels.
The applied force, resulting deformation and required energy ranged from 7.73 to
29.40N, 0.17 to 0.54mm and 0.0013 to 0.0100J for whole and dehulled seeds respectively
within 4.1 and 7.7% moisture content (wet basis).
A portable expeller for beniseed oil expression was designed and fabricated, based on
the results of the determined properties. The expression chamber has a barrel of 60mm
diameter and a special wormshaft of length 600mm rotating at a speed of 45rpm through a 1-
hp electric-gear reduction motor. The average capacity of the expeller was 10kg beniseed per
hour. A-50litres/h oil filter press was also designed and fabricated for improved oil recovery
and better cake utilization.
The efficiency of the expeller in terms of oil recovery from the seed as
influenced by wormshaft speed and seed moisture content was evaluated. Increasing
wormshaft speed from 30 to 45rpm increased the oil recovery from 37.56 to 79.63%
and 33.70 to 74.28% for Yandev-55 and E8 respectively. A further increase to 75rpm
decreased the respective oil recovery for the two accessions to 32.47 and 31.92%.
The residual oil-in-cake increased from 14.43 to 43.54% and 17.73 to 43.88% for the
two accessions, with the increase in seed moisture content from 4.1 to 10.3% wb.
The maximum filtered oil recovery of 79.63 and 74.28% and minimum oil-in-
cake of 14.43 and 17.73% were obtained for Yandev-55 and E8 respectively from a –
one pass crushing. These values were obtained at wormshaft speed of 45rpm and
4
moisture content of 5.3% and are in agreement with what obtained for other oilseeds.
The oil quality attributes in terms of relative density, free fatty acid and colour
varied from 0.915 to 0.922, 0.98 to 1.01 and pale yellow to golden yellow
respectively while the respective moisture and protein contents of the expressed cake
were in the range 3.3 to 6.7% and 31.68 to 33.98%.

5
CERTIFICATION
I certify that this work was carried out by Mr. T.M.A. Olayanju in the
Department of Agricultural Engineering, Faculty of Technology, University of
Ibadan, Nigeria.
………………………………………………………….
Supervisor
The Rev’d Prof. E. Babájídé Lucas FNSE, Dip. Th.
Retired Professor in the Department of Agricultural Engineering,
University of Ibadan,
Nigeria.

6
DEDICATION
This work is dedicated to my wife Martina Onyemechi and my children,
Ayòmídé, Ayòmíkún and Tòmíwá Oláyanjú for their love and understanding.

7
ACKNOWLEDGEMENTS
I am most grateful to GOD, who by His grace, mercy and love brought this
work to successful completion.
My indebtedness goes to my supervisor, the Rev’d Prof. E. Babájídé Lucas for
his guidance, advice and thorough supervision of this work. May God continue to
guide him in all his ways.
My profound gratitude goes to the Head, Agricultural Engineering
Department, Prof. J.C. Igbeka for his special interest, and meaningful contribution to
this research work. I also want to thank all the members of staff of Agricultural
Engineering Department, especially Engr. K. Ogedengbe, Drs. Y. Mijinyawa, E.A.
Ajav, A.O. Raji and Bro. Ademola Adeleke for their assistance and support.
I appreciate the financial and moral supports offered by the Management of
Federal Institute of Industrial Research, Oshodi (FIIRO) Lagos, specifically the
immediate past and incumbent Directors; Prof. S. A. Odunfa and Dr. O. Olatunji and
the supports received from Engr. A. A. Adeagbo, ADR (E) and Dr. F.A.O. Osinowo,
ADR (CFT). My special thank goes to Mrs. Mojisola O. Oresanya, the CRO (CFT)
FIIRO whom I worked closely with; for her provision of necessary information at the
initial stage of the work and for her assistance in processing the beniseed samples into
dehulled form. God bless you.
My sincere appreciations go to Dr. S. M. Misari, the Director, National Cereal
Research Institute, (NCRI) Badeggi, Niger State; Drs. A.A. Idowu, G. A. Iwo, G.

8
Agidi, Mr. J. Anuonye and Bro. Ifekodi, for their support and assistance. I also want
to thank Engrs. O. Ogunjinrin, A.K. Kamal, Y. Ademiluyi and C. Ozumba, all of the
National Centre for Agricultural Mechanisation (NCAM) Ilorin, Kwara State for their
assistance during the experimental stage of the research work. I cannot but appreciate
Mr. H. Crowbar of AfriAgric. Products Ltd., Apapa, Lagos; Chief Bankole of Nova
Tech., Ibadan; and the entire members of staff, FIIRO Design Unit for their assistance
during the fabrication stage of this work. The special assistance received from Drs.
S.D. Kulkarni, R. K. Gupta and R. K. Varma of the Central Institute of Agricultural
Engineering (CIAE) Bhopal, M.P, India, and Mr. V. K. Desai, Managing Director,
Tiny Tech, Rajkot, India during my stay with them, is highly appreciated.
I acknowledged the role played by my friends and colleagues, especially,
Messrs. W.B. Asiru, J. A. V. Famurewa, O.O. Awoliyi, O. Aremu, O. M.Yusuff, R.
Akinoso, A. Olapade, T. Ajayi, A. Ademuyiwa and N. O. Adekunle. You have been
very supportive. To the households of faith; Vine Branch Charistmatic Church,
Mokola, Ibadan, Fountain of Life Church, Ilupeju, Lagos and Agape Christian
Assembly, Ejigbo, Lagos for their prayers, I say a big Thank You. The secretariat
assistance of Mrs. A. I. Badmos is highly appreciated.
Finally, I cannot but express my sincere love and appreciation to my
DARLING WIFE, without you beside me, I wonder what would have become of this
golden objective of my life. Thanks for being there, all the time and God bless you.

9
TABLE OF CONTENT
PAGE
TITLE PAGE 1
ABSTRACT 2
CERTIFICATION 5
DEDICATION 6
ACKNOWLEDGEMENTS 7
TABLE OF CONTENTS 9
LIST OF TABLES 13
LIST OF FIGURES 17
LIST OF PLATES 20
LIST OF SYMBOLS AND ABBREVIATIONS 21
CHAPTER ONE
1.0 INTRODUCTION 22
1.1 Background Information 22
1.2 Objectives of Work 23
1.3 Justification of Work 24
1.4 Scope of Work 25

10
CHAPTER TWO
2.0 LITERATURE REVIEW 26
2.1 Historical Background 26
2.2 Beniseed Cultural Practices and Management 30
2.3 Beniseed Structure and Nutritional Composition 36
2.4 Beniseed Products Utilization 38
2.5 Physical Properties of Agricultural Materials 43
2.6 Beniseed Oil Expression Technology and Equipment 49
2.7 Factors Affecting Oil Expression from Oilseed 62
CHAPTER THREE
3.0 MATERIALS AND METHODS 78
3.1 Experimental Plan 78
3.2 Research Materials 78
3.3 Material Preparation 80
3.4 Experimental Procedures 88
3.5 Experimental Design and Performance Evaluation of the
Fabricated Beniseed Oil Expeller 93
3.6 Standard Tests for Analysis 101
3.7 Statistical Analysis 104
11
CHAPTER FOUR
4.0 RESULTS 106
4.1 Size and Shape 106
4.2 Gravimetric Properties 109
4.3 Coefficient of Friction 116
4.4 Mechanical Behaviour of Beniseed Under Compression Loading 119
4.5 Existing Oil Expellers 125
4.6 Machinery Design Analyses 126
4.7 Machinery Fabrication 149
4.8 Cost Estimation of the Oil Expression Plant 158
4.9 Technical Information on the Fabricated Oil Processing Plant 162
4.10 Machine Performance Operational Tests 165
CHAPTER FIVE
5.0 DISCUSSIONS 182
5.1 Size and Shape 182
5.2 Gravimetric Properties 184
5.3 Coefficient of Friction 184
5.4 Mechanical Behaviour of Beniseed Under Compression Loading 189
5.5 Existing Oil Expellers 190
5.6 Machine Operational Performance 191

12
CHAPTER SIX
6.0 CONLUSIONS AND RECOMMENDATIONS 196
6.1 Conclusions 196
6.2 Recommendations 198
REFERENCES 199
APPENDICES 211
1.0 Some Physical Characteristics of two Beniseed Accessions 211
2.0 Mechanical Behaviour of Beniseed under Compession Loading Using
Universal Testing Machine (UTM M350 - 5KN AX RANGE) 226
3.0 Information on Fabrication of Oil Expellers 235
4.0 Mechanical Expression of Oil from Beniseed
Using the Fabricated Oil Expeller 237
5.0 Isometric and Orthographic Projections of the Fabricated
Oil Expression Plant 242
6.0 Letters and Correspondence on Mechanical Oil Expression 248

13
LIST OF TABLES
Table Title Page
2.1 Leading Accessions in Nigerian Beniseed Germplasm Collection
Evaluated at Nsukka (Plant Density = 172,218/ha) 29
2.2 Nutritional Composition of Beniseed 39
2.3 Constants and Exponents for General Oilseed Equation 63
3.1 Experimental Variables and their Levels 79
3.2 The Split-Split Plot Design Experimental Layout 96
3.3 Outline of Analysis of Variance 105
4.1 Standard V – Belts Pitch Lengths 136
4.2 Determination of Average Oil Volumetric Flow Rate 146
4.3 Bill of Materials for the Construction of the Designed Oil Expeller 158
4.4 Bill of Materials for the Construction of the Designed Oil Filter Press 160
A1-1 Some Physical Characteristics of Yandev-55 Accession at 5.3%
Moisture Content, wb 211
A1-2 Some Physical Characteristics of E8 Accession at 5.3% Moisture
Content, wb 212
A1-3 Spatial Dimension of two Beniseed Accessions at Different Levels of
Moisture Contents 213
A1-4 Analysis of Variance for Size and Shape Parameters 214
A1-5 Regression Equations for Size and Shape Parameters 217

14
A1-6 Gravimetric Properties of two Beniseed Accessions at Different Moisture
Content Levels 218
A1-7 Analysis of Variance for Gravimetric Properties 219
A1-8 Regression Equations for Gravimetric Properties 221
A1-9 Coefficient of Static Friction of two Beniseed Accessions with
respect to Different Surfaces 222
A1-10 Summary of Analysis of Variance for Coefficient of Static Friction of
two Beniseed Accessions with respect to Different Surfaces 223
A1-11 Regression Analysis for for Coefficient of Static Friction 225
A2-1 Mechanical Behaviour of Undehulled Yandev-55 Beniseed Accession
at 5.3% Moisture Content (wb) 226
A2-2 Mechanical Behaviour of Dehulled Yandev-55 Beniseed Accession
at 5.3% Moisture Content (wb) 227
A2-3 Mechanical Behaviour of Undehulled E8 Beniseed Accession
at 5.3% Moisture Content (wb) Under Compression Loading 228
A2-4 Mechanical Behaviour of Dehulled E8 Beniseed Accesion
at 5.3% Moisture Content (wb) Under Compression Loading 229
A2-5 Mean Values of Rupture Force, Deformation and Energy Requirements
of the two Beniseed Accessions at Different Moisture Content Levels 230
A2-6 Analysis of Variance for the Mechanical Characteristics
of Beniseed at 5% Significance Level 231

15
A2-7 Regression Equations for the Mechanical Characteristics 234
A3-1 Some Manufacturers of Cottage Scale Oil Expellers 235
A3-2 Design Specifications of Some Cottage Scale Oil Expellers 236
A4-1 Effect of Wormshaft Speed and Moisture Content of two Beniseed
Accessions on Machine Throughput 237
A4-2 Effect of Wormshaft Speed and Moisture Content of two Beniseed
Accessions on Oil Recovery 238
A4-3 Effect of Wormshaft Speed and Moisture Content on the Oil
and Cake Quality 239
A4-4 Analysis of Variance for Oil Recovery at 5% Significance Level 240
A4-5 Regression Equations for Beniseed Oil Recovery within 4.1 to 10.32%
Moisture Content (wb) and 30 to 75rpm Wormshaft Speed 241
A4-6 Results of Duncan Mean Range Test for Oil Recovery
at 5% Significant Level 241
A5-1 Orthographic and Isometric Projections of the
Fabricated Beniseed Oil Expeller 242a
A5-2 Exploded View of the Fabricated Beniseed Oil Expeller 242a
A5-3 Detailed Drawing of Parts of the Fabricated Beniseed Oil Expeller 242a
A5-4 Orthographic and Isometric Projections of Worms
and Wormshaft Assembly 242
A5-5 Orthographic and Isometric Projections of Expeller’s Press Worm 243
16
A5-6 Orthographic and Isometric Projections of Expeller’s Cone 244
A5-7 Isometric Projection of the Fabricated Oil Filter Press 245
A5-8 Orthographic Projection of the Fabricated Oil Filter Press 246
A5-9 Isometric Projection of the Fabricated Oil Filter Plate 247
17
LIST OF FIGURES
Figure Title Page
2.1 Map of Nigeria Showing Beniseed Production Area 31
2.2 The Transverse Section of Beniseed 37
2.3 Kit Screw Press (4.5 – 9.0kg / Press) 54
2.4 Hydraulic Press (1 – 5kg / Press) 55
2.5 Traditional Animal Powered Ghani (1 – 2kg / h) 57
2.6 Power Ghani (12 – 15kg / h) 58
2.7 Power Cecoco Expeller (30 – 50 kg / h) 60
2.8 Mini 40 Expeller (45 – 65 kg / h) 61
3.1 Flow Chart for Beniseed Oil and Cake Production 81
4.1 Effect of Moisture Content on the Size of Yandev 55 Beniseed Accession 107
4.2 Effect of Moisture Content on the Size of E8 Beniseed Accession 108
4.3 Effect of Moisture Content on the Sphericity of two Beniseed Accessions 110
4.4 Effect of Moisture Content on Bulk Density of the two Accessions 112
4.5 Effect of Moisture Content on True Density of the two Accessions 113
4.6 Effect of Moisture Content on Porosity of two Beniseed Accessions 114
4.7 Effect of Moisture Content on Thousand Kernel Weight
of two Beniseed Accessions 115
4.8 Effect of Moisture Content on Coefficient of Friction of Yandev 55
Beniseed Accession 117

18
4.9 Effect of Moisture Content on Coefficient of Friction
of E8 Beniseed Accession 118
4.10 Force – Deformation Curve of Individual Yandev 55
Beniseed Kernel under Compression Loading 120
4.11 Force – Deformation Curve of Individual E8 Beniseed Kernel
under Compression Loading 121
4.12 Rupture Force as a Function of Seed Moisture Content
for the two Accessions 122
4.13 Mean Specific Deformation at Seed Rupture as a Function of Moisture
Content for the Pre-Conditined Beniseed Accessions 123
4.14 Mean Energy as a Function of Seed Moisture Content for the two
Pre-Conditioned Beniseed Accessions 124
4.15 Forces Acting on Screw Thread 130
4.16 Effective Power of Belts as a Function of RPM of Small Sheaves 135
4.17 Geometry of Belt Drive 138
4.18 Bending Loads on the Wormhaft 142
4.19 Shear Force and Bending Moment Diagrams 143
4.20 The Graph of t/(V/A) against V/A 148
4.21 Plant Lay-out for the Cottage Scale Beniseed Oil Mill 164
4.22 Effect of Wormshaft Speed on Machine Throughput
for Yandev 55 Beniseed Accession 166

19
4.23 Effect of Wormshaft Speed on Machine Throughput for E8
Beniseed Accession 167
4.24 Effect of Moisture Content on Machine Throughput for Yandev 55
Beniseed Accession 168
4.25 Effect of Moisture Content on Machine Throughput for E8
Beniseed Accession 169
4.26 Wormshaft Speed and Oil Recovery for Various Moisture Contents
Using Yandev-55 171
4.27 Wormshaft Speed and Oil Recovery for the two Beniseed Accessions
Using 5.3% Moisture Content 172
4.28 Moisture Content and Oil Recovery for the two Beniseed Accessions
Using Wormshaft Speed of 45 rpm 173
4.29 Actual and Predicted Plots of Oil Recovery at Various
Wormshaft Speeds Using Yandev-55 at 5.3% Moisture Content 175
4.30 Actual and Predicted Plots of Oil Recovery at Various Moisture Contents
Using Yandev-55 at 45rpm Wormshaft Speed 176
4.31 Effect of Moisture Content on Residual Oil in Yandev 55 Cake 178
4.32 Effect of Moisture Content on Residual Oil in E8 Cake 179
4.33 Effect of Moisture Content on Residual Moisture in Yandev 55 Cake 180
4.34 Effect of Moisture Content on Residual Moisture in E8 Cake 181

20
LIST OF PLATES
Plate Title Page
1. Beniseed at Flowering 33
2. Beniseed at Harvesting 34
3. Some Common Varieties of Beniseed 40
4. Specific Gravity Separator 82
5. Debittering of Beniseed in an Aluminium Pot 83
6. Draining of Beniseed in a Plastic Basket 84
7. Mechanical Dehulling of Beniseed 85
8. Separation of Seed from Hull Using Brine 86
9. Drying of Dehulled Beniseed on a Concrete Slab 87
10. Beniseed Kernel Under Compression Loading 92
11. The Fabricated Oil Expeller in Operation 97
12. The Fabricated Oil Filter Press in Operation 98
13. The Oil and Cake Produced by the Expeller 99
14. The Fabricated Beniseed Oil Expeller 151
15. Worms and Wormshaft Assembly 153
16. The Fabricated Oil Filter Press 156

21
LIST OF SYMBOLS AND ABBREVIATIONS
Symbol/Abbreviation Meaning
Y Oil yield, %
Yo Initial oil content of the seed
t Pressing time, minute
M Seed moisture content, %
wb Wet basis
P Applied pressure, MPa
L Major diameter (longest intercept), mm
B Intermediate diameter (longest intercept normal to L),mm
T Minor diamaeter (longest intercept normal to L and B), mm
Sphericity
TKW Thousand-kernel weight, g
FFA Free fatty acids
Q Expeller capacity, kg/h
D Mean diameter of screw
N Wormshaft speed, rpm
P Pitch of screw, mm
H Depth of worm, mm
e Thickness of worm, mm
Helix angle, deg.
W Axial load, N
F Applied force normal to W, N
s Coefficient of static friction, deg
Angle of friction
T Torque, Nm

22
CHAPTER ONE
1.0 INTRODUCTION
1.1 Background Information
Beniseed, also known as Sesame seed (Sesamun indicum L.) belongs to the
family Pedaliaceae. It is one of the oldest cultivated oilseed crops in the world
(Langhan, 1985). It is grown in the tropical and subtropical countries of the world.
The major beniseed-producing countries include India, Mexico, the Sudan, China,
Burma and Nigeria (Salunkhe and Desai, 1986). The seed is a staple food of many
ethnic groups in Nigeria and it is cultivated in most of the local government areas of
the Middle Belt and some Northern States of Nigeria, with Benue, Taraba, Plateau,
Nassarawa, Kogi, Katsina, Jigawa and Kano States as major centres (Misari and Iwo,
2000).
Recent works have shown that beniseed is an excellent source of high quality
oil and protein. The seed is free from undesirable components such as protease
inhibitors in soybean, gossypols in cotton, lectins in peanuts and ricin in castor beans
(Share, 1998). Beniseed oil contains natural antioxidants in the form of sesamol and
tocopherol which make it the most resistant to oxidative rancidity among the several
vegetable oils (Yen and Shyu, 1989; Jaswant and Shukla, 1991).
In the places where beniseed plant is cultivated, it has been crowned the
“Queen of oilseed crops”. This is because the crop fetches much money for the
producers and premium world price that exceeds other oilseeds in more than
23
threefolds (Uzo, 1998). For example, the wholesale price of refined beniseed oil in
New York, in 1997 ranged from 33 to 39 cents per pound weight as compared to
cottonseed oil – 13 to 17 cents; corn oil – 12 to19 cents and soybean oil – 10 to 13
cents. (Uzo, op. cit). In quality, the best brands of beniseed oil are close to olive oil.
It has no odour and after refining, it becomes straw-like in colour and tasty.
Beniseed oil is widely employed as cooking oil and raw materials in the
manufacture of margarine and pharmaceuticals. After burning, beniseed oil yields
top-quality, black ink. Its protein has a desirable amino acid profile and is
nutritionally as good as soybean protein (Johnson et al., 1979).
The usual method of beniseed oil extraction at domestic level involves
pounding the seeds in a wooden mortar and treating the product with hot water. This
makes the oil to float to the surface from where it is skimmed off. This method is
slow, of low oil yield and the oil produced is of unpleasant odour and bitter taste
(UNIFEM, 1987).
1.2 Objectives of Work
The specific objective of this work is to determine some physical and
mechanical properties of beniseed that will serve as inputs in the design and
fabrication of an oil expression plant for the seed. In pursuance of this, the following
tangential objectives arise:

24
• to determine some physical properties of beniseed including the linear
dimensions, size, sphericity, bulk and true densities, porosity, thousand kernel
weight and coefficient of friction between it and different structural surfaces,
• to determine some of the mechanical properties of beniseed, these being the force
required, resulting deformation and energy needed to rupture and express oil from
the seed,
• to apply the determined parameters in the design and fabrication of an oil
expression plant for the seed,
and
• to investigate the effect of some machine operational parameters such as moisture
content and wormshaft speed on the performance of the fabricated oil expeller.
1.3 Justification of Work
The increasing population rate of Nigeria (put at about 2.8 percent per annum
- EPW, 1999) and the urge to look in-ward for alternative sources of vegetable oil
from groundnuts and palm kernels have created interest in developing machinery to
process the lesser known oilseeds such as beniseeds, (Odunfa, 1993).
Beniseed has a long history of cultivation and utilization in some agricultural
zones of the country. The production and utilization scenario had been that of era of
production mainly for exports, to that of limited household processing and utilization,
and now to that of medium to large – scale industrial processing coupled with
expanded export promotion drives (Misari and Iwo, 2000).
25
However, research has shown that beniseed has a bitter tastes and the hull
contains oxalic acid (about 2-3%) which reacts with calcium and thus reduces
calcium availability from the seed (Kinsella and Mohite, 1985).
According to Oresanya (1990), the Federal Ministry of Science and
Technology in 1984 formed an inter-institutional task force consisting of the Institute
of Agricultural Research (I.A.R), Samaru; Federal Polytechnic, Idah; Federal Institute
of Industrial Research, Oshodi (FIIRO); Benue Polytechnic and the University of
Ibadan. One of the tasks assigned to the body was for FIIRO, Lagos to develop
technology and machinery for dehulling beniseed and expressing oil from it.
FIIRO, as reported by Oresanya and Koleoso, (1990) has developed a mini
processing plant for the debittering and dehulling of beniseed. However, it was
observed that further investigation into the physical and mechanical properties of
beniseed and studies of factors affecting oil expession as well as optimisation of those
factors will be needed in order to develop a complete pilot plant that will be able to
produce beniseed oil and cake, and eventually augment the conventional oilseed
products.
1.4 Scope of Work
There are many beniseed accessions in Nigeria. However, this work is limited
to the two common accessions: Yandev – 55 (from Benue State) and E8 (from Kano
State). These two accessions represent the Southern and Northern zones of Nigeria
respectively.

26
CHAPTER TWO
2.0 LITERATURE REVIEW
2.1 Historical Background
Beniseed originated in Africa and spread through West Asia to India, China,
Japan and from there to other parts of the world (Uzo, 1998). The tiny seeds have
been known as a highly prized source of oil in Babylon, Assyria and many other
eastern countries for at least 4000 years (BHI, 2000). Beniseed oil was first referred
to in the sixth century as moa in Chinese and koba in Japanese (BHI, op. cit.) The
seed is commonly known as sesame in America, simsim in East Africa, til in India
and gingely in Sri-Lanka. Its other names are benne or benni. Different tribes in
Nigeria have different names for the seed such as riidi in Hausa, igogo in Igala, ishwa
in Tiv, isasa in Igbo and ekuku in Yoruba (Voh, 1998)
According to Thangavelu, (1992), the total world crop area under beniseed is
about 6 million hectares. Sixty-six per cent of this is concentrated in the countries of
Asia (India, China and Burma) but most of the output are consumed locally and do
not enter world trade. Twenty-five percent of this is planted in Africa and eight per
cent in America mostly in Venezuela, Mexico, Guatemala and Columbia. In Europe,
commercial cultivation of beniseed is carried out in Bulgaria and Greece.
In Nigeria, the land area under beniseed is estimated at 80,000 hectares and
the yield is between 200 and 450 kg/ha of dry seed in peasant farming while yield of

27
800-2000 kg/ha have been reported on research farms (Ogunbodede and Ogunremi,
1986).
National production figures for beniseed in the 1960s and early 1970s
fluctuated between 10,000 and 20,000 metric tonnes; by 1980s it got to the 40,000
metric tonnes mark and above 50,000 tonnes by 1993/94 (CBN 1994, FOS 1995).
Production figures in 1996 and 1997 were estimated to be 64,000 and 67,000 metric
tonnes respectively. It has been estimated that production will increase from 70,000
metric tonnes in 1998 to about 139,000 metric tonnes by the year 2010 (PRSD, 1997).
The international trade outlook for sesame as reported by Coote (1998)
amounts to 360,000mt per annum ex-world, Nigeria sharing about 10% of the export
compared to other competitors from Europe (30,000mt), Mid-East/Mediterranean
(60,000mt), North America (60,000mt) and Far East, Japan (210,000mt).
According to Voh (1998) research on beniseed production and processing in
Nigeria was stimulated by the great demand for oilseeds in Europe after the World
War II. The West African Oilseed Mission was mandated to investigate in 1947, the
possibility for the production of groundnut and other oil seeds in Nigeria. The
Nigerian government selected Mokwa as one of the sites for the production of
oilseeds. The production of the oilseeds began under the Colonial Development Co-
operation that later withdrew its activities from the venture in 1954 and handed over
to the Northern Nigerian Government to initiate research activities so as to broaden
the scheme.

28
Consequently in 1959, Mokwa experimental station of IAR became the center
of sesame research in Nigeria. Some research activities on the crop were later
initiated in IAR, Samaru. In 1987, there was a re-organization of National
Agricultural Research Institutes in Nigeria. In the process, the National Cereals
Research Institute, (NCRI) Badeggi was given the national mandate to conduct
research work into the genetic improvement of beniseed, among other crops.
According to Uzo and Ojiako (1981) about 20 species in the genus have been
identified (Table 2.1). Nineteen of these species are indigenous to Africa. This and
other evidences suggest that beniseed was domesticated in Africa probably in West
Africa. Improved varieties have been tested at many farm centres in Northern
Nigeria. Yandev Farm Center with its catchment areas seemed to have been more
successful in terms of release and adoption. The major breakthrough was the
replacement of the black seeded varieties with the white colour types.
The research efforts over the years have resulted in the development of several
lines presently grown in different parts of Nigeria. Some of these include 69B-392,
N68-1-5, 65B-28, Yandev- 55, 65B-58, 60/2-3-8B, PBTIL.No.1, E8, Cross No. 3 and
73A-58 (Adeyemo and Ojo, 1983).

29
Table 2.1: Leading Accessions in Nigerian Sesame Germplasm Collection Evaluated
at Nsukka (Plant density = 172,218/ha).
Accession Other Names Origin Seed *Seed Seed Oil Oil
Wt./ Color Yield % kg/ha
Plant kg/ha
UNN 161 Morada Venezuela 12.64 W 2177 56.4 1228
UNN 63 Morada Ind. Venezuela 17.07 W 2940 52.1 1532
UNN 155 Kaffer-S Sudan 20.60 Br 3548 47.3 2033
UNN 87 X34/38-4 Zaria 15.04 PW 2590 55.6 1440
UNN 28 N128 Zaria 16.10 W 2773 59.2 1641
UNN 99 Queelain Zaria 15.00 LBr 2583 51.9 1341
UNN 27 B-9 India 22.55 C 3884 45.9 1783
UNN 65 Morada-9 Venezuela 15.07 W 2595 55.7 1446
UNN 4 T 12 Zaria 15.51 PW 2671 54.2 1448
UNN 34 1029-2 Sudan 15.20 PW 2618 54.7 1484
UNN 32 E 40 Zaria 13.32 BW 2294 52.2 1197
UNN 30 68A-22 Zaria 14.20 BW 2446 55.1 1348
UNN 50 A/1/7 Sudan 16.33 PW 2812 53.9 1516
UNN 151 Texas #10 Sudan 11.45 Br 2101 56.1 1187
UNN 52 Huria Sudan 11.97 BrW 2061 58.3 1202
UNN 5 N-128 Zaria 11.32 W 1950 55.1 1074
UNN 47 E 8 Zaria 11.38 W 1960 55.0 1078
UNN 95 Texas N-51 Sudan 11.22 BrW 1932 54.9 1061
UNN 57 Rio-S Zaria 10.52 W 1812 55.8 1011
UNN 170 Tuvan Yandev 14.97 W 2578 60.2 1552
UNN 129 89/2 Zaria 16.90 PW 2911 54.9 1598
UNN 51 KRR-2 India 13.46 BrW 2318 60.8 1409
UNN 80 128(1) Zaria 11.43 W 1969 52.2 1028
NIC-1 California 20.93 BrW 3605 49.7 1791
UNN 89 Yandev-55 Yandev 11.88 PW 2046 56.7 1160
S549 California 18.20 BrW 3134 54.1 1696
Tetra California 12.50 W 2153 58.2 1253
234sh California 12.46 LBr 2146 54.1 1161
Longest California 13.83 DW 2382 55.3 1329
UNN Kenya Kenya 17.15 BBr 2954 55.2 1630
Mean 14.67 2531 55.1 1389
• Legend: B = Black, Br = Brown, C = Chocolate, D = Dull
L = Light, P = Pure and W = White
Source: Uzo and Ojiako (1981)
30
2.2. Beniseed Cultural Practices and Management
Beniseed is an annual herbaceous, mucilaginous erect plant, which is
characterized by bell-shaped flowers and opposite leaves. It matures within 4 months
and reaches height of 0.6 to 0.8m with a well-developed root system. The fruits are
dehiscent axial capsules, 3 to 4cm long containing 4 segments with each housing 20
to 25 small flat seeds (Douglas and Considine, 1982). The seeds are very small and
tender with the weight of about 1,000 seeds being 2.0 to 3.5g.
Beniseed normally requires fairly warm conditions during growth to produce
maximum yield, and the average daily temperature required during the critical three
to four months of growth period is 23 – 300C (Weiss 1983). A temperature range of
25 – 270C encourages rapid germination, initial growth and flower germination. The
seed is usually grown in areas with an annual rainfall of 625 – 2,250mm.Once
established, it can tolerate short periods of drought. It grows in the plains and at
elevations up to 1,200m. It cannot withstand frost, continued heavy rainfall or
prolonged drought (Uzo and Adedzwa, 1985).
The seed is not exacting in its soil requirement thus, it is adapted to many
types of soil. This explains its wide range of production area from Yandev in Benue
State to Nguru in Yobe State (Figure 2.1). However, it does best on well-drained
fertile soils of barry texture and neutral reactions (Hamman, 1998). It can also grow
on permeable clays or dark alluvial soils where moisture is not limiting and water
logging not pronounced.

31
Figure 2.1: Map of Nigeria Showing Beniseed Production Area Source: NCRI (1998)

32
There is no large-scale mechanized production of the crop in Nigeria. Only
small peasant farmers are involved. A wide range of cultural practices exists within
the beniseed growing areas of the country. In Kogi, Benue and Taraba States the crop
is sown at the on set of the early rains in March-April. In Nassarawa state, it is sown
two to three months to the end of rainy season (Hockman, 1998).
Beniseed is always grown from seed, usually in pure stand. The seed is either
broadcast or drilled in rows 30cm apart at a rate of 10kg/ha on a well-prepared, weed
free seedbed (Plate1). In mixed cropping, the seed is planted with maize, sorghum or
millet (Desai and Goyal, 1980).
Maturity is reached 80 – 81 days after planting, depending on the varieties.
Early crop is harvested in July to August while the late crop is harvested in November
to December. The seeds mature from the bottom upwards and are cut and dried as
soon as the bottom pods turn from green to yellow (Gibbon and Pain, 1985).
Traditional practice is to harvest and gather the crop manually using sickles (Plate 2).
Tractor rear and side mounted reaper can be used for harvesting the broadcast crop.
Vertical conveyor reapers have been used for harvesting crop, raised in rows and at
optimum moisture level of 15 – 20 per cent, to avoid shattering of pods (Devnani, et
al., 1993).
The harvested bunches after drying, are gathered together on a clean platform,
mat or tarpaulin and carefully beaten with sticks. Sometimes the dried bunches are
gathered in bunches and hit on the platform or mats where the seeds are shed out.

33
Plate 1: Beniseed at Flowering Location: NCRI Farm, Badeggi, Niger State

34
Plate 2: Beniseed at Harvesting Location: NCRI Farm, Badeggi, Niger State
Sickle
Dried
Plant
35
The seeds are winnowed and gathered together and parked into bags where they are
stored (Omolohunu, 1998).
The yield is usually low and it ranges between 300kg – 900 kg/ha. Most of
the seeds are sold in the local market as fresh or toasted seeds. The price ranges from
N4000 – N6000 per 100kg bag depending on the location and times of sales
(Omolohunu, op. cit.). The storage of beniseed is easy because it does not run the risk
of out-door storage and the losses are easily controlled. Length of storage depends on
individual purpose, and could be up to a year or more. The seeds must not be stored
in very hot conditions after harvesting because heat can render the oil in the seed
rancid. If stored at 18 degrees Celsius and at a relative humidity of 50 percent,
beniseeds will keep for a year. They are usually packed for export in 50-kilograms
bags. Small quantities are stored by farmers in the pots, gourds and sacks. Its
transportation is less costly compared with other oilseed troops (Voh, 1998).
Beniseed production has been limited because of the fact that all commercial
varieties are dehiscent and thus has a high labour requirement at harvest. The
discovery of a non-dehiscent type of the seed has raised hopes that high-yielding non-
dehiscent varieties could be developed, which could be harvested mechanically, this
prospect has stimulated renewed interest in sesame breeding (Yermanos, 1985).

36
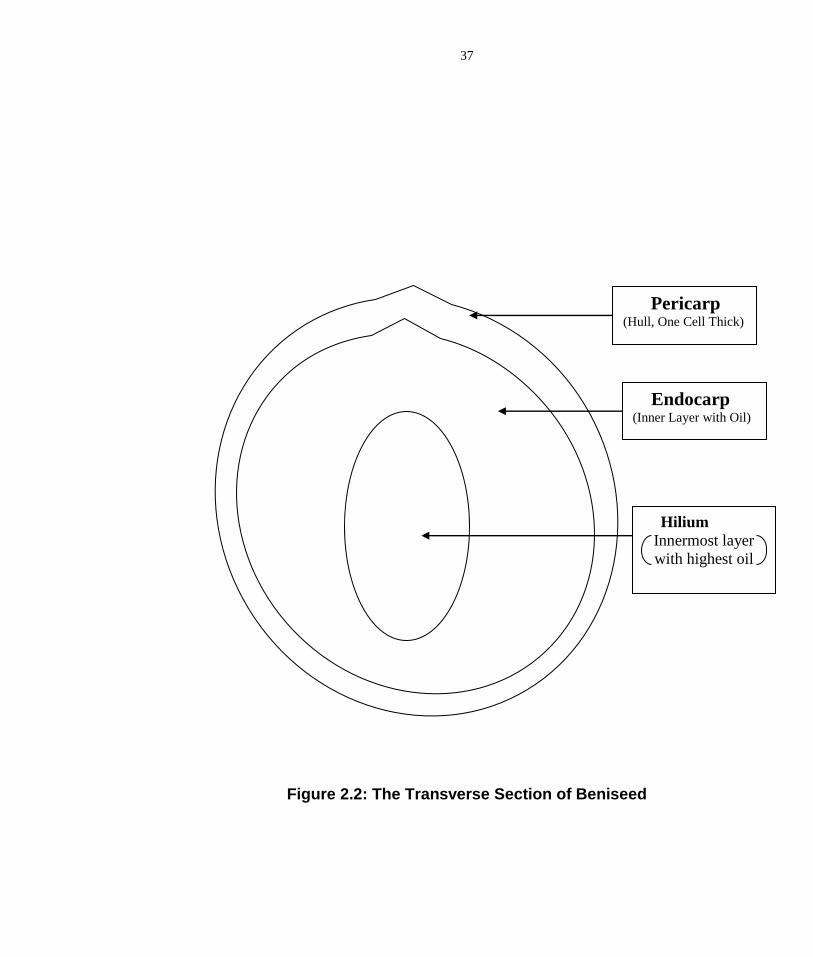
2.3 Beniseed Structure and Nutritional Composition
Beniseeds are pear shape, ovate, small, slightly flattened and thinner towards
hilium (figure 2.2). The hull of beniseed which is lower in oil content and rich in
fibre, constitute 15-20 per cent of seed weight (Gandhi, 1998). Each cell is
surrounded by a thin cell wall mainly composed of cellulose and oil globules, which
are in small droplets of 10 to 80m in diameter and are scattered throughout the
cytoplasm. The oil globules, well spread in all the cells of the seed, remain in the
form of emulsion. When pressure is applied on the cell walls, it reduces in size and
the seed cotyledons start rupturing, resulting in generation of heat. The heat, so
generated, is sufficient to break the emulsion and coagulate the liquid protein, which
results in the release of the oil droplets (Mrema and McNulty, 1985).
Beniseed contains fatty and non-fatty constituents. The relative amount of
each depends upon variety and quality of seeds (Ohaba and Ketiku, 1983). Fatty acid
compositions of a typical beniseed oil sample as reported by Weiss (1983) are 7 to
11% of palmitic acid; 2 to 6% of stearic acid; 32 to 54% of oleic acid and 39 to 56%
of linoleic acid. Other fatty acids occur in amounts less than 1 per cent. Several
steroids have been found in beniseed oil, which make it increase the insecticidal
potency of pyrethroids. Investigations on the two of its minor constituents, sesamin
and sesamolin show that the seed contain 0.34 to 1.13 per cent sesamin and 0.13 to
0.58 per cent sesamolin. A third important minor compound of the seed, which is a
strong antioxidant, is sesamol. It occurs in a free form but it is also liberated from
sesamolin by dilute mineral acids or by hydrogenation (Uzo, op. cit.).
37
Figure 2.2: The Transverse Section of Beniseed
Pericarp (Hull, One Cell Thick)
Endocarp (Inner Layer with Oil)
Hilium
Innermost layer with highest oil

38
Protein content of whole beniseed of over 100 selections ranged from 26 to 30
per cent while that of the meal on the basis of 8 per cent moisture and 1 per cent oil,
varies from 48 to 59 per cent (Johnson et al., 1979). The protein is high in
methoinine, an essential amino acid with sulphur (up to 3.4%). This is unusual for
most plant proteins and the defatted meal prepared from dehulled seed does not
contain undesirable pigment. These unique properties render beniseed an excellent
protein source for supplementing soybean, peanut, and other vegetable proteins,
which lack sufficient methionine, to increase their nutritive qualities (Johnson et al.,,
op. cit.).
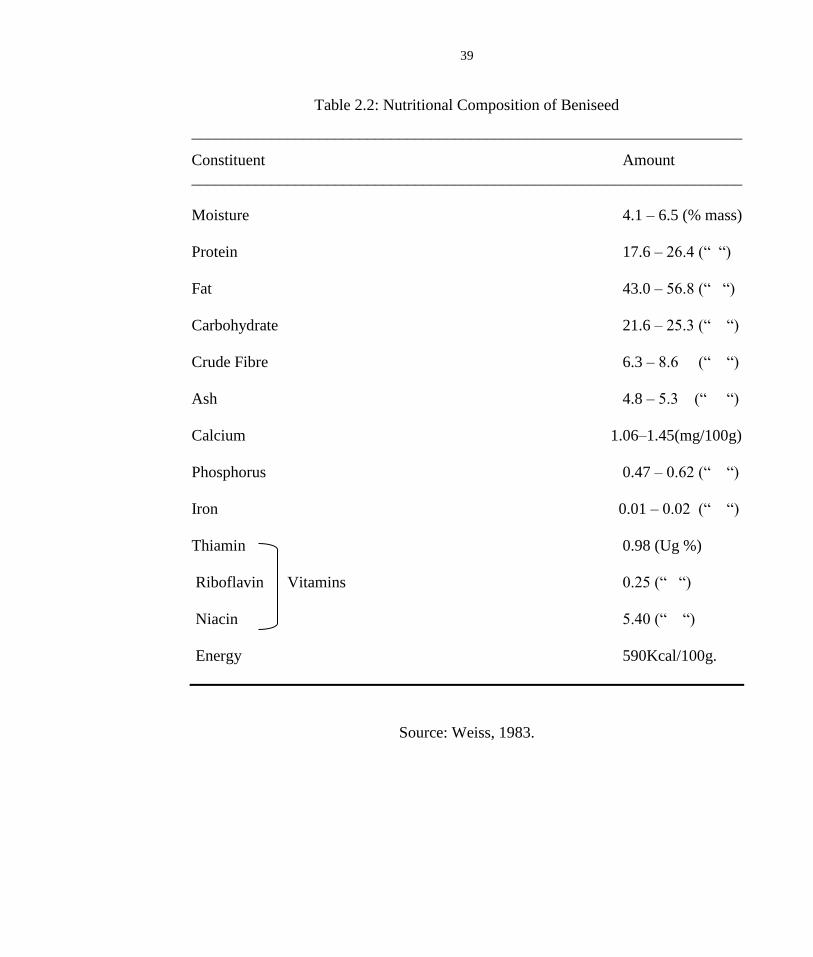
Analysis of beniseed found in various parts of the world for their composition
gave values as shown in table 2.2
2.4 Beniseed Products Utilization
There are different types and qualities of beniseeds. Their colour varies from
white through brown to black (Plate 3). White seeds received a higher market price
and are used primarily in raw form because of their aesthetic value, whereas mixed
seeds are generally crushed into oil (Market Asia, 2000).
Beniseed is a prized seed in the world because of the by-product that are
derived from it. These are the dehulled seed, the oil and the cake. The seed is a rich
source of oil, protein, phosphorous and calcium. The value of beniseeds depends on
their purity, expressed as a percentage, and oil content, which should exceed 50
percent. The oil reacts fairly rapidly on exposure to air, but forms a soft film after
39
Table 2.2: Nutritional Composition of Beniseed
_____________________________________________________________________
Constituent Amount
_____________________________________________________________________
Moisture 4.1 – 6.5 (% mass)
Protein 17.6 – 26.4 (“ “)
Fat 43.0 – 56.8 (“ “)
Carbohydrate 21.6 – 25.3 (“ “)
Crude Fibre 6.3 – 8.6 (“ “)
Ash 4.8 – 5.3 (“ “)
Calcium 1.06–1.45(mg/100g)
Phosphorus 0.47 – 0.62 (“ “)
Iron 0.01 – 0.02 (“ “)
Thiamin 0.98 (Ug %)
Riboflavin Vitamins 0.25 (“ “)
Niacin 5.40 (“ “)
Energy 590Kcal/100g.
Source: Weiss, 1983.

40
Plate 3: Some Common Varieties of Beniseed
White
VarietyBlack
Variety
Brown
Variety
41
long exposure. This unique characteristic makes itone of the major edible oils in the
semi – drying oil (Yen and Shyu, 1989). The oil content vary from 35% to 57% with
50 to 57% in the creamy, white variety, 48% in the black and 46% in the brown
variety (Tashito et al., 1990; Patil, 1998).
The white variety has lower levels of hull than the other two, which are not so
popular in this country but are found in India. Dehulling the seeds, or removing their
thin husk, increases their value as does bleaching of the dehulled seeds. Moisture
content and free fatty acid content are also important in assessing value. The highest
quality beniseeds are found in Central America, primarily in Guatemala (Market
Asia, op.cit.).
Weiss (1983) classified Nigeria among major producers of beniseed for
export. The seed has high economic potential both as source of oil, protein and
foreign exchange earner for the country. It ranked second to only cocoa in export
volume. Raw beniseed is sold in world market at a price of US550/MT while the
processed oil from the seed can be sold at a price of about USS3, 500/MT (Coote,
1998).
Beniseeds are supplied to markets in North America, Europe, and East Asia
by countries in Africa, Latin America and South Asia. Cooking oil can be extracted
from beniseeds and this is their main use, especially in Asia. In North America and
Europe, raw sesame seeds generally are used for toppings on breads such as
hamburger buns, bagels, bread sticks, and other baked goods. Restaurants and natural
food store customers purchase beniseeds for use in ethnic dishes. Middle Eastern

42
countries use beniseeds for tahini paste and halvah, as well as for oil. (Market Asia,
op. cit.).
Beniseed oil is used for edible purposes and for the manufacture of soap,
insecticides and paints. In India, the oil forms the basis of most of the fragrant and
scented oils used in perfumery. Approximately, 500,000 tons of sesame oil is
produced annually, which is about 4% of the estimated world production of liquid
edible vegetable oil (Katung, 1998).
The seed cake is an excellent supplement for cattle, sheep, poultry and pigs,
when given with a lysine rich supplement. The cake left after the oil extraction is of
high nutritional value and it is a good source of methoinine, which is deficient in
many cakes of leguminous origin. Tribe (1967) as reported by Katung (1998) stated
that mixture of beniseed and groundnut cakes gave better rat growth rates than
groundnut cake alone and that the beniseed and soybean was superior to soybean
alone in chick diets.
The whole seed can be used in confectionery. In Nigeria, the seeds are mostly
used in soup preparation or taken as snacks with groundnuts or roasted maize and in
South America, the seed meal is mixed with corn to produce a traditional type of
bread made from corn (Oresanya and Koleoso, 1990).
The young leaves of beniseed could be used as vegetable in soup preparation.
The stalk after harvesting are mostly used as fuel woods, while the dried shrub is
sometimes burnt and ashes left behind are used as raw materials for local soap
production (Omolohunu, 1998). Indeed, there is use for virtually all the parts of the
plant.

43
2.5 Physical Properties of Agricultural Materials
Peleg and Bagly (1982) have defined the physical properties of agricultural
materials as those properties that lend themselves to description and quantification by
physical means. These properties include the linear dimensions, size, shape, bulk and
true densiities, porosity, weight and volume. Others are angle of repose, specific
gravity, colur and coefficient of friction. The knowledge of these physical properties
constitutes an essential engineering data in the design of machines, structures,
processes and control, in analysing the performance and the efficiency of a machine,
as well as in developing new consumer products (Mohsenin, 1986).
Mohsenin, op. cit. used a technique, which related the volume of a set of
specimens of pebbles to the axial dimensions of 50 kernels, dry shelled corn by
measuring the major, minor and intermediate axes as well as weight and specific
gravity of each kernel. The volume of the kernel was taken as one of the parameters
defining the shape of the kernel and the three mutually perpendicular axes were taken
as a measure of the size of the kernels. Tracings of shape and designation of the three
intercepts for seeds and grains obtained by a photographic enlarger were presented.
He stated that the sphericity of most agricultural particles is within the range of 0.32
to 1.00. The criteria used for describing shapes and size include charted standards,
roundness, sphericity, measurement of axial dimensions, resemblance to geometric
bodies and average project area.

44
Igbeka and Sagi (1970) as reported by Fashina (1986) used a Nikon profile to
measure the lengths and diameters of citrus flower particles. This instrument is good,
in that two micrometers could be mounted on it and the specimen could be magnified
to the user’s specification. The projected area could be calculated from the
dimensions of length and average diameter.
Muir and Macnoroe (1987) studied physical properties of cereal and oilseed
cultivars grown in Western Canada and concluded that standard bulk densities were
significantly different among cultivars of the same cereal grains and oilseed. They
observed that porosity based on the compacted bulk densities ranged from 34-38% for
rapeseed, mustard, flex and soybean and 56% for sunflower.
Fornal et al. (1989) made an attempt to apply scanning electron microscopy in
interpreting the results of some selected physical properties of triticale grain. A study
on the association between variation in the main physical properties of Bolero, Dagro
and Largo varieties, and differences in their microstructure were performed. The bulk
density was in the range 590.7-714.9 kg/cm3, the range being greatest in Bolero and
least in Dagro.
Gowda et al. (1990) studied the effects of moisture contents of 4.5-15.0%
(wb) on the physical properties of lineseed (Linum usitatissimum) cv. S-36 seeds.
Bulk density and specific gravity decreased linearly with increasing moisture content.
Size, volume, porosity and 100-grain weight increased linearly with increasing
moisture content.

45
Kanawade et al. (1990) determined the effects of moisture content on certain
selected physical properties of pulse seeds. Particle density, bulk density and porosity
of pigeonpea, chickpea, cowpea, pea, green gram (Vigna radiata) black gram (v.
mungo), soybean and moth bean (Vigna aconitifolia) seeds were determined at 5
moisture content levels. The relationship between the moisture content and bulk
density was curvilinear. The particle density was not affected by moisture content
while the porosity increased with increasing moisture content in all species.
Hsu et al. (1991) evaluated the physical properties of pistachios (Pistacia vera
L.) as functions of moisture content at room temperature. The moisture content of
pistachios ranged from 40% w.b. at harvest time to a minimum of 5.5% (wb). The
length, width and thickness of pistachios increased with increasing moisture content
as represented by third-degree regression equations. The bulk density increased
linearly with moisture content.
Chode-Gowda et al. (1991) measured seeds sizes and seed weights of 8
pigeonpea cultivars. The average length was in the range 5.09-6.52 mm; width -
4.80-6.19mm; thickness - 3.93-5.33 mm; and seed weight - 70.67-157.90 mg.
Oje and Ugbor (1991) measured some physical properties of oilbean seeds
relevant to dehulling as the initial stage in developing a machine for dehulling oilbean
(Pentaclethra macrophylla) seeds. At a moisture content of 4.55% (db), oilbean
seeds have a major diameter ranging from 60-70mm and thickness ranging from 9-
19mm. A low average sphericity of 0.60 and roundness of 0.4 are characteristically
46
unfavourable for rolling of the seeds to take place. With an average density of 1.12
g/cm3, the seed is unable to float in water. The least in size was found to be more
than 50% smaller than the largest, considering all principal dimensions.
Arora (1991) determined engineering properties like size, diameter, volume,
bulk density, particle density, and porosity of 3 vaireites of rough rice (Oryza sativa
L.) at 5 moisture content levels of 8.10, 14.20, 18.23, 23.40 and 27.23% d.b. These
properties were found to be linearly dependent upon moisture content.
Arora and Singh (1991) investigated the interrelations of physical properties
of sunflower and groundnut with moisture content. Physical properties such as size,
shape, density, porosity, colour and 1000-grain weight of sunflower seeds, groundnut
pods and groundnut kernels were determined at different moisture contents (3.95 to
25% d.b). The equation for volume determination was developed and the various
properties related with moisture content by linear regression method. The properties
were found to be linearly dependent upon moisture content.
Irvine et al. (1992) determined experimentally bulk and particle densities for
McGregor flaxseed, Eston and Laird lentils and Ackerpelle fababeans, at various
moisture contents. Both bulk and particle densities decreased with an increase in
moisture contents for all seed types.
Kaleemullah (1992) adjusted Groundnuts cv. ICGS-44 seeds to moisture
contents of 7.0, 14.4, 22.2 and 32.2% (db) and determined their physical properties.
The seed shape was regarded as oval. As moisture content increased, seed

47
dimensions increased by amount 5% of the minor and medium axes and less than 1%
in the major axis. Mean values of roundness and sphericity at 7% moisture content
were 64.8 and 63.7%, respectively. Bulk and seed densities decreased curvilinearly,
and porosity increased as moisture content increased.
Sethi et al. (1992) measured physical properties like shape, sphericity, bulk
density and porosity of Raya, Toria and Gobi Sarson seeds. Sphericity increased with
increase in moisture content, whereas density and porosity were observed to decrease.
Oje (1993) carried out studies on Locust bean pods and seeds. Studies on
some of the properties relevant to dehulling indicated that the pods had a major
diameter ranging from 76 to 277 mm, compared to 8-12 mm for the seeds. The seed
thickness ranged from 5.75 to 7.0 mm. Rolling of the seeds occurs when average
sphericity and roundness are 0.67 and 0.65 respectively.
Latunde-Dada (1993) investigated 12 Nigerian cowpea (Vigna unguiculata)
varieties for physical properties. The seed coat accounted for 5.8 to 11.4% of the
weight of the seeds, leached solids 5.1 to 13.6%, swelling capacity 43.9 to 94.5% and
the seed density ranged between 0.91 to 1.28 g/cm3.
Joshi et al. (1993) investigated several physical properties of pumpkin seeds
and kernels to facilitate the development of equipment for processes such as
dehulling. The average length, width, thickness and unit mass of the seed were
16.91mm, 8.67mm, 3.00mm and 0.203g respectively. Corresponding values for the
kernel were 14.62mm, 6.89mm, 2.50mm and 0.160g respectively. In the moisture

48
range from 4 to 40% d.b, studies on re-wetted seed showed that the bulk density
increased from 404 to 472 kg/m3, true density decreased from 1179 to 1070 kg/m3,
and porosity decreased from 65.73 to 55.45%. For the kernel, the corresponding
values changed from 481 to 554 kg/m3, 1080 to 1143 kg/m3 and 55.46 to 51.535
respectively.
Kulkarni et al. (1993) determined the moisture content of soybean cv. JS7224
by exposing the seeds to 105oC for 16 hours and then adding calculated amounts of
water to attain desired moisture contents between 8 and 11.4% d.b after 24 hours.
Seeds were randomly selected and spatial dimensions calculated. Seed dimensions
increased linearly with increasing moisture content up to 11.4% d.b with a 60%
increase in seed length, 26% increase in size and 20% increase in breadth at the
maximum moisture content.
Gowda et al. (1995) studies the effects of moisture contents of 8.24-27.07%
on the physical properties of soybean cv. Maple Belle seeds. The seed length, width
and thickness, sphericity, volume and 1000-seed weight increased with increasing
moisture content while solid density and bulk density decreased. Increasing seed
moisture content had greater effect on seed thickness (11.98%) than on length
(10.90%) or width (6.88%).
Sokhansanj and Lang (1996) developed an equation for predicting kernel and
bulk volume of wheat and canola during adsorption and desorption. The changes in
kernel and bulk density of canola were small compared with those measured in wheat

49
during the adsorption/desorption cycle. In an almost linear increase, the bulk density
of wheat decreased from 790 to 686 kg/m3 when kernel moisture content increased
from 8 to 22.5% w.b. The bulk density of canola decreased by only 672 to 661
kg/cm3 due to moisture increase from 5 to 19% w.b.
Pan et al. (1996) evaluated and compared physical properties and dry-milling
characteristics of six low-temperature-dried, high-oil maize hybrids (HOC) to three
regular yellow dent hybrids (YDC) representing a range of endosperm hardness that
were not selected from dry-milling characteristics. The test weights, true densities,
and 100-kernel weights of the six Hoc hybrids ranged from 732.8 to 758.6 kg/m3,
1.27 to 1.29 g/cm3, and 26.6 to 28.2g, respectively.
2.6 Beniseed Oil Processing Technology and Equipment
Cleaning is a pre-requisite operation in beniseed oil production. The Federal
Produce Inspection Service (FPIS) enforces FAO prescribed grades and standards
recommended by International Commodities Board for cleaning beniseed especially
those intended for export (Hockman, 1998). The standard for the two types of
beniseeds produced in Nigeria – the Benue and Kano varieties have the same quality
standards termed as “Exportable Quality” which means beniseeds that contain:
• not more than 2% by weight of stones, literite and other mineral or vegetable
extraneous matter; and
• not more than 5% by weight of seed other than sesamum indicum.

50
Beniseeds that fail to meet this standard are rejected for export. Simple
machines such as air-screen cleaners and specific gravity separators are available for
medium scale cleaning of beniseeds.
In conventional processing where oil is the major product, the whole seed is
usually crushed and the oil is extracted. The by-product (meal) is usually fed to
animals as a protein source (Inyang and Ekanem, 1996). In areas, where the meal is
eaten by human beings, dehulling is necessary. This is because the hull contains
undesirable oxalic acid (2-3%), which could complex with calcium and reduce its
availability (Kinsella and Mohite, 1985). The hull also contains undigestible fiber,
which imparts a dark colour to the meal.
According to Gupta (1998) dehulling improves the nutritional and flavour
characteristics of the meal and leads to the production of a glossy white product
irrespective of the hull colour (black, white or red). From experiments on oil
extraction, it has been discovered that dehulling of beniseed leads to a higher oil
yield, increased protein content, and reduced fiber content (Johnson et al., 1979;
Olayanju, 1998).
The small size of beniseed makes its dehulling difficult. Various investigators
have reported several dehulling methods. Toma et al., (1979) as reported by
Oresanya and Koleoso (1990) used a lye solution to dehull 5 varieties of beniseed.
They stated that 6% sodium hydroxide at 60oC with seed to lye ratio of 1:3 (w/v) was
sufficient to decorticate all the beniseed varieties in 10 seconds. Another method

51
according to Moharam (1981) consisted of contacting beniseed with boiling solution
of 0.6% sodium hydroxide at 96oC for 1 to 2 minutes to facilitate the rupturing of the
outer coat. The coat was then removed by washing. A yield of 85% of dehulled
material on the weight of raw seeds was obtained.
Beniseed dehulling by alkali treatment is associated with the following
problems: the difficulty of having to source the chemical locally, hazard of handling
the alkali during processing, and high cost of processing (Odunfa, 1993). Tontisirin
et al. (1980) subjected water soaked beniseeds to a rubbing action of two vertically
mounted discs in order to peel off the hull, which was then separated by floatation in
brine. Traditional method of dehulling beniseed involves soaking in cold water
overnight followed by partial drying and rubbing against a rough surface. The hulls
separated from the kernels are removed by winnowing (Gow-chin, 1990; Badifu and
Abah, 1998). This method is laborious and suitable for handling only small batches
of seed.
FIIRO as reported by Olayanju et al. (2000) had improved on these methods
by developing a mechanical dehuller that can handle up to 10kg of beniseed per batch
of 10 minutes. The machine consists of a shaft carrying three blades. The high speed
of the rotating blades in excess water brought about the dehulling of the seed without
breakage. Separation of the hull from the kernel was done by floatation in brine.
Drying studies on the dehulled wet beniseed containing 42 to 45% moisture
contents (wb) have been carried out. According to Ramachandral (1971) as reported
52
by Oresanya and Koleoso op.cit., the studied methods were sundrying, cross-flow
drying, through-flow drying and pneumatic flash drying. The study indicated that for
drying of the dehulled seed, through-flow drying was the ideal and economical
method. He recommended hot air drying temperature of 80oC and a tray loading (tray
with wire mesh bottom) of 42 kg/m2 with air entry at the top of the bed of material
and discharge at the bottom.
The removal of oil from beniseed can be achieved by either solvent extraction
or mechanical expression. Acccording to Jaswant and Shukla (1991) solvent
extraction is the act of extracting oil from oil – bearing materials thruogh the process
of diffusion with the help of low boling point solvent. It is capable of removing nearly
all of the available oil from the seed meal and produce high protein meal with good
preservation qualities. However, the expensive nature of extraction equipment and its
proness to fire explosion hazards make the extraction process unsuitable for the small
and medium scale farmers who form the majority of oil processors in the developing
countries (David and Vincent, 1980).
The mechanical expression according to Fellow (1988) is the most widely
used method for oil extraction from vegetable oilseeds. It can be achieved either in
two stages - size reduction to produce a paste, followed by separation in a press or in
a single stage, which both ruptures the cells and expresses the oil. In general, the
single stage is more economical, permits higher throughputs and has low capital and

53
operating costs. However, for some oilseeds that are especially hard, a – two stage
expression is more effective.
UNIFEM (1987) classified expression devices in three categories viz: plate
presses, ghanis and expellers. Oil plate presses are of two types: screw press and
hydraulic press. In a screw press, steamed beniseed is pressed slowly and with
pressure by a plunger force down by screw and into a cylinder with large number of
small holes (Figure 2.3). Capacities of screw presses depend upon the size of the
cage, an average being about 1.5 kg per batch. In an hydraulic press, pressure is
exerted by an hydraulic device such as a lorry jack. It requires a heavy - rigid framed
structure (Figure 2.4). Hydraulic presses generate greater pressure than plate presses.
However, the hydraulic fluid should be prevented from coming in contact with the
oilseed.
Ghanis originated in India and they denote names given to machines which
are primarily used to express oil from beniseed. Traditional ghanis are normally
operated by animals and can be manufactured locally. TDRI (1984) described a
ghani as consisting of a wooden mortar and wood or stone pestle. They stated that
the mortar is fixed to the ground while the pestle, driven by one or a pair of bullocks
(or other draught animals) is located in the mortar where the seeds are crushed by
friction and pressure (Figure 2.5).

54
Figure 2.3: Kit Screw Press (4.5 – 9.0kg / Press)
Adapted from UNIFEM (1987)
Perforated
Cylinder
Oil Outlet
Plunger
Threaded
Shaft

55
Figure 2.4: Hydraulic Press (1 – 5kg / Press) Adapted from UNIFEM (1987)
Expression
Chamber
Rigid
FrameHydraulic
Jack

56
The oil runs through a hole at the bottom of the mortar while the residue is
scooped out. Depending on the size of the mortar and type of seeds, an animal-
operated ghani can process about 5kg of seeds every 1hour.
Srikanta (1980) described the mechanical versions as consisting of pestle and
mortar which are usually arranged in pairs with either the pestle or mortar held
stationary while the other is rotated (Figure 2.6). Power ghanis have a greater
capacity and can process up to 100kg of seeds per day.
Oil expeller has been described by UNIFEM op. cit.as having a horizontal
rotating metal screw, which feeds oil-bearing raw materials into a barrel-shaped outer
casting using perforated wall. The pressure produced grinds and crushes the solid
material and presses the oil out of the ruptured cells in the oilseeds. The oil flows
through the perforations in the casing and this is collected in a trough placed
underneath the machine. The cake is removed from the unit through a special outlet
provided for it.
Although, a number of oil expellers have been developed, only two designs
developed by Anderson and French Oil Mill Company are popular (Srivastava and
Kachru, 1995). In Anderson’s expeller, the pressing is achieved by means of a
wormshaft continuosly rotating within cylinder or cage composed of closely spaced
bars. The French expeller differs considerably from Anderson’s expeller in details of
construction as well as in operation. Instead of vertical worms for pre-pressing the
material before it enters the main barrel, it uses two screws revolving within the same

57
Figure 2.5: Traditional Animal Powered Ghani (1 – 2kg / h)
Adapted from UNIFEM (1987)
Wooden
Mortar
Oil
Outlet
Bullock
Wooden
Pestle

58
Figure 2.6: Power Ghani (12 – 15kg / h) Adapted from Srikanta (1980)
Motorised
Pestle
Metallic
MortarPower
Drive
Raised
Platform

59
horizontal barrel. These mechanical expellers may be used as pre – presses or as high-
pressure expellers. The difference being that, high-pressure expeller uses higher
temperature for material preparation and greater number of screw conveyors.
Some expellers have supplementary heaters fitted to the barrel to improve
yields. Most small expellers are power-driven requiring about 3hp and are able to
process between 10 to 50 kg per hour of raw beniseed depending on the type of
expeller used (Figures 2.7 and 2.8). Bigger units processing greater quantities are
available for use in large mills. The expressed cake has 5 – 18% (w/w) residual oil,
depending on the type of oilseed and operating conditions (Rosedown, 1990 and
Desai, 1998).
Most mechanically expressed oils are generally not clear. This is because
some of the fine solid particles formed by pulverization during pressure application
become a solid solution with the extracted oil. As a result, the extracted oils are
usually cloudy in appearance due to the suspended solid particles in the fluid. Even in
some cases, the oil is in slurry form (Olayanju, 1999). Therefore, the mechanically
expressed oils have to be filtered to obtain clear liquids, which can be packaged for
domestic and industrial uses.
The usual method of removing small impurities from vegetable oil at cottage
level is by using an ordinary cloth stretched over a frame onto a tank of sufficient
capacity. The filtered oil is left in the tank for a few hours in order to allow the
settling down of any other impurities still suspended in the oil. The oil is then

60
Figure 2.7: Power Cecoco Expeller (30 – 50 kg / h)
Adapted from UNIFEM (1987)
Oil
Outlet
Power
Drive
Expression
Chamber
Cone
Adjuster

61
Figure 2.8: Mini 40 Expeller (45 – 65 kg / h)
Adapted from UNIFEM (1987)
Cone
Adjuster
Cake
Outlet
Oil
Outlet
Power
DriveFeeding
Hopper

62
transferred into tins or bottles via a funnel from a tap attached over the sediment
layer. This is a slow process and finds little application in food industry (Svarosky,
1981). A post extraction equipment, the filter press will be needed to improve the
quality of the expressed oil.
Moss and Durger (1979) as reported by Olayanju op. cit. stated that oil
filtration can be achieved through pressure, vacuum and centrifugal forces
applications. They observed that vacuum and centrifugal filtrations have high capital
cost and produce cakes, which have high moisture contents and that they are best
suited for materials that form a free draining cake.
Earle (1983) described the two commonly used pressure filters as the plate
and frame; and the shell and leaf. He stated that the shell and leaf filters are best
suited to routine filtration of liquor, which have similar characteristics. Jones et al.
(1983) stated that plate and frame filter press is considered for commercial purposes
because it has low capital cost, high flexibility for different foods, reliable and easily
maintained.
2.7 Factors Affecting Oil Expression from Oilseed
Koo (1942) as reported by Khan and Hannah, (1983) investigated the effects
of pressing temperature, pressure, time and moisture content on oil recovery for seven
oilseeds in a laboratory hydraulic press and developed the following general equation
for oilseeds:
63
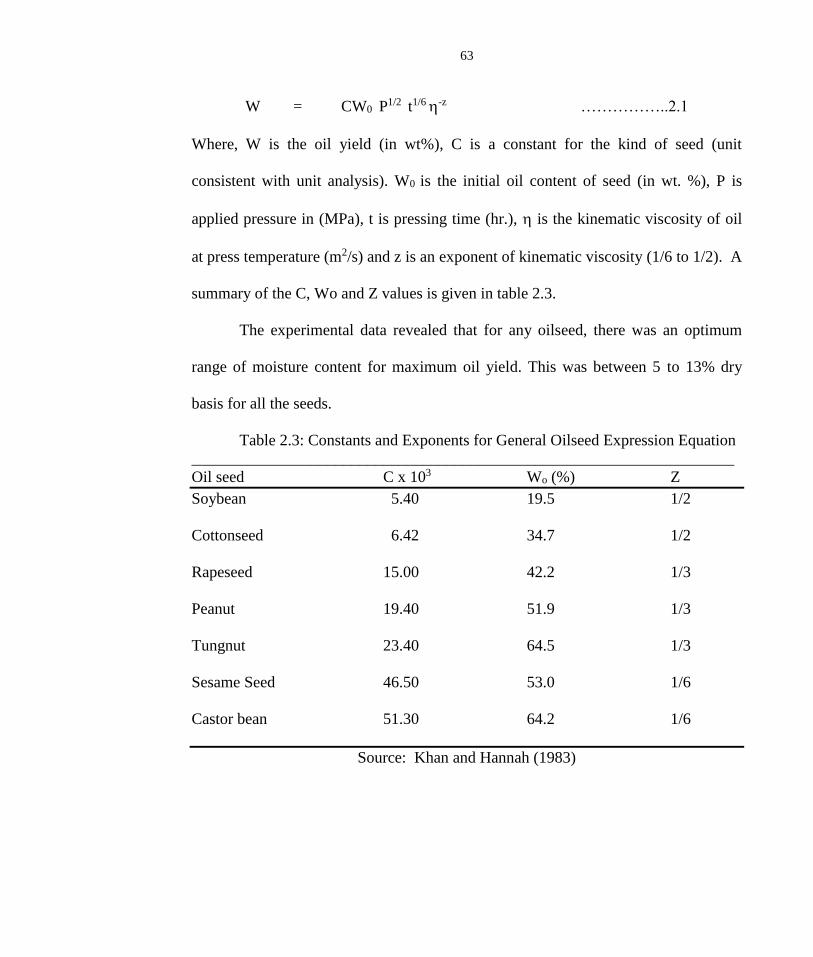
W = CW0 P1/2 t1/6 -z ……………..2.1
Where, W is the oil yield (in wt%), C is a constant for the kind of seed (unit
consistent with unit analysis). W0 is the initial oil content of seed (in wt. %), P is
applied pressure in (MPa), t is pressing time (hr.), is the kinematic viscosity of oil
at press temperature (m2/s) and z is an exponent of kinematic viscosity (1/6 to 1/2). A
summary of the C, Wo and Z values is given in table 2.3.
The experimental data revealed that for any oilseed, there was an optimum
range of moisture content for maximum oil yield. This was between 5 to 13% dry
basis for all the seeds.
Table 2.3: Constants and Exponents for General Oilseed Expression Equation
____________________________________________________________________
Oil seed C x 103 Wo (%) Z
Soybean 5.40 19.5 1/2
Cottonseed 6.42 34.7 1/2
Rapeseed 15.00 42.2 1/3
Peanut 19.40 51.9 1/3
Tungnut 23.40 64.5 1/3
Sesame Seed 46.50 53.0 1/6
Castor bean 51.30 64.2 1/6
Source: Khan and Hannah (1983)

64
Ward (1976) visualised that the oil in the seed is contained in fibrous
capillaries. When pressure is applied, the volume of the capillaries is reduced to
expel the oil. At the same time, the capillaries are narrowed, sheared and eventually
sealed by the increasing pressure and therefore, screw pressing operation at high
pressure becomes self defeating. He emphasised the need for seed preparation,
cooking, screw pressing and separation of solid from expelled oil for re-feeding to the
screw press to achieve high press efficiency.
Tindale (1976) reviewed the range of screw presses available to processors
with their technical features. The smallest available range was stated to be of 5
tonnes per day capacity with a single barrel of 838.2mm length and it is driven by a -
20hp motor through a V-belt drive. The largest expeller available was of 200 tonnes
per day capacity and was used as a pre-press prior to solvent extraction.
Bredson (1977) described the use of mechanical screw press as principal
means of oil extraction in United States from 1930 to 1950 and listed three steps for
oil recovery from oilseeds. The first step was to roll the oilseed in a machine to
rupture substantial percentage of oil cell walls and to provide homogenous flakes for
cooking. The second step was to cook the flakes in a cooker for rupturing oil cell
walls as to coagulate the protein and to inhibit the destructive enzyme. The third step
was to press the flakes in an efficient screw press to finally express the oil.
He reported that in French press, the feed screw usually starts with 152.4mm
pitch and ends with 114.3mm pitch. The maximum pressure in full press varies

65
between 96 to 108 MPa and the variable size orifice at discharge end finally controls
the backpressure. The press has a screw of increasing root diameter and decreasing
pitch revolving in a cylindrical drainage cage.
Khan and Hanna (1983) reviewed the expression of oilseed in an expeller.
The result indicates that pressure, temperature, pressing time and moisture content are
the factors which affect the oil yield during expression of oilseed. The yield data
reported mostly in the literature correspond to the hydraulic presses while the current
technology for oil expression is the screw press. They emphasised that research is
still needed to determine if these factors affect the screw press process in the same
way and to the same extent as they do in static pressing operation.
Khan and Hanna (1984) reported the effects of pressure (P), temperature (T),
pressing time (t) and moisture content (M) on oil yield (Y) from soybean during
mechanical expression. They developed prediction equation for ground soybean with
hulls, flakes with hulls and flakes without hulls. The predicted equation for soybean
flakes with hulls was:
Y = 199.6 + 2.81 T – 0.007 T2 + 32.26 M – 1.20 M2 + 1.399 P + 1.23 t – 0.143TM –
0.013 T P - 0.005 Tt – 0.076 M P (r = 0.95; ESS = 3.67) ……….2.2
In general, the results showed that best oil yields were achieved by increasing
the temperature, pressure and pressing time at moisture content of 9 – 10 per cent.
The maximum oil yield of 85 per cent was obtained from soy flakes at a temperature
of 60oC, pressure of 35-65MPa and moisture content of 9 – 10 per cent. The

66
temperature, moisture and inter-action terms of moisture and temperature in the
regression analysis were highly significant. The effect of pressing time on oil yield
had little effect. The soybean hulls play an important role in oil expression.
Singh et al. (1984) developed a mathematical model to predict oil expression
from sunflower seed. Moisture content, pressure, pressing time and seed temperature
prior to pressing were considered as factors of oil expression in a hydraulic press.
The models developed for different types of seed materials are presented below:
Whole sunflower seed:
RO = -77 + 13.8M + 0.25 P + 0.47 T - 0.35 M2 – 0.0038 P2 +
0.002 T2– 0.056 MT ……………….2.3
(r = 0.97, Se = 2.07)
The above model revealed that moisture content of seed was the most
important factor affecting the residual oil in cake.
Dehulled seed:
RO = 23 + 4.6M – 2.3 t + 0.17 T – 0.180 M2 – 0.0008 P2 + 0.10 t2 +
0.006MP + 0.09 M t - 0.013 MT ……………….2.4
(r = 0.93, Se = 1.00)
Finely ground seed:
RO = -10 + 4.5 M + 0.29 P – 1.7 t + 0.13 T – 0.13 M2 – 0.001 T2 – 0.011 MP + 0.11
Mt – 0.012 MT – 0.012 P t – 0.002 P T + 0.017 t T (r = 0.98, Se = 0.68) ….. 2.5
67
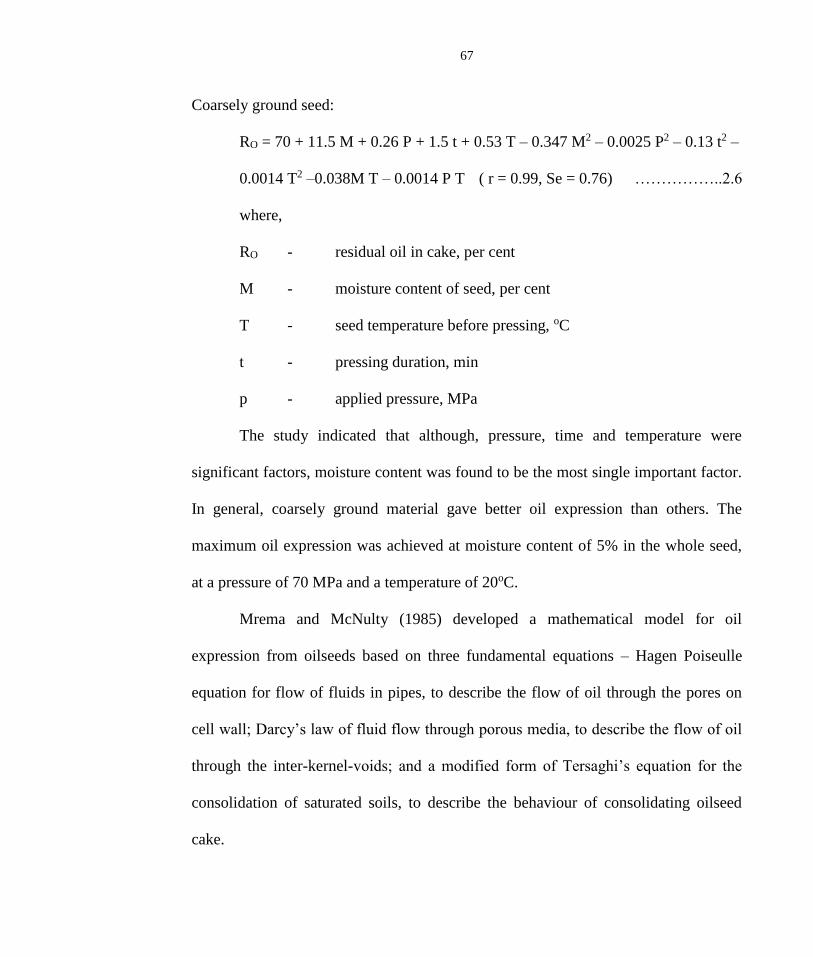
Coarsely ground seed:
RO = 70 + 11.5 M + 0.26 P + 1.5 t + 0.53 T – 0.347 M2 – 0.0025 P2 – 0.13 t2 –
0.0014 T2 –0.038M T – 0.0014 P T ( r = 0.99, Se = 0.76) ……………..2.6
where,
RO - residual oil in cake, per cent
M - moisture content of seed, per cent
T - seed temperature before pressing, oC
t - pressing duration, min
p - applied pressure, MPa
The study indicated that although, pressure, time and temperature were
significant factors, moisture content was found to be the most single important factor.
In general, coarsely ground material gave better oil expression than others. The
maximum oil expression was achieved at moisture content of 5% in the whole seed,
at a pressure of 70 MPa and a temperature of 20oC.
Mrema and McNulty (1985) developed a mathematical model for oil
expression from oilseeds based on three fundamental equations – Hagen Poiseulle
equation for flow of fluids in pipes, to describe the flow of oil through the pores on
cell wall; Darcy’s law of fluid flow through porous media, to describe the flow of oil
through the inter-kernel-voids; and a modified form of Tersaghi’s equation for the
consolidation of saturated soils, to describe the behaviour of consolidating oilseed
cake.

68
A good agreement was obtained between experimental data and predicted data
for oil expression in the constant load regime. The model revealed that rate of oil
expression was dependent on the flow of oil across cell wall. The model may be used
to predict the performance of commercial hydraulic presses and screw expellers.
Sivakumarah et al. (1985) reported the effect of peanut moisture content,
temperature and period of pre-heating, and the pressure applied on oil expression in a
small expeller. The maximum oil expression (Y) determined by response surface
analysis was as follows:
Y =376.661 – 8.214 X1 + 7,419 X2 – 29.072 X3 – 0.118 X1 X2 + 0.271 X1 X3
– 0.302 X2 X3 + 0.052 X12 – 0.100 X2
2 + 1.056 X32 …………..2.7
where X1, X2, X3 and Y refer to the peanut temperature, preheat time, moisture
content, and oil yield respectively. The maximum oil expression efficiency of 91.4
per cent was obtained at temperature of 95.4oC, 27.4 min duration and 5.42 per cent
moisture content.
Sukumaran and Singh (1985) reported the effect of moisture content and rate
of deformation on modulus of elasticity of bulk rapeseed under uniaxial compression.
The moisture content has maximum effect on the secant modulus at any given
pressure. They emphasised the existence of collapse point, which occurs due to
interlocking of the deformed broken solids such that the total beds behaves as one
porous matrix. This may occur before or after the oil point. As the moisture content
increased, the pressure and deformation, needed to release the oil, from the cellular
69
structure of the seed also increased. This is mainly because of plasticising effect of
the moisture. They explained that this phenomenon could be due to the cushioning
effect caused by the moisture induced swelling of the mucilage of the outer epidermal
cells.
Tikkoo et. al. (1985) evaluated the performance of a baby oil expeller for oil
recovery and energy consumption at moisture content of 5.9 to 14.2 per cent (wb). It
was concluded that oil recovery and energy consumption was significantly influenced
by moisture content. The maximum oil recovery and minimum specific energy
consumption were found at the moisture content of 9-10 per cent and 10 – 12 per cent
respectively.
Champanwat (1986) evaluated the performance of an expeller for oil recovery
from mustard oilseed at initial moisture content of 6-15 per cent (wb). The maximum
oil recovery and minimum specific energy consumption were found at moisture
content of 8.6 – 9.5 per cent and 10 – 12 per cent respectively. The final cake
moisture content was reported to be lower by about 3 per cent from the initial
moisture content.
Jacobson and Baker (1986) reported the oil recovery of sunflower oilseed
from a small screw expeller. They stated that high efficiency can be obtained if
oilseeds with low moisture content are pressed at higher expeller pressure and if high
capacity with high oil output is desired from low moisture content sunflower seed,
preheating of oilseed will be necessary.
70
Sukumaran and Singh (1987) reported the effect of moisture content and
applied pressure on oil expression from a-10mm thick bed of rapeseed. They gave a
maximum oil recovery of 62.32 per cent at 9.88 MPa for rapeseed of 4.56 per cent
moisture content (wb). It was stated that with the increase of moisture content, the oil
expression decreases at all applied pressure. The oil expression above 9.35 per cent
moisture content was found to be insignificant.
Sivakumaran and Goodrum (1987) reported that peanut feed rate, oil
expression rate, meal oil content and expression efficiency can be controlled in a
small screw press by varying the internal pressure of the screw press. They stated
that a reduction in internal pressure led to the increased peanut feed rate and increased
meal oil extraction rate in the initial stages, increased cake oil content and lowered oil
expression efficiency. They related the expression efficiency, E to the meal oil
content, Mo with the equation
E = 103 – 1.62 Mo ……………………..2.8
The variation of pressure along the screw axis was found to be significantly different
from the behaviour found in commercial expellers.
Vadke and Sasulski (1988) reported the effect of shaft speed, choke opening
and seed pre-treatment i.e. moisture conditioning, flaking and preheating of canola
seed in a small screw press. With reduction of choke opening and shaft speed,
maximum pressure increased and both press throughput and residual oil in the cake
decreased. When either the whole seed or flakes were preheated in the range of 40-
71
100 oC, the pressure and throughput increased and residual oil in the cake decreased.
The press throughput and oil output were maximum at 5% seed moisture content
while the residual oil showed a continuous rise with increasing seed moisture content.
Vadke et al. (1988) developed a mathematical model of an oilseed press by
superimposition of filtration analysis on screw extrusion theory to calculate press
throughput and residual oil in the cake for a given press geometry and physical
properties of oilseed. The model predicted that press performance would improve i.e.
the throughput would increase and residual oil in cake would decrease if it was cooled
during operation. The longer barrel press would give higher output with lower
residual oil in cake. The predicted effects of wormshaft speed and choke opening on
screw press performance agreed reasonably well with the experimental results
obtained on a small laboratory model.
Sukumaran and Singh (1989) stated that the effective applied pressure for oil
expression is considered to correspond to some value above the oil point pressure
while pressure below this point relate the effort required to mobilise oil flow from the
seed cells to the surface. The oil-point pressure for mustard seed increased from 5.93
MPa to 8.84 MPa at 5mm/min rate of deformation for moisture range of 4.6 to 12.4
per cent (wet basis).
Sivala (1989) studied the effect of applied pressure, pressing time and
moisture content on oil yield for sieved and unsieved rice bran and developed
prediction equations. He stated that maximum oil recovery of 55 per cent was
72
obtained in case of unsieved bran for treatment combination of 25.5 MPa, 35 minutes
and 11% moisture content, whereas in case of sieved bran maximum oil recovery of
only 50 per cent was observed for treatment combination of 30 MPa, 25 minutes and
10 per cent moisture content (wb).
Fasina and Ajibola (1989) investigated the effect of moisture content, heating
temperature, heating time, applied pressure and duration of heating on the oil yield
from conophor nut using a laboratory press. The oil yield at any pressure was
dependent on the moisture content of the sample after heating, heating temperature
and heating time. High oil yields were obtained from the samples with moisture
contents between 8 and 10 per cent (wb) after heating. The maximum oil yield of 66
per cent was obtained when milled conophor nut was conditioned to 11 per cent
moisture heated at 65 oC for 28 min and expressed at a pressure of 25 MPa. The oil
expressed under this condition was of good quality with 1.18 per cent FFA.
Mandhyan (1990) studied the effect of pressure, pressing duration, moisture
content, temperature and particle size of soybean on oil recovery in a hydraulic press
and reported that the maximum oil recovery of 85 per cent was possible at 2.36 mm
particle size, 119oC temperature, 127 MPa pressure, 5.76 per cent moisture content
and 7.5 seconds pressing duration. The final temperature and moisture content of
soybean particles were found to be 131oC and 8.5% after heat treatment to the
soybean particles having initial moisture content of 25%, barrel temperature of
300oC, and holding time of 40 seconds.

73
Mahendra (1990) reported the performance of a commercial expeller of
152.4mm barrel diameter for mustard oilseed. The expeller was fitted with 5 worms
of 152.4, 114.3, 76.2, 63.5 and 63.5 mm pitches. The average cake thickness and
barrel temperature varied from 2-4.3mm and 60-91 oC in different passes respectively.
Adeeko and Ajibola (1990) studied the effect of particle size, heating
temperature, heating time, pressure and pressing time on oil yield and quality of
finely and coarsely shelled groundnut. Oil yield increased with increased pressure up
to 20MPa beyond which it either leveled off or decreased. The rate of oil expression
increased by an increase in temperature, time of heating and particle size. Heating
time at any temperature did not affect the oil yield. About 90 per cent oil was
expressed in 3 minutes.
Ajibola et al. (1990) investigated the mechanical expression of oil from melon
seeds in a laboratory press. The processing variables were particle size, moisture
content, heating temperature and heating time. The oil yield was affected by moisture
content, heating temperature and heating time. However, the oil yield was mostly
dependent on the amount of moisture reduction achieved during heating. The highest
oil yield of 80 per cent was obtained at a pressure of 25 MPa when the samples
conditioned to initial moisture content of 9 and 15 per cent (wb) were heated to
achieve a reduction of moisture content of about 5 per cent.
Sivala et al. (1991) reported the effect of moisture content on oil expression
from rice bran using response surface methodology. The oil recovery from unsieved
74
bran increased from 35.6 per cent to 55.9 per cent with the increase of moisture
content from 7.2 per cent to 10.5 per cent and decrease in pressing time from 45 to 35
min when pressure of 25.5 MPa was applied. Further increase of moisture content to
11 per cent resulted in decline in oil expression.
Sivala et al. (1991) developed a mathematical model of rice bran oil
expression based on one-dimensional consolidation theory with suitable assumptions:
Q = K [ 1 – e-(Pi2t/4)] ……………….2.9
or, Qsat = K ( 1 – e-βt) …………… .2.10
where,
Q - Oil yield.
t - pressing time
β - (Pi2Co)/( 4 H2).
K - Describes the rice bran cake properties.
Co - Coefficient of consolidation, cm2/s
H - Rice bran bed height under consolidation, cm.
P - Applied pressure, MPa
The application and validity of the above model were verified by using the
experimental data obtained from the rice bran oil expression through hydraulic
pressing. The value of Qsat was taken equal to K at the end of 45 min at a given
constant pressure and then value of β was calculated. There was a good agreement

75
between observed and calculated values with correlation coefficient of 0.9397 –
0.9968.
Vermal et al. (1992) reported the performance of a commercial oil ghani for
oil expression from mustard oilseed in India. The study was undertaken to optimise
the seed conditioning factors such as pressure and crushing time to obtain maximum
oil recovery and minimum specific energy consumption. It was concluded that
moisture content for maximum oil recovery was 8.5 per cent (wb).
Shukla et al. (1992) reviewed the technology and equipment developed in
India for oil expression from mustard oilseed. The review of baby oil expellers
(extruder type) tested at different universities revealed that maximum oil recovery of
77.56 to 80.91 per cent was achievable at a moisture content of 9.5 to 10 per cent
(wb).
Verma et al. (1993) reported the performance of an expeller with rapeseed for
oil recovery and energy consumption at moisture contnet of 6-15 per cent (wb).
Maximum oil recovery of 82 per cent was reported at 9 – 9.5 per cent for oilseed
without cooking, whereas, oil recovery of 84 per cent was obtained when rapeseed
was cooked with steam at 0.1 MPa for 60 minute duration. The minimum specific
energy consumption of 0.15kwh per kg oil was achieved for cooked oilseed as
compared to 0.19kwh per kg oil at 10.0 per cent (wb) in cold expression.
Hamzat and Clarke (1993) reported the effect of process variables such as
moisture content, pressing time, pressure particle size and bed depth on oil yield to
76
the parameters studied. The development of the equation was based on the concept of
quasi-equilibrium oil yield. The general equation for oil yield was as follows:
Y = Ye Mc Pd Hf (1 – a e –b t) ……………2.11
where, Y is oil yield (per cent) Ye is quasi-equilibrium oil yield (per cent), M is seed
moisture content (per cent-db), P is applied pressure (MPa), H is bed depth (mm) and
a, b, c, d and f are constants.
A multiple regression analysis was performed on the data obtained during
experiments and values of constants were calculated. The maximum oil yield was
obtained from coarsely ground samples of 5 per cent moisture content at 31 MPa
pressure in 10 min pressing duration. The oil yield from 25mm-bed depth was higher
than 98mm bed depth. They reported that the difference in the percentage of oil yield
obtained was insignificant for bed depth in the range of 12.5 to 35mm. Thus, they
selected bed depth of 25 and 98 mm for their experiments.
Faborede and Favier (1996) in a study of oil expression in seeds developed a
theory relating seedbed compression with seed kernel properties. A threshold
compressive pressure at which oil first emerges from a seed kernel in a seedbed
during mechanical seed-oil expression (referred to as the oil-plant) is theoretically
related to the kernel density, which enables its determination from the initial bulk
properties of the seedbed. They stated that the potential advantage of identifying the
oil-point include the need to predetermine the effective pressure required for oil
expression.

77
Patil and Sinha (1998) studied the effect of thermal and hydrothermal
pretreatments on oil-point of raw soybean, blanched soy-splits and extruded soybean
that were mechanically compressed in a developed oil-point tester using the carver
press. Their results indicated that minimum pressure was required for reaching the
oil-point of extruded soybean samples followed by that of blanched soy-splits. They
stated that increasing moisture content increased the oil-point pressure for all the
three soybean samples considered. They also reported that minimum pressure
requirement of 19.9Mpa was observed in case of soy-splits, which was reported to be
more than double (8.8Mpa) that was required for raw rapeseed sample. They
explained that this was due to the fact that soybean has a low oil content (18-20% oil)
and is hard to press compare to the soft rapeseed which contains over 40% oil.
From the foregoing, it is important that optimum processing conditions for the
expression of oil from beniseed be identified for higher oil yield and improve cake
quality at minimum production cost. This will also assist the designers and
manufacturers in selecting appropriate materials and mechanisms, which will
invariably sustain and promote product quality.
78
CHAPTER THREE
3.0 MATERIALS AND METHODS
3.1 Experimental Plan
A series of experiments were carried out to determine some physical and
mechanical properties of beniseed and to study the effect of some machine
operational parameters on the expressed beniseed oil and cake. The quality of oil and
residual oil content of the cake was also determined.
The levels and range of independent variables in various studies were selected
on the basis of review of literature and preliminary experiments conducted. These are
presented in table 3.1.
3.2 Research Materials
One – 50kg bag, each of the two common beniseed accessions under the local
names – Benue (Native) and Kano (Agric.) were obtained from a company that
exports beniseed from Nigeria- the AfriAgric Products Limited, Apapa, Lagos. The
seed samples were taken to the National Cereal Research Institute, (NCRI), Badeggi
in Niger State for proper identification. The Benue sample was identified as Yandev-
55 while that of Kano was identified as E8. The variation in the grain sizes and
physico - mechanical properties could affect the oil expression quality of beniseed.
As a result, the two accessions representing the two geographical zones of the country
– the South and North respectively were selected.

79
Table 3.1: Experimental Variables and their Levels
S/N Quantity Independent Dependent Treatment Levels Interval Replication
Variables Variables
1. Spatial Moisture Major Diameter,mm 5 5-30 6 50
Dimensions Content Intermiadiate Dia,mm
%, wb Minor Diameter., mm
Geometric Mean, mm
Sphericity, %
2. Gravimetric Moisture Bulk Density, kg/m3 5 5-30 6 3
Properties Content True Density, kg/m3
%, wb Porosity, %
Thousand Kernel –
Weight, g
3. Static Moisture Coefficient friction 5 5-20 5 3
Coefficient Content on Mild Steel,
of friction %, wb Plywood, Concrete
and Glass
4.Compression Moisture Rupture Force, N 3 4 - 8 2 10
Behaviour Content Deformation, mm
%, wb Energy, Nm
5.Expeller Wormshaft Machine Cap.,kg/h 4 30-75 15 1
Performance Speed, rpm Oil Recovery, %
Residual Oil in Cake,%
Moisture in Cake, %
Colour of Oil
Moisture Machine Capacity,kg/h 4 4-10 2 1
Content Oil Recovery, %
%, wb Residual Oil in Cake, %
Moisture in Cake , %
Colour of Oil

80
3.3 Material Preparation:
Dehulled beniseed sample was prepared by using FIIRO established method
as reported by Oresanya and Koleoso (1990). The sequence of the process is given in
figure 3.1 and briefly described below:
The procured beniseeds with approximate moisture content of 5.3% were
cleaned using a specific gravity separator (Plate 4) to remove dust, sand, dry leaves
and empty capsules of fruits from the seeds.
Beniseed has bitter taste that remains even after dehulling and oil extraction.
The bitterness according to Oresanya and Koleoso, op. cit., contains alkaloids such as
caffeine in coffee and tea. However, it is extractable in water. In line with this, the
beniseed was cooked in water at 100oC for about 20 minutes in a covered container
(Plate 5).The water was drained off and the seed washed twice in cold water (Plate 6).
The debittered seeds were poured into a mechanical dehuller consisting of 3
blades rotating in a container of excess water (Plate 7). The high speed of the dehuller
brought about the dehulling of the seeds without breakage.
Separation of the hulls from the seed was done by draining the hull-kernel
moisture on a 1.2mm sieve and then poured into a container of brine (15% Solution)
and mixed thoroughly (Plate 8). This was allowed to stand for about 30 minutes. The
hulls sink while the kernels float on water. The floating kernels were drained on a
sieve. Drying of the wet kernels was done on a clean concrete slab under a shade in
order to ensure gradual drying of individual kernels (Plate 9). This was preferred to
open sun drying because of stress gradient in the dried kernels, which may result in
high breakage.

81
R a w B e n i s e e d s
Cleaning
Debittering
Dehulling
Hull Separation
Drying
Expelling
________________________________________
Oil Cake
Filtering Drying
Degumming Milling/Peletizing
Packaging ----------------------------------------------→ Storage
Figure 3.1: Flow Chart for Beniseed Oil and Cake Production Adapted from Oresanya and Koleoso (1990)

82
Plate 4: Specific Gravity Separator
Feeding
Spout
Collection
Points

83
Plate 5: Debittering of Beniseed in an Aluminium Pot
Cooking
Stove
AluminiumPot
Containing
Beniseed

84
Plate 6: Draining of Cooked Beniseed in a Plastic Bucket
Cooked
Beniseed
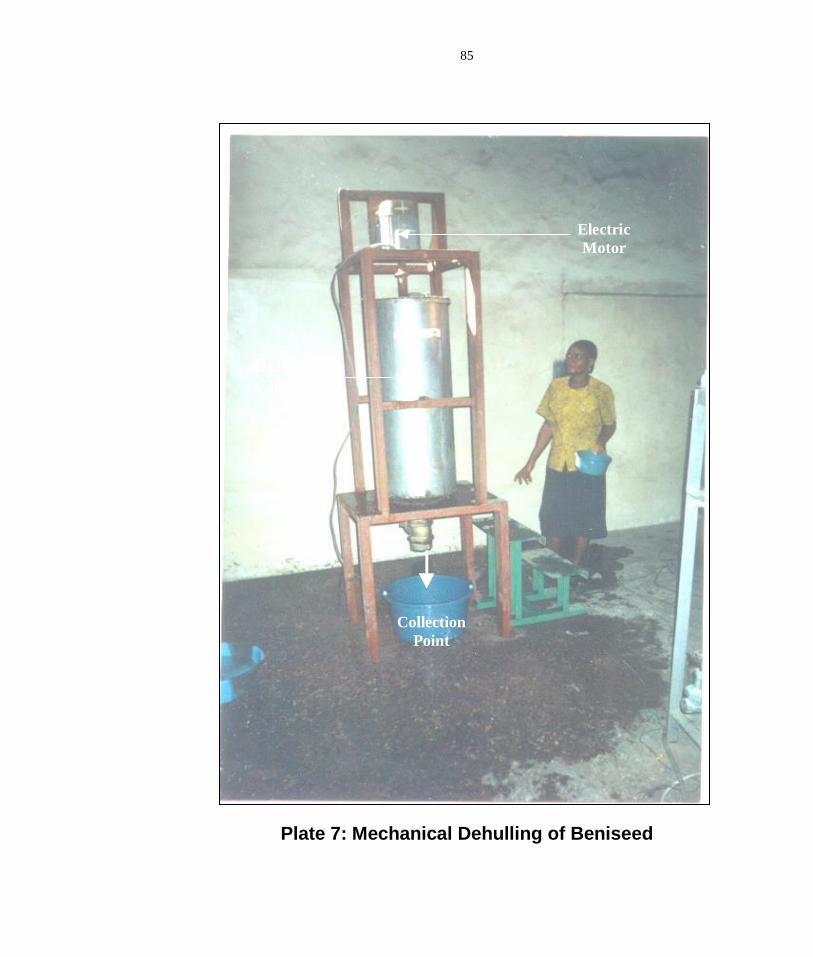
85
Plate 7: Mechanical Dehulling of Beniseed
Electric
Motor
Cylindrical
Tank
Collection
Point
Electric
Motor
Dehulling
Chamber

86
Plate 8: Separation of Seed from Hull using Brine
Separated
Hulls
Wet Dehulled
Beniseed Wet Dehulled
Beniseed
Separated
Hulls

87
Plate 9: Drying of Dehulled Beniseed on a Concrete Slab
Dried
Beniseed
Drained
Beniseed
Kernels

88
3.4 Experimental Procedures
The methods used for determining the physical and mechanical properties of
beniseed are those that have been established in literatures.
3.4.1 Size and Sphericity
Fifty replicate samples of undehulled beniseeds were randomly selected. The
three linear dimensions of each seed namely major, intermediate and minor diameters
were measured with a micro meter screw gauge, reading to 0.01mm.The equivalent
diameter and sphericity of each seed were determined using the following equation
proposed by Mohsenin (1986)
Equivalent Diameter, D= (L X B X T) 1/3 ……………….. 3.1
and Sphericity, = (LXBXT) 1/3 ………….…….…3.2 L
where: L = Longest intercept, (Length) in mm; B = Longest intercept normal to ‘L’
(Breadth) in mm; T= Longest intercept normal to ‘L’ and ‘B’(Thickness) in mm.
A-2 x 5 factorial in Completely Randomized Design, CRD experimental
design was used with a total of 500 observations (2 accessions x 5 moisture content
levels x 50 samples) each for major, intermediate, minor and equivalent diameters;
and sphericity.
3.4.2 Bulk Density:
The bulk density of beniseed at different moisture content was determined by
filling a container of known self-weight and volume to the brim with beniseeds and
weighing to determine the net weight of the seeds. Uniform density was achieved by
89
tapping the container 10 times in the same manner in all measurements. The bulk
density was calculated as
Bulk Density (g/cm3) = Weight of sample (g) ……………3.3
Volume occupied (cm3)
3.4.3 True Density
The true or solid density defined as the ratio of a given mass of sample to its
volume was determined by the water displacement method. Accordingly, a known
weight (50g) of sample was poured into a 100cm3 fractionally graduated cylinder
containing 50cm3 distilled water. The volume of water displaced by the seeds was
observed. The true density was calculated as
True Density (g/cm3) = Weight of the sample (g) ………… 3.4
Volume of distilled water displaced (cm3)
The representative values of bulk and true densities were taken as the average
of 3 replications. A-2 x 5 factorial in CRD experimental design was used with a total
of 30 observations (2 accessions x 5 moisture content levels x 3 replications) each for
bulk and true densities.
3.4.4 Porosity
The porosity of an unconsolidated agricultural material can either be
determined experimentally using the porosity tank method or theoretically from bulk
and true densities of the material. Results from both methods have been found to be
in close agreement (Waziri and Mittal, 1983). The porosity of beniseed in this work
was determined using the relationship presented by Mohsenin (1986) as follows;

90
Porosity = (1 – (Bulk Density/ True Density) )/100 …………………3.5
A-2 x 5 factorial in CRD experimental design was used with a total number of
30 observations (2 accessions x 5 moisture content levels x 3 replications).
3.4.5 Thousand Kernel Weight
For small seeds like beniseed, 1000 kernels were weighed and a parameter
known as the thousand-kernel weight (TKW) was determined. An electronic
weighing balance having a sensitivity of 0.10g was used.
A-2 x 5 factorial in CRD experimental design with a total number of 30
observations (2 accessions x 5 moisture content levels x 3 replications) was used.
3.4.6 Coefficient of Friction
The static coefficient of friction was obtained on four structural surfaces
namely mildsteel, plywood, concrete and glass. In the case of plywood the direction
of movement was parallel to the grain. A tilting table constructed by the Engineering
Drawing Office of the Federal Institute of Industrial Research, Oshodi (FIIRO) was
used. The surface to be tested was fixed on the tilting table and the beniseeds were
poured into a cardboard paper ring of diameter 10cm by 2cm deep until the ring was
full. Care was taken to raise the ring slightly so that it did not touch the surface. The
table was then slowly tilted by a gentle screwing device until movement of the seeds
down mounted against the edge of the tilting table. The tangent of the angle of
friction is the coefficient of friction.

91
A-2 x 4 factorial in CRD experimental design with a total of 24 observations
(2 accessions x 4 moisture content levels x 3 replications) was utilised.
3.4.7. Mechanical Behaviour of Beniseed under Compression Loading
Compression tests were performed on beniseed kernels using the Monsanto
Universal Testing Machine of the National Centre for Agricultural Mechanization,
(NCAM) Ilorin, Kwara State. Testing Conditions for the lnstron Machine were
loading range: 0 - 500N; chart speed – 50rpm/mm; Crosshead speed – 1.5mm/min.
The procedure used by Braga et. al. (1999) was followed.
Ten samples, each of the two beniseed accessions in both dehulled and
undehulled form and at three moisture content levels were used for the test. Each
seed was placed between the compression plates of the tensonometer (Plate 10). The
seed was compressed at a constant deformation rate of 1.25mm/min. The applied
forces at bioyield and oil points and their corresponding deformations for each seed
sample was read directly from the force-deformation curve. The mechanical
behaviour of beniseed was expressed in terms of force required for maximum strength
of the seed, energy required to deform the seed to initial rupture and seed specific
deformation. The rupture force was determined as the force on the digital display
when the seed under compression makes a clicking sound. Each process was often
completed whenever the break point of the positioned seed is reached.

92
Plate 10: Beniseed Kernel under Compression Loading
Beniseed
Kernel
Beniseed
Kernel
93
A– 2 x 2 x 3 Factorial design in CRD with a total of 120 observations (2
accessions in 2 different forms x 3 moisture content levels x 10 replications) was used
to evaluate the force applied, deformation sustained and energy required.
3.5 Experimental Design and Performance Evaluation of the Fabricated
Beniseed Oil Expeller
According to Oresanya and Koleoso (1990), NCRI (1995) and Tunde-
Akintunde (2000), plate and hydraulic presses can be used for expressing oil from
vegetable oilseeds but they are more laborious, time consuming and less effective
while an oil expeller expresses oil at higher per cent than the two presses.
Though, oil expellers are presently in use, in this country, most of them could
not perform effectively with beniseed. Therefore, there is need for modifications and
local production of these expellers in order to perform efficiently on the seed,
eliminate or reduce the problem of shortage of spare parts, maintenance personnel
and the cost of importation. This has necessitated the design and fabrication of this
expeller, which is deemed appropriate for use locally as far as simplicity and
effectiveness of operation are concerned.
In the light of the above, a functional-power-operated oil expeller containing a
special wormshaft rotating in cylindrical barrel with perforations was designed and
fabricated based on the application of parameters obtained from the determined
physical and mechanical properties of the seed. A post extraction equipment, the oil
filter press was also developed in order to improve the quality of oil expressed from

94
the seed. The plates are provided with individual valves, which allows the filterates to
collect into a common draining system and storage.
In order to evaluate the performance of the fabricated oil expeller, three sets of
experiments were carried out as follows:
• varying the wormshaft speed of the expeller and determining how this affects the
oil recovery and cake quality
• varying the seed moisture content and noting how this affects the yield and
quality of the expressed oil and cake; and
• determining how beniseed accession affects the quality of oil expressed from it.
These three experiments were designed as factorial experiments involving an
interactive study of the effects of the three independent variables on the quality of
expressed oil and cake. The three independent variables viz: Wormshaft Speed (N),
Moisture Content (M) and Beniseed Accession (A) were combined in a split plot
experiment. Four levels of wormshaft speed, four levels of moisture content and two
levels of beniseed accession were employed.
The wormshaft, N was considered as the mainplot, while the moisture content,
M and beniseed accession, A were considered as the sub-plot and sub-sub plot
respectively (Table 3.2).
Two kilograms, each of the dehulled beniseed samples was poured into the
hopper. The electric motor was switch on. The speed was then adjusted with the aid
of a belt/pulley arrangement to the first speed. When a constant speed was indicated

95
by the tycometer attached to the wormshaft, the feed control gate was opened for the
seed to pass onto the expression chamber where the seed was crushed and
compressed (Plate 11). The crushing time was noted.
The expressed oil was clarified using the developed oil filter press (Plate 12).
The operation was repeated for the other samples. The dehulled seed, filtered oil and
expressed cake were as shown in Plate 13.
The volumes of the expressed and filtered oil were measured by using a
graduated cylinder while the weight of the expressed cake was measured on a
chemical balance.
The expression efficiency of a laboratory press was given by Ajibola and
Fasina (1989) as:
E = Y ……………………..3.6
Co
where:
Y = Oil yield in per cent = W1 –W2 X 100 ……………………….3.7
W2
W1 = Weight of unexpressed sample
W2 = Weight of expressed sample
Co = The initial oil content of the seed
However, equation 3.7 has to be modified in order to obtain the actual
expression efficiency, E of the fabricated oil expeller. This was evaluated in terms of
oil recovery as follows:
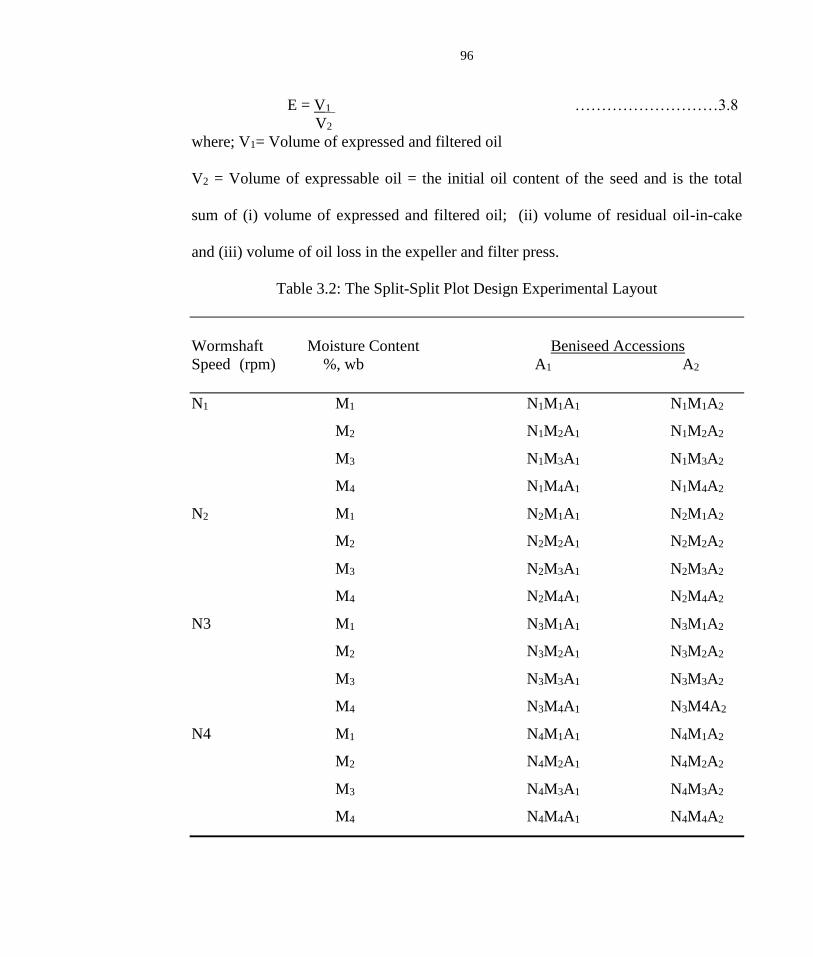
96
E = V1 ………………………3.8
V2
where; V1= Volume of expressed and filtered oil
V2 = Volume of expressable oil = the initial oil content of the seed and is the total
sum of (i) volume of expressed and filtered oil; (ii) volume of residual oil-in-cake
and (iii) volume of oil loss in the expeller and filter press.
Table 3.2: The Split-Split Plot Design Experimental Layout
Wormshaft Moisture Content Beniseed Accessions
Speed (rpm) %, wb A1 A2
N1 M1 N1M1A1 N1M1A2
M2 N1M2A1 N1M2A2
M3 N1M3A1 N1M3A2
M4 N1M4A1 N1M4A2
N2 M1 N2M1A1 N2M1A2
M2 N2M2A1 N2M2A2
M3 N2M3A1 N2M3A2
M4 N2M4A1 N2M4A2
N3 M1 N3M1A1 N3M1A2
M2 N3M2A1 N3M2A2
M3 N3M3A1 N3M3A2
M4 N3M4A1 N3M4A2
N4 M1 N4M1A1 N4M1A2
M2 N4M2A1 N4M2A2
M3 N4M3A1 N4M3A2
M4 N4M4A1 N4M4A2

97
Plate 11: The Fabricated Oil Expeller in Operation
Oil Expression from Undehulled Beniseed
Oil Expression from Dehulled Beniseed
Undehulled
Seeds
Undehulled
Cake
Raw Oil

98
Plate 12: The Fabricated Oil Filter Press in Operation
Expressed
Beniseed
Oil
Oil
Pump
Filtered
Oil
Expressed
Beniseed
Oil
Oil
Pump
Filtered
Oil Taps

99
Plate 13: The Oil and Cake Produced by the Expeller
Mechanically Expressed Beniseed Oil with Fine Particles
Dehulled
Beniseed
Produced
Cake
Filtered
Oil
Settling
Oil
Slurry
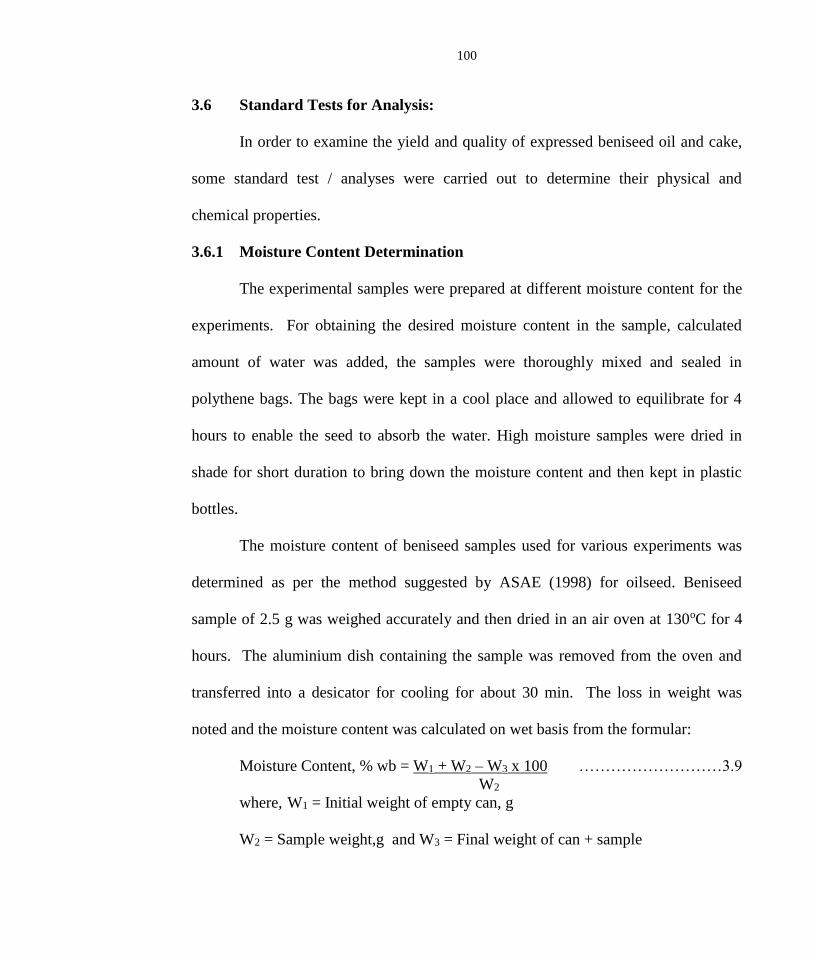
100
3.6 Standard Tests for Analysis:
In order to examine the yield and quality of expressed beniseed oil and cake,
some standard test / analyses were carried out to determine their physical and
chemical properties.
3.6.1 Moisture Content Determination
The experimental samples were prepared at different moisture content for the
experiments. For obtaining the desired moisture content in the sample, calculated
amount of water was added, the samples were thoroughly mixed and sealed in
polythene bags. The bags were kept in a cool place and allowed to equilibrate for 4
hours to enable the seed to absorb the water. High moisture samples were dried in
shade for short duration to bring down the moisture content and then kept in plastic
bottles.
The moisture content of beniseed samples used for various experiments was
determined as per the method suggested by ASAE (1998) for oilseed. Beniseed
sample of 2.5 g was weighed accurately and then dried in an air oven at 130oC for 4
hours. The aluminium dish containing the sample was removed from the oven and
transferred into a desicator for cooling for about 30 min. The loss in weight was
noted and the moisture content was calculated on wet basis from the formular:
Moisture Content, % wb = W1 + W2 – W3 x 100 ………………………3.9
W2
where, W1 = Initial weight of empty can, g
W2 = Sample weight,g and W3 = Final weight of can + sample
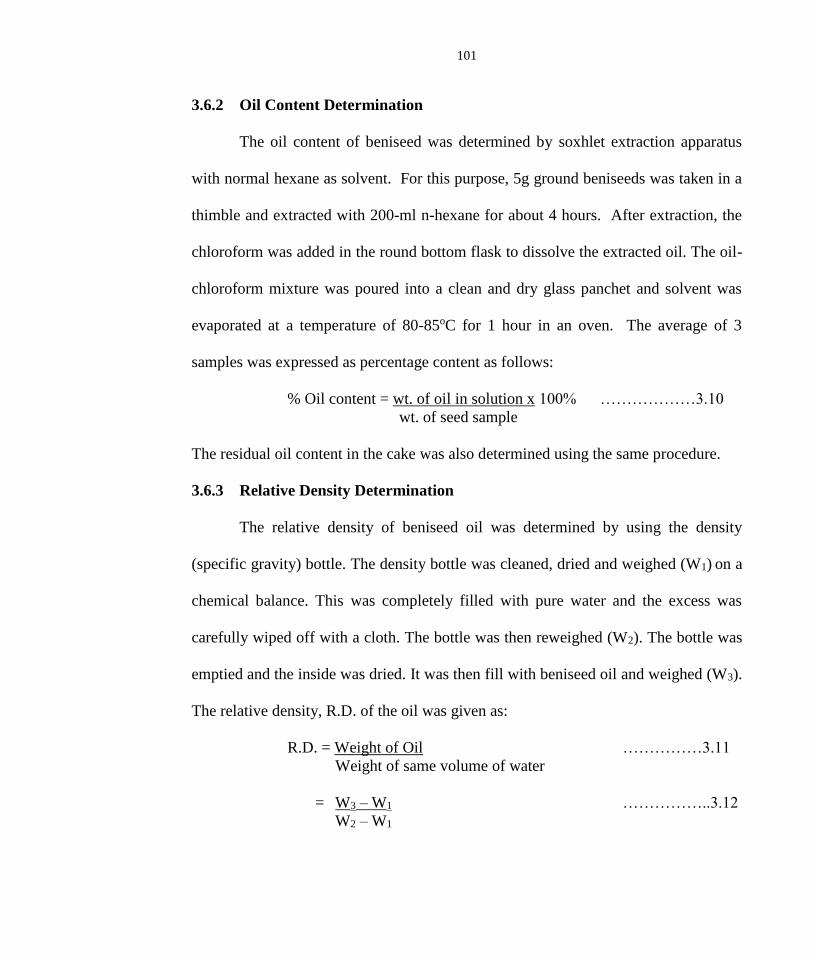
101
3.6.2 Oil Content Determination
The oil content of beniseed was determined by soxhlet extraction apparatus
with normal hexane as solvent. For this purpose, 5g ground beniseeds was taken in a
thimble and extracted with 200-ml n-hexane for about 4 hours. After extraction, the
chloroform was added in the round bottom flask to dissolve the extracted oil. The oil-
chloroform mixture was poured into a clean and dry glass panchet and solvent was
evaporated at a temperature of 80-85oC for 1 hour in an oven. The average of 3
samples was expressed as percentage content as follows:
% Oil content = wt. of oil in solution x 100% ………………3.10
wt. of seed sample
The residual oil content in the cake was also determined using the same procedure.
3.6.3 Relative Density Determination
The relative density of beniseed oil was determined by using the density
(specific gravity) bottle. The density bottle was cleaned, dried and weighed (W1) on a
chemical balance. This was completely filled with pure water and the excess was
carefully wiped off with a cloth. The bottle was then reweighed (W2). The bottle was
emptied and the inside was dried. It was then fill with beniseed oil and weighed (W3).
The relative density, R.D. of the oil was given as:
R.D. = Weight of Oil ……………3.11
Weight of same volume of water
= W3 – W1 ……………..3.12
W2 – W1
102
3.6.4 Free Fatty Acid Content Determination
The free fatty acid (FFA) content of the expressed oil was determined using
the standard test recommended by the Association of Official Analytical Chemists
(AOAC, 1984). 10g of the expressed and filtered beniseed oil was weighed into a
conical flask. An equal volume of diethyl ether and ethanol (the FFA solvent) was
measured into a beaker. Three drops of 1% phenophtalin was added to the solvent and
neutralised with a few mls of NaOH (0.1N) until the colour turned pink.
50mls of FFA solvent was added to the sample in the conical flask. The final
solution was titrated agaist 0.1N NaOH until the colour turned to reddish pink. The
calculation for the FFA content is given as follows:
FFA = Tv X 5.61 ……………...3.13
Sw
where, Tv = Titre value
Sw = Sample weight
3.6.5 Oil Colour Determination
The colour of oil collected from each experiment was determined by
tintometer. It gives colour in terms of Lovibond units for red, yellow and blue. The
matching colour for visual description was taken from the Lovibond system chart.

103
3.6.6 Protein Content Determination
The protein content of expressed beniseed cake was detrmined using the
method recommended by AOAC and it is the automated (macrokjeldahl method). The
appratus used includes, a digester with an in-built temperature controller, digestion
tubes, heat resistant ploves, automatic pipettes, measuring cylinders, complete
filration unit, weighing balance, kjeldahl flasks, conical flasks and a distilling (a
Tecator 1030 automatic analyser) unit.The chemicals used areconcentrated Sulphuric
acid, kjeldahl copper catalyst tablets, Sodium hydroxide (40%) and Boric acid (4%)
with bromocresol green methyl red indicator solution.
1g of beniseed cake, ground into fine powder was weighed into a digestion
tube and 15mls of concentrated sulphuric acid and 5 kjeldahl tablets were added. The
tube was then placed in a preset digester at 410oC and digested for 45minutes. 75mls
of distilled water was added to the tube after cooling to prevent caking. The tube was
then placed in the distilling uni, with 50mls of 40% NaOH dispensed into it to dilute
the solution. The mixture in the tube was further distilled into 25mls of 4% boric acid
for 5minutes. After this, the mixture was titrated against 0.47N HCL until a grey
colour was obtained. A blank sample (i.e without beniseed cake) was also subjected
to the above procedures. The percentage total Nirogen is calculated as follows:
% Total Nitrogen = (14.01 + St –Bt X N) …………….3.14
10 X Sw
where, St = Sample titre; Bt = Blank titre;
N = Normality of HCL; Sw = Sample weight.

104
3.7 Statistical Analysis
3.7.1 Analysis of Variance
The analysis of variance (ANOVA) which is one of the major statistical
research tools in almost all the scientific discipline was used to examine the variation
in the results of all the experiments obtained under the various independent variables
and their interactions. Thus, it is a summary of complex pattern of data provided in
tabular form. Statistical software with split plot programme was used for the analysis
on private computer. The wormshaft speed, N was considered as the main plot, while
the moisture content, M and beniseed accession, A were considered as the sub-plot
and sub-sub plot respectively. The outline of the format used by Gomez and Gomez
(1984) is presented in table 3.3.
3.7.2 Comparison between Treatment Means
The Duncan Multiple Range Test (DMRT) was used for comparing the
treatment means. The DMRT has been found useful in selecting the best and optimal
treatment means. Thus, it is recommended for comparing all possible pairs of
treatment means without a control when a large number of data are to be tested (Obi,
1986).

105
3.7.3 Regression Analysis
Regression analysis was used to indicate the effects of independent variables,
wormshaft speed, moisture content and beniseed accession on the quality of oil and
cake. A software (Microsoft Excel) was used to develop regression equations that
relates the independent variables with the dependent variables.
Table 3.3: Outline of Analysis of Variance
Source of Variation DF SS MS Fvalue
Main Plot
Replication (r)
Main Plot factor, A (a-1)
Error (a) (r-1) (a-1)
Sub-Plot
Sub-Plot factor, B (b-1)
A X B (a-1) (b-1)
Error (b) (r-1)(a-1)(b-1)
Sub-Sub Plot
Sub-Sub Plot, C
A X C (a-1)(c-1)
B X A (b-1)(c-1)
A X B X C (a-1)(b-1)(c-1)
Error (c) (r-1)(b-1)(c-1)
Total (r)(a)(b)(c)
___________________________________________________________________
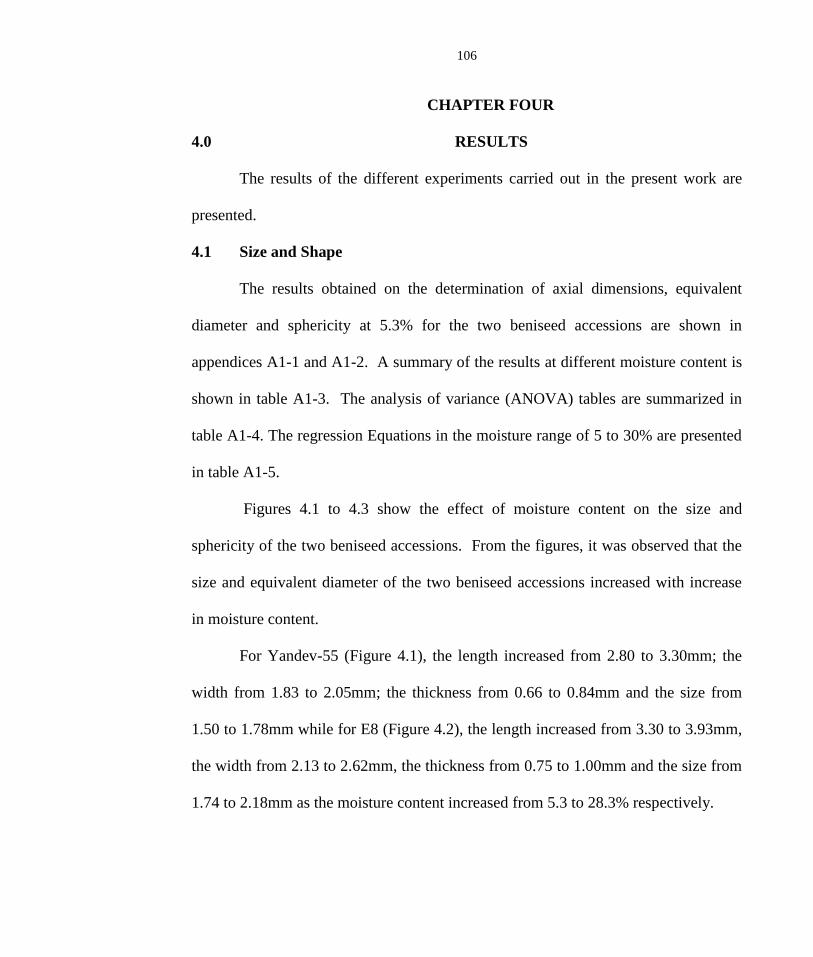
106
CHAPTER FOUR
4.0 RESULTS
The results of the different experiments carried out in the present work are
presented.
4.1 Size and Shape
The results obtained on the determination of axial dimensions, equivalent
diameter and sphericity at 5.3% for the two beniseed accessions are shown in
appendices A1-1 and A1-2. A summary of the results at different moisture content is
shown in table A1-3. The analysis of variance (ANOVA) tables are summarized in
table A1-4. The regression Equations in the moisture range of 5 to 30% are presented
in table A1-5.
Figures 4.1 to 4.3 show the effect of moisture content on the size and
sphericity of the two beniseed accessions. From the figures, it was observed that the
size and equivalent diameter of the two beniseed accessions increased with increase
in moisture content.
For Yandev-55 (Figure 4.1), the length increased from 2.80 to 3.30mm; the
width from 1.83 to 2.05mm; the thickness from 0.66 to 0.84mm and the size from
1.50 to 1.78mm while for E8 (Figure 4.2), the length increased from 3.30 to 3.93mm,
the width from 2.13 to 2.62mm, the thickness from 0.75 to 1.00mm and the size from
1.74 to 2.18mm as the moisture content increased from 5.3 to 28.3% respectively.

107
Figure 4.1: Effect of Moisture Content on the
Size of Yandev 55 Accession
0
0.5
1
1.5
2
2.5
3
3.5
0 5 10 15 20 25 30
Moisture Content, % wb
Gra
in S
ize
, m
m Major Diameter, mm Intermediate Diameter, mm
Minor Diameter, mm Geometric Mean, mm
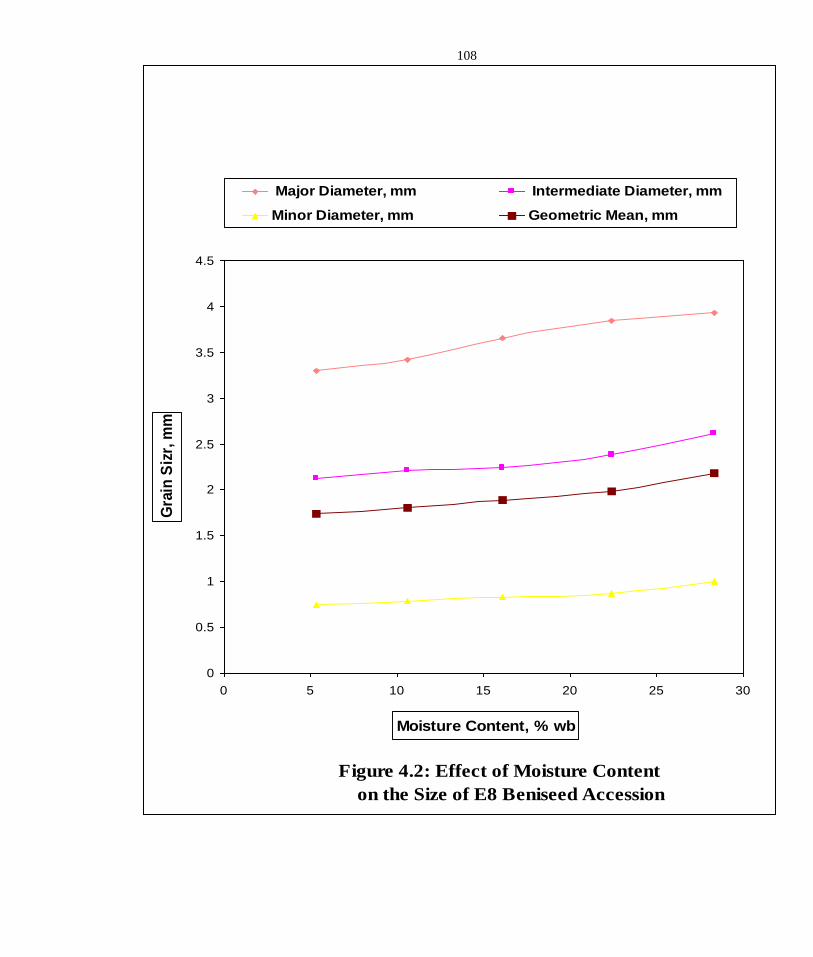
108
Figure 4.2: Effect of Moisture Content
on the Size of E8 Beniseed Accession
0
0.5
1
1.5
2
2.5
3
3.5
4
4.5
0 5 10 15 20 25 30
Moisture Content, % wb
Gra
in S
izr,
mm
Major Diameter, mm Intermediate Diameter, mm
Minor Diameter, mm Geometric Mean, mm

109
For the two accessions, sphericity decreased as the moisture content increased
from 5.3 to 16.1% and then increased with a further increase in moisture content to
28.3% (Figures 4.3). For Yandev-55, sphericity decreased from 0.541 at 5.3% to
0.536 at 16.1% moisture content and then increased to 0.547 at 28.3% while for E8, it
decreased from 0.537 to 0.518 and then increased to 0.554 at the above moisture
levels respectively.
Table A1-4 shows that there is a difference in accession means for major and
intermediate diameters while for minor diameter, geometric mean and sphericity, the
accession means are not different at the 0.050 level. Also, there is a difference in
moisture content means for intermediate diameter, minor diameter and geometric
mean while for major diameter and sphericity, the moisture content means are not
different at the 0.050 level for Yandev-55 and E8 . The interaction between accession
and moisture content is non-significant in all the parameters.
4.2 Gravimetric Properties
The results of the experiments on gravimetric properties (bulk and true
densities, porosity and thousand kernel weight) of the two beniseed accessions at
different moisture contents are summarized in table A1-6. The analysis of variance
(ANOVA) tables are summarized in table A1-7. The regression equations in the
moisture content range of 5 to 30% are represented in table A1-8.
110
Figure 4.3: Effect of Moisture Content on the
Sphericity of two Beniseed Accessions
51.5
52
52.5
53
53.5
54
54.5
55
55.5
56
0 5 10 15 20 25 30
Moisture Content, % wb
Sp
he
ricit
y, %
Y-55 Sphericity, % E8 Sphericity, %

111
Figure 4.4 shows that the bulk density decreased with increase in moisture
content. For Yandev-55, it decreased from 688kg/m3 at 5.3% moisture content to
613kg/m3 at 28.3% moisture content while for E8, the decrease was from 674 to
528kg/m3 at the same moisture content levels respectively.
Figure 4.5 shows that the true density also decreased with increase in moisture
content. For Yandev-55, it decreased from 1042kg/m3 at 5.3% moisture content to
981kg/m3 at 28.3% moisture content, while for E8, it decreased from 1050 to
988kg/m3 at the same moisture content levels respectively.
Figure 4.6 shows that porosity increased with increase in moisture content for
the two accessions. For Yandev-55, porosity increased from 33.97 at 5.3% moisture
content to 37.51 at 28.3% moisture content while for E8, the increased was from
35.81 to 46.56 at the same moisture content levels.
Figure 4.7 shows that thousand-kernel weight (TKW) increased with increase
in moisture content. For Yandev-55, TKW increased from 2.63g at 5.3% moisture
content to 2.96g at 28.3% moisture content while for E8, it was from 2.98 to 3.50g at
the same studied moisture content levels.

112
Figure 4.4: Effect of Moisture Content on the
Bulk Density of two Beniseed Accessions
500
520
540
560
580
600
620
640
660
680
700
0 5 10 15 20 25 30
Moisture Content, % wb
Bu
lk D
en
sit
y, k
g/
m3
Y-55 Bulk Density, kg/m3 E8 Bulk Density, kg/m3

113
Figure 4.5: Effect of Moisture Content on the True
Density of two Beniseed Accessions
970
980
990
1000
1010
1020
1030
1040
1050
1060
0 5 10 15 20 25 30
Moisture Content, % wb
Tru
e D
en
sit
y, k
g/m
3Y-55 True Density, kg/m3 E8 True Density, kg/m3

114
Figure 4.6: Effect of Moisture Content on the
Porosity on two Beniseed Accessions
30
32
34
36
38
40
42
44
46
48
0 5 10 15 20 25 30
Moisture Content, % wb
Po
ros
ity
, %
Y-55 Porosity, % E8 Porosity, %

115
Figure 4.7: Effect of Moisture Content on the Thousand
Kernel Weight of two Beniseed Accessions
2
2.2
2.4
2.6
2.8
3
3.2
3.4
3.6
0 5 10 15 20 25 30
Moisture Content, % wb
Th
ou
san
d K
ern
el W
eig
ht,
gY-55 Thousand Kernel Weight, g E8 Thousand Kernel Weight, g

116
4.3 Coefficient of Friction
The coefficient of friction for the two beniseed accessions on four structural
surfaces and at different moisture contents are summarized in table A1-9. The
analysis of variance (ANOVA) table is summarized in table A1-10. The regression
equations in the moisture content range of 5-3% are represented in table A1-11.
Figures 4.8 and 4.9 show the effect of moisture content on the coefficient of
friction on different structural surfaces for the two beniseed accessions. It was
observed that the coefficient of friction decreased from 0.5095 at 5.3% moisture
content to 0.4621 at 10.6% moisture content and increased to 0.5392 with a further
increase in moisture content to 22.4% for mild steel surface. Similar trends were
observed for plywood, concrete and glass for the two accessions.

117
Figure 4.8: Effect of Moisture Content on the Coefficient
of Firction of Yandev 55 Beniseed Accession
0.3
0.35
0.4
0.45
0.5
0.55
0.6
0 5 10 15 20 25
Moisture Content, % wb
Co
eff
. o
f F
rict
ion
Mildsteel Plywood Concrete Glass
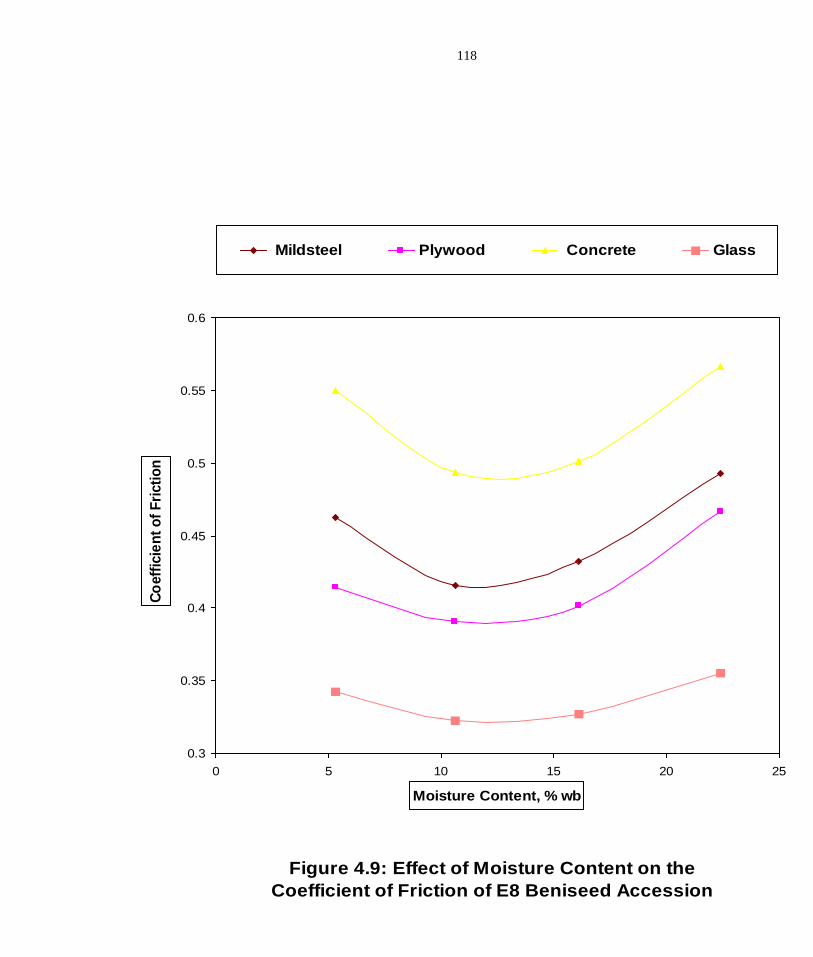
118
Figure 4.9: Effect of Moisture Content on the
Coefficient of Friction of E8 Beniseed Accession
0.3
0.35
0.4
0.45
0.5
0.55
0.6
0 5 10 15 20 25
Moisture Content, % wb
Co
eff
icie
nt
of
Fri
cti
on
Mildsteel Plywood Concrete Glass

119
4.4 Mechanical Behaviour of Beniseed under Compression Loading
The results of the tests on mechanical behaviour of beniseed under
compression loading are given in appendices A2-1 to A2-5. The analysis of variance
tables are summarized in table A2-6. The regression equations in the moisture content
range of 5-3% are represented in table A2-7.
Figures 4.10 and 4.11 show the variation in force required to rupture and to
reach the oil-point of individual kernels and their corresponding deformations. The
effect of moisture content on the rupture force, specific deformation and energy
requirement of the two beniseed accessions are shown in figures 4.12 - 4.14.
The bioyield point in the force deformation curves denote the seed rupture
point and this point was determined by a visual decrease in force as deformation
increases. The oil-point indicates the threshold force and deformation at which the oil
emerges from an oilseed kernel when pressed mechanically. Tables A2-1 to A2-4
present the raw data obtained from the evaluation of the effect of seed pre-
conditioning at storage moisture content of 5.3%, wb on the force applied,
deformation sustained and energy required to rupture the seed. Table A2-5
summarized the results obtained at different moisture content levels.
Figures 4.10 and 4.11 show that the applied force required to rupture and
express oil from beniseed is greater when the seed was dehulled than when left
undehulled. For dehulled Yandev-55 and E8, the values are 10.9 and 9.4N at rupture
and 29.4 and 28.4N at oil-point respectively.

120
Figure 4.10: Load Deformation Curve of Individual Yandev Kernels
Load, N
Deformation,mm
Load, N
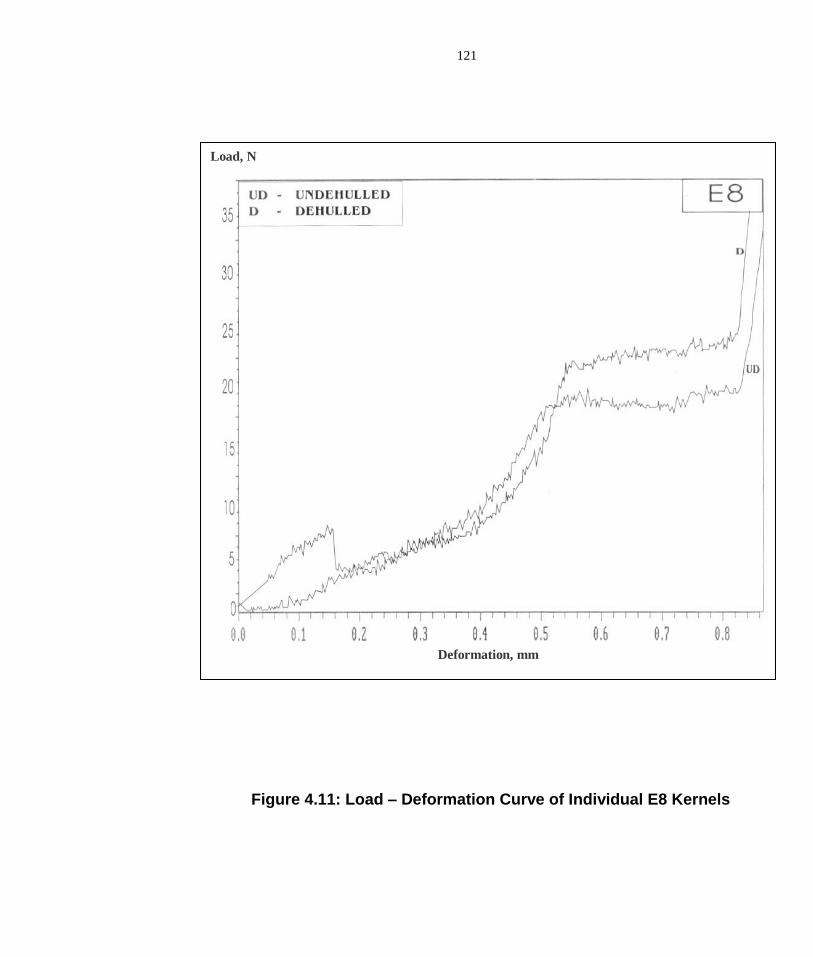
121
Figure 4.11: Load – Deformation Curve of Individual E8 Kernels
Deformation, mm
Load, mm
Deformation, mm
Load, N
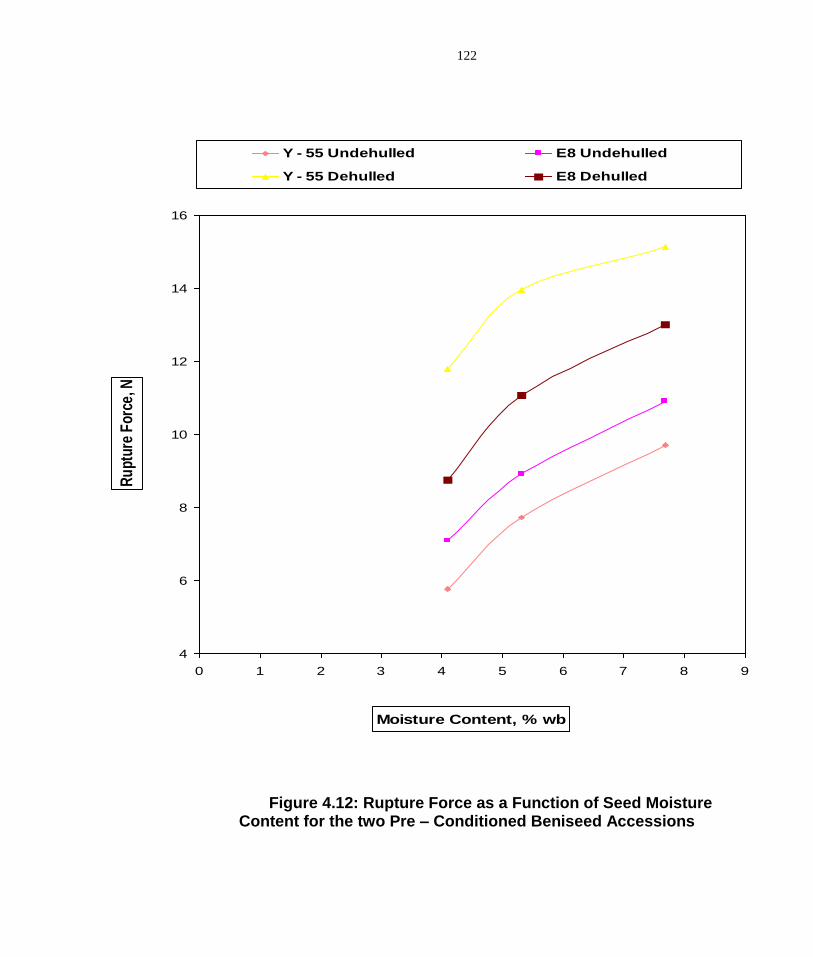
122
Figure 4.12: Rupture Force as a Function of Seed Moisture Content for the two Pre – Conditioned Beniseed Accessions
4
6
8
10
12
14
16
0 1 2 3 4 5 6 7 8 9
Moisture Content, % wb
Ru
ptur
e F
orce
, N
Y - 55 Undehulled E8 Undehulled
Y - 55 Dehulled E8 Dehulled

123
Figure 4.13: Mean Specific Deformation at Seed Rupture as a Function of Moisture Content for the two Pre – Conditioned Beniseed Accessions
0.1
0.15
0.2
0.25
0.3
0.35
0.4
0.45
0.5
0 2 4 6 8 10
Moisture Content, % wb
Sp
ecifi
c D
efo
rmat
ion
, mm
Y - 55 Undehulled E8 Undehulled
Y - 55 Dehulled E8 Dehulled

124
Figure 4.14: Mean Energy as a Function of Moisture Content for the two Pre – Conditioned Beniseed Accessions
0.2
0.4
0.6
0.8
1
1.2
1.4
1.6
1.8
0 1 2 3 4 5 6 7 8 9
Moisture Content, % wb
En
erg
y, J
(10
-3)
Y - 55 Undehulled E8 Undehulled
Y - 55 Dehulled E8 Dehulled

125
However, for undehulled seeds, the values for Yandev-55 and E8 are 8.7 and
9.0N for rupture and 18.6 and 20.8N for oil point respectively. The corresponding
deformations follow a similar trend with values that ranged between 0.123 to
0.494mm and 0.46 to 0.54mm for rupture and oil-point respectively. Figures 4.12 –
4.14 show that all the studied mechanical property - applied force, specific
deformation and energy increased with increase in moisture content for the two
beniseed accessions.
4.5 Existing Oil Expellers
Some information on oil expellers manufactured by a number of
manufacturers in Nigeria and abroad is presented in appendix three, tables A3-1 and
A3-2. The list covers a wide range of expellers and gives good information that may
be needed by oil processors.
Analysis of the data on the available oil expellers indicates that there is no
correlation among the capacity, power input and weight of the expeller. Over 75% of
the models had capacity less than 75kg/h, which reflect a trend towards manufacture
of smaller capacity expellers.

126
4.6 Machinery Design Analyses
An oil expression plant consisting of an oil expeller and a filter press was
designed based on the results of the determined properties and information obtained
from sections 4.1 to 4.5.
4.6.1 Oil Expeller
4.6.1.1 Theoretical Considerations
An expeller is considered as an equipment with discontinuous flight called
wormshaft. The following assumptions were made for design consideration.
• The maceration of oilseed was complete in the feed section leaving the
homogenous mixture of oil and solids in the ram section.
• No pressure development would take place in the feed section. The pressure
development and the expression of oil start at the beginning of the ram section.
• The temperature of oilseed mass remained constant in the ram section. In reality,
the temperature would increase along the ram section due to shearing action of the
shaft.
As the oil solid mixture passes through the section, it is subjected to radial
pressure exerted by the wormshaft. The pressure causes flow of oil in the radial
direction through the solid matrix and out through the barrel slots. The oil-flow in
turn changes the flow rate of mixture in the axial direction.

127
4.6.1.2 Design Conception
Based on the above assumptions, preliminary work and analysis of
information received on the existing oil expellers (Appendix, A1-2), the following
specifications were made:
Length of chamber, L (mm) = 300
Number of worms, n = 6
Worm pitches, P (mm) = 2 x 25, 37.5, 37.5, 37.5, 37.5, 37.5
Depth of worm, H (mm) = 6.25
Thickness of worm, e (mm) = 6.25
Helix angle, (degree) = 10
Screw Diameter at the Feed Section, DF = 47.5mm
Screw Diameter at the Discharge Section, DD = 60mm
Mean diameter of screw, Dm = 54
Speed of rotation, N (rpm) = 45
4.6.1.3 Design Capacity
The capacity of an expeller is controlled by drag flow, pressure flow and leak
flow in the barrel assembly. The theoretical capacity of an expeller with single flight
in feed section was given by Varma (1998) as:
Q = DN cos (Pcos – e) H ……………………….4.1
where; Q = volumetric flow
D = mean diameter of screw

128
N = rotational speed of wormshaft
P = pitch of the screw
H = depth of the screw
e = flight width
= helix angle
From section 4.6.1.2,
Q = 3.142 x 54 x 45 x Cos 10 (25Cos10 – 6.25) 6.25
= 8.63 x 105 mm3/min
= 0.05178m3/h (for single start in 3 passes)
= 35.26kg/h (for average bulk density of 681kg/m3, section 4.2)
= 11.75kg/h (in a - single pass operation)
Say 10kg/h in real conditions and 0.25 metric tonne/day.
4.1.6.4 Compression Ratio
Oil expeller works on the principle of a pressure differential applied to
incoming oilseed against that applied to the discharge material. This may be termed
as compression ratio. According to Shukla et. al.(1992), compression ratio, C.R. is
defined as ratio of the volume displaced per revolution of the shaft at the feed section
to the volume displaced per revolution of the shaft at the plug or discharge section.
They gave the theoretical equation as:
C.R = (DB2 – DF
2) ……………………….4.2
(DB2 – DD
2)

129
where,
DB = Diameter of the expression chamber = 61mm
DF = Diameter of the wormshaft at feed section = 47.5mm
DD = Diameter of the wormshaft at Discharge section = 60mm
Therefore, C.R = (612 – 47.52)
(612 – 602)
= 3721 – 2256
3721 – 3600
= 12.1
This is within the range specified for oilseed with high oil content.
4.6.1.5 Forces Acting on Screw Thread
The two main forces acting on the screw thread are.
• Force required to translate and compress the beniseed charge.
• Frictional force resulting from the screw’s motion.
The shaft has six worms, each of which is subjected to pressure due to
compression of beniseed kernels. This pressure increases from a minimum value at
the feed end to a maximum at the discharge end (Ward, 1976).
Consider a portion of the screw as shown in Figure 4.15, under the static
condition, the direction of load on the unit length of the thread will be normal to the
thread surface along line AO.

130
Figure 4.15: Forces Acting on Screw Thread

131
where: K = Elemental load, N
= Helix angle, deg
= Friction angle, deg
When the screw is rotated so that the load is moved, the line of action AO will
be rotated through the angle of friction, to BO. For equilibrium of forces, the
component BO parallel to the axis of the screw,
W = Kcos ( + ) ……...…………….4.2
Similarly, the component BO perpendicular to the axis of the screw.
F = Ksin ( + ) ……………….4.3
then, F = Ksin ( + )
W Kcos ( + )
F = W tan ( + ) ……………………4.4
The friction angle,
= tan-1 s ………………………. 4.5
Where
s = coefficient of static friction.
= 0.486 (section 4.3)
= tan-1 (0.486) 25o
W is the axial force required to expel a great deal of the oil at the oil-point and
has been determined to be 29.4N on the average (section 4.5)
F = 29.4 tan (10 + 25) = 20.59N/kernel
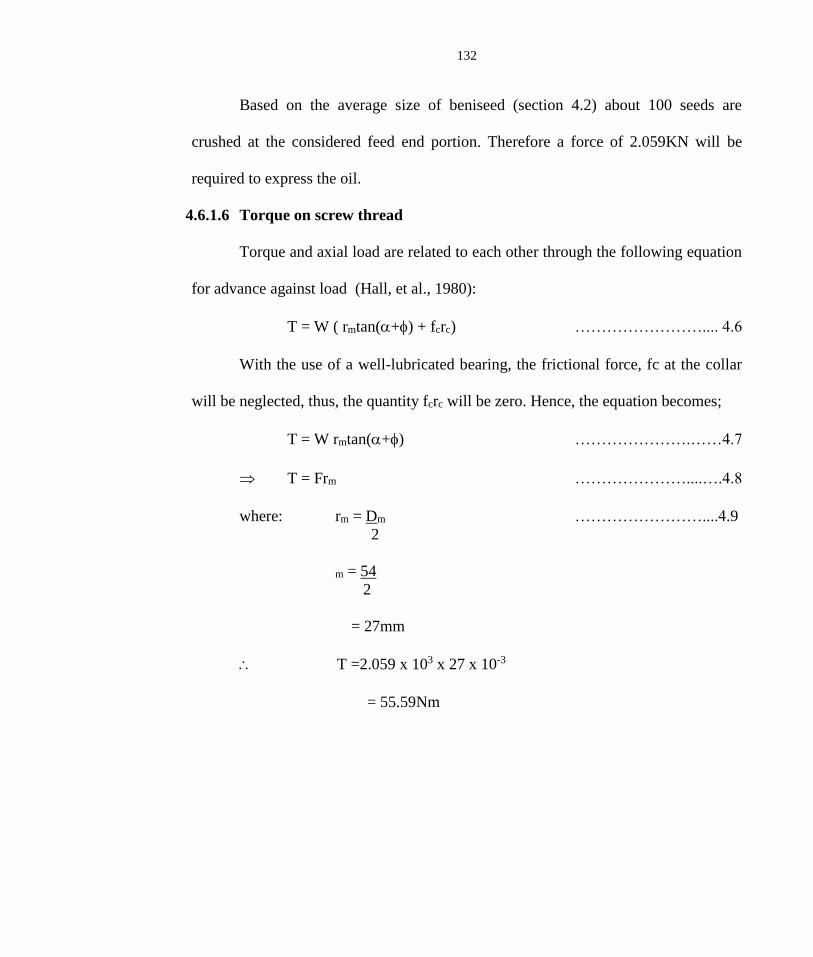
132
Based on the average size of beniseed (section 4.2) about 100 seeds are
crushed at the considered feed end portion. Therefore a force of 2.059KN will be
required to express the oil.
4.6.1.6 Torque on screw thread
Torque and axial load are related to each other through the following equation
for advance against load (Hall, et al., 1980):
T = W ( rmtan(+) + fcrc) …………………….... 4.6
With the use of a well-lubricated bearing, the frictional force, fc at the collar
will be neglected, thus, the quantity fcrc will be zero. Hence, the equation becomes;
T = W rmtan(+) ………………….……4.7
T = Frm …………………....….4.8
where: rm = Dm ……………………....4.9
2
m = 54
2
= 27mm
T =2.059 x 103 x 27 x 10-3
= 55.59Nm
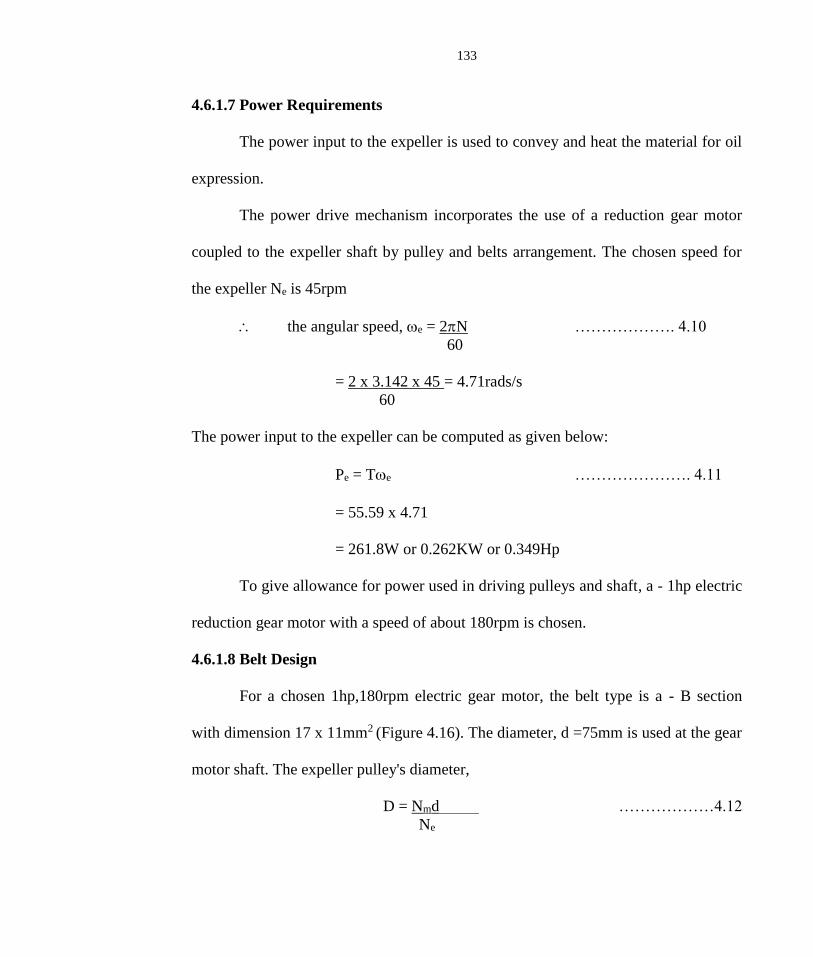
133
4.6.1.7 Power Requirements
The power input to the expeller is used to convey and heat the material for oil
expression.
The power drive mechanism incorporates the use of a reduction gear motor
coupled to the expeller shaft by pulley and belts arrangement. The chosen speed for
the expeller Ne is 45rpm
the angular speed, e = 2N ………………. 4.10
60
= 2 x 3.142 x 45 = 4.71rads/s
60
The power input to the expeller can be computed as given below:
Pe = Te …………………. 4.11
= 55.59 x 4.71
= 261.8W or 0.262KW or 0.349Hp
To give allowance for power used in driving pulleys and shaft, a - 1hp electric
reduction gear motor with a speed of about 180rpm is chosen.
4.6.1.8 Belt Design
For a chosen 1hp,180rpm electric gear motor, the belt type is a - B section
with dimension 17 x 11mm2 (Figure 4.16). The diameter, d =75mm is used at the gear
motor shaft. The expeller pulley's diameter,
D = Nmd ………………4.12
Ne
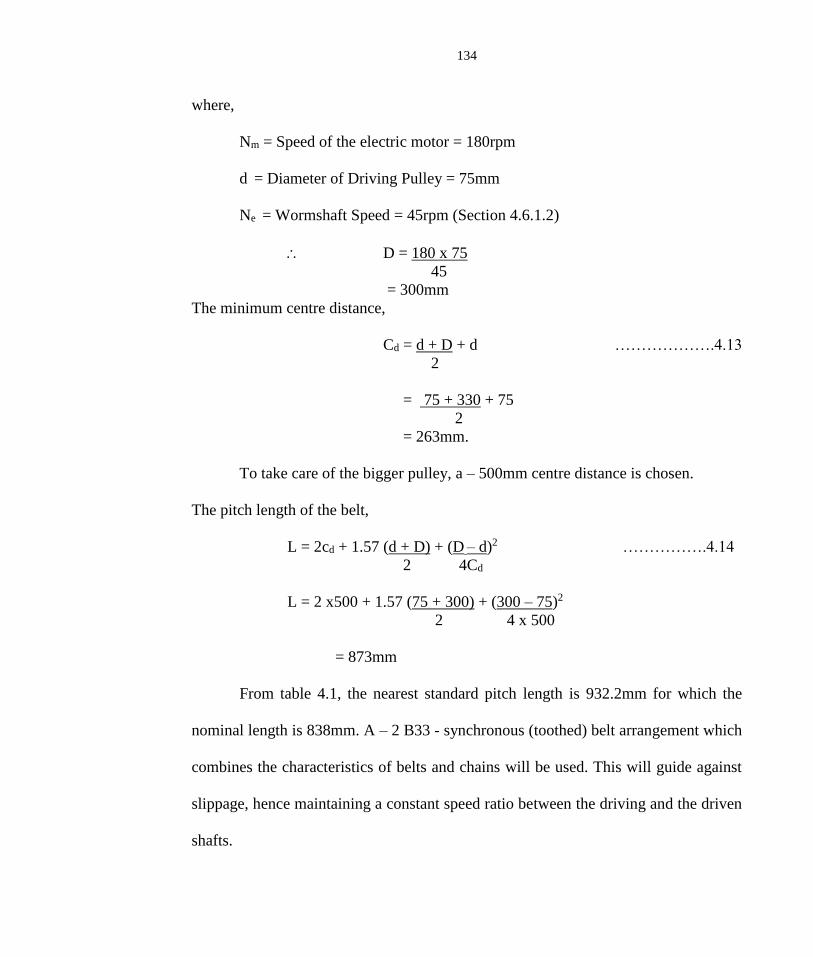
134
where,
Nm = Speed of the electric motor = 180rpm
d = Diameter of Driving Pulley = 75mm
Ne = Wormshaft Speed = 45rpm (Section 4.6.1.2)
D = 180 x 75
45
= 300mm
The minimum centre distance,
Cd = d + D + d ……………….4.13
2
= 75 + 330 + 75
2
= 263mm.
To take care of the bigger pulley, a – 500mm centre distance is chosen.
The pitch length of the belt,
L = 2cd + 1.57 (d + D) + (D – d)2 …………….4.14
2 4Cd
L = 2 x500 + 1.57 (75 + 300) + (300 – 75)2
2 4 x 500
= 873mm
From table 4.1, the nearest standard pitch length is 932.2mm for which the
nominal length is 838mm. A – 2 B33 - synchronous (toothed) belt arrangement which
combines the characteristics of belts and chains will be used. This will guide against
slippage, hence maintaining a constant speed ratio between the driving and the driven
shafts.

135
Figure 4.16: Effective Power of Belts as a Function of RPM of Small Sheaves
Source: Mubeen, 1998

136
Table 4.1: Standard V – Belts Pitch Lengths
Nominal Length Standard Pitch Length, mm (inches)
mm (inches) ___________________________________________________
A – Section B – Section C – Section
_____________________________________________________________________
660 (26) 696 (27.4) ------- --------
787 (31) 823 (32.4) ------- --------
838 (33) 874 (34.4) ------- --------
889 (35) 925 (36.4) 932.2 (36.7) --------
965 (38) 1001 (39.4) 1008.4 (39.7) --------
1067 (42) 1102 (43.4) 1110 (43.7) --------
1168 (46) 1204 (47.4) 1212 (47.7) --------
1219 (48) 1252 (49.4) -------- --------
1295 (51) 1331 (52.4) 1339 (52.7) 1351 (53.2)
1295 (53) 1382 (54.4) 1389 (54.7) --------
1397 (55) 1433 (56.4) 1440 (56.7) --------
1524 (60) 1561 (61.4) 1567 (61.7) 1580 (62.2)
1575 (62) 1610 (63.4) 1618 (63.7) --------
1625 (64) 1661 (65.4) 1669 (65.7) --------
1727 (68) 1762 (69.4) 1770 (69.7) 1783 (70.2)
1905 (75) 1941 (76.4) 1948 (76.7) 1961 (77.2)
1981 (78) 2017 (79.4) 2024 (79.7) --------
2032 (80) 2067 (81.4) -------- --------
2057 (81) -------- 2101 (82.7) 2113 (83.2)
2108 (83) 2144 (84.4) 2151 (84.7) --------
2159 (85) 2195 (86.4) 2202 (86.7) 2215 (87.2)
2286 (90) 2322 (91.4) 2329 (91.7) 2342 (92.2)
2438 (96) 2474 (97.4) -------- 2499 (98.2)
2464 (97) 2499 (98.4) 2507 (98.7) --------
2667 (105) 2702 (106.4) 2710 (106.7) 2723 (107.2)
2845 (112) 2880 (113.4) 2888 (113.7) 2901 (114.2)
3048 (120) 3084 (121.4) 3091 (121.7) 3104 (122.2)
Source : Mubeen, 1998.

137
4.6.1.9 Determination of Tensions in the Belt
Figure 4.17 shows the belt geometry and according to Hall et.al. 1980, the
angle of wrap
= 180 2sin-1{(R - r)/C} (3.19)
where :
R = radius of the larger pulley =150mm
r = radius of the smaller pulley = 37.5mm
C = centre distance = 500mm
= 180 + 2sin-1{(150 – 37.5)/500}= 206deg. = 3.6rad
and = 180 - 2sin-1{(150 – 37.5)/500}= 154deg. = 2.7rad.
To obtain T and T, the following equations are solved simultaneously :
(T - T) V = P -----------------3.20
and T - mv = e sin()
………………3.21
T - mv
where :
T = tension in the tight side
T = tension in the slack side
m = bte
b = belt width = 17mm
t = belt thickness = 11mm
e = belt density 970kg/m3 for leather belt
m = 17 x 11 x 10-3 x 970 = 0.18kg/m

138
Figure 4.7: Geometry of Belt Drive
D
d
R
r
C

139
= coefficient of friction between belt
= (0.15 for leather belt on steel )
v = belt velocity = r = 2rNm/ 60 m/s
=2x 3.142 x 37.5 x 10-3 x 180
60
= 0.71m/s
= 40deg. (most common angle of groove)
For small pulley, e
sin()
= e 0.15 x 2.7/ sin 20 = 3.27
and For big pulley, e
sin()
= e 0.15 x 3.6/ sin 20 = 4.80
The pulley with smaller value governs the design. In this case, the smaller
pulley governs the design.
T - mv = 3.27
T - mv
T − 0.18 x 0.7162 = 3.27
T − 0.18 x 0.7162
T − 0.093 = 3.27 T − 0.302
3.27 T − T =0.302 −0.093
3.27 T − T = 0.209 ……………..3.23
But Power (Kw) = (T − T )V ……………..3.24
P = 1Hp = 0.746KW
V = 0.71m/s
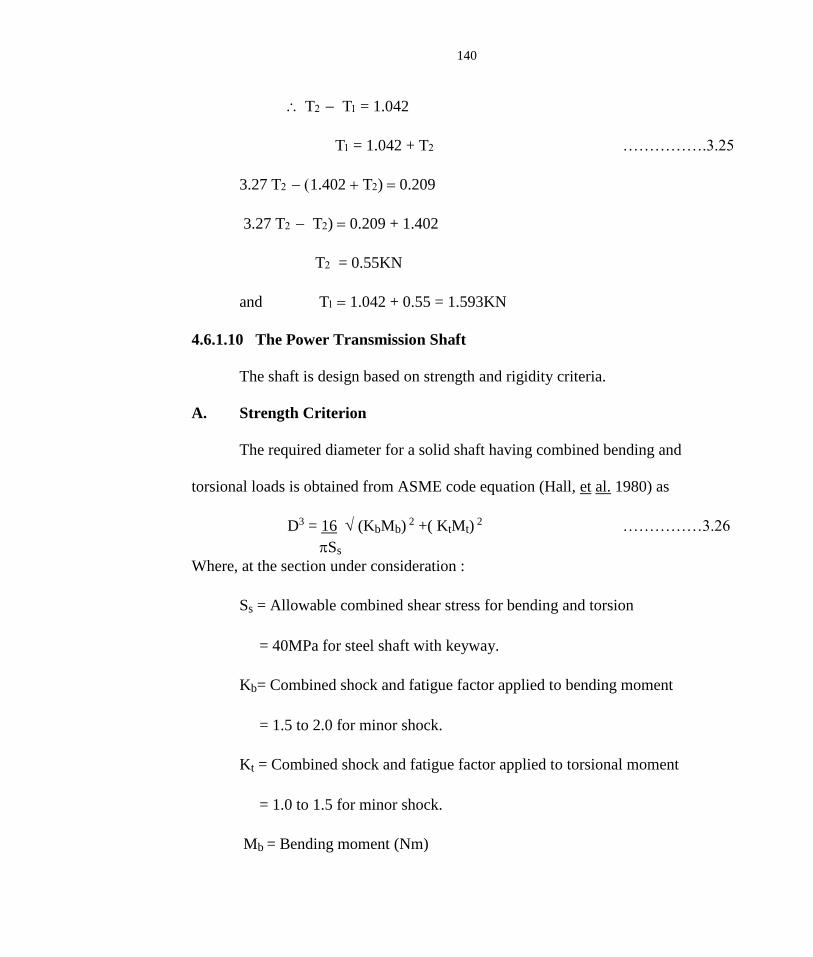
140
T − T = 1.042
T = 1.042 + T …………….3.25
3.27 T − (1.402 + T) = 0.209
3.27 T − T) = 0.209 + 1.402
T = 0.55KN
and T = 1.042 + 0.55 = 1.593KN
4.6.1.10 The Power Transmission Shaft
The shaft is design based on strength and rigidity criteria.
A. Strength Criterion
The required diameter for a solid shaft having combined bending and
torsional loads is obtained from ASME code equation (Hall, et al. 1980) as
D3 = 16 (KbMb) 2 +( KtMt) 2 ……………3.26
Ss
Where, at the section under consideration :
Ss = Allowable combined shear stress for bending and torsion
= 40MPa for steel shaft with keyway.
Kb= Combined shock and fatigue factor applied to bending moment
= 1.5 to 2.0 for minor shock.
Kt = Combined shock and fatigue factor applied to torsional moment
= 1.0 to 1.5 for minor shock.
Mb = Bending moment (Nm)

141
Mt = Torsional moment (Nm) = 55.59Nm (section 4.6.1.5)
D = Diameter of solid shaft (m).
The bending load is due to the weight of the pulley, the summation of
tensions on the belts acting vertically downward, and the weight of the threaded
shaft as shown in Figure 4.18.
The shaft is supported at point A and C by two bearings. The reactions RA and
Rc at the two supports are determined as follows :
RA + Rc = W s + ( T 1 + T 2) + W p ……………3.27
where : W s = weight of threaded shaft =50N (preliminary survey)
T 1 + T 2 = sum of tensions on vertical belts = 1030N (section 4.6.1.8)
W p = weight of pulley = 50N (preliminary survey)
RA + Rc = 50 + 2144 +50
RA + Rc= 2244
Taking moment about A,
Rc (0.485) = 50( 0.3025) + 2194(0.605)
Rc = 1343N
RA = 2244 – 1343 = 902N
The shear force and bending moment diagrams are shown in Figure 4.19. The
maximum bending moment occurs at B and it is 273Nm.

142
Ws T1+T2+Wp
RA RC
Figure 4.18: Bending Loads on the Wormshaft
0.3025m 0.1825m 0 120m
0.1825m

143
Figure 4.19: Shear Force and Bending Moment Diagrams
A
B
C
D
50N
1342N
2194N
902N
0.3025m 0.1825m 0.1200m
S. F.
B. M.
274Nm
263Nm
902N
50N
1342N
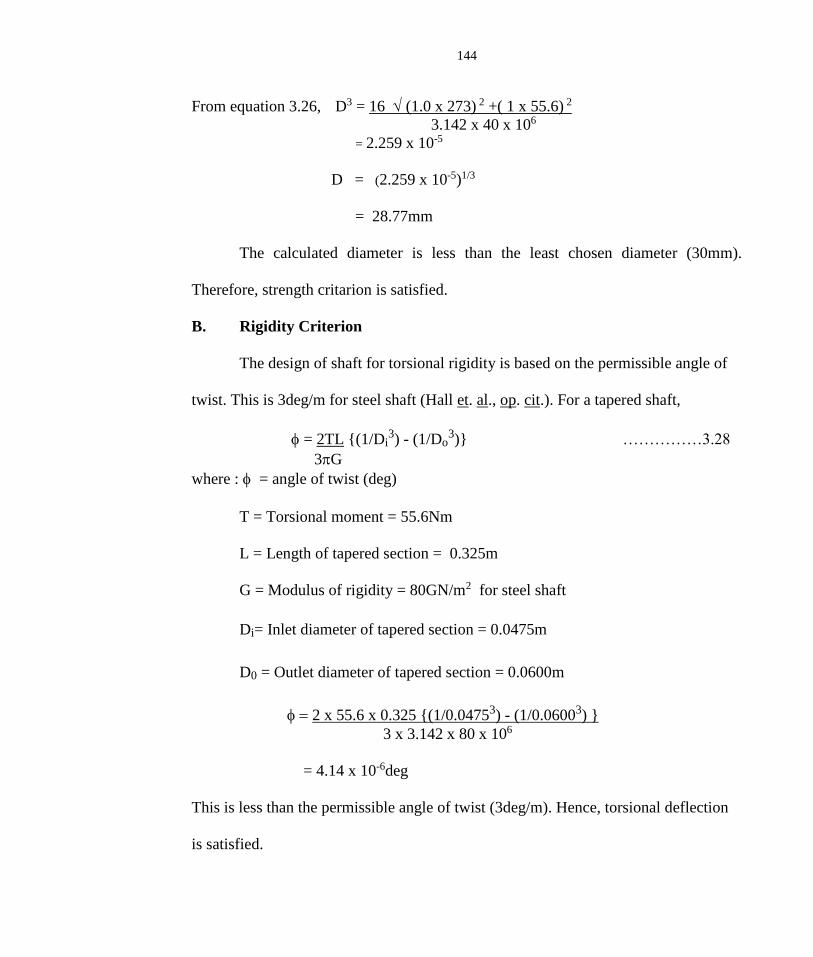
144
From equation 3.26, D3 = 16 (1.0 x 273) 2 +( 1 x 55.6) 2
3.142 x 40 x 106
= 2.259 x 10⁻⁵
D = (2.259 x 10⁻⁵)1/3
= 28.77mm
The calculated diameter is less than the least chosen diameter (30mm).
Therefore, strength critarion is satisfied.
B. Rigidity Criterion
The design of shaft for torsional rigidity is based on the permissible angle of
twist. This is 3deg/m for steel shaft (Hall et. al., op. cit.). For a tapered shaft,
= 2TL {(1/Di3) - (1/Do
3)} ……………3.28
3G
where : = angle of twist (deg)
T = Torsional moment = 55.6Nm
L = Length of tapered section = 0.325m
G = Modulus of rigidity = 80GN/m2 for steel shaft
Di= Inlet diameter of tapered section = 0.0475m
D0 = Outlet diameter of tapered section = 0.0600m
= 2 x 55.6 x 0.325 {(1/0.04753) - (1/0.06003) }
3 x 3.142 x 80 x 106
= 4.14 x 10⁻⁶deg
This is less than the permissible angle of twist (3deg/m). Hence, torsional deflection
is satisfied.
145
4.6.2 Oil Filter Press
4.6.2.1 Design Conception
The proposed oil filter press has the following conceived specifications:
• Plate and frame dimensions = 300 X 300 X 25mm3
• Number of plates and frames = 6 each
• Oil pump power requirement = 1hp at 180rpm
4.6.2.3 Design Analyses
At the beginning of plate and frame filter press operation, the whole pressure
drop available is across the medium itself since as yet no cake is formed. Thus,
Darcy's basic filration equation can be applied.
Q = KAP ...........................…………….4.12
L
However, as the cake becomes thicker and offers more resistance to the flow,
the pressure developed by the pump becomes a limiting factor and the filtration
proceeds at a nearly constant pressure (Tiller et al., 1979; Fellows, 1988). A modified
Darcy's equation for constant pressure which gives a straight-line equation as quoted
by Olayanju, 1999 is then applied.
tA = rVcV + rL ...............................…..…4.13
V 2P A P
Where:
Q (m3/s) = Oil flow rate
K = Permeability of the bed

146
A (m2) = Face area of the filter medium
V (m3) = Volume of filtrate
Vc = Fractional volume of filter cake in feed liquid volume, V
(Ns/m2) = Viscosity of the oil
r (m-2
) = Specific resistance of the filter cake
L (m) = Equivalent thickness and initial cake layer
P (KN/m2) = Pressure drop which is a function of pump characteristics
t (s) = Filtration time
A model filtration experiment was carried out on a filter press area 0.0929m2
to which slurry is fed at a constant rate. The result is as shown in table 4.2.
Table 4.2: Determination of the Average Oil Volumetric Flow Rate
_____________________________________________________________________
Time Volume of V t
t (minute) Filtrate, V (l) A V/A
10 18 193.76 0.052
20 30 322.93 0.062
30 39 419.82 0.071
40 48 516.68 0.071
50 54 581.27 0.086

147
From the graph of t/ (V/A) against V/A (Figure 4.20), the slope is 0.0123 and
the intercept is 0 42. These are equivalent to rVc/2P and rL/P from equation 4.13
respectively. Substituting for this in the equation
tA/V =0.0123 (V/A) + 0.42
Rewriting the equation gives a quadratic equation in V/A as
t = 0.0123 (V/A)2 + 0.42(V/A) - t =0
Substituting t = 60 0.0123 (V/A)2 + 0.42(V/A) - 60 = 0
Therefore, V = -0.42 + 0.422 + 4 x 5 x 0.0123 x 60
A 2 ( 0.0123 )
V/A = 54.83m
For 300mm-filter plate, effective filtration area is 0.096m2 for cast iron.
V/A = 54.83 x 0.096m2 = 52.63 litres ~ 50litres/hour.
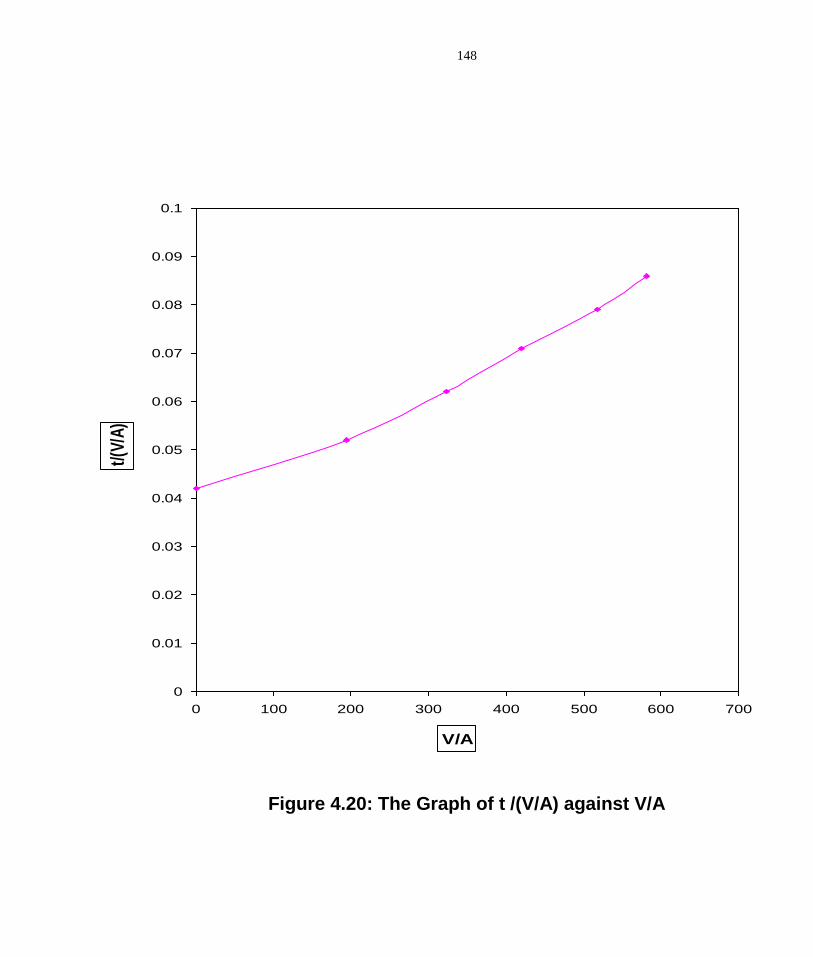
148
Figure 4.20: The Graph of t /(V/A) against V/A
0
0.01
0.02
0.03
0.04
0.05
0.06
0.07
0.08
0.09
0.1
0 100 200 300 400 500 600 700
V/A
t/(V
/A)

149
4.7 Machinery Development
The designed oil expeller and filter press were fabricated based on the
reported design specifications. Appendix five shows the orthographic and isometric
projections; exploded view and detailed drawings of parts of the machines. The part
numbers used in the following description are indicated in the appendix together with
their respective materials of construction.
4.7.1 Oil Expeller
The expeller consists of seven main parts namely: - the feeding assembly, the
expression barrel, the worms and wormshaft assembly, the cone mechanism, the
power transmission unit, the oil and cake troughs and the main frame (Plate 15 and
Appendix A5-1). The salient features of the fabricated oil expeller are:
• It has been developed to meet an increasing demand for simple, small capacity
expeller suitable for village / cottage industry or on – farm applications.
• High compression ratio (little or no clearance between the barrel and wormshaft)
which enables squeezing of oil out of the crushed seed.
• Utilization of special wormshaft with reverse worm.
• The design enables cold expression of beniseed without size reduction or
coooking operation.
150
4.7.1.1 The Feeding Assembly
It consists of a hopper, which is mounted on the mainframe of the expeller
(Appendix A5-1, Part no 1). The oilseed flows down the feed hopper through a
sliding gate provided on the hopper. The sliding gate is adjusted manually to control
feed rate.
4.7.1.2 The Expression Chamber
The expression chamber is made of 60mm diameter, 300mm long and
12.7mm thick stainless steel pipe. This was splitted into two equal halves viz: top and
bottom parts (Appendix A5-3, Part nos. 3 and 7). A slot was made at the left end of
the top face (Appendix A5-3). 30 – 1.0mm perforations are provided on the bottom
part of the barrel (Appendix A5-3) so that expressed oil can drain through. The two
halves are bolted together using 6 – 12.5mm bolts and nuts. The expression chamber
is enclosed in a cover to prevent expressed oil from coming in contact with dust and
foreign materials.
4.7.1.3 Worms and Wormshaft Assembly
The continuos wormshaft designed for other oilseeds was replaced with a
special wormshaft fitted with six worms of different pitches (Plate 15 and Appendices
A5-1 to A5-4). The worm flight design along pressure and discharge section is such
that the material does not wrap around more than 3200 (Appendix A5-5). This leaves
an axial gap in the flight that enables the compressed material to slide in either
direction relative to velocity generated by worm pitch. This balances the pressure
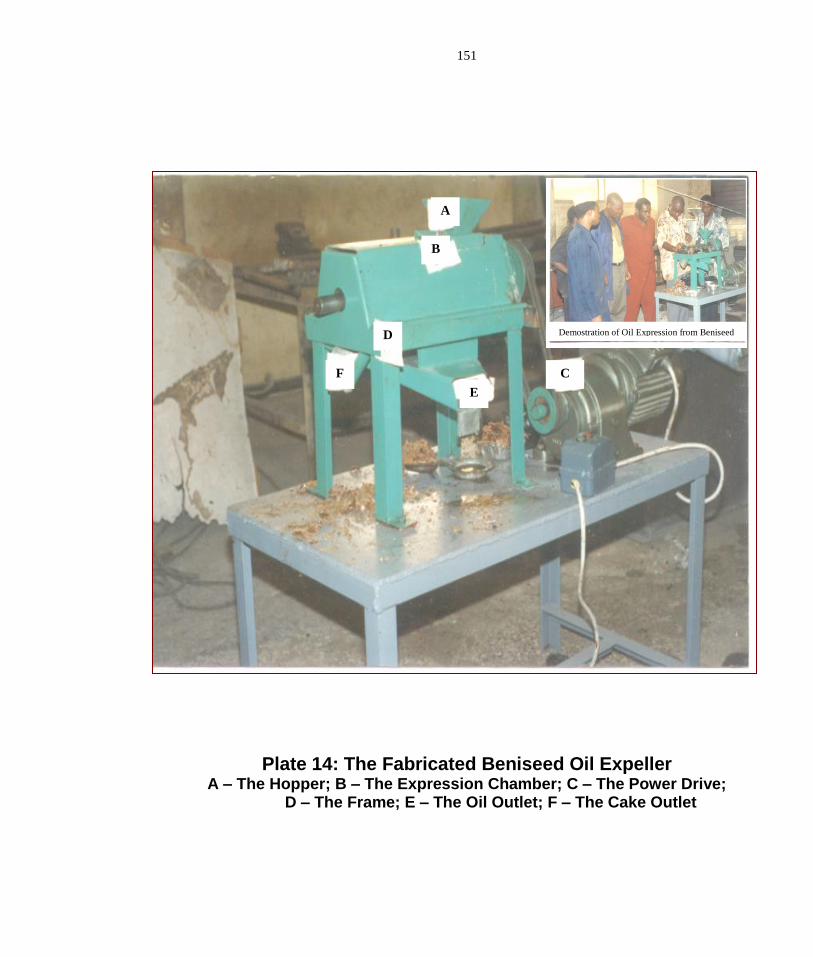
151
Plate 14: The Fabricated Beniseed Oil Expeller A – The Hopper; B – The Expression Chamber; C – The Power Drive;
D – The Frame; E – The Oil Outlet; F – The Cake Outlet
Demostration of Oil Expression from Beniseed
A
B
C
D
E
F

152
over a group of worm section and reduces a tendency of material to lock in individual
section and rotate with the shaft.
The configuration of the worm section is such that the volume displacement at
the feed end of the press is greater than the discharge end. The whole assembly
rotates in the barrel. The worms have a dual role of conveying the oilseeds through
the barrel and at the same time exerting pressure on the material. Besides increasing
the pressure in the barrel, the shear action on the barrel breaks the oilseeds into
smaller particles.
The modified worms of the expeller have flight leading to discharge
end. In the reverse worm set-up, one of the original worms in the middle of the shaft
is replaced by another of worm of similar dimensions but with flight running in the
opposite direction i.e towards the feed end. Due to pressure created by the worms and
choke, the oil flows out of the oil – solid matrix through the holes in the cage bar.
4.7.1.4 Choke Mechanism
The choke mechanism consists of a revolving cone, sleeve and a check nut (Appendix
A5-6). The check nut is mounted on the thread of the worm shaft and rotates with it.
However, it can be adjusted manually to move on the wormshaft axially during the
setting of the cone position. The annular space between the revolving cone and the
sleeve (mounted on the discharge end support) controls the final adjustment of
pressure in the barrel and the ultimate cake thickness. The cake breakers are fixed on
the cone end to cut the cake into smaller sizes for successful crushing.
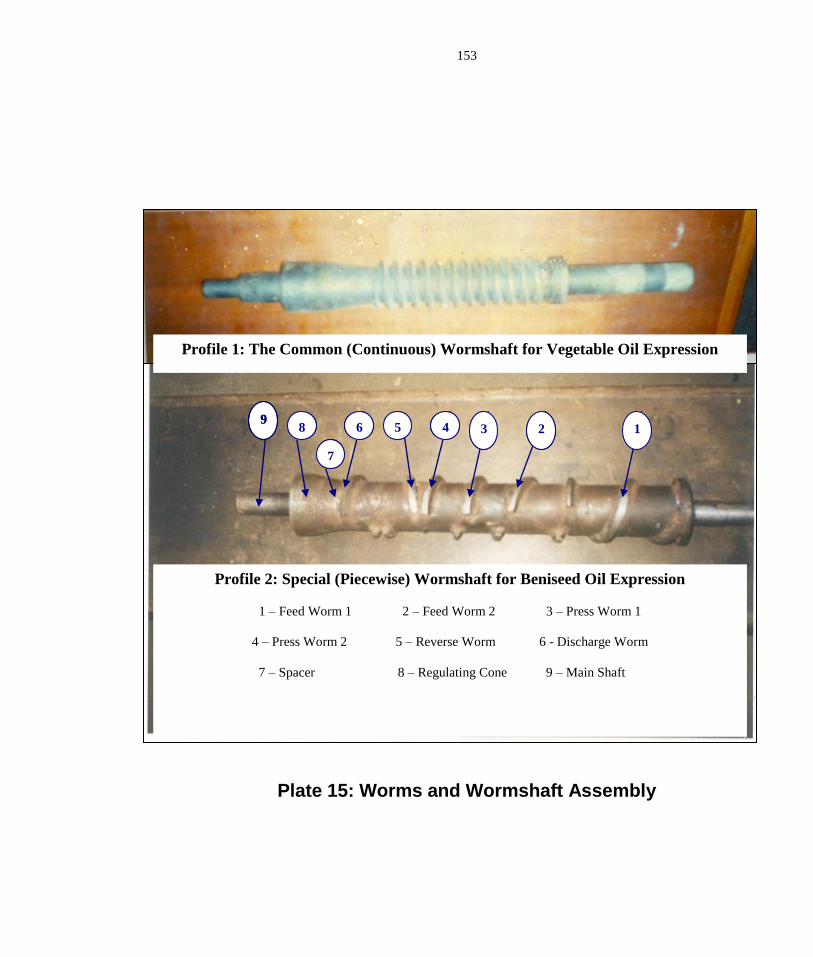
153
Plate 15: Worms and Wormshaft Assembly
Profile 1: The Common (Continuous) Wormshaft for Vegetable Oil Expression
9 8 6 1 2 3 5 4
7
Profile 2: Special (Piecewise) Wormshaft for Beniseed Oil Expression
1 – Feed Worm 1 2 – Feed Worm 2 3 – Press Worm 1
4 – Press Worm 2 5 – Reverse Worm 6 - Discharge Worm
7 – Spacer 8 – Regulating Cone 9 – Main Shaft
2 3 4 9
5 6
7
8

154
4.7.1.5 Power Drive Unit
This consists of a - 1hp, 180rpm, 3-phase a.c motor, control panel with a
star/delta starter, a set of belts and pulleys. The desired speed was obtained by fixing
V-groove pulleys on the main shaft.
Power transmission accessories
A.C motor : 0.745kw
Voltage, 3-phase :440v
Ampere Rating 24A
Electric Motor Speed : 180rpm
Wormshaft Speed :45rpm
Diameter of motor pulley : 75mm
Diameter of main expeller pulley : 300mm
Overall Dimensions
Length : 1000mm
Width : 720mm
Height : 1500mm
4.7.1.6 Oil and Cake Troughs
The oil and cake trough (Appendix A5-1, Part nos. 10 and 11) are made of
gauge 13 (1.2mm) galvanized sheet metal. They are inclined at an angle of 60 degrees
to the horizontal so as to allow for free flow of oil and cake.

155
4.7.1.7 The Mainframe
It is a table-type frame which supports the barrel, clamping bars, worm
assembly, gear drive, feed end support, die end support, bearings and feeder
assembly. It consists of a base and supports, which are made from mild steel
(Appendix A5-1).
4.7.2 Oil Filter Press
The filter press is made of nine main components viz.; the filter plates, the end
plates, the filter cloth, the screw shaft and follower, the operating handle, the standing
rame, the filter pump drive and the piping materials (Plate 16 and Appendices A5).
The filtration chamber is made of 12-filter plates (6 solid and 6 Hollow) cast,
machined and arranged on a framework. Each solid plate has grooves on its surfaces
for oil drainage after passing through the filter cloth (Appendix A5-9). A-4hp electric
gear pump forces the oil into the press.
4.7.2.1 The Filter Plates and Frames
The filter plates was cast and the border had a thin - central portion, the
surface of which is in the form of ridges or designs in relief, between which the oil
can flow in spite of the pressure. This tends to force the cloth against the plate. There
are 6 of them in all each having dimension (300 x 300 x 25) mm3 (Appendix A5-9).
The frame has a similar machined border, but its interior is open. They are also 6 in
number.

156
Plate 16: The Fabricated Oil Filter Press
Final
Collection
Point
Recycling
Line
OilTaps

157
4.7.2.2 Supporting Bars
The plates and frames are supported by two steel bars which also serve as
cross braces and absorb tensile force produced between the two end members by the
pressure exerted in closing the press (Appendix A5-8, Part no 5).
4.7.2.3 Other Components
There is an electric motor and a gear pump coupled together with the aid of
sprockets and chain. The are six taps on the filter plates discharging oil into a
longitudinal trough through which the clear filtered oil is removed. Each face of every
plate is covered with a filter cloth to create a series of cloth-walled chambers into
which slurry can be forced under pressure.

158
4.8 Cost Estimation of the Developed Beniseed Oil Plant
The developed plant is made of two major equipment viz: the oil
expeller and the oil filter press. The cost of materials for the constuction of
these equipment are as shown in tables 4.3 and 4.4.
Table 4.3: Bill of Materials for the Construction of the Designed Oil Expeller
_______________________________________________________________
Qty. Material Specifications Rate Amount
(#) (#)
_______________________________________________________________
MECHANICAL COMPONENTS
6 Angle Iron One Length, 50mm x 50mm2 800 4800
1 Galvanized Metal Sheet 240cm x 120cmx 2mm 5200 5200
1 Mild Steel Solid Shaft 100cm long, 65mm 5000 5000
6 Mild Steel Bar 10mm x 10mm x 1m 400 2400
1 Hollow Pipe 80mm x 25mm thick x 50cm long, 1000 1000
1 Driven Pulley 75mm Double Groove 500 500
1 Driving Pulley 300mm Double Groove 2200 2200
2 Pillow Bearings 30mm Inner Bore 3200 6400
2 Leather Belts B35; V – Type 800 1600
1 Mild Steel Plate 120cm x 60cm x 5mm 5000 5000
1Pkt. Mild Steel Electrode Gauge 10 1200 1200
1Pkt. Mild Steel Electrode Gauge 12 900 900

159
Qty Material Specifications Rate (#) Amount (#)
24 Bolts & Nuts M10 Hex. (50mm) 25 600
4 Cutting Stones 300mm Size 180 180
2 Grinding Stones 300mm Size 150 150
2 Hack Saw Blades 300mm Long 120 240
4 Drill Bits 3, 5, 7 & 10mm 110 440
______
Sub Total #38,440
ELECTRICAL COMPONENTS
1 Electric Gear Motor 3 – Phase, 2Hp @ 180rpm 30000 30000
1 Motor Starter 2 Buttons (ON & OFF) 5000 5000
1 Switch Gear Box 30Amp. (MEM) 5000 5000
15Pcs. PVC Cables 3 - Core X 6mm X 1m 60 900
_______
Sub Total #40,900
Machining of Wormshaft and Barrel 15000
Fabrication (Bending, Rolling, Shearing) 5000
_________________
TOTAL #99,340

160
Table 4.4: Bill of Materials for the Construction of the Designed Oil Filter Press
Qty Material Specifications Rate Amount
(#) (#)
______________________________________________________________
COMPONENTS TO BE CAST AND MACHINED
6 Solid Plates 30cm x 30cm x 25mm 4500 27000
6 Spacing Plates 30cm x 30cm x 25mm 2500 15000
2 End Plates 30cm x 30cm x 50mm 3500 7000
1 Back Plate 30cm x 30cm x 50mm 3500 3500
1 Screw End Shaft/Nut 100cm long, 50mm 5000 5000
2 Supporting Rods 100cm long, 50mm 1000 1000
Sub Total #58,500
FABRICATION MATERIALS
3 Angle Iron One Length, 50mm x 50mm 1500 1500
1 Galvanized Metal Sheet 240cm x 120cm x 1.8mm 3800 3800
2Pkt. Mild Steel Electrodes Gauges 10 & 12 2100 4200
12 Bolts & Nuts M10 Hex. (50mm) 25 300
4 Cutting Stones 300mm Size 180 180
2 Grinding Stones 300mm Size 150 150
2 Hack Saw Blades 300mm Long 120 240
4 Drill Bits 3, 5, 7 & 10mm 110 440
_______
Sub Total #11,170

161
Qty Material Specifications Rate (#) Amount (#)
ELECTRICAL COMPONENTS
1 Filter Pump Gear; 2Hp @ 180rpm 26000 26000
1 Motor Starter 2 Buttons - ON & OFF 5000 5000
1 Switch Gear Box 20Amp. (MEM) 3600 3600
10Pcs. PVC Cables 3 - Core X 6mm X 1m 60 600
Sub Total #35,200
ACCESSORIES
1 Pressure Gauge 0 – 100Psi 6000 6000
6 Outlet Taps 25mm Size 1000 6000
6 Connection Joints (Circular, Elbow, Tee) 500 3000
2 Storage and Distribution Tanks 150 Litres (Plastic) 3100 6200
4yrds. Filter Cloth 1200 4800
_______
Sub Total #26,000
Machining of Plates and Screw 7500
Fabrication (Bending, Rolling, Shearing) 2500
TOTAL #140,870

162
4.9 Technical Information on the Fabricated Oil Processing Plant
This section is intended for potential oil millers wishing to take up the
plantas a means of extracting oil for a cottage-scale production. The expeller
considered has a capacity of 10 to 25kg/h. Therefore by working only one day
shift (8hours) which is normal for such cottage plants, the units can process
between 80 and 200kg of raw beniseed per day. In a few cases, such units do
work 2 or 3 shifts per day, and may then process up to half a tonne (I.L.O.,1984).
A. Equipment Requirement
The following equipment will be needed for a plant processing
200kg/h of raw beniseed per eight – hour working day
• One seed cleaner of the air – screen type (50kg/h);
• One seed dehuller of the centrifugal/seratted teeth type (10kg / batch);
• One seed separator (10kg / batch);
• One oil expeller (25kg/h);
• One oil filter Press (50lit/h);
• Movable scale, capable of weighing up to 50kg;
B. Labour Requirement
A family of five people can suffice for the running of the plant. The
mill owner should have necessary skills for the running of the equipment, as
well as maintaining and repairing them.

163
C. Layout of Operations
This scale is typically a family enterprise. Therefore, the floor plan in
figure 4. 26 is only an indicative of good practise.
D. Getting the Equipment Set for Use
• Install the equipment on level and clean environment.
• Make sure belt tensions are adequate.
• Check all bolts and nuts for tighness.
• Lubricate all moving parts.
• Clean all surfaces that may come in contact with oil or cake.
E. Operating the Equipment
• Press the green button to start the Equipment.
• Idle the expeller by circulating a small of the seeds untill the expeller’s
barrel is heated up.
• Pour cleaned and dehulled beniseed into the expeller at a regulated rate.
• Place containers at the troughs to collect oil and cake.
• When satisfied with the degree of expression and filtration, press the red
button to stop the equipment.
• Clean the equipment and the floor properly.
• Do not leave the machine uncleaned to avoid undesirable odour and visit
of flies.
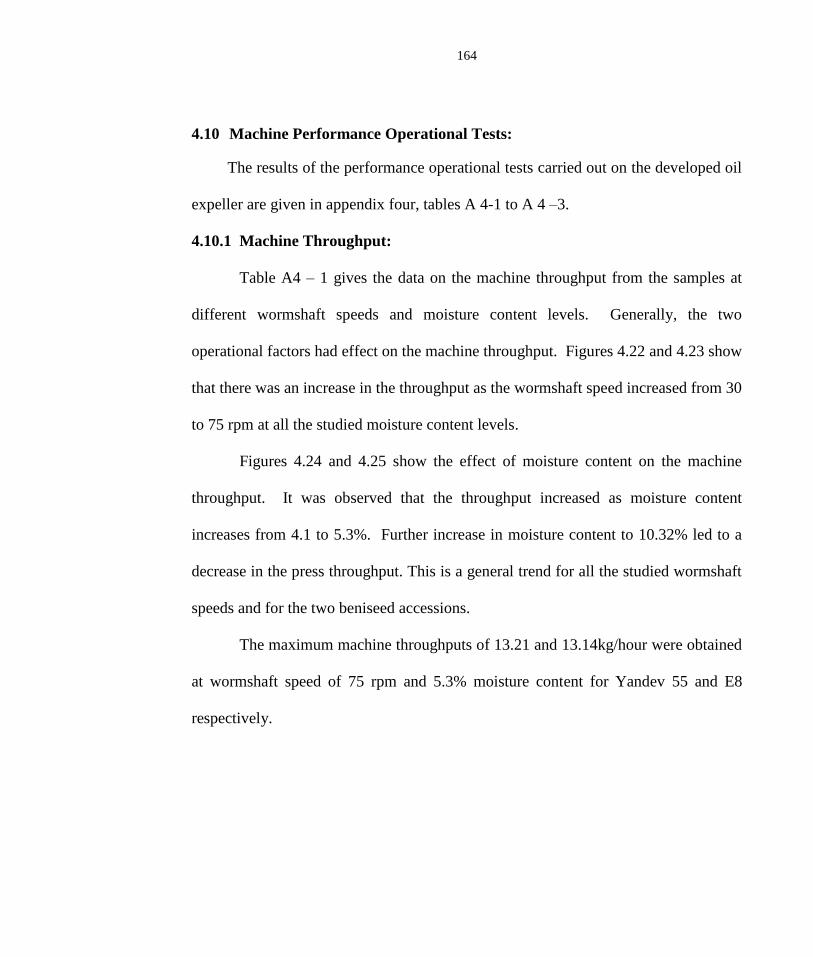
164
4.10 Machine Performance Operational Tests:
The results of the performance operational tests carried out on the developed oil
expeller are given in appendix four, tables A 4-1 to A 4 –3.
4.10.1 Machine Throughput:
Table A4 – 1 gives the data on the machine throughput from the samples at
different wormshaft speeds and moisture content levels. Generally, the two
operational factors had effect on the machine throughput. Figures 4.22 and 4.23 show
that there was an increase in the throughput as the wormshaft speed increased from 30
to 75 rpm at all the studied moisture content levels.
Figures 4.24 and 4.25 show the effect of moisture content on the machine
throughput. It was observed that the throughput increased as moisture content
increases from 4.1 to 5.3%. Further increase in moisture content to 10.32% led to a
decrease in the press throughput. This is a general trend for all the studied wormshaft
speeds and for the two beniseed accessions.
The maximum machine throughputs of 13.21 and 13.14kg/hour were obtained
at wormshaft speed of 75 rpm and 5.3% moisture content for Yandev 55 and E8
respectively.

165
Figure 4.22: Effect of Wormshaft Speed on Machine Throughput for Yandev – 55 Accession
YANDEV 55
9
9.5
10
10.5
11
11.5
12
12.5
13
13.5
0 10 20 30 40 50 60 70 80
Wormshaft Speed, rpm
Mac
hine
Thr
ough
put,
kg/h
4.1 % Moisture Content 5.31 % Moisture Content
7.69 % Moisture Content 10.32 % Moisture Content

166
Figure 4.23: Effect of Wormshaft Speed on
E8
8
8.5
9
9.5
10
10.5
11
11.5
12
12.5
13
0 10 20 30 40 50 60 70 80
Wormshaft Speed, rpm
Ma
chin
e T
hro
ug
hp
ut,
kg
/h
4.1 % Moisture Content 5.31 % Moisture Content
7.69 % Moisture Content 10.32 % Moisture Content
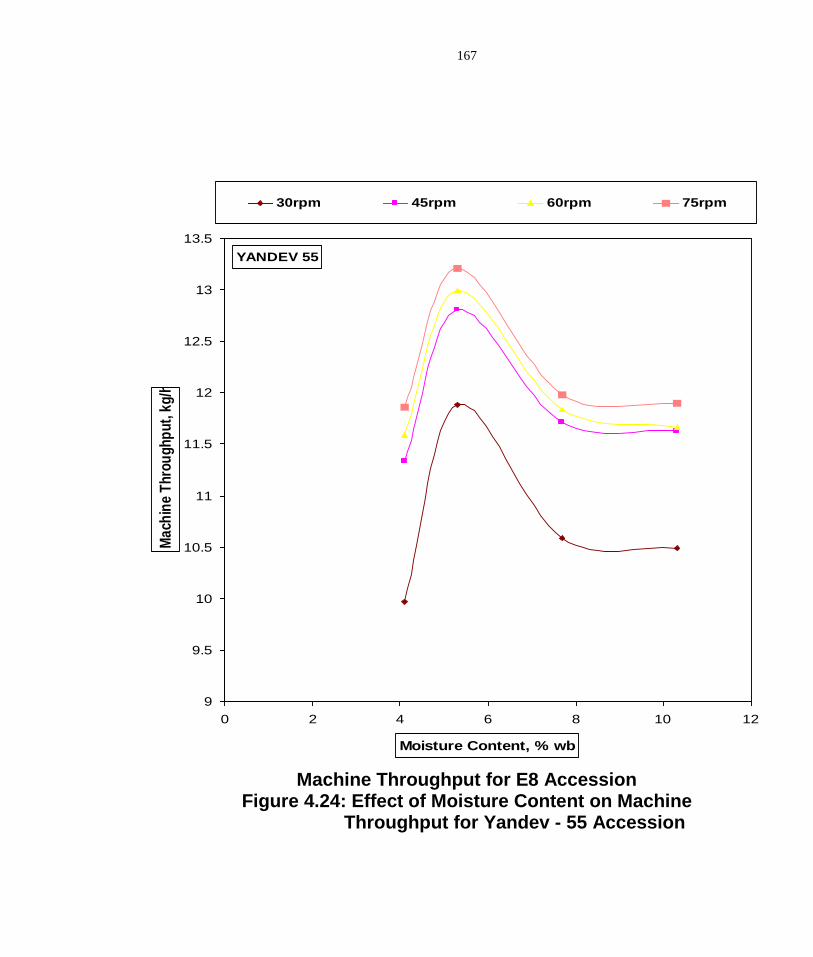
167
Machine Throughput for E8 Accession Figure 4.24: Effect of Moisture Content on Machine
Throughput for Yandev - 55 Accession
YANDEV 55
9
9.5
10
10.5
11
11.5
12
12.5
13
13.5
0 2 4 6 8 10 12
Moisture Content, % wb
Ma
chin
e T
hro
ug
hp
ut,
kg
/h
30rpm 45rpm 60rpm 75rpm

168
Figure 4.25: Effect of Wormshaft Speed on Machine Throughput for E8 Accession
E8
8
8.5
9
9.5
10
10.5
11
11.5
12
12.5
13
0 2 4 6 8 10 12
Moisture Content, % wb
Ma
chin
e T
hru
og
hp
ut,
kg
/h
30rpm 45rpm 60rpm 75rpm

169
4.10.2 Oil Recovery:
The effect of wormshaft speed, moisture content and beniseed accession on oil
recovery is presented in table A4-2. The oil recovery from Yandev 55 increased with
increase in wormshaft speed from 30 to 45 rpm when the seed moisture content and
accession were kept constant (Figures 4.26 and 4.27).
A further increase in worm shaft speed to 75 rpm led to a decrease in oil
recovery. Moreover, at the initial /level of moisture content (i.e. at 4.1%), the rate of
increase in oil recovery with corresponding change in wormshaft was very sharp with
curvilinear relationship indicated on the graph. Also, a sharp increase in oil recovery
was observed between worm shaft of 30 and 45 rpm at all the studied moisture
contents.
The maximum oil recovery of 79.63% was observed at wormshaft speed of 45
rpm and 5.3% moisture content while the minimum of 32.47 was recorded at 75 rpm
and 10.32% moisture content. The same trend was obtained for E8 accession with a
maximum oil recovery of 74.28%.
The moisture content affected oil recovery at all the studied wormshaft speeds
for the two beniseed accessions as indicated in Figure 4.26. Oil recovery increased
with increase in moisture content of seed between the first (4.10%) and second
(5.30%) levels of moisture content and decreased with further increase in moisture
content of seed to the fourth (10.32%) level, for all wormshaft speeds and for the two
accessions (Figures 4.27 and 4.28).
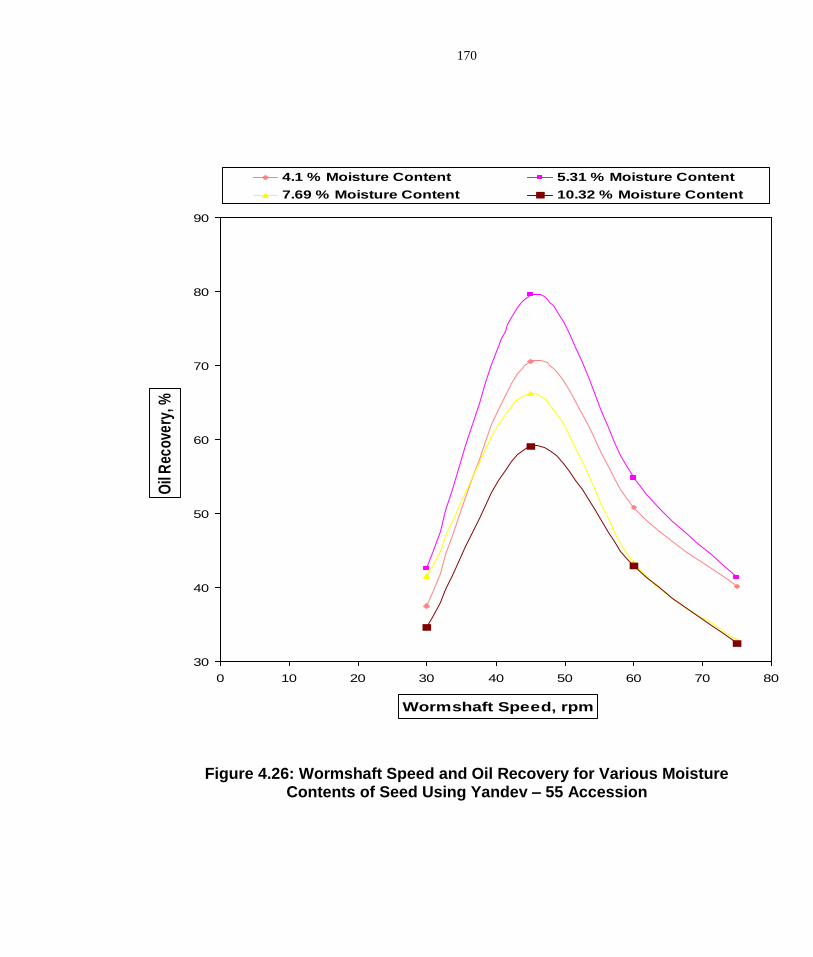
170
Figure 4.26: Wormshaft Speed and Oil Recovery for Various Moisture
Contents of Seed Using Yandev – 55 Accession
30
40
50
60
70
80
90
0 10 20 30 40 50 60 70 80
Wormshaft Speed, rpm
Oil
Rec
over
y, %
4.1 % Moisture Content 5.31 % Moisture Content
7.69 % Moisture Content 10.32 % Moisture Content
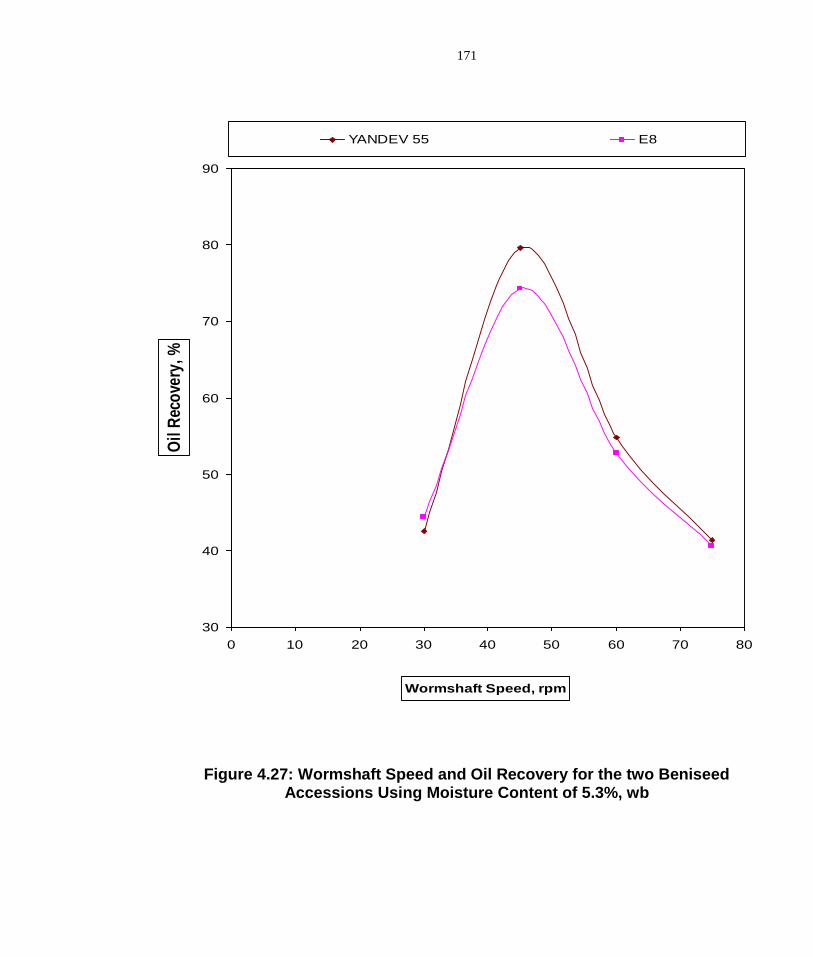
171
Figure 4.27: Wormshaft Speed and Oil Recovery for the two Beniseed Accessions Using Moisture Content of 5.3%, wb
30
40
50
60
70
80
90
0 10 20 30 40 50 60 70 80
Wormshaft Speed, rpm
Oil
Rec
ove
ry,
%
YANDEV 55 E8

172
Figure 4.28: Moisture Content and Oil Recovery for the two Beniseed Accessions Using Wormshaft Speed of 45rpm
50
55
60
65
70
75
80
85
0 2 4 6 8 10 12
Moisture Content, % wb
Oil
Rec
ove
ry,
%Yandev 55 E8
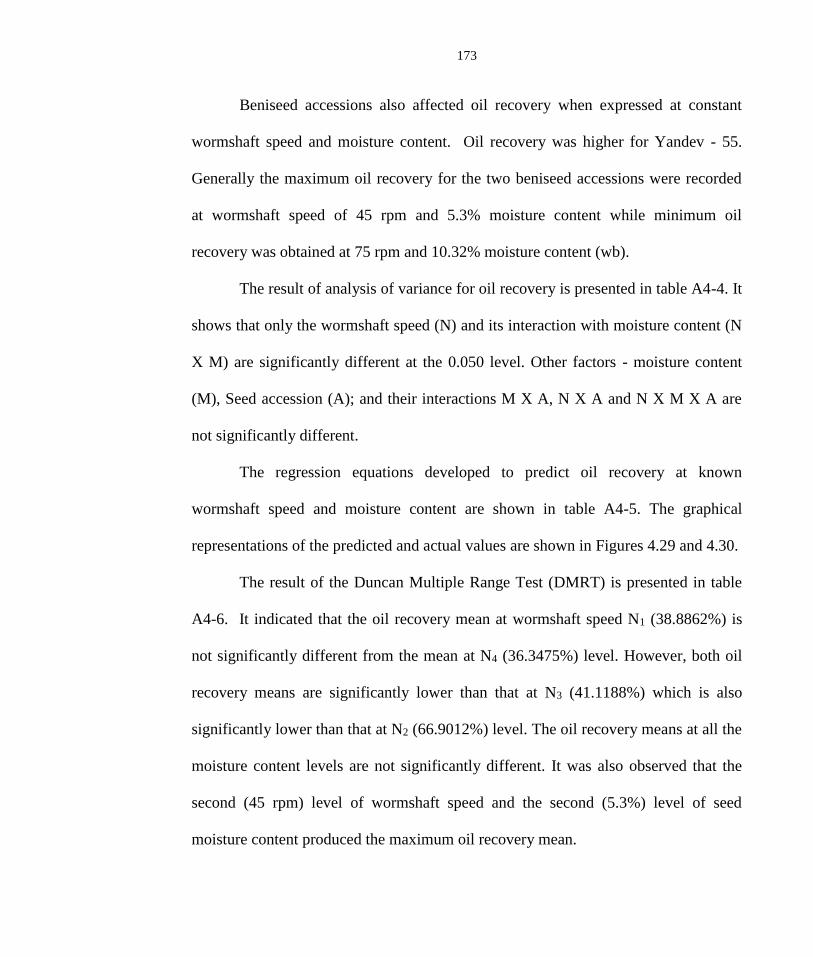
173
Beniseed accessions also affected oil recovery when expressed at constant
wormshaft speed and moisture content. Oil recovery was higher for Yandev - 55.
Generally the maximum oil recovery for the two beniseed accessions were recorded
at wormshaft speed of 45 rpm and 5.3% moisture content while minimum oil
recovery was obtained at 75 rpm and 10.32% moisture content (wb).
The result of analysis of variance for oil recovery is presented in table A4-4. It
shows that only the wormshaft speed (N) and its interaction with moisture content (N
X M) are significantly different at the 0.050 level. Other factors - moisture content
(M), Seed accession (A); and their interactions M X A, N X A and N X M X A are
not significantly different.
The regression equations developed to predict oil recovery at known
wormshaft speed and moisture content are shown in table A4-5. The graphical
representations of the predicted and actual values are shown in Figures 4.29 and 4.30.
The result of the Duncan Multiple Range Test (DMRT) is presented in table
A4-6. It indicated that the oil recovery mean at wormshaft speed N1 (38.8862%) is
not significantly different from the mean at N4 (36.3475%) level. However, both oil
recovery means are significantly lower than that at N3 (41.1188%) which is also
significantly lower than that at N2 (66.9012%) level. The oil recovery means at all the
moisture content levels are not significantly different. It was also observed that the
second (45 rpm) level of wormshaft speed and the second (5.3%) level of seed
moisture content produced the maximum oil recovery mean.

174
Figure 4.29: Actual and Predicted Plots of Oil Recovery at Different Wormshaft Speed Using Yandev - 55 at 5.3% Moisture Content
Predicted Equation : E = -0.0097N + 0.113N – 1.616N + 55.3
30
40
50
60
70
80
90
0 10 20 30 40 50 60 70 80
Wormshaft Speed, rpm
Oil
Rec
ove
ry,
%Actual Oil Recovery Predicted Oil Recovery

175
Figure 4.30: Actual and Predicted Plots of Oil Recovery atDifferent Moisture Content Using Yandev - 55 at Worm shaft Speed of 45 rpm.
Predicted Equation : E = -35.48M + 24.76M – 18.59M + 56.18
50
55
60
65
70
75
80
85
0 2 4 6 8 10 12
Moisture Content, % wb
Oil
Rec
ove
ry,
%
Actual Oil Recovery Predicted Oil Recovery

176
4.10.3 Oil and Cake Qualities
The relative density and the Free fatty acid (FFA) content of the expressed oil
and protein content of the produced cake from Yandev 55 and E8 at the optimum
condition of 45rpm and 5.3% moisture content were 0.919, 0.922, 0.84, 0.98, 58.50%
and 57.75% respectively. The effect of wormshaft speed and seed moisture content on
colour of oil, residual oil and moisture content of cake are presented in table A4-3.
The colour of the expressed oil darkened from light yellow to golden yellow
and finally to yellow as the wormshaft speed increases from 30 to 75rpm. The
intensity increased with an increase in moisture lost from beniseeds as the wormshaft
speed and seed moisture content increased.
The effect of moisture content on residual oil in cake is shown in figures 4.31
and 4.32 for the two accessions. Generally, the residual oil in the cake increased with
the increase in moisture content at all the wormshaft speeds and ranged from 14.43 to
43.54% and 17.73 to 43.88% for Yandev – 55 and E8 respectively.
The minimum residual oil in cake was obtained at 45rpm and at moisture
content of 5.3% for the two beniseed accessions. The foot formation was very high
(about 30%) at the initial wormshaft speed of 30rpm.
The cake moisture content increased with the increase of moisture addition
(Figures 4.33 and 4.34). The minimum cake moisture of 3.20 and 3.39 were obtained
at wormshaft speed of 45rpm and 4.1% seed moisture content for the two accessions.

177
Figure 4.31: Effect of Moisture Content on Residual Oil in Y– 55 Cake
YANDEV 55
0
5
10
15
20
25
30
35
40
45
50
4.1 5.31 7.69 10.32
Moisture Content, % wb
Re
sid
ual
Oil
in
Cak
e, %
30rpm 45rpm 60rpm 75rpm
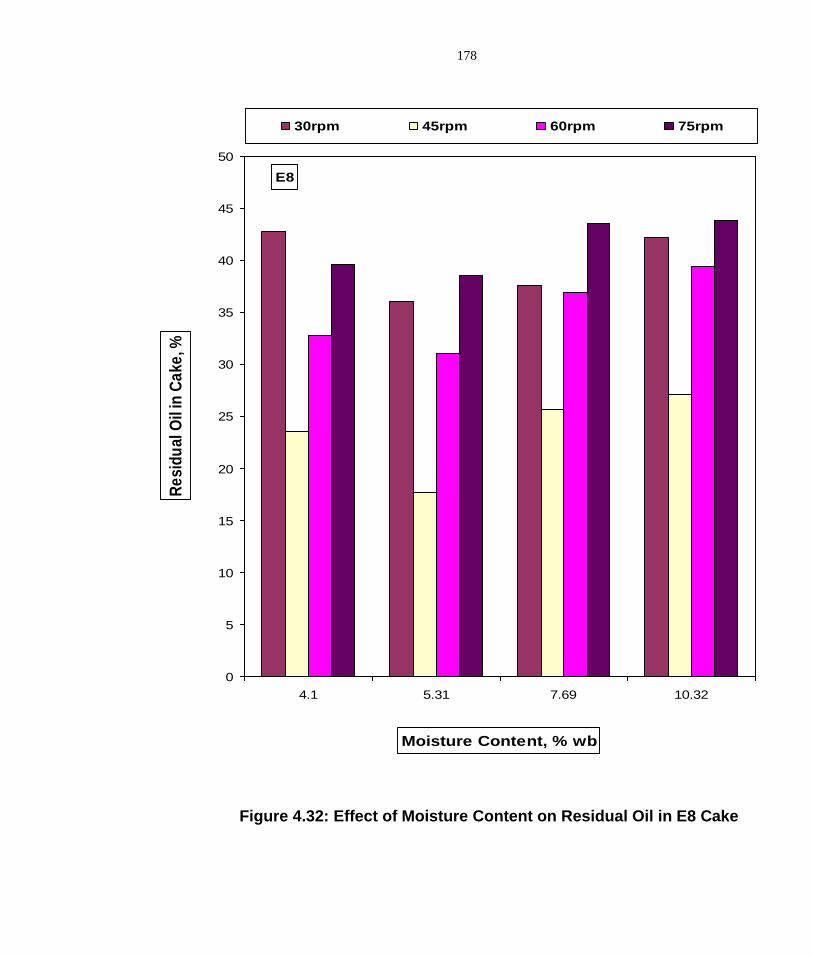
178
Figure 4.32: Effect of Moisture Content on Residual Oil in E8 Cake
E8
0
5
10
15
20
25
30
35
40
45
50
4.1 5.31 7.69 10.32
Moisture Content, % wb
Re
sid
ua
l O
il in
Ca
ke
, %
30rpm 45rpm 60rpm 75rpm
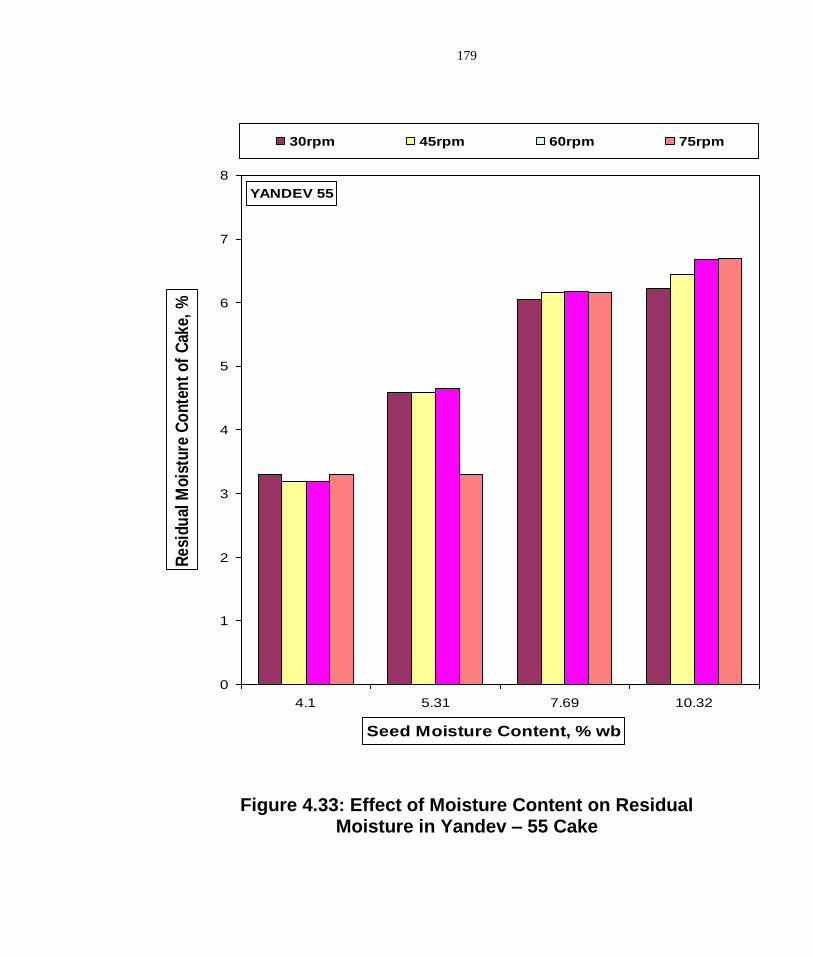
179
Figure 4.33: Effect of Moisture Content on Residual Moisture in Yandev – 55 Cake
YANDEV 55
0
1
2
3
4
5
6
7
8
4.1 5.31 7.69 10.32
Seed Moisture Content, % wb
Re
sid
ual
Mo
istu
re C
on
ten
t o
f C
ake,
%
30rpm 45rpm 60rpm 75rpm

180
Figure 4.34: Effect of Moisture Content on Residual Moisture in E8 Cake
E8
0
1
2
3
4
5
6
7
8
4.1 5.31 7.69 10.32
Seed Moisture Content, % wb
Re
sid
ual
Mo
istu
re C
on
ten
t o
f C
ake,
%
30rpm 45rpm 60rpm 75rpm
181
CHAPTER FIVE
5.0 DISCUSSIONS
The discussions on the experimental results are presented.
5.1 Size and Shape
From the results obtained, the size indices exhibit linear increase with increase
in moisture content. The analysis of variance indicates that moisture content has
highly significant effect on the dimensional parameters of beniseed. The regression
analysis of the experimental data shows a positive correlation of major, intermediate,
minor and equivalent diameters with moisture content with high R2 values. This could
be due to increase in axial dimensions while gaining moisture.
Similar results have been presented by other investigators such as Gowda et
al. (1990) for Linseed (Linium usitatissinum) CV. S-36 in the moisture range of 4.5
– 15%; Hsu et al. (1991) for pistachiost; Arora (1991) for 3 varieties of rough rice
(Oryza sativa L.) at 5 moisture content levels; Arora and Singh (1991) for sunflower
and groundnut; Kulkarmi et al. (1993) for soybeans CV. Js7244 and Gowda et al.
(1995) for Soybeans CV. Maple Belle seeds.
Handling losses during cleaning and oil expression are affected by size and
shape of beniseed. If the screen hole is too big, this may result in uncleaned seeds
while too small a hole may lead to lesser efficiency. If the oil barrel clearance is too
wide, this may result in partial crushing of seed while too small a clearance may lead
to excessive choking of the discharge section as the seeds are crushed. For optimum

182
performance of the cleaner and oil expeller, the size of perforations and barrel
clearance have to be carefully selected. The obtained results are therefore useful in
developing cleaning and oil expression machinery.
The information on the interaction between beniseed accession and moisture
content is necessary in knowing whether a screen specified for Yandev-55 at a given
moisture content can be used for E8 at the same or different moisture content, thus
reducing the number of screens in processing the two accessions in the moisture
content range of 5-30%.
The accession and moisture content had effects on beniseeds, thus, making
them to differ in size. Therefore, screens and barrel clearance for use in cleaning and
oil expression will have to be specified to take care of these variations.
Sphericity was observed to decrease between 5.3 and 16.1% moisture content
and increased at a further increase in moisture content to 28.3% for the two beniseed
accessions. This is unlike the results obtained by Sethi et al. (1992) where the
sphericities of Raya, Tora and Gobi Sarson seeds were reported to increase with
increase in moisture content throughout the range of moisture contents studied. A
similar trend as Sethi et al. opp. cit. has been reported for soybeans CV. Maple Belle
Seeds by Gowda et al. (1995) in the moisture range of 8.24 to 29.07%. The
observation for the studied accessions could be attributed to the large increase in seed
length relative to width and thickness between 5.3 and 16.1% moisture content for the

183
two accessions. There exists a positive linear correlation between sphericity and
moisture content with low R2 values.
The sphericity values of beniseed for the two accessions are within the range
0.52 and 0.53 and this fall within the range of 0.32 and 1.00 reported by Mohsenin
(1986) for most agricultural crops. Beniseed can be said to have a mean sphericity of
0.52 and ovate in the analysis of rate process. As sphericity is nearly constant within
the harvest and storage moisture content range, beniseed can also be said to exhibit
isometric shrinkage during drying.
The medium sphericity values for beniseed indicate characteristics not that
favourable for rolling of seeds to take place and thus has practical implication in the
design of processing and storage equipment, especially in handling operations such as
conveying and discharge from chutes.
5.2 Gravimetric Properties
The bulk density of the two beniseed accessions decreased with an increase in
moisture content. This is due to the fact that as the moisture content increase, the
particle volume increases, thus the same weight of material occupies more volume of
the cylinder and hence leading to a decrease in bulk density.
The result is in agreement with Gowda et al. (1990) for linseed (Linum
usitatissimum) CV. S-36 seeds; Kanawade et al. (1990) for pigeon pea, chickpea,
cowpea, pea, greengram, soybean and moth bean seeds at 5 moisture levels; Arora
(1991) for 3 varieties of rough rice (Oryza sativa L.) at 5 moisture levels; Arora and

184
Singh (1991) for sunflower seeds and groundnut kernels; Irvine et al. (1992) for
flaxseed, lentis and faba beans; Sethi et al. (1992) for Raya, Toria and Gobi Sarson
seeds; Gowda et al. (1995) for soybeans CV. Maple Belle Seeds; Sokhansanj and
Lang (1996) for wheat and canola seeds.
However, for pista chios (Pistachio Vera L.), Hsu et al. (1991) reported that
bulk density increased linearly with moisture content while Kaleemullah (1992)
reported a curvilinear decrease as moisture content increased in case of groundnuts
CV. ICGS-44.
The reason for the different trends for agricultural products could be that some
seeds, on application of moisture, increase in volume much more than the
corresponding weight gain and vice versa. In comparison, beniseed with bulk density
ranging from 528 to 688kg/m3 has similar values with triticale grain reported by
Fornal et al. (1989) as 590 – 715kg/m3 and canola reported by Sokhansanj and Lang,
op. cit. as 661 to 672kg/m3. It has lesser values of bulk density than 1120kg/m3
reported for oil bean seeds by Oje and Ugbor (1991); 686 –790kg/m3 reported for
wheat by Sokhansanj and Lang (1996); 732 – 759kg/m3 reported for high – oil maize
hybrids (HOC) and yellow dent hybrids (YDC) by Pan et al. (1996). It has higher
values than 404 – 472kg/m3 reported for pumpkin by Joshi et al. (1993).
The decrease in true density is analogous to decrease in bulk density, which is
due to increase in volume of the material (more than weight increase), at higher
moisture content levels. Regression analysis shows that true density is negatively

185
correlated and depicts the linear dependency of true density on moisture content. Pan
et al. (1996) reported that for high oil/maize hybrids (HOC) density ranged from 1270
to 1290kg/m3 at 12.5% moisture content. The true density of beniseed of 1050kg/m3
at 5.3% for E8 can be compare with that of pumpkin of 1070kg/m3 at 40% moisture
content (db) as reported by Joshi et al. (1993).
The analysis of variance tables shows that there is a highly significant
difference in moisture content means. The interaction between accession and
moisture content is non-significant for bulk and true densities. Muir and Macnoroe
(1987) had concluded that bulk densities were significantly different among cultivar
of the same cereal grains and rapeseed.
Bulk density values for beniseed has practical applications in calculating
thermal properties in heat transfer problems, in determining Reynolds number in
pneumatic and hydraulic handling of the material, in separating the product from
undesirable materials and in predicting physical structures and chemical composition.
It plays important role in other application, which include design of silos and storage
bins, maturity and quality evaluation of products, which are essential to grain
marketing.
The porosity of the two beniseed accessions increased with increase in
moisture content. This observation could be due to large increase in bulk density
relative to true density as the moisture content increases for the two accessions.
Regression analyses indicates that porosity is positively correlated with moisture

186
content and that it is linearly dependent on moisture content in the given range of 5.3
to 28.3% moisture content (wb).
Arora and Singh (1991) have reported a similar, longer dependency trend for
sunflower and groundnut. Gowda et al. (1990) reported increase in porosity with
increases in moisture content for linseed (Linum usitatissimum) CV. S-36 Seed.
Kanawade et al. (1990) observed a similar trend for pigeon pea, chickpea, cow pea,
pea, green gram, black gram, soybean and moth bean seeds while Kaleemular (1992)
also reported a similar behaviour for groundnuts CV. ICGS-44 seeds. These trends
are similar to that of beniseed.
However, for Raya, Toria and Gobi Sarson Seeds, Sethi et al. (1992) reported
a decrease in porosity with increasing moisture content. Joshi et. al. (1993) reported a
similar behaviour for pumpkin seeds and kernels. These differences may be
attributable to the size and shape of individual seeds at high moisture contents. Muir
and Macnoroe (1987) reported porosity values of 34-38% for rapeseed, mustard flex
and soybean. Beniseed therefore fall within this group.
The E8 accession has higher porosity values that Yandev-55. This could be
attributable to the larger size of E8 seeds. However, the analysis of variance table
shows that there is a no significant difference between the accession and moisture
content means as well as their interactions.
The knowledge of the percent void of unconsolidated agricultural materials
such as beniseed is important in heat and air flow studies, marketing of seeds and

187
grains, storage and processing of agricultural products, and in design of seed planting
devices.
The increase in thousand-kernel weight (TKW) with increase in moisture
content is because increase in moisture content increases the water content (by
weight) of the grain and also leads to an increase in the size of the grain. The analysis
of variance table shows that there is a significant difference in accession means.
There is no significant interaction between accession and moisture content for these
two parameters. Regression analysis shows a linear relationship and positive
correlation between TKW and moisture content.
Similar results have been reported by Gowda et al. (1990) for linseed (Linum
usitatissimum) CV. S-36. They reported linear increase in 1000-grain weight with
moisture contents of 4.5 – 15%. Gowda et al. (1995) also reported a similar trend for
soybeans CV. Maple Belle seeds. Pan et al. (1996) reported 100-kernel weight of six
low – temperature dried, high – oil maize hybrids (HOS) as ranging from 26.6 –
28.2g at 12.5% moisture content. 1000-kernel weight for beniseed was 2.96g for
Yandev-55 and 3.5 for E8 at 28.3%. The reported values for most of the seeds are
very much higher than beniseed in relative comparison.
5.3 Coefficient of Friction
The coefficient of friction on all the studied surfaces decreased with increase
in moisture content from 5,3% to 10.6% and then increased with a further increase in
moisture content to 28.3%. Glass has the least values of 0.345 for Yandev-55 and

188
0.323 for E8 at 10.6% moisture content. The values of coefficient of friction for
beniseed on mild steel, plywood and concrete do not differ significantly from each
other and they are not significantly affected by moisture content. Their values lie
between the range 0.41 to 0.58. These values are within the range of values specified
for other seeds and grains as summarized by Mohsenin (1986). This is expected as
the seeds have very smooth surfaces. The analysis of variance shows a highly
significance difference between the moisture content means for all the structural
surfaces but the effects of accession and its interaction with moisture content is not
significant.
5.4 Mechanical Behaviour of Beniseed under Compression Loading
The results of the analysis of variance had shown that the seed accession, pre-
conditioning method and moisture content levels have significant effects on the
applied force, specific deformation and energy characteristics of beniseed.
It was also observed that the mean values of all the rheological characteristics
were higher when the seeds were dehulled than when left undehulled. This may be
due to the fact, when the seed has been dehulled and dried, it shrinks and becomes
hard, thus requiring a higher force, longer distance and more energy to deform and
rupture the seed.
Changes in moisture content also affect the force-deformation behaviour of
the seed. The interactions of all the factors showed significant effect on all the
characteristics.
189
Similar results have been obtained for mustard seed by Sukumaran and Singh
(1988) in which the oil-point pressure increased from 5.93 to 8.8Mpa at 5mm/minnte
rate of deformation for moisture range of 4.6 to 12.4 per cent (wet basis). Braga et al.
(1999) also reported that the compression position and moisture content affect the
rupture force, specific deformation and energy requirement of macadamia nut. Olaoye
(2000) also reported that variation in moisture content, variety and axis of orientation
of castor nut affected the force-deformation behaviour of the seed.These rheological
characteristics are essential in designing of oil expression plant for beniseed.
5.5 Existing Oil Expellers
Most of the studied expellers have continuous helical threads while few have
interrupted helical threads revolving concentrically within stationary cylindrical
barrels which usually have axially arranged slots through which oil flows out.
In general, the type of expellers depend on the power applied per kg of
material being crushed, the types of barrel, the form of expeller’s feed end, the form
of choke section and worm configuration. The cone mechanisms on the expellers are
identical. Furthermore, all the expellers have a compression ratio in the order of 5,
which indicates that the basic design features of most of the expellers are similar.
Tikkoo et al. (1985) and Agrawal et al. (1987) made different observations for oil
expellers available in India. The difference in observations may be due to the fact that
most of the expellers are used for different oilseeds, some of which are hard like
soybean and mustard seed; and some which are soft like groundnut and sesame seed.

190
5.6 Machine Operational Performance:
The results of the performance operational tests carried out on the developed
oil expeller are discussed below.
5.6.1 Machine Throughput:
The result shows that the machine throughput increased with increase in
wormshaft speed at all the studied moisture content levels. The throughput also
increased as moisture content increased from 4.1 to 5.3% and decreased with a further
increase in moisture content.
Similar results had been reported by Tikko et al. (1985) while evaluating the
performance of a baby oil expeller for oil recovery and energy consumption in
relation to seed moisture (5.9 – 14.2% db) and wormshaft speed. Sivakumaran and
Goodrum (1987) while working on peanut feed rate reported that a reduction in
internal pressure led to an increased in peanut feed rate. Vadke and Salsulski (1988)
also reported the effect of wormshaft speed, choke opening and seed pre-treatment on
press throughput. They observed that as the wormshaft speed and choke opening
increased, the press throughput also increased. They further stated that the maximum
press throughput was obtained at 5% seed moisture content.
The observation in the present study may be due to the fact that as the
wormshaft rotates, the beniseed material at 4.1 and 5.3% moisture contents wet basis
(which are very dried) offered least resistance to the wormshaft movement, thereby
leading to an increase in press throughput as the wormshaft speed increased.

191
However, at 10.32% moisture content, the material is relatively wet, thereby creating
a resistant effect on the wormshaft movement and thus leading to a decrease in
machine throughput.
5.6.2 Oil Recovery
The results had shown that the wormshaft speed, moisture content and seed
accession had significant effect on oil recovery. The oil recovery increased as
wormshaft speed increased from 30 to 45 rpm and decreased with a further increase
in wormshaft speed to 75 rpm at all the studied moisture content. The maximum oil
recovery of 79.63% was obtained for Yandev – 55 at wormshaft speed of 45 rpm and
5.3% moisture content.
This observation seems to conform to the results of an earlier study conducted
by Shukla et al. (1992) at the Central Institute of Agricultural Engineering (CIAE)
Bhopal, India. Best oil recoveries of 55.11% at 5.13% moisture content (wb) was
obtained for groundnut; 71.50% at 9% m.c for soydal; 74.29% at 9% m.c. for linseed;
77.56% at 9.5% m.c. for rapeseed; 81% at 9.4% m.c. for safflower; and 85.2% at
8.9% m.c. for sunflower. In a related study, Varma et al. (1992) while working on the
performance of an expeller with rapeseed had also reported a similar trend. They
reported maximum oil recovery of 82 percent at 9-9.5% moisture content for cooked
rapeseed and oil recovery of 84 per cent when the seed was steamed at 0.1 MPa for
60 minutes.

192
The phenomenon may be attributed to the fact that at 5.3% moisture level, the
shear and compression are relatively better than at the other moisture levels. This is
because moisture also works as heat transfer medium. So the total heat generated by
wormshaft during pressing might be fully transferred to the individual fat globules,
which results in breakdown of the emulsion form of the fat and helps in releasing
more oil droplets. While low moisture causes britleness, higher moisture content
causes plasticising effect, which reduces the level of compression and gives poor
recovery.
The observation may also be due to the fact as the wormshaft speed increased
from 30 to 45 rpm, there was an increase in barrel temperature which invariably led to
the heating and rupturing of the oil cell and thus a decrease in oil viscosity and
moisture content and hence an increase in oil recovery. However, as the wormshaft
speed was further increased to 75 rpm, there was little or no residence time for the
seed material to undergo enough cell rupturing, this eventually led to a decrease in oil
recovery. Also a higher oil recovery for Yandev – 55 accession may be due to the
fact the seed is relatively hard and smaller in size when compared to E8 accession.
This improves its ability to resist rupture force and thus yield more oil.
5.6.3 Oil and Cake Qualities:
The minimum residual oil in the expressed cake of 14.43% is about 6% lower
than the difference between the amount of oil available in the seeds and oil expelled
as some of the oil sticks to the periphery of the expeller’s barrel and the filter plates.

193
Further oil can be recovered from the expressed cake in multiple passes /
crushing of the cake in the expeller. However, this choice depends on the economics
of the process and end use of the cake. According to Jaswant and Shukla (1990), high
pressure can be used to express more oil from the seed in a single pass, but the quality
of the oil and the nutritional value of the cake may be affected. It will also reduce the
capacity of the expeller.
Alternatively, the press – solvent extraction technique can be used. In this case
the oil is first expelled at low pressure from the seed, the cake, which contain more
than 8% oil, is then extracted in a solvent extraction plant. This technique is
advantageous as more oil is expelled using less energy. The quality of the oil is good
from nutritional and consumption point of view.
The results had also shown that the wormshaft seed and moisture content had
effect on the colour of oil, residual oil and moisture in cake. The residual oil and
moisture content in cake was found to increase with increase in moisture content at all
wormshaft speed. A similar trend had been reported by Tikkoo et al. (1985) while
evaluating the performance of a super deluxe model expeller manufactured by M/S.
S.P. Engineering Corporation, Kanpur (U.P.) in terms of residual oil in cake in
relation to seed moisture (5.9 to 14.2% db) and wormshaft speed. They reported that
residual oil in cake was significantly influenced by moisture content of seed and the
values are in the range 8-10% in two passes. Sivakumaran and Goodrum (1987) while
working on the effect of internal pressure of screw press on cake oil content also

194
observed a similar trend. They reported that a reduction in internal pressure led to an
increase in cake oil.
The relative density of the expressed oil is within the range of 0.915 and 0.923
specified for beniseed oil by Codex Alimentarius, 1992. The FFA values of 0.84 and
0.98 indicate the care and control exercised during processing of the seed and it is
also an indication of freshness of the oil. Typical value for crude beniseed oil is
1.01% (Johnson et. al., 1979). High levels of FFA values (about 3-4%) are avoided
because it can result in excessive smoking and unsatisfactory flavour in the oil.
The colour intensity of the oil increased as the seed moisture content
increased. Feather (1977) as reported by Tunde – Akintunde (2000) observed a
similar phenomenon. He reported that colours are formed from carbohydrates in food
where there is a loss of one or more molecules of water from the carbohydrate.
The highest wormshaft speed of 75 rpm and moisture content of 10.32% gave
a yellow colour for expressed oil. This according to Rosell and Pritchad (1991) is
still within the standard for crude oil. In an earlier report, Weiss (1983) had stated
that high quality oils must be pale or colourless and therefore dark coloured oils are
undesirable. This is because they will need to be specially refined and this invariably
will increase the cost of production. This implies that during oils production, the
wormshaft speed and seed moisture content should not be too high such that the
moisture loss will result in dark oils.
195
6.0 CONCLUSIONS AND RECOMMENDATIONS
6.1 Conclusions
The specific objective of this work was achieved. Vital numeric values of
some physical properties of beniseed such as the linear dimensions, size, sphericity,
bulk and true densities, porosity, thousand kernel weight and coefficient of friction on
different structural surfaces, and mechanical properties such as the force required,
resulting deformation and energy needed to rupture and express oil from the seed had
been established. The design and fabrication of an oil expression plant was carried out
based on the application of the determined properties. The effects of wormshaft speed
and moisture content on the yield and quality of the expressed oil and cake were also
investigated. The following conclusions are drawn:
• The linear dimensions, equivalent diameter and thousand kernel weight of
beniseed increased with increase in moisture content while porosity, bulk and true
densities decreased with increased in moisture content. Sphericity decreased with
increase in moisture content from 4.1 to 5.3% and then increased with further
increase in moisture content to 10.3%.
• The two beniseed accessions (Yandev 55 and E8) are different with respect to
linear dimensions, equivalent diameter, bulk and true densities, porosity,
individual grain weight and volume but not statistically different with respect to
sphericity.

196
• The mean sphericity of 0.53 is medium enough to assume an ovate shape for
beniseed during the analysis of rate processes. Also as sphericity does not vary
significantly with moisture content, beniseed can be said to exhibit isometric
shrinkage during drying.
• Bulk density of the whole-beniseed ranges from 528 – 682 Kg/m3 and decreases
with the increase in moisture content. The true density is higher than the bulk
density and has high negative linear correlation with moisture content.
• The mean coefficient of friction between beniseed and glass is 0.32 while that on
other structural surface lies between 0.45 to 0.59.
• The rupture strength of beniseed ranges from 7.73 – 13.96 N and it decreases with
the increase in moisture content from 4.10 – 10.32 per cent.
• The barrel diameters of all the studied expellers were in the range of 60 to 90mm
and most of them are of 75kg/h capacity. The worm dimensions fitted on the
wormshaft were very close to each other. The cone mechanism on each expeller is
identical in design. Furthermore, all the expellers have a compression ratio in the
order of 5, which indicates that the basic design features of most of the expellers
are similar.
• The statistical analysis for oil recovery showed that the second level of wormshaft
speed (45 rpm), the second level of moisture content (5.3%, wb) and Yandev-55
accession are the optimum experimental levels that yielded 12.81kg/h throughput,
79.63% oil recovery and 14.43% oil-in-cake in a single crushing.

197
• The machine throughput, oil recovery, oil and cake qualities of dehulled beniseed
were highly affected by wormshaft speed, moisture content and seed accessions.
These parameters were found to be greater at lower levels of wormshaft speed and
moisture content.
• The residual oil in beniseed cake produced from a single crushing increased from
14.43 to 43.54% with the increase of moisture content from 4.1 to 10.3% per cent.
• The residual moisture content in cake increased with the increase of initial
moisture content of beniseed. It was lower by 1 to 3 per cent as compared to
initial moisture content of oilseed.
6.2 Recommendations
From the above conclusions, the following recommendations are made for
further studies with a view to coming up with comprehensive processing and
operational parameters that affect oil expression from beniseed.
• The aerodynamics properties of beniseed should be investigated.
• Investigation on the effect of other operational parameters apart from wormshaft
speed and moisture content should be carried out.
• The capacity of the oil plant should be increased so that larger quantities can be
produced per unit time.

198
REFERENCES
Adeeko, K. A. and O. O. Ajibola 1990: Processing Factors Affecting Yield and
Quality of Mechanically Expressed Groundnut Oil. Journal Agric. Engrg. Res;
45: 31-43.
Adeyemo, M. O. and A. A. Ojo 1993: Evaluation of Germplasm of Sesame
(Sesamum indicum L.) at Makurdi, Nigeria.Tropical Oilseeds Journal;1(2):1-8.
Ajibola O. O., S. E Eniyemo, O. O. Fasina and K. A. Adeeko, 1990: Mechanical
Expression of Oil from Melon Seeds. J. Agric. Engrg. Res; 45: 45-53
AOAC, 1984: Official Method of Analysis. Association of Official Analytical
Chemists, Washigton. 11th Edition.
ASAE Standards, 1998. Moisture Measurement – Unground Grain and Seeds.
American Society of Agricultural Engineers (ASAE); S352.2 DEC 97: 551.
Arora, S. 1991: Physical and Aerodynamic Properties of Rough Rice (Oryza sativa).
Indian Journal of Agricultural Engineering. Vol. 1: 17-22.
Arora S. and K. Singh, 1991: Physical Properties of Sunflower and Groundnut and
their Interrelations with Moisture Content. J. Res. Punjab Agric.Univ:
28 (1): 91-96.
Badifu, G.I.O. and M.C.O. Abah, 1998: Physicochemical Properties and Storage
Stability of Oils from Sesame Seed and Sheanut Kernels. Nigerian Journal of
Science and Technology. 1(1): 116 – 123.
BHI, 2000: Extra Virgin Cold Pressed – Sesame Oil. Vegetarian Healthy Food. Bay
Hill Impex. Ltd. 60 Weybright Court, Unit 4, Toronto, Ontario, MIS. 4E4
Canada.
Bredson, D. K. 1977: Mechanical Pressing. Journal of the American Oil Chemist’
Society. 54:480-490.
Braga, G.C., S.M. Couto, T. Hara, T. P. Jayme and A. Neto, 1999: Mechanical
Behaviour of Macadamia Nut under Compression Loading. J. Agric. Engrg.
Res. 72: 239-245.
CBN, 1994: Annual Report and Statement of Accounts. Central Bank of Nigeria.
199
Codex Alimentarius, 1992: Codex Standard for Edible Sesame Seed Oil. Fats, Oils
and Related Products. Joint FAO / WHO Food Standards Programme
Vol 8: 33 – 36.
Champawant, P. S. 1986: Performance Study of Mechanical Oil Expeller with
Mustard Seed. An Unpublished M. Tech. Thesis, Indian Institute of
Technology Kharagpur.
Chode-Gowda, M., R. Ramaiah, and A. S. Banakar, 1991: Engineering Properties
of Pigeon pea Seeds. Mysore Journal of Agricultural Science.25 (2): 224-228.
Coote, C. J. 1998: The Market for Nigerian Sesame Seeds. In Pre – Conference
Proceedings of First National Workshop on Beniseed held at the National
Cereal Research Institute (NCRI) Badeggi, Niger State. Pp 33 – 35.
Davie, J. and L. Vincent, 1980: Extraction of Vegetable Oils and fats. In R.J.
Hamilton and A. Bhati (eds.), Fats and Oils, Chemistry and Technology.
Applied Science. London. : 123 – 134.
Desai, V. K. 1998: Private Communication. Tiny Tech. Plants, Tagore Road, Rajkot
360000 2, India
Desai, W. D. and S. N. Goyal, 1980: Intercropping of sesame with other Oil Crops.
Indian Journal of Agricultural Science. 58(8): 603 – 605.
Devnani, R. S., B. K. Garg, J. Prasad, H. S. Bisen and K. L. Majunder, 1993:
Improved Machinery for Production of Oilseeds. AICRP on Farm Implement
and Machinery. Central Institute of Agricultural Engineering (CIAE). Bhopal,
M.P., India.
Douglas, M. and F. Considine 1982: Food and Food Production. Van Nostrand
Reinhold Inc.: 1776 – 1790.
Earle, R. L. 1983: Unit Operations in Food Processing. Pergamon Press, Oxford;
143-158.
EPW, 1999: The Nigerian Labour Market, Job Creation and the Reduction of
Unemployment. Economic Policy Watch. No. 3.
Faborede M. O. and J. F. Favier, 1996: Identification and Significance of the Oil
Point in Seed-Oil Expression. J. Agric. Engrg. Res. 65: 335-345.
200
Fashina, A.B. 1986: Some Physical and Aerodynamics Properties of Egusi
(Colocynthis citrullus L.) Seeds As Related to Mechanical Decortication. An
Unpublished Ph.D Thesis in the Department of Agricultural Engineering,
University of Ibadan.
Fasina, O. O. and O. O Ajibola,. 1989: Mechanical Expression of Oil from Conophur
Nut (Tetracarpidium conophorum). J. Agric. Engrg. Res. 44. 275 –287.
Fellows, P. 1988: Food Processing Technology - Principles and Practice. Ellis
Horward Series in Food and Technology. Pp 130 – 147.
Fornal, J., E. Wodecki, J. Sadowska, A. Ornowski and Z. Dziuba, 1989: Attempt to
Apply Scanning Electron Microscopy in Interpreting the Results of
Determining Selected Physical Properties of Triticale Grain. Acta Academiae
Agriculturae ac Technicae Olstenensis, Technologia Alimentorum. 23:159–
170.
FOS 1995: Annual Report. Federal Office of Statistics.
Gandhi, A. P. 1998: Composition of Oilseeds and Oils and their Nutritional
Significance. In Processing and Storage of Oilseeds and Products for Food
Uses. Central Institute of Agricultural Engineering. Bhopal-M.P. India,2.1-10.
Gibbon, D. and A. Pain 1985: Sesame. .In Crops of the Drier Regions of the Tropics.
Tropical Sscience; 128.
Gomez, K. A. and A. A. Gomez, 1984: Statistical Procedure for Agricultural
Research.. Second Edition John Wiley and Sons, New York
Gow-Chin. Y. 1990: Influence of Seed Roasting Process on the changes in
composition and Quality of Sesame (Sesamum indicum L.) Oil. Journal of the
Science of Food and Agriculture. Vol. 50; No. 4 : 563-570.
Gowda. M. C., G.S.V Raghava, B. Ranganna and Y. Gariepy, 1995: Some
PhysicalProperties of a Soybean Cultiva in Canada. International Agricultural
EngineeringJournal 4 (4): 197-206.
Gowda, M. C., R. Ramaiah, and B.C. Channakeshava, 1990: Effect of Moisture
Content on Physical Properties of Linseed. Mysore Journal of Agricultural
Sciences. 24; (3): 365-370.

201
Gupta, R. K. 1998: Decortation/Dehulling of Oilseeds - Equipment and Approaches.
In Processing and Storage of Oilseeds and Products for Food Uses. Central
Institute of Agricultural Engineering. Bhopal, M. P. India.
Hall, A.S.; A.R. Holowenko, and Laughlin, H.G. 1980: Schaum’s Outline Theory and
Problem of Machine Design. McGraw- Hill Book Company, London.
Hamman, A. W. 1998: Traditional Production Practices and Utilization of Beniseed –
What Potentials for Large Scale Production. In Pre-Conference Proceedings
of the First National Workshop on Beniseed. NCRI, Badeggi, Niger State.
Hamzat, K. O. and B. Klarkhe, 1993: Prediction of Oil Yield from Groundnuts Using
the Concept of Quasi-Equilibrium Oil Yield. J. Agric. Engrg. Res. 39: 70-87.
Hockman, M. 1998: Processing, Marketing and Uses of By-Products of Sesame Seed.
African Sesame Seed Forum, Lagos. Nigeria.
Hsu, M.H., J.D. Mannapperuma, and R.P. Singh, 1991: Physical and Thermal
Properties of Pistachios. J. Agric. Engrg. Res. 49 (4): 311-321
.
I.L.O., 1984: Small Scale Oil Extraction from Groundnut and Copra. Technical
Memorandum (5). International Labour Office, Geneva. Pp 21 - 26.
Inyang, U. E. and J. O Ekanem 1996: Effect of Dehulling Methods and
Desolventizing Temperatures on Promximate Composition and Some
Functional Properties of Sesame (Sesame Indicum. L.) Seed Flour. Journal of
the American Oil Chemists’ Society Vol. 73. No. 9 pg. 1133-1136.
Irvine, D. A., D. S Jayas, N.D.G. White, and M. G. Britton, 1992: Physical Properties
of Flaxseed, Lentils, and Ababeans. Canadian Agricultural Engineering
34: (1):75 –81.
Jacobson, L. A. and F. K. Backer, 1986: Recovery of Sunflower Oil with a Small
Screw Expeller. Energy in Agriculture,;15: 199-203.
Jaswant, S. and B. D. Shukla, 1991: Post Harvest Technology of Oilseeds.
Technology Mission on Oilseeds, CIAE. Bhopal, India.
Johnson, L. A., J. M. Suleiman and E. W. Lusas, 1979: Sesame Protein: A Review
and Prospectus. Journal of the American Oil Chemists’ Society. Vol. 56.
202
Jones, H., N. Jones and R.J. Swienthek, 1983: Plate and Frame Filters Clarified Apple
Juice. Food Process. USA October Pp 104 - 105
Joshi, D. C., S. K., Das and R. K. Mukherjee, 1993: Physical Properties of Pumpkin
Seeds.Journal of Agricultural Engineering Research; 54 (3): 219-229.
Kaleemular, S. 1992. The Effect of Moisture Content on the Physical Properties of
Groundnut Kernels. Tropical Sicence; 32(2): 129-126.
Kanawade, L. R., B. W. Bhosale and M. S. Kadam, 1990: Effects of Moisture
Content on Certain Selected Physical Properties of Pulse Seeds. Journal of
Maharashtra Agricultural Universities 15(1): 60-62.
Katung, P. D. 1998: Production, Management and Utilization of Sesame (Sesamum
indicum L.). Pre-Conference Proceeding of the First National Workshop on
Beniseed, NCRI, Badeggi, Niger State.
Khan, L.M. and Hanna, M. A. 1983: Expression of Oil from Oilseeds – A Review.
Journal of Agric. Engrg. Res.; 28: 495-523.
Khan, L. M. and Hanna, M. A. 1984: Expression of Soybean Oil. Transactions of the
American Society of Agricultural Engineer; 27: 190 - 194.
Kinsella, J. S. and R. R. Mohite, 1985: The Physico-Chemical Characteristics and
Functional Properties of Sesame Proteins. In New Protein Foods, Vol. 5,
Academic Press Inc. New York. Pp. 435-456.
Kulkarni, S. D., N.G. Bhole and S. K. Sawarkar, 1993: Spatial Dimensions of
Soybeans and their Dependence on Grain Moisture Conditions. Journal of
Food Science and Technology. Mysore 30(5): 335-338.
Langham, R. 1985: USA – Growing Sesame in the Desert Southwest. In Sesame and
Safflower Status and Potentials. Ed. A. Ashiri. Proceeding of Expert
Consultation. FAO Plant Production and Protection. Paper No 66. Pg. 75.
Latunde-Dada, G. O. 1993: Iron Contents and Some Physical Components of Twelve
Cowpea Varieties. J. Food Sciences and Nutrition; 43(4): 193 - 197.
Mahendra, N. 1990: A Report on Base Line Study of Existing Oil Expeller.
Development and Consulting Services, Butwal, Nepal.

203
Mandhyan, B. K. 1990: Mechanical Expression of Soyoil and Utilization of Soycake
as Food. An Unpublished Ph.D Thesis Submitted to Indian Institute
Technology, Kharangpur, India.
Market Asia, 2000: Word Market for Sesame Seeds. Agric Business Information.
Http://www.marketasia.org/news/archieve/v35/sesame.htm.
Misari, S.M. and G. A. Iwo, 2000: Beniseed Research Development and Prospect, In
Nigeria. In Genetics and Crop Improvement in Nigeria in the Twenty-First
Century. A-25 Year Commerotative Publication of Genetic Society of
Nigeria; 152-161.
Moharram, Y. G. 1981: Studies on Wet Dehulling of Egyptian Sesame Seeds by a
Lye Solution. Lebens Wissensch. Technology 14 (3).
Mohsenin, N. N. 1986: Physical Properties of Plant and Animal Materials. Structure,
Physical Characteristics and Mechanical Properties. Revised Edition. Gordon
and Breach Science Publishers. New York. Pg. 94-96, 798-804.
Mubeen, A. 1998: Machine Design. Khanna Publishers, 2 – B Nath Market, Naisarak
Delhi – 11 00 06 : 698 – 730.
Muir, W. E and J. A Macnoroe, 1987: Physical Properties of Cereals and Oilseed
Cultivars Grown in Western Canada. Canadian Agric. Eng; 30: 51-55.
Mrema, G. C. and P.B. Mc Nulty, 1985: Mathematical Model of Mechanical Oil
Expression from Oilseeds. J. Agric. Engrg. Res; 31: 361-370.
NCRI, 1995: “NCRI Develops Vegetables Oil Extractor”. National Cereasl Research
Institute, Badeggi Niger State. Newsletter Vol : Number 1.
NCRI 1998: In – House Review Meeting. Oilseed Research Programme, National
Cereals Research Institute.Badeggi, Niger State.
Obi, I. U. 1986: Statistical Methods of Detecting Differences between Treatments
Means. SNAAP Press Ltd. Enugu, Nigeira.
Odunfa, S. A. 1993: Nigerian Lesser Known Crops. University of Agric. Abeokuta.
Conference Proceeeding. Series No. 3 : 155-163.

204
Ogunbodede, B. A. and E. A. Ogunremi, 1986: Estimation of Sesame (Sesame
indicum L.) Yield Parameters. Nigerian Journal of Agronomy 1 (1): 9 – 13.
Ohaba, J. A. and A. O. Ketiku, 1983: The Nutritive Value of Nigerian Beniseed
(Sesamum indicum L.). 2nd African Nutrition Congress.
Olaoye, J.O. 2000: Fracture Resistance of Castor Nut to Mechanical Damage.
Proceedings of the First International Conference of the Nigerian Institution of
Agricultural Engineers;Volume 22: 44 – 47.
Olayanju, T.M.A. 1998: Design, Development and Evaluation of a Vegetable Oil
Expeller. An Annual Report Submitted to the Federal Institute of Industrial
Research, Oshodi (FIIRO) Lagos
Olayanju, T.M.A. 1999: Design, Development and Evaluation of a Vegetable Oil
Filter Press An Annual Report Submitted to the Federal Institute of Industrial
Research, Oshodi (FIIRO) Lagos
Olayanju, T.M.A., M. O Oresanya and A. A. Adeagbo, 2000: Development of a
Processing Plant for Beniseed. Proceedings of the First International
Conference and the Millenium General Meeting of the Nigerian Institution of
Agricultural Engineers; Volume 22: 48 -51
Oje, K. 1993: Locust Bean Pods and Seeds: Some Physical Properties of Relevance to
Dehulling and Seed Processing. Journal of Food Science and Technology,
Mysore 30: (4): 253-255.
Oje, K and E.C. Ugbor, 1991: Some Physical Properties of Oilbean Seed. Journal of
Agricultural Engineering Research; 50 (4): 305-313.
Omolohunu, E. B. 1998: Status of Beniseed in the Federal Capital Territory (FCT)
Abuja. In Pre - Conference Proceedings of the First National Workshop on
Beniseed; 159 –162.
Oresanya, M.O. 1990: Literature Review of Beniseed (Sesame seed) Its Processing
and Utilization. Chemical and Fibre Sectional Report, Federal Institute of
Industrial Research, Oshodi, Lagos.
Oresanya, M. O. and O. A.Koleoso 1990: Beniseed Processing and Utilization.
An Annual Report Submitted to the Federal Institute of Industrial Research,
Oshodi (FIIRO) Lagos

205
Pan. Z., S. R. Eckhoff,, M. R Paulsen, and J. B. Litchfield, 1996: Physical Properties
and Dry-Milling Characteristics of Six Selected High-Oil Maize Hybrids.
Cereal Chemistry; 73 (5): 517-520.
Patil, R. T. 1998: Mechanical Oil Expression – Mechanics, Process and Equipment.
In Processing and Storage of Oilseeds and Products for Food Uses. Central
Institute of Agricultural Engineering. Bhopal, M. P. India.
Patil, R. T. and L. K. Sharma, 1998: Studies on Oil-point Measurement of Soybean.
IFCON; T-01: 200.
Peleg, M. and E.B. Bagly, 1982: Physical Properties of Foods. AVI Publishing Co.
Inc. West Port Connectiut.
PRSD, 1997: Visioning for Agricultural Production in Nigeria by the year 2010.
Planning, Research and Statistics Dept, Federal Ministry of Agriculture and
Natural Resources, Abuja.
Ramachandra, B. S., L. S. SubraRao, A. Ramesh and P.K. Ramanathan, 1971: Drying
Studies on the Dehulled Wet Sesame Seed. J. Food Sci. Technology; 8(1):
17-19.
Rosedown, S., 1990: The Compact Solution to Oilseed Processing. A Simon –
Rosedown Food Engineering Company Puiblication, England, 10: 1 - 8.
Rosell, J.B. and J.L.R. Pritchard, 1991: Analysis of Oilseeds, Fats and Fatty Food.
Elsevier Applied Science. Elsevier Science Publications.
Salunkhe, D. K. and B. B. Desai, 1986: Postharvest Biotechnology of Oil seeds.
CRC Press Inc. BocaRaton, Florida.
Sethi, P. S., P. C Grover, and B.C. Thakur, 1992: Selected Engineering Properties of
Oilseeds: Raya, Toria and Gorbi Sarson. J. Res. Punjab Agric. Univ; 29 (1):
99-110.
Share, S. K. 1998: Anti Nutritional Factors in Oilseeds. In Processing and Storage of
Oilseeds and Products for Food Uses. Central Institute of Agricultural
Engineering. Bhopal, M. P. India.: 211-218.

206
Shukla, B.D., P. K. Srivastava and R. K. Gupta, 1992: Oilseed Processing
Technology. Technology Mission on Oilseed, Central Institute of Agricultural
Engineering, Bhopal, India : 155-156.
Singh, M. S., L.E. Farsaire, L. W. Stewart and W. Douglas, 1984: Development of
Mathematical Models to Predict Sunflower Oil Expression. Trans. ASAE:
1190 - 1194.
Sivakumaran, K. and Goodrum, J. W. 1987: Influence of Internal Pressure on
Performance of a Small Screw Expeller. Trans. ASAE ; Vol.30, No.4 : 1167
1171.
Sivakumaran, K., J. W. Goodrum, and A. B. Ralph, 1985: Expeller Optimization for
Peanut Oil Production. Trans. ASAE : 316 – 320.
Sivala, K. 1989: Studies on Rice Bran Oil Expression. An Unpublished Ph.D. Thesis
Submitted to the Post Havest Technology Centre, Indian Institute of
Technology. Kharagpur.
Sivala, K., N.G. Bhole and R.K. Mukherjee, 1991: Effect of Moisture Content on
Rice Bran Oil Expression. J. Agric. Engng. Res; 50: 81-91.
Sivala, K., R. V.Vasudeva, S. Sorangi, R. K. Mukherjee, and N.G.Bhole, 1991:
Mathematical Modelling of Rice Bran Oil Expression. Journal of Food
Process Engineering;14 :51 – 68.
Sokhansanhj, S and W. Lang, 1996: Prediction of Kernel and Bulk Volume of Wheat
and Canola During Adsorption and Desorption. Journal of Agricultural
Engineering Research; 63 (2): 129-136.
Srikanta, R.P. 1980: A Search for Appropriate Technology for Village Oil.
Appropriate Technology Development Association (ATDA) Publications.
Srivastava, P.K., and R.P. Kachru, 1995: Compedium of Technologies for Oilseed
Processing and Utilization. Technology Mission on Oilseeds, Central Institute
of Agricultural Engineering, Bhopal, India, 6: 69-84.
Sukumaran, C.R. and B.P.N. Singh, 1985: Effect of Moisture Content and Rate of
Deformation on Apparent Modulus of Elasticity of Bulk Rapeseed.
Proceedings India Society of Agricultural Engineers (ISAE); SJC 3: 41-51.
207
Sukumaran, C.R. and B.P.N Singh, 1987: Oil Expression Characteristics of Rapeseed
under Uniaxial Bulk Compression, Journal of Food Science and Technology;
24: 11-16.
Sukumaran, C. R. and B.P.N. Singh, 1989: Compression of a Bed of Rapeseed – The
Oil Point. J. Agric. Engng. Res; 46: 77-83.
Svarosky, L. 1981: Solid- Liquid Separation. Butterworths Monographs in Chemistry
and Chemical Engineering; 242 - 264.
Tashiro, L., Y. Fukuda, J. Osawa and M. Namiko, 1990: Oil Minor Components of
Sesame (Sesamum indicum L.) Strains. J. Am. Oil Chemists’ Soc.; 67: 508
511.
TDRI, 1984: Oil Palm News. Tropical Development and Research Institute (TDRI);
Publications, London.
Thangavelu, S. 1992: Brief Review of Sesame Network. Proceeding of a Steering
Committee Meeting and Workshop on Oilcrops. Ed. W. A. Navaro. Nairobi,
Kenya.11 – 14 August.
Tikko, A. K. D.K. Gupta, and B.P.N. Singh, 1985: Cold Pressing of Rapeseed.
Research Bulletin PHT 01: 2. Pant Nagar, India.
Tindale. L. H. and S. R. Hill-Hass, 1976: Current Equipment for Mechanical Oil
Extraction. J. Am. Oil Chemists’ Soc.; Vol. 53: 265-274.
Tontisirin, K., M. Benlawon, S. Dhanamitta and A. Valyasevic 1980: Formulation of
Supplementary Infant Foods at the Home and Village Levels in Thailand.
Ramathibodi Hospital and Institute of Nutrition. Mahidol University Bangkok,
Thailand. Food and Nutrition Bulletin.Vol. 3, No. 3.
Tunde – Akintunde, T. Y. 2000: Predictive Models for Evaluating the Effect of Some
Processing Parameters on Yield and Quality of Some Soybean {Glycine max
(L) Merril} Products. An Unpublished Ph.D Thesis in the Department of
Agricultural Engineering, University of Ibadan.
U.N.I.F.E.M., 1987: Oil Extraction. Food Cycle Technology Source Book One.
United Nation Industrial Fund for Women Publications, New York.

208
Uzo, J. O. 1998: Beniseed – A Neglected Oil Wealth of Nigeria. Pre-Conference
Proceeding of the First National Workshop on Beniseed, NCRI, Badeggi:1-17.
Uzo, J. O and D. K. Adedzwa, 1985: A Search for Drought Resistance in the Wild
Relative of the Cultivated Sesame (Sesamum indicum L.). In Sesame and
Safflower Status and Potentials. Ed. A. Ashiri. Proceeding of Expert
Consultation, FAO Plant Production and Protection. Paper No 66. Pg. 166.
Uzo, J. O. and G. U. Ojiako, 1981: Breeding and Selection Method for Sesame on the
Basis of Assessment of Major Nigerian Sesame Strains, F. Hybrids and
Segregating Generations. F.A.O. Plant Production and Protection Paper No.
29, 90-96.
Vadke, V. S. and F.W. Sasulski, 1988: Mechanics of Oil Expression from Canola.
J. Am. Oil Chemists’ Soc.; 65: 1169-1176.
Vadke, V. S., F. W. Sasulski and S. A. Shook, 1988: Mathematical Simulation of an
Oilseed Press. J. Am. Oil Chemists’ Soc.; 65: 1610-1616.
Varma, R. K. 1998: Design of an Oil Expeller. In Processing and Storage of Oil seeds
and Products for Food Uses. Course Manual for Summer School. Central
Institute of Agricultural Engineering Bhopal M.P India: 378 - 388.
Varma, R.K., R.S. Sawant and N.G. Bhole, 1992: Studies on Commercial Oil Ghani.
Proceeding of 7th National Convention of Agricultural Engineers, held at
Bhubaneswar, India. Pp 138-144.
Voh, J.P. 1998: An Overview of Beniseed Research and Production in Nigeria and
Prospect for Increased Production. Pre - Conference Proceedings of the First
NationalWorkshop on Beniseed; 18 – 29.
Ward, J. A. 1976: Processing High Oil Content Seeds in Continuous Screw Presses.
J. Am.Oil Chemists’ Soc.; Vol. 53: 201 –264.
Waziri, A.N. and J.P. Mittal, 1983: Design Related Physical Properties of Selected
Agricultural Products. Journal of Agric. Mechanization in Asia, Africa and
Latin America.Vol. 14 (1).
Weiss, E. A. 1983: Oilseed Crops. Longman Group Limited, London.

209
Yen, G.C. and S. L. Shyu, 1989: Oxidative Stability of Sesame Oil Prepared from
Sesame Seed with Different Roasting Temperature. Food Chemistry 34: 215 –
224.
Yermanos, D. M. 1985: Sesame Growing: An Idealised Overview. Oilcrops
Newsletter, N.C.R.I Badeggi. No. 2: 61-62.
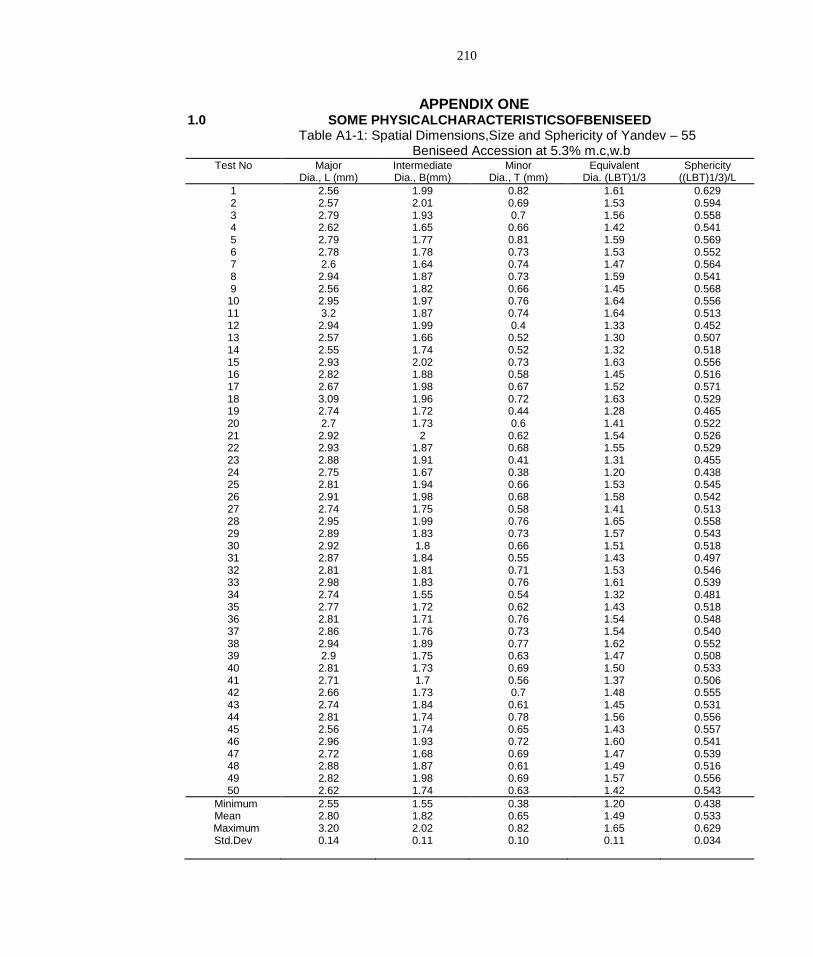
210
APPENDIX ONE 1.0 SOME PHYSICALCHARACTERISTICSOFBENISEED
Table A1-1: Spatial Dimensions,Size and Sphericity of Yandev – 55 Beniseed Accession at 5.3% m.c,w.b
Test No Major Intermediate Minor Equivalent Sphericity Dia., L (mm) Dia., B(mm) Dia., T (mm) Dia. (LBT)1/3 ((LBT)1/3)/L
1 2.56 1.99 0.82 1.61 0.629 2 2.57 2.01 0.69 1.53 0.594 3 2.79 1.93 0.7 1.56 0.558 4 2.62 1.65 0.66 1.42 0.541 5 2.79 1.77 0.81 1.59 0.569 6 2.78 1.78 0.73 1.53 0.552 7 2.6 1.64 0.74 1.47 0.564 8 2.94 1.87 0.73 1.59 0.541 9 2.56 1.82 0.66 1.45 0.568
10 2.95 1.97 0.76 1.64 0.556 11 3.2 1.87 0.74 1.64 0.513 12 2.94 1.99 0.4 1.33 0.452 13 2.57 1.66 0.52 1.30 0.507 14 2.55 1.74 0.52 1.32 0.518 15 2.93 2.02 0.73 1.63 0.556 16 2.82 1.88 0.58 1.45 0.516 17 2.67 1.98 0.67 1.52 0.571 18 3.09 1.96 0.72 1.63 0.529 19 2.74 1.72 0.44 1.28 0.465 20 2.7 1.73 0.6 1.41 0.522 21 2.92 2 0.62 1.54 0.526 22 2.93 1.87 0.68 1.55 0.529 23 2.88 1.91 0.41 1.31 0.455 24 2.75 1.67 0.38 1.20 0.438 25 2.81 1.94 0.66 1.53 0.545 26 2.91 1.98 0.68 1.58 0.542 27 2.74 1.75 0.58 1.41 0.513 28 2.95 1.99 0.76 1.65 0.558 29 2.89 1.83 0.73 1.57 0.543 30 2.92 1.8 0.66 1.51 0.518 31 2.87 1.84 0.55 1.43 0.497 32 2.81 1.81 0.71 1.53 0.546 33 2.98 1.83 0.76 1.61 0.539 34 2.74 1.55 0.54 1.32 0.481 35 2.77 1.72 0.62 1.43 0.518 36 2.81 1.71 0.76 1.54 0.548 37 2.86 1.76 0.73 1.54 0.540 38 2.94 1.89 0.77 1.62 0.552 39 2.9 1.75 0.63 1.47 0.508 40 2.81 1.73 0.69 1.50 0.533 41 2.71 1.7 0.56 1.37 0.506 42 2.66 1.73 0.7 1.48 0.555 43 2.74 1.84 0.61 1.45 0.531 44 2.81 1.74 0.78 1.56 0.556 45 2.56 1.74 0.65 1.43 0.557 46 2.96 1.93 0.72 1.60 0.541 47 2.72 1.68 0.69 1.47 0.539 48 2.88 1.87 0.61 1.49 0.516 49 2.82 1.98 0.69 1.57 0.556 50 2.62 1.74 0.63 1.42 0.543
Minimum 2.55 1.55 0.38 1.20 0.438 Mean 2.80 1.82 0.65 1.49 0.533
Maximum 3.20 2.02 0.82 1.65 0.629 Std.Dev 0.14 0.11 0.10 0.11 0.034

211
Ta ble A1-2: Spatial Dimensions,Size and Sphericity of E8 Beniseed Accession at 5.3% m.c,w.b
Test No Major Diameter L (mm)
Intermediate Diameter B(mm)
Minor Diameter T (mm)
Equivalent Diameter
(LBT)1/3 (mm)
Sphericity ((LBT)1/3)/L
1 3.91 2.17 0.85 1.93 0.494
2 3.35 2.27 0.70 1.75 0.521 3 3.26 1.95 0.76 1.69 0.519 4 3.30 1.97 0.70 1.66 0.502 5 3.61 2.30 0.75 1.84 0.510 6 3.40 2.24 0.65 1.70 0.501 7 3.15 2.14 0.66 1.64 0.522 8 3.14 2.35 0.81 1.81 0.578 9 3.48 2.22 0.76 1.80 0.518
10 3.10 2.10 0.61 1.58 0.511 11 3.44 1.96 0.77 1.73 0.503 12 3.39 2.44 0.92 1.97 0.580 13 3.39 2.49 0.69 1.80 0.531 14 3.19 2.44 0.67 1.73 0.544 15 3.05 2.43 0.60 1.64 0.539 16 3.40 2.24 0.89 1.89 0.557 17 3.07 2.28 0.83 1.80 0.586 18 3.56 2.57 0.94 2.05 0.576 19 3.48 2.22 0.66 1.72 0.495 20 3.40 2.44 0.63 1.74 0.510 21 3.35 2.18 0.84 1.83 0.546 22 3.45 2.24 0.75 1.80 0.521 23 3.09 1.87 0.52 1.44 0.467 24 2.65 1.62 0.69 1.44 0.542 25 3.50 2.04 0.92 1.87 0.535 26 3.45 2.35 0.80 1.86 0.541 27 3.40 2.10 0.91 1.87 0.549 28 3.01 2.11 0.77 1.70 0.564 29 2.92 1.91 0.62 1.51 0.518 30 3.44 2.25 0.77 1.81 0.527 31 3.45 2.08 0.94 1.89 0.548 32 3.52 2.25 0.81 1.86 0.528 33 3.47 2.24 0.69 1.75 0.504 34 3.43 2.09 0.78 1.77 0.517 35 3.25 1.89 0.64 1.58 0.486 36 3.29 2.03 0.68 1.66 0.503 37 3.33 2.08 0.79 1.76 0.529 38 3.37 1.93 0.74 1.69 0.501 39 3.39 1.94 0.71 1.67 0.493 40 3.25 2.06 0.85 1.79 0.549 41 3.20 1.97 0.73 1.66 0.520 42 3.13 2.00 0.70 1.64 0.523 43 3.53 2.19 0.78 1.82 0.516 44 3.52 2.24 0.77 1.82 0.518 45 3.32 2.11 0.76 1.75 0.526 46 3.24 1.78 0.71 1.60 0.494 47 3.07 1.98 0.66 1.59 0.518 48 3.12 1.99 0.77 1.68 0.540 49 3.08 1.93 0.74 1.64 0.532 50 3.20 1.94 0.75 1.67 0.522
Minimum 2.65 1.62 0.52 1.44 0.467 Mean 3.31 2.13 0.75 1.74 0.525
Maximum 3.91 2.57 0.94 2.05 0.586 Std.Dev 0.21 0.19 0.09 0.12 0.025

212
Table A1-3: Spatial Dimensions, Size and Sphericity of two Beniseed Accessions
at Different Levels of Moisture Contents
Material Moisture Spatial Dimensions, mm Geometric Mean Sphericity
Content Major Intermediate Minor (LBT)1/3, mm LBT1/3/L
Yandev 55 5.30 2.80 1.83 0.68 1.52 0.541
10.60 2.91 1.88 0.71 1.57 0.539
16.10 3.07 1.93 0.75 1.64 0.536
22.40 3.15 2.00 0.80 1.71 0.544
28.30 3.30 2.05 0.87 1.81 0.547
E8 5.30 3.30 2.13 0.75 1.74 0.537
10.60 3.42 2.21 0.78 1.81 0.528
16.10 3.66 2.24 0.83 1.89 0.518
22.40 3.85 2.38 0.87 1.99 0.519
28.30 3.93 2.62 1.00 2.18 0.554

213
Table A1-4: Analysis of Variance for Size and Shape Parameters
at 5% Significance Level
(1) Major Diameter (mm)
_____________________________________________________________________
Source of Degree of Sum of Mean Fvalue
Variation Freedom, DF Squares, SS Squares, MS
____________________________________________________________________
Accession (A) 1 0.858 0.858 7.944*
Moisture Content (M) 4 0.433 0.108 2.700NS
Interaction (A X M) 4 0.014 0.004 0.028 NS
Total 9 1.306 0.145
_____________________________________________________________________
(2) Intermediate Diameter (mm)
_____________________________________________________________________
Source of Degree of Sum of Mean Fvalue
Variation Freedom, DF Squares, SS Squares, MS
_____________________________________________________________________
Accession (A) 1 0.357 0.357 9.154*
Moisture Content (M) 4 0.155 0.039 65.00**
Interaction (A X M) 4 0.025 0.006 0.100 NS
Total 9 0.537 0.060
_____________________________________________________________________
* Significant Difference
** Highly Significant Difference
NS Non Significant

214
(3) Minor Diameter (mm)
_____________________________________________________________________
Source of Degree of Sum of Mean Fvalue
Variation Freedom, DF Squares, SS Squares, MS
_____________________________________________________________________
Accession (A) 1 0.018 0.018 1.200 NS
Moisture Content (M) 4 0.059 0.015 60.00**
Interaction (A X M) 4 0.001 0.003 0.028 NS
Total 9 0.07 0.009
_____________________________________________________________________
(4) Geometric Mean (mm)
_____________________________________________________________________
Source of Degree of Sum of Mean Fvalue
Variation Freedom, DF Squares, SS Squares, MS
_____________________________________________________________________
Accession (A) 1 0.185 0.185 4.512 NS
Moisture Content (M) 4 0.164 0.041 20.50**
Interaction (A X M) 4 0.007 0.002 0.051 NS
Total 9 0.355 0.039
_____________________________________________________________________
* Significant Difference
** Highly Significant Difference
NS Non Significant

215
(5) Sphericity (%)
_____________________________________________________________________
Source of Degree of Sum of Mean Fvalue
Variation Freedom, DF Squares, SS Squares, MS
_____________________________________________________________________
Accession (A) 1 0.0001 0.00010 0.400NS
Moisture Content (M) 4 0.0010 0.00030 0.250 NS
Interaction (A X M) 4 0.0001 0.00003 0.300 NS
Total 9 0.0010 0.00010
_____________________________________________________________________
* Significant Difference
** Highly Significant Difference
NS Non Significant

216
Table A1-5: Regression Equations for Size and Shape Parameters
in the Moisture Content Range of 4.1 to 28.3% wb.
_____________________________________________________________________
Property Beniseed Linear Regression R– Square Correlation
Accession Equation Coefficient
_____________________________________________________________________
Major Dia. (mm) Yandev 55 2.692 + 0.021M 0.989 0.995
Major Dia. (mm) E8 3.096 + 0.029M 0.896 0.946
Intermediate Dia. (mm) Yandev 55 1.778 + 0.009M 0.998 0.999
Intermediate Dia. (mm) E8 1.984 + 0.020M 0.907 0.953
Minor Dia., mm Yandev 55 0.627 + 0.008M 0.981 0.991
Minor Dia., mm E8 0.676 + 0.010M 0.922 0.961
Geometric Mean (mm ) Yandev 55 1.444 + 0.012M 0.990 0.995
Geometric Mean (mm ) E8 1.617 + 0.018M 0.962 0.981
Sphericity (%) Yandev 55 0.536 + 0.0003M 0.427 0.653
Sphericity (%) E8 0.523 - 0.0004M 0.082 0.287
_____________________________________________________________________
M = Moisture Content, % wb

217
Table A1-6: Gravimetric Properties of two Beniseed Accessions
at Different Moisture Content Levels
Material Moisture Bulk True Porosity Thousand
Content Density Density % Kernel Weight
%, wb kg/m3 kg/m3 g
_____________________________________________________________________
Yandev 55 5.30 688 1042 33.97 2.63
10.60 682 1031 34.11 2.72
16.10 668 1017 34.32 2.88
22.40 645 1010 36.13 2.93
28.30 613 981 37.51 2.96
E8 5.30 674 1050 35.81 2.98
10.60 638 1025 37.76 3.02
16.10 594 1015 41.48 3.08
22.40 553 1002 44.81 3.46
28.30 528 988 46.56 3.50

218
Table A1-7: Analysis of Variance for Gravimetric Properties
at 5% Significance Level
(1) Bulk Density (kg/m3)
_____________________________________________________________________
Source of Degree of Sum of Mean Fvalue
Variation Freedom, DF Squares, SS Squares, MS
_____________________________________________________________________
Accession (A) 1 9548.10 9548.10 2.390 NS
Moisture Content (M) 4 15977.60 3994.40 7.607*
Interaction (A X M) 4 2100.40 525.10 0.171 NS
Total 9 27626 3069.57
_____________________________________________________________________
(2) True Density (kg/m3)
_____________________________________________________________________
Source of Degree of Sum of Mean Fvalue
Variation Freedom, DF Squares, SS Squares, MS
_____________________________________________________________________
Accession (A) 1 0.100 0.100 0.00009 NS
Moisture Content (M) 4 4272.40 1068.10 39.41**
Interaction (A X M) 4 108.40 27.10 0.056 NS
Total 9 4380.90 486.77
_____________________________________________________________________
** Highly Significant Difference
NS Non Significant

219
(3) Porosity (%)
_____________________________________________________________________
Source of Degree of Sum of Mean Fvalue
Variation Freedom, DF Squares, SS Squares, MS
_____________________________________________________________________
Accession (A) 1 92.294 92.294 5.124 NS
Moisture Content (M) 4 72.052 18.013 3.547 NS
Interaction (A X M) 4 20.315 5.079 0.247NS
Total 9 184.661 20.518
_____________________________________________________________________
(4) Thousand Kernel Weight (g)
_____________________________________________________________________
Source of Degree of Sum of Mean Fvalue
Variation Freedom, DF Squares, SS Squares, MS
_____________________________________________________________________
Accession (A) 1 1.600 1.600 16.00*
Moisture Content (M) 4 0.400 0.100 1.00 NS
Interaction (A X M) 4 0.400 0.100 0.375 NS
Total 9 2.400 0.267
_____________________________________________________________________
* Significant Difference
** Highly Significant Difference
NS Non Significant

220
Table A1-8: Regression Equations for Gravimetric Properties
in the Moisture Content Range of 4.1 to 28.3% wb.
_____________________________________________________________________
Property Beniseed Linear Regression R– Square Correlation
Accession Equation Coefficient
_____________________________________________________________________
Bulk Density, kg/m3 Yandev 55 713.08 – 3.258M 0.943 -0.971
Bulk Density, kg/m3 E8 705.06 – 6.509M 0.989 0.944
True Density, kg/m3 Yandev 55 1057.17 – 2.477M 0.949 -0.974
True Density, kg/m3 E8 1057.86 – 2.531M 0.966 0.983
Porosity, % Yandev 55 32.57 + 0.159M 0.878 0.937
Porosity, % E8 33.12 + 0.494M 0.985 0.933
1000-Kernel Wt., g Yandev 55 2.577 + 0.015M 0.917 0.958
1000-Kernel Wt., g E8 2.780+ 0.026M 0.885 0.941
M = Moisture Content, % wb

221
Table A1-9: Coefficient of Static Friction of two Beniseed Accessions
with respect to Different Structural Surfaces
_____________________________________________________________________
Material Moisture Mildsteel Plywood Concrete Glass
Content (Normal- (Normal- (Normal- (Plain)
% w.b Surface Surface Surface
Finish) Finish) Finish)
_____________________________________________________________________
Yandev-55 5.3 0.5095 0.4706 0.5704 0.3672
10.6 0.4621 0.4473 0.5140 0.3477
16.1 0.4797 0.4586 0.5217 0.3524
22.4 0.5392 0.5236 0.5872 0.3805
E8 5.3 0.4625 0.4142 0.5498 0.3424
10.6 0.4157 0.3904 0.4932 0.3226
16.1 0.4326 0.4017 0.5011 0.3273
22.4 0.4925 0.4667 0.5665 0.3554

222
Table A1-10: Analysis of Variance for the Coefficient of
Static Friction at 5% Significance Level
(1) Mild Steel
_____________________________________________________________________
Source of Degree of Sum of Mean Fvalue
Variation Freedom, DF Squares, SS Squares, MS
_____________________________________________________________________
Accession (A) 1 0.004 0.004 2.00 NS
Moisture Content (M) 3 0.007 0.002 66.67**
Interaction (A X M) 3 0.0001 0.00003 0.015 NS
Total 7 0.011 0.002
____________________________________________________________________
(2) Plywood
_____________________________________________________________________
Source of Degree of Sum of Mean Fvalue
Variation Freedom, DF Squares, SS Squares, MS
_____________________________________________________________________
Accession (A) 1 0.006 0.006 3.00 NS
Moisture Content (M) 3 0.007 0.002 66.67**
Interaction (A X M) 3 0.0001 0.00003 0.015 NS
Total 7 0.013 0.002
_____________________________________________________________________
* Significant Difference
** Highly Significant Difference
NS Non Significant

223
(3) Concrete
_____________________________________________________________________
Source of Degree of Sum of Mean Fvalue
Variation Freedom, DF Squares, SS Squares, MS
_____________________________________________________________________
Accession (A) 1 0.001 0.001 0.333 NS
Moisture Content (M) 3 0.008 0.003 100.00**
Interaction (A X M) 3 0.0001 0.00003 0.030 NS
Total 7 0.009 0.001
_____________________________________________________________________
(4) Glass
_____________________________________________________________________
Source of Degree of Sum of Mean Fvalue
Variation Freedom, DF Squares, SS Squares, MS
_____________________________________________________________________
Accession (A) 1 0.001 0.001 0.333 NS
Moisture Content (M) 3 0.001 0.0003 10.00*
Interaction (A X M) 3 0.0001 0.00003 0.069 NS
Total 7 0.003 0.0004
_____________________________________________________________________
* Significant Difference
** Highly Significant Difference
NS Non Significant

224
Table A1-11: Regression Equations for Static Coefficient of Friction
in the Moisture Content Range of 5.3 to 22.4% wb.
_____________________________________________________________________
Property Beniseed Linear Regression R– Square Correlation
Accession Equation Coefficient
_____________________________________________________________________
Mild Steel Yandev 55 0.972 - 0.0165M 0.0647 -0.254
Mild Steel E8 0.423 + 0.002M 0.196 0.443
Plywood Yandev 55 0.432 + 0.003M 0.465 0.682
Plywood E8 0.376 + 0.003M 0.458 0.677
Concrete Yandev 55 0.532 + 0.001M 0.061 0.247
Concrete E8 0.511 + 0.001M 0.061 0.246
Glass Yandev 55 0.350 + 0.001M 0.179 0.423
Glass E8 0.325 + 0.001M 0.172 0.414
M = Moisture Content, % wb

225
APPENDIX TWO
2.0 MECHANICAL BEHAVIOUR OF BENISEEDS UNDER COMPRESSION LOADING USING UNIVERAL TESTING MACHINE (UTM-M350-5KN AX RANGE)
Table: A2 – 1: Mechanical Behaviour of Undehulled Yandev – 55
Beniseed Accession under Compression Loading
…………………………………………………………………………………………
S/N Height of Load Deformation Energy Load Deformation Energy
Loading at Yield at Yield at Yield at Break at Break at Break
mm N mm J (10-3) N mm J (10-3)
…………………………………………………………………………………………
1. 2.1000 8.1000 0.0840 0.0004 37.400 0.7640 0.0155
2. 2.1000 7.0000 0.0920 0.0004 34.100 0.6950 0.0100
3. 2.1000 8.3000 0.0530 0.0003 39.300 0.7140 0.0128
4. 2.4000 6.8000 0.2450 0.0002 28.600 0.9750 0.0130
5. 2.2000 7.0000 0.2330 0.0002 33.800 0.8590 0.0094
6. 2.3000 7.8000 0.3960 0.0013 38.500 0.8800 0.0114
7. 2.2000 7.0000 0.0920 0.0003 34.100 0.7740 0.0104
8. 2.4000 9.7000 0.5660 0.0015 43.400 1.0130 0.0104
9. 2.1000 8.1000 0.2290 0.0010 37.200 0.7710 0.0109
10 2.4000 7.5000 0.3370 0.0015 31.400 0.8630 0.0090
…………………………………………………………………………………………
Min. 2.1000 6.8000 0.0530 0.0002 28.600 0.6950 0.0094
Mean 2.2300 7.7300 0.2327 0.0007 35.780 0.8308 0.0109
Max. 2.2400 9.7000 0.5660 0.0015 43.400 1.0130 0.0130
S.D 0.1338 0.8820 0.1642 0.0006 4.253 0.1062 0.0012
………………………………………………………………………………………
Height of Loading - Cross Head Position / Travel, Excluding Grips (mm)
Load at Yield – Force at Point of Yield , (N). Yield is the Point at which Initial
Straight Line Portion of Load / Deformation Curve Dips, i.e Drop off
Deformation at Yield – Distance Travelled at Point of Yield
Energy at Yield – Work Done to Point of Yield (Nm)
Load at Break – Force at which Maximum Deformation is reached (N)
Deformation at Break – Maximum Deformation (mm)
Energy at Break – Energy at Point of Maximum Deformation (Nm)
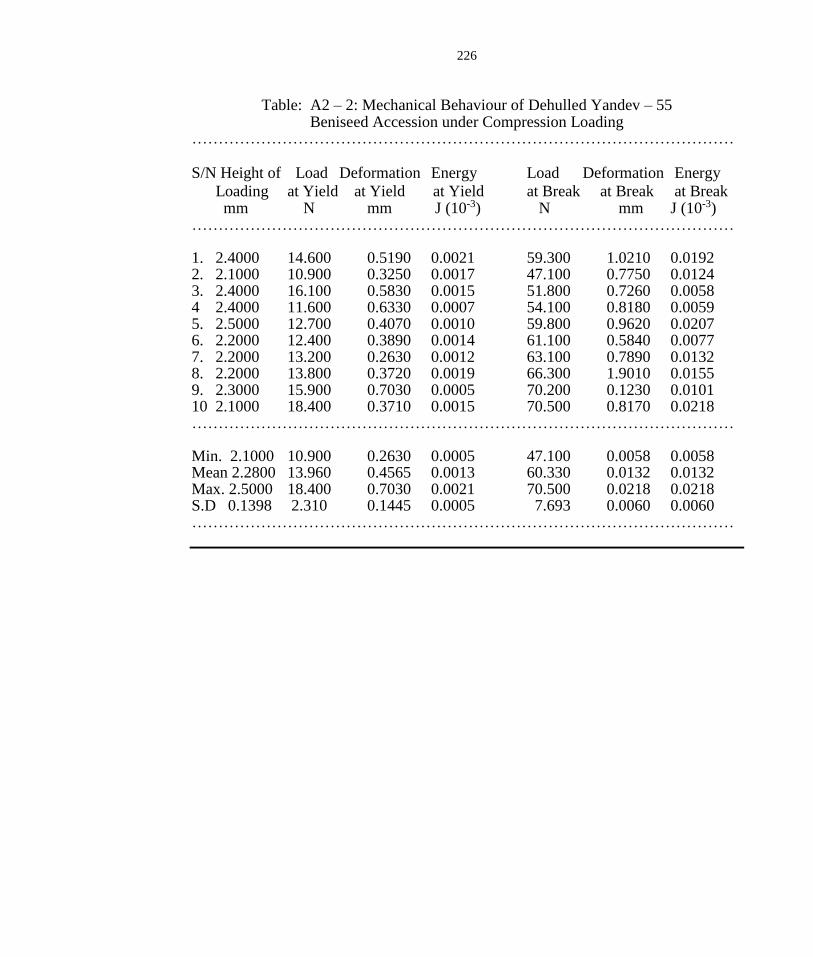
226
Table: A2 – 2: Mechanical Behaviour of Dehulled Yandev – 55 Beniseed Accession under Compression Loading
………………………………………………………………………………………… S/N Height of Load Deformation Energy Load Deformation Energy
Loading at Yield at Yield at Yield at Break at Break at Break mm N mm J (10-3) N mm J (10-3) ………………………………………………………………………………………… 1. 2.4000 14.600 0.5190 0.0021 59.300 1.0210 0.0192 2. 2.1000 10.900 0.3250 0.0017 47.100 0.7750 0.0124 3. 2.4000 16.100 0.5830 0.0015 51.800 0.7260 0.0058 4 2.4000 11.600 0.6330 0.0007 54.100 0.8180 0.0059 5. 2.5000 12.700 0.4070 0.0010 59.800 0.9620 0.0207 6. 2.2000 12.400 0.3890 0.0014 61.100 0.5840 0.0077 7. 2.2000 13.200 0.2630 0.0012 63.100 0.7890 0.0132 8. 2.2000 13.800 0.3720 0.0019 66.300 1.9010 0.0155 9. 2.3000 15.900 0.7030 0.0005 70.200 0.1230 0.0101 10 2.1000 18.400 0.3710 0.0015 70.500 0.8170 0.0218 ………………………………………………………………………………………… Min. 2.1000 10.900 0.2630 0.0005 47.100 0.0058 0.0058 Mean 2.2800 13.960 0.4565 0.0013 60.330 0.0132 0.0132 Max. 2.5000 18.400 0.7030 0.0021 70.500 0.0218 0.0218 S.D 0.1398 2.310 0.1445 0.0005 7.693 0.0060 0.0060 …………………………………………………………………………………………
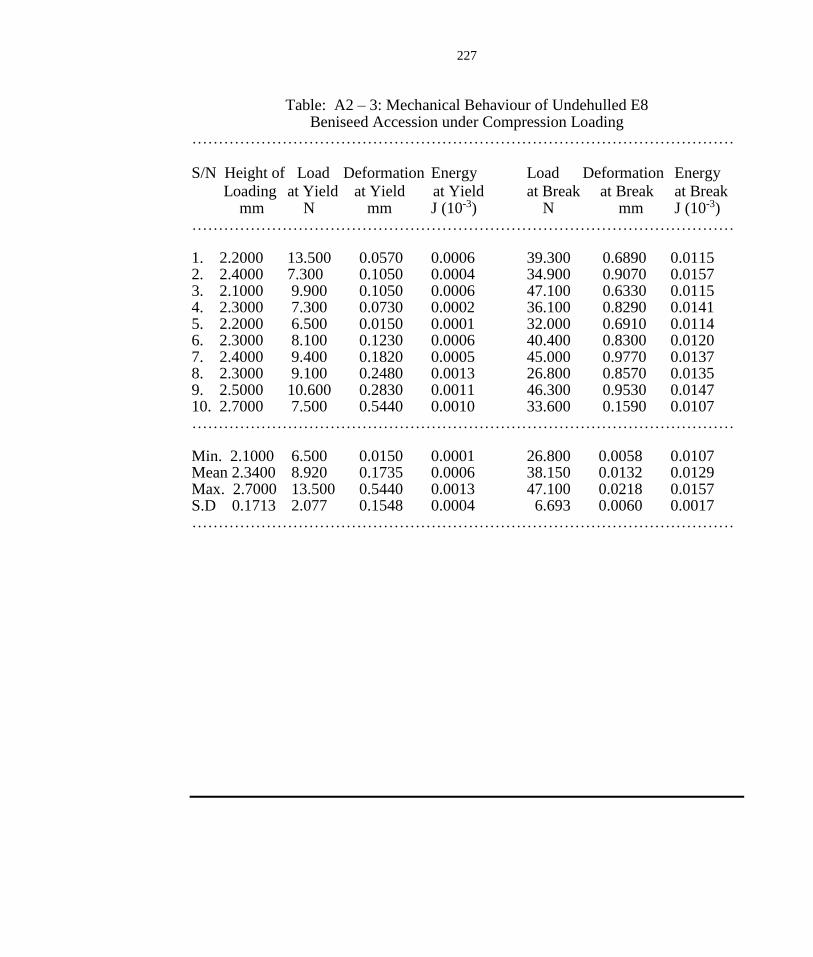
227
Table: A2 – 3: Mechanical Behaviour of Undehulled E8 Beniseed Accession under Compression Loading
………………………………………………………………………………………… S/N Height of Load Deformation Energy Load Deformation Energy
Loading at Yield at Yield at Yield at Break at Break at Break mm N mm J (10-3) N mm J (10-3) ………………………………………………………………………………………… 1. 2.2000 13.500 0.0570 0.0006 39.300 0.6890 0.0115 2. 2.4000 7.300 0.1050 0.0004 34.900 0.9070 0.0157 3. 2.1000 9.900 0.1050 0.0006 47.100 0.6330 0.0115 4. 2.3000 7.300 0.0730 0.0002 36.100 0.8290 0.0141 5. 2.2000 6.500 0.0150 0.0001 32.000 0.6910 0.0114 6. 2.3000 8.100 0.1230 0.0006 40.400 0.8300 0.0120 7. 2.4000 9.400 0.1820 0.0005 45.000 0.9770 0.0137 8. 2.3000 9.100 0.2480 0.0013 26.800 0.8570 0.0135 9. 2.5000 10.600 0.2830 0.0011 46.300 0.9530 0.0147 10. 2.7000 7.500 0.5440 0.0010 33.600 0.1590 0.0107 ………………………………………………………………………………………… Min. 2.1000 6.500 0.0150 0.0001 26.800 0.0058 0.0107 Mean 2.3400 8.920 0.1735 0.0006 38.150 0.0132 0.0129 Max. 2.7000 13.500 0.5440 0.0013 47.100 0.0218 0.0157 S.D 0.1713 2.077 0.1548 0.0004 6.693 0.0060 0.0017 …………………………………………………………………………………………
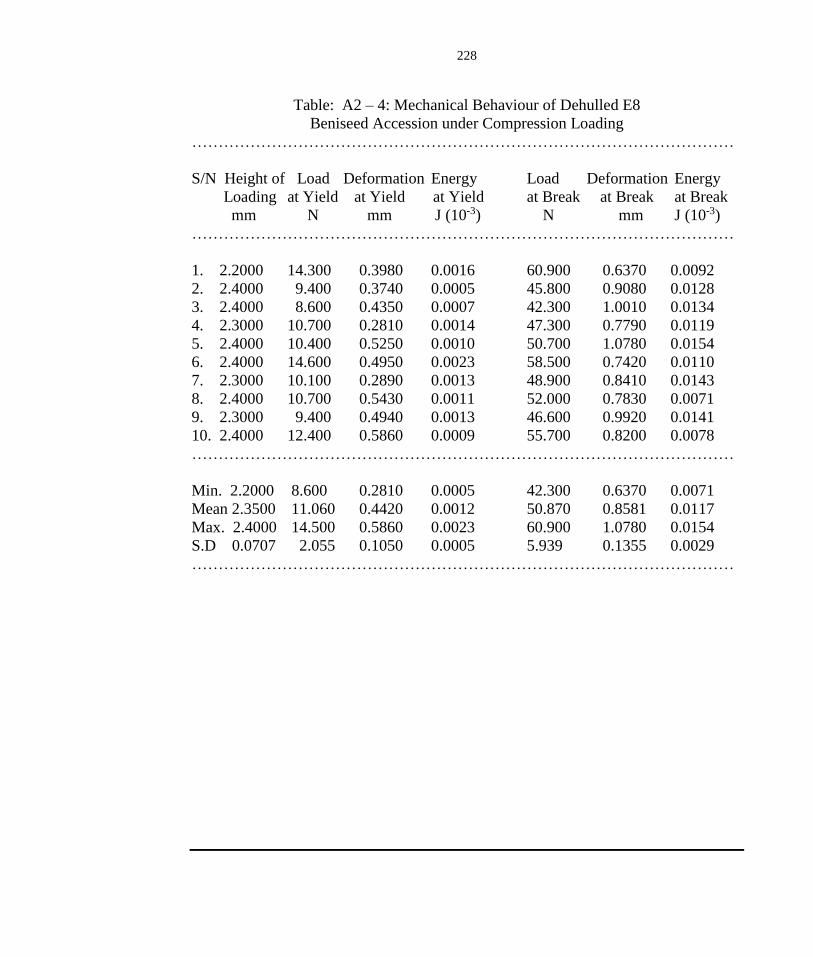
228
Table: A2 – 4: Mechanical Behaviour of Dehulled E8
Beniseed Accession under Compression Loading
…………………………………………………………………………………………
S/N Height of Load Deformation Energy Load Deformation Energy
Loading at Yield at Yield at Yield at Break at Break at Break
mm N mm J (10-3) N mm J (10-3)
…………………………………………………………………………………………
1. 2.2000 14.300 0.3980 0.0016 60.900 0.6370 0.0092
2. 2.4000 9.400 0.3740 0.0005 45.800 0.9080 0.0128
3. 2.4000 8.600 0.4350 0.0007 42.300 1.0010 0.0134
4. 2.3000 10.700 0.2810 0.0014 47.300 0.7790 0.0119
5. 2.4000 10.400 0.5250 0.0010 50.700 1.0780 0.0154
6. 2.4000 14.600 0.4950 0.0023 58.500 0.7420 0.0110
7. 2.3000 10.100 0.2890 0.0013 48.900 0.8410 0.0143
8. 2.4000 10.700 0.5430 0.0011 52.000 0.7830 0.0071
9. 2.3000 9.400 0.4940 0.0013 46.600 0.9920 0.0141
10. 2.4000 12.400 0.5860 0.0009 55.700 0.8200 0.0078
…………………………………………………………………………………………
Min. 2.2000 8.600 0.2810 0.0005 42.300 0.6370 0.0071
Mean 2.3500 11.060 0.4420 0.0012 50.870 0.8581 0.0117
Max. 2.4000 14.500 0.5860 0.0023 60.900 1.0780 0.0154
S.D 0.0707 2.055 0.1050 0.0005 5.939 0.1355 0.0029
…………………………………………………………………………………………

229
Table A2 -5: Mean Values of Rupture Force, Specific Deformation and Energy
Requirement of two Beniseed Accessions at Different Moisture Content Levels
Pre – Conditioning Moisture Rupture Specific Energy Requiement,
Content Force, N Deformation, mm J (10-3)
%,wb ___________ _______________ ______________
Yandev 55 E8 Yandev 55 E8 Yandev 55 E8
Undehulled 4.10 5.77 7.09 0.19 0.13 0.5 0.4
5.31 7.73 8.92 0.23 0.17 0.7 0.6
7.69 9.71 10.89 0.26 0.19 1.0 0.8
-------------------------------------------------------------------------------------------------------
Dehulled 4.10 11.79 8.74 0.37 0.35 1.1 1.0
5.30 13.96 11.06 0.46 0.44 1.3 1.2
7.69 15.12 13.01 0.48 0.46 1.6 1.4
_____________________________________________________________________

230
Table A2 – 6: Analysis of Variance for the Mechanical Characteristics
of Beniseed at 5% Significance Level
(1) Rupture Force (Newton)
_____________________________________________________________________
Source of Degree of Sum of Mean Fvalue
Variation Freedom, DF Squares, SS Squares, MS
_____________________________________________________________________
Main Effects: Accession (A) 1 1.591 1.591 0.0344NS
Conditioning (C) 1 46.295 46.295 3.141 NS
Moisture Content (M) 2 29.476 14.738 1.281 NS
2 – Way Interactions (A X C) 1 11.505 11.505 221.25**
(A X M) 2 0.104 0.052 1.019 NS
(M X C) 2 0.101 0.051 0.646 NS
3 – Way Interactions (A X C X M) 2 0.157 0.079 0.0097 NS
Total 11 89.231 8.112
_____________________________________________________________________
* Significant Difference
** Highly Significant Difference
NS Non Significant
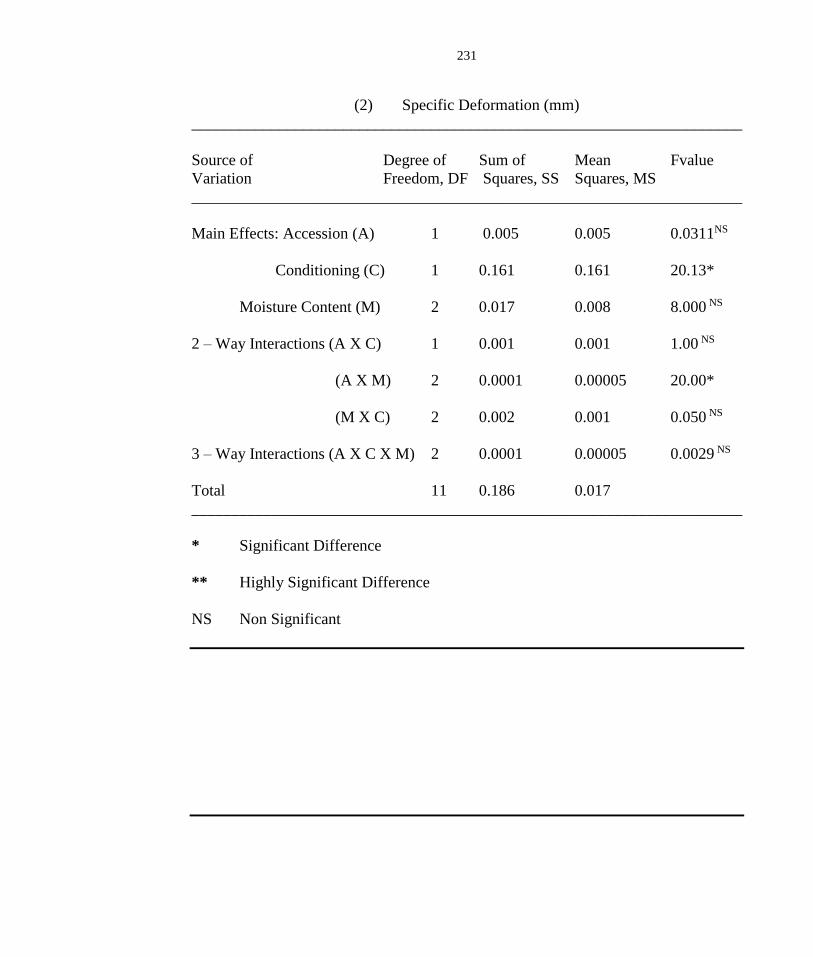
231
(2) Specific Deformation (mm)
_____________________________________________________________________
Source of Degree of Sum of Mean Fvalue
Variation Freedom, DF Squares, SS Squares, MS
_____________________________________________________________________
Main Effects: Accession (A) 1 0.005 0.005 0.0311NS
Conditioning (C) 1 0.161 0.161 20.13*
Moisture Content (M) 2 0.017 0.008 8.000 NS
2 – Way Interactions (A X C) 1 0.001 0.001 1.00 NS
(A X M) 2 0.0001 0.00005 20.00*
(M X C) 2 0.002 0.001 0.050 NS
3 – Way Interactions (A X C X M) 2 0.0001 0.00005 0.0029 NS
Total 11 0.186 0.017
_____________________________________________________________________
* Significant Difference
** Highly Significant Difference
NS Non Significant

232
(3) Energy Requirement (Joule)
_____________________________________________________________________
Source of Degree of Sum of Mean Fvalue
Variation Freedom, DF Squares, SS Squares, MS
_____________________________________________________________________
Main Effects: Accession (A) 1 0.053 0.053 0.0491N
Conditioning (C) 1 1.080 1.080 5.320 NS
Moisture Content (M) 2 0.407 0.203 203.00**
2 – Way Interactions (A X C) 1 0.001 0.001 10.00NS
(A X M) 2 0.007 0.003 0.333 NS
(M X C) 2 0.0001 0.00005 1.00 NS
3 – Way Interactions (A X C X M) 2 0.0001 0.00005 0.0004 NS
Total 11 1.547 0.141
_____________________________________________________________________
* Significant Difference
** Highly Significant Difference
NS Non Significant
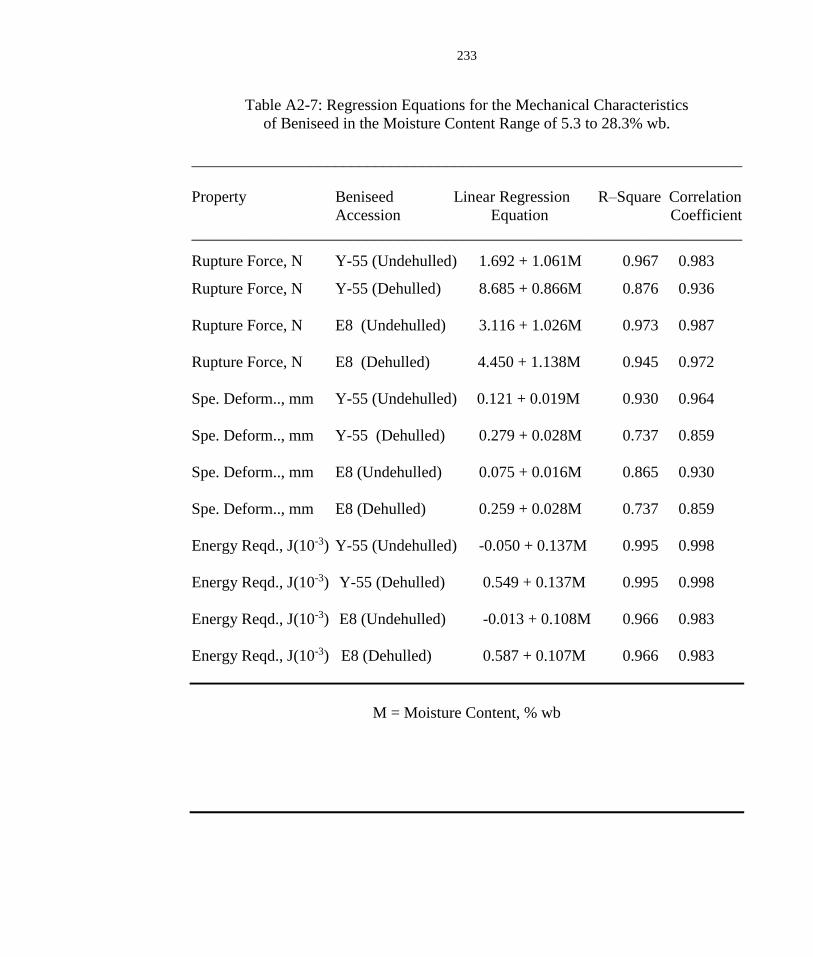
233
Table A2-7: Regression Equations for the Mechanical Characteristics
of Beniseed in the Moisture Content Range of 5.3 to 28.3% wb.
_____________________________________________________________________
Property Beniseed Linear Regression R–Square Correlation
Accession Equation Coefficient
_____________________________________________________________________
Rupture Force, N Y-55 (Undehulled) 1.692 + 1.061M 0.967 0.983
Rupture Force, N Y-55 (Dehulled) 8.685 + 0.866M 0.876 0.936
Rupture Force, N E8 (Undehulled) 3.116 + 1.026M 0.973 0.987
Rupture Force, N E8 (Dehulled) 4.450 + 1.138M 0.945 0.972
Spe. Deform.., mm Y-55 (Undehulled) 0.121 + 0.019M 0.930 0.964
Spe. Deform.., mm Y-55 (Dehulled) 0.279 + 0.028M 0.737 0.859
Spe. Deform.., mm E8 (Undehulled) 0.075 + 0.016M 0.865 0.930
Spe. Deform.., mm E8 (Dehulled) 0.259 + 0.028M 0.737 0.859
Energy Reqd., J(10-3) Y-55 (Undehulled) -0.050 + 0.137M 0.995 0.998
Energy Reqd., J(10-3) Y-55 (Dehulled) 0.549 + 0.137M 0.995 0.998
Energy Reqd., J(10-3) E8 (Undehulled) -0.013 + 0.108M 0.966 0.983
Energy Reqd., J(10-3) E8 (Dehulled) 0.587 + 0.107M 0.966 0.983
M = Moisture Content, % wb

234
APPENDIX THREE
3.0 INFORMATION ON OIL EXPELLERS DEVELOPMENT
Table A3-1: Some Manufacturers of Cottage Scale Oil Expellers
S/N Name and Address S/N Name and Address
1. Techo Quip Ltd. 2. Indev Ltd.
Techno Industrial Estate 3/5 Adebambo St.
15, Olushola Ikare Street Obanikoro, Lagos
Alake Bus Stop Tel. 964498
P. O. Box 5323, Ikeja, Lagos
3. Chidi Aguba Nig. Ltd. 4. Nucleus Ventures (Nig.) Ltd.
55, Western Avenue Ariwoola House
Surulere, Lagos Opp. Olona Motors,
Polytechnic Road,
P. O. Box 19910, U. I.
Tel: 02-2413501
5. Ultra Unique Eng. Ltd. 6. Nova Technologies (Nig) Ltd.
36/38 Winners way, Ajibode Bus Stop, U.I., Ojoo
Off Basorun MKT Road Ibadan
Orita Basorun, Ibadan Tel (02) 8103960
7. Lawod Metals Ltd. 8. Tiny Tech Plants
9, Alekuwodo Road Tagore Road, Rajkot
Okefia, Osogbo. 360 000 2 India
Tel: 035 – 232241 Tel: 91 – 281 477466
9. Marthias Reinartz Neuss 10. Simon Rosedowns Ltd.
Industrie Str. 14, CannonStreet, Hull,
England P.O.Box 100950
Tel: 0482 – 29864 Fed. Rep. Germany
Tel: 02101 – 272028 _____________________________________________________________________

235
Table A3-2: Design Specifications of Some Cottage Scale Oil Expellers
No Name Capacity
Kg/h
Power
Requirement
Hp
Wormshaft
Speed
Rpm
Inner
Diameter
of Chamber
mm
Length
of
Chamber
mm / No
of Bars
Overall
Dimension
Mm
L, B, H
Total
Wt.
Kg
1.
2.
Table Oil
Expeller (S)
Mini 40 Oil
Expeller
30
40
3
3
-
120
58
62
16
234
1060, 530, 890
760, 450, 550
203
250
3. Table Oil
Expeller (Du)
40 5 - 69 18 1060, 530, 890 208
4. Infant Oil
Expeller
40 5 45 78 406 1625, 700,1145 440
5. TableOil
Expeller (De)
50 5 - 73 20 1140, 550, 960 230
6. TableOil
Expeller
55 5 - 80 22 1140, 550,960 255
7. BabyOil
Expeller No1
56 7.5 33 - 610 2083, 610, 1370 1000
8. Baby Oil
Expeller(SOL)
60 7 35 - - 1880, 610,1370 1000
9. BabyOil
Expeller (SDG)
72 15 22 - - 2753,1066,2051 2400
10. BabyOil
Expeller (NO2)
83.3 10 - 126 686 2436,1066,2055 1500
11.
12.
Tiny Tech
Oil Expeller
Young Oil
Expeller
100
180
10
15
-
22
89
124
-
762
1960 ,460, 500
2250,1060,2220
-
2500

236
APPENDIX FOUR
4.0 MECHANICAL EXPRESSION OF OIL FROM BENISEED
USING THE FABRICATED OIL EXPELLER
Table A4-1: Effect of Wormshaft Speed and Moisture Content
of two Beniseed Accessions on Machine Throughput __________________________________________________________________________________
S/N Wormshaft Mositure Crushing Time Machine
Speed Content min. sec. Throughput
rpm %, wb kg/h
__________________ _______________
Yandev – 55 E8 Yandev – 55 E8
_____________________________________________________________________
1 30 4.10 12 02 13 28 9.97 9.06
2 30 5.31 10 06 10 25 11.88 11.22
3 30 7.69 11 20 11 50 10.59 10.14
4 30 10.32 11 26 12 26 10.49 9.42
5 45 4.10 10 35 12 14 11.33 9.88
6 45 5.31 9 22 10 02 12.81 11.96
7 45 7.69 10 15 10 26 11.71 11.50
8 45 10.32 10 19 11 07 11.63 10.79
9 60 4.10 10 21 11 10 11.59 10.75
10 60 5.31 9 14 9 56 12.99 12.08
11 60 7.69 10 08 10 24 11.84 11.54
12 60 10.32 10 17 10 35 11.67 11.34
13 75 4.10 10 12 10 46 11.56 10.46
14 75 5.31 9 05 10 17 13.21 11.85
15 75 7.69 10 01 10 26 11.98 11.50
16 75 10.3 2 10 05 10 44 11.90 11.18

237
Table A4-2: Effect of Wormshaft Speed and Moisture Content
of two Beniseed Accessions on Oil Recovery
_____________________________________________________________________
S/N Wormshaft Mositure *Expressed Oil Filtered Oil **Oil
Speed Content cc cc Recovery, %
rpm %, wb Yandev 55 E8 Yandev 55 E Yandev 55 E8 ______________________________________________________________________________________
1 30 4.10 656 477 450 397 37.56 33.70
2 30 5.31 560 601 510 524 42.57 44.48
3 30 7.69 647 594 498 495 41.57 42.02
4 30 10.32 488 566 415 407 34.64 34.55
5 45 4.10 874 920 846 764 70.62 64.85
6 45 5.31 999 936 954 875 79.63 74.28
7 45 7.69 931 910 793 724 66.19 61.43
8 45 10.32 790 807 718 696 59.13 59.08
9 60 4.10 667 646 610 588 50.92 49.91
10 60 5.31 732 696 657 621 54.84 52.72
11 60 7.69 565 552 519 508 43.32 43.12
12 60 10.32 478 472 436 461 42.99 39.13
13 75 4.10 509 484 482 457 40.23 38.79
14 75 5.31 513 495 496 478 41.40 40.58
15 75 7.69 418 407 394 383 32.88 32.51
16 75 10.3 2 406 395 389 376 32.47 31.92
* Expressed oil was from each 2kg sample and on a – one pass / crushing basis.
** The initial oil content of Yandev – 55 and E8 Samples were determined to be
55.12 and 54.20% with an average relative density of 0.92. Thus, the respective
volumes of expressable oil are 1198 and 1178cc respectively.

238
Table A4-3: Effect of Wormshaft Speed and Moisture Content
of two Beniseed Accessions on the Oil and Cake Qualities
_____________________________________________________________________
S/N Wormshaft Mositure Residual Oil Moisture Content Colour
Speed Content in Cake, % in Cake, % of Oil
rpm %, wb ___________ ___________ ________________
Yandev 55 E8 Yandev 55 E8 Yandev 55 E8
1 30 4.10 40.39 42.77 3.30 3.52 Light Light
2 30 5.31 37.30 36.12 4.60 4.64 Light Yellow
3 30 7.69 37.92 37.64 6.05 6.25 Yellow Yellow
4 30 10.32 42.19 42.25 6.22 7.09 Light Light
5 45 4.10 19.98 23.55 3.20 3.39 Light Light
6 45 5.31 14.43 17.73 4.60 4.60 Golden Golden
7 45 7.69 22.72 25.64 6.16 6.18 Golden Golden
8 45 10.32 27.08 27.11 6.44 6.52 Yellow Light
9 60 4.10 32.15 32.77 3.20 3.38 Light Light
10 60 5.31 29.73 31.08 4.65 4.68 Golden Golden
11 60 7.69 36.84 36.96 6.18 6.21 Golden Light
12 60 10.32 37.04 39.43 6.68 6.59 Light Golden
13 75 4.10 38.75 39.64 3.30 3.55 Light Light
14 75 5.31 38.02 38.53 3.30 3.57 Light Light
15 75 7.69 43.28 43.51 6.16 6.19 Light Yellow
16 75 10.3 2 43.54 43.88 6.70 6.73 Yellow Yellow

239
Table A4-4: Analysis of Variance for Oil Recovery at 5% Significance Level
__________________________________________________________________________________
Source of Degree of Sum of Mean F - value
Variation Freedom (DF) Squares (SS) Squares (MS)
_____________________________________________________________________
Main Effects: Accession (A) 1 24.308 24.308 0.117NS
Moisture Content (M) 3 624.571 208.190 0.136 NS
Wormshaft Speed (N) 3 4599.917 1533.306 117.19**
2 – Way Interactions (A X M) 3 4.586 1.529 0.297 NS
(A X N) 3 15.455 5.152 0.263 NS
(M X N) 9 176.213 19.579 9.209*
3 – Way Interactions (AX M X N) 9 19.138 2.126 0.0121NS
Total 31 5464.187 176.264
_____________________________________________________________________
* Significant Difference
** Highly Significant Difference
NS Non Significant

240
Table A4-5: Regression Equations for Beniseed Oil Recovery within 4.1 to 10.32%
Moisture Content (wb) and 30 to 75rpm Wormshaft Speed
_____________________________________________________________________
Beniseed Cubic Regression R–Square Correlation
Accession Equation Coefficient
Yandev 55 E = -0.0097N3 + 0.113N2 – 1.616N + 55.3 0.0815 -0.2876
E = -35.48M3 + 24.76M2 – 18.59M + 56.18 0.1024 -0.3903
E8 E = -0.0084N3 + 0.097N2 – 1.359N + 52.49 0.0734 -0.2771
E = -33.05M3 + 23.32M2 – 17.94M + 54.03 0.1114 -0.4033
E = Oil Recovery, % N = Wormshaft Speed, rpm M = Moisture Content, % wb.
Table A4-6: Results of Duncan Mean Range Test
for Oil Recovery at 5% Significant Level*
Levels Wormshaft Speed Moisture Content
(N) (M)
1 38.8862a 48.3225a
2 66.9012b 53.8125a
3 47.1188c 45.3800a
4 36.3475a 41.7388a
*Any two means with a common letter in the same column

241
are not significantly different
APPENDIX FIVE
5.0 ISOMETRIC AND ORTHOGRAPHIC PROJECTIONS OF THE
DEVELOPED OIL EXPRESSION PLANT
A5-4: Isometric and Orthographic Projections of the
Special Worms and Wormshaft Assembly

242
35 75 12 50 25 37.5 37.5 37.5 37.5 37.5 12 62.5 30 35 75
B
BØ60
SECTION B - B
AA
380 110
600
SECTION A - A
ALL DIMENSIONS IN MMSCALE / 1:4
110

243
A5-5: Isometric and Orthographic Projections of Expeller’s Press Worm
PITCH 37.5
6
60 35
47.5
Ø60 Ø35
SECTION B- B
37.5
6
6
6
Pitch37.5
6 3750
37.50
ALL DIMENSIONS IN MM
SCALE 1 / 1.5

244
A5-6: Isometric and Orthographic Projections of Expeller’s Cone
37.53
12.5
6
SECTION A - A
ALL DIMENSIONS IN MM
SCALE 1: 1.5
ø47.5
ø60
12.5
ø35

245
A5-7: Isometric Projection of the Fabricated Oil Filter Press
Oil
PumpOil
Inlet
Oil
Outlet
Filter
Plates
SCALE 1: 6

246
A5-8: Orthographic Projection of the Fabricated Oil Filter Press
2 5 68
1 79
311
17
18
12 13
300mm
4
14
15
16
300mm
500mm

247
A5-9: Isometric Projection of the Fabricated Oil Filter Plate
Oil
Outlet
Oil
Inlets
Oil
Grooves
300mm Solid Plate
300mm
Plate
Handle
SCALE 1 : 4
248
APPENDIX SIX
6.0 LETTERS AND CORRESPONDENCE ON MECHANICAL OIL EXPRESSION

249
250

251
Related Documents