www.exitcertified.com IBM Cognos Cube Designer - Design Dynamic Cubes (v11.0) (B6063G) Presented To Sharonne Ayers Course: B6063G Class ID: 155661 Dates: 2021/02/17-2021/02/18 Sharonne Ayers [email protected] TCW Adobe Connect

Welcome message from author
This document is posted to help you gain knowledge. Please leave a comment to let me know what you think about it! Share it to your friends and learn new things together.
Transcript
www.exitcerti�ed.com
IBM Cognos Cube Designer - DesignDynamic Cubes (v11.0) (B6063G)
Presented To Sharonne Ayers
Course: B6063GClass ID: 155661Dates: 2021/02/17-2021/02/18
Sharonne [email protected]
TCW Adobe Connect

®
IBM Training
Demonstrations, Exercises and Solutions
IBM Cognos Cube Designer:Design Dynamic Cubes (v11.0)Course code B6063 ERC 2.0
®
IBM Training
Name: Sharonne Ayers Email: [email protected] TCW Adobe Connect 2021/02/17
Preface
© Copyright IBM Corp. 2012, 2016 P-2 Course materials may not be reproduced in whole or in part without the prior written permission of IBM.
April 2016 NOTICES
This information was developed for products and services offered in the USA.
IBM may not offer the products, services, or features discussed in this document in other countries. Consult your local IBM representative for information on the products and services currently available in your area. Any reference to an IBM product, program, or service is not intended to state or imply that only that IBM product, program, or service may be used. Any functionally equivalent product, program, or service that does not infringe any IBM intellectual property right may be used instead. However, it is the user's responsibility to evaluate and verify the operation of any non-IBM product, program, or service. IBM may have patents or pending patent applications covering subject matter described in this document. The furnishing of this document does not grant you any license to these patents. You can send license inquiries, in writing, to:
IBM Director of Licensing IBM Corporation North Castle Drive, MD-NC119 Armonk, NY 10504-1785 United States of America
The following paragraph does not apply to the United Kingdom or any other country where such provisions are inconsistent with local law: INTERNATIONAL BUSINESS MACHINES CORPORATION PROVIDES THIS PUBLICATION "AS IS" WITHOUT WARRANTY OF ANY KIND, EITHER EXPRESS OR IMPLIED, INCLUDING, BUT NOT LIMITED TO, THE IMPLIED WARRANTIES OF NON-INFRINGEMENT, MERCHANTABILITY OR FITNESS FOR A PARTICULAR PURPOSE. Some states do not allow disclaimer of express or implied warranties in certain transactions, therefore, this statement may not apply to you.
This information could include technical inaccuracies or typographical errors. Changes are periodically made to the information herein; these changes will be incorporated in new editions of the publication. IBM may make improvements and/or changes in the product(s) and/or the program(s) described in this publication at any time without notice.
Any references in this information to non-IBM websites are provided for convenience only and do not in any manner serve as an endorsement of those websites. The materials at those websites are not part of the materials for this IBM product and use of those websites is at your own risk.
IBM may use or distribute any of the information you supply in any way it believes appropriate without incurring any obligation to you. Information concerning non-IBM products was obtained from the suppliers of those products, their published announcements or other publicly available sources. IBM has not tested those products and cannot confirm the accuracy of performance, compatibility or any other claims related to non-IBM products. Questions on the capabilities of non-IBM products should be addressed to the suppliers of those products.
This information contains examples of data and reports used in daily business operations. To illustrate them as completely as possible, the examples include the names of individuals, companies, brands, and products. All of these names are fictitious and any similarity to the names and addresses used by an actual business enterprise is entirely coincidental.
TRADEMARKS
IBM, the IBM logo, ibm.com, Cognos and TM1 are trademarks or registered trademarks of International Business Machines Corp., registered in many jurisdictions worldwide. Other product and service names might be trademarks of IBM or other companies. A current list of IBM trademarks is available on the web at “Copyright and trademark information” at www.ibm.com/legal/copytrade.shtml.
Adobe, the Adobe logo, are either registered trademarks or trademarks of Adobe Systems Incorporated in the United States, and/or other countries.
Java and all Java-based trademarks and logos are trademarks or registered trademarks of Oracle and/or its affiliates.
Microsoft, Windows, and the Windows logo are trademarks of Microsoft Corporation in the United States, other countries, or both.
UNIX is a registered trademark of The Open Group in the United States and other countries.
© Copyright International Business Machines Corporation 2016.
This document may not be reproduced in whole or in part without the prior written permission of IBM.
US Government Users Restricted Rights - Use, duplication or disclosure restricted by GSA ADP Schedule Contract with IBM Corp.
Name: Sharonne Ayers Email: [email protected] TCW Adobe Connect 2021/02/17
Introduction to IBM Cognos Dynamic Cubes
© Copyright IBM Corporation 2016Course materials may not be reproduced in whole or in part without the written permission of IBM.
Introduction to IBM Cognos Dynamic Cubes
IBM Cognos Dynamic Cubes
Name: Sharonne Ayers Email: [email protected] TCW Adobe Connect 2021/02/17
Uni t 1 In t roduct ion to IBM Cognos Dynamic Cubes
© Copyright IBM Corp. 2012, 2016 1-21 Course materials may not be reproduced in whole or in part without the prior written permission of IBM.
© Copyright IBM Corporation 2016Introduction to IBM Cognos Dynamic Cubes
Demonstration 1
Explore the Dynamic Cube lifecycle
Demonstration 1: Explore the Dynamic Cube lifecycle
The panes in the Dynamic Cubes interface described in this demonstration are called by their names as dictated by product management. These can be confusing since the proper names are not always included anywhere in the user interface. They are, however, described here and in unit 2. The Data Source Explorer is the pane on the left side of the interface. It has the word "Source" at the top. The Project Explorer is the middle pane that is labeled "Project Explorer." However, when you click the f(x) tab at the bottom, the Project Explorer becomes the Function Explorer. This tab has toggle functionality. The Object Editor is the pane on the right at the top. It can be labeled differently, based on what object is selected in the Project Explorer. Below the Object Editor is the Properties pane. It contains two tabs, Properties and Issues. Be sure to make note of these UI proper names because they are not always obvious, and they are used in the steps of the demonstrations in this course.
Name: Sharonne Ayers Email: [email protected] TCW Adobe Connect 2021/02/17
Uni t 1 In t roduct ion to IBM Cognos Dynamic Cubes
© Copyright IBM Corp. 2012, 2016 1-22 Course materials may not be reproduced in whole or in part without the prior written permission of IBM.
Demonstration 1: Explore the Dynamic Cube lifecycle Purpose: You want to examine a cube model in Cube Designer, and then publish the cube to demonstrate the resulting package and data source. You will then use the cube as a data source for a query in IBM Cognos Analytics, and demonstrate how to view the cube metrics. The environment provided in this course requires the following services to be started before you begin performing demonstrations and exercises:
• Apache Directory Server • DB2 -DB2COPY 1 - DB2 • DB2DAS - DB2DAS00 • IBM Cognos • World Wide Web Publishing Service
To review the services, on the Taskbar of your environment, click the Services icon, and ensure that the above services are running. If you have closed your image and launched it again, it is a best practice to review the status of the services before continuing with your demonstrations and exercises. If the Apache Directory Server or DB2 -DB2COPY 1 - DB2 service have stopped, you will need to stop the IBM Cognos service, start the stopped service(s), and then start the IBM Cognos service once the previously stopped service(s) has (have) started successfully. You can start and stop a specific service by double-clicking the service to open the Properties dialog box, and then clicking the Stop or Start buttons. Note that it may take 15 minutes or more for the IBM Cognos service to start.
Task 1. Open a cube and examine the structure. 1. Click Start > All Programs > IBM Cognos Cube Designer > IBM Cognos
Cube Designer, and then click Open Existing. 2. Browse to C:\Training\B6063\Start Files\01\Demo 1 and double-click the
Sales.fmd model, and then authenticate as admin/Education1 when you are prompted.
3. In Project Explorer, expand Model > Sales cube. Notice the cube and dimension objects. The Order Date dimension has a red clock badge on its icon . This indicates that it is used as a time dimension.
Name: Sharonne Ayers Email: [email protected] TCW Adobe Connect 2021/02/17
Uni t 1 In t roduct ion to IBM Cognos Dynamic Cubes
© Copyright IBM Corp. 2012, 2016 1-23 Course materials may not be reproduced in whole or in part without the prior written permission of IBM.
4. Expand the Order Date dimension > Levels folder > Order Date_H hierarchy. 5. Collapse the Order Date dimension. 6. Expand the Products dimension > Levels folder, and then double-click the
Product Type level to open its attributes in the Object Editor. 7. Examine the Object Editor and notice the attributes that are assigned to the
Level Unique Key and Member Caption . 8. Repeat the previous two steps for the Product level. 9. In the Data Source Explorer, expand the GOSALESDW > Tables folder, and
examine the data source objects. These objects represent tables from an imported data source.
10. In Project Explorer, double-click the Product level to open it in Object Editor. It should already be open, but you are instructed here to repeat the action in case other clicking has disturbed the state.
11. In the Data Source Explorer, scroll down and expand SLS_PRODUCT_DIM to display the keys, columns, and joins.
12. From the Data Source Explorer, drag the DISCONTINUED_DATE column to the whitespace below the Attribute values in the Object Editor to create a dimension level mapping. A new Attribute/Mapping pair is added to the Product level. This is one way to map a data source column to the dimension as an attribute. Once you drag it to the editor, you can then set its properties and, if applicable, designate it as a Level Unique Key or Member Caption.
13. Click Undo to undo this edit. 14. In Project Explorer, under the Sales cube, double-click the Measures folder to
open it in the Object Editor. Notice that the Sales cube has only one measure, Sales.
15. In the Data Source Explorer, expand SLS_SALES_FACT and then drag the QUANTITY measure to the Object Editor. Notice how measures are mapped to the cube from the Data Source Explorer.
16. Click Undo to undo this edit.
17. Above the Object Editor, click the Sales cube , and in the Object Editor, examine the dimensions.
18. In the Relationship column of the Retailers dimension, click Edit. 19. On the Joins tab, under Retailers, click RETAILER_KEY and then expand the
list to view the columns of the SLS_RTL_DIM table.
Name: Sharonne Ayers Email: [email protected] TCW Adobe Connect 2021/02/17
Uni t 1 In t roduct ion to IBM Cognos Dynamic Cubes
© Copyright IBM Corp. 2012, 2016 1-24 Course materials may not be reproduced in whole or in part without the prior written permission of IBM.
20. Under Measures, click RETAILER_KEY and then expand the list to view the columns of the SLS_SALES_FACT table. Notice how the relationship is made in the join.
21. Press Esc to close the list. 22. Above the Object Editor, click the Sales cube again, and then click the
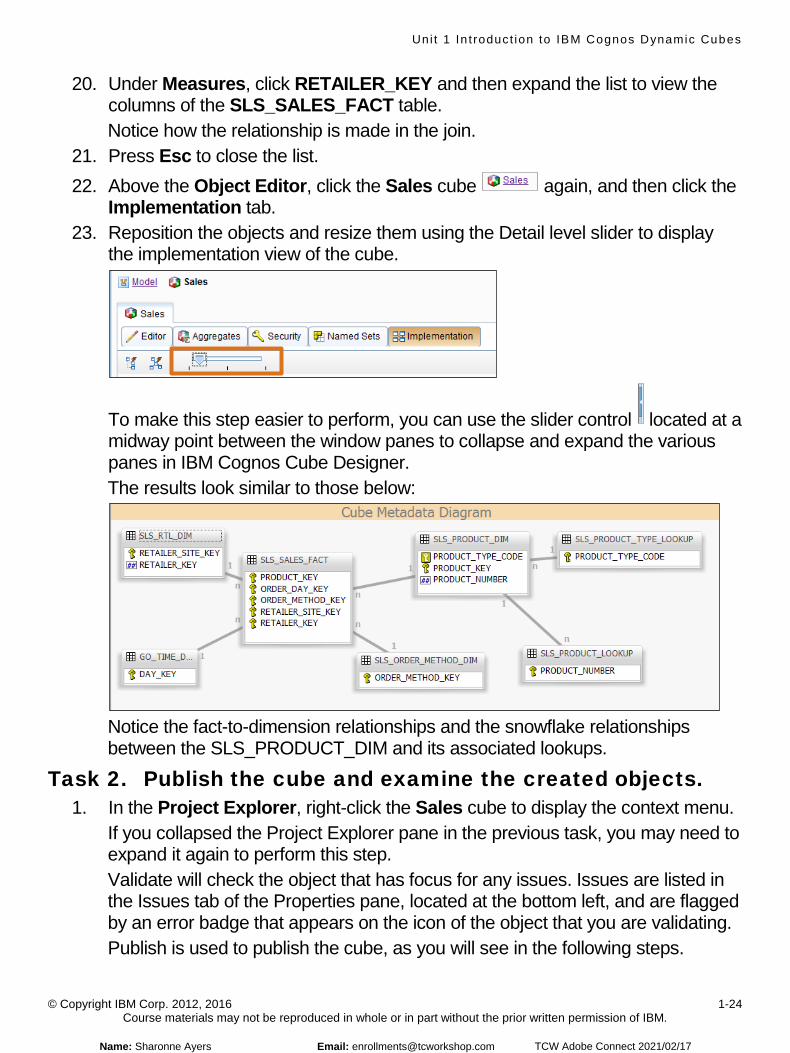
Implementation tab. 23. Reposition the objects and resize them using the Detail level slider to display
the implementation view of the cube.
To make this step easier to perform, you can use the slider control located at a midway point between the window panes to collapse and expand the various panes in IBM Cognos Cube Designer. The results look similar to those below:
Notice the fact-to-dimension relationships and the snowflake relationships between the SLS_PRODUCT_DIM and its associated lookups.
Task 2. Publish the cube and examine the created objects. 1. In the Project Explorer, right-click the Sales cube to display the context menu.
If you collapsed the Project Explorer pane in the previous task, you may need to expand it again to perform this step. Validate will check the object that has focus for any issues. Issues are listed in the Issues tab of the Properties pane, located at the bottom left, and are flagged by an error badge that appears on the icon of the object that you are validating. Publish is used to publish the cube, as you will see in the following steps.
Name: Sharonne Ayers Email: [email protected] TCW Adobe Connect 2021/02/17
Uni t 1 In t roduct ion to IBM Cognos Dynamic Cubes
© Copyright IBM Corp. 2012, 2016 1-25 Course materials may not be reproduced in whole or in part without the prior written permission of IBM.
2. Click Validate. Notice that the Issues tab under the Cube Metadata Diagram displays 0 Issues.
3. Right-click the Sales cube again, click Publish, and then in the Publish window, expand Additional Options. 'Select all options' selects all options in the Publish window. 'Publish a package for this cube' will cause the model package to be published. The default is Public folder, which will publish to Team content in the Content Store. The cube name will be used as the package name. 'Add the dynamic cube to a dispatcher' configures the cube as a data source. 'Start the dynamic cube' will start the cube if you also configure the cube as a data source. 'Associate my account and signon with the cube datasource' allows you to use credentials to access the data source in IBM Cognos Analytics - Reporting.
4. Click Select all options, and then click OK to publish the cube. 5. Once the publish operation is successful, click OK on the Deploy Results
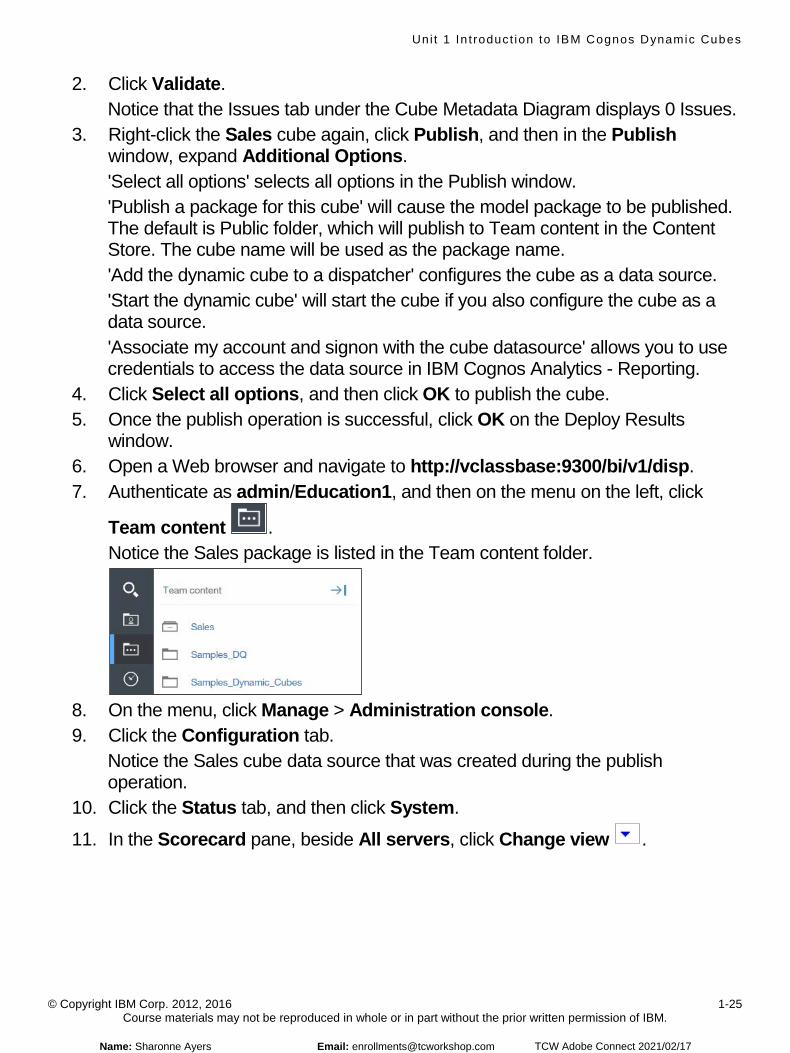
window. 6. Open a Web browser and navigate to http://vclassbase:9300/bi/v1/disp. 7. Authenticate as admin/Education1, and then on the menu on the left, click
Team content . Notice the Sales package is listed in the Team content folder.
8. On the menu, click Manage > Administration console. 9. Click the Configuration tab.
Notice the Sales cube data source that was created during the publish operation.
10. Click the Status tab, and then click System.
11. In the Scorecard pane, beside All servers, click Change view .
Name: Sharonne Ayers Email: [email protected] TCW Adobe Connect 2021/02/17
Uni t 1 In t roduct ion to IBM Cognos Dynamic Cubes
© Copyright IBM Corp. 2012, 2016 1-26 Course materials may not be reproduced in whole or in part without the prior written permission of IBM.
12. Point to Services, and then click Query. The QueryService appears in the Scorecard pane as follows:
13. Click QueryService.
You can see the Sales cube under the Query Service.
14. Next to Sales, click Actions . Notice some of the operations that can be performed on the cube at this point, such as Stop, Start, Restart, and Refresh security settings.
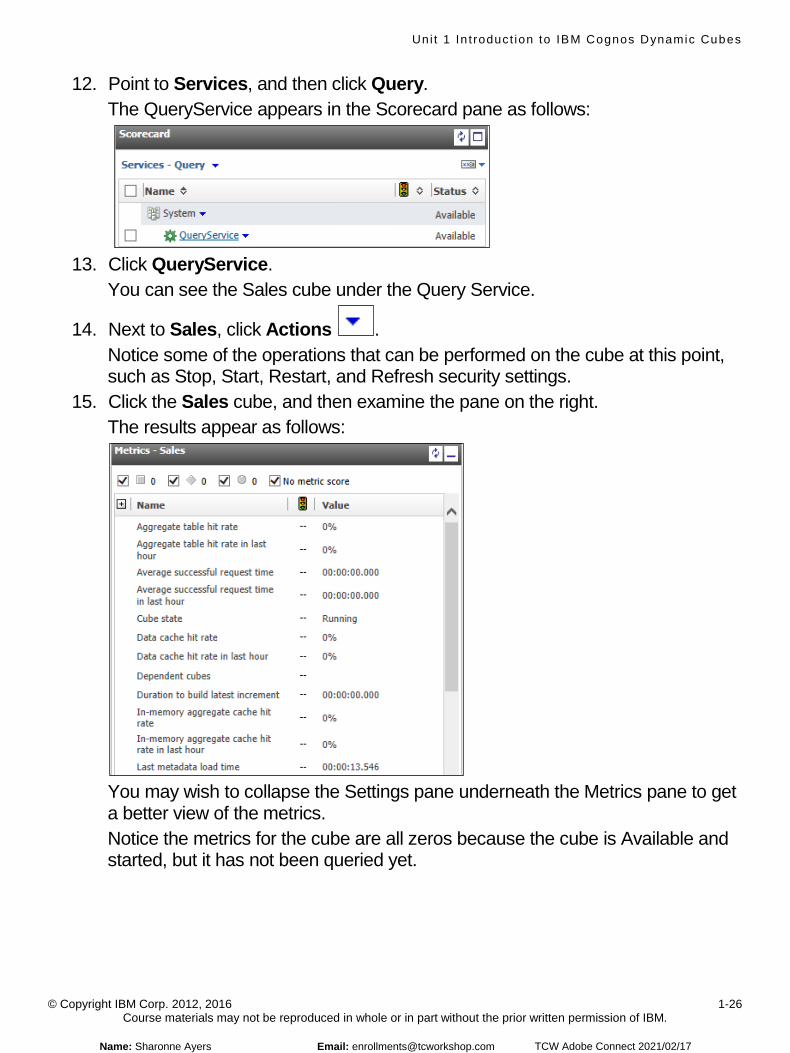
15. Click the Sales cube, and then examine the pane on the right. The results appear as follows:
You may wish to collapse the Settings pane underneath the Metrics pane to get a better view of the metrics. Notice the metrics for the cube are all zeros because the cube is Available and started, but it has not been queried yet.
Name: Sharonne Ayers Email: [email protected] TCW Adobe Connect 2021/02/17
Uni t 1 In t roduct ion to IBM Cognos Dynamic Cubes
© Copyright IBM Corp. 2012, 2016 1-27 Course materials may not be reproduced in whole or in part without the prior written permission of IBM.
Task 3. Create a report from the cube and view the metrics. 1. Return to the original tab of your Web browser titled Welcome, and from the
New menu, click Report.
2. In the New window, next to Package, click Browse . 3. Click Sales, and then click Open. 4. In the New window, click Crosstab, and then click OK.
IBM Cognos Analytics - Reporting opens using the Sales package.
5. On the menu, click Data . The Source pane slides out from the left.
6. In the Source pane, click View Members Tree , and then expand the Measures folder. Notice the similarities between the Source model in IBM Cognos Analytics - Reporting and the cube model that you published. The Sales measure is in the Measures folder. There are four hierarchies that represent the hierarchies from the four dimensions in the cube model.
7. From the Measures folder in the Source pane, drag the Sales measure to the Measures drop zone.
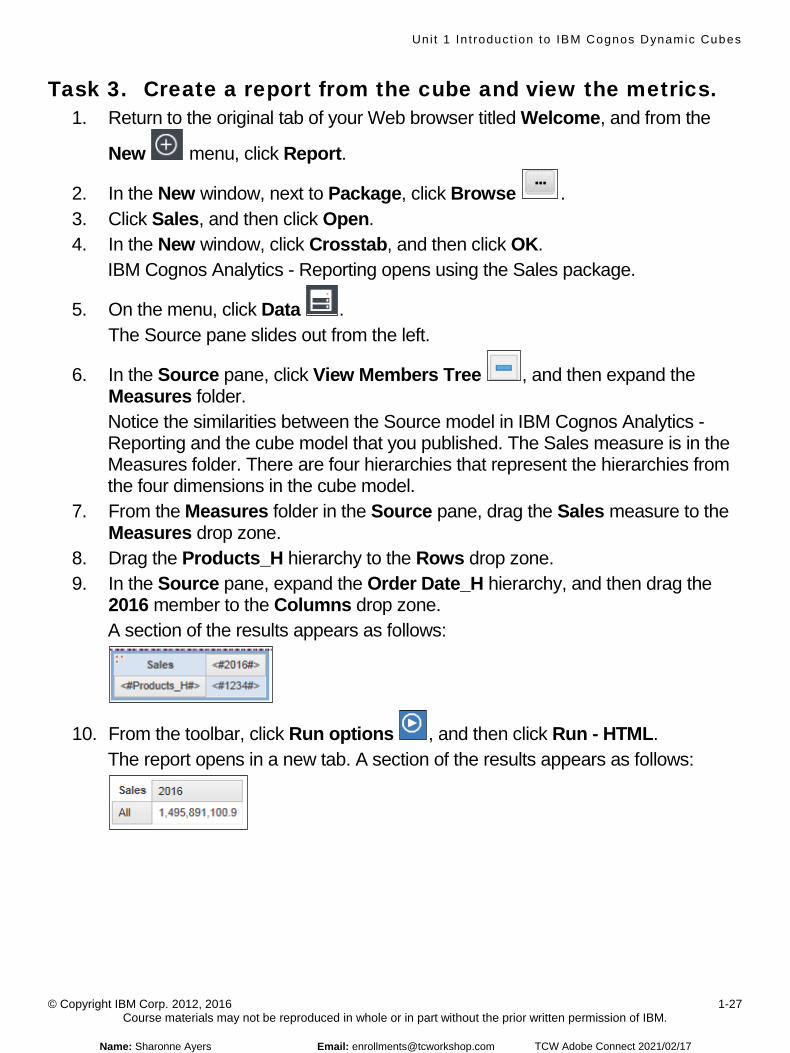
8. Drag the Products_H hierarchy to the Rows drop zone. 9. In the Source pane, expand the Order Date_H hierarchy, and then drag the
2016 member to the Columns drop zone. A section of the results appears as follows:
10. From the toolbar, click Run options , and then click Run - HTML. The report opens in a new tab. A section of the results appears as follows:
Name: Sharonne Ayers Email: [email protected] TCW Adobe Connect 2021/02/17
Uni t 1 In t roduct ion to IBM Cognos Dynamic Cubes
© Copyright IBM Corp. 2012, 2016 1-28 Course materials may not be reproduced in whole or in part without the prior written permission of IBM.
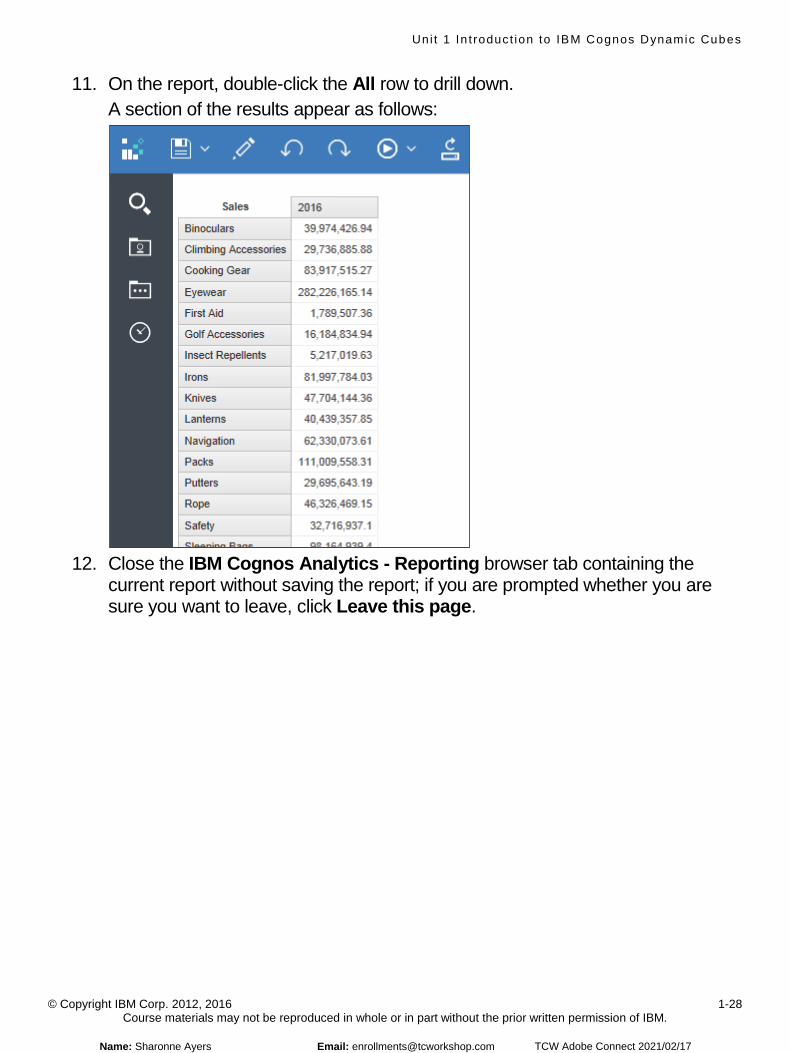
11. On the report, double-click the All row to drill down. A section of the results appear as follows:
12. Close the IBM Cognos Analytics - Reporting browser tab containing the
current report without saving the report; if you are prompted whether you are sure you want to leave, click Leave this page.
Name: Sharonne Ayers Email: [email protected] TCW Adobe Connect 2021/02/17
Uni t 1 In t roduct ion to IBM Cognos Dynamic Cubes
© Copyright IBM Corp. 2012, 2016 1-29 Course materials may not be reproduced in whole or in part without the prior written permission of IBM.
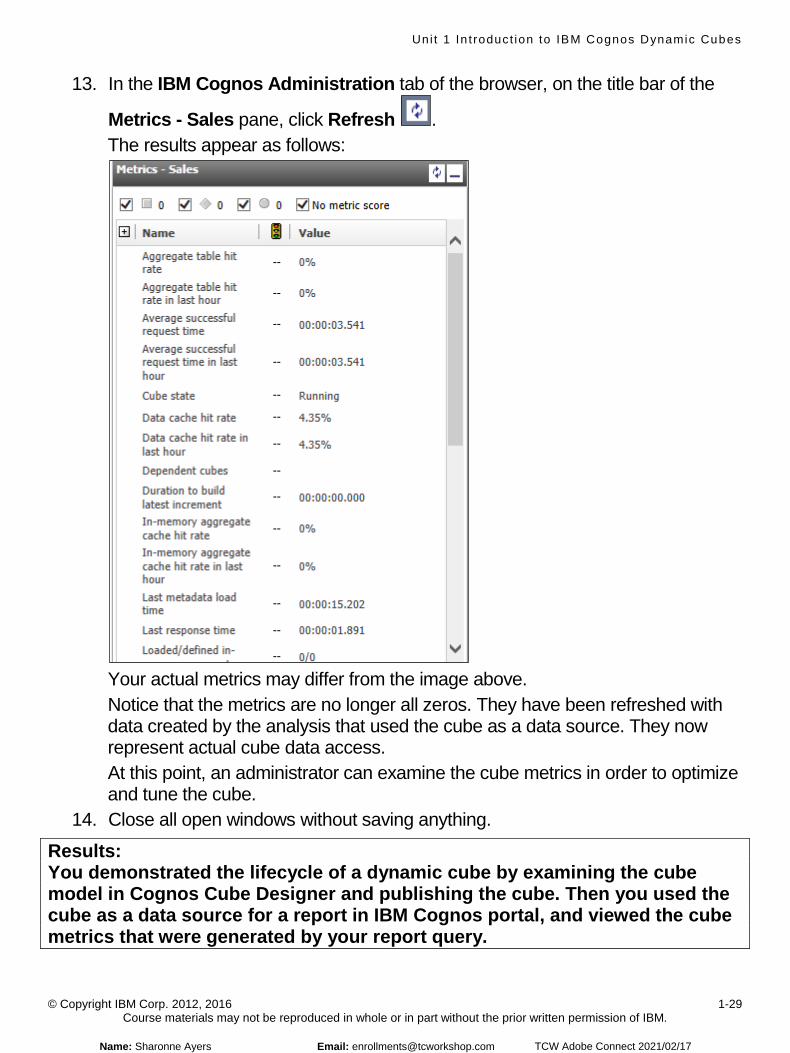
13. In the IBM Cognos Administration tab of the browser, on the title bar of the
Metrics - Sales pane, click Refresh . The results appear as follows:
Your actual metrics may differ from the image above. Notice that the metrics are no longer all zeros. They have been refreshed with data created by the analysis that used the cube as a data source. They now represent actual cube data access. At this point, an administrator can examine the cube metrics in order to optimize and tune the cube.
14. Close all open windows without saving anything.
Results: You demonstrated the lifecycle of a dynamic cube by examining the cube model in Cognos Cube Designer and publishing the cube. Then you used the cube as a data source for a report in IBM Cognos portal, and viewed the cube metrics that were generated by your report query.
Name: Sharonne Ayers Email: [email protected] TCW Adobe Connect 2021/02/17

Create and design a Dynamic Cube
© Copyright IBM Corporation 2016Course materials may not be reproduced in whole or in part without the written permission of IBM.
Create and design a Dynamic Cube
IBM Cognos Dynamic Cubes
Name: Sharonne Ayers Email: [email protected] TCW Adobe Connect 2021/02/17

Uni t 2 Create and des ign a Dynamic Cube
© Copyright IBM Corp. 2012, 2016 2-2 Course materials may not be reproduced in whole or in part without the prior written permission of IBM.
Name: Sharonne Ayers Email: [email protected] TCW Adobe Connect 2021/02/17
Uni t 2 Create and des ign a Dynamic Cube
© Copyright IBM Corp. 2012, 2016 2-12 Course materials may not be reproduced in whole or in part without the prior written permission of IBM.
© Copyright IBM Corporation 2016Create and design a Dynamic Cube
Demonstration 1
Model a Dynamic Cube
Demonstration 1: Model a Dynamic Cube
Name: Sharonne Ayers Email: [email protected] TCW Adobe Connect 2021/02/17
Uni t 2 Create and des ign a Dynamic Cube
© Copyright IBM Corp. 2012, 2016 2-13 Course materials may not be reproduced in whole or in part without the prior written permission of IBM.
Demonstration 1: Model a Dynamic Cube
Purpose: You want to manually create a cube and explore the manual cube creation process.
Task 1. Open IBM Cognos Cube Designer and log in. 1. From the Start menu, click All Programs > IBM Cognos Cube Designer >
IBM Cognos Cube Designer. For the remainder of this course, you will be instructed to open IBM Cognos Cube Designer in order to perform this step.
2. Click Create New Blank Project. IBM Cognos Cube Designer opens.
3. On the toolbar, click Get Metadata , and then click Browse Content Manager Datasource. The Log On to IBM Cognos Software dialog window appears.
4. Use the credentials User ID: admin, password: Education1. 5. In the Select a database schema window, expand
great_outdoors_warehouse, click the GOSALESDW schema, and then click OK.
Task 2. Create a new cube and measure. 1. In the Project Explorer, right-click Model, point to New, and then click Cube.
A new, empty cube appears in the Project Explorer with the name highlighted for you to rename it.
2. Type Product Sales, and then press Enter. 3. Expand the Product Sales cube, right-click the Measures folder, point to New,
and then click Measure.
Name: Sharonne Ayers Email: [email protected] TCW Adobe Connect 2021/02/17
Uni t 2 Create and des ign a Dynamic Cube
© Copyright IBM Corp. 2012, 2016 2-14 Course materials may not be reproduced in whole or in part without the prior written permission of IBM.
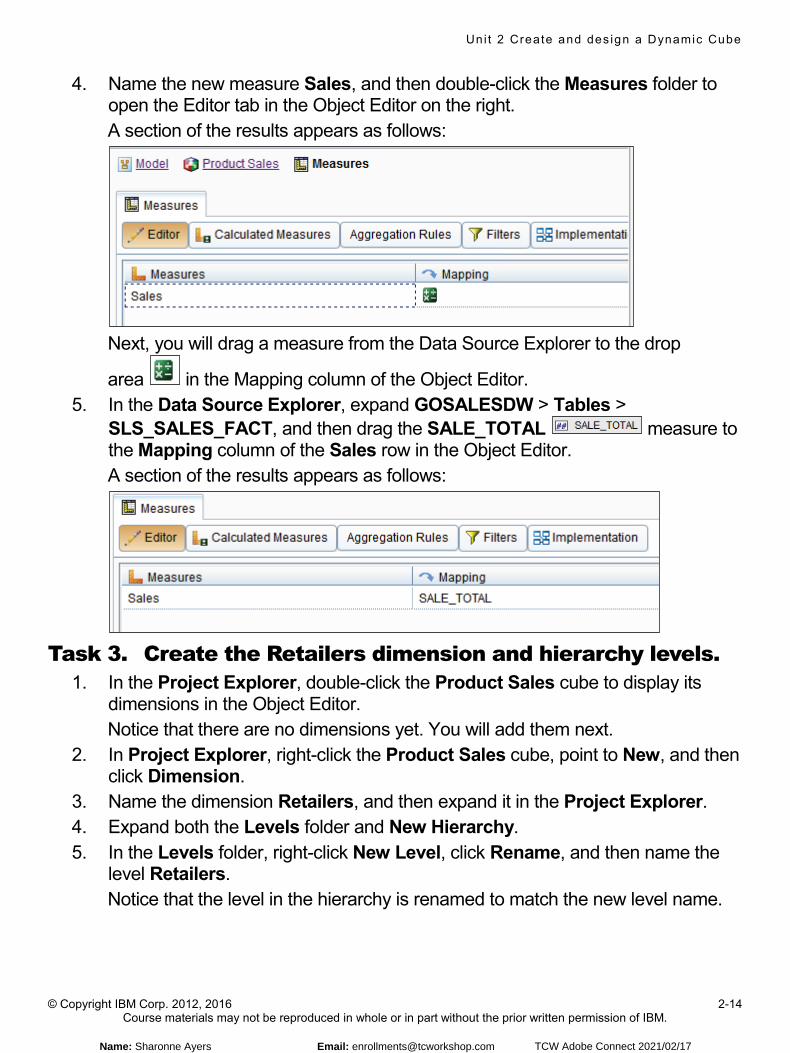
4. Name the new measure Sales, and then double-click the Measures folder to open the Editor tab in the Object Editor on the right. A section of the results appears as follows:
Next, you will drag a measure from the Data Source Explorer to the drop
area in the Mapping column of the Object Editor. 5. In the Data Source Explorer, expand GOSALESDW > Tables >
SLS_SALES_FACT, and then drag the SALE_TOTAL measure to the Mapping column of the Sales row in the Object Editor. A section of the results appears as follows:
Task 3. Create the Retailers dimension and hierarchy levels.
1. In the Project Explorer, double-click the Product Sales cube to display its dimensions in the Object Editor. Notice that there are no dimensions yet. You will add them next.
2. In Project Explorer, right-click the Product Sales cube, point to New, and then click Dimension.
3. Name the dimension Retailers, and then expand it in the Project Explorer. 4. Expand both the Levels folder and New Hierarchy. 5. In the Levels folder, right-click New Level, click Rename, and then name the
level Retailers. Notice that the level in the hierarchy is renamed to match the new level name.
Name: Sharonne Ayers Email: [email protected] TCW Adobe Connect 2021/02/17
Uni t 2 Create and des ign a Dynamic Cube
© Copyright IBM Corp. 2012, 2016 2-15 Course materials may not be reproduced in whole or in part without the prior written permission of IBM.
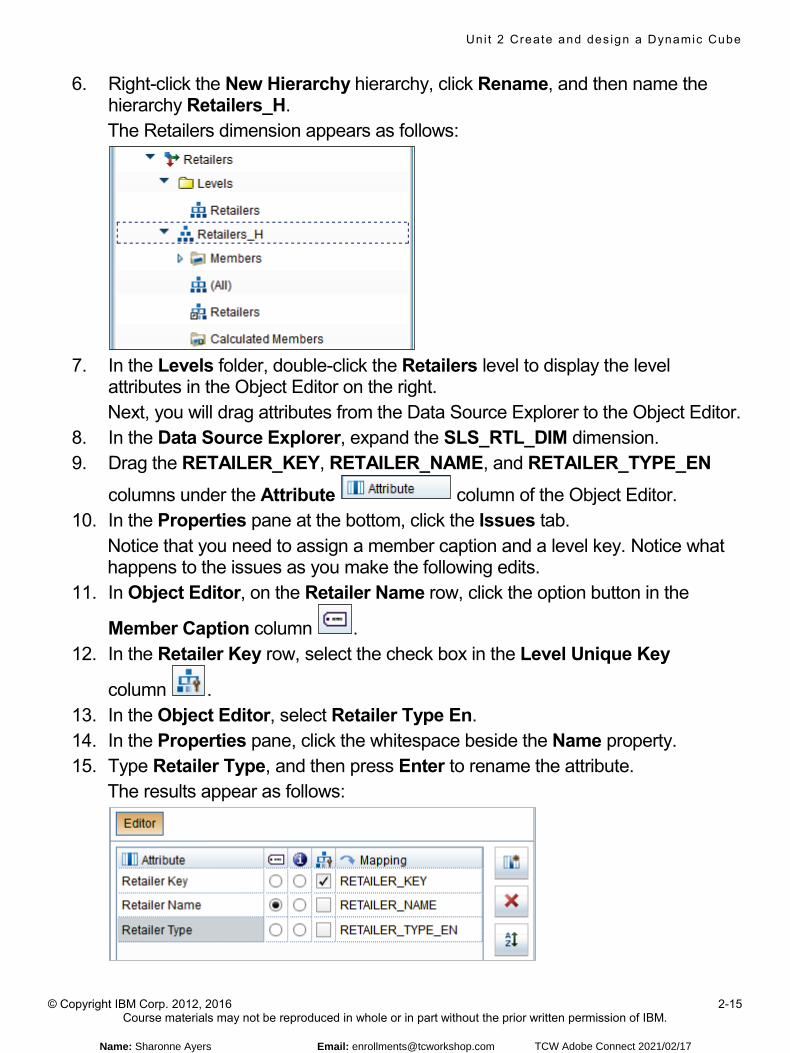
6. Right-click the New Hierarchy hierarchy, click Rename, and then name the hierarchy Retailers_H. The Retailers dimension appears as follows:
7. In the Levels folder, double-click the Retailers level to display the level
attributes in the Object Editor on the right. Next, you will drag attributes from the Data Source Explorer to the Object Editor.
8. In the Data Source Explorer, expand the SLS_RTL_DIM dimension. 9. Drag the RETAILER_KEY, RETAILER_NAME, and RETAILER_TYPE_EN
columns under the Attribute column of the Object Editor. 10. In the Properties pane at the bottom, click the Issues tab.
Notice that you need to assign a member caption and a level key. Notice what happens to the issues as you make the following edits.
11. In Object Editor, on the Retailer Name row, click the option button in the
Member Caption column . 12. In the Retailer Key row, select the check box in the Level Unique Key
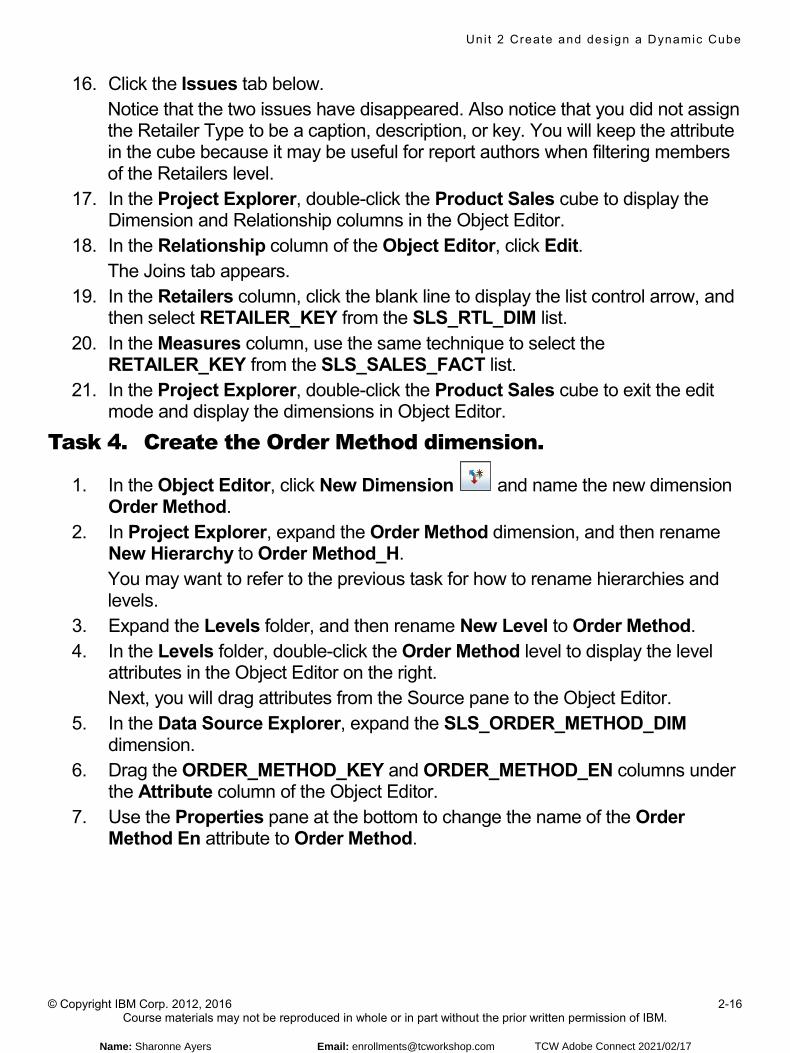
column . 13. In the Object Editor, select Retailer Type En. 14. In the Properties pane, click the whitespace beside the Name property. 15. Type Retailer Type, and then press Enter to rename the attribute.
The results appear as follows:
Name: Sharonne Ayers Email: [email protected] TCW Adobe Connect 2021/02/17
Uni t 2 Create and des ign a Dynamic Cube
© Copyright IBM Corp. 2012, 2016 2-16 Course materials may not be reproduced in whole or in part without the prior written permission of IBM.
16. Click the Issues tab below. Notice that the two issues have disappeared. Also notice that you did not assign the Retailer Type to be a caption, description, or key. You will keep the attribute in the cube because it may be useful for report authors when filtering members of the Retailers level.
17. In the Project Explorer, double-click the Product Sales cube to display the Dimension and Relationship columns in the Object Editor.
18. In the Relationship column of the Object Editor, click Edit. The Joins tab appears.
19. In the Retailers column, click the blank line to display the list control arrow, and then select RETAILER_KEY from the SLS_RTL_DIM list.
20. In the Measures column, use the same technique to select the RETAILER_KEY from the SLS_SALES_FACT list.
21. In the Project Explorer, double-click the Product Sales cube to exit the edit mode and display the dimensions in Object Editor.
Task 4. Create the Order Method dimension.
1. In the Object Editor, click New Dimension and name the new dimension Order Method.
2. In Project Explorer, expand the Order Method dimension, and then rename New Hierarchy to Order Method_H. You may want to refer to the previous task for how to rename hierarchies and levels.
3. Expand the Levels folder, and then rename New Level to Order Method. 4. In the Levels folder, double-click the Order Method level to display the level
attributes in the Object Editor on the right. Next, you will drag attributes from the Source pane to the Object Editor.
5. In the Data Source Explorer, expand the SLS_ORDER_METHOD_DIM dimension.
6. Drag the ORDER_METHOD_KEY and ORDER_METHOD_EN columns under the Attribute column of the Object Editor.
7. Use the Properties pane at the bottom to change the name of the Order Method En attribute to Order Method.
Name: Sharonne Ayers Email: [email protected] TCW Adobe Connect 2021/02/17
Uni t 2 Create and des ign a Dynamic Cube
© Copyright IBM Corp. 2012, 2016 2-17 Course materials may not be reproduced in whole or in part without the prior written permission of IBM.
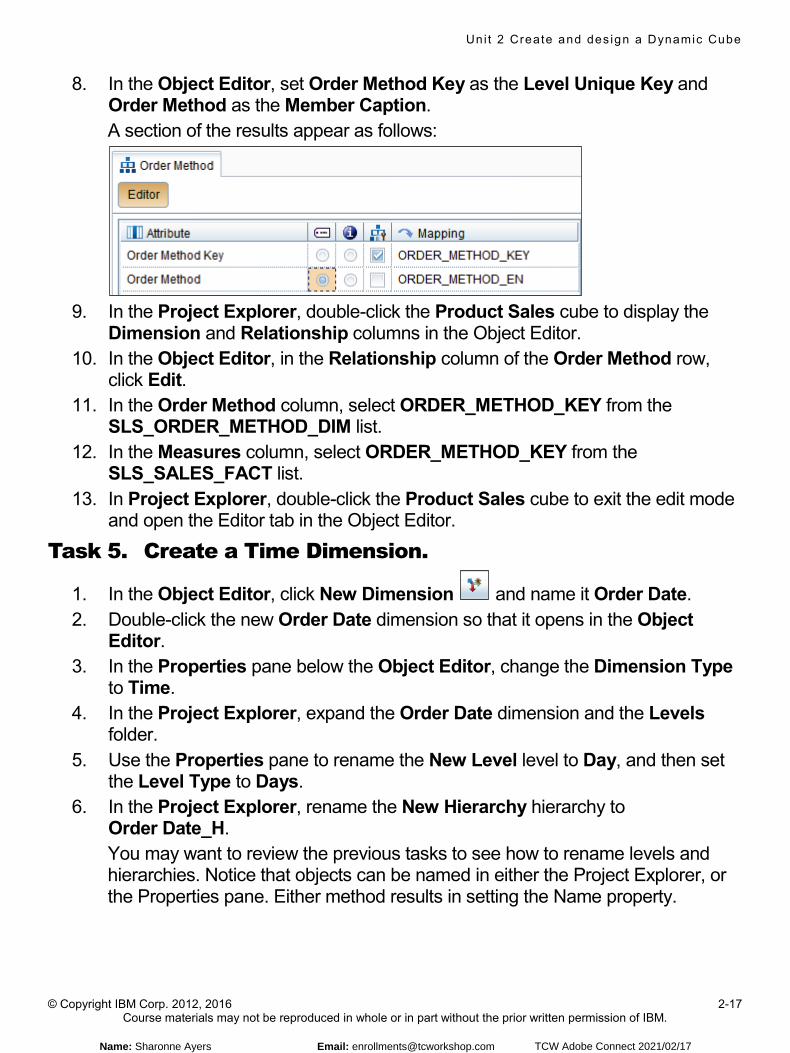
8. In the Object Editor, set Order Method Key as the Level Unique Key and Order Method as the Member Caption. A section of the results appear as follows:
9. In the Project Explorer, double-click the Product Sales cube to display the
Dimension and Relationship columns in the Object Editor. 10. In the Object Editor, in the Relationship column of the Order Method row,
click Edit. 11. In the Order Method column, select ORDER_METHOD_KEY from the
SLS_ORDER_METHOD_DIM list. 12. In the Measures column, select ORDER_METHOD_KEY from the
SLS_SALES_FACT list. 13. In Project Explorer, double-click the Product Sales cube to exit the edit mode
and open the Editor tab in the Object Editor.
Task 5. Create a Time Dimension.
1. In the Object Editor, click New Dimension and name it Order Date. 2. Double-click the new Order Date dimension so that it opens in the Object
Editor. 3. In the Properties pane below the Object Editor, change the Dimension Type
to Time. 4. In the Project Explorer, expand the Order Date dimension and the Levels
folder. 5. Use the Properties pane to rename the New Level level to Day, and then set
the Level Type to Days. 6. In the Project Explorer, rename the New Hierarchy hierarchy to
Order Date_H. You may want to review the previous tasks to see how to rename levels and hierarchies. Notice that objects can be named in either the Project Explorer, or the Properties pane. Either method results in setting the Name property.
Name: Sharonne Ayers Email: [email protected] TCW Adobe Connect 2021/02/17
Uni t 2 Create and des ign a Dynamic Cube
© Copyright IBM Corp. 2012, 2016 2-18 Course materials may not be reproduced in whole or in part without the prior written permission of IBM.
7. Double-click the Order Date_H hierarchy to view its levels in the Object Editor.
8. In the Object Editor, click New Level , select the New Level, and use the Properties pane to rename the new level to Year, and set its Level Type to Years.
9. In the Object Editor, click New Level, use the Properties pane to rename the new level to Quarter, and then set its Level Type to Quarters.
10. In the Object Editor, click New Level, use the Properties pane to rename the new level to Month, and then set its Level Type to Months.
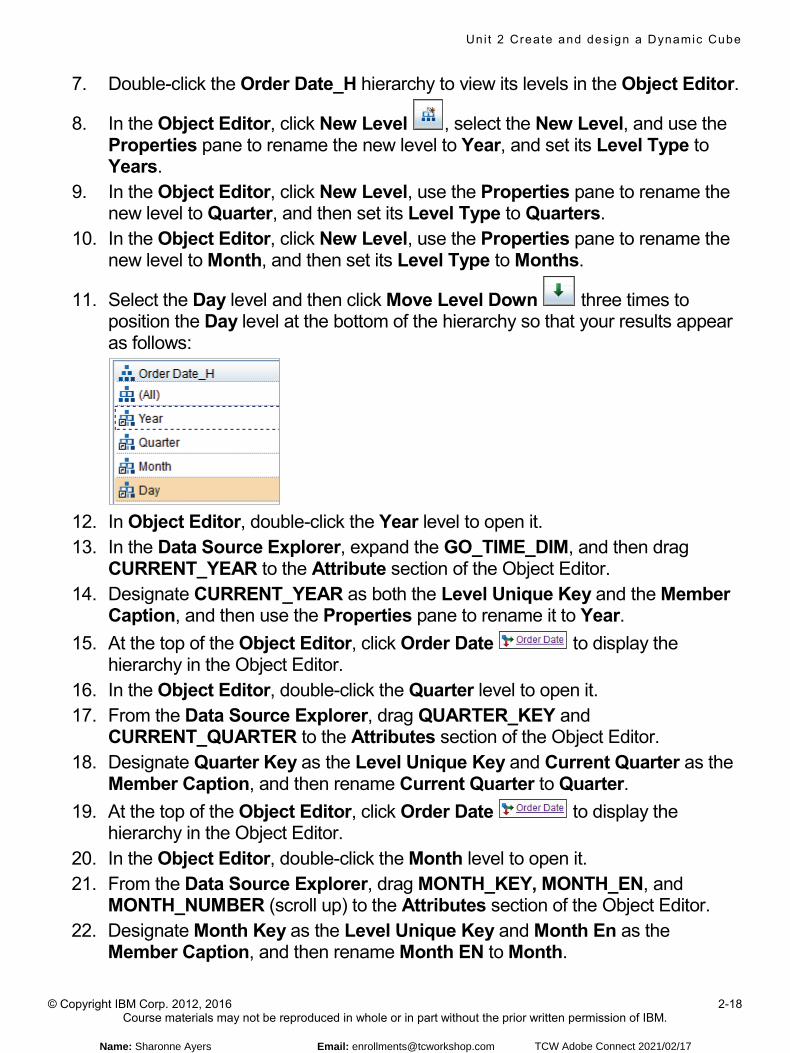
11. Select the Day level and then click Move Level Down three times to position the Day level at the bottom of the hierarchy so that your results appear as follows:
12. In Object Editor, double-click the Year level to open it. 13. In the Data Source Explorer, expand the GO_TIME_DIM, and then drag
CURRENT_YEAR to the Attribute section of the Object Editor. 14. Designate CURRENT_YEAR as both the Level Unique Key and the Member
Caption, and then use the Properties pane to rename it to Year. 15. At the top of the Object Editor, click Order Date to display the
hierarchy in the Object Editor. 16. In the Object Editor, double-click the Quarter level to open it. 17. From the Data Source Explorer, drag QUARTER_KEY and
CURRENT_QUARTER to the Attributes section of the Object Editor. 18. Designate Quarter Key as the Level Unique Key and Current Quarter as the
Member Caption, and then rename Current Quarter to Quarter. 19. At the top of the Object Editor, click Order Date to display the
hierarchy in the Object Editor. 20. In the Object Editor, double-click the Month level to open it. 21. From the Data Source Explorer, drag MONTH_KEY, MONTH_EN, and
MONTH_NUMBER (scroll up) to the Attributes section of the Object Editor. 22. Designate Month Key as the Level Unique Key and Month En as the
Member Caption, and then rename Month EN to Month.
Name: Sharonne Ayers Email: [email protected] TCW Adobe Connect 2021/02/17
Uni t 2 Create and des ign a Dynamic Cube
© Copyright IBM Corp. 2012, 2016 2-19 Course materials may not be reproduced in whole or in part without the prior written permission of IBM.
23. At the top of the Object Editor, click Order Date . 24. In the Object Editor, double-click the Day level. 25. In the Data Source Explorer, from the GO_TIME_DIM, drag DAY_KEY,
DAY_DATE, and DAY_OF_MONTH to the Attribute section of the Object Editor.
26. Designate DAY_KEY as the Level Unique Key.
27. Click New Attribute , and use the Properties pane to name it Order Date. 28. In the Properties pane, in the Value column, click the blank line that
corresponds to the Expression property. This opens the Expression editor.
29. In the Project Explorer, in the Order Date dimension, expand the Month level, and then drag the Month attribute to the Expression pane.
30. In the Expression pane, after the Month, type a space, and then type || ' ' || trim(char( Notice that there is a space between two single quotes in the expression.
31. In the Project Explorer, in the Order Date dimension, expand the Day level, and then drag the Day of Month attribute to the end of the expression that you are building.
32. In the Expression editor, at the end of the expression, type )) || ',' || ' ' || char( Notice that there is a space between the second set of single quotes.
33. In the Project Explorer, in the Order Date dimension, expand the Year level, and then drag the Year attribute to the end of the expression that you are building.
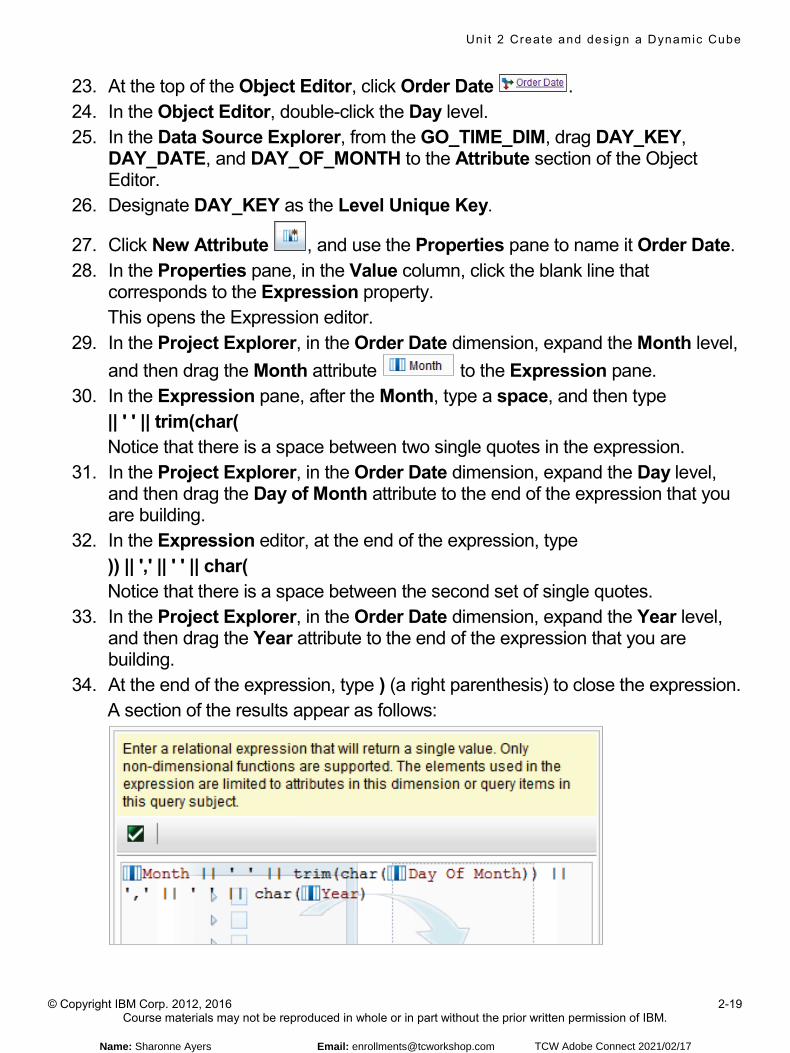
34. At the end of the expression, type ) (a right parenthesis) to close the expression. A section of the results appear as follows:
Name: Sharonne Ayers Email: [email protected] TCW Adobe Connect 2021/02/17
Uni t 2 Create and des ign a Dynamic Cube
© Copyright IBM Corp. 2012, 2016 2-20 Course materials may not be reproduced in whole or in part without the prior written permission of IBM.
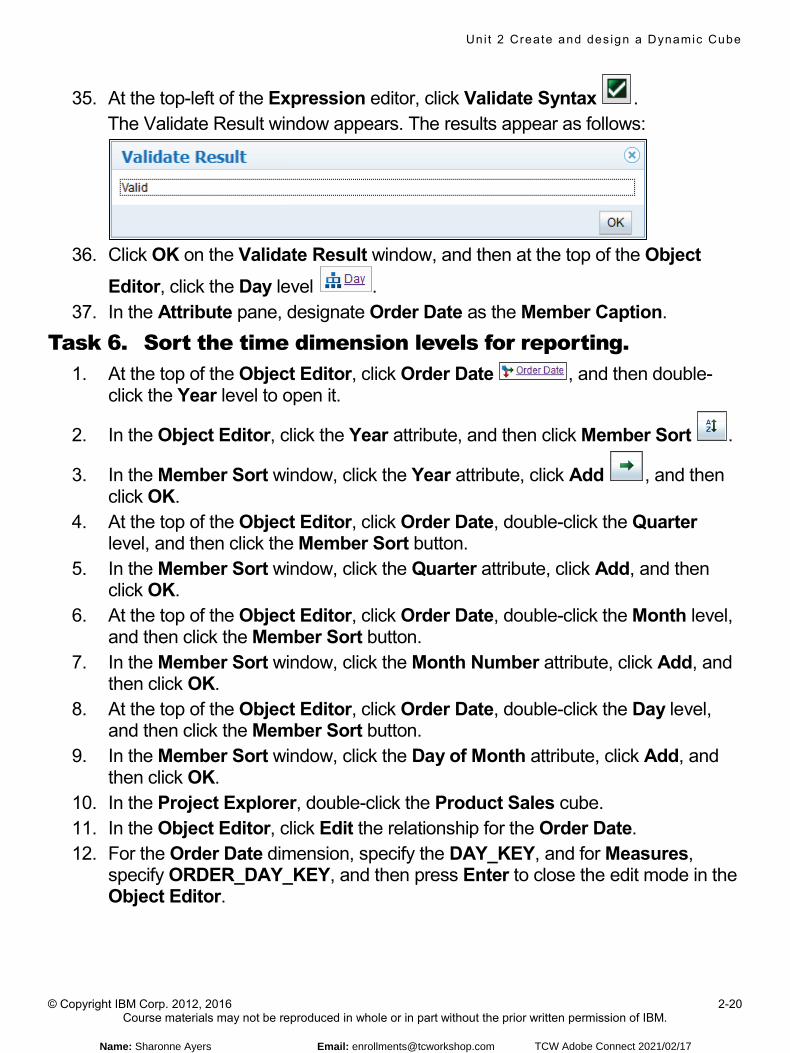
35. At the top-left of the Expression editor, click Validate Syntax . The Validate Result window appears. The results appear as follows:
36. Click OK on the Validate Result window, and then at the top of the Object
Editor, click the Day level . 37. In the Attribute pane, designate Order Date as the Member Caption.
Task 6. Sort the time dimension levels for reporting. 1. At the top of the Object Editor, click Order Date , and then double-
click the Year level to open it.
2. In the Object Editor, click the Year attribute, and then click Member Sort .
3. In the Member Sort window, click the Year attribute, click Add , and then click OK.
4. At the top of the Object Editor, click Order Date, double-click the Quarter level, and then click the Member Sort button.
5. In the Member Sort window, click the Quarter attribute, click Add, and then click OK.
6. At the top of the Object Editor, click Order Date, double-click the Month level, and then click the Member Sort button.
7. In the Member Sort window, click the Month Number attribute, click Add, and then click OK.
8. At the top of the Object Editor, click Order Date, double-click the Day level, and then click the Member Sort button.
9. In the Member Sort window, click the Day of Month attribute, click Add, and then click OK.
10. In the Project Explorer, double-click the Product Sales cube. 11. In the Object Editor, click Edit the relationship for the Order Date. 12. For the Order Date dimension, specify the DAY_KEY, and for Measures,
specify ORDER_DAY_KEY, and then press Enter to close the edit mode in the Object Editor.
Name: Sharonne Ayers Email: [email protected] TCW Adobe Connect 2021/02/17
Uni t 2 Create and des ign a Dynamic Cube
© Copyright IBM Corp. 2012, 2016 2-21 Course materials may not be reproduced in whole or in part without the prior written permission of IBM.
13. Click the Issues tab. All issues should be solved at this point. Look in the Project Explorer to see if
any of the objects have error badges imposed over their icons , , . This indicates that even though you solved the joins, you still need to fix any issues and validate the model before you can publish the cube.
Do not confuse the time badge that appears on the Order Date dimension with an error badge.
Task 7. Create the Products dimension. 1. In the Project Explorer, double-click the Product Sales cube, and then in the
Object Editor, click New Dimension. 2. Rename the new dimension Products. 3. In Project Explorer, expand the Products dimension, and then rename New
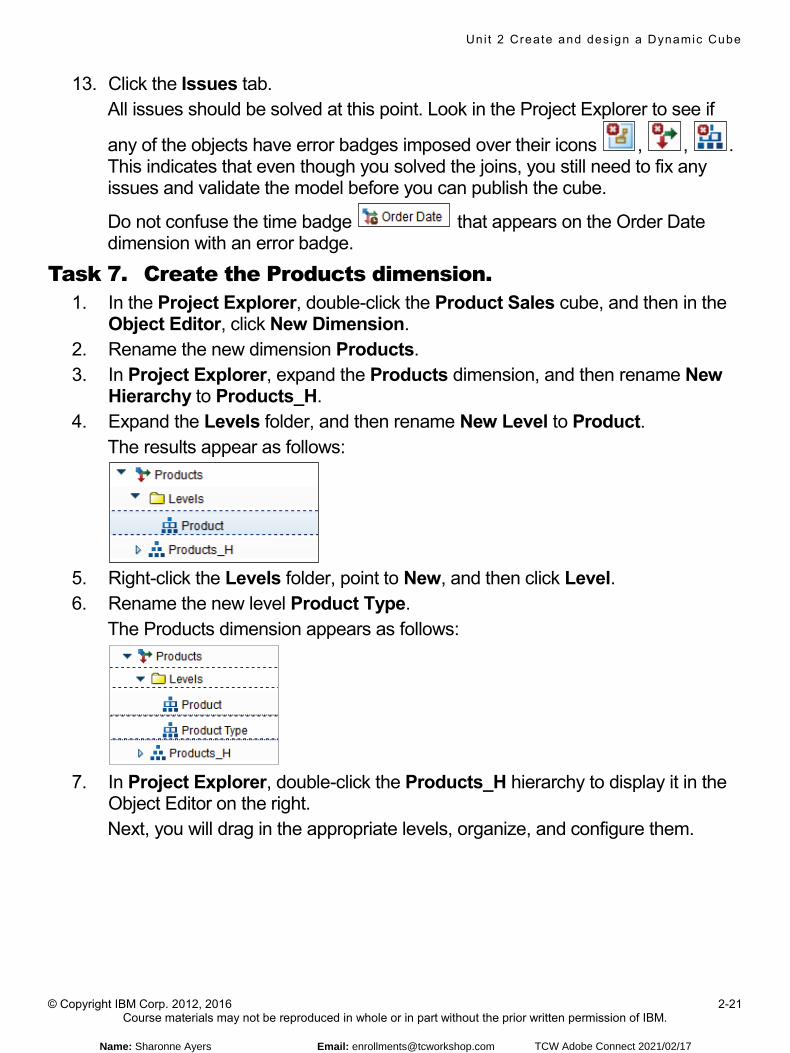
Hierarchy to Products_H. 4. Expand the Levels folder, and then rename New Level to Product.
The results appear as follows:
5. Right-click the Levels folder, point to New, and then click Level. 6. Rename the new level Product Type.
The Products dimension appears as follows:
7. In Project Explorer, double-click the Products_H hierarchy to display it in the
Object Editor on the right. Next, you will drag in the appropriate levels, organize, and configure them.
Name: Sharonne Ayers Email: [email protected] TCW Adobe Connect 2021/02/17
Uni t 2 Create and des ign a Dynamic Cube
© Copyright IBM Corp. 2012, 2016 2-22 Course materials may not be reproduced in whole or in part without the prior written permission of IBM.
8. From the Project Explorer, drag Product Type to the Object Editor so that the result appears as follows:
9. In the Object Editor, select the Product level, and then click Move Level
Down to move it to the bottom of the list. The results appear as follows:
10. In the Object Editor, double-click the Product level to view its attributes and
mappings. Notice that you have not created any attributes yet.
11. In the Data Source Explorer, expand the SLS_PRODUCT_DIM dimension, and then drag Product Key and Product Number to the Object Editor.
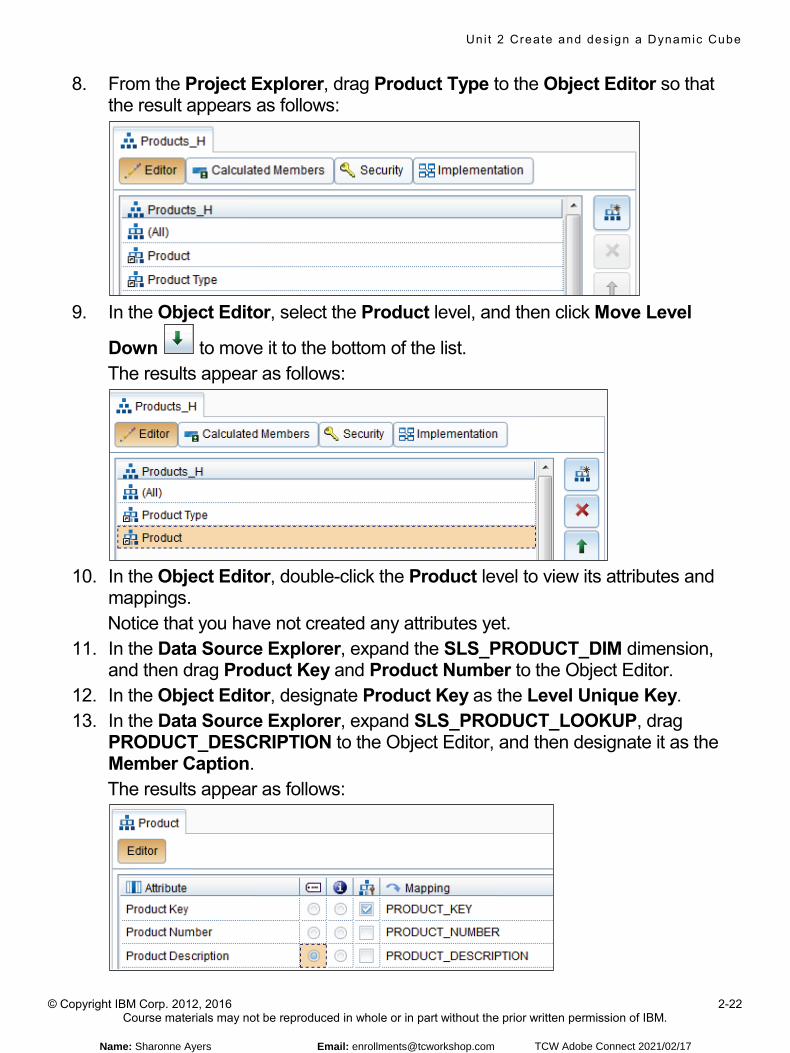
12. In the Object Editor, designate Product Key as the Level Unique Key. 13. In the Data Source Explorer, expand SLS_PRODUCT_LOOKUP, drag
PRODUCT_DESCRIPTION to the Object Editor, and then designate it as the Member Caption. The results appear as follows:
Name: Sharonne Ayers Email: [email protected] TCW Adobe Connect 2021/02/17

Uni t 2 Create and des ign a Dynamic Cube
© Copyright IBM Corp. 2012, 2016 2-23 Course materials may not be reproduced in whole or in part without the prior written permission of IBM.
14. At the top of the Object Editor, click Levels to display the entire Product_H hierarchy.
15. In the Object Editor, double-click the Product Type level to view its attributes and mappings.
16. In the Data Source Explorer, from the SLS_PRODUCT_DIM, drag the PRODUCT_TYPE_CODE to the Object Editor, and then designate it as the Level Unique Key.
17. In the Data Source Explorer, expand SLS_PRODUCT_TYPE_LOOKUP, drag the PRODUCT_TYPE_EN column to the Object Editor, and then designate it as the Member Caption. The Product Type level in the Object Editor appears as follows:
There are more levels that can be added to the Products dimension hierarchy, but for the sake of time and the purpose of this demonstration, you will only use the two levels. Any additional levels would be added in similar fashion.
18. In the Project Explorer, double-click the Product Sales cube to display the Dimension and Relationship columns in the Object Editor.
19. In the Object Editor, in the Relationship column next to Products, click Edit. The Joins tab appears.
20. In the Products column, select PRODUCT_KEY from the SLS_PRODUCT_DIM list.
21. In the Measures column, select PRODUCT_KEY from the SLS_SALES_FACT list, and then press Enter to close the edit mode.
Name: Sharonne Ayers Email: [email protected] TCW Adobe Connect 2021/02/17
Uni t 2 Create and des ign a Dynamic Cube
© Copyright IBM Corp. 2012, 2016 2-24 Course materials may not be reproduced in whole or in part without the prior written permission of IBM.
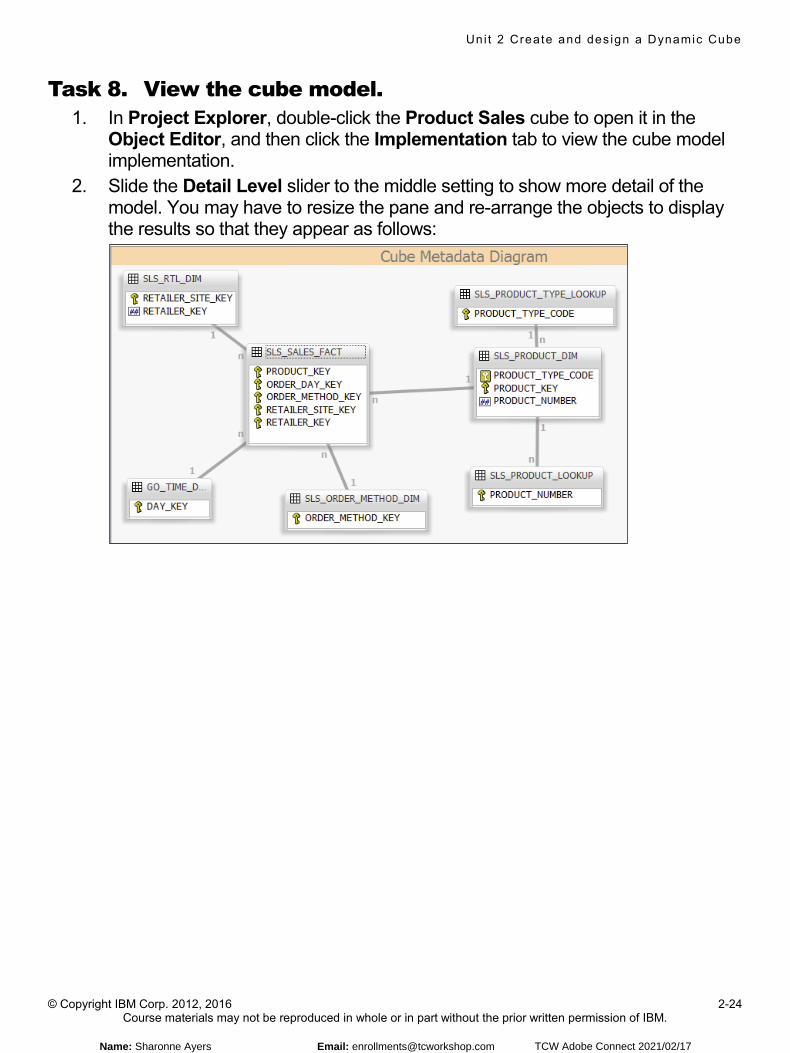
Task 8. View the cube model. 1. In Project Explorer, double-click the Product Sales cube to open it in the
Object Editor, and then click the Implementation tab to view the cube model implementation.
2. Slide the Detail Level slider to the middle setting to show more detail of the model. You may have to resize the pane and re-arrange the objects to display the results so that they appear as follows:
Name: Sharonne Ayers Email: [email protected] TCW Adobe Connect 2021/02/17
Uni t 2 Create and des ign a Dynamic Cube
© Copyright IBM Corp. 2012, 2016 2-25 Course materials may not be reproduced in whole or in part without the prior written permission of IBM.
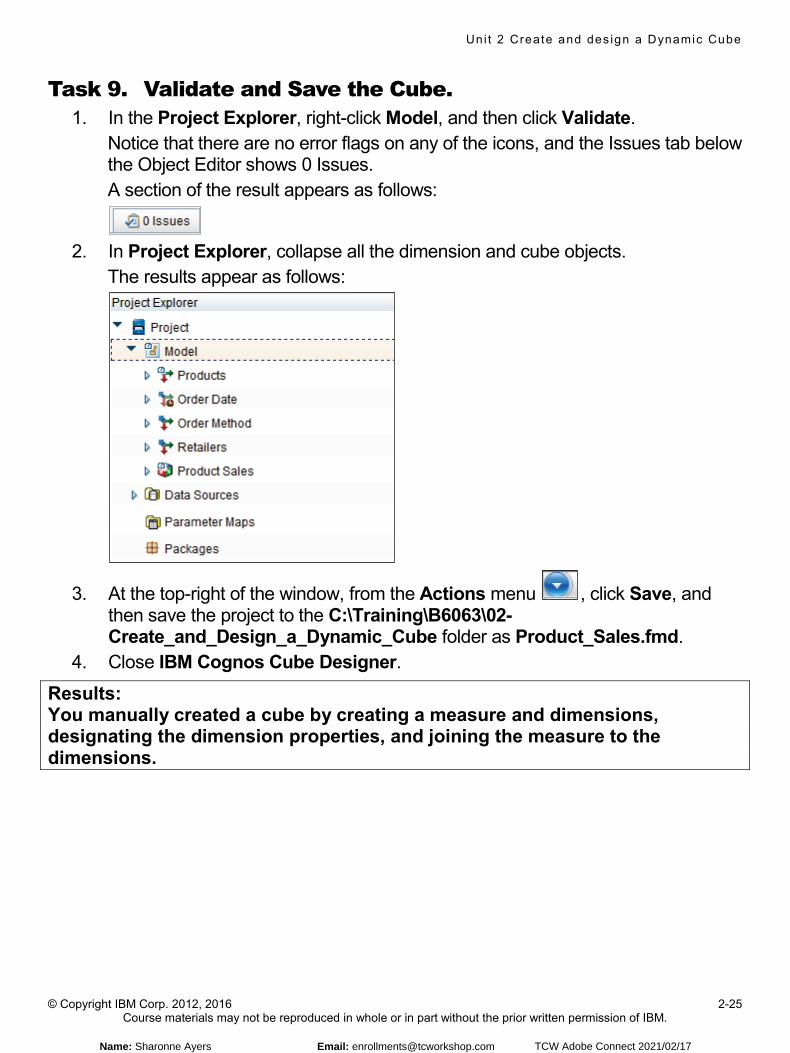
Task 9. Validate and Save the Cube. 1. In the Project Explorer, right-click Model, and then click Validate.
Notice that there are no error flags on any of the icons, and the Issues tab below the Object Editor shows 0 Issues. A section of the result appears as follows:
2. In Project Explorer, collapse all the dimension and cube objects.
The results appear as follows:
3. At the top-right of the window, from the Actions menu , click Save, and then save the project to the C:\Training\B6063\02-Create_and_Design_a_Dynamic_Cube folder as Product_Sales.fmd.
4. Close IBM Cognos Cube Designer. Results: You manually created a cube by creating a measure and dimensions, designating the dimension properties, and joining the measure to the dimensions.
Name: Sharonne Ayers Email: [email protected] TCW Adobe Connect 2021/02/17
Uni t 2 Create and des ign a Dynamic Cube
© Copyright IBM Corp. 2012, 2016 2-28 Course materials may not be reproduced in whole or in part without the prior written permission of IBM.
© Copyright IBM Corporation 2016Create and design a Dynamic Cube
Exercise 1
Create a valid Dynamic Cube
Exercise 1: Create a valid Dynamic Cube
Name: Sharonne Ayers Email: [email protected] TCW Adobe Connect 2021/02/17
Uni t 2 Create and des ign a Dynamic Cube
© Copyright IBM Corp. 2012, 2016 2-29 Course materials may not be reproduced in whole or in part without the prior written permission of IBM.
Exercise 1: Create a valid Dynamic Cube Your company has a need to see sales numbers for each retailer by day over time. You will create a dynamic cube that contains this information for your report authors to use in the creation of reports for your company. To do this you will need to:
• Start IBM Cognos Cube Designer, create a new blank project, and import data from the great_outdoors_warehouse data source, GOSALESDW schema.
• Create a new cube called Sales Retailers with a measure called Sales that uses the SALES_TOTAL from the SLS_SALES_FACT source table.
• Create a Retailers dimension that derives its attributes from the SLS_RTL_DIM source table. You will use the RETAILER_SITE_KEY as your unique identifier, the RETAILER_NAME as your caption, and join to the measure based on the RETAILER_SITE_KEY from both fact and dimension tables.
• create an Order Date dimension based on data from the GO_TIME_DIM source table. You will use the DAY_KEY as your unique identifier, the DAY_DATE as your caption, and join to the measure based on the DAY_KEY from the dimension and the ORDER_DAY_KEY from the fact.
• Validate your model to ensure that you performed all the tasks correctly • Save the model as Sales_Retailers.fmd in the
C:\Training\B6063\02-Create_and_Design_a_Dynamic_Cube folder. For more detailed information outlined as tasks and final results, see the Tasks and Results section of this exercise.
Name: Sharonne Ayers Email: [email protected] TCW Adobe Connect 2021/02/17
Uni t 2 Create and des ign a Dynamic Cube
© Copyright IBM Corp. 2012, 2016 2-30 Course materials may not be reproduced in whole or in part without the prior written permission of IBM.
Exercise 1: Tasks and Results Task 1. Create a new cube and measure.
• Open IBM Cognos Cube Designer and create a new blank project. • Click Get Metadata, click Browse Content Manager Datasource, and then log
in as admin/Education1. • From the great_outdoors_warehouse data source, use the GOSALESDW
schema. • In the Project Explorer, right-click Model, create a new cube, and then name it
Sales Retailers. If you need to review how to do this or other tasks in this exercise, you may wish to refer to the demonstration in this unit.
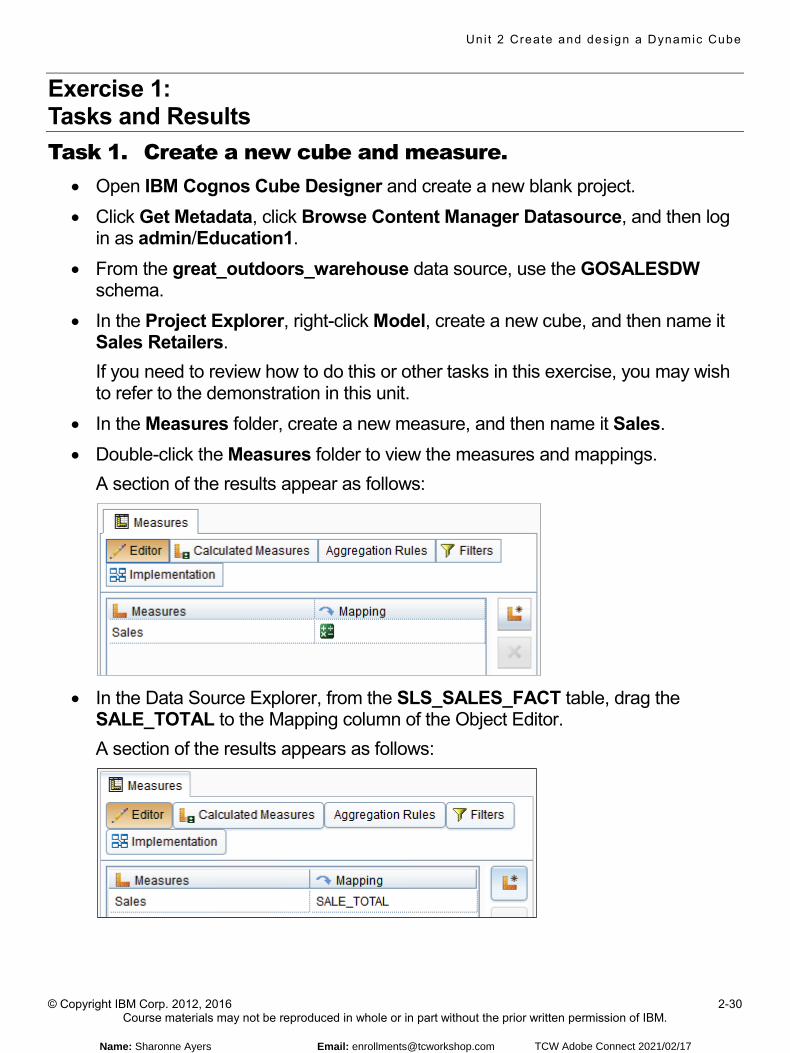
• In the Measures folder, create a new measure, and then name it Sales. • Double-click the Measures folder to view the measures and mappings.
A section of the results appear as follows:
• In the Data Source Explorer, from the SLS_SALES_FACT table, drag the
SALE_TOTAL to the Mapping column of the Object Editor. A section of the results appears as follows:
Name: Sharonne Ayers Email: [email protected] TCW Adobe Connect 2021/02/17
Uni t 2 Create and des ign a Dynamic Cube
© Copyright IBM Corp. 2012, 2016 2-31 Course materials may not be reproduced in whole or in part without the prior written permission of IBM.
Task 2. Create the Retailers dimension. • In the Project Explorer, double-click the Sales Retailers cube to display its
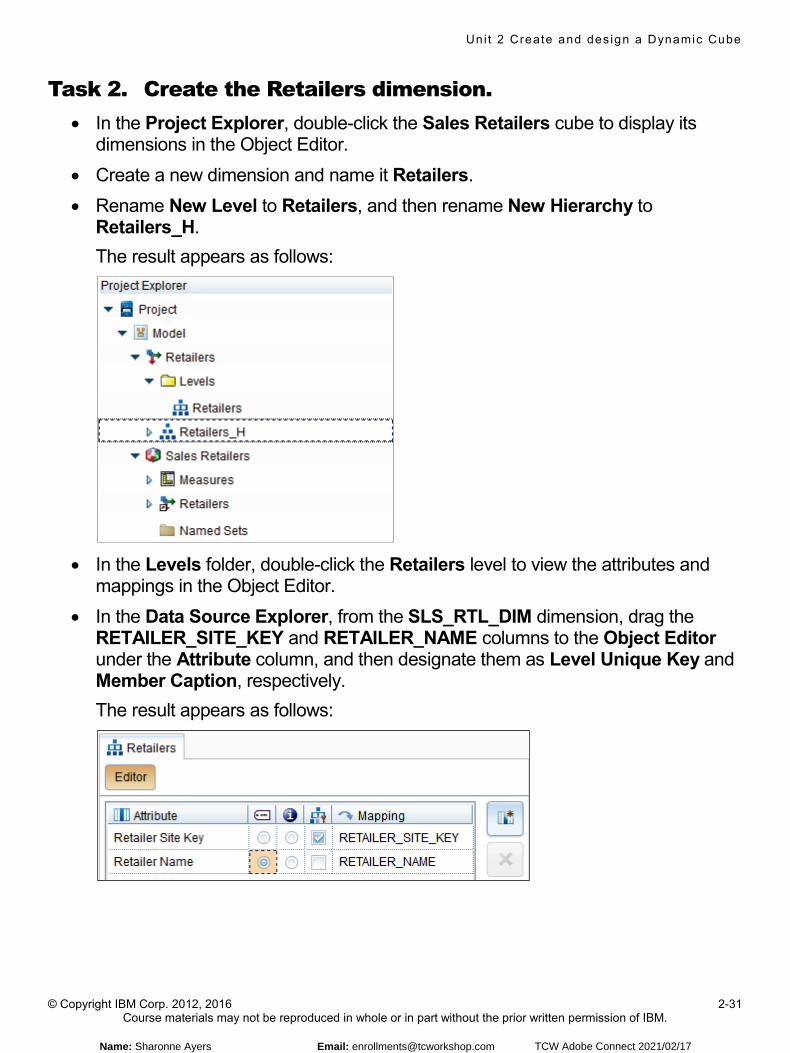
dimensions in the Object Editor. • Create a new dimension and name it Retailers. • Rename New Level to Retailers, and then rename New Hierarchy to
Retailers_H. The result appears as follows:
• In the Levels folder, double-click the Retailers level to view the attributes and
mappings in the Object Editor. • In the Data Source Explorer, from the SLS_RTL_DIM dimension, drag the
RETAILER_SITE_KEY and RETAILER_NAME columns to the Object Editor under the Attribute column, and then designate them as Level Unique Key and Member Caption, respectively. The result appears as follows:
Name: Sharonne Ayers Email: [email protected] TCW Adobe Connect 2021/02/17
Uni t 2 Create and des ign a Dynamic Cube
© Copyright IBM Corp. 2012, 2016 2-32 Course materials may not be reproduced in whole or in part without the prior written permission of IBM.
• In the Project Explorer, double-click the Sales Retailers cube, and then in the Object Editor, edit the relationship so that the SLS_RTL_DIM > RETAILER_SITE_KEY points to the SLS_SALES_FACT > RETAILER_SITE_KEY.
Task 3. Add another dimension and level to the cube. • Create a new dimension for the cube, and then name it Order Date. • Set the Dimension Type property to Time. • In the Project Explorer, expand the Order Date dimension and the Levels
folder. • In Project Explorer, rename the New Level to Order_Day, and then set the
Level Type property to Days. • Rename the New Hierarchy hierarchy to Order_Date_H. • In the Levels folder, double-click the Order_Day level to view its attributes in the
Object Editor on the right. • In the Data Source Explorer, from the GO_TIME_DIM, drag the DAY_KEY and
DAY_DATE columns to the Attribute section of the Object Editor. • Designate the Day Key attribute as the Level Unique Key and the Day Date
attribute as the Member Caption. • Set the relationship so that the GO_TIME_DIM > DAY_KEY =
SLS_SALES_FACT > ORDER_DAY_KEY.
Name: Sharonne Ayers Email: [email protected] TCW Adobe Connect 2021/02/17
Uni t 2 Create and des ign a Dynamic Cube
© Copyright IBM Corp. 2012, 2016 2-33 Course materials may not be reproduced in whole or in part without the prior written permission of IBM.
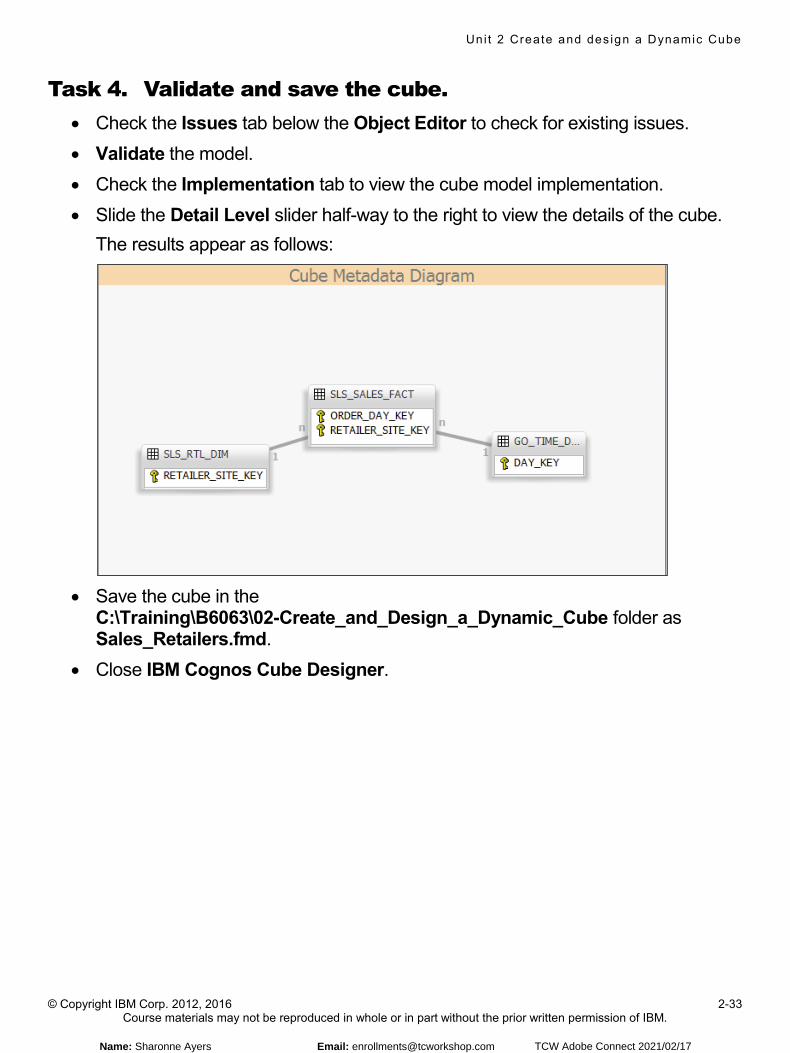
Task 4. Validate and save the cube. • Check the Issues tab below the Object Editor to check for existing issues. • Validate the model. • Check the Implementation tab to view the cube model implementation. • Slide the Detail Level slider half-way to the right to view the details of the cube.
The results appear as follows:
• Save the cube in the
C:\Training\B6063\02-Create_and_Design_a_Dynamic_Cube folder as Sales_Retailers.fmd.
• Close IBM Cognos Cube Designer.
Name: Sharonne Ayers Email: [email protected] TCW Adobe Connect 2021/02/17
Deploy and configure a Dynamic Cube
© Copyright IBM Corporation 2016Course materials may not be reproduced in whole or in part without the written permission of IBM.
Deploy and configure a Dynamic Cube
IBM Cognos Dynamic Cubes
Name: Sharonne Ayers Email: [email protected] TCW Adobe Connect 2021/02/17
Uni t 3 Deploy and conf igure a Dynamic Cube
© Copyright IBM Corp. 2012, 2016 3-8 Course materials may not be reproduced in whole or in part without the prior written permission of IBM.
© Copyright IBM Corporation 2016Deploy and configure a Dynamic Cube
Demonstration 1
Deploy a Dynamic Cube
Demonstration 1: Deploy a Dynamic Cube
Name: Sharonne Ayers Email: [email protected] TCW Adobe Connect 2021/02/17
Uni t 3 Deploy and conf igure a Dynamic Cube
© Copyright IBM Corp. 2012, 2016 3-9 Course materials may not be reproduced in whole or in part without the prior written permission of IBM.
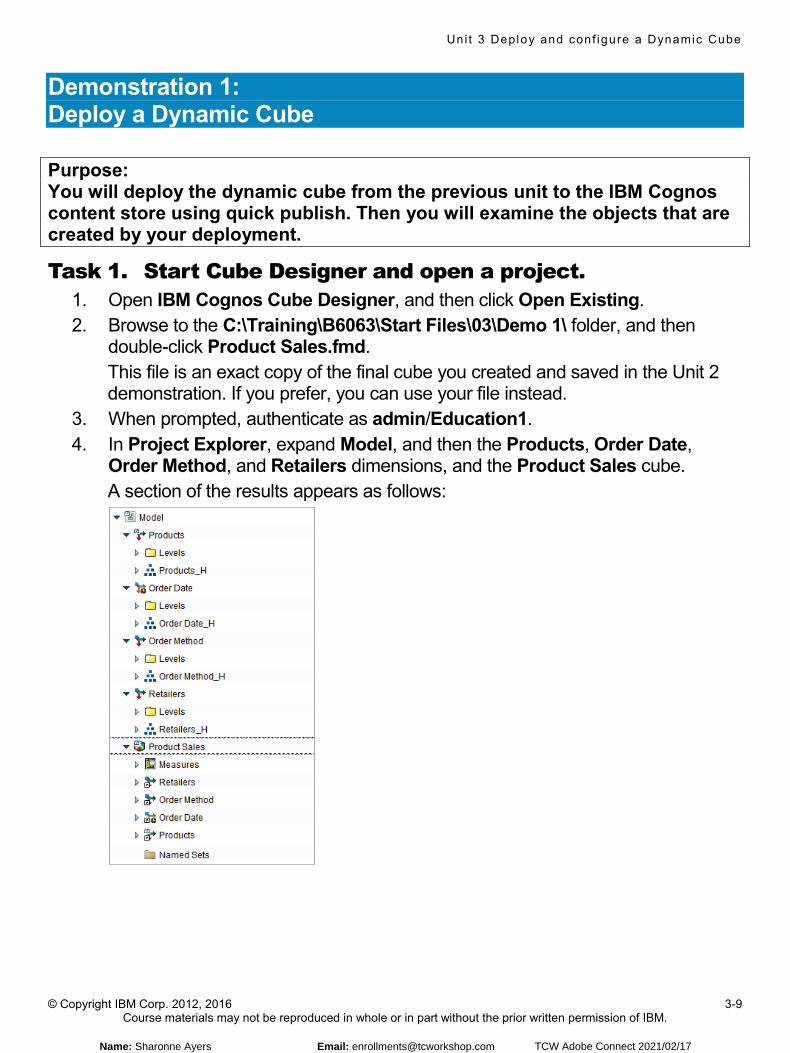
Demonstration 1: Deploy a Dynamic Cube Purpose: You will deploy the dynamic cube from the previous unit to the IBM Cognos content store using quick publish. Then you will examine the objects that are created by your deployment.
Task 1. Start Cube Designer and open a project. 1. Open IBM Cognos Cube Designer, and then click Open Existing. 2. Browse to the C:\Training\B6063\Start Files\03\Demo 1\ folder, and then
double-click Product Sales.fmd. This file is an exact copy of the final cube you created and saved in the Unit 2 demonstration. If you prefer, you can use your file instead.
3. When prompted, authenticate as admin/Education1. 4. In Project Explorer, expand Model, and then the Products, Order Date,
Order Method, and Retailers dimensions, and the Product Sales cube. A section of the results appears as follows:
Name: Sharonne Ayers Email: [email protected] TCW Adobe Connect 2021/02/17
Uni t 3 Deploy and conf igure a Dynamic Cube
© Copyright IBM Corp. 2012, 2016 3-10 Course materials may not be reproduced in whole or in part without the prior written permission of IBM.
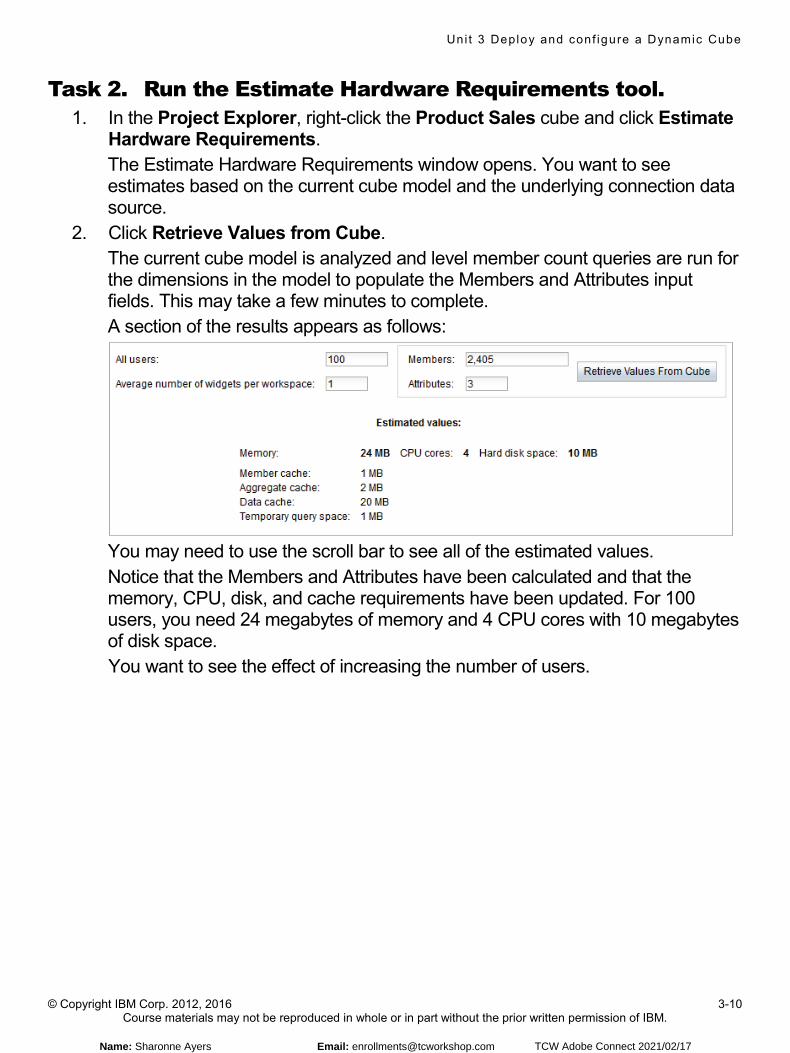
Task 2. Run the Estimate Hardware Requirements tool. 1. In the Project Explorer, right-click the Product Sales cube and click Estimate
Hardware Requirements. The Estimate Hardware Requirements window opens. You want to see estimates based on the current cube model and the underlying connection data source.
2. Click Retrieve Values from Cube. The current cube model is analyzed and level member count queries are run for the dimensions in the model to populate the Members and Attributes input fields. This may take a few minutes to complete. A section of the results appears as follows:
You may need to use the scroll bar to see all of the estimated values. Notice that the Members and Attributes have been calculated and that the memory, CPU, disk, and cache requirements have been updated. For 100 users, you need 24 megabytes of memory and 4 CPU cores with 10 megabytes of disk space. You want to see the effect of increasing the number of users.
Name: Sharonne Ayers Email: [email protected] TCW Adobe Connect 2021/02/17
Uni t 3 Deploy and conf igure a Dynamic Cube
© Copyright IBM Corp. 2012, 2016 3-11 Course materials may not be reproduced in whole or in part without the prior written permission of IBM.
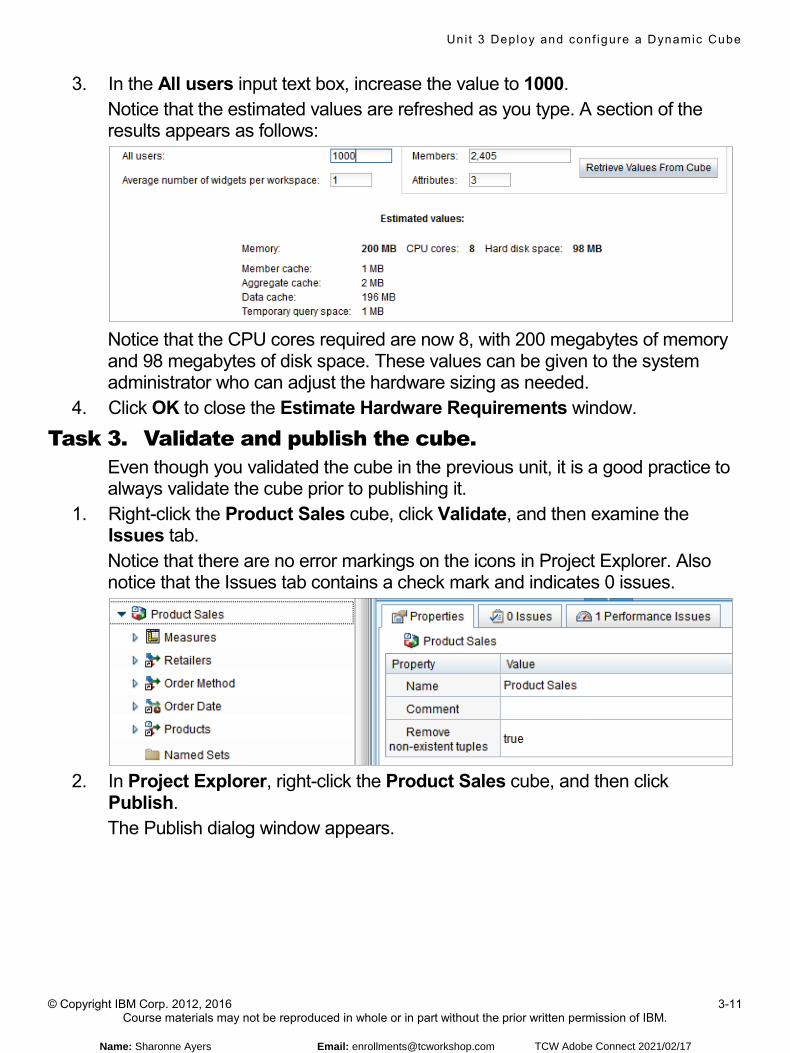
3. In the All users input text box, increase the value to 1000. Notice that the estimated values are refreshed as you type. A section of the results appears as follows:
Notice that the CPU cores required are now 8, with 200 megabytes of memory and 98 megabytes of disk space. These values can be given to the system administrator who can adjust the hardware sizing as needed.
4. Click OK to close the Estimate Hardware Requirements window.
Task 3. Validate and publish the cube. Even though you validated the cube in the previous unit, it is a good practice to always validate the cube prior to publishing it.
1. Right-click the Product Sales cube, click Validate, and then examine the Issues tab. Notice that there are no error markings on the icons in Project Explorer. Also notice that the Issues tab contains a check mark and indicates 0 issues.
2. In Project Explorer, right-click the Product Sales cube, and then click
Publish. The Publish dialog window appears.
Name: Sharonne Ayers Email: [email protected] TCW Adobe Connect 2021/02/17
Uni t 3 Deploy and conf igure a Dynamic Cube
© Copyright IBM Corp. 2012, 2016 3-12 Course materials may not be reproduced in whole or in part without the prior written permission of IBM.
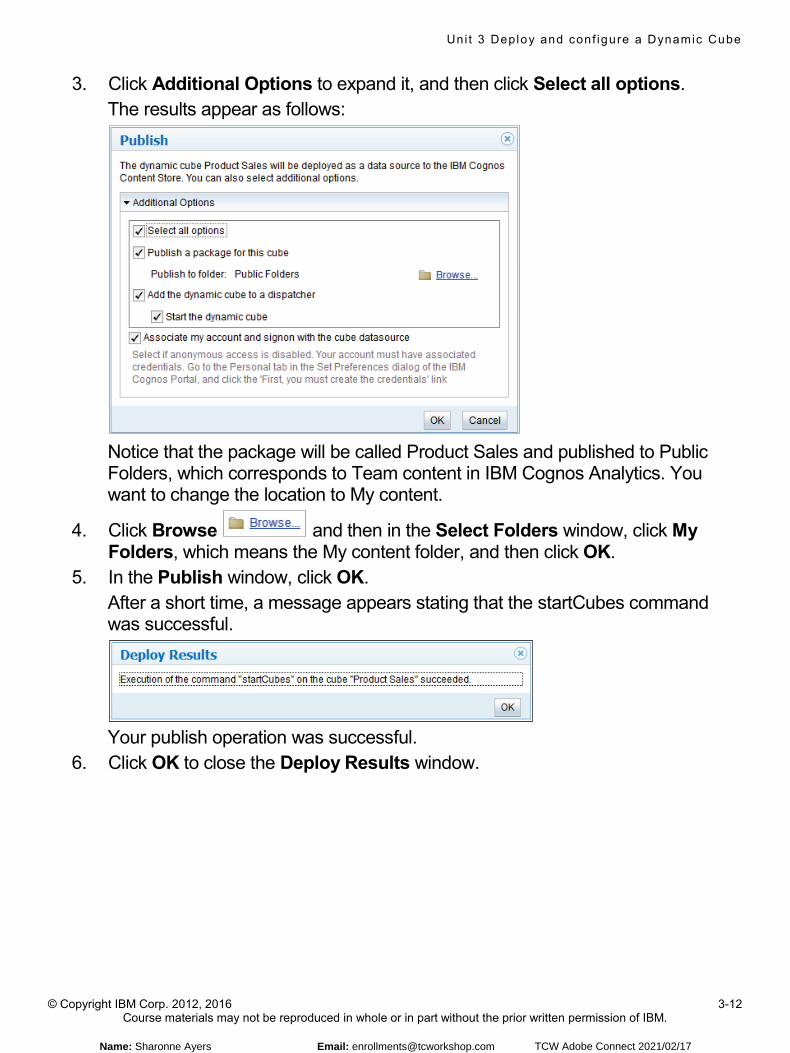
3. Click Additional Options to expand it, and then click Select all options. The results appear as follows:
Notice that the package will be called Product Sales and published to Public Folders, which corresponds to Team content in IBM Cognos Analytics. You want to change the location to My content.
4. Click Browse and then in the Select Folders window, click My Folders, which means the My content folder, and then click OK.
5. In the Publish window, click OK. After a short time, a message appears stating that the startCubes command was successful.
Your publish operation was successful.
6. Click OK to close the Deploy Results window.
Name: Sharonne Ayers Email: [email protected] TCW Adobe Connect 2021/02/17

Uni t 3 Deploy and conf igure a Dynamic Cube
© Copyright IBM Corp. 2012, 2016 3-13 Course materials may not be reproduced in whole or in part without the prior written permission of IBM.
Task 4. Examine the objects created by the deployment. 1. Open a Web browser and then browse to http://
http://vclassbase:9300/bi/v1/disp and authenticate as admin/Education1.
2. On the menu, click Manage , and then click Administration console, A new browser tab opens for IBM Cognos Administration.
3. In IBM Cognos Administration, click the Configuration tab. The results appear as follows:
Notice the Product Sales cube has been published as a data source connection in IBM Cognos Administration. It can now be used as a data source connection for reporting.
4. Return to the Welcome tab in your browser, and on the menu, click
My content . Notice that the Product Sales package was published to the My content folder.
Task 5. Examine the cube in the Query Service. 1. Return to the IBM Cognos Administration tab of the Web browser. 2. Click the Status tab, and then in the left pane, click System.
3. In the Scorecard pane, beside All servers, click Change view , point to Services, and then click Query.
4. Click QueryService . Notice that the Product Sales cube has been added to the QueryService of the default dispatcher. You can examine all the cube actions from here, or you can use the Dynamic Cubes shortcut option in the Status tab. You want to view the cube using the Dynamic Cubes option from the Status tab.
5. On the Status tab, on the left, click Dynamic Cubes .
Name: Sharonne Ayers Email: [email protected] TCW Adobe Connect 2021/02/17
Uni t 3 Deploy and conf igure a Dynamic Cube
© Copyright IBM Corp. 2012, 2016 3-14 Course materials may not be reproduced in whole or in part without the prior written permission of IBM.
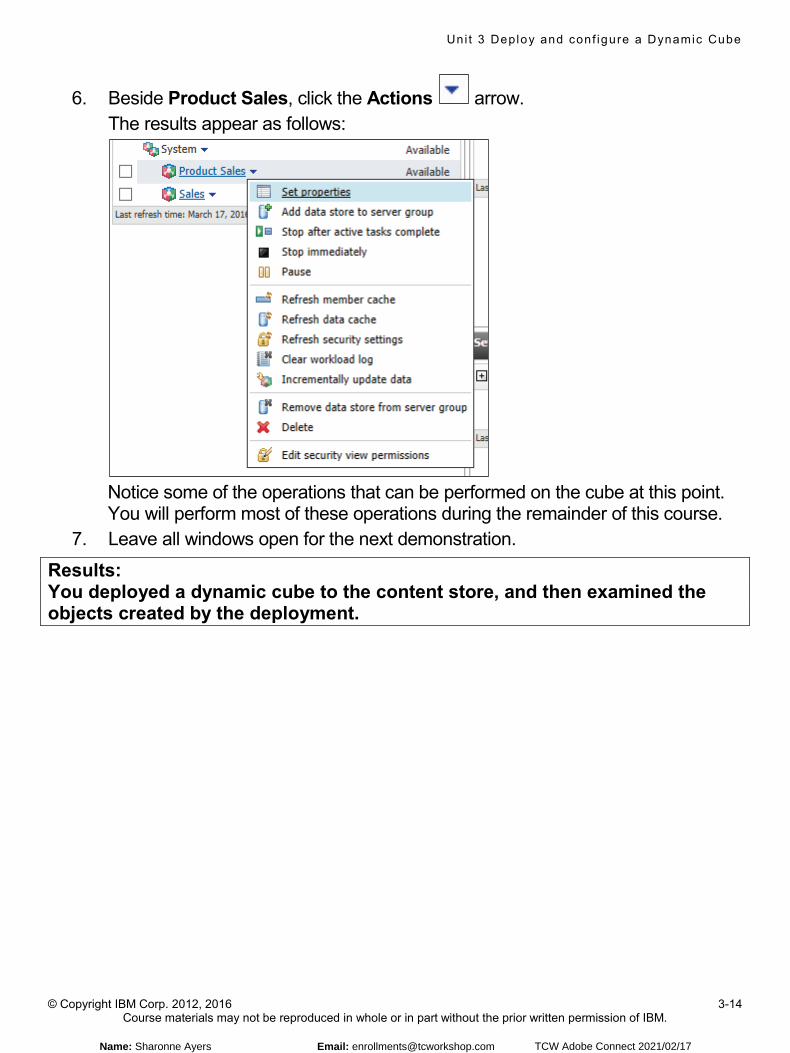
6. Beside Product Sales, click the Actions arrow. The results appear as follows:
Notice some of the operations that can be performed on the cube at this point. You will perform most of these operations during the remainder of this course.
7. Leave all windows open for the next demonstration.
Results: You deployed a dynamic cube to the content store, and then examined the objects created by the deployment.
Name: Sharonne Ayers Email: [email protected] TCW Adobe Connect 2021/02/17
Uni t 3 Deploy and conf igure a Dynamic Cube
© Copyright IBM Corp. 2012, 2016 3-18 Course materials may not be reproduced in whole or in part without the prior written permission of IBM.
© Copyright IBM Corporation 2016Deploy and configure a Dynamic Cube
Demonstration 2
Manually assign an access account
Demonstration 2: Manually assign an access account
Name: Sharonne Ayers Email: [email protected] TCW Adobe Connect 2021/02/17
Uni t 3 Deploy and conf igure a Dynamic Cube
© Copyright IBM Corp. 2012, 2016 3-19 Course materials may not be reproduced in whole or in part without the prior written permission of IBM.
Demonstration 2: Manually assign an access account
Purpose: You want to explore how to assign an access account to a cube. In the publish operation of your Product Sales cube, this task was already done for you because you selected the option to 'Associate my account and signon with the cube data source'. You will now examine how to assign the account manually in the event that you choose to do it yourself. This task is normally performed by an IBM Cognos Administrator.
Task 1. Examine how to specify the access account. In the previous demonstration, you left your web browser open.
1. Within the IBM Cognos Administration browser tab, click the Configuration tab.
2. Beside the Product Sales cube, in the Actions column, click
Set properties - Product Sales . At the bottom, under Access Account, notice that the Admin Person user is already assigned based on the publish options you selected in the previous demonstrations. You can still see how to select the access account, or even change the current selection.
Name: Sharonne Ayers Email: [email protected] TCW Adobe Connect 2021/02/17
Uni t 3 Deploy and conf igure a Dynamic Cube
© Copyright IBM Corp. 2012, 2016 3-20 Course materials may not be reproduced in whole or in part without the prior written permission of IBM.
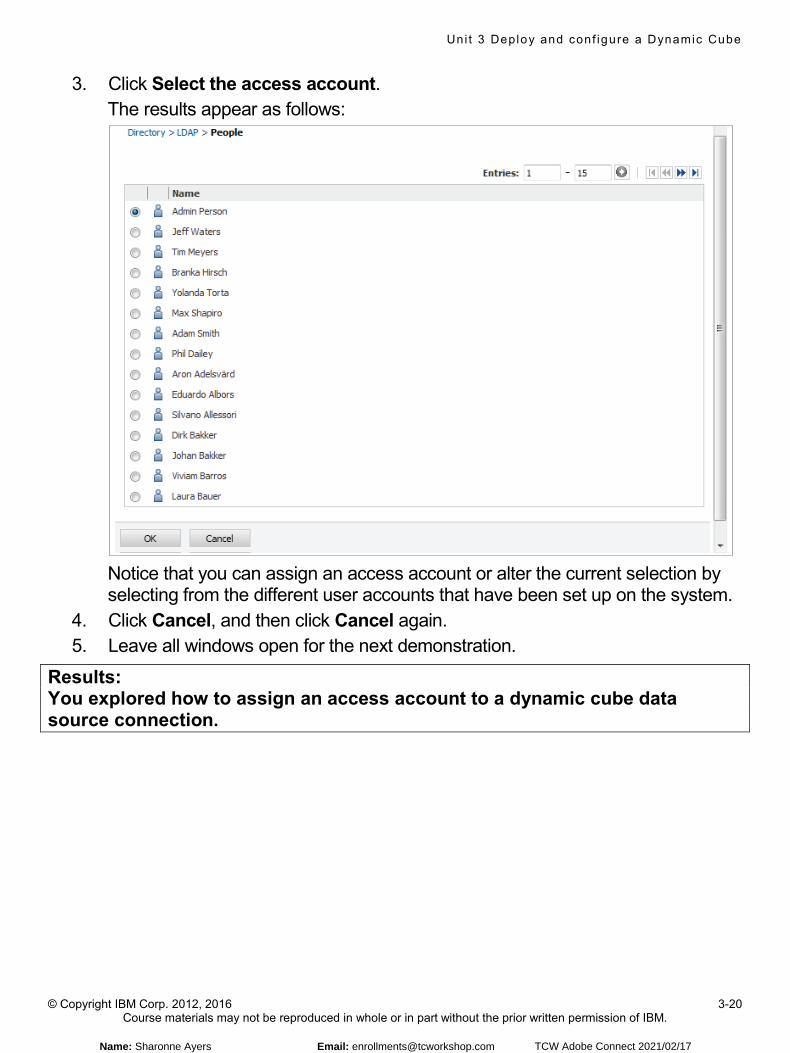
3. Click Select the access account. The results appear as follows:
Notice that you can assign an access account or alter the current selection by selecting from the different user accounts that have been set up on the system.
4. Click Cancel, and then click Cancel again. 5. Leave all windows open for the next demonstration.
Results: You explored how to assign an access account to a dynamic cube data source connection.
Name: Sharonne Ayers Email: [email protected] TCW Adobe Connect 2021/02/17
Uni t 3 Deploy and conf igure a Dynamic Cube
© Copyright IBM Corp. 2012, 2016 3-25 Course materials may not be reproduced in whole or in part without the prior written permission of IBM.
© Copyright IBM Corporation 2016Deploy and configure a Dynamic Cube
Demonstration 3
Report against a cube and view the metrics
Demonstration 3: Report against a cube and view the metrics
Name: Sharonne Ayers Email: [email protected] TCW Adobe Connect 2021/02/17
Uni t 3 Deploy and conf igure a Dynamic Cube
© Copyright IBM Corp. 2012, 2016 3-26 Course materials may not be reproduced in whole or in part without the prior written permission of IBM.
Demonstration 3: Report against a cube and view the metrics
Purpose: You want to examine cube statistics before and after running a report against the cube data source.
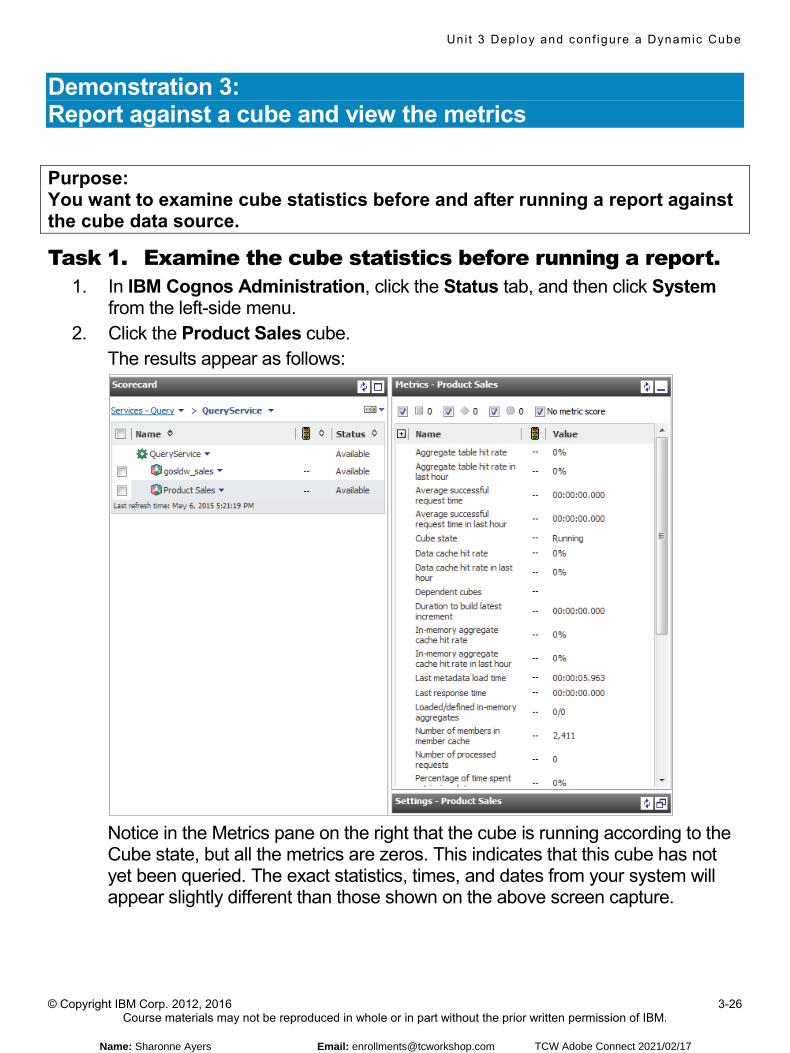
Task 1. Examine the cube statistics before running a report. 1. In IBM Cognos Administration, click the Status tab, and then click System
from the left-side menu. 2. Click the Product Sales cube.
The results appear as follows:
Notice in the Metrics pane on the right that the cube is running according to the Cube state, but all the metrics are zeros. This indicates that this cube has not yet been queried. The exact statistics, times, and dates from your system will appear slightly different than those shown on the above screen capture.
Name: Sharonne Ayers Email: [email protected] TCW Adobe Connect 2021/02/17
Uni t 3 Deploy and conf igure a Dynamic Cube
© Copyright IBM Corp. 2012, 2016 3-27 Course materials may not be reproduced in whole or in part without the prior written permission of IBM.
Task 2. Create a report that uses the cube as a data source. 1. Return to the Welcome tab in your Web browser and from the menu, click
New , and then click Report. 2. Next to Package, click the Browse button, click My content, and then click the
Product Sales package that you published in a previous demonstration. 3. Click Open. 4. In the New window, double-click Crosstab.
5. On the menu, click Navigate , and then click Report .
6. At the top right, click Show properties , and in the Data section of the properties window, double-click Advanced drill behavior.
7. Select the check boxes for Allow drill-up and drill-down and Use these settings as the default for new reports, and then click OK.
8. At the top, click Show properties again to hide the properties pane.
9. On Page explorer, click Report pages > Page 1 .
10. From the menu, click Data .
11. From the Source pane, click View Members Tree , expand the Measures folder, and then drag the Sales measure to the Measures drop zone.
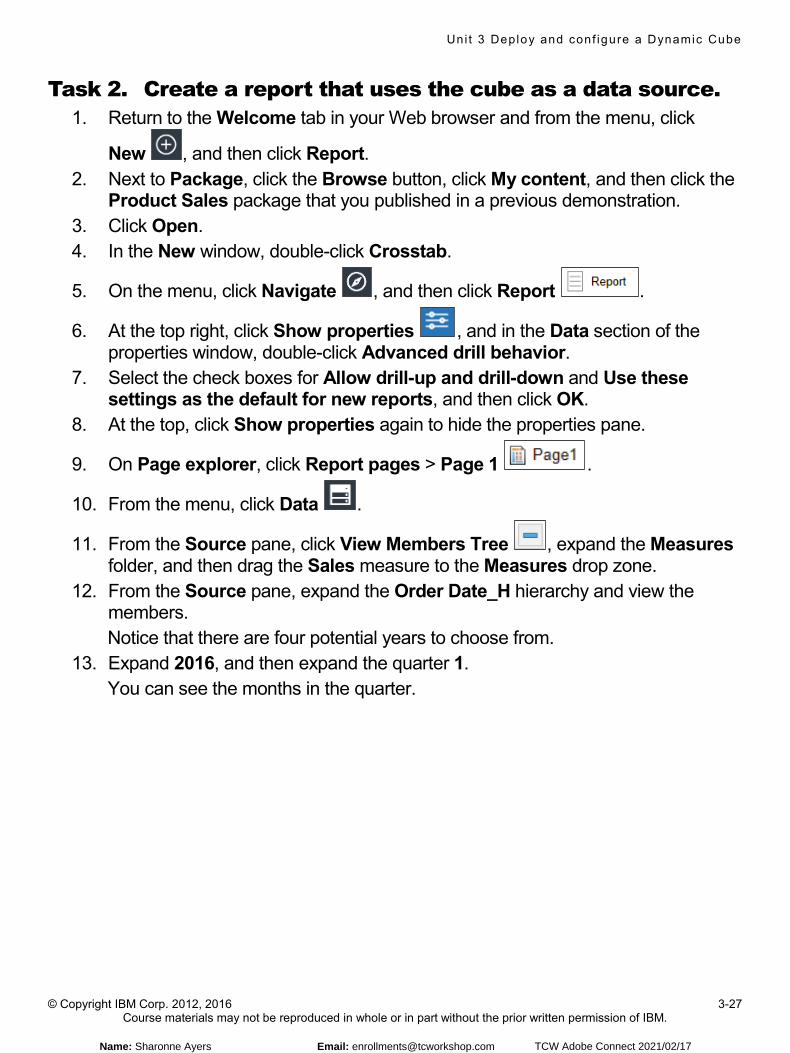
12. From the Source pane, expand the Order Date_H hierarchy and view the members. Notice that there are four potential years to choose from.
13. Expand 2016, and then expand the quarter 1. You can see the months in the quarter.
Name: Sharonne Ayers Email: [email protected] TCW Adobe Connect 2021/02/17
Uni t 3 Deploy and conf igure a Dynamic Cube
© Copyright IBM Corp. 2012, 2016 3-28 Course materials may not be reproduced in whole or in part without the prior written permission of IBM.
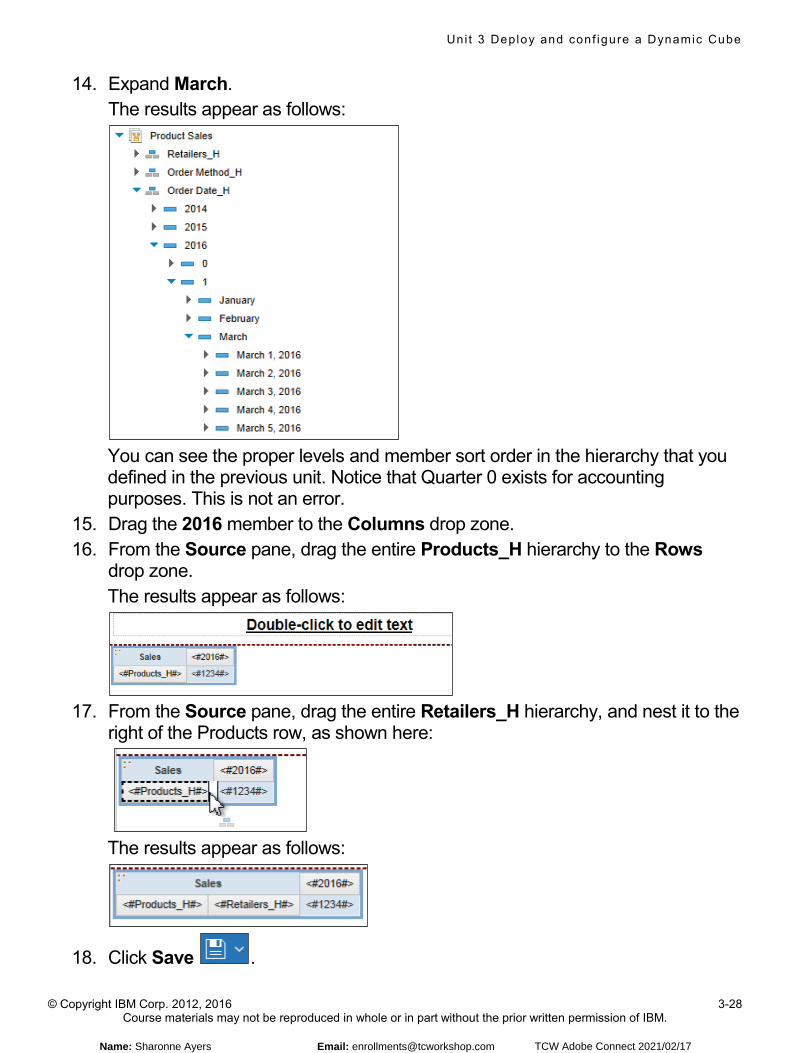
14. Expand March. The results appear as follows:
You can see the proper levels and member sort order in the hierarchy that you defined in the previous unit. Notice that Quarter 0 exists for accounting purposes. This is not an error.
15. Drag the 2016 member to the Columns drop zone. 16. From the Source pane, drag the entire Products_H hierarchy to the Rows
drop zone. The results appear as follows:
17. From the Source pane, drag the entire Retailers_H hierarchy, and nest it to the
right of the Products row, as shown here:
The results appear as follows:
18. Click Save .
Name: Sharonne Ayers Email: [email protected] TCW Adobe Connect 2021/02/17
Uni t 3 Deploy and conf igure a Dynamic Cube
© Copyright IBM Corp. 2012, 2016 3-29 Course materials may not be reproduced in whole or in part without the prior written permission of IBM.
19. In the Save as box, type Product Sales by Retailer 2016, click My content, and then click Save.
20. From the Run options menu , select Run HTML. The report opens in a new tab.
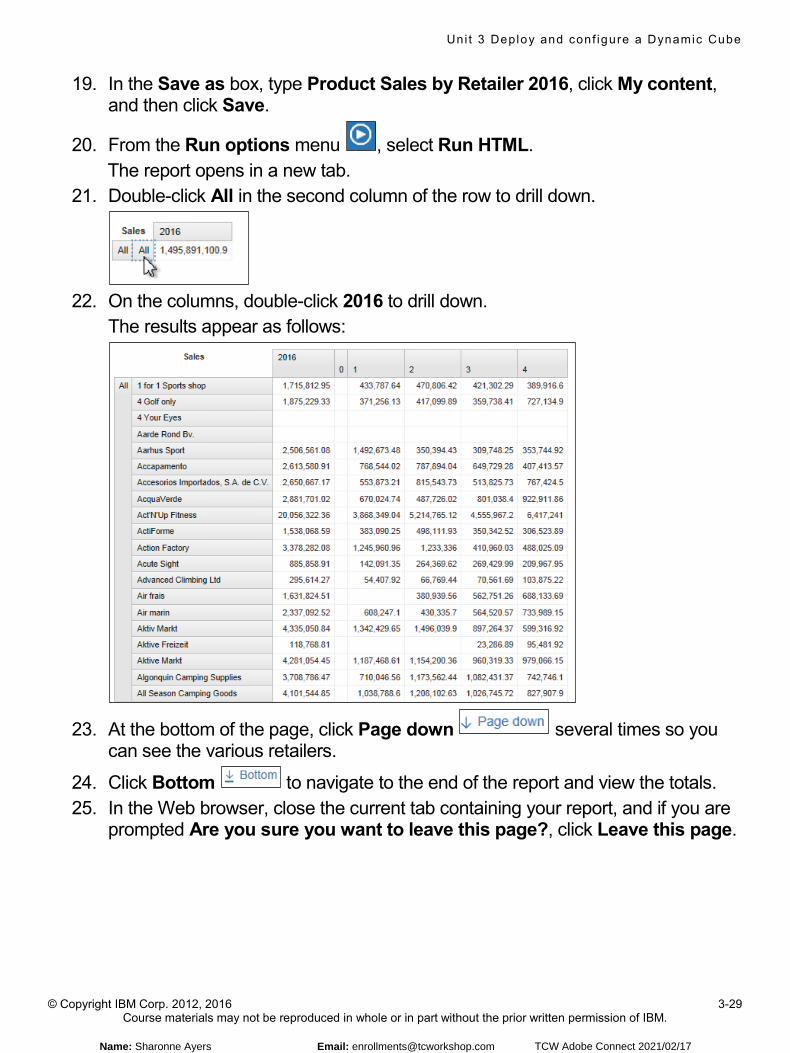
21. Double-click All in the second column of the row to drill down.
22. On the columns, double-click 2016 to drill down.
The results appear as follows:
23. At the bottom of the page, click Page down several times so you can see the various retailers.
24. Click Bottom to navigate to the end of the report and view the totals. 25. In the Web browser, close the current tab containing your report, and if you are
prompted Are you sure you want to leave this page?, click Leave this page.
Name: Sharonne Ayers Email: [email protected] TCW Adobe Connect 2021/02/17
Uni t 3 Deploy and conf igure a Dynamic Cube
© Copyright IBM Corp. 2012, 2016 3-30 Course materials may not be reproduced in whole or in part without the prior written permission of IBM.
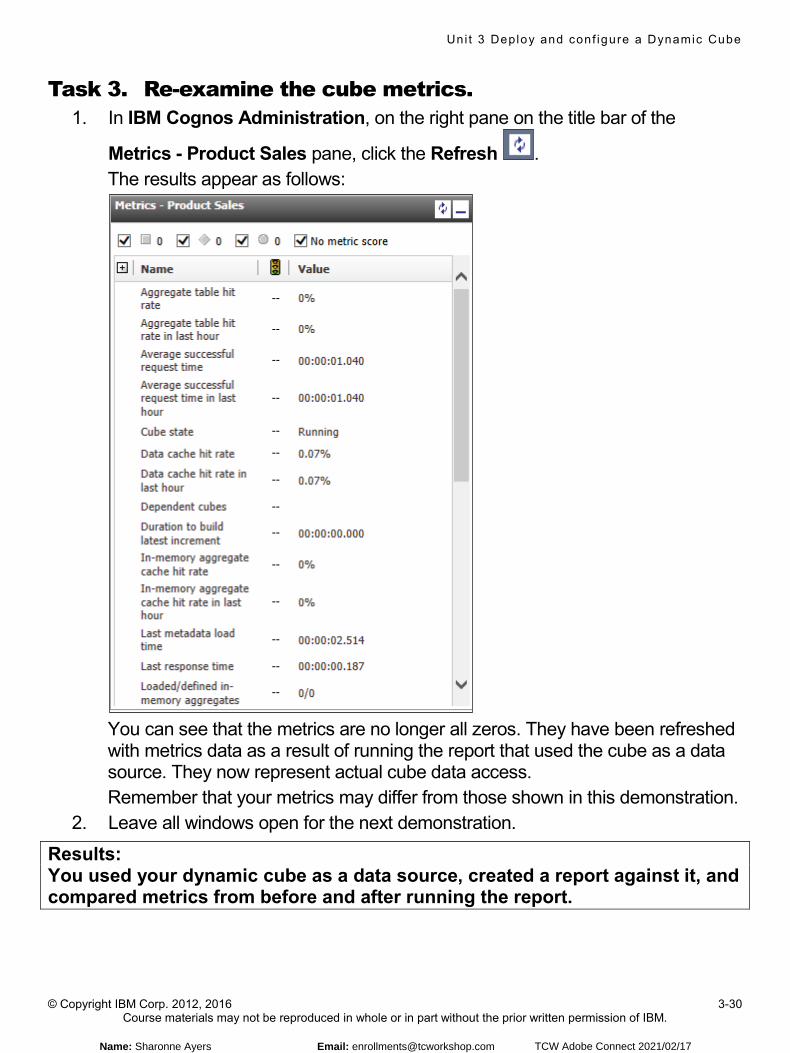
Task 3. Re-examine the cube metrics. 1. In IBM Cognos Administration, on the right pane on the title bar of the
Metrics - Product Sales pane, click the Refresh . The results appear as follows:
You can see that the metrics are no longer all zeros. They have been refreshed with metrics data as a result of running the report that used the cube as a data source. They now represent actual cube data access. Remember that your metrics may differ from those shown in this demonstration.
2. Leave all windows open for the next demonstration.
Results: You used your dynamic cube as a data source, created a report against it, and compared metrics from before and after running the report.
Name: Sharonne Ayers Email: [email protected] TCW Adobe Connect 2021/02/17
Uni t 3 Deploy and conf igure a Dynamic Cube
© Copyright IBM Corp. 2012, 2016 3-31 Course materials may not be reproduced in whole or in part without the prior written permission of IBM.
© Copyright IBM Corporation 2016Deploy and configure a Dynamic Cube
Demonstration 4
Configure a Dynamic Cube to trigger a report
Demonstration 4: Configure a Dynamic Cube to trigger a report
Name: Sharonne Ayers Email: [email protected] TCW Adobe Connect 2021/02/17
Uni t 3 Deploy and conf igure a Dynamic Cube
© Copyright IBM Corp. 2012, 2016 3-32 Course materials may not be reproduced in whole or in part without the prior written permission of IBM.
Demonstration 4: Configure a Dynamic Cube to trigger a report
Purpose: You want to configure a cube to trigger a report after the in-memory aggregates have finished loading, so that the cube cache is populated with data as soon as possible. You will set the Post in-memory trigger name property, start the cube, and view the results.
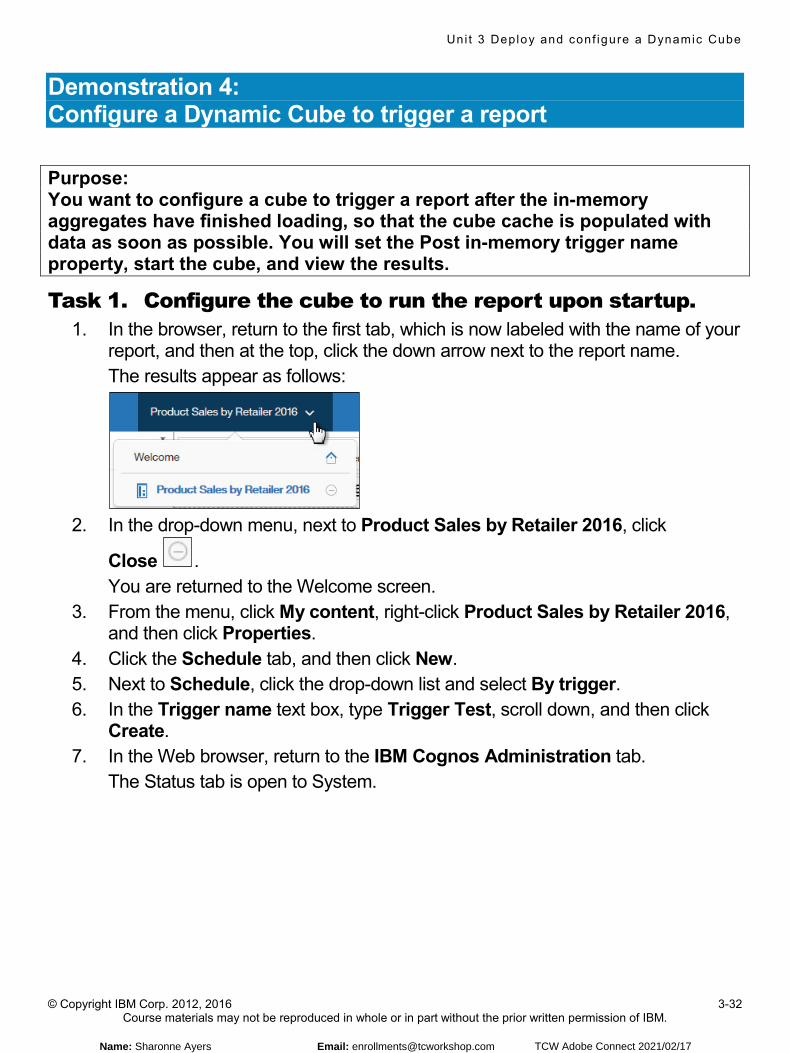
Task 1. Configure the cube to run the report upon startup. 1. In the browser, return to the first tab, which is now labeled with the name of your
report, and then at the top, click the down arrow next to the report name. The results appear as follows:
2. In the drop-down menu, next to Product Sales by Retailer 2016, click
Close . You are returned to the Welcome screen.
3. From the menu, click My content, right-click Product Sales by Retailer 2016, and then click Properties.
4. Click the Schedule tab, and then click New. 5. Next to Schedule, click the drop-down list and select By trigger. 6. In the Trigger name text box, type Trigger Test, scroll down, and then click
Create. 7. In the Web browser, return to the IBM Cognos Administration tab.
The Status tab is open to System.
Name: Sharonne Ayers Email: [email protected] TCW Adobe Connect 2021/02/17
Uni t 3 Deploy and conf igure a Dynamic Cube
© Copyright IBM Corp. 2012, 2016 3-33 Course materials may not be reproduced in whole or in part without the prior written permission of IBM.
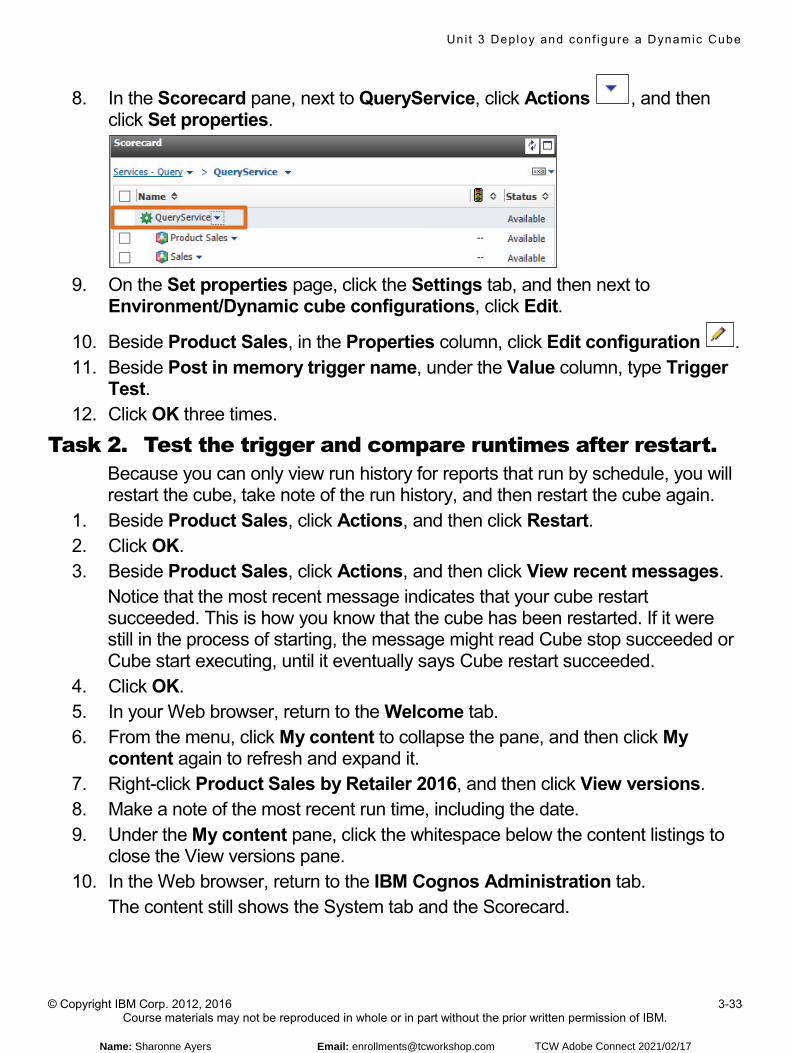
8. In the Scorecard pane, next to QueryService, click Actions , and then click Set properties.
9. On the Set properties page, click the Settings tab, and then next to
Environment/Dynamic cube configurations, click Edit.
10. Beside Product Sales, in the Properties column, click Edit configuration . 11. Beside Post in memory trigger name, under the Value column, type Trigger
Test. 12. Click OK three times.
Task 2. Test the trigger and compare runtimes after restart. Because you can only view run history for reports that run by schedule, you will restart the cube, take note of the run history, and then restart the cube again.
1. Beside Product Sales, click Actions, and then click Restart. 2. Click OK. 3. Beside Product Sales, click Actions, and then click View recent messages.
Notice that the most recent message indicates that your cube restart succeeded. This is how you know that the cube has been restarted. If it were still in the process of starting, the message might read Cube stop succeeded or Cube start executing, until it eventually says Cube restart succeeded.
4. Click OK. 5. In your Web browser, return to the Welcome tab. 6. From the menu, click My content to collapse the pane, and then click My
content again to refresh and expand it. 7. Right-click Product Sales by Retailer 2016, and then click View versions. 8. Make a note of the most recent run time, including the date. 9. Under the My content pane, click the whitespace below the content listings to
close the View versions pane. 10. In the Web browser, return to the IBM Cognos Administration tab.
The content still shows the System tab and the Scorecard.
Name: Sharonne Ayers Email: [email protected] TCW Adobe Connect 2021/02/17
Uni t 3 Deploy and conf igure a Dynamic Cube
© Copyright IBM Corp. 2012, 2016 3-34 Course materials may not be reproduced in whole or in part without the prior written permission of IBM.
11. Beside the Product Sales cube, use the Actions menu to restart the cube. 12. Click OK. 13. Beside the Product Sales cube, click Actions, and then click View recent
messages. Notice that the cube has been restarted.
14. Click OK.
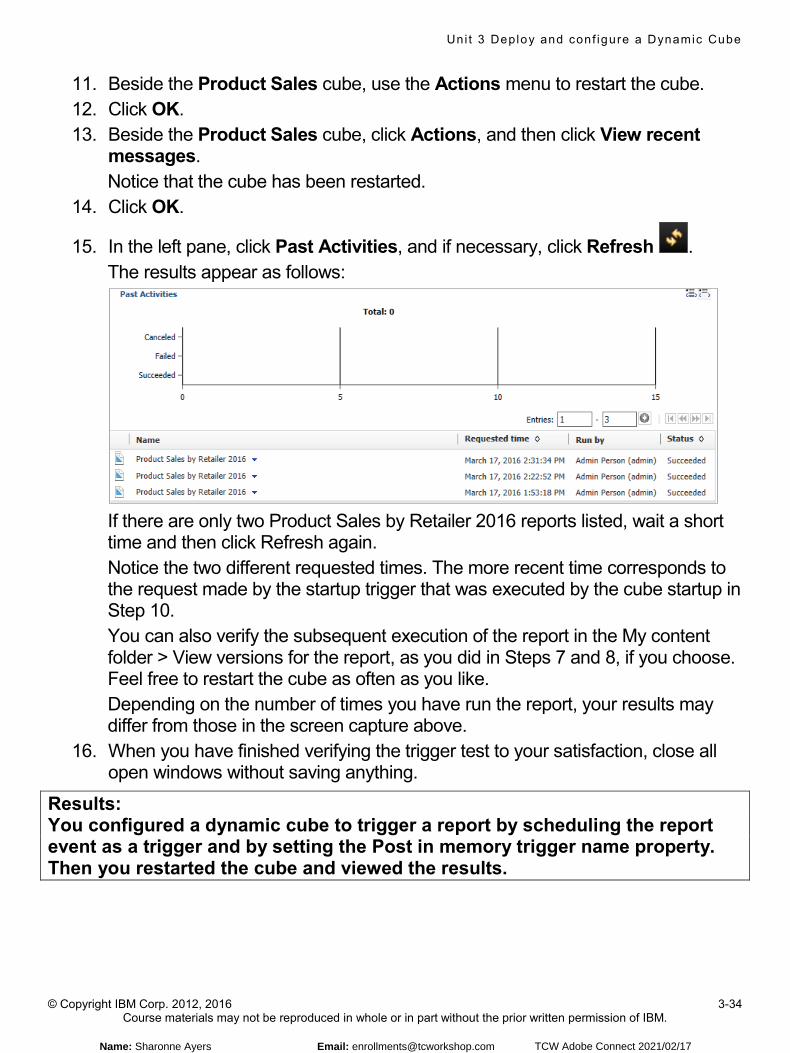
15. In the left pane, click Past Activities, and if necessary, click Refresh . The results appear as follows:
If there are only two Product Sales by Retailer 2016 reports listed, wait a short time and then click Refresh again. Notice the two different requested times. The more recent time corresponds to the request made by the startup trigger that was executed by the cube startup in Step 10. You can also verify the subsequent execution of the report in the My content folder > View versions for the report, as you did in Steps 7 and 8, if you choose. Feel free to restart the cube as often as you like. Depending on the number of times you have run the report, your results may differ from those in the screen capture above.
16. When you have finished verifying the trigger test to your satisfaction, close all open windows without saving anything.
Results: You configured a dynamic cube to trigger a report by scheduling the report event as a trigger and by setting the Post in memory trigger name property. Then you restarted the cube and viewed the results.
Name: Sharonne Ayers Email: [email protected] TCW Adobe Connect 2021/02/17
Uni t 3 Deploy and conf igure a Dynamic Cube
© Copyright IBM Corp. 2012, 2016 3-38 Course materials may not be reproduced in whole or in part without the prior written permission of IBM.
© Copyright IBM Corporation 2016Deploy and configure a Dynamic Cube
Exercise 1
Deploy and configure a Dynamic Cube
Exercise 1: Deploy and configure a Dynamic Cube
Name: Sharonne Ayers Email: [email protected] TCW Adobe Connect 2021/02/17
Uni t 3 Deploy and conf igure a Dynamic Cube
© Copyright IBM Corp. 2012, 2016 3-39 Course materials may not be reproduced in whole or in part without the prior written permission of IBM.
Exercise 1: Deploy and configure a Dynamic Cube You want to deploy the dynamic cube that you created in the exercise from the previous unit to the content store using quick publish. Then you will examine the objects that are created by your deployment. To accomplish this you will need to:
• use the Estimate Hardware Requirements tool to estimate the hardware requirements to be delivered to the system administrator
• validate and publish the Sales Retailers cube from IBM Cognos Cube Designer • examine the deployed package • examine the data source connection in IBM Cognos Administration • examine the cube in IBM Cognos Administration
For more detailed information outlined as tasks and final results, see the Tasks and Results section of this exercise. If you need additional help in performing the tasks in this exercise, refer to the demonstrations in this unit.
Name: Sharonne Ayers Email: [email protected] TCW Adobe Connect 2021/02/17
Uni t 3 Deploy and conf igure a Dynamic Cube
© Copyright IBM Corp. 2012, 2016 3-40 Course materials may not be reproduced in whole or in part without the prior written permission of IBM.
Exercise 1: Tasks and Results Task 1. Open the cube and use the Estimate Hardware
Requirements tool. • Start IBM Cognos Cube Designer, select Open an existing project and
navigate to C:\Training\B6063\Start Files\03\Exercise 1\ folder and then open the Sales Retailers.fmd project. This file is an exact copy of the final cube you created and saved in the Unit 2 exercise. If you prefer, you can use your file instead.
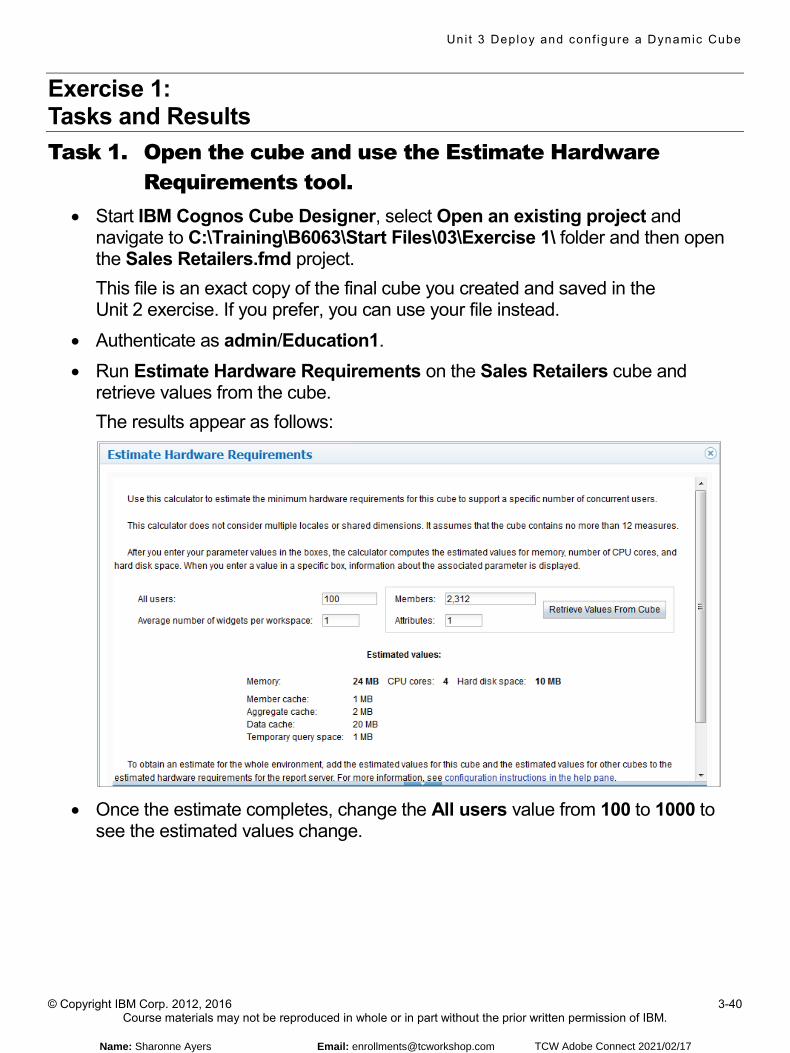
• Authenticate as admin/Education1. • Run Estimate Hardware Requirements on the Sales Retailers cube and
retrieve values from the cube. The results appear as follows:
• Once the estimate completes, change the All users value from 100 to 1000 to
see the estimated values change.
Name: Sharonne Ayers Email: [email protected] TCW Adobe Connect 2021/02/17
Uni t 3 Deploy and conf igure a Dynamic Cube
© Copyright IBM Corp. 2012, 2016 3-41 Course materials may not be reproduced in whole or in part without the prior written permission of IBM.
Task 2. Validate and publish the cube. • In the Project Explorer, expand Model, then expand the Order Date dimension,
the Retailers dimension, and the Sales Retailers cube. • Validate the Sales Retailers cube, and ensure that there are no issues. • In the Project Explorer, publish the Sales Retailers cube to My Folders
selecting all options.
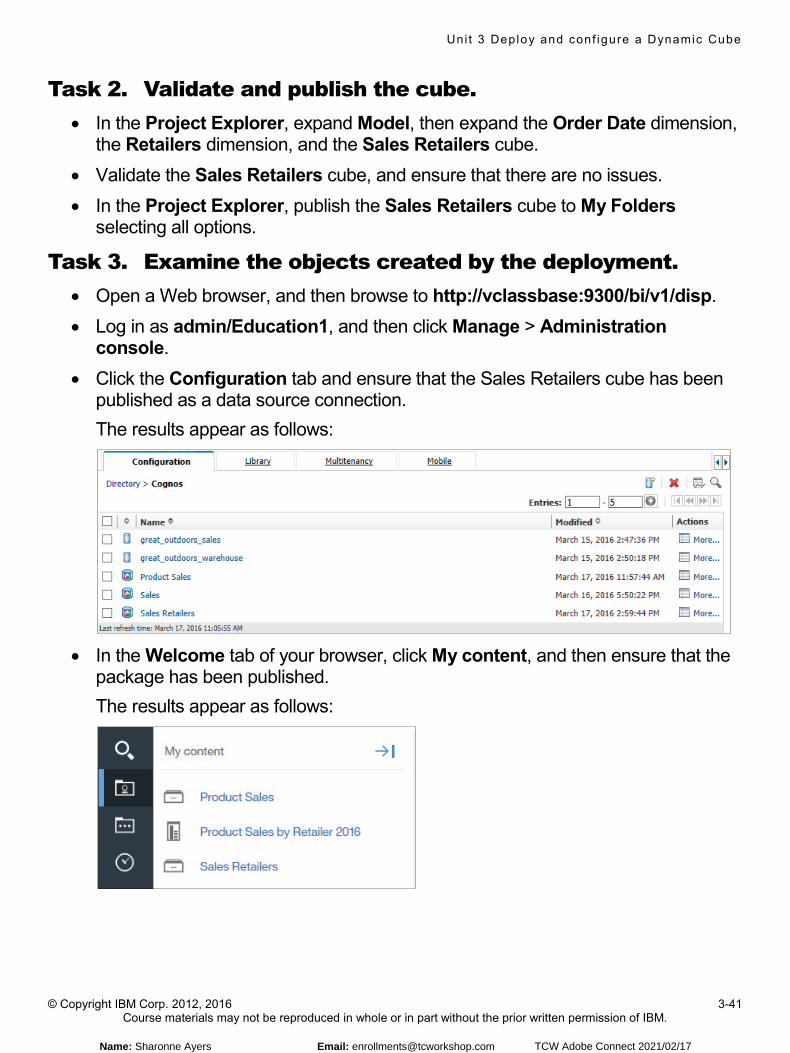
Task 3. Examine the objects created by the deployment. • Open a Web browser, and then browse to http://vclassbase:9300/bi/v1/disp. • Log in as admin/Education1, and then click Manage > Administration
console. • Click the Configuration tab and ensure that the Sales Retailers cube has been
published as a data source connection. The results appear as follows:
• In the Welcome tab of your browser, click My content, and then ensure that the
package has been published. The results appear as follows:
Name: Sharonne Ayers Email: [email protected] TCW Adobe Connect 2021/02/17
Uni t 3 Deploy and conf igure a Dynamic Cube
© Copyright IBM Corp. 2012, 2016 3-42 Course materials may not be reproduced in whole or in part without the prior written permission of IBM.
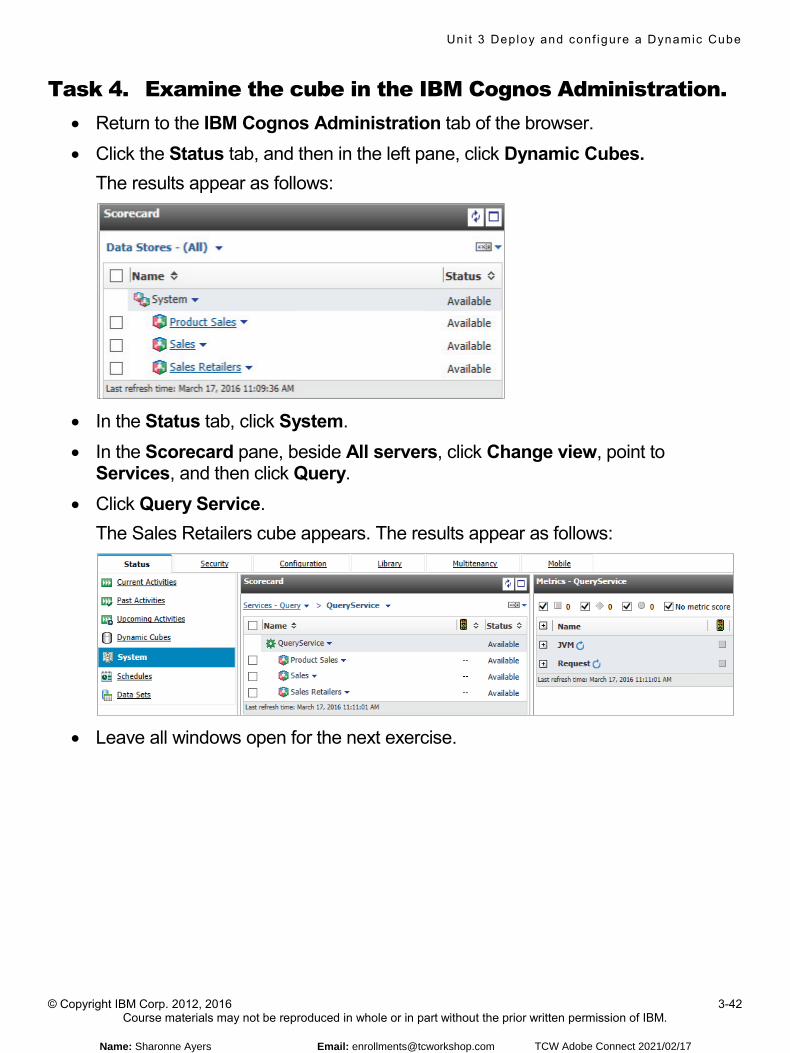
Task 4. Examine the cube in the IBM Cognos Administration. • Return to the IBM Cognos Administration tab of the browser.• Click the Status tab, and then in the left pane, click Dynamic Cubes.
The results appear as follows:
• In the Status tab, click System.• In the Scorecard pane, beside All servers, click Change view, point to
Services, and then click Query.• Click Query Service.
The Sales Retailers cube appears. The results appear as follows:
• Leave all windows open for the next exercise.
Name: Sharonne Ayers Email: [email protected] TCW Adobe Connect 2021/02/17
Uni t 3 Deploy and conf igure a Dynamic Cube
© Copyright IBM Corp. 2012, 2016 3-43 Course materials may not be reproduced in whole or in part without the prior written permission of IBM.
© Copyright IBM Corporation 2016Deploy and configure a Dynamic Cube
Exercise 2
Report against a cube and create a trigger
Exercise 2: Report against a cube and create a trigger
Name: Sharonne Ayers Email: [email protected] TCW Adobe Connect 2021/02/17
Uni t 3 Deploy and conf igure a Dynamic Cube
© Copyright IBM Corp. 2012, 2016 3-44 Course materials may not be reproduced in whole or in part without the prior written permission of IBM.
Exercise 2: Report against a cube and create a trigger Next, you want to create a report for your Sales Retailers cube, called Retail_Sales_by_Day, and view the report and the statistics that are created for the cube. Then you will create a Post in-memory trigger for your report and verify that it works. To do this you will need to:
• examine the metrics for the Sales Retailers cube in IBM Cognos Administration • create a crosstab report containing rows from the Retailers_H hierarchy and
columns from the Order Date_H hierarchy to show the Sales measure from your cube
• run the report to refresh the metrics and then examine them • schedule the report to run by trigger after the in-memory aggregates have loaded
as soon the Sales Retailers cube starts • restart the cube and validate that the report was executed upon cube startup.
For more detailed information outlined as tasks and final results, see the Tasks and Results section of this exercise. If you need additional help in performing the tasks in this exercise, refer to the demonstrations in this unit.
Name: Sharonne Ayers Email: [email protected] TCW Adobe Connect 2021/02/17
Uni t 3 Deploy and conf igure a Dynamic Cube
© Copyright IBM Corp. 2012, 2016 3-45 Course materials may not be reproduced in whole or in part without the prior written permission of IBM.
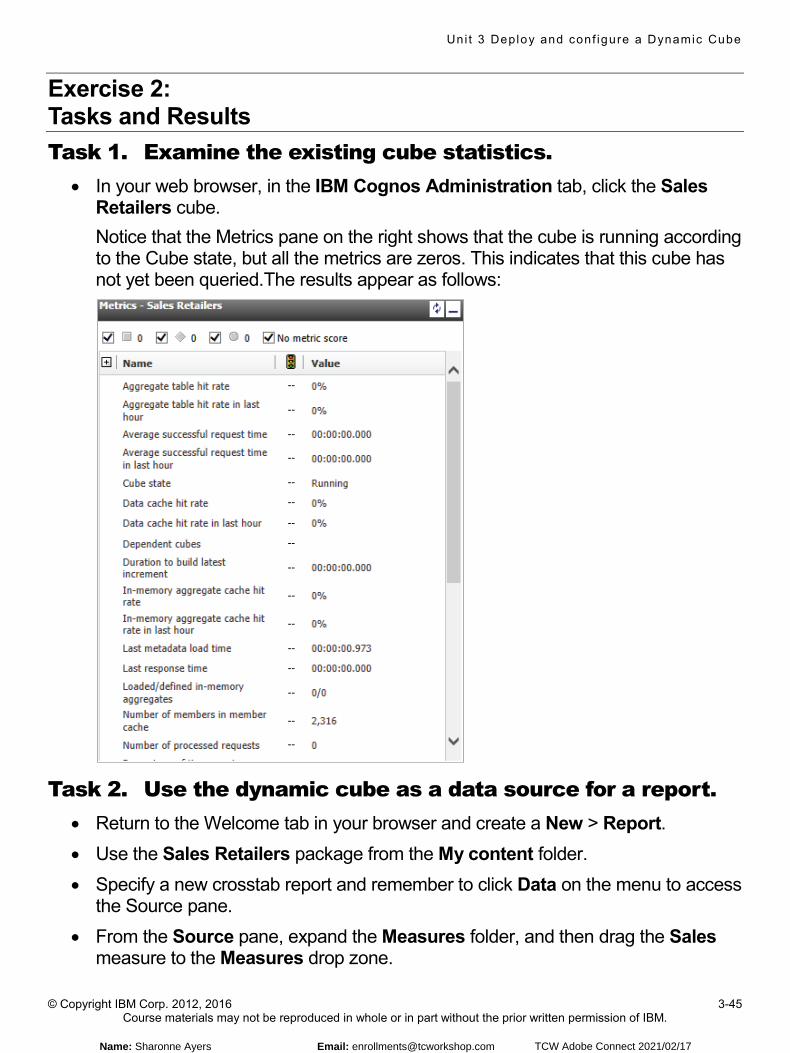
Exercise 2: Tasks and Results Task 1. Examine the existing cube statistics.
• In your web browser, in the IBM Cognos Administration tab, click the Sales Retailers cube. Notice that the Metrics pane on the right shows that the cube is running according to the Cube state, but all the metrics are zeros. This indicates that this cube has not yet been queried.The results appear as follows:
Task 2. Use the dynamic cube as a data source for a report. • Return to the Welcome tab in your browser and create a New > Report. • Use the Sales Retailers package from the My content folder. • Specify a new crosstab report and remember to click Data on the menu to access
the Source pane. • From the Source pane, expand the Measures folder, and then drag the Sales
measure to the Measures drop zone.
Name: Sharonne Ayers Email: [email protected] TCW Adobe Connect 2021/02/17
Uni t 3 Deploy and conf igure a Dynamic Cube
© Copyright IBM Corp. 2012, 2016 3-46 Course materials may not be reproduced in whole or in part without the prior written permission of IBM.
• From the Source pane, drag the Retailers_H hierarchy to the Rows drop zone. • From the Source pane, drag the Order Date_H hierarchy to the Columns drop
zone. • Save the report as Retail Sales by Day in the My content folder. • Run the report as HTML. • On the rows header, double-click All to drill to the retailers. • On the column header, double-click All to drill to the day level. • Scroll left/right and Page up/down to examine the report data.
Notice the sparseness of the data, because this report is at the day level. Also, because the report is at the day level, it may take longer to run than the monthly report in the previous demonstrations.
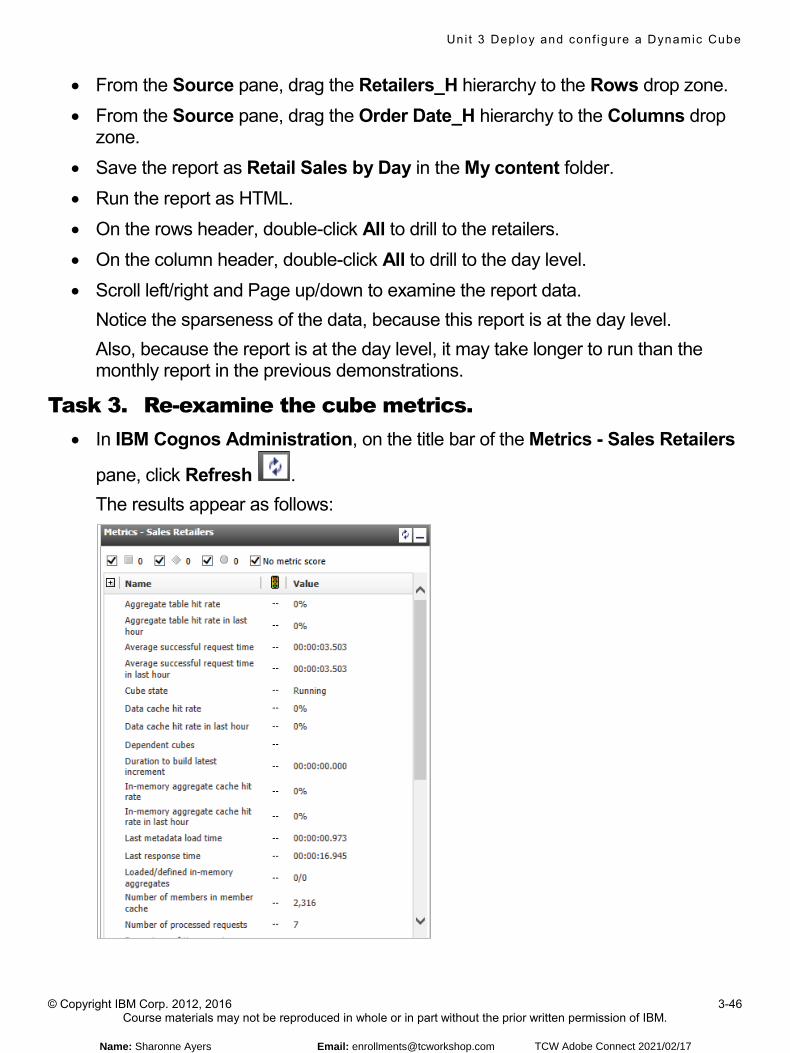
Task 3. Re-examine the cube metrics. • In IBM Cognos Administration, on the title bar of the Metrics - Sales Retailers
pane, click Refresh . The results appear as follows:
Name: Sharonne Ayers Email: [email protected] TCW Adobe Connect 2021/02/17
Uni t 3 Deploy and conf igure a Dynamic Cube
© Copyright IBM Corp. 2012, 2016 3-47 Course materials may not be reproduced in whole or in part without the prior written permission of IBM.
Task 4. Configure the cube to run the report upon startup. • In the browser, return to the Welcome screen. (Hint: consult the demonstration if
you do not remember how to get back from the report to the Welcome screen.) • Click My content, and then access the properties for the Retail Sales by Day
report. • In the Schedule tab, create a new schedule. • Create the schedule By trigger and name the trigger Trigger Test2. • In IBM Cognos Administration, use the Actions for Query Service to Set
properties. • Click the Settings tab, and then beside Environment > Dynamic cube
configurations, under the Value column, click Edit. • Beside Sales Retailers, in the Properties column, click Edit configuration. • Beside Post in memory trigger name, in the Value column, type Trigger Test2. • Remember at this point to click OK three times.
Task 5. Test the trigger. • In the Scorecard pane, click QueryService. • Next to Sales Retailers, use Actions to Restart the cube. • View recent messages for the Sales Retailers cube to ensure that the cube
restart succeeded. • In the Web browser, return to the Welcome tab and re-open My content. • Access View versions for the Retail Sales by Day report and make note of the
most recent run time and date. The report may take some time to execute because the data is at the daily grain.
• Return to IBM Cognos Administration. • In the left pane, click System. • On the Scorecard pane, navigate to the Sales Retailers cube on the
QueryService, and then restart the cube. • On the View the results - Restart window, notice that the Status indicates
Succeeded, and then click OK. Remember to allow some time for the daily detailed report to complete at this point.
Name: Sharonne Ayers Email: [email protected] TCW Adobe Connect 2021/02/17
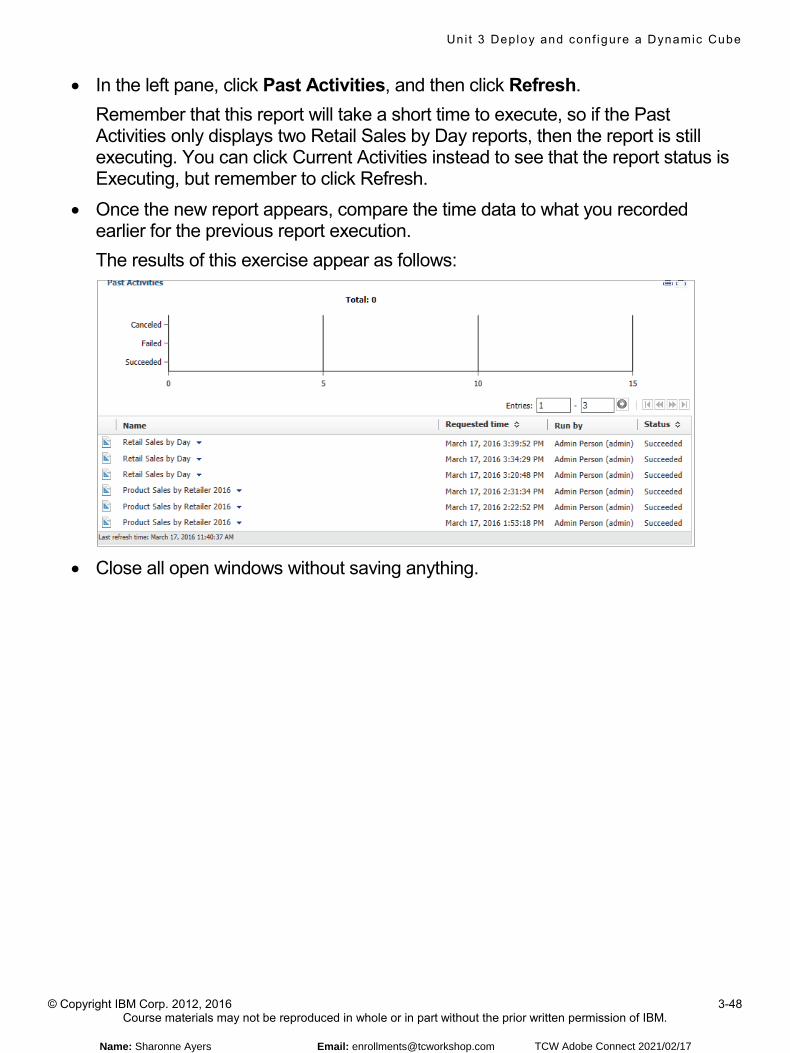
Uni t 3 Deploy and conf igure a Dynamic Cube
© Copyright IBM Corp. 2012, 2016 3-48 Course materials may not be reproduced in whole or in part without the prior written permission of IBM.
• In the left pane, click Past Activities, and then click Refresh. Remember that this report will take a short time to execute, so if the Past Activities only displays two Retail Sales by Day reports, then the report is still executing. You can click Current Activities instead to see that the report status is Executing, but remember to click Refresh.
• Once the new report appears, compare the time data to what you recorded earlier for the previous report execution. The results of this exercise appear as follows:
• Close all open windows without saving anything.
Name: Sharonne Ayers Email: [email protected] TCW Adobe Connect 2021/02/17
Advanced Dynamic Cube modeling
© Copyright IBM Corporation 2016Course materials may not be reproduced in whole or in part without the written permission of IBM.
Advanced Dynamic Cube modeling
IBM Cognos Dynamic Cubes
Name: Sharonne Ayers Email: [email protected] TCW Adobe Connect 2021/02/17

Uni t 4 Advanced Dynamic Cube model ing
© Copyright IBM Corp. 2012, 2016 4-2 Course materials may not be reproduced in whole or in part without the prior written permission of IBM.
Name: Sharonne Ayers Email: [email protected] TCW Adobe Connect 2021/02/17
Uni t 4 Advanced Dynamic Cube model ing
© Copyright IBM Corp. 2012, 2016 4-17 Course materials may not be reproduced in whole or in part without the prior written permission of IBM.
© Copyright IBM Corporation 2016Advanced Dynamic Cube modeling
Demonstration 1
Model a relative time dimension
Demonstration 1: Model a relative time dimension
Name: Sharonne Ayers Email: [email protected] TCW Adobe Connect 2021/02/17
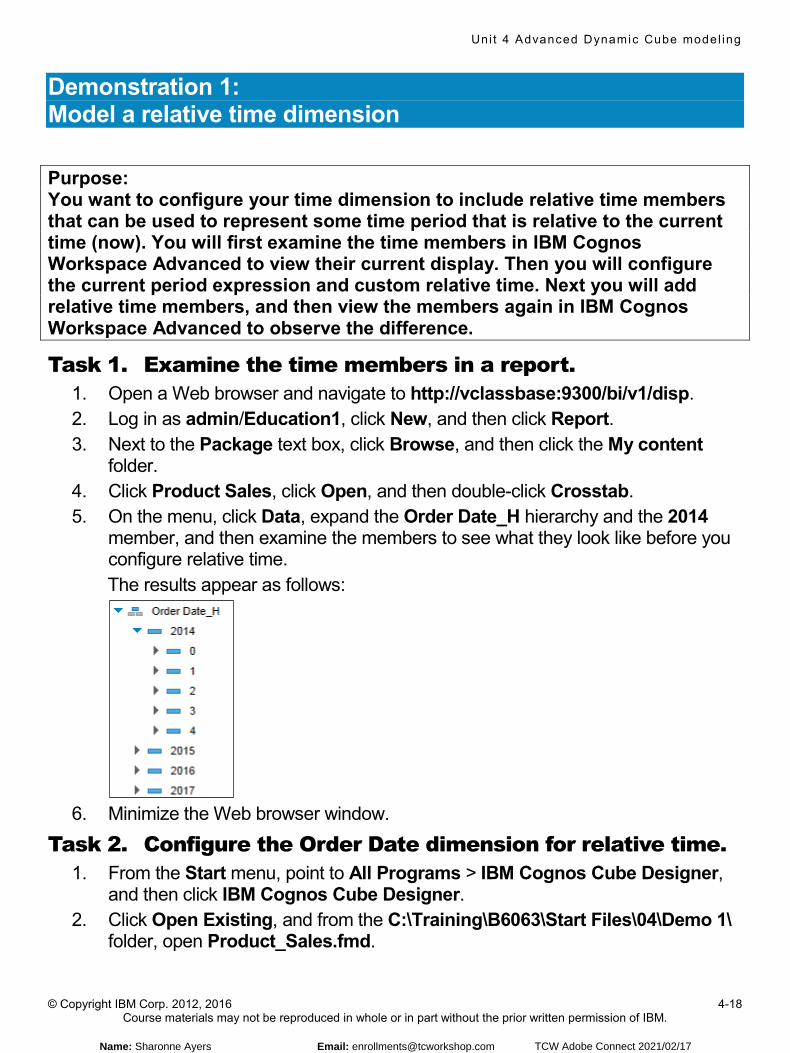
Uni t 4 Advanced Dynamic Cube model ing
© Copyright IBM Corp. 2012, 2016 4-18 Course materials may not be reproduced in whole or in part without the prior written permission of IBM.
Demonstration 1: Model a relative time dimension
Purpose: You want to configure your time dimension to include relative time members that can be used to represent some time period that is relative to the current time (now). You will first examine the time members in IBM Cognos Workspace Advanced to view their current display. Then you will configure the current period expression and custom relative time. Next you will add relative time members, and then view the members again in IBM Cognos Workspace Advanced to observe the difference.
Task 1. Examine the time members in a report. 1. Open a Web browser and navigate to http://vclassbase:9300/bi/v1/disp. 2. Log in as admin/Education1, click New, and then click Report. 3. Next to the Package text box, click Browse, and then click the My content
folder. 4. Click Product Sales, click Open, and then double-click Crosstab. 5. On the menu, click Data, expand the Order Date_H hierarchy and the 2014
member, and then examine the members to see what they look like before you configure relative time. The results appear as follows:
6. Minimize the Web browser window.
Task 2. Configure the Order Date dimension for relative time. 1. From the Start menu, point to All Programs > IBM Cognos Cube Designer,
and then click IBM Cognos Cube Designer. 2. Click Open Existing, and from the C:\Training\B6063\Start Files\04\Demo 1\
folder, open Product_Sales.fmd.
Name: Sharonne Ayers Email: [email protected] TCW Adobe Connect 2021/02/17
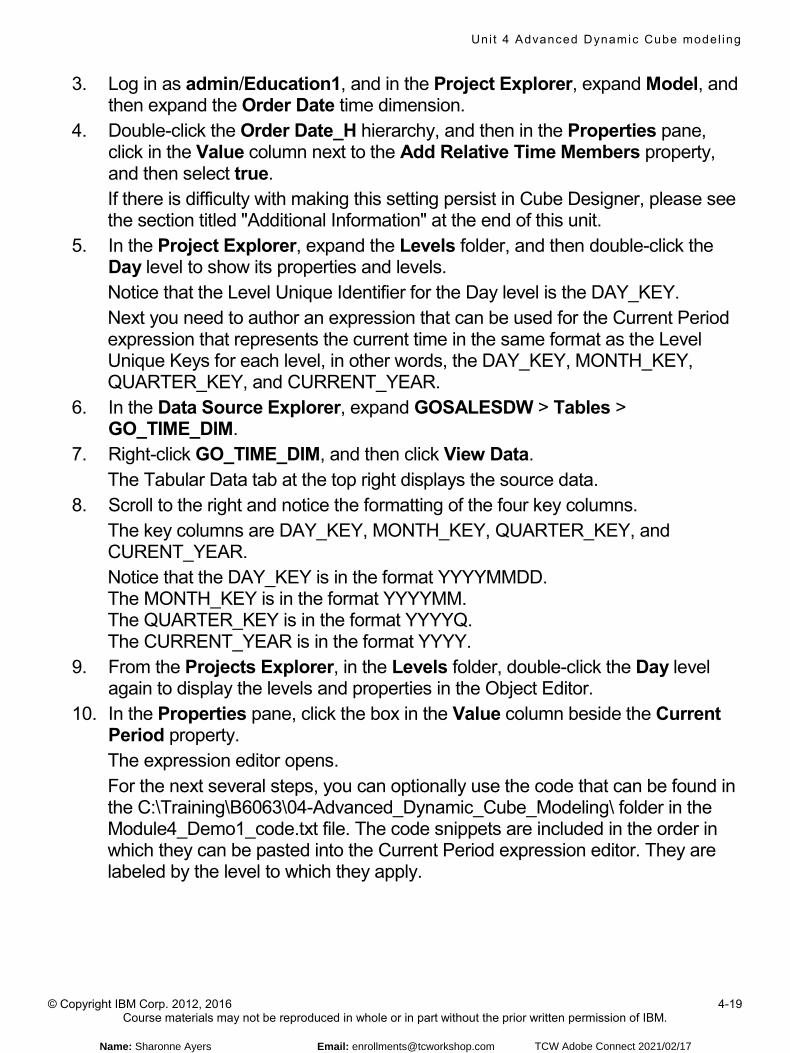
Uni t 4 Advanced Dynamic Cube model ing
© Copyright IBM Corp. 2012, 2016 4-19 Course materials may not be reproduced in whole or in part without the prior written permission of IBM.
3. Log in as admin/Education1, and in the Project Explorer, expand Model, and then expand the Order Date time dimension.
4. Double-click the Order Date_H hierarchy, and then in the Properties pane, click in the Value column next to the Add Relative Time Members property, and then select true. If there is difficulty with making this setting persist in Cube Designer, please see the section titled "Additional Information" at the end of this unit.
5. In the Project Explorer, expand the Levels folder, and then double-click the Day level to show its properties and levels. Notice that the Level Unique Identifier for the Day level is the DAY_KEY. Next you need to author an expression that can be used for the Current Period expression that represents the current time in the same format as the Level Unique Keys for each level, in other words, the DAY_KEY, MONTH_KEY, QUARTER_KEY, and CURRENT_YEAR.
6. In the Data Source Explorer, expand GOSALESDW > Tables > GO_TIME_DIM.
7. Right-click GO_TIME_DIM, and then click View Data. The Tabular Data tab at the top right displays the source data.
8. Scroll to the right and notice the formatting of the four key columns. The key columns are DAY_KEY, MONTH_KEY, QUARTER_KEY, and CURENT_YEAR. Notice that the DAY_KEY is in the format YYYYMMDD. The MONTH_KEY is in the format YYYYMM. The QUARTER_KEY is in the format YYYYQ. The CURRENT_YEAR is in the format YYYY.
9. From the Projects Explorer, in the Levels folder, double-click the Day level again to display the levels and properties in the Object Editor.
10. In the Properties pane, click the box in the Value column beside the Current Period property. The expression editor opens. For the next several steps, you can optionally use the code that can be found in the C:\Training\B6063\04-Advanced_Dynamic_Cube_Modeling\ folder in the Module4_Demo1_code.txt file. The code snippets are included in the order in which they can be pasted into the Current Period expression editor. They are labeled by the level to which they apply.
Name: Sharonne Ayers Email: [email protected] TCW Adobe Connect 2021/02/17
Uni t 4 Advanced Dynamic Cube model ing
© Copyright IBM Corp. 2012, 2016 4-20 Course materials may not be reproduced in whole or in part without the prior written permission of IBM.
11. In the expression editor, type or paste the following expression: cast(
(extract(year, localtimestamp) * 10000) + (extract(month, localtimestamp) * 100) + (extract(day, localtimestamp)), varchar(8))
The results appear as follows:
12. Click Validate to validate the expression, and then on the Validate Result window, click OK.
13. In the Project Explorer, under the Levels folder, double-click the Month level. 14. In the Properties pane, click the box in the Value column next to the Current
Period property. 15. In the expression editor, type or paste the following expression:
cast( (extract(year, localtimestamp) * 100) + (extract(month, localtimestamp)), varchar(6))
16. Click Validate and then click OK. 17. In the Project Explorer, under the Levels folder, double-click the Quarter level. 18. In the Properties pane, click the box in the Value column next to the Current
Period property.
Name: Sharonne Ayers Email: [email protected] TCW Adobe Connect 2021/02/17
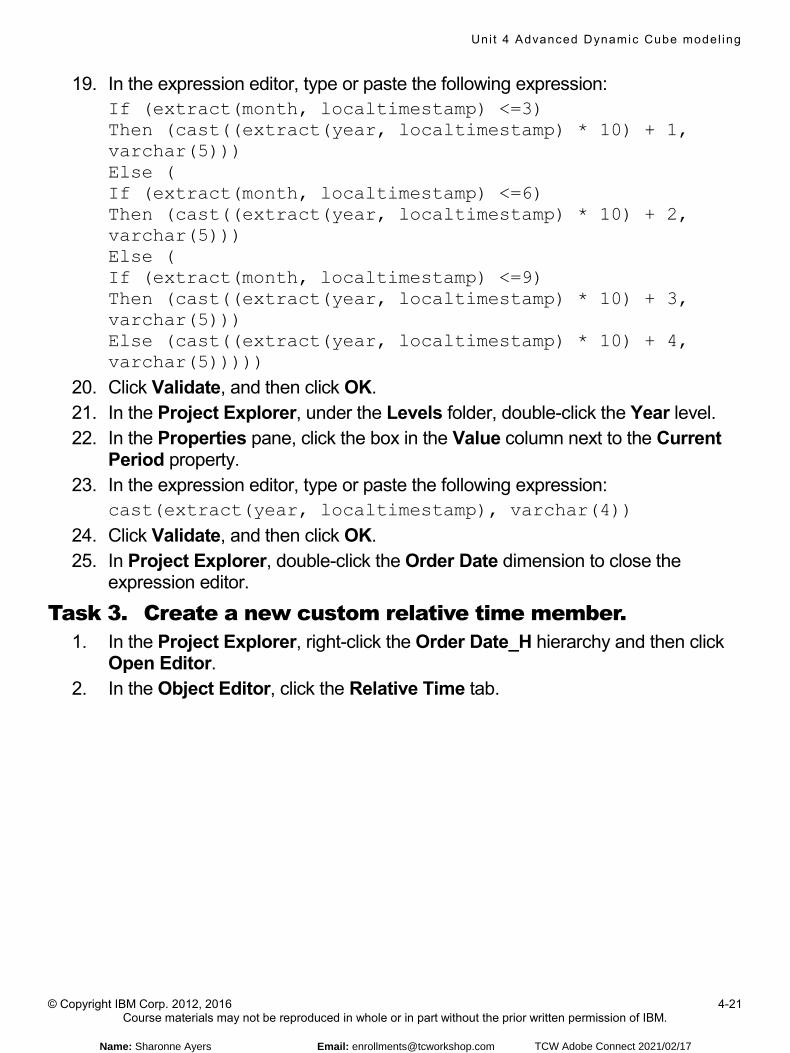
Uni t 4 Advanced Dynamic Cube model ing
© Copyright IBM Corp. 2012, 2016 4-21 Course materials may not be reproduced in whole or in part without the prior written permission of IBM.
19. In the expression editor, type or paste the following expression: If (extract(month, localtimestamp) <=3) Then (cast((extract(year, localtimestamp) * 10) + 1, varchar(5))) Else ( If (extract(month, localtimestamp) <=6) Then (cast((extract(year, localtimestamp) * 10) + 2, varchar(5))) Else ( If (extract(month, localtimestamp) <=9) Then (cast((extract(year, localtimestamp) * 10) + 3, varchar(5))) Else (cast((extract(year, localtimestamp) * 10) + 4, varchar(5)))))
20. Click Validate, and then click OK. 21. In the Project Explorer, under the Levels folder, double-click the Year level. 22. In the Properties pane, click the box in the Value column next to the Current
Period property. 23. In the expression editor, type or paste the following expression:
cast(extract(year, localtimestamp), varchar(4)) 24. Click Validate, and then click OK. 25. In Project Explorer, double-click the Order Date dimension to close the
expression editor.
Task 3. Create a new custom relative time member. 1. In the Project Explorer, right-click the Order Date_H hierarchy and then click
Open Editor. 2. In the Object Editor, click the Relative Time tab.
Name: Sharonne Ayers Email: [email protected] TCW Adobe Connect 2021/02/17
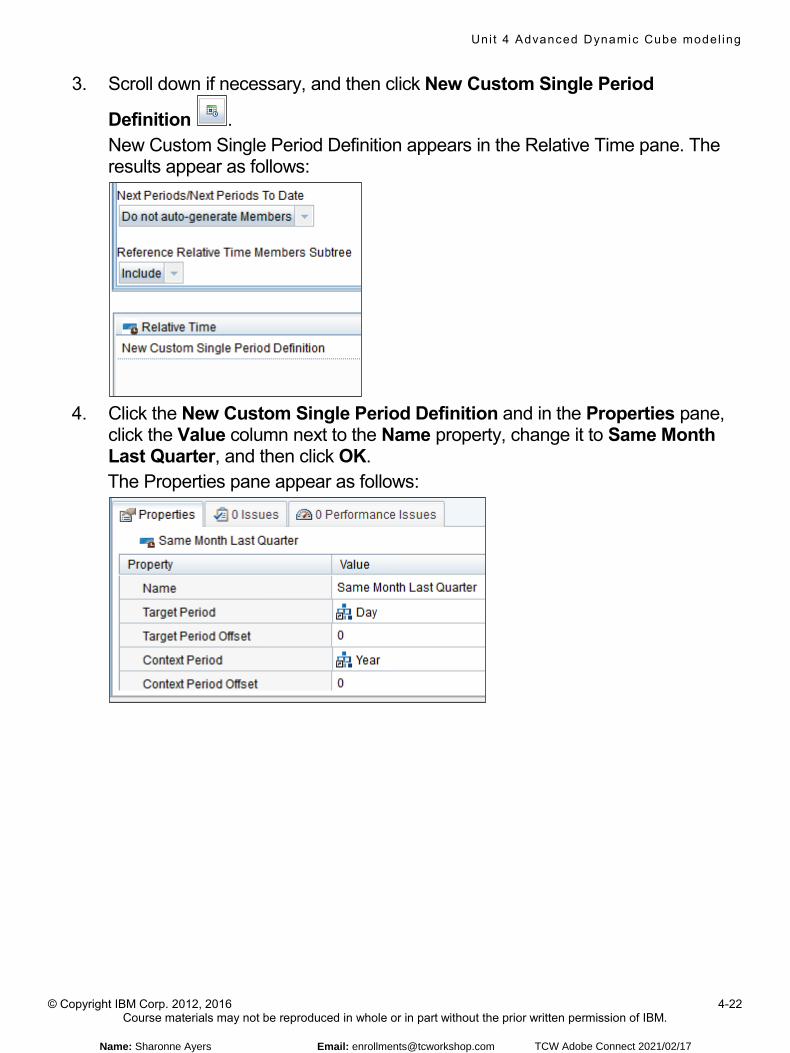
Uni t 4 Advanced Dynamic Cube model ing
© Copyright IBM Corp. 2012, 2016 4-22 Course materials may not be reproduced in whole or in part without the prior written permission of IBM.
3. Scroll down if necessary, and then click New Custom Single Period
Definition . New Custom Single Period Definition appears in the Relative Time pane. The results appear as follows:
4. Click the New Custom Single Period Definition and in the Properties pane,
click the Value column next to the Name property, change it to Same Month Last Quarter, and then click OK. The Properties pane appear as follows:
Name: Sharonne Ayers Email: [email protected] TCW Adobe Connect 2021/02/17
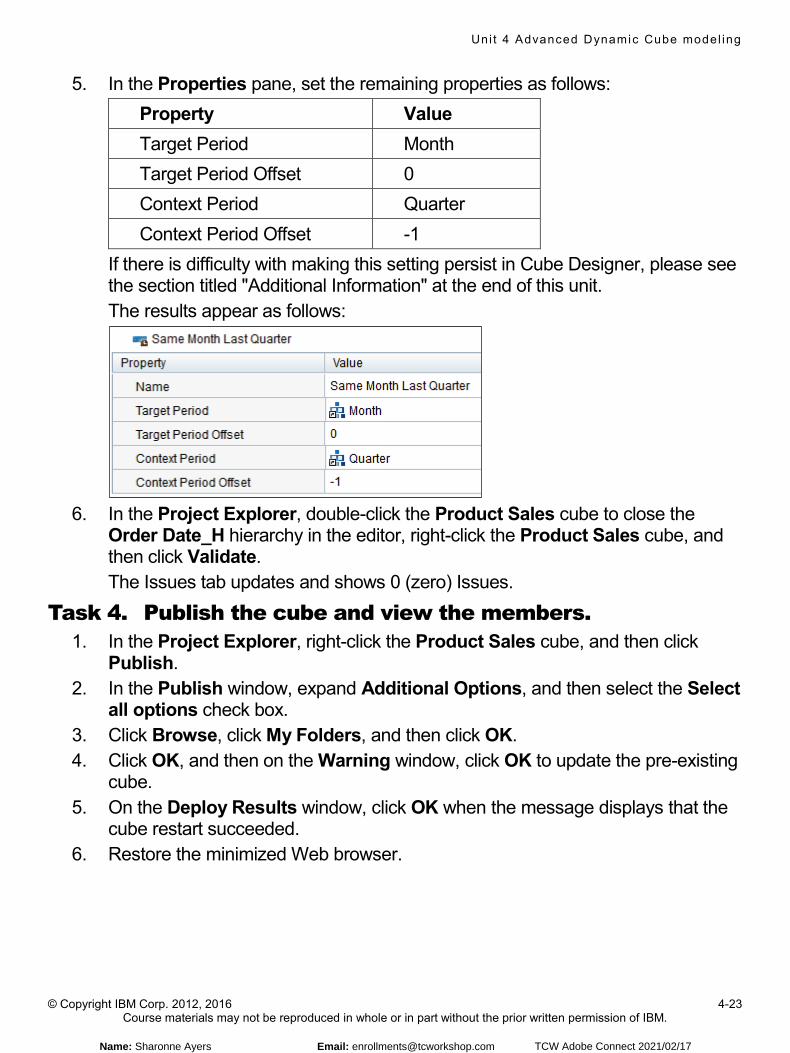
Uni t 4 Advanced Dynamic Cube model ing
© Copyright IBM Corp. 2012, 2016 4-23 Course materials may not be reproduced in whole or in part without the prior written permission of IBM.
5. In the Properties pane, set the remaining properties as follows: Property Value Target Period Month Target Period Offset 0 Context Period Quarter Context Period Offset -1
If there is difficulty with making this setting persist in Cube Designer, please see the section titled "Additional Information" at the end of this unit. The results appear as follows:
6. In the Project Explorer, double-click the Product Sales cube to close the
Order Date_H hierarchy in the editor, right-click the Product Sales cube, and then click Validate. The Issues tab updates and shows 0 (zero) Issues.
Task 4. Publish the cube and view the members. 1. In the Project Explorer, right-click the Product Sales cube, and then click
Publish. 2. In the Publish window, expand Additional Options, and then select the Select
all options check box. 3. Click Browse, click My Folders, and then click OK. 4. Click OK, and then on the Warning window, click OK to update the pre-existing
cube. 5. On the Deploy Results window, click OK when the message displays that the
cube restart succeeded. 6. Restore the minimized Web browser.
Name: Sharonne Ayers Email: [email protected] TCW Adobe Connect 2021/02/17
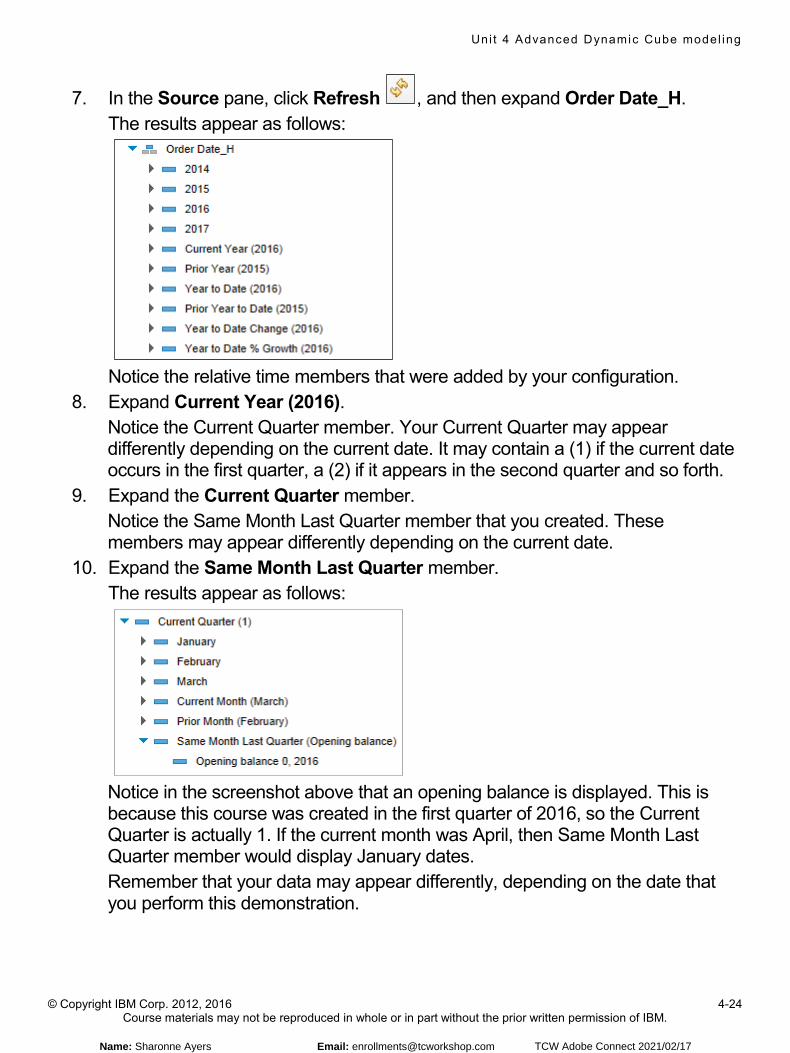
Uni t 4 Advanced Dynamic Cube model ing
© Copyright IBM Corp. 2012, 2016 4-24 Course materials may not be reproduced in whole or in part without the prior written permission of IBM.
7. In the Source pane, click Refresh , and then expand Order Date_H. The results appear as follows:
Notice the relative time members that were added by your configuration.
8. Expand Current Year (2016). Notice the Current Quarter member. Your Current Quarter may appear differently depending on the current date. It may contain a (1) if the current date occurs in the first quarter, a (2) if it appears in the second quarter and so forth.
9. Expand the Current Quarter member. Notice the Same Month Last Quarter member that you created. These members may appear differently depending on the current date.
10. Expand the Same Month Last Quarter member. The results appear as follows:
Notice in the screenshot above that an opening balance is displayed. This is because this course was created in the first quarter of 2016, so the Current Quarter is actually 1. If the current month was April, then Same Month Last Quarter member would display January dates. Remember that your data may appear differently, depending on the date that you perform this demonstration.
Name: Sharonne Ayers Email: [email protected] TCW Adobe Connect 2021/02/17
Uni t 4 Advanced Dynamic Cube model ing
© Copyright IBM Corp. 2012, 2016 4-25 Course materials may not be reproduced in whole or in part without the prior written permission of IBM.
11. Close the Web browser without saving, and leave IBM Cognos Cube Designer open for the next demonstration.
Results: You configured a time dimension that can be used to represent relative time.
Name: Sharonne Ayers Email: [email protected] TCW Adobe Connect 2021/02/17
Uni t 4 Advanced Dynamic Cube model ing
© Copyright IBM Corp. 2012, 2016 4-26 Course materials may not be reproduced in whole or in part without the prior written permission of IBM.
© Copyright IBM Corporation 2016Advanced Dynamic Cube modeling
Demonstration 2
Define a calculated measure/member
Demonstration 2: Define a calculated measure/member
Name: Sharonne Ayers Email: [email protected] TCW Adobe Connect 2021/02/17
Uni t 4 Advanced Dynamic Cube model ing
© Copyright IBM Corp. 2012, 2016 4-27 Course materials may not be reproduced in whole or in part without the prior written permission of IBM.
Demonstration 2: Define a calculated measure/member Purpose: You want to add a new measure to your Product Sales cube that calculates the sales for the previous period. You will validate that calculated measure in a report that compares it to the actual sales from a previous year.
Task 1. Add the calculated member to the cube. 1. In the Project Explorer, expand the Product Sales cube if necessary, and
then double-click the Measures folder to open it in the Object Editor. 2. In the Object Editor, click the Calculated Measures tab, and then click New
Calculated Measure . 3. Click New Calculated Measure, and then in the Properties pane, set the
Name property to Previous Period Sales. 4. In the Properties pane, click the box in the Value column next to the
Expression property.
5. At the bottom of the Project Explorer, click the Functions tab . Functions, syntax, OLAP functionality, and MDX expressions are outside the scope of this course. The functions used in this demonstration are typical MDX functions that should be familiar to anyone who has experience creating cube models. In Function Explorer, if you highlight a function, IBM Cognos Cube Designer displays a brief description of the function syntax, its arguments, and what value it returns.
6. In the Function Explorer, expand Dimensional Functions, and then expand R-Z.
7. Drag the tuple function to the expression editor, and press the Backspace key to remove the closing parenthesis. The Function Explorer is a helpful tool for creating expressions, but for the sake of time, you will type the remaining pieces of the expression.
8. At the end of the expression, type parallelPeriod(level(currentMember(.
9. At the bottom of the Function Explorer, click Package . 10. Drag the Order Date_H hierarchy to the expression editor. 11. At the end of the expression, type )),1),.
Name: Sharonne Ayers Email: [email protected] TCW Adobe Connect 2021/02/17
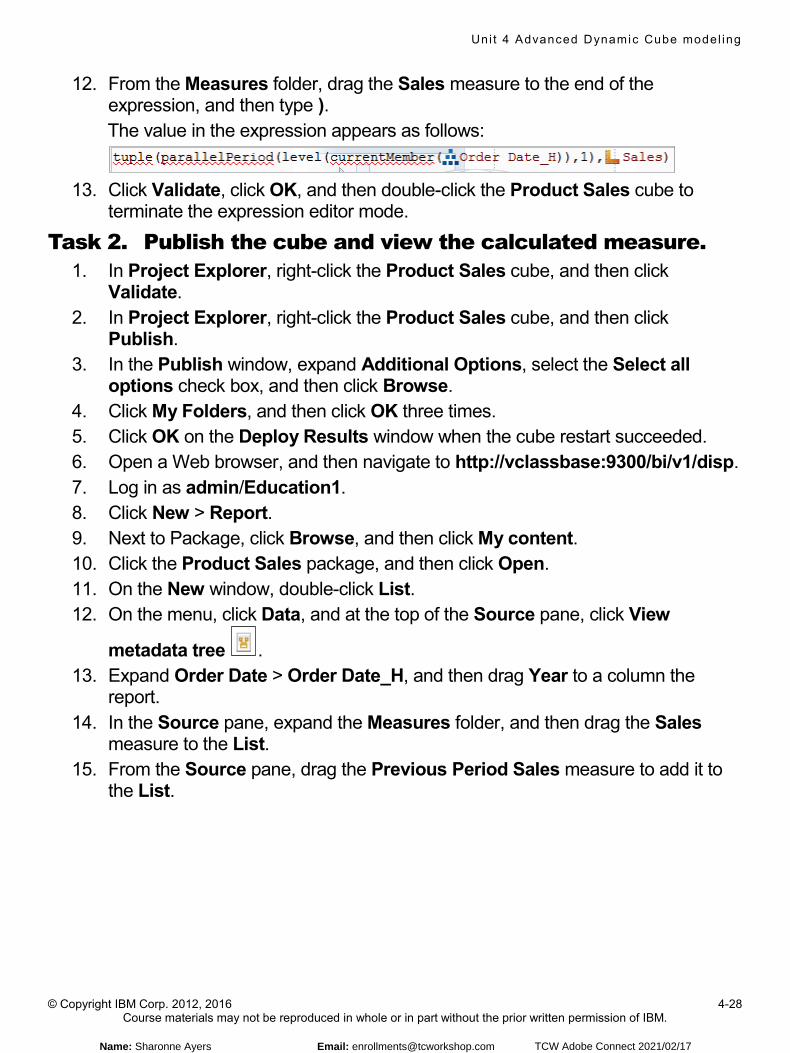
Uni t 4 Advanced Dynamic Cube model ing
© Copyright IBM Corp. 2012, 2016 4-28 Course materials may not be reproduced in whole or in part without the prior written permission of IBM.
12. From the Measures folder, drag the Sales measure to the end of the expression, and then type ). The value in the expression appears as follows:
13. Click Validate, click OK, and then double-click the Product Sales cube to
terminate the expression editor mode.
Task 2. Publish the cube and view the calculated measure. 1. In Project Explorer, right-click the Product Sales cube, and then click
Validate. 2. In Project Explorer, right-click the Product Sales cube, and then click
Publish. 3. In the Publish window, expand Additional Options, select the Select all
options check box, and then click Browse. 4. Click My Folders, and then click OK three times. 5. Click OK on the Deploy Results window when the cube restart succeeded. 6. Open a Web browser, and then navigate to http://vclassbase:9300/bi/v1/disp. 7. Log in as admin/Education1. 8. Click New > Report. 9. Next to Package, click Browse, and then click My content. 10. Click the Product Sales package, and then click Open. 11. On the New window, double-click List. 12. On the menu, click Data, and at the top of the Source pane, click View
metadata tree . 13. Expand Order Date > Order Date_H, and then drag Year to a column the
report. 14. In the Source pane, expand the Measures folder, and then drag the Sales
measure to the List. 15. From the Source pane, drag the Previous Period Sales measure to add it to
the List.
Name: Sharonne Ayers Email: [email protected] TCW Adobe Connect 2021/02/17

Uni t 4 Advanced Dynamic Cube model ing
© Copyright IBM Corp. 2012, 2016 4-29 Course materials may not be reproduced in whole or in part without the prior written permission of IBM.
16. Click Run options > Run HTML. The results appear as follows:
Notice that the Previous Period Sales for any particular year are in agreement with the Sales for the previous year.
17. Close the Web browser without saving, and leave Cube Designer open for the next demonstration.
Results: You created a calculated measure in the Product Sales cube and then validated it by using it in a report that compared current year measures with previous year measures.
Name: Sharonne Ayers Email: [email protected] TCW Adobe Connect 2021/02/17
Uni t 4 Advanced Dynamic Cube model ing
© Copyright IBM Corp. 2012, 2016 4-32 Course materials may not be reproduced in whole or in part without the prior written permission of IBM.
© Copyright IBM Corporation 2016Advanced Dynamic Cube modeling
Demonstration 3
Create and use Named Sets
Demonstration 3: Create and use Named Sets
Name: Sharonne Ayers Email: [email protected] TCW Adobe Connect 2021/02/17
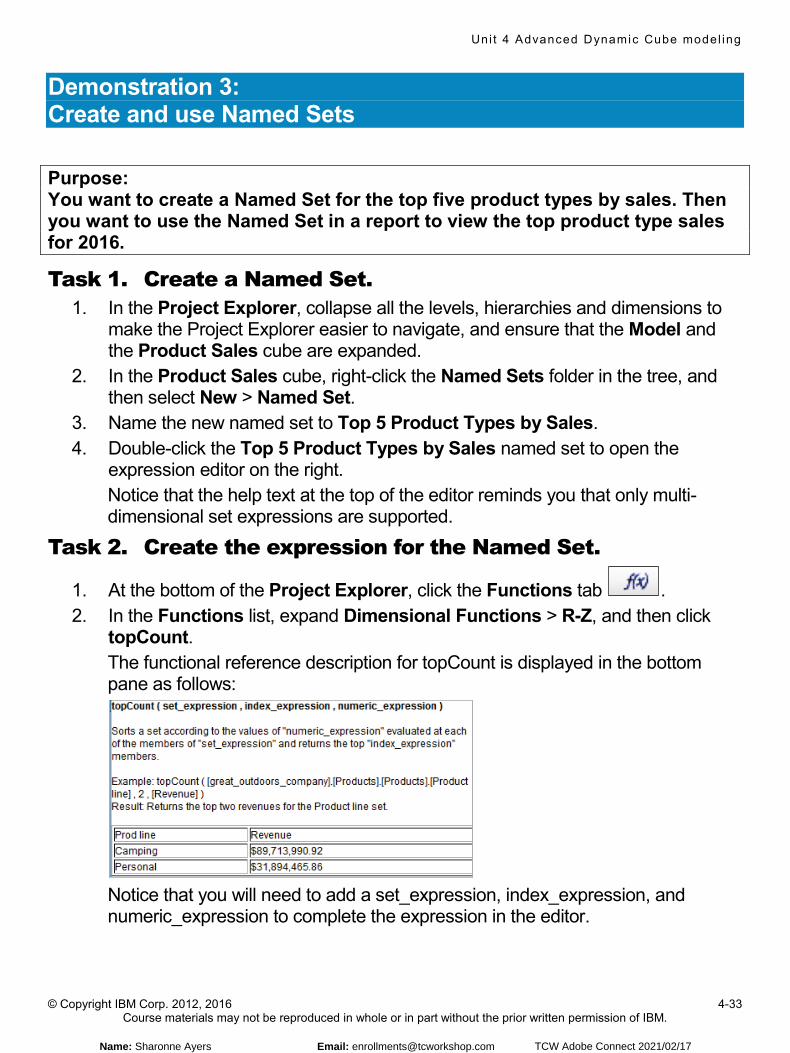
Uni t 4 Advanced Dynamic Cube model ing
© Copyright IBM Corp. 2012, 2016 4-33 Course materials may not be reproduced in whole or in part without the prior written permission of IBM.
Demonstration 3: Create and use Named Sets
Purpose: You want to create a Named Set for the top five product types by sales. Then you want to use the Named Set in a report to view the top product type sales for 2016.
Task 1. Create a Named Set. 1. In the Project Explorer, collapse all the levels, hierarchies and dimensions to
make the Project Explorer easier to navigate, and ensure that the Model and the Product Sales cube are expanded.
2. In the Product Sales cube, right-click the Named Sets folder in the tree, and then select New > Named Set.
3. Name the new named set to Top 5 Product Types by Sales. 4. Double-click the Top 5 Product Types by Sales named set to open the
expression editor on the right. Notice that the help text at the top of the editor reminds you that only multi-dimensional set expressions are supported.
Task 2. Create the expression for the Named Set.
1. At the bottom of the Project Explorer, click the Functions tab . 2. In the Functions list, expand Dimensional Functions > R-Z, and then click
topCount. The functional reference description for topCount is displayed in the bottom pane as follows:
Notice that you will need to add a set_expression, index_expression, and numeric_expression to complete the expression in the editor.
Name: Sharonne Ayers Email: [email protected] TCW Adobe Connect 2021/02/17
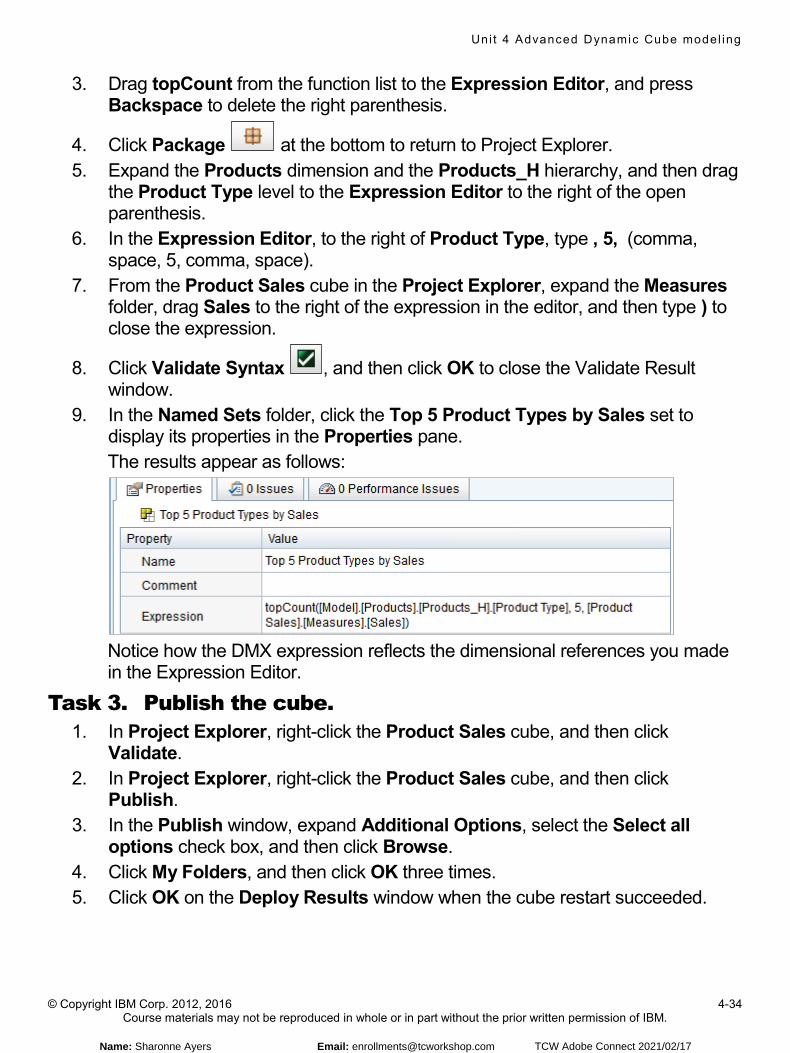
Uni t 4 Advanced Dynamic Cube model ing
© Copyright IBM Corp. 2012, 2016 4-34 Course materials may not be reproduced in whole or in part without the prior written permission of IBM.
3. Drag topCount from the function list to the Expression Editor, and press Backspace to delete the right parenthesis.
4. Click Package at the bottom to return to Project Explorer. 5. Expand the Products dimension and the Products_H hierarchy, and then drag
the Product Type level to the Expression Editor to the right of the open parenthesis.
6. In the Expression Editor, to the right of Product Type, type , 5, (comma, space, 5, comma, space).
7. From the Product Sales cube in the Project Explorer, expand the Measures folder, drag Sales to the right of the expression in the editor, and then type ) to close the expression.
8. Click Validate Syntax , and then click OK to close the Validate Result window.
9. In the Named Sets folder, click the Top 5 Product Types by Sales set to display its properties in the Properties pane. The results appear as follows:
Notice how the DMX expression reflects the dimensional references you made in the Expression Editor.
Task 3. Publish the cube. 1. In Project Explorer, right-click the Product Sales cube, and then click
Validate. 2. In Project Explorer, right-click the Product Sales cube, and then click
Publish. 3. In the Publish window, expand Additional Options, select the Select all
options check box, and then click Browse. 4. Click My Folders, and then click OK three times. 5. Click OK on the Deploy Results window when the cube restart succeeded.
Name: Sharonne Ayers Email: [email protected] TCW Adobe Connect 2021/02/17
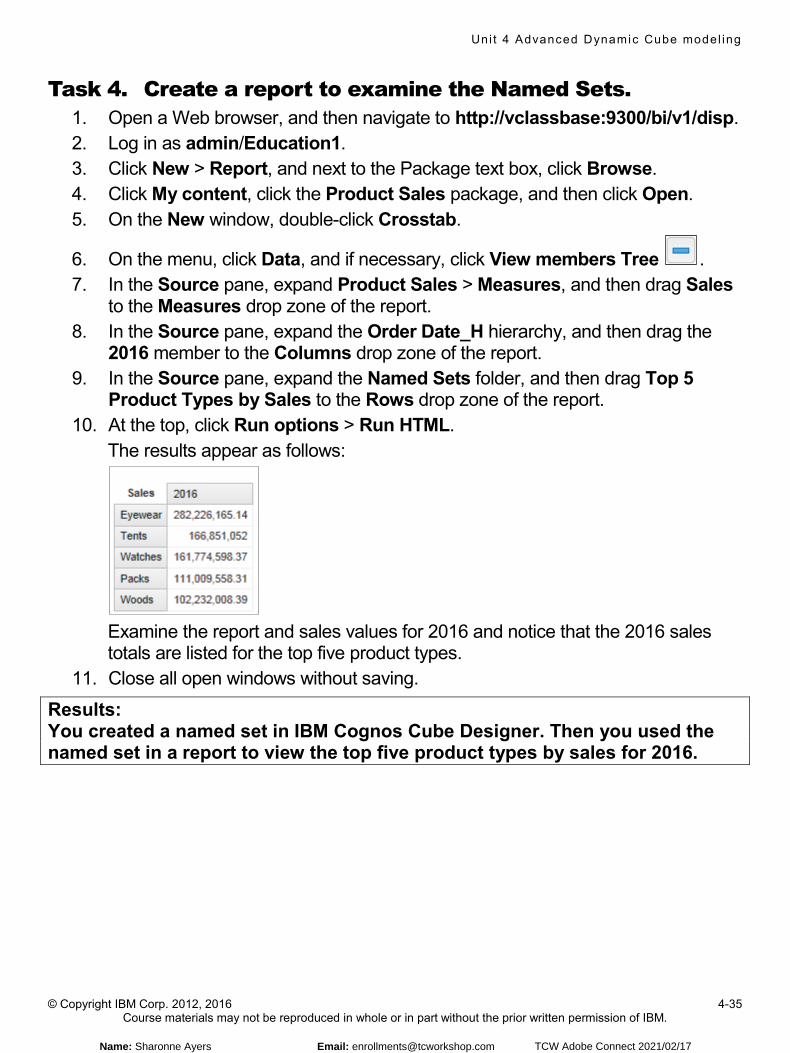
Uni t 4 Advanced Dynamic Cube model ing
© Copyright IBM Corp. 2012, 2016 4-35 Course materials may not be reproduced in whole or in part without the prior written permission of IBM.
Task 4. Create a report to examine the Named Sets. 1. Open a Web browser, and then navigate to http://vclassbase:9300/bi/v1/disp. 2. Log in as admin/Education1. 3. Click New > Report, and next to the Package text box, click Browse. 4. Click My content, click the Product Sales package, and then click Open. 5. On the New window, double-click Crosstab.
6. On the menu, click Data, and if necessary, click View members Tree . 7. In the Source pane, expand Product Sales > Measures, and then drag Sales
to the Measures drop zone of the report. 8. In the Source pane, expand the Order Date_H hierarchy, and then drag the
2016 member to the Columns drop zone of the report. 9. In the Source pane, expand the Named Sets folder, and then drag Top 5
Product Types by Sales to the Rows drop zone of the report. 10. At the top, click Run options > Run HTML.
The results appear as follows:
Examine the report and sales values for 2016 and notice that the 2016 sales totals are listed for the top five product types.
11. Close all open windows without saving.
Results: You created a named set in IBM Cognos Cube Designer. Then you used the named set in a report to view the top five product types by sales for 2016.
Name: Sharonne Ayers Email: [email protected] TCW Adobe Connect 2021/02/17
Uni t 4 Advanced Dynamic Cube model ing
© Copyright IBM Corp. 2012, 2016 4-38 Course materials may not be reproduced in whole or in part without the prior written permission of IBM.
ADDITIONAL INFORMATION: Remember that in a real-life dynamic cubes environment, Dynamic Cubes is installed across several physical servers. Many different Cognos components are communicating with each other during the design, configure, publish, and reporting processes around dynamic cubes. To facilitate the delivery of this course, a multi-server configuration is emulated using a single virtual machine in the course image. It is possible that the messages sent to and from the different components may not be properly received at times. If you experience issues in the user interface where Cube Designer does not record your settings, you should attempt to make the setting and then save the Cube Designer project in its current location. Close the Cube Designer tool, and then re-open the saved project to continue working through the demonstration.
Name: Sharonne Ayers Email: [email protected] TCW Adobe Connect 2021/02/17

Advanced features of Cube Designer
© Copyright IBM Corporation 2016Course materials may not be reproduced in whole or in part without the written permission of IBM.
Advanced features of Cube Designer
IBM Cognos Dynamic Cubes
Name: Sharonne Ayers Email: [email protected] TCW Adobe Connect 2021/02/17

Uni t 5 Advanced features of Cube Des igner
© Copyright IBM Corp. 2012, 2016 5-2 Course materials may not be reproduced in whole or in part without the prior written permission of IBM.
Name: Sharonne Ayers Email: [email protected] TCW Adobe Connect 2021/02/17
Uni t 5 Advanced features of Cube Des igner
© Copyright IBM Corp. 2012, 2016 5-8 Course materials may not be reproduced in whole or in part without the prior written permission of IBM.
© Copyright IBM Corporation 2016Advanced features of Cube Designer
Demonstration 1
Add support for multiple locales
Demonstration 1: Add support for multiple locales
Name: Sharonne Ayers Email: [email protected] TCW Adobe Connect 2021/02/17
Uni t 5 Advanced features of Cube Des igner
© Copyright IBM Corp. 2012, 2016 5-9 Course materials may not be reproduced in whole or in part without the prior written permission of IBM.
Demonstration 1: Add support for multiple locales
Purpose: In most business scenarios, multilingual support would be added to the dimensions for an entire project. For the purposes of this demonstration, you will add multilingual support for only one dimension, Order Method. Once you understand how it is done, you will be able to add it to an entire project if you wish.
Task 1. Select the locales to use in your project. 1. From the Start menu, point to All Programs > IBM Cognos Cube Designer,
and then click IBM Cognos Cube Designer. 2. Click Open Existing, and then from the
C:\Training\B6063\Start Files\05\Demo 1\ folder, open Product_Sales.fmd. 3. Log in as admin/Education1 and in the Project Explorer, expand Model, and
then expand the Order Method dimension. 4. In the Project Explorer, click Project to display its properties in the Properties
pane. Notice that the Design Language is set to English by default.
5. In the Properties pane, beside the Supported Locales property, click Add Locale(s).
6. In the Add Locale(s) window, select the French check box, and then click OK.
Task 2. Add multiple locale names to the metadata objects. 1. In the Project Explorer, click the Order Method dimension. 2. In the Properties pane, under the Value column, click the box beside the Name
property. 3. Click the box beside French, type Methode de Commande, and then click OK. 4. In the Properties pane, set the Multilingual Support property to By Column.
Task 3. Add support for attributes. 1. In the Project Explorer, under the Order Method dimension, double-click the
Order Method_H hierarchy. 2. In the Object Editor on the right, double-click the Order Method level. 3. In the Object Editor, click the Order Method attribute.
In the Properties pane, notice that the Column Name is set to ORDER_METHOD_EN and the Multilingual property is set to false.
Name: Sharonne Ayers Email: [email protected] TCW Adobe Connect 2021/02/17
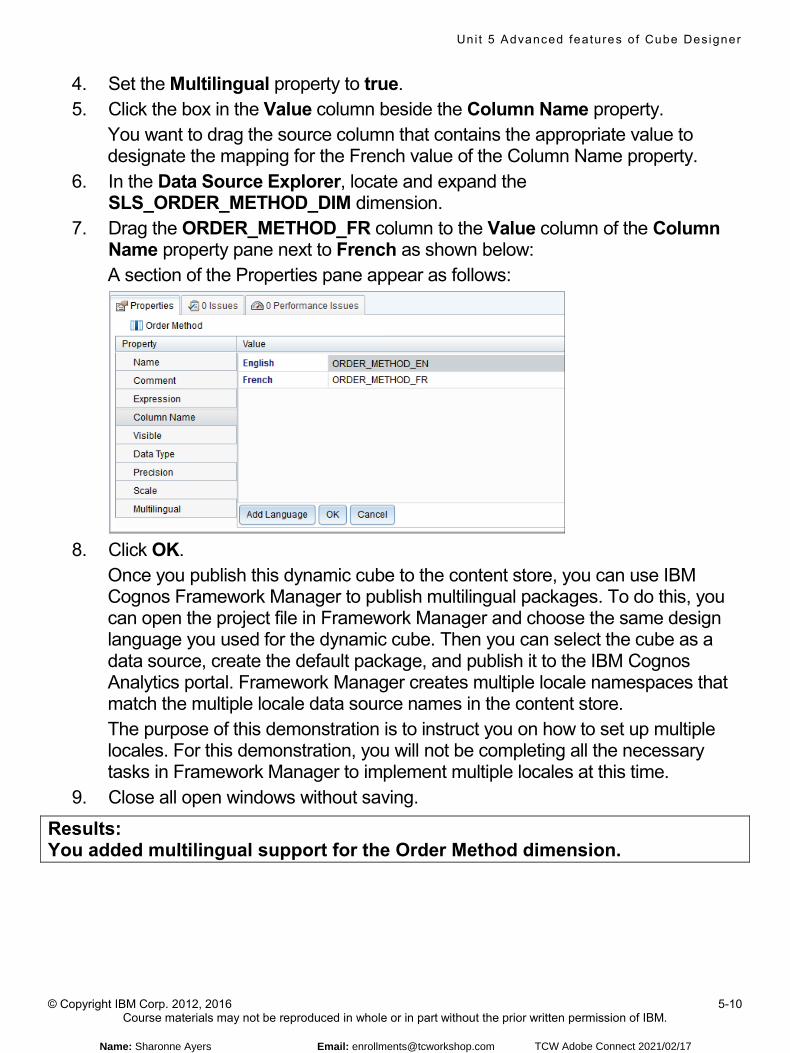
Uni t 5 Advanced features of Cube Des igner
© Copyright IBM Corp. 2012, 2016 5-10 Course materials may not be reproduced in whole or in part without the prior written permission of IBM.
4. Set the Multilingual property to true. 5. Click the box in the Value column beside the Column Name property.
You want to drag the source column that contains the appropriate value to designate the mapping for the French value of the Column Name property.
6. In the Data Source Explorer, locate and expand the SLS_ORDER_METHOD_DIM dimension.
7. Drag the ORDER_METHOD_FR column to the Value column of the Column Name property pane next to French as shown below: A section of the Properties pane appear as follows:
8. Click OK.
Once you publish this dynamic cube to the content store, you can use IBM Cognos Framework Manager to publish multilingual packages. To do this, you can open the project file in Framework Manager and choose the same design language you used for the dynamic cube. Then you can select the cube as a data source, create the default package, and publish it to the IBM Cognos Analytics portal. Framework Manager creates multiple locale namespaces that match the multiple locale data source names in the content store. The purpose of this demonstration is to instruct you on how to set up multiple locales. For this demonstration, you will not be completing all the necessary tasks in Framework Manager to implement multiple locales at this time.
9. Close all open windows without saving.
Results: You added multilingual support for the Order Method dimension.
Name: Sharonne Ayers Email: [email protected] TCW Adobe Connect 2021/02/17

Uni t 5 Advanced features of Cube Des igner
© Copyright IBM Corp. 2012, 2016 5-17 Course materials may not be reproduced in whole or in part without the prior written permission of IBM.
© Copyright IBM Corporation 2016Advanced features of Cube Designer
Demonstration 2
Import Framework Manager packages into Cube Designer
Demonstration 2: Import Framework Manager packages into Cube Designer
Name: Sharonne Ayers Email: [email protected] TCW Adobe Connect 2021/02/17
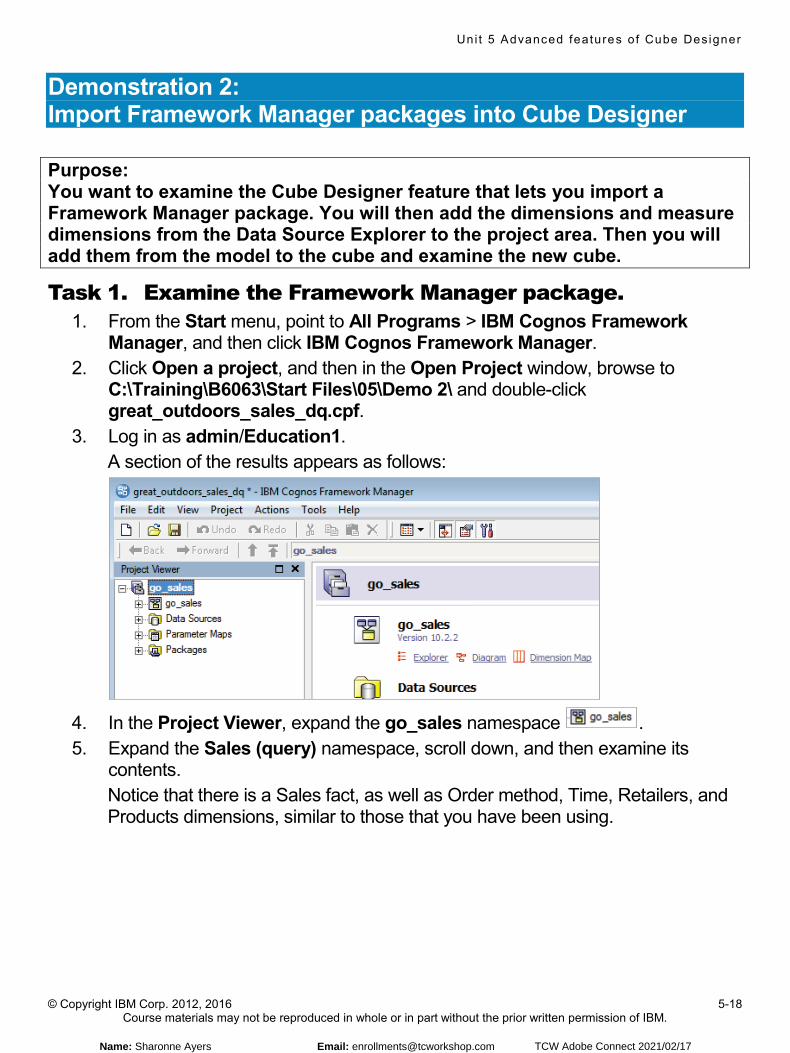
Uni t 5 Advanced features of Cube Des igner
© Copyright IBM Corp. 2012, 2016 5-18 Course materials may not be reproduced in whole or in part without the prior written permission of IBM.
Demonstration 2: Import Framework Manager packages into Cube Designer Purpose: You want to examine the Cube Designer feature that lets you import a Framework Manager package. You will then add the dimensions and measure dimensions from the Data Source Explorer to the project area. Then you will add them from the model to the cube and examine the new cube.
Task 1. Examine the Framework Manager package. 1. From the Start menu, point to All Programs > IBM Cognos Framework
Manager, and then click IBM Cognos Framework Manager. 2. Click Open a project, and then in the Open Project window, browse to
C:\Training\B6063\Start Files\05\Demo 2\ and double-click great_outdoors_sales_dq.cpf.
3. Log in as admin/Education1. A section of the results appears as follows:
4. In the Project Viewer, expand the go_sales namespace . 5. Expand the Sales (query) namespace, scroll down, and then examine its
contents. Notice that there is a Sales fact, as well as Order method, Time, Retailers, and Products dimensions, similar to those that you have been using.
Name: Sharonne Ayers Email: [email protected] TCW Adobe Connect 2021/02/17
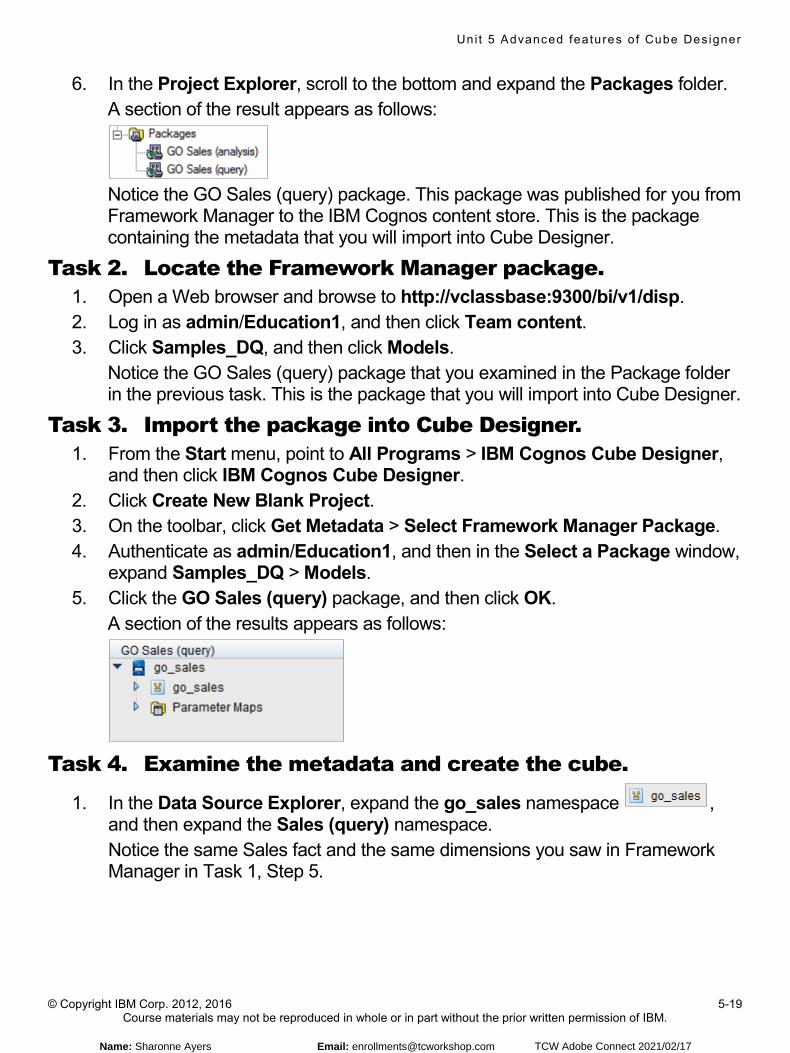
Uni t 5 Advanced features of Cube Des igner
© Copyright IBM Corp. 2012, 2016 5-19 Course materials may not be reproduced in whole or in part without the prior written permission of IBM.
6. In the Project Explorer, scroll to the bottom and expand the Packages folder. A section of the result appears as follows:
Notice the GO Sales (query) package. This package was published for you from Framework Manager to the IBM Cognos content store. This is the package containing the metadata that you will import into Cube Designer.
Task 2. Locate the Framework Manager package. 1. Open a Web browser and browse to http://vclassbase:9300/bi/v1/disp. 2. Log in as admin/Education1, and then click Team content. 3. Click Samples_DQ, and then click Models.
Notice the GO Sales (query) package that you examined in the Package folder in the previous task. This is the package that you will import into Cube Designer.
Task 3. Import the package into Cube Designer. 1. From the Start menu, point to All Programs > IBM Cognos Cube Designer,
and then click IBM Cognos Cube Designer. 2. Click Create New Blank Project. 3. On the toolbar, click Get Metadata > Select Framework Manager Package. 4. Authenticate as admin/Education1, and then in the Select a Package window,
expand Samples_DQ > Models. 5. Click the GO Sales (query) package, and then click OK.
A section of the results appears as follows:
Task 4. Examine the metadata and create the cube.
1. In the Data Source Explorer, expand the go_sales namespace , and then expand the Sales (query) namespace. Notice the same Sales fact and the same dimensions you saw in Framework Manager in Task 1, Step 5.
Name: Sharonne Ayers Email: [email protected] TCW Adobe Connect 2021/02/17
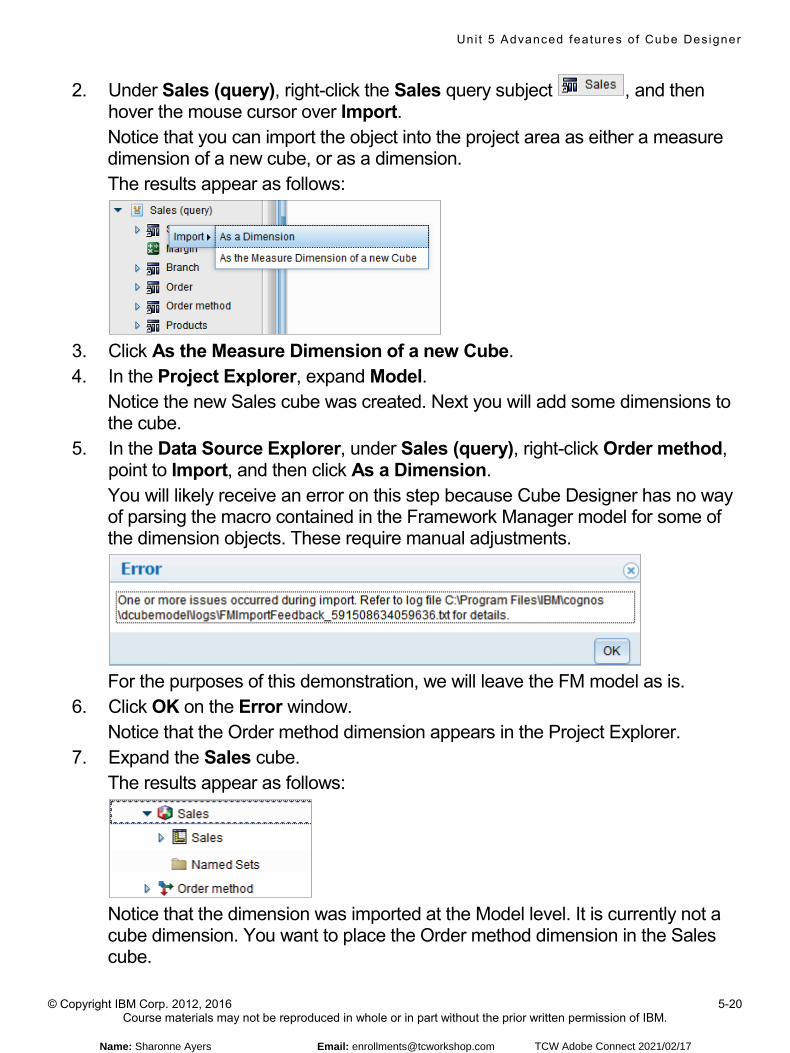
Uni t 5 Advanced features of Cube Des igner
© Copyright IBM Corp. 2012, 2016 5-20 Course materials may not be reproduced in whole or in part without the prior written permission of IBM.
2. Under Sales (query), right-click the Sales query subject , and then hover the mouse cursor over Import. Notice that you can import the object into the project area as either a measure dimension of a new cube, or as a dimension. The results appear as follows:
3. Click As the Measure Dimension of a new Cube. 4. In the Project Explorer, expand Model.
Notice the new Sales cube was created. Next you will add some dimensions to the cube.
5. In the Data Source Explorer, under Sales (query), right-click Order method, point to Import, and then click As a Dimension. You will likely receive an error on this step because Cube Designer has no way of parsing the macro contained in the Framework Manager model for some of the dimension objects. These require manual adjustments.
For the purposes of this demonstration, we will leave the FM model as is.
6. Click OK on the Error window. Notice that the Order method dimension appears in the Project Explorer.
7. Expand the Sales cube. The results appear as follows:
Notice that the dimension was imported at the Model level. It is currently not a cube dimension. You want to place the Order method dimension in the Sales cube.
Name: Sharonne Ayers Email: [email protected] TCW Adobe Connect 2021/02/17
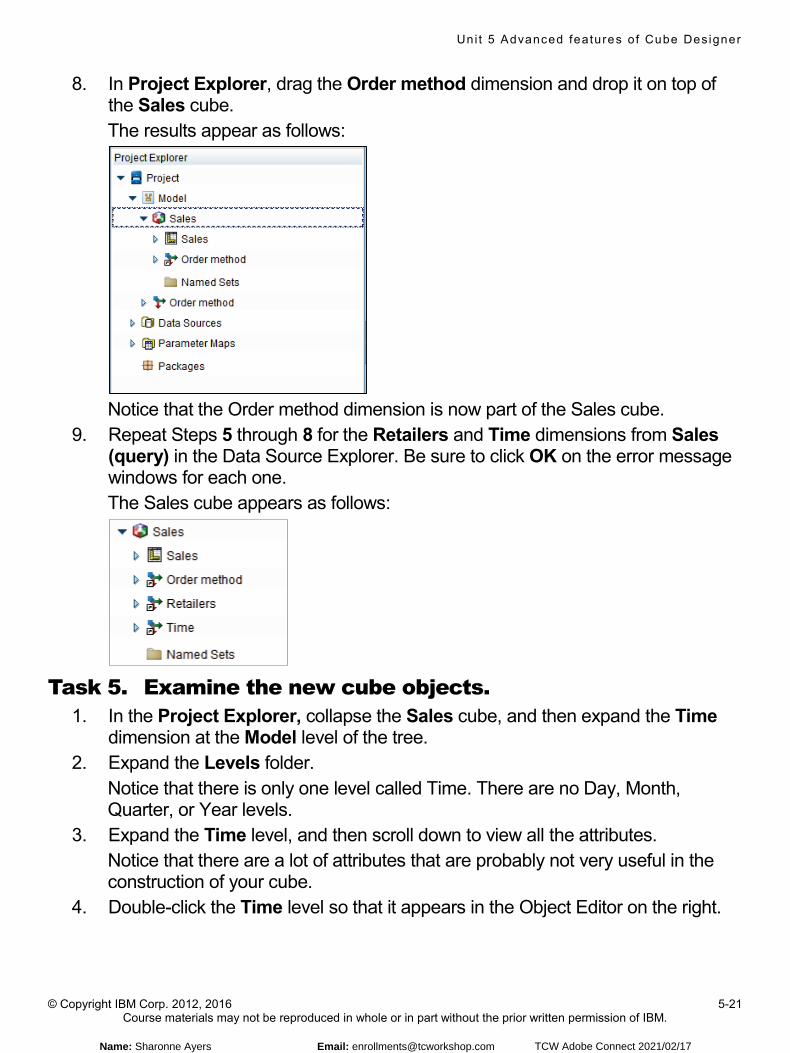
Uni t 5 Advanced features of Cube Des igner
© Copyright IBM Corp. 2012, 2016 5-21 Course materials may not be reproduced in whole or in part without the prior written permission of IBM.
8. In Project Explorer, drag the Order method dimension and drop it on top of the Sales cube. The results appear as follows:
Notice that the Order method dimension is now part of the Sales cube.
9. Repeat Steps 5 through 8 for the Retailers and Time dimensions from Sales (query) in the Data Source Explorer. Be sure to click OK on the error message windows for each one. The Sales cube appears as follows:
Task 5. Examine the new cube objects.
1. In the Project Explorer, collapse the Sales cube, and then expand the Time dimension at the Model level of the tree.
2. Expand the Levels folder. Notice that there is only one level called Time. There are no Day, Month, Quarter, or Year levels.
3. Expand the Time level, and then scroll down to view all the attributes. Notice that there are a lot of attributes that are probably not very useful in the construction of your cube.
4. Double-click the Time level so that it appears in the Object Editor on the right.
Name: Sharonne Ayers Email: [email protected] TCW Adobe Connect 2021/02/17
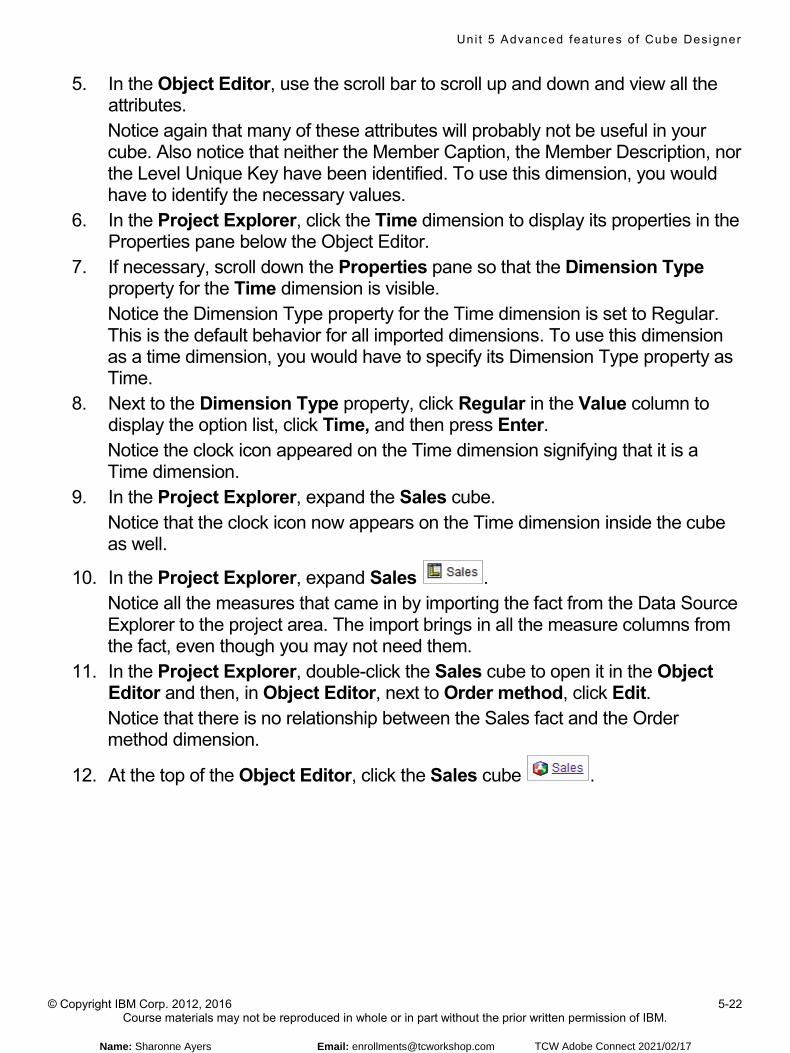
Uni t 5 Advanced features of Cube Des igner
© Copyright IBM Corp. 2012, 2016 5-22 Course materials may not be reproduced in whole or in part without the prior written permission of IBM.
5. In the Object Editor, use the scroll bar to scroll up and down and view all the attributes. Notice again that many of these attributes will probably not be useful in your cube. Also notice that neither the Member Caption, the Member Description, nor the Level Unique Key have been identified. To use this dimension, you would have to identify the necessary values.
6. In the Project Explorer, click the Time dimension to display its properties in the Properties pane below the Object Editor.
7. If necessary, scroll down the Properties pane so that the Dimension Type property for the Time dimension is visible. Notice the Dimension Type property for the Time dimension is set to Regular. This is the default behavior for all imported dimensions. To use this dimension as a time dimension, you would have to specify its Dimension Type property as Time.
8. Next to the Dimension Type property, click Regular in the Value column to display the option list, click Time, and then press Enter. Notice the clock icon appeared on the Time dimension signifying that it is a Time dimension.
9. In the Project Explorer, expand the Sales cube. Notice that the clock icon now appears on the Time dimension inside the cube as well.
10. In the Project Explorer, expand Sales . Notice all the measures that came in by importing the fact from the Data Source Explorer to the project area. The import brings in all the measure columns from the fact, even though you may not need them.
11. In the Project Explorer, double-click the Sales cube to open it in the Object Editor and then, in Object Editor, next to Order method, click Edit. Notice that there is no relationship between the Sales fact and the Order method dimension.
12. At the top of the Object Editor, click the Sales cube .
Name: Sharonne Ayers Email: [email protected] TCW Adobe Connect 2021/02/17
Uni t 5 Advanced features of Cube Des igner
© Copyright IBM Corp. 2012, 2016 5-23 Course materials may not be reproduced in whole or in part without the prior written permission of IBM.
13. Repeat Steps 11 and 12 to examine the relationships between the Sales fact and the Retailers and Time dimensions. You will notice that no relationships have been set. In conclusion, although the ability to import a Framework Manager package into Cube Designer can reduce modeling time, it will most likely not create a cube that is ready for production. An example is the inability of Cube Designer to handle the FM macros. However, FM imports are a useful way to create a cube model that is good starting point. Remember though, you must check the model thoroughly to ensure that your relationships, level keys, and member captions are in accordance with your design goals. You may also have more content than you need in the form of either extra attributes or extra measures that you do not intend to use. You can use this feature to jumpstart your model when it is based on a Framework Manager package, but remember that the responsibility still resides with the modeler to ensure that all the design details meet the business requirements.
14. Close all open windows without saving.
Results: You imported a Framework Manager package into Cube Designer and created a cube. Then you examined the cube as it was created to identify the tasks that must be done before the cube can be used in a real business scenario.
Name: Sharonne Ayers Email: [email protected] TCW Adobe Connect 2021/02/17

Optimize performance with aggregates
© Copyright IBM Corporation 2016Course materials may not be reproduced in whole or in part without the written permission of IBM.
Optimize performance with aggregates
IBM Cognos Dynamic Cubes
Name: Sharonne Ayers Email: [email protected] TCW Adobe Connect 2021/02/17
Uni t 6 Opt imize per formance wi th aggregates
© Copyright IBM Corp. 2012, 2016 6-6 Course materials may not be reproduced in whole or in part without the prior written permission of IBM.
© Copyright IBM Corporation 2016Optimize performance with aggregates
Demonstration 1
Explore an aggregate
Demonstration 1: Explore an aggregate
Name: Sharonne Ayers Email: [email protected] TCW Adobe Connect 2021/02/17

Uni t 6 Opt imize per formance wi th aggregates
© Copyright IBM Corp. 2012, 2016 6-7 Course materials may not be reproduced in whole or in part without the prior written permission of IBM.
Demonstration 1: Explore an aggregate
Purpose: In order to understand how aggregates are modeled, you will examine the sample aggregate. The Sample Outdoors Company dynamic cube contains an aggregate, which maps to the sample AGGR_TIME_PROD_OM_FACT database aggregate table. This table aggregates the Quantity and Revenue measures at the Quarter and Product type levels. In this example scenario, in-memory aggregates are not enabled.
Task 1. Explore the gosldw_sales2 aggregate. 1. From the Start menu, click All Programs > IBM Cognos Cube Designer >
IBM Cognos Cube Designer. 2. Click Open Existing, navigate to C:\Training\B6063\Start Files\06\Demo 1,
and then double-click model.fmd. 3. Authenticate as admin/Education1. 4. In the Project Explorer, expand Model and then double-click gosldw_sales. 5. In the Object Editor on the right, click the Aggregates tab.
The results appear as follows:
6. In the In-Database Aggregates pane, double-click gosldw_sales2.
On the Editor tab, there are three dimensions listed: Order method, Products, and Time.
Name: Sharonne Ayers Email: [email protected] TCW Adobe Connect 2021/02/17

Uni t 6 Opt imize per formance wi th aggregates
© Copyright IBM Corp. 2012, 2016 6-8 Course materials may not be reproduced in whole or in part without the prior written permission of IBM.
7. In the Object Editor, in the Dimension column, click Time. The right side of the editor displays a list of any hierarchies and levels. Note that Time only has one hierarchy. Even if a dimension has more than one hierarchy, usually only one of them participates in the aggregate table, since multiple hierarchies can add to the tuple, which impacts performance. Both the Year and Quarter levels are selected, which indicates that the aggregate level grain for the Time dimension is the Quarter level.
8. Deselect the Year check box. The Quarter check box is also deselected, which indicates that you must include the keys of higher dimension grains in the aggregate to correctly route the query.
9. Select the Quarter check box. The Year check box is also selected.
10. Click the Order method dimension. Notice that the Order Method hierarchy has only one level. It might seem pointless to include Order Method in the aggregate table, but it actually allows for a richer, more versatile aggregate table. The set of queries that can be routed to the aggregate table is enlarged.
11. Click Measures . There are two measures: Quantity and Revenue. The Mapping column displays the columns in the aggregate table that map to these measures: QUANTITY and SALE_TOTAL.
12. In the Mapping column, place the cursor over QUANTITY. The names of the related aggregate table and column display in a tool tip. This identifies the source objects to which the aggregate measures are mapped.
13. At the top of the pane, click gosldw_sales2 to return to the Aggregate Editor.
Name: Sharonne Ayers Email: [email protected] TCW Adobe Connect 2021/02/17
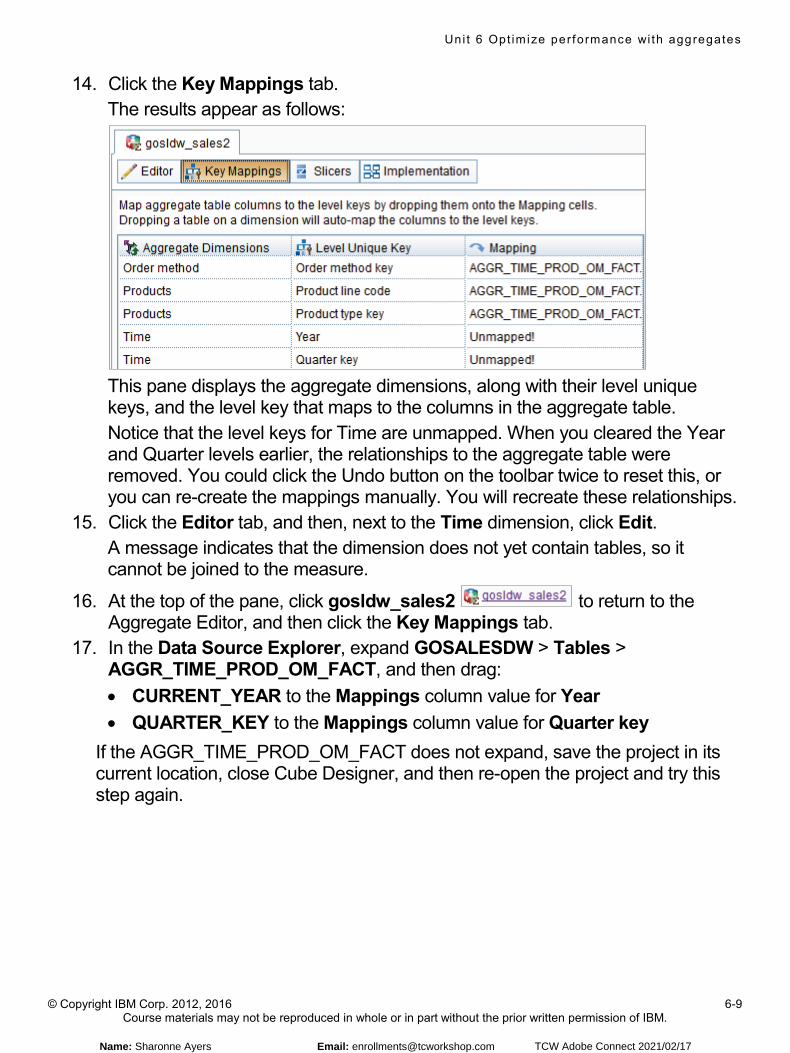
Uni t 6 Opt imize per formance wi th aggregates
© Copyright IBM Corp. 2012, 2016 6-9 Course materials may not be reproduced in whole or in part without the prior written permission of IBM.
14. Click the Key Mappings tab. The results appear as follows:
This pane displays the aggregate dimensions, along with their level unique keys, and the level key that maps to the columns in the aggregate table. Notice that the level keys for Time are unmapped. When you cleared the Year and Quarter levels earlier, the relationships to the aggregate table were removed. You could click the Undo button on the toolbar twice to reset this, or you can re-create the mappings manually. You will recreate these relationships.
15. Click the Editor tab, and then, next to the Time dimension, click Edit. A message indicates that the dimension does not yet contain tables, so it cannot be joined to the measure.
16. At the top of the pane, click gosldw_sales2 to return to the Aggregate Editor, and then click the Key Mappings tab.
17. In the Data Source Explorer, expand GOSALESDW > Tables > AGGR_TIME_PROD_OM_FACT, and then drag: • CURRENT_YEAR to the Mappings column value for Year • QUARTER_KEY to the Mappings column value for Quarter key
If the AGGR_TIME_PROD_OM_FACT does not expand, save the project in its current location, close Cube Designer, and then re-open the project and try this step again.
Name: Sharonne Ayers Email: [email protected] TCW Adobe Connect 2021/02/17
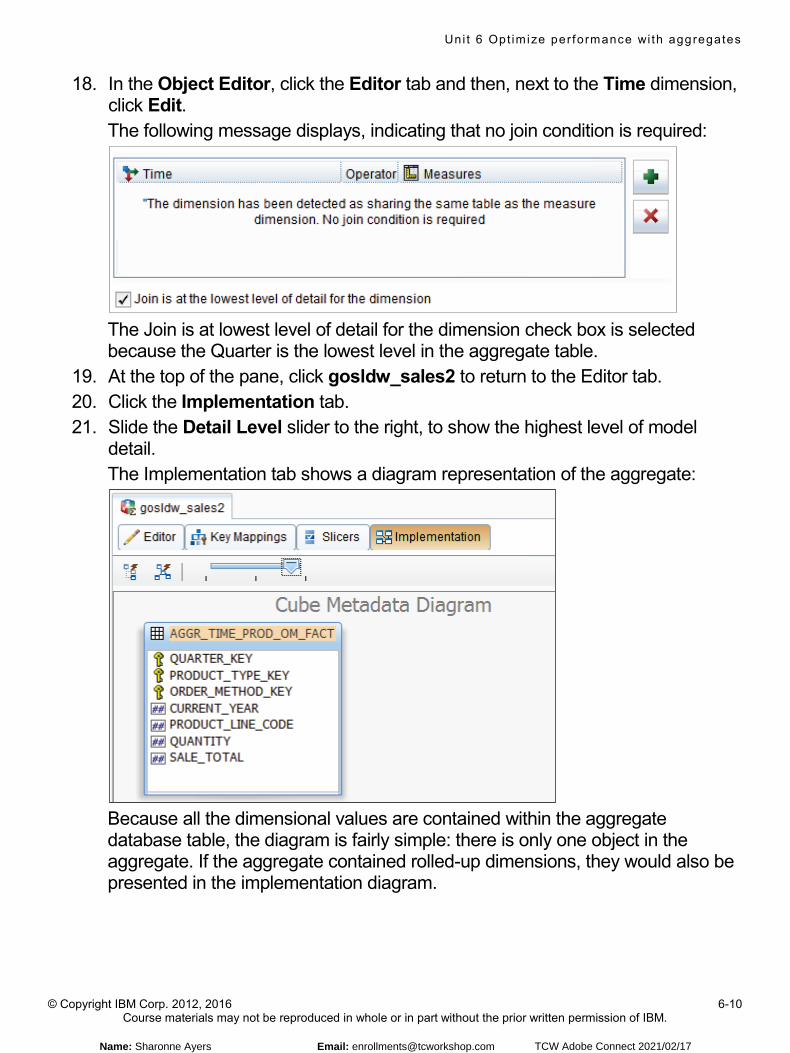
Uni t 6 Opt imize per formance wi th aggregates
© Copyright IBM Corp. 2012, 2016 6-10 Course materials may not be reproduced in whole or in part without the prior written permission of IBM.
18. In the Object Editor, click the Editor tab and then, next to the Time dimension, click Edit. The following message displays, indicating that no join condition is required:
The Join is at lowest level of detail for the dimension check box is selected because the Quarter is the lowest level in the aggregate table.
19. At the top of the pane, click gosldw_sales2 to return to the Editor tab. 20. Click the Implementation tab. 21. Slide the Detail Level slider to the right, to show the highest level of model
detail. The Implementation tab shows a diagram representation of the aggregate:
Because all the dimensional values are contained within the aggregate database table, the diagram is fairly simple: there is only one object in the aggregate. If the aggregate contained rolled-up dimensions, they would also be presented in the implementation diagram.
Name: Sharonne Ayers Email: [email protected] TCW Adobe Connect 2021/02/17

Uni t 6 Opt imize per formance wi th aggregates
© Copyright IBM Corp. 2012, 2016 6-11 Course materials may not be reproduced in whole or in part without the prior written permission of IBM.
22. In Object Editor, click the Editor tab to navigate away from the Implementation tab diagram.
23. Close IBM Cognos Cube Designer without saving anything.
Result: You explored the sample aggregate, which maps to the sample AGGR_TIME_PROD_OM_FACT database aggregate table. You saw the dimensions, measures, and levels that the aggregate uses to map to the database aggregate table.
Name: Sharonne Ayers Email: [email protected] TCW Adobe Connect 2021/02/17
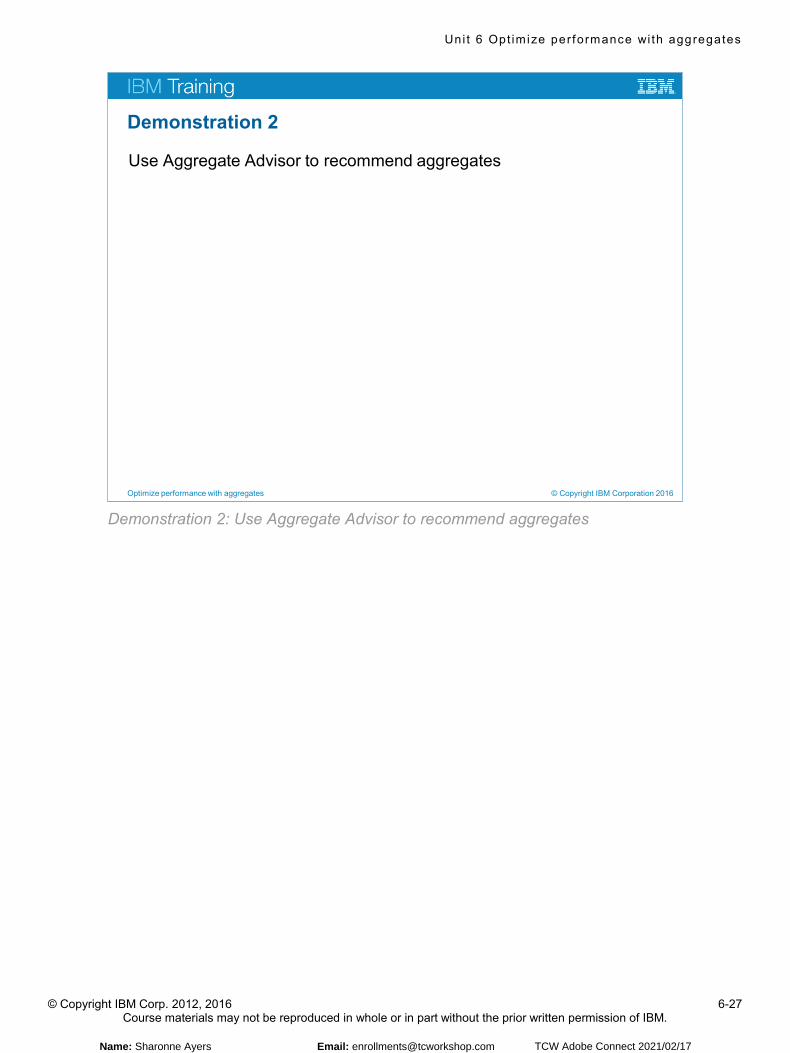
Uni t 6 Opt imize per formance wi th aggregates
© Copyright IBM Corp. 2012, 2016 6-27 Course materials may not be reproduced in whole or in part without the prior written permission of IBM.
© Copyright IBM Corporation 2016Optimize performance with aggregates
Demonstration 2
Use Aggregate Advisor to recommend aggregates
Demonstration 2: Use Aggregate Advisor to recommend aggregates
Name: Sharonne Ayers Email: [email protected] TCW Adobe Connect 2021/02/17
Uni t 6 Opt imize per formance wi th aggregates
© Copyright IBM Corp. 2012, 2016 6-28 Course materials may not be reproduced in whole or in part without the prior written permission of IBM.
Demonstration 2: Use Aggregate Advisor to recommend aggregates Purpose: You want to ensure that your dynamic cube is optimized to return results as efficiently as possible. To do so, you deploy the cube, and then ask the Administrator to enable workload logging for the cube, and restart it. You will then want to run reports that represent the data requirements of your report users. After you run reports against the cube, the Administrator can use Aggregate Advisor to monitor the performance of the cube and recommend aggregates to make the cube more efficient. Be aware that the recommendations made may differ slightly from the recommendations in the demonstration. Also, your cube metrics may differ slightly in percentages, sizes, or load and execution times.
Task 1. Publish the gosldw_sales dynamic cube. You will deploy the sample dynamic cube as a data source in your Cognos Analytics environment, so that the Administrator can enable workload logging for the dynamic cube.
1. Start IBM Cognos Cube Designer, click Open Existing, navigate to C:\Training\B6063\Start Files\06\Demo 2, and then double-click model.fmd.
2. Authenticate as admin/Education1, and in the Project Explorer, expand Model.
3. Right-click the gosldw_sales dynamic cube, and then click Validate. Notice that the Issues tab indicates some issues.
4. Click the Issues tab. Notice that the issues pertain to the presence of aggregates, dimensional filters, and named sets. These are merely warnings and not errors. You will publish the cube anyway.
5. Right-click the gosldw_sales cube, and then click Publish. This time you will leave Pubic Folders selected as the publish folder.
6. Expand Additional Options, select the Select all options check box, and then click OK.
7. On the Warning window, click OK. 8. On the Deploy Results window stating that the cube start or restart succeeded,
click OK.
Name: Sharonne Ayers Email: [email protected] TCW Adobe Connect 2021/02/17
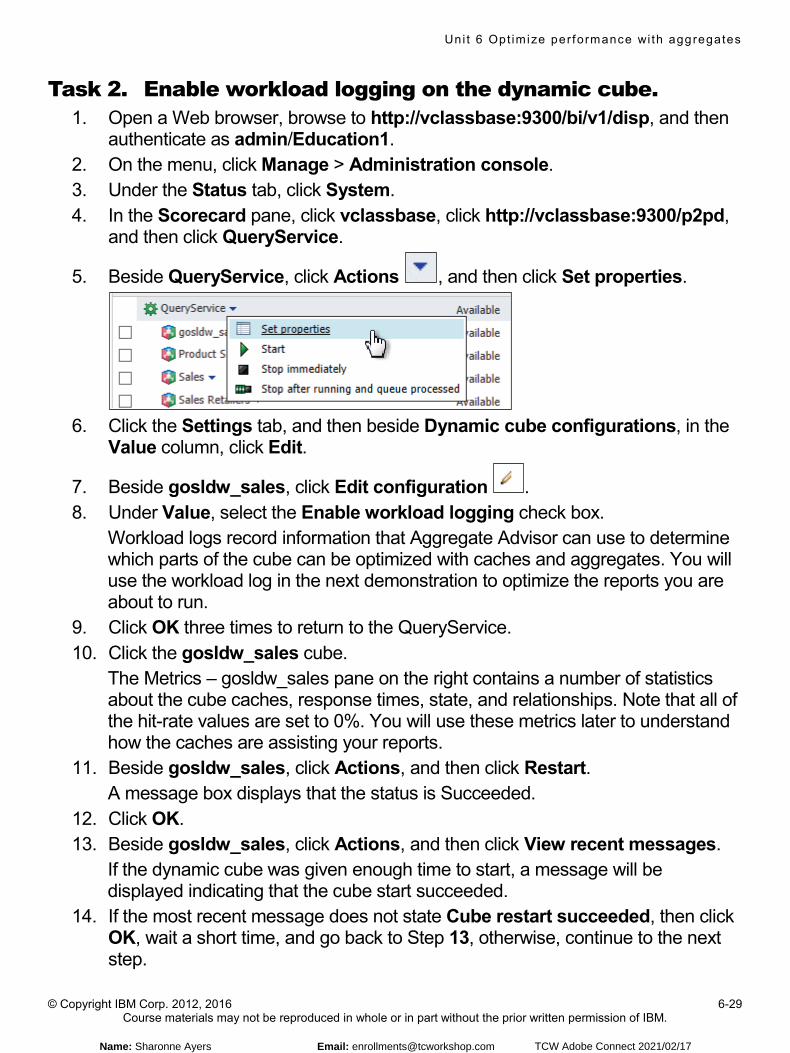
Uni t 6 Opt imize per formance wi th aggregates
© Copyright IBM Corp. 2012, 2016 6-29 Course materials may not be reproduced in whole or in part without the prior written permission of IBM.
Task 2. Enable workload logging on the dynamic cube. 1. Open a Web browser, browse to http://vclassbase:9300/bi/v1/disp, and then
authenticate as admin/Education1. 2. On the menu, click Manage > Administration console. 3. Under the Status tab, click System. 4. In the Scorecard pane, click vclassbase, click http://vclassbase:9300/p2pd,
and then click QueryService.
5. Beside QueryService, click Actions , and then click Set properties.
6. Click the Settings tab, and then beside Dynamic cube configurations, in the
Value column, click Edit.
7. Beside gosldw_sales, click Edit configuration . 8. Under Value, select the Enable workload logging check box.
Workload logs record information that Aggregate Advisor can use to determine which parts of the cube can be optimized with caches and aggregates. You will use the workload log in the next demonstration to optimize the reports you are about to run.
9. Click OK three times to return to the QueryService. 10. Click the gosldw_sales cube.
The Metrics – gosldw_sales pane on the right contains a number of statistics about the cube caches, response times, state, and relationships. Note that all of the hit-rate values are set to 0%. You will use these metrics later to understand how the caches are assisting your reports.
11. Beside gosldw_sales, click Actions, and then click Restart. A message box displays that the status is Succeeded.
12. Click OK. 13. Beside gosldw_sales, click Actions, and then click View recent messages.
If the dynamic cube was given enough time to start, a message will be displayed indicating that the cube start succeeded.
14. If the most recent message does not state Cube restart succeeded, then click OK, wait a short time, and go back to Step 13, otherwise, continue to the next step.
Name: Sharonne Ayers Email: [email protected] TCW Adobe Connect 2021/02/17
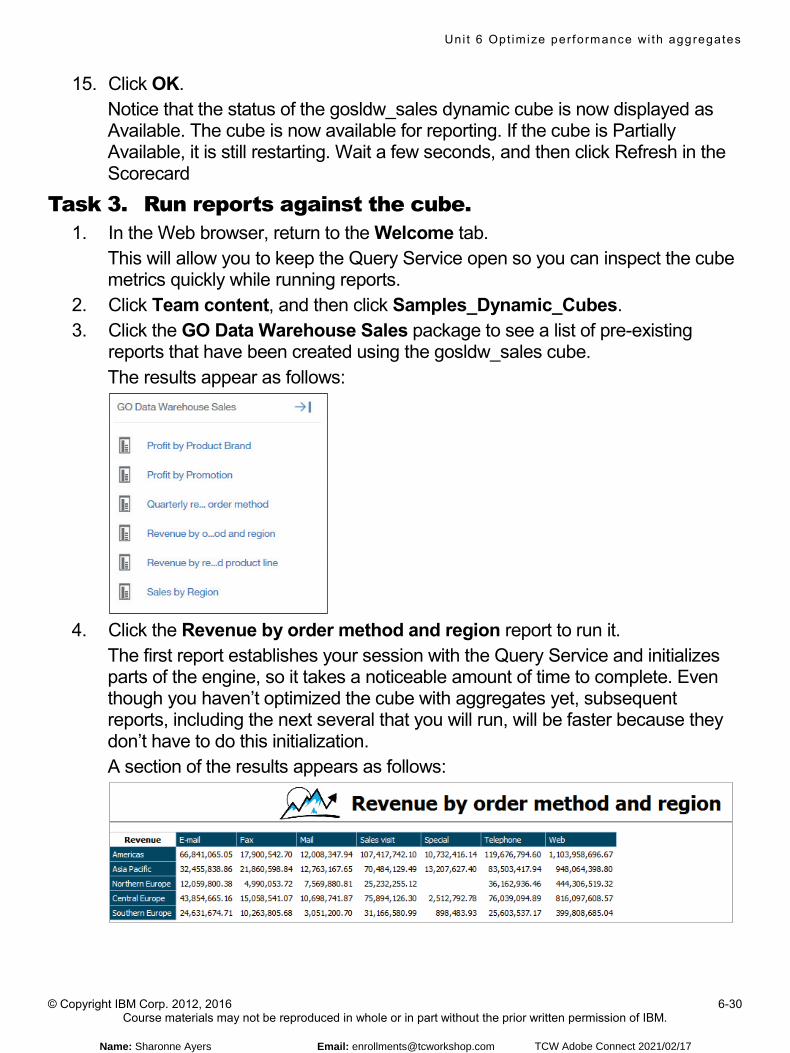
Uni t 6 Opt imize per formance wi th aggregates
© Copyright IBM Corp. 2012, 2016 6-30 Course materials may not be reproduced in whole or in part without the prior written permission of IBM.
15. Click OK. Notice that the status of the gosldw_sales dynamic cube is now displayed as Available. The cube is now available for reporting. If the cube is Partially Available, it is still restarting. Wait a few seconds, and then click Refresh in the Scorecard
Task 3. Run reports against the cube. 1. In the Web browser, return to the Welcome tab.
This will allow you to keep the Query Service open so you can inspect the cube metrics quickly while running reports.
2. Click Team content, and then click Samples_Dynamic_Cubes. 3. Click the GO Data Warehouse Sales package to see a list of pre-existing
reports that have been created using the gosldw_sales cube. The results appear as follows:
4. Click the Revenue by order method and region report to run it.
The first report establishes your session with the Query Service and initializes parts of the engine, so it takes a noticeable amount of time to complete. Even though you haven’t optimized the cube with aggregates yet, subsequent reports, including the next several that you will run, will be faster because they don’t have to do this initialization. A section of the results appears as follows:
Name: Sharonne Ayers Email: [email protected] TCW Adobe Connect 2021/02/17
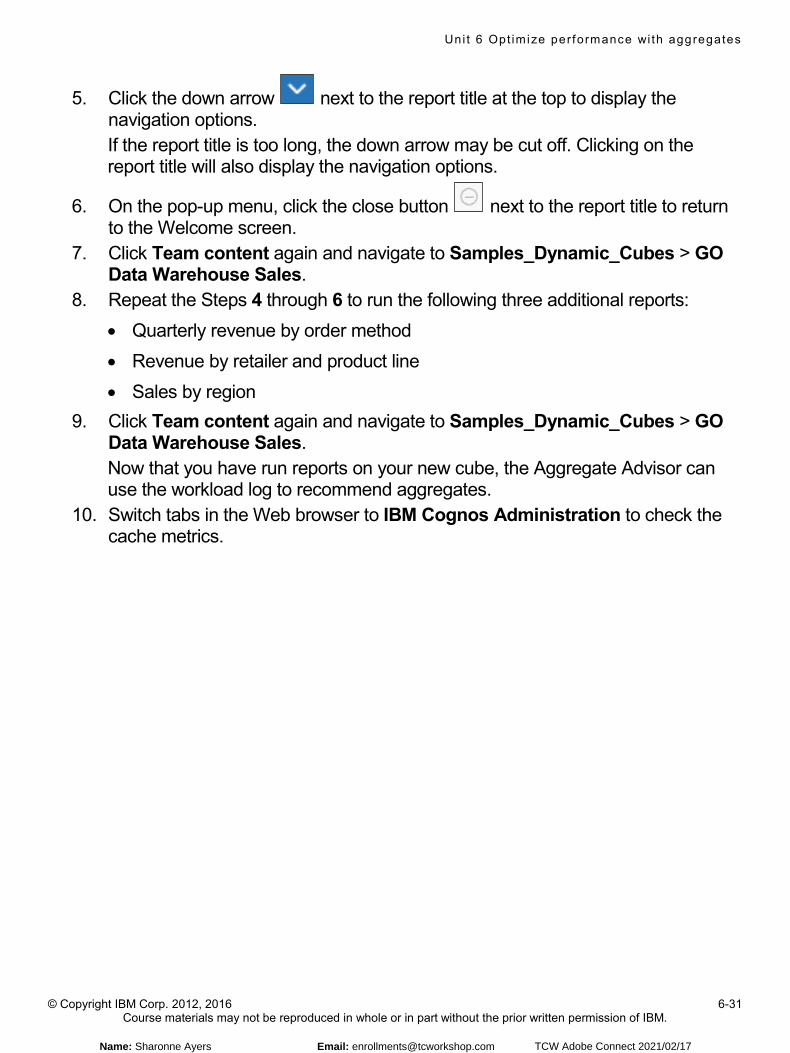
Uni t 6 Opt imize per formance wi th aggregates
© Copyright IBM Corp. 2012, 2016 6-31 Course materials may not be reproduced in whole or in part without the prior written permission of IBM.
5. Click the down arrow next to the report title at the top to display the navigation options. If the report title is too long, the down arrow may be cut off. Clicking on the report title will also display the navigation options.
6. On the pop-up menu, click the close button next to the report title to return to the Welcome screen.
7. Click Team content again and navigate to Samples_Dynamic_Cubes > GO Data Warehouse Sales.
8. Repeat the Steps 4 through 6 to run the following three additional reports: • Quarterly revenue by order method • Revenue by retailer and product line • Sales by region
9. Click Team content again and navigate to Samples_Dynamic_Cubes > GO Data Warehouse Sales. Now that you have run reports on your new cube, the Aggregate Advisor can use the workload log to recommend aggregates.
10. Switch tabs in the Web browser to IBM Cognos Administration to check the cache metrics.
Name: Sharonne Ayers Email: [email protected] TCW Adobe Connect 2021/02/17
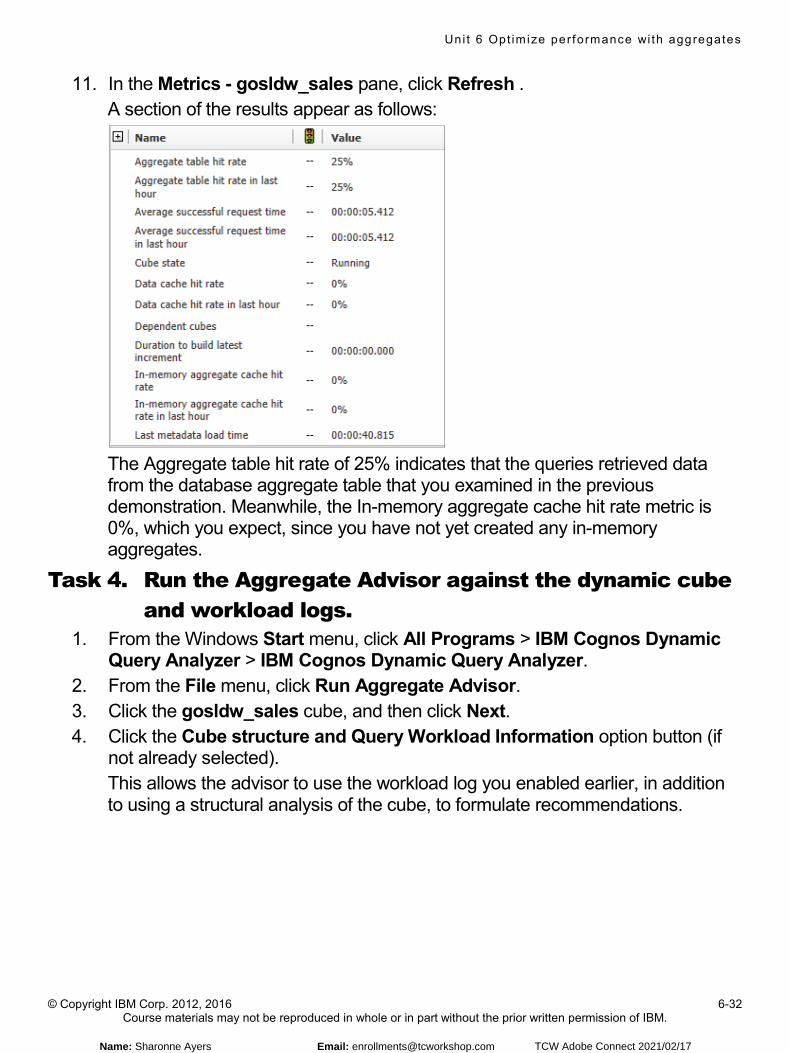
Uni t 6 Opt imize per formance wi th aggregates
© Copyright IBM Corp. 2012, 2016 6-32 Course materials may not be reproduced in whole or in part without the prior written permission of IBM.
11. In the Metrics - gosldw_sales pane, click Refresh . A section of the results appear as follows:
The Aggregate table hit rate of 25% indicates that the queries retrieved data from the database aggregate table that you examined in the previous demonstration. Meanwhile, the In-memory aggregate cache hit rate metric is 0%, which you expect, since you have not yet created any in-memory aggregates.
Task 4. Run the Aggregate Advisor against the dynamic cube and workload logs.
1. From the Windows Start menu, click All Programs > IBM Cognos Dynamic Query Analyzer > IBM Cognos Dynamic Query Analyzer.
2. From the File menu, click Run Aggregate Advisor. 3. Click the gosldw_sales cube, and then click Next. 4. Click the Cube structure and Query Workload Information option button (if
not already selected). This allows the advisor to use the workload log you enabled earlier, in addition to using a structural analysis of the cube, to formulate recommendations.
Name: Sharonne Ayers Email: [email protected] TCW Adobe Connect 2021/02/17

Uni t 6 Opt imize per formance wi th aggregates
© Copyright IBM Corp. 2012, 2016 6-33 Course materials may not be reproduced in whole or in part without the prior written permission of IBM.
5. Under In-memory aggregates, set the Maximum to 200 MB and then, under Advisor run time limit, set the Maximum to 5 minutes. The results appear as follows:
If you receive the following error, click OK, cancel Aggregate Advisor, close Dynamic Query Analyzer, and start Task 4 again.
6. Click Next. 7. On the Filter Workload Information screen of the wizard, leave Package
names unselected, select Report names, and then next to Report names,
click browse . On the Selection Needed window, you want to click the names of the reports that you ran earlier.
Name: Sharonne Ayers Email: [email protected] TCW Adobe Connect 2021/02/17
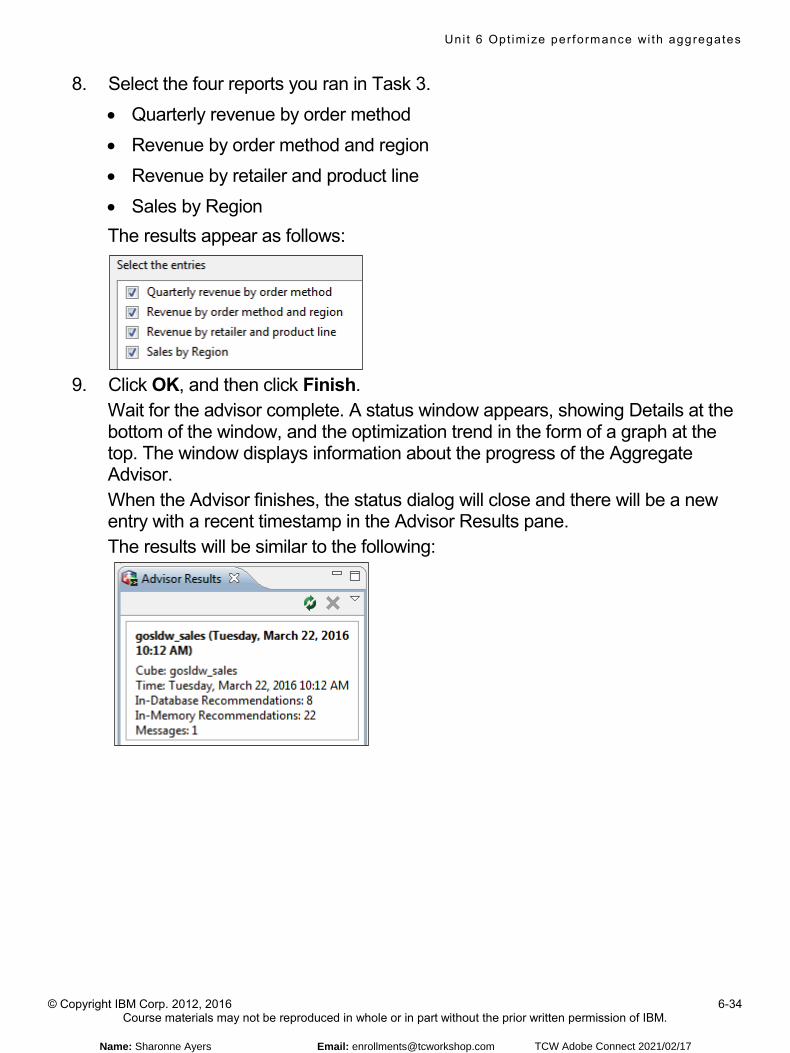
Uni t 6 Opt imize per formance wi th aggregates
© Copyright IBM Corp. 2012, 2016 6-34 Course materials may not be reproduced in whole or in part without the prior written permission of IBM.
8. Select the four reports you ran in Task 3. • Quarterly revenue by order method • Revenue by order method and region • Revenue by retailer and product line • Sales by Region The results appear as follows:
9. Click OK, and then click Finish.
Wait for the advisor complete. A status window appears, showing Details at the bottom of the window, and the optimization trend in the form of a graph at the top. The window displays information about the progress of the Aggregate Advisor. When the Advisor finishes, the status dialog will close and there will be a new entry with a recent timestamp in the Advisor Results pane. The results will be similar to the following:
Name: Sharonne Ayers Email: [email protected] TCW Adobe Connect 2021/02/17
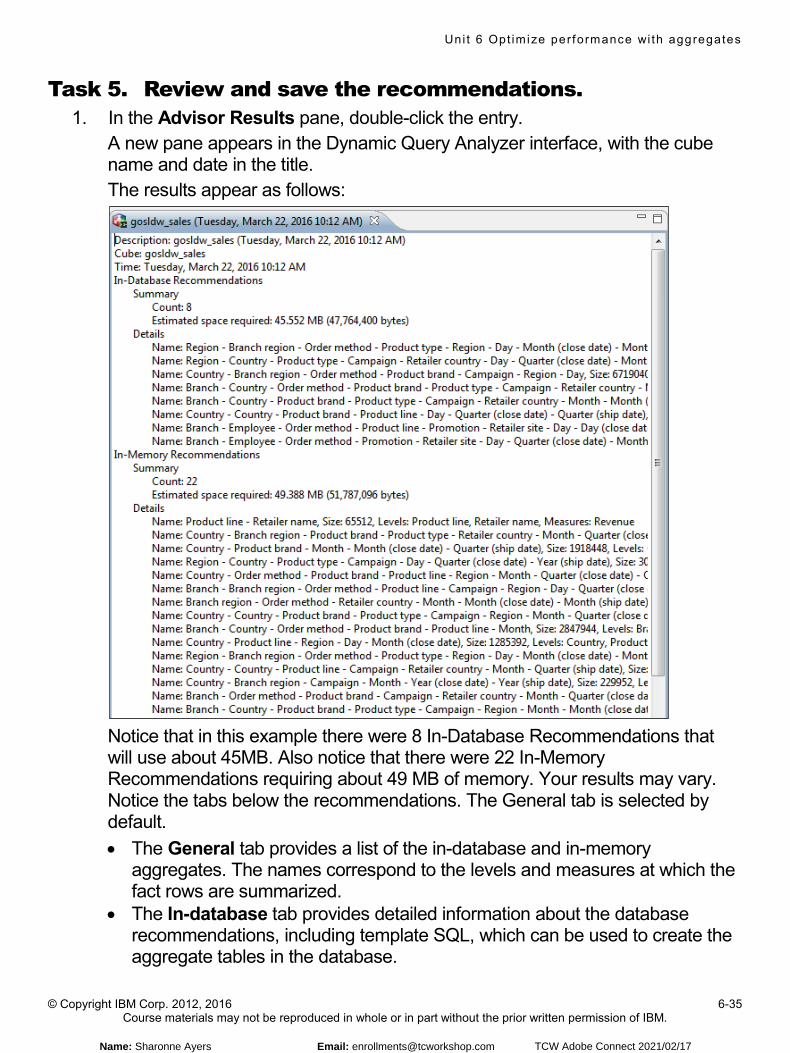
Uni t 6 Opt imize per formance wi th aggregates
© Copyright IBM Corp. 2012, 2016 6-35 Course materials may not be reproduced in whole or in part without the prior written permission of IBM.
Task 5. Review and save the recommendations. 1. In the Advisor Results pane, double-click the entry.
A new pane appears in the Dynamic Query Analyzer interface, with the cube name and date in the title. The results appear as follows:
Notice that in this example there were 8 In-Database Recommendations that will use about 45MB. Also notice that there were 22 In-Memory Recommendations requiring about 49 MB of memory. Your results may vary. Notice the tabs below the recommendations. The General tab is selected by default. • The General tab provides a list of the in-database and in-memory
aggregates. The names correspond to the levels and measures at which the fact rows are summarized.
• The In-database tab provides detailed information about the database recommendations, including template SQL, which can be used to create the aggregate tables in the database.
Name: Sharonne Ayers Email: [email protected] TCW Adobe Connect 2021/02/17
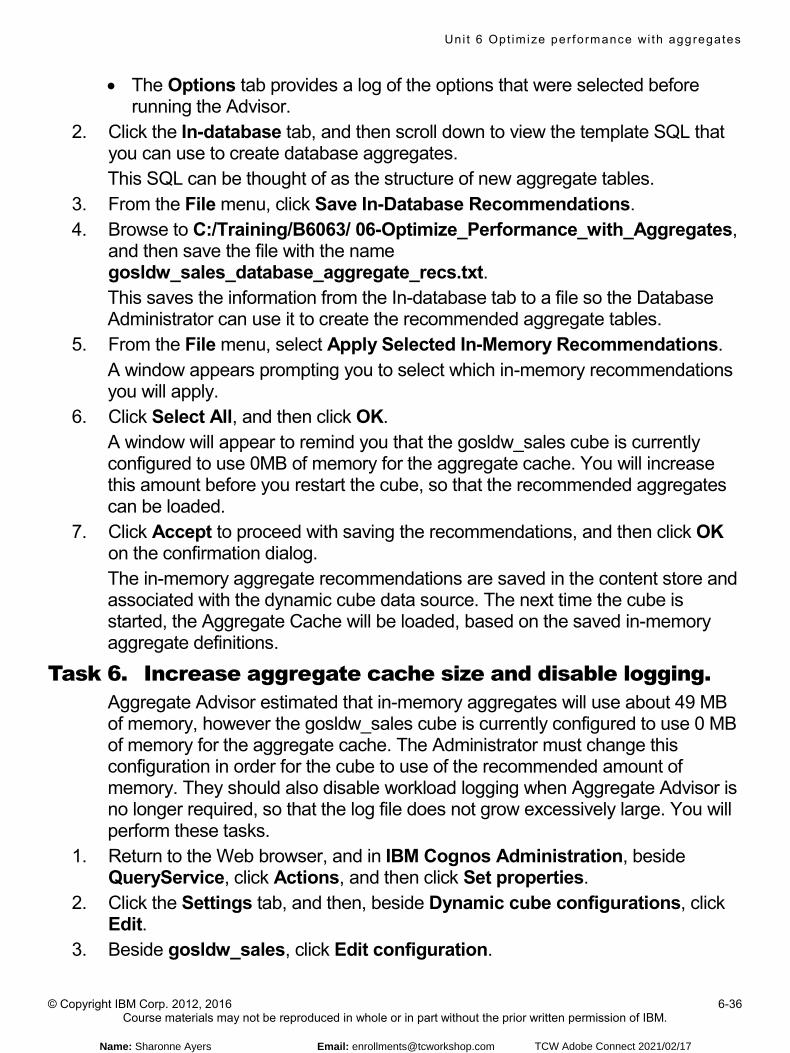
Uni t 6 Opt imize per formance wi th aggregates
© Copyright IBM Corp. 2012, 2016 6-36 Course materials may not be reproduced in whole or in part without the prior written permission of IBM.
• The Options tab provides a log of the options that were selected before running the Advisor.
2. Click the In-database tab, and then scroll down to view the template SQL that you can use to create database aggregates. This SQL can be thought of as the structure of new aggregate tables.
3. From the File menu, click Save In-Database Recommendations. 4. Browse to C:/Training/B6063/ 06-Optimize_Performance_with_Aggregates,
and then save the file with the name gosldw_sales_database_aggregate_recs.txt. This saves the information from the In-database tab to a file so the Database Administrator can use it to create the recommended aggregate tables.
5. From the File menu, select Apply Selected In-Memory Recommendations. A window appears prompting you to select which in-memory recommendations you will apply.
6. Click Select All, and then click OK. A window will appear to remind you that the gosldw_sales cube is currently configured to use 0MB of memory for the aggregate cache. You will increase this amount before you restart the cube, so that the recommended aggregates can be loaded.
7. Click Accept to proceed with saving the recommendations, and then click OK on the confirmation dialog. The in-memory aggregate recommendations are saved in the content store and associated with the dynamic cube data source. The next time the cube is started, the Aggregate Cache will be loaded, based on the saved in-memory aggregate definitions.
Task 6. Increase aggregate cache size and disable logging. Aggregate Advisor estimated that in-memory aggregates will use about 49 MB of memory, however the gosldw_sales cube is currently configured to use 0 MB of memory for the aggregate cache. The Administrator must change this configuration in order for the cube to use of the recommended amount of memory. They should also disable workload logging when Aggregate Advisor is no longer required, so that the log file does not grow excessively large. You will perform these tasks.
1. Return to the Web browser, and in IBM Cognos Administration, beside QueryService, click Actions, and then click Set properties.
2. Click the Settings tab, and then, beside Dynamic cube configurations, click Edit.
3. Beside gosldw_sales, click Edit configuration.
Name: Sharonne Ayers Email: [email protected] TCW Adobe Connect 2021/02/17

Uni t 6 Opt imize per formance wi th aggregates
© Copyright IBM Corp. 2012, 2016 6-37 Course materials may not be reproduced in whole or in part without the prior written permission of IBM.
4. Select the Maximum space for in-memory aggregates (MB) check box, and then under Value, type 128. Be careful, because there are other similarly named items. You set the size to 128 MB to provide some extra storage, because the 49 MB size from the Advisor was only an estimate and you want to be sure all the recommended aggregates fit into memory. For more information on how to determine the proper amount of memory to assign to each cache, read Understanding Hardware Requirements for Cognos Dynamic Cubes from the business analytics proven practices website: http://www.ibm.com/developerworks/analytics/practices.html You can also take the IBM Cognos Analytics Enterprise Administration course.
5. Beside Enable workload logging, under Value, deselect the check box. 6. Click OK three times to return to the QueryService. 7. Click the gosldw_sales cube to show its metrics in the upper right pane.
In the Metrics pane, the Loaded/defined in-memory aggregates metric has a value of 0/0. This is because the cube needs to be restarted to refresh and load the recommendations. Also, you can see that the In-memory aggregate cache hit rate is still at 0%.
Task 7. Restart the cube to initialize the in-memory aggregate.
Since the cube was last started, you have updated it with in-memory aggregates. The cube has to be restarted to load the aggregates.
1. Beside gosldw_sales, click Actions, and then click Restart. 2. Click OK.
Notice that the metric for Loaded/defined in-memory aggregates has a value of 0/22. This indicates that the cube has 22 in-memory aggregates, but has not yet loaded any of them.
3. Beside gosldw_sales, click Actions, and then click View recent messages. You will notice that the in-memory aggregates load is still executing. The cube starts before the in-memory aggregates are loaded. Note that reports can be run against the cube while the in-memory aggregates are loading.
4. Click OK.
Name: Sharonne Ayers Email: [email protected] TCW Adobe Connect 2021/02/17
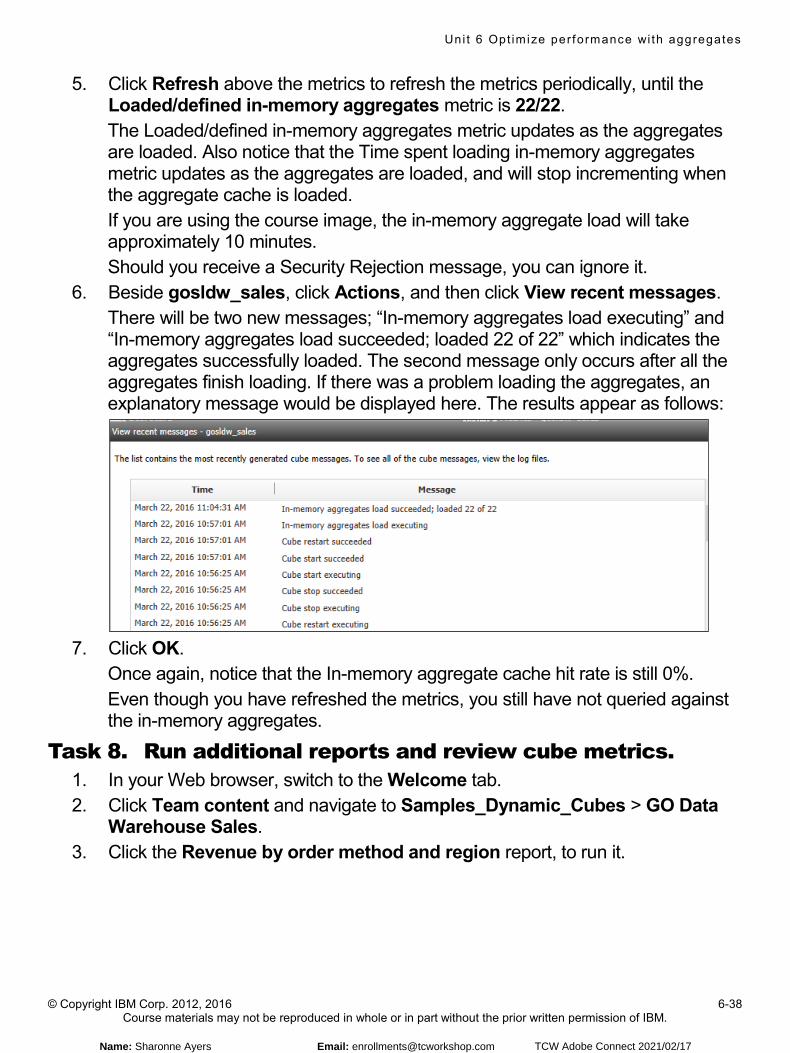
Uni t 6 Opt imize per formance wi th aggregates
© Copyright IBM Corp. 2012, 2016 6-38 Course materials may not be reproduced in whole or in part without the prior written permission of IBM.
5. Click Refresh above the metrics to refresh the metrics periodically, until the Loaded/defined in-memory aggregates metric is 22/22. The Loaded/defined in-memory aggregates metric updates as the aggregates are loaded. Also notice that the Time spent loading in-memory aggregates metric updates as the aggregates are loaded, and will stop incrementing when the aggregate cache is loaded. If you are using the course image, the in-memory aggregate load will take approximately 10 minutes. Should you receive a Security Rejection message, you can ignore it.
6. Beside gosldw_sales, click Actions, and then click View recent messages. There will be two new messages; “In-memory aggregates load executing” and “In-memory aggregates load succeeded; loaded 22 of 22” which indicates the aggregates successfully loaded. The second message only occurs after all the aggregates finish loading. If there was a problem loading the aggregates, an explanatory message would be displayed here. The results appear as follows:
7. Click OK.
Once again, notice that the In-memory aggregate cache hit rate is still 0%. Even though you have refreshed the metrics, you still have not queried against the in-memory aggregates.
Task 8. Run additional reports and review cube metrics. 1. In your Web browser, switch to the Welcome tab. 2. Click Team content and navigate to Samples_Dynamic_Cubes > GO Data
Warehouse Sales. 3. Click the Revenue by order method and region report, to run it.
Name: Sharonne Ayers Email: [email protected] TCW Adobe Connect 2021/02/17
Uni t 6 Opt imize per formance wi th aggregates
© Copyright IBM Corp. 2012, 2016 6-39 Course materials may not be reproduced in whole or in part without the prior written permission of IBM.
4. Switch tabs, and in the Metrics - gosldw_sales pane, click Refresh. Notice that the In-memory aggregate cache hit rate metric is 100%. This means all the values were retrieved from the aggregate cache. There have been no queries to the physical database for this report. Also notice the Data cache hit rate metric is 0%. The data cache stores the values that are summarized at a higher level than those in the aggregate cache; however, in this case, none of those values were used.
5. Switch tabs back to your report, and then click the down arrow next to the report title at the top to display the navigation options.
6. On the pop-up menu, click the close button next to the report title to return to the Welcome screen.
7. Click Team content again and navigate to Samples_Dynamic_Cubes > GO Data Warehouse Sales.
8. Click the Revenue by retailer and product line report. 9. Switch tabs, and then in the Metrics pane, click Refresh.
Notice the In-memory aggregate cache hit rate metric is still 100%. 10. In IBM Cognos Dynamic Query Analyzer, click File, and then click Clear In-
Memory Recommendations. When a cube is associated with both in-memory and in-database aggregates, the query is routed to the in-memory aggregates first. You will remove the in-memory aggregates to prepare for the next demonstration using database aggregates.
11. Click the gosldw_sales cube, click Finish, and then click OK. 12. From the File menu, click Exit to close the IBM Cognos Dynamic Query
Analyzer. 13. Leave the Web browser and Cube Designer open for the next demonstration.
Results: After enabling workload logging, you ran reports against the cube and used the Aggregate Advisor to monitor the performance of the cube and recommend aggregates that would optimize the performance of the cube.
Name: Sharonne Ayers Email: [email protected] TCW Adobe Connect 2021/02/17
Uni t 6 Opt imize per formance wi th aggregates
© Copyright IBM Corp. 2012, 2016 6-44 Course materials may not be reproduced in whole or in part without the prior written permission of IBM.
© Copyright IBM Corporation 2016Optimize performance with aggregates
Demonstration 3
Model aggregates
Demonstration 3: Model aggregates
Name: Sharonne Ayers Email: [email protected] TCW Adobe Connect 2021/02/17
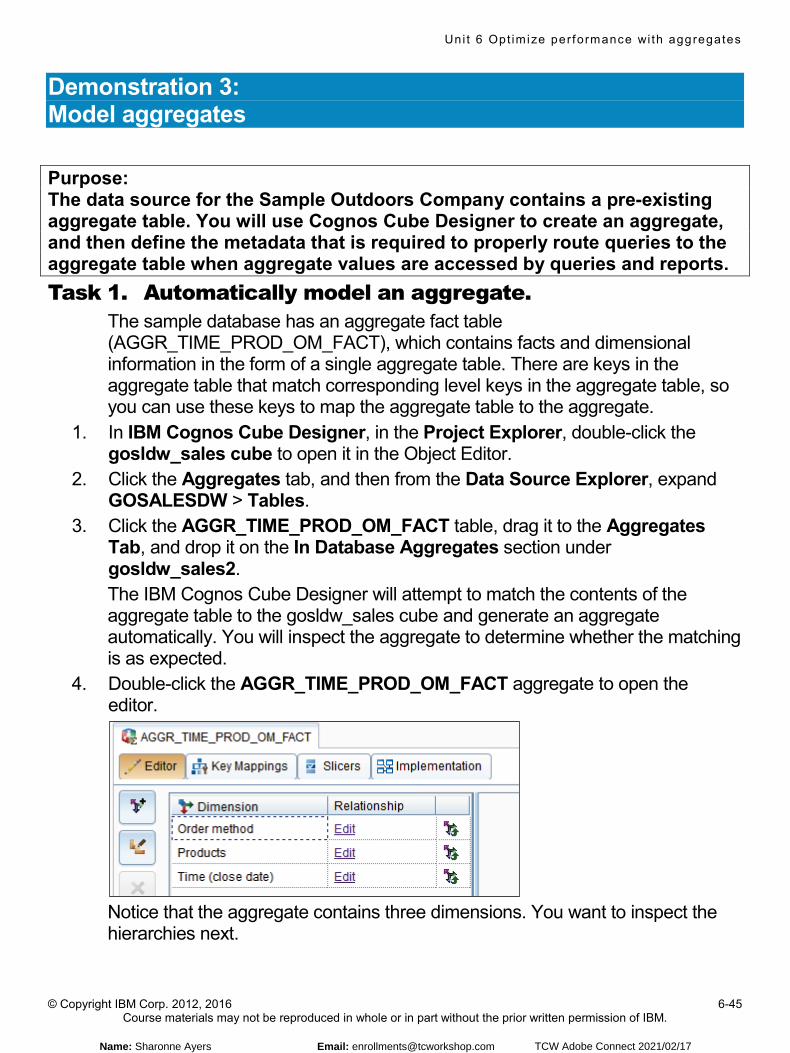
Uni t 6 Opt imize per formance wi th aggregates
© Copyright IBM Corp. 2012, 2016 6-45 Course materials may not be reproduced in whole or in part without the prior written permission of IBM.
Demonstration 3: Model aggregates
Purpose: The data source for the Sample Outdoors Company contains a pre-existing aggregate table. You will use Cognos Cube Designer to create an aggregate, and then define the metadata that is required to properly route queries to the aggregate table when aggregate values are accessed by queries and reports. Task 1. Automatically model an aggregate.
The sample database has an aggregate fact table (AGGR_TIME_PROD_OM_FACT), which contains facts and dimensional information in the form of a single aggregate table. There are keys in the aggregate table that match corresponding level keys in the aggregate table, so you can use these keys to map the aggregate table to the aggregate.
1. In IBM Cognos Cube Designer, in the Project Explorer, double-click the gosldw_sales cube to open it in the Object Editor.
2. Click the Aggregates tab, and then from the Data Source Explorer, expand GOSALESDW > Tables.
3. Click the AGGR_TIME_PROD_OM_FACT table, drag it to the Aggregates Tab, and drop it on the In Database Aggregates section under gosldw_sales2. The IBM Cognos Cube Designer will attempt to match the contents of the aggregate table to the gosldw_sales cube and generate an aggregate automatically. You will inspect the aggregate to determine whether the matching is as expected.
4. Double-click the AGGR_TIME_PROD_OM_FACT aggregate to open the editor.
Notice that the aggregate contains three dimensions. You want to inspect the hierarchies next.
Name: Sharonne Ayers Email: [email protected] TCW Adobe Connect 2021/02/17
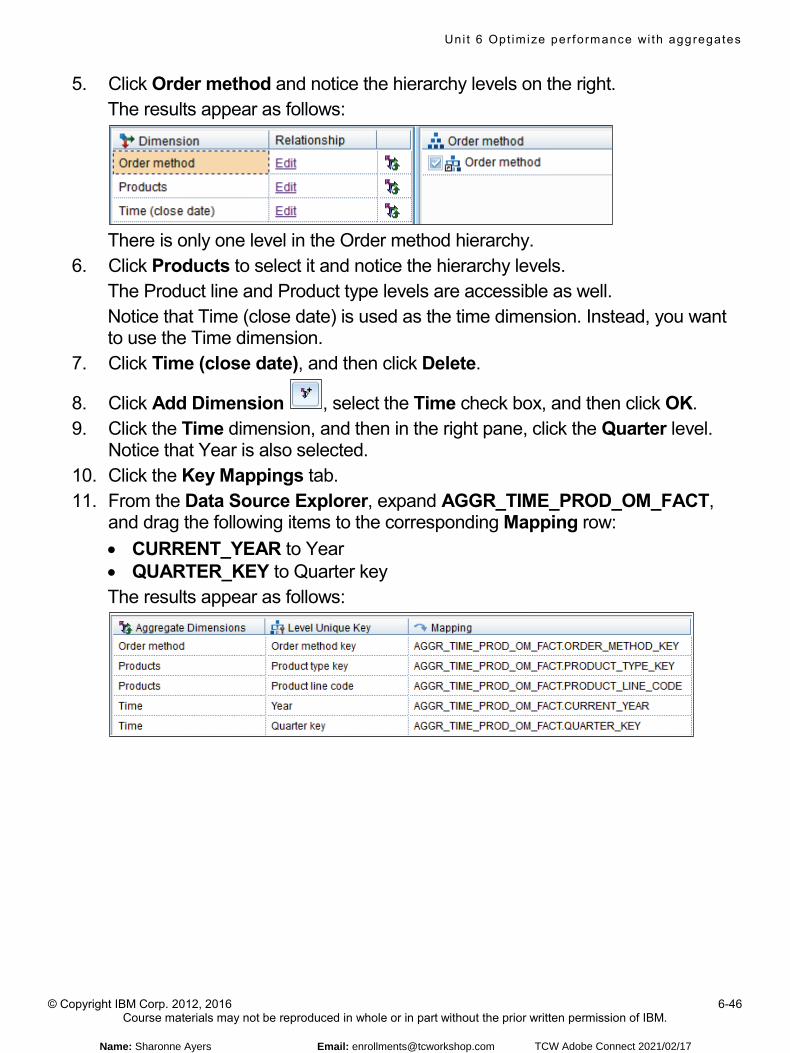
Uni t 6 Opt imize per formance wi th aggregates
© Copyright IBM Corp. 2012, 2016 6-46 Course materials may not be reproduced in whole or in part without the prior written permission of IBM.
5. Click Order method and notice the hierarchy levels on the right. The results appear as follows:
There is only one level in the Order method hierarchy.
6. Click Products to select it and notice the hierarchy levels. The Product line and Product type levels are accessible as well. Notice that Time (close date) is used as the time dimension. Instead, you want to use the Time dimension.
7. Click Time (close date), and then click Delete.
8. Click Add Dimension , select the Time check box, and then click OK. 9. Click the Time dimension, and then in the right pane, click the Quarter level.
Notice that Year is also selected. 10. Click the Key Mappings tab. 11. From the Data Source Explorer, expand AGGR_TIME_PROD_OM_FACT,
and drag the following items to the corresponding Mapping row: • CURRENT_YEAR to Year • QUARTER_KEY to Quarter key The results appear as follows:
Name: Sharonne Ayers Email: [email protected] TCW Adobe Connect 2021/02/17
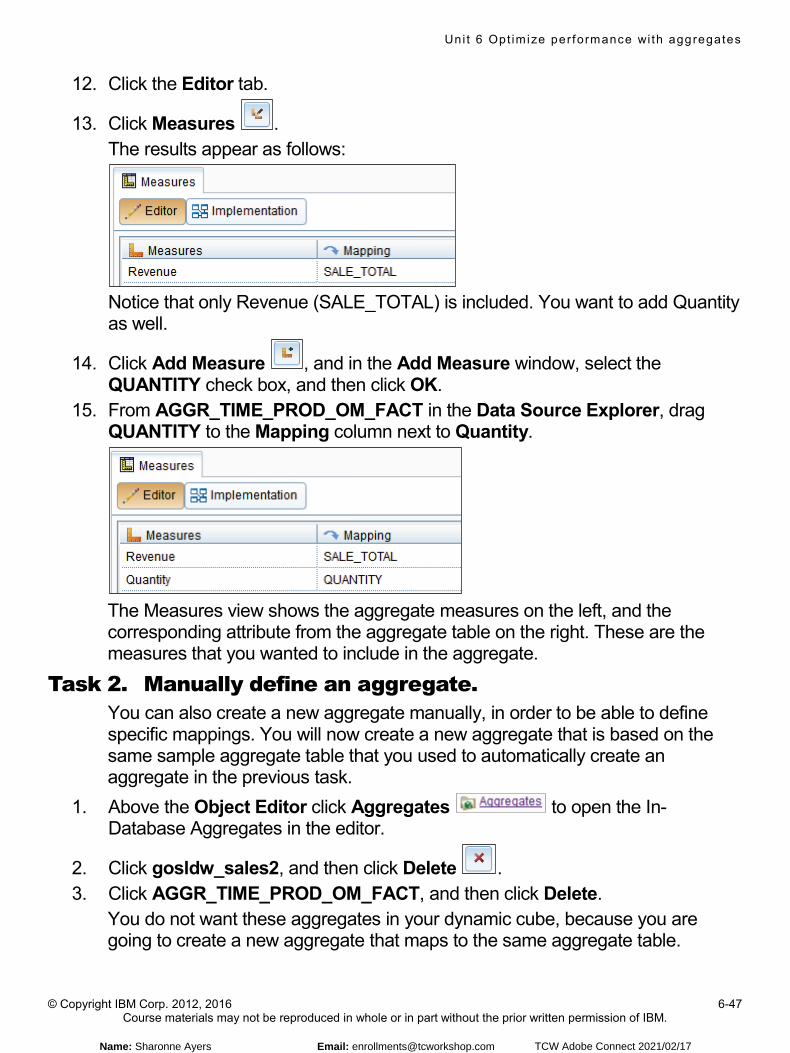
Uni t 6 Opt imize per formance wi th aggregates
© Copyright IBM Corp. 2012, 2016 6-47 Course materials may not be reproduced in whole or in part without the prior written permission of IBM.
12. Click the Editor tab.
13. Click Measures . The results appear as follows:
Notice that only Revenue (SALE_TOTAL) is included. You want to add Quantity as well.
14. Click Add Measure , and in the Add Measure window, select the QUANTITY check box, and then click OK.
15. From AGGR_TIME_PROD_OM_FACT in the Data Source Explorer, drag QUANTITY to the Mapping column next to Quantity.
The Measures view shows the aggregate measures on the left, and the corresponding attribute from the aggregate table on the right. These are the measures that you wanted to include in the aggregate.
Task 2. Manually define an aggregate. You can also create a new aggregate manually, in order to be able to define specific mappings. You will now create a new aggregate that is based on the same sample aggregate table that you used to automatically create an aggregate in the previous task.
1. Above the Object Editor click Aggregates to open the In-Database Aggregates in the editor.
2. Click gosldw_sales2, and then click Delete . 3. Click AGGR_TIME_PROD_OM_FACT, and then click Delete.
You do not want these aggregates in your dynamic cube, because you are going to create a new aggregate that maps to the same aggregate table.
Name: Sharonne Ayers Email: [email protected] TCW Adobe Connect 2021/02/17
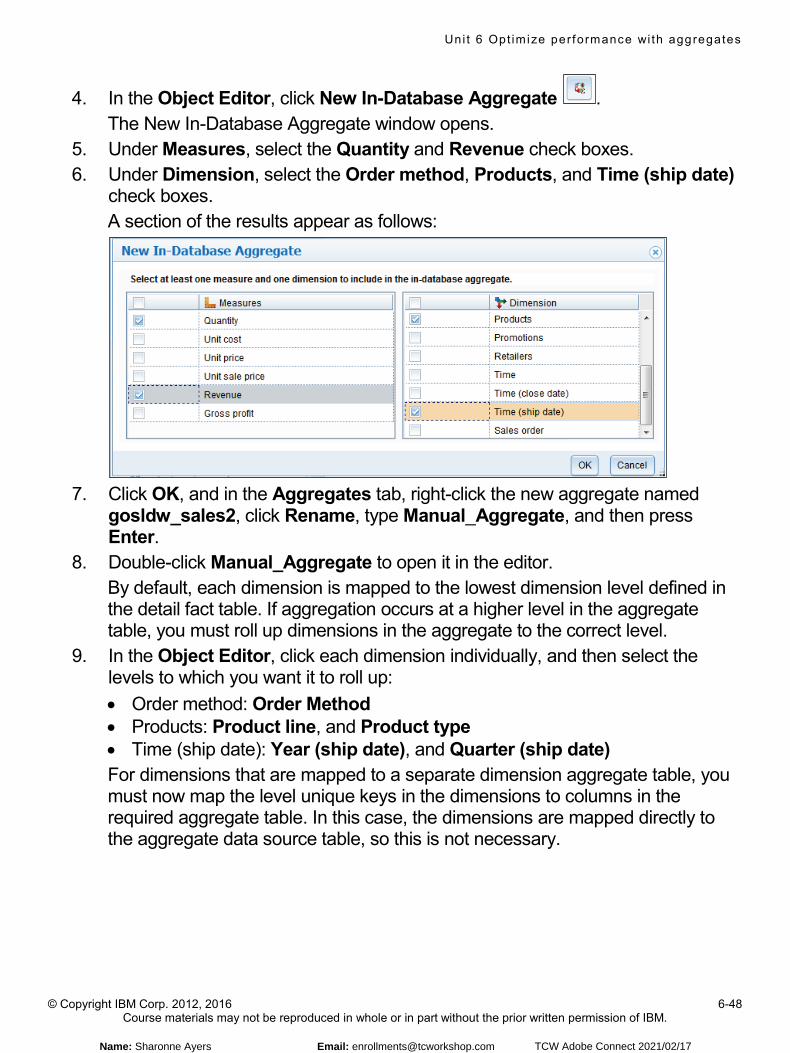
Uni t 6 Opt imize per formance wi th aggregates
© Copyright IBM Corp. 2012, 2016 6-48 Course materials may not be reproduced in whole or in part without the prior written permission of IBM.
4. In the Object Editor, click New In-Database Aggregate . The New In-Database Aggregate window opens.
5. Under Measures, select the Quantity and Revenue check boxes. 6. Under Dimension, select the Order method, Products, and Time (ship date)
check boxes. A section of the results appear as follows:
7. Click OK, and in the Aggregates tab, right-click the new aggregate named
gosldw_sales2, click Rename, type Manual_Aggregate, and then press Enter.
8. Double-click Manual_Aggregate to open it in the editor. By default, each dimension is mapped to the lowest dimension level defined in the detail fact table. If aggregation occurs at a higher level in the aggregate table, you must roll up dimensions in the aggregate to the correct level.
9. In the Object Editor, click each dimension individually, and then select the levels to which you want it to roll up: • Order method: Order Method • Products: Product line, and Product type • Time (ship date): Year (ship date), and Quarter (ship date) For dimensions that are mapped to a separate dimension aggregate table, you must now map the level unique keys in the dimensions to columns in the required aggregate table. In this case, the dimensions are mapped directly to the aggregate data source table, so this is not necessary.
Name: Sharonne Ayers Email: [email protected] TCW Adobe Connect 2021/02/17
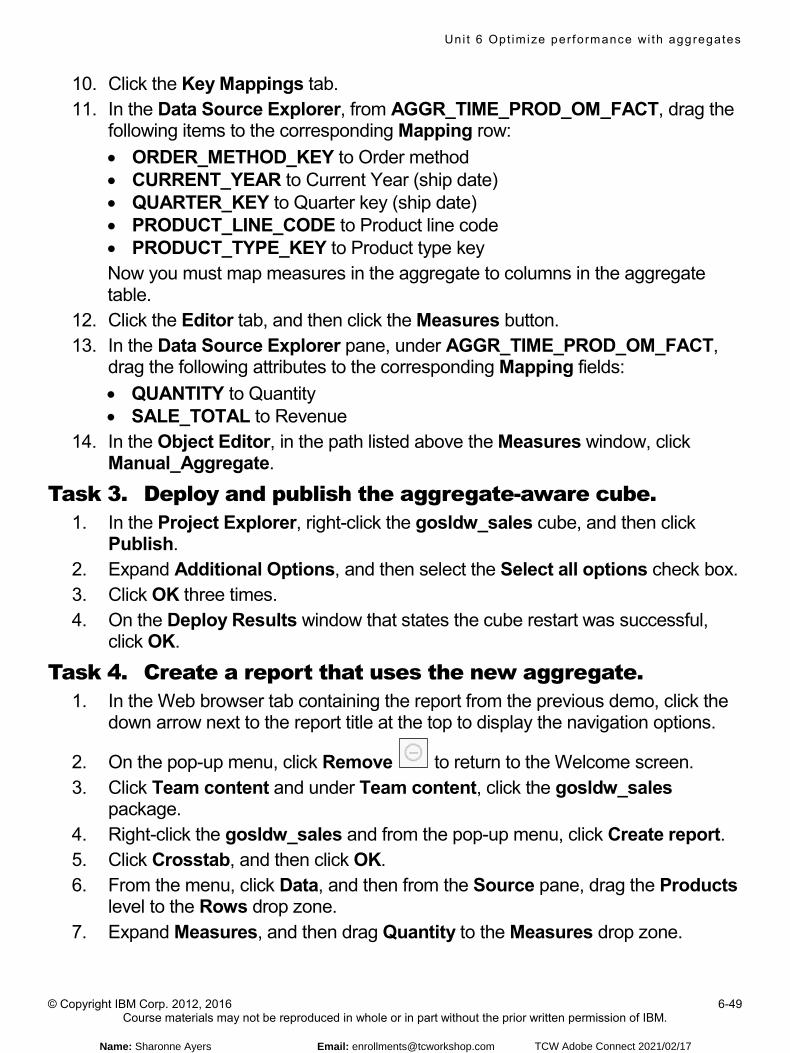
Uni t 6 Opt imize per formance wi th aggregates
© Copyright IBM Corp. 2012, 2016 6-49 Course materials may not be reproduced in whole or in part without the prior written permission of IBM.
10. Click the Key Mappings tab. 11. In the Data Source Explorer, from AGGR_TIME_PROD_OM_FACT, drag the
following items to the corresponding Mapping row: • ORDER_METHOD_KEY to Order method • CURRENT_YEAR to Current Year (ship date) • QUARTER_KEY to Quarter key (ship date) • PRODUCT_LINE_CODE to Product line code • PRODUCT_TYPE_KEY to Product type key Now you must map measures in the aggregate to columns in the aggregate table.
12. Click the Editor tab, and then click the Measures button. 13. In the Data Source Explorer pane, under AGGR_TIME_PROD_OM_FACT,
drag the following attributes to the corresponding Mapping fields: • QUANTITY to Quantity • SALE_TOTAL to Revenue
14. In the Object Editor, in the path listed above the Measures window, click Manual_Aggregate.
Task 3. Deploy and publish the aggregate-aware cube. 1. In the Project Explorer, right-click the gosldw_sales cube, and then click
Publish. 2. Expand Additional Options, and then select the Select all options check box. 3. Click OK three times. 4. On the Deploy Results window that states the cube restart was successful,
click OK.
Task 4. Create a report that uses the new aggregate. 1. In the Web browser tab containing the report from the previous demo, click the
down arrow next to the report title at the top to display the navigation options.
2. On the pop-up menu, click Remove to return to the Welcome screen. 3. Click Team content and under Team content, click the gosldw_sales
package. 4. Right-click the gosldw_sales and from the pop-up menu, click Create report. 5. Click Crosstab, and then click OK. 6. From the menu, click Data, and then from the Source pane, drag the Products
level to the Rows drop zone. 7. Expand Measures, and then drag Quantity to the Measures drop zone.
Name: Sharonne Ayers Email: [email protected] TCW Adobe Connect 2021/02/17

Uni t 6 Opt imize per formance wi th aggregates
© Copyright IBM Corp. 2012, 2016 6-50 Course materials may not be reproduced in whole or in part without the prior written permission of IBM.
8. Drag Order Method to the Columns drop zone. 9. Click Run options > Run HTML.
The report appears in a new tab. 10. On the rows, double-click the All value to drill into the products. 11. On the columns, double-click the All value to drill into the various order
methods. The report appears as follows:
Notice that the Web order method contained the largest quantity. You will use this fact in the next task.
12. Close the current tab and return to the report design tab. 13. Click Save. 14. Select My content, and in the Save as box, type Unit_6_Aggregates, and
then click Save. 15. In the Web browser, click the IBM Cognos Administration tab, and then in the
Metrics - gosldw_sales pane, click Refresh. The Aggregate table hit rate is 100%, which indicates that the data was retrieved from the aggregate table that you mapped to the aggregate in your dynamic cube.
Name: Sharonne Ayers Email: [email protected] TCW Adobe Connect 2021/02/17
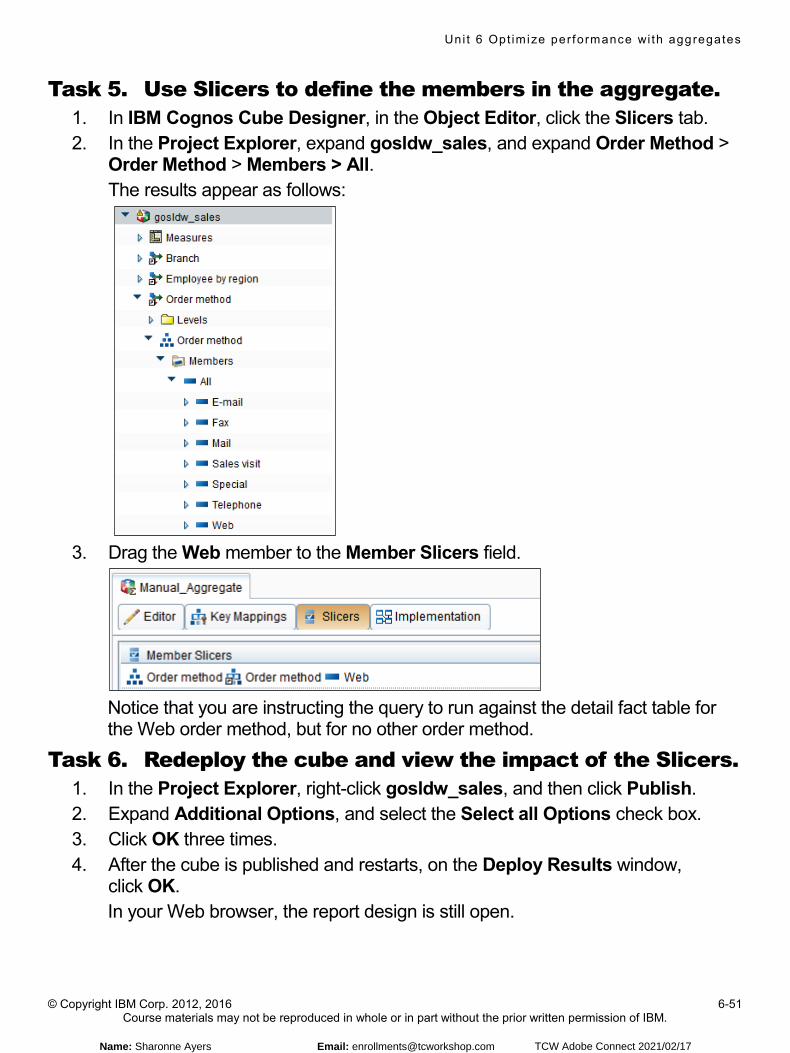
Uni t 6 Opt imize per formance wi th aggregates
© Copyright IBM Corp. 2012, 2016 6-51 Course materials may not be reproduced in whole or in part without the prior written permission of IBM.
Task 5. Use Slicers to define the members in the aggregate. 1. In IBM Cognos Cube Designer, in the Object Editor, click the Slicers tab. 2. In the Project Explorer, expand gosldw_sales, and expand Order Method >
Order Method > Members > All. The results appear as follows:
3. Drag the Web member to the Member Slicers field.
Notice that you are instructing the query to run against the detail fact table for the Web order method, but for no other order method.
Task 6. Redeploy the cube and view the impact of the Slicers. 1. In the Project Explorer, right-click gosldw_sales, and then click Publish. 2. Expand Additional Options, and select the Select all Options check box. 3. Click OK three times. 4. After the cube is published and restarts, on the Deploy Results window,
click OK. In your Web browser, the report design is still open.
Name: Sharonne Ayers Email: [email protected] TCW Adobe Connect 2021/02/17
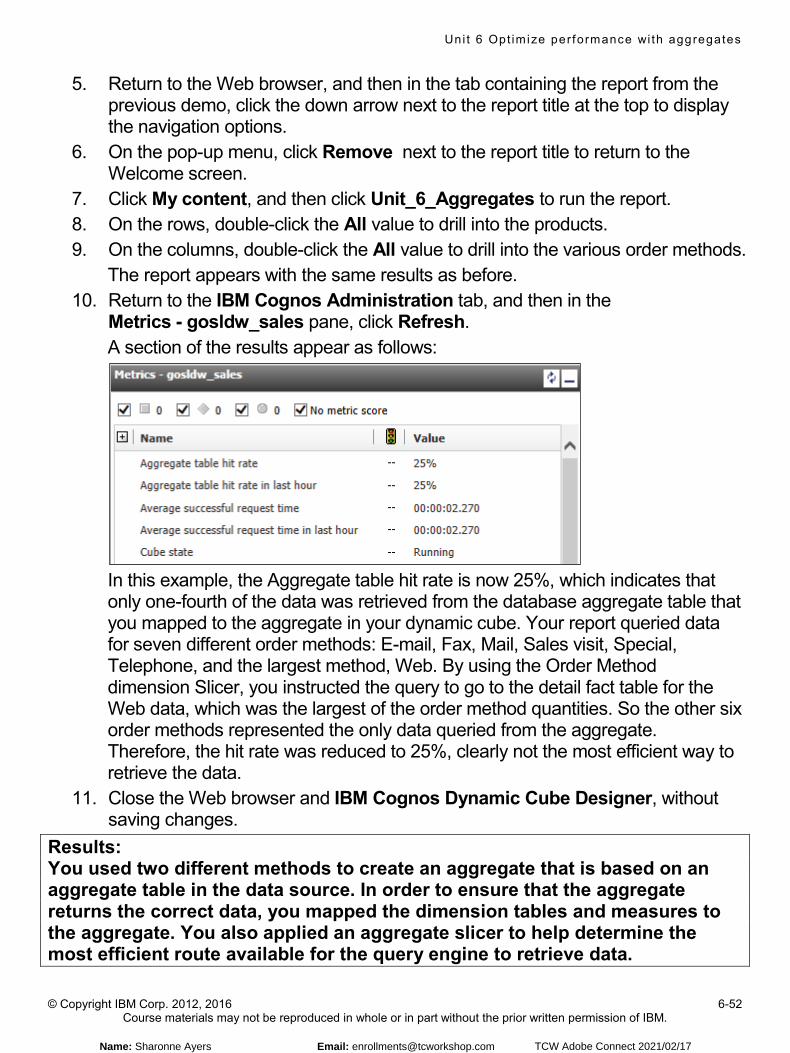
Uni t 6 Opt imize per formance wi th aggregates
© Copyright IBM Corp. 2012, 2016 6-52 Course materials may not be reproduced in whole or in part without the prior written permission of IBM.
5. Return to the Web browser, and then in the tab containing the report from the previous demo, click the down arrow next to the report title at the top to display the navigation options.
6. On the pop-up menu, click Remove next to the report title to return to the Welcome screen.
7. Click My content, and then click Unit_6_Aggregates to run the report. 8. On the rows, double-click the All value to drill into the products. 9. On the columns, double-click the All value to drill into the various order methods.
The report appears with the same results as before. 10. Return to the IBM Cognos Administration tab, and then in the
Metrics - gosldw_sales pane, click Refresh. A section of the results appear as follows:
In this example, the Aggregate table hit rate is now 25%, which indicates that only one-fourth of the data was retrieved from the database aggregate table that you mapped to the aggregate in your dynamic cube. Your report queried data for seven different order methods: E-mail, Fax, Mail, Sales visit, Special, Telephone, and the largest method, Web. By using the Order Method dimension Slicer, you instructed the query to go to the detail fact table for the Web data, which was the largest of the order method quantities. So the other six order methods represented the only data queried from the aggregate. Therefore, the hit rate was reduced to 25%, clearly not the most efficient way to retrieve the data.
11. Close the Web browser and IBM Cognos Dynamic Cube Designer, without saving changes.
Results: You used two different methods to create an aggregate that is based on an aggregate table in the data source. In order to ensure that the aggregate returns the correct data, you mapped the dimension tables and measures to the aggregate. You also applied an aggregate slicer to help determine the most efficient route available for the query engine to retrieve data.
Name: Sharonne Ayers Email: [email protected] TCW Adobe Connect 2021/02/17

Define security
© Copyright IBM Corporation 2016Course materials may not be reproduced in whole or in part without the written permission of IBM.
Define security
IBM Cognos Dynamic Cubes
Name: Sharonne Ayers Email: [email protected] TCW Adobe Connect 2021/02/17
Uni t 7 Def ine secur i t y
© Copyright IBM Corp. 2012, 2016 7-20 Course materials may not be reproduced in whole or in part without the prior written permission of IBM.
© Copyright IBM Corporation 2016Define security
Demonstration 1
Use security filters to define hierarchy security views
Demonstration 1: Use security filters to define hierarchy security views
Name: Sharonne Ayers Email: [email protected] TCW Adobe Connect 2021/02/17

Uni t 7 Def ine secur i t y
© Copyright IBM Corp. 2012, 2016 7-21 Course materials may not be reproduced in whole or in part without the prior written permission of IBM.
Demonstration 1: Use security filters to define hierarchy security views
Purpose: Your company outsources the production of their Personal Accessories product line to an overseas manufacturing company. You want to configure security on the gosldw_sales cube to restrict the access of outsourcing resources so that they can only see sales for the Personal Accessories product line. You will create role-based security by creating a security filter and a view to restrict access.
Task 1. Publish the model cube. 1. Open IBM Cognos Cube Designer, click Open Existing, and then from
C:\Training\B6063\Start Files\07\Demo 1\, double-click model.fmd. 2. Authenticate as admin/Education1, and then expand Model. 3. Right-click the gosldw_sales cube, and then click Publish. 4. In the Publish window, expand Additional Options, select the Select all
options check box, and then click OK three times. 5. When the message window appears indicating a successful cube restart,
click OK.
Task 2. View a report as an unrestricted user. 1. Open a Web browser, navigate to http://vclassbase:9300/bi/v1/disp, and then
authenticate as admin/Education1. 2. From the menu, click Team content, click the gosldw_sales package, and
then click the ellipsis to the right of the gosldw_sales package. 3. Click Create report, and then double-click Crosstab. 4. On the menu, click Data, and then on the Source pane, expand Measures, and
then drag the Revenue measure to the Measures drop zone. 5. From the Source pane, drag the Time member to the Columns drop zone. 6. From the Source pane, drag the Products level to the Rows drop zone.
A section of the results appear as follows:
7. From the Run options menu, click Run HTML.
Name: Sharonne Ayers Email: [email protected] TCW Adobe Connect 2021/02/17
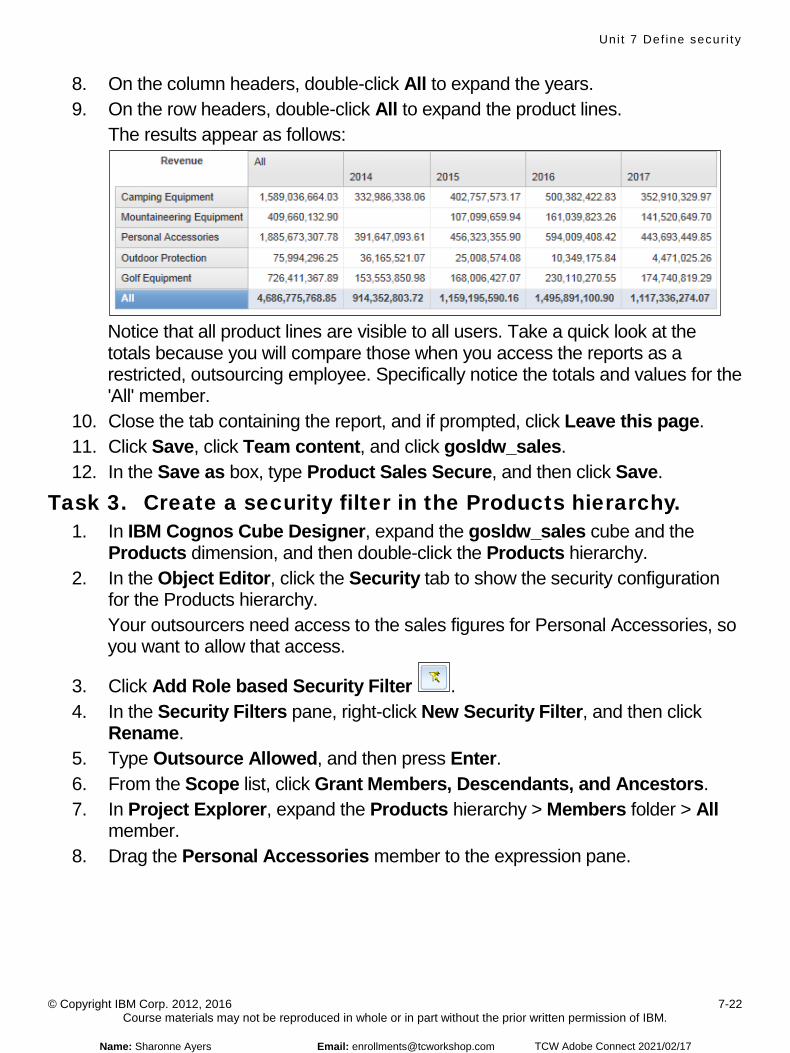
Uni t 7 Def ine secur i t y
© Copyright IBM Corp. 2012, 2016 7-22 Course materials may not be reproduced in whole or in part without the prior written permission of IBM.
8. On the column headers, double-click All to expand the years. 9. On the row headers, double-click All to expand the product lines.
The results appear as follows:
Notice that all product lines are visible to all users. Take a quick look at the totals because you will compare those when you access the reports as a restricted, outsourcing employee. Specifically notice the totals and values for the 'All' member.
10. Close the tab containing the report, and if prompted, click Leave this page. 11. Click Save, click Team content, and click gosldw_sales. 12. In the Save as box, type Product Sales Secure, and then click Save.
Task 3. Create a security filter in the Products hierarchy. 1. In IBM Cognos Cube Designer, expand the gosldw_sales cube and the
Products dimension, and then double-click the Products hierarchy. 2. In the Object Editor, click the Security tab to show the security configuration
for the Products hierarchy. Your outsourcers need access to the sales figures for Personal Accessories, so you want to allow that access.
3. Click Add Role based Security Filter . 4. In the Security Filters pane, right-click New Security Filter, and then click
Rename. 5. Type Outsource Allowed, and then press Enter. 6. From the Scope list, click Grant Members, Descendants, and Ancestors. 7. In Project Explorer, expand the Products hierarchy > Members folder > All
member. 8. Drag the Personal Accessories member to the expression pane.
Name: Sharonne Ayers Email: [email protected] TCW Adobe Connect 2021/02/17
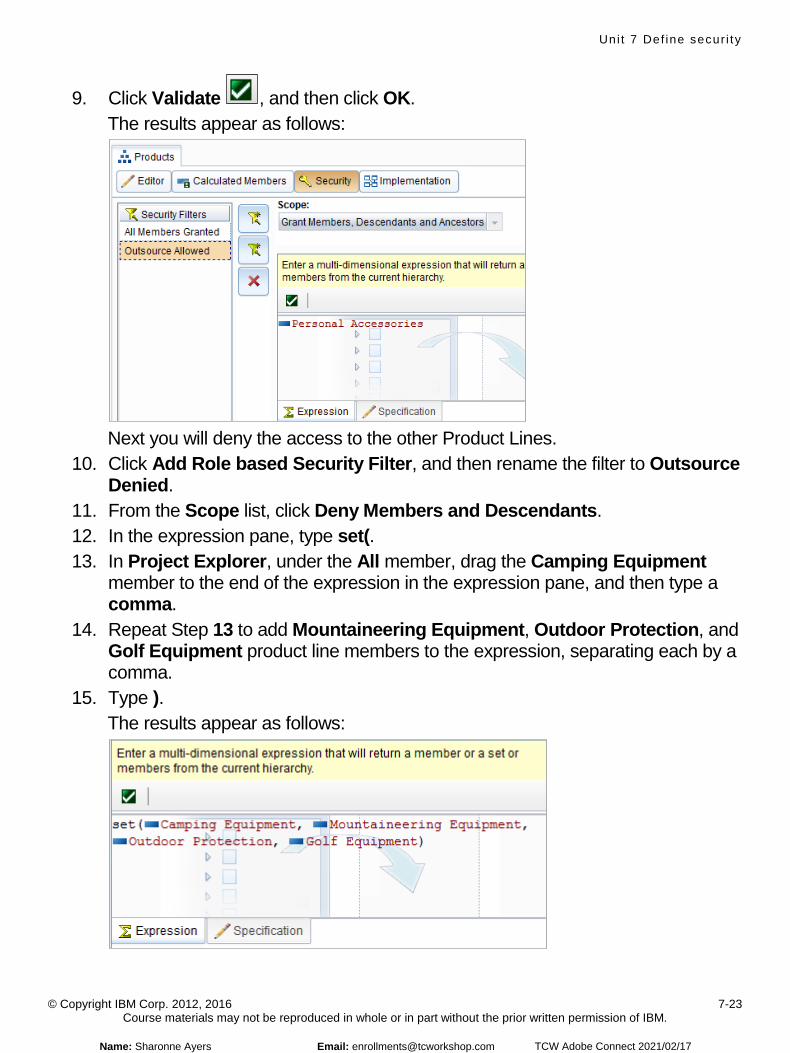
Uni t 7 Def ine secur i t y
© Copyright IBM Corp. 2012, 2016 7-23 Course materials may not be reproduced in whole or in part without the prior written permission of IBM.
9. Click Validate , and then click OK. The results appear as follows:
Next you will deny the access to the other Product Lines.
10. Click Add Role based Security Filter, and then rename the filter to Outsource Denied.
11. From the Scope list, click Deny Members and Descendants. 12. In the expression pane, type set(. 13. In Project Explorer, under the All member, drag the Camping Equipment
member to the end of the expression in the expression pane, and then type a comma.
14. Repeat Step 13 to add Mountaineering Equipment, Outdoor Protection, and Golf Equipment product line members to the expression, separating each by a comma.
15. Type ). The results appear as follows:
Name: Sharonne Ayers Email: [email protected] TCW Adobe Connect 2021/02/17
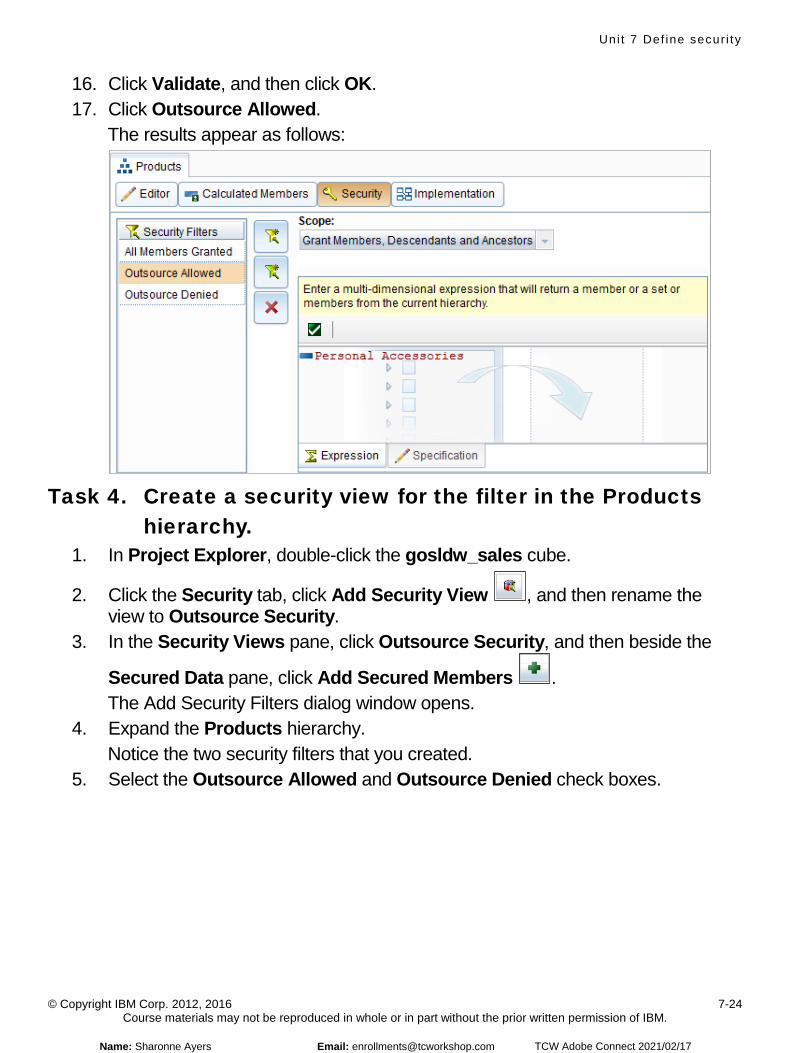
Uni t 7 Def ine secur i t y
© Copyright IBM Corp. 2012, 2016 7-24 Course materials may not be reproduced in whole or in part without the prior written permission of IBM.
16. Click Validate, and then click OK. 17. Click Outsource Allowed.
The results appear as follows:
Task 4. Create a security view for the filter in the Products
hierarchy. 1. In Project Explorer, double-click the gosldw_sales cube.
2. Click the Security tab, click Add Security View , and then rename the view to Outsource Security.
3. In the Security Views pane, click Outsource Security, and then beside the
Secured Data pane, click Add Secured Members . The Add Security Filters dialog window opens.
4. Expand the Products hierarchy. Notice the two security filters that you created.
5. Select the Outsource Allowed and Outsource Denied check boxes.
Name: Sharonne Ayers Email: [email protected] TCW Adobe Connect 2021/02/17
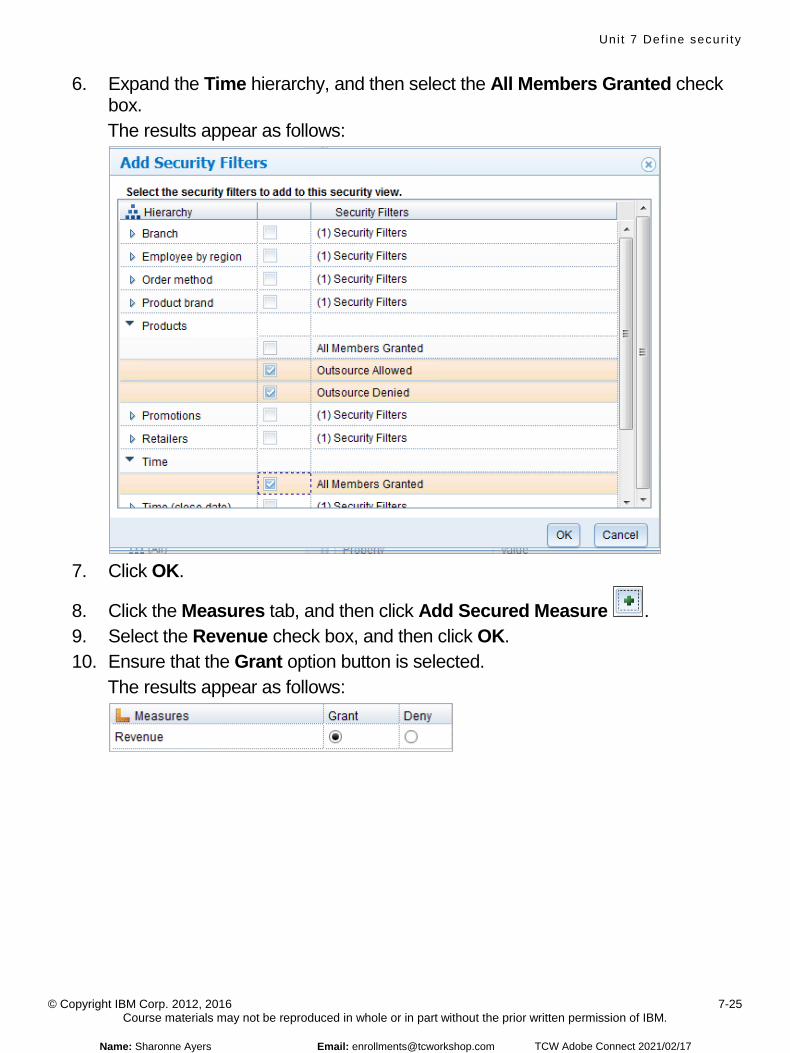
Uni t 7 Def ine secur i t y
© Copyright IBM Corp. 2012, 2016 7-25 Course materials may not be reproduced in whole or in part without the prior written permission of IBM.
6. Expand the Time hierarchy, and then select the All Members Granted check box. The results appear as follows:
7. Click OK.
8. Click the Measures tab, and then click Add Secured Measure . 9. Select the Revenue check box, and then click OK. 10. Ensure that the Grant option button is selected.
The results appear as follows:
Name: Sharonne Ayers Email: [email protected] TCW Adobe Connect 2021/02/17
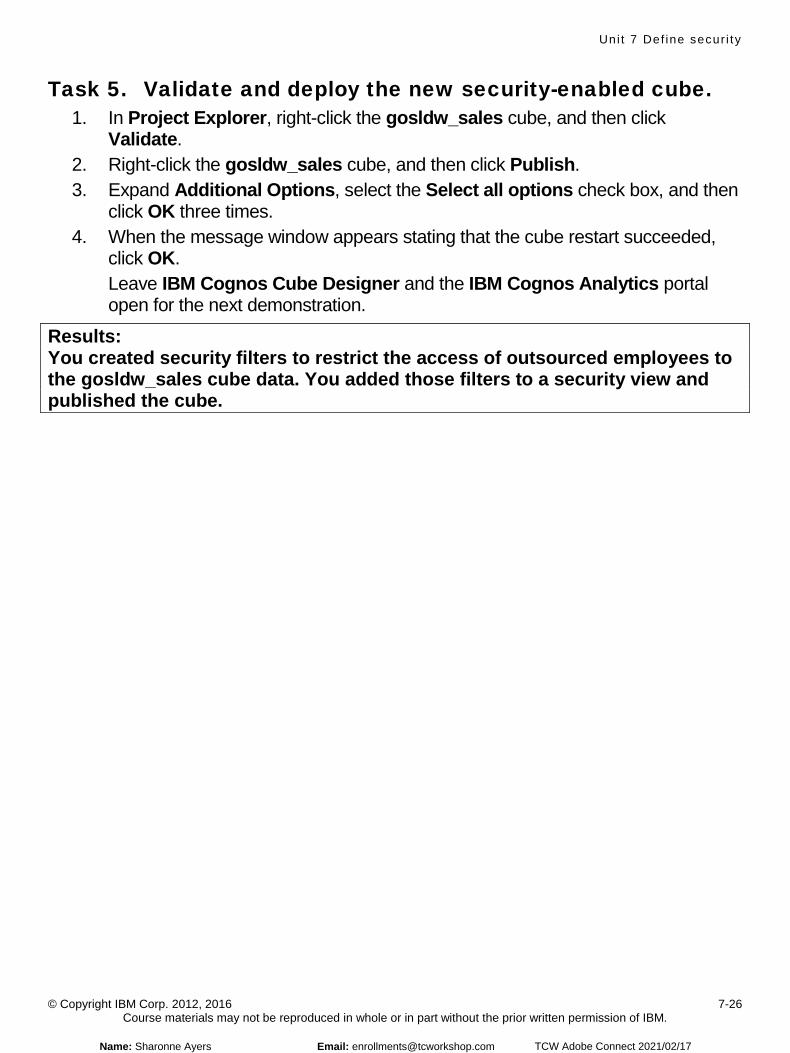
Uni t 7 Def ine secur i t y
© Copyright IBM Corp. 2012, 2016 7-26 Course materials may not be reproduced in whole or in part without the prior written permission of IBM.
Task 5. Validate and deploy the new security-enabled cube. 1. In Project Explorer, right-click the gosldw_sales cube, and then click
Validate. 2. Right-click the gosldw_sales cube, and then click Publish. 3. Expand Additional Options, select the Select all options check box, and then
click OK three times. 4. When the message window appears stating that the cube restart succeeded,
click OK. Leave IBM Cognos Cube Designer and the IBM Cognos Analytics portal open for the next demonstration.
Results: You created security filters to restrict the access of outsourced employees to the gosldw_sales cube data. You added those filters to a security view and published the cube.
Name: Sharonne Ayers Email: [email protected] TCW Adobe Connect 2021/02/17
Uni t 7 Def ine secur i t y
© Copyright IBM Corp. 2012, 2016 7-27 Course materials may not be reproduced in whole or in part without the prior written permission of IBM.
© Copyright IBM Corporation 2016Define security
Demonstration 2
Assign users and groups to security views
Demonstration 2: Assign users and groups to security views
Name: Sharonne Ayers Email: [email protected] TCW Adobe Connect 2021/02/17
Uni t 7 Def ine secur i t y
© Copyright IBM Corp. 2012, 2016 7-28 Course materials may not be reproduced in whole or in part without the prior written permission of IBM.
Demonstration 2: Assign users and groups to security views Purpose: You want to assign outsourced company users to the new security views that you created, and then test their access to the secured data. For the purpose of this demonstration, assume that Frank Bretton is the designated user from your company's outsourced partner.
Task 1. Specify security for the cube as a data source. Next you will add an outsourced user, Frank Bretton, to the security view.
1. In the web browser, click the down arrow next to the report title, and select Welcome.
2. From the menu, click Manage > Administration console. 3. Click the Configuration tab, and then click the gosldw_sales data source. 4. Click model.
Notice the Outsource Security view associated with the cube.
5. Under the Actions column, click Set Properties - Outsource Security . 6. Select the Override the access permissions acquired from the parent entry
check box. 7. Select the Everyone check box, and then click Remove. 8. Click Add, click LDAP, and then click People. 9. Select the Show users in the list check box.
10. Click Next Page , select the Frank Bretton check box, and then click Add .
11. Click OK. 12. Select the Frank Bretton check box.
Name: Sharonne Ayers Email: [email protected] TCW Adobe Connect 2021/02/17
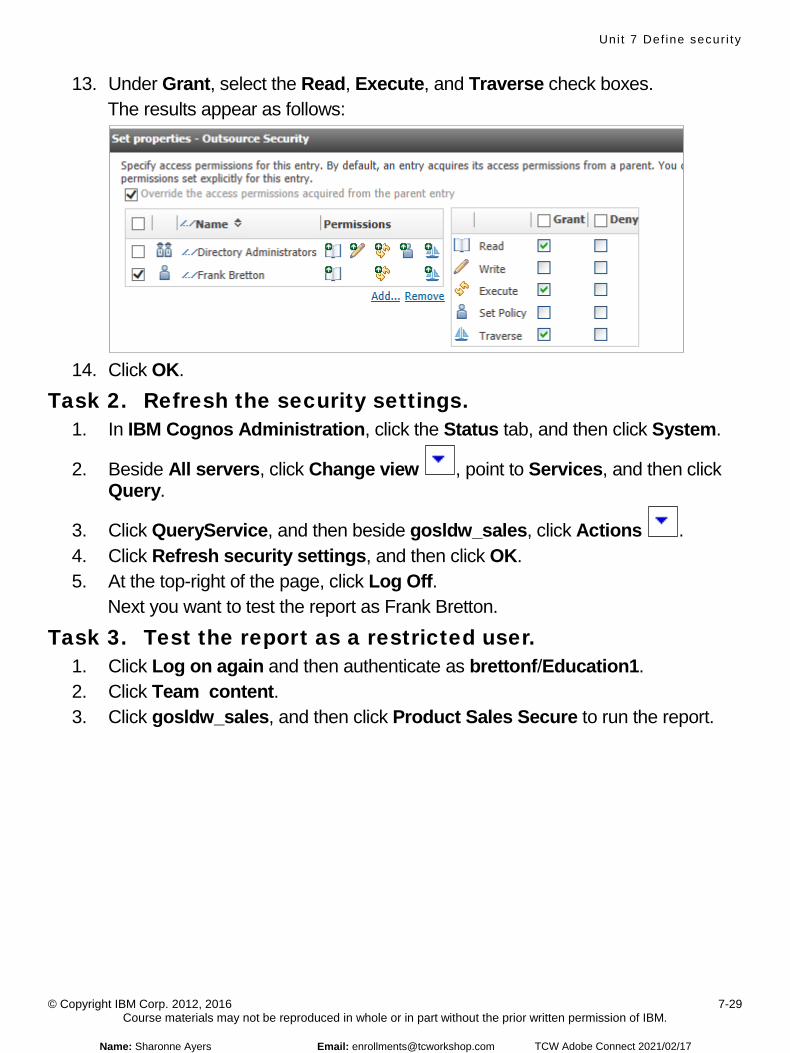
Uni t 7 Def ine secur i t y
© Copyright IBM Corp. 2012, 2016 7-29 Course materials may not be reproduced in whole or in part without the prior written permission of IBM.
13. Under Grant, select the Read, Execute, and Traverse check boxes. The results appear as follows:
14. Click OK.
Task 2. Refresh the security settings. 1. In IBM Cognos Administration, click the Status tab, and then click System.
2. Beside All servers, click Change view , point to Services, and then click Query.
3. Click QueryService, and then beside gosldw_sales, click Actions . 4. Click Refresh security settings, and then click OK. 5. At the top-right of the page, click Log Off.
Next you want to test the report as Frank Bretton.
Task 3. Test the report as a restricted user. 1. Click Log on again and then authenticate as brettonf/Education1. 2. Click Team content. 3. Click gosldw_sales, and then click Product Sales Secure to run the report.
Name: Sharonne Ayers Email: [email protected] TCW Adobe Connect 2021/02/17
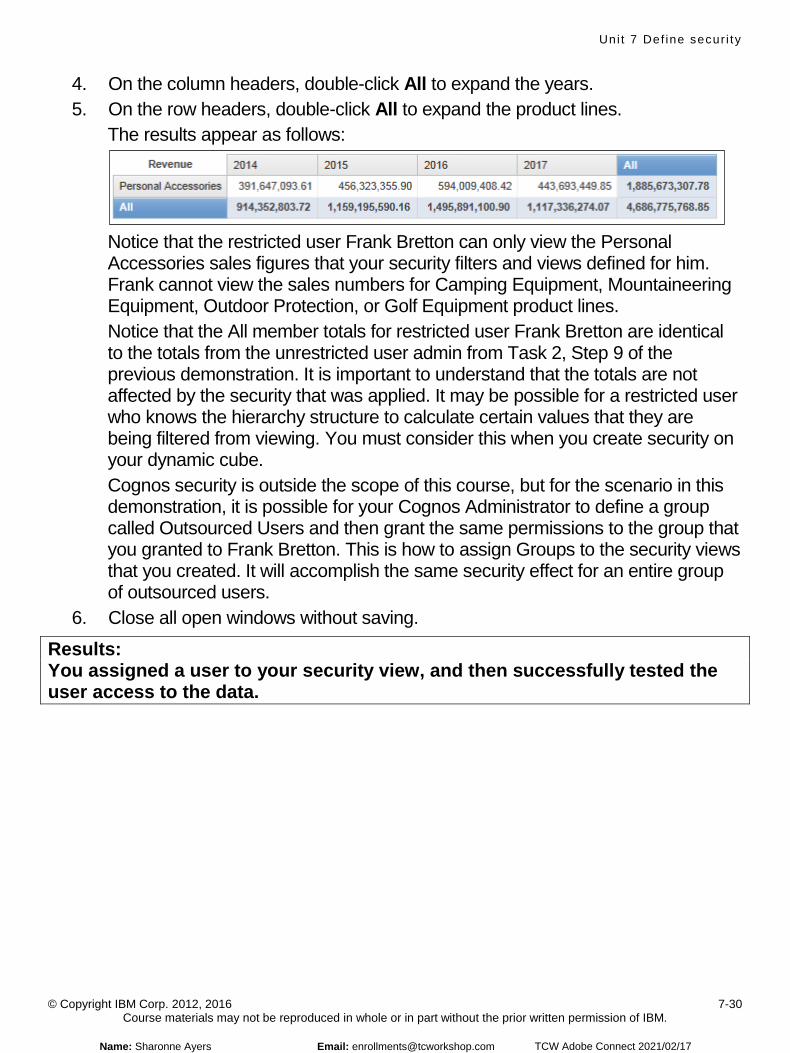
Uni t 7 Def ine secur i t y
© Copyright IBM Corp. 2012, 2016 7-30 Course materials may not be reproduced in whole or in part without the prior written permission of IBM.
4. On the column headers, double-click All to expand the years. 5. On the row headers, double-click All to expand the product lines.
The results appear as follows:
Notice that the restricted user Frank Bretton can only view the Personal Accessories sales figures that your security filters and views defined for him. Frank cannot view the sales numbers for Camping Equipment, Mountaineering Equipment, Outdoor Protection, or Golf Equipment product lines. Notice that the All member totals for restricted user Frank Bretton are identical to the totals from the unrestricted user admin from Task 2, Step 9 of the previous demonstration. It is important to understand that the totals are not affected by the security that was applied. It may be possible for a restricted user who knows the hierarchy structure to calculate certain values that they are being filtered from viewing. You must consider this when you create security on your dynamic cube. Cognos security is outside the scope of this course, but for the scenario in this demonstration, it is possible for your Cognos Administrator to define a group called Outsourced Users and then grant the same permissions to the group that you granted to Frank Bretton. This is how to assign Groups to the security views that you created. It will accomplish the same security effect for an entire group of outsourced users.
6. Close all open windows without saving.
Results: You assigned a user to your security view, and then successfully tested the user access to the data.
Name: Sharonne Ayers Email: [email protected] TCW Adobe Connect 2021/02/17
Model a virtual cube
© Copyright IBM Corporation 2016Course materials may not be reproduced in whole or in part without the written permission of IBM.
Model a virtual cube
IBM Cognos Dynamic Cubes
Name: Sharonne Ayers Email: [email protected] TCW Adobe Connect 2021/02/17

Uni t 8 Model a v i r tua l cube
© Copyright IBM Corp. 2012, 2016 8-2 Course materials may not be reproduced in whole or in part without the prior written permission of IBM.
Name: Sharonne Ayers Email: [email protected] TCW Adobe Connect 2021/02/17

Uni t 8 Model a v i r tua l cube
© Copyright IBM Corp. 2012, 2016 8-18 Course materials may not be reproduced in whole or in part without the prior written permission of IBM.
© Copyright IBM Corporation 2016Model a virtual cube
Demonstration 1
Model a virtual cube
Demonstration 1: Model a virtual cube
Name: Sharonne Ayers Email: [email protected] TCW Adobe Connect 2021/02/17
Uni t 8 Model a v i r tua l cube
© Copyright IBM Corp. 2012, 2016 8-19 Course materials may not be reproduced in whole or in part without the prior written permission of IBM.
Demonstration 1: Model a virtual cube Purpose: You want to create a new cube to combine into a virtual cube. You will create a new cube called Sales Targets that uses a separate Order Month time dimension. Then you will deploy and test the cube by creating a report against it. Finally, you will combine the new Sales Targets cube and your Product Sales cube into one virtual cube called Sales vs Targets.
Task 1. Create a Sales Targets cube and its measure. 1. Start IBM Cognos Cube Designer, and then click Open Existing. 2. From C:\Training\B6063\Start Files\08\Demo 1, open Product Sales.fmd,
and then authenticate as admin/Education1. 3. In Project Explorer, expand Model, click Model, and then on the Project
Explorer toolbar, click New Cube . 4. Type Sales Targets and then press Enter. 5. Expand the Sales Targets cube and then double-click the Measures folder to
open it in the Object Editor. 6. In the Data Source Explorer, expand GOSALESDW > Tables >
SLS_SALES_TARG_FACT. 7. Drag SALES_TARGET to the Object Editor.
Task 2. Add the Order Month time dimension to the cube. 1. In the Project Explorer, double-click the Sales Targets cube.
2. In the Object Editor, click New Dimension , and then name it Order Month.
3. Click the Order Month dimension, and then set the Dimension Type property to Time.
4. In Project Explorer, expand the Order Month dimension if necessary, and the Levels folder.
5. Rename New Hierarchy to Order Month_H, rename New Level to Month, and then set its Level Type property to Months.
6. Right-click the Levels folder, point to New, and then click Level. 7. Rename it to Quarter, and then set its Level Type property to Quarters. 8. Right-click the Levels folder, point to New, and then click Level. 9. Rename it to Year, and then set its Level Type property to Years.
Name: Sharonne Ayers Email: [email protected] TCW Adobe Connect 2021/02/17
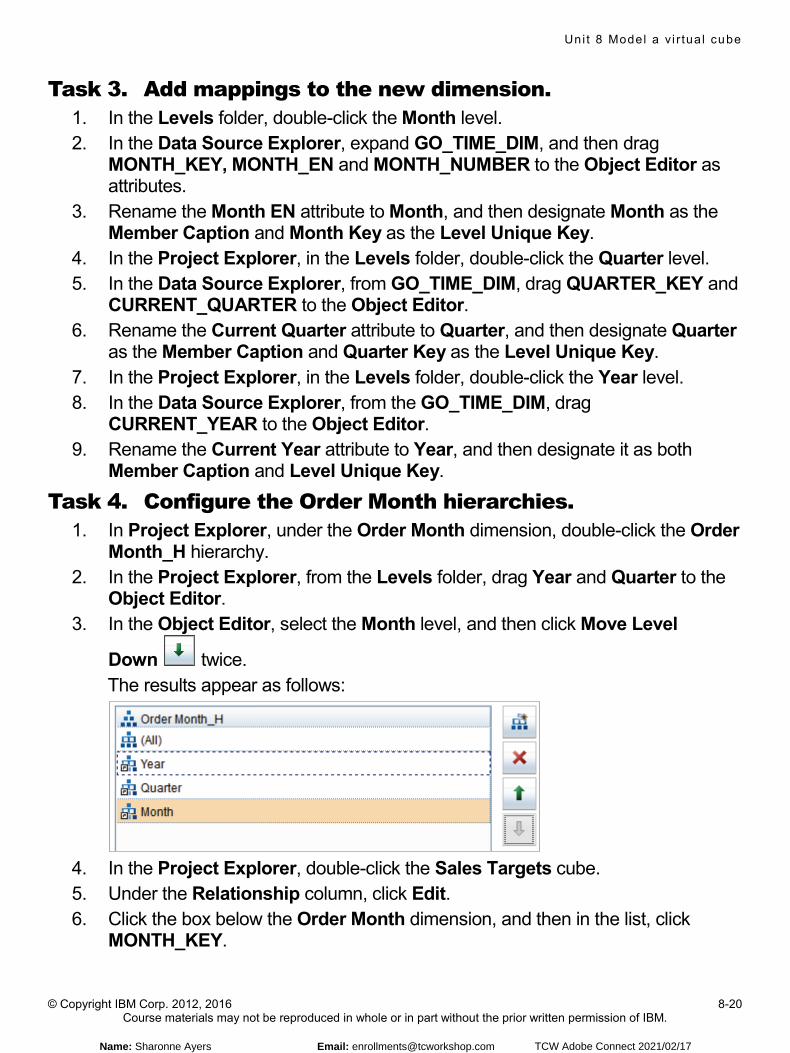
Uni t 8 Model a v i r tua l cube
© Copyright IBM Corp. 2012, 2016 8-20 Course materials may not be reproduced in whole or in part without the prior written permission of IBM.
Task 3. Add mappings to the new dimension. 1. In the Levels folder, double-click the Month level. 2. In the Data Source Explorer, expand GO_TIME_DIM, and then drag
MONTH_KEY, MONTH_EN and MONTH_NUMBER to the Object Editor as attributes.
3. Rename the Month EN attribute to Month, and then designate Month as the Member Caption and Month Key as the Level Unique Key.
4. In the Project Explorer, in the Levels folder, double-click the Quarter level. 5. In the Data Source Explorer, from GO_TIME_DIM, drag QUARTER_KEY and
CURRENT_QUARTER to the Object Editor. 6. Rename the Current Quarter attribute to Quarter, and then designate Quarter
as the Member Caption and Quarter Key as the Level Unique Key. 7. In the Project Explorer, in the Levels folder, double-click the Year level. 8. In the Data Source Explorer, from the GO_TIME_DIM, drag
CURRENT_YEAR to the Object Editor. 9. Rename the Current Year attribute to Year, and then designate it as both
Member Caption and Level Unique Key.
Task 4. Configure the Order Month hierarchies. 1. In Project Explorer, under the Order Month dimension, double-click the Order
Month_H hierarchy. 2. In the Project Explorer, from the Levels folder, drag Year and Quarter to the
Object Editor. 3. In the Object Editor, select the Month level, and then click Move Level
Down twice. The results appear as follows:
4. In the Project Explorer, double-click the Sales Targets cube. 5. Under the Relationship column, click Edit. 6. Click the box below the Order Month dimension, and then in the list, click
MONTH_KEY.
Name: Sharonne Ayers Email: [email protected] TCW Adobe Connect 2021/02/17
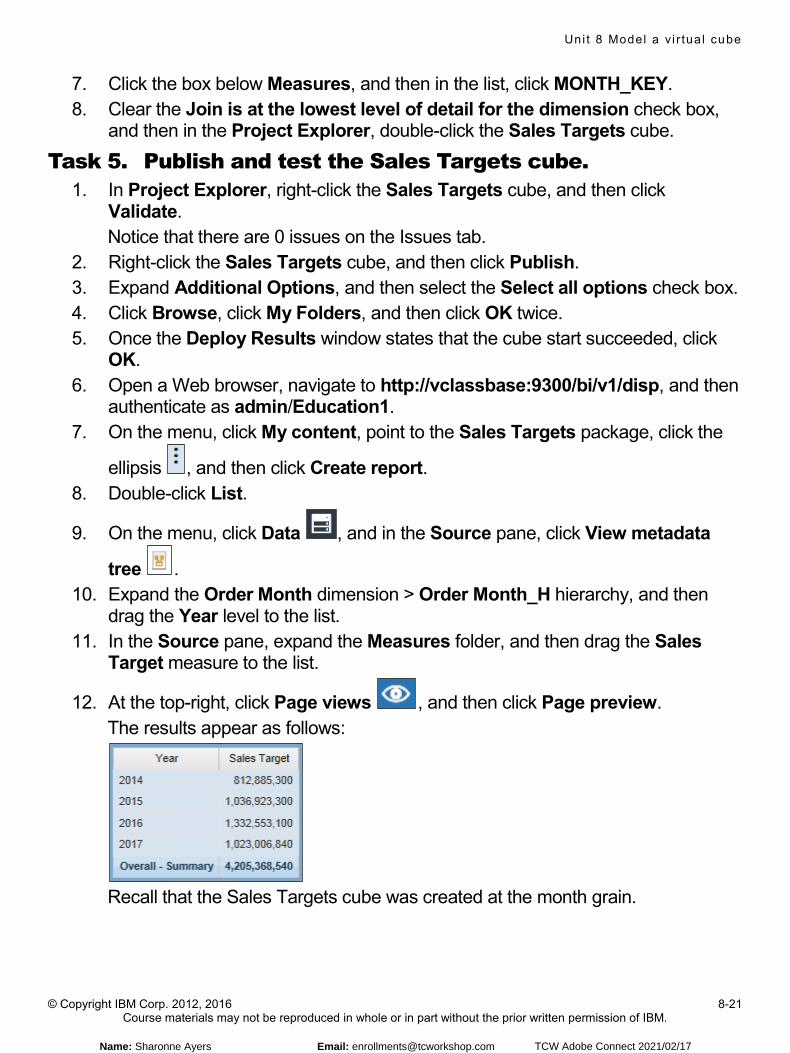
Uni t 8 Model a v i r tua l cube
© Copyright IBM Corp. 2012, 2016 8-21 Course materials may not be reproduced in whole or in part without the prior written permission of IBM.
7. Click the box below Measures, and then in the list, click MONTH_KEY. 8. Clear the Join is at the lowest level of detail for the dimension check box,
and then in the Project Explorer, double-click the Sales Targets cube.
Task 5. Publish and test the Sales Targets cube. 1. In Project Explorer, right-click the Sales Targets cube, and then click
Validate. Notice that there are 0 issues on the Issues tab.
2. Right-click the Sales Targets cube, and then click Publish. 3. Expand Additional Options, and then select the Select all options check box. 4. Click Browse, click My Folders, and then click OK twice. 5. Once the Deploy Results window states that the cube start succeeded, click
OK. 6. Open a Web browser, navigate to http://vclassbase:9300/bi/v1/disp, and then
authenticate as admin/Education1. 7. On the menu, click My content, point to the Sales Targets package, click the
ellipsis , and then click Create report. 8. Double-click List.
9. On the menu, click Data , and in the Source pane, click View metadata
tree . 10. Expand the Order Month dimension > Order Month_H hierarchy, and then
drag the Year level to the list. 11. In the Source pane, expand the Measures folder, and then drag the Sales
Target measure to the list.
12. At the top-right, click Page views , and then click Page preview. The results appear as follows:
Recall that the Sales Targets cube was created at the month grain.
Name: Sharonne Ayers Email: [email protected] TCW Adobe Connect 2021/02/17
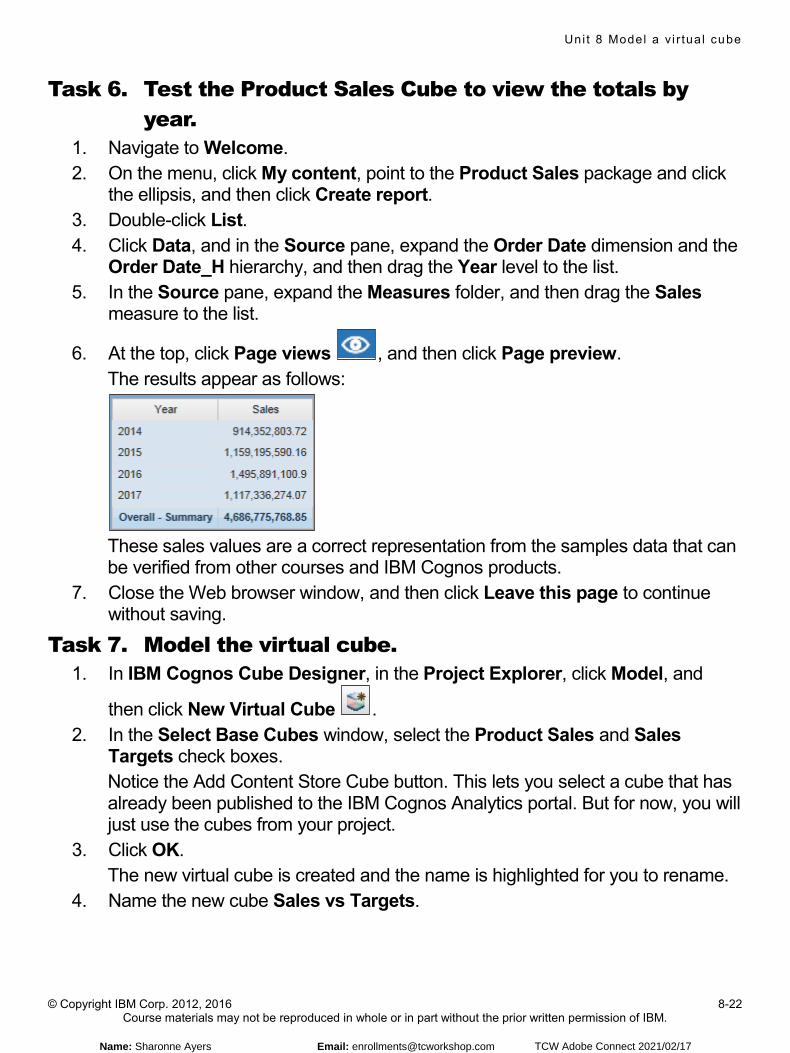
Uni t 8 Model a v i r tua l cube
© Copyright IBM Corp. 2012, 2016 8-22 Course materials may not be reproduced in whole or in part without the prior written permission of IBM.
Task 6. Test the Product Sales Cube to view the totals by year.
1. Navigate to Welcome. 2. On the menu, click My content, point to the Product Sales package and click
the ellipsis, and then click Create report. 3. Double-click List. 4. Click Data, and in the Source pane, expand the Order Date dimension and the
Order Date_H hierarchy, and then drag the Year level to the list. 5. In the Source pane, expand the Measures folder, and then drag the Sales
measure to the list.
6. At the top, click Page views , and then click Page preview. The results appear as follows:
These sales values are a correct representation from the samples data that can be verified from other courses and IBM Cognos products.
7. Close the Web browser window, and then click Leave this page to continue without saving.
Task 7. Model the virtual cube. 1. In IBM Cognos Cube Designer, in the Project Explorer, click Model, and
then click New Virtual Cube . 2. In the Select Base Cubes window, select the Product Sales and Sales
Targets check boxes. Notice the Add Content Store Cube button. This lets you select a cube that has already been published to the IBM Cognos Analytics portal. But for now, you will just use the cubes from your project.
3. Click OK. The new virtual cube is created and the name is highlighted for you to rename.
4. Name the new cube Sales vs Targets.
Name: Sharonne Ayers Email: [email protected] TCW Adobe Connect 2021/02/17
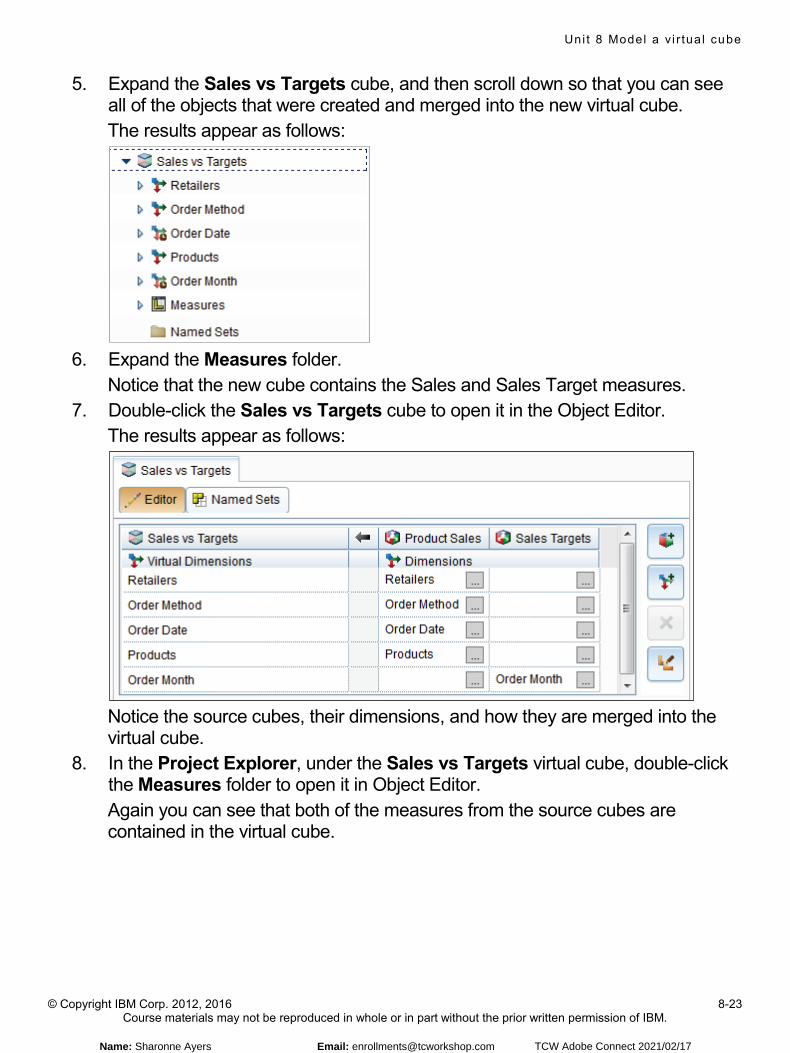
Uni t 8 Model a v i r tua l cube
© Copyright IBM Corp. 2012, 2016 8-23 Course materials may not be reproduced in whole or in part without the prior written permission of IBM.
5. Expand the Sales vs Targets cube, and then scroll down so that you can see all of the objects that were created and merged into the new virtual cube. The results appear as follows:
6. Expand the Measures folder.
Notice that the new cube contains the Sales and Sales Target measures. 7. Double-click the Sales vs Targets cube to open it in the Object Editor.
The results appear as follows:
Notice the source cubes, their dimensions, and how they are merged into the virtual cube.
8. In the Project Explorer, under the Sales vs Targets virtual cube, double-click the Measures folder to open it in Object Editor. Again you can see that both of the measures from the source cubes are contained in the virtual cube.
Name: Sharonne Ayers Email: [email protected] TCW Adobe Connect 2021/02/17
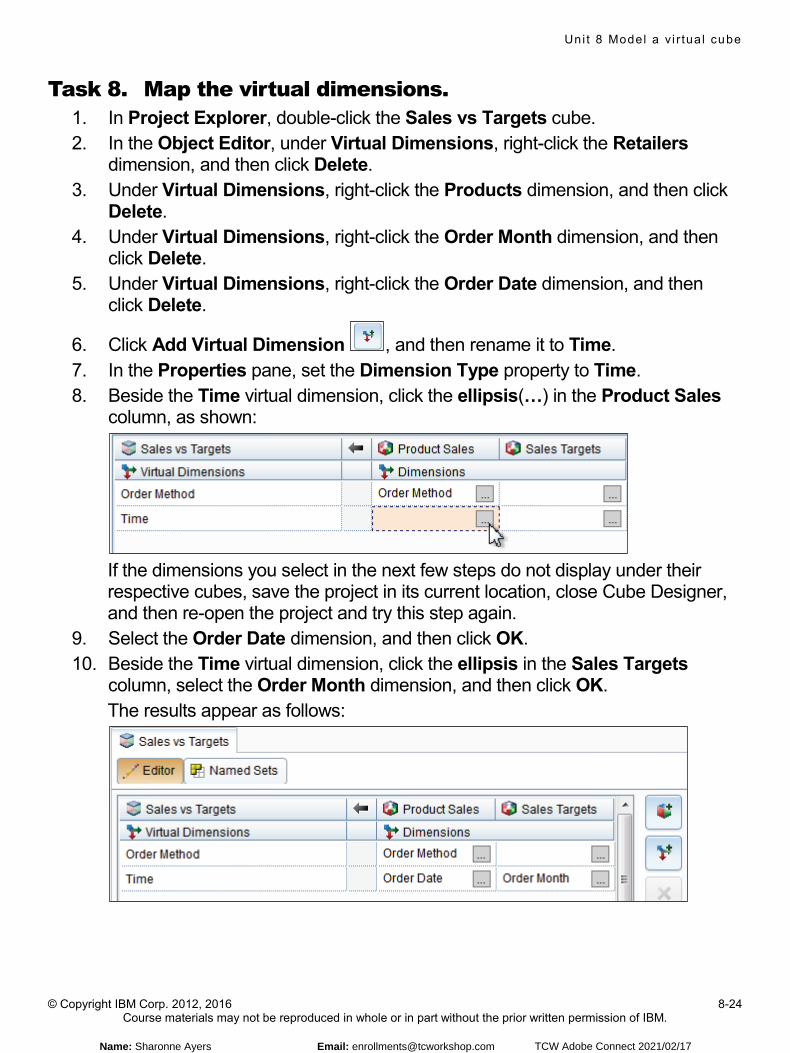
Uni t 8 Model a v i r tua l cube
© Copyright IBM Corp. 2012, 2016 8-24 Course materials may not be reproduced in whole or in part without the prior written permission of IBM.
Task 8. Map the virtual dimensions. 1. In Project Explorer, double-click the Sales vs Targets cube. 2. In the Object Editor, under Virtual Dimensions, right-click the Retailers
dimension, and then click Delete. 3. Under Virtual Dimensions, right-click the Products dimension, and then click
Delete. 4. Under Virtual Dimensions, right-click the Order Month dimension, and then
click Delete. 5. Under Virtual Dimensions, right-click the Order Date dimension, and then
click Delete.
6. Click Add Virtual Dimension , and then rename it to Time. 7. In the Properties pane, set the Dimension Type property to Time. 8. Beside the Time virtual dimension, click the ellipsis(…) in the Product Sales
column, as shown:
If the dimensions you select in the next few steps do not display under their respective cubes, save the project in its current location, close Cube Designer, and then re-open the project and try this step again.
9. Select the Order Date dimension, and then click OK. 10. Beside the Time virtual dimension, click the ellipsis in the Sales Targets
column, select the Order Month dimension, and then click OK. The results appear as follows:
Name: Sharonne Ayers Email: [email protected] TCW Adobe Connect 2021/02/17
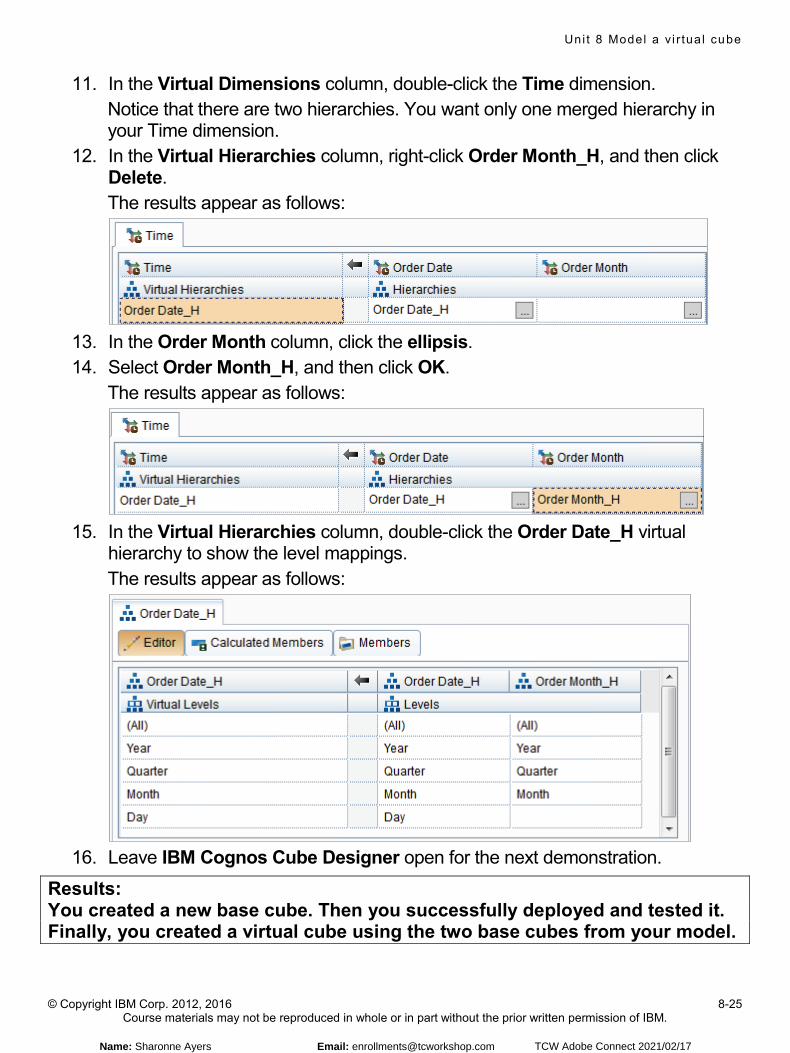
Uni t 8 Model a v i r tua l cube
© Copyright IBM Corp. 2012, 2016 8-25 Course materials may not be reproduced in whole or in part without the prior written permission of IBM.
11. In the Virtual Dimensions column, double-click the Time dimension. Notice that there are two hierarchies. You want only one merged hierarchy in your Time dimension.
12. In the Virtual Hierarchies column, right-click Order Month_H, and then click Delete. The results appear as follows:
13. In the Order Month column, click the ellipsis. 14. Select Order Month_H, and then click OK.
The results appear as follows:
15. In the Virtual Hierarchies column, double-click the Order Date_H virtual
hierarchy to show the level mappings. The results appear as follows:
16. Leave IBM Cognos Cube Designer open for the next demonstration.
Results: You created a new base cube. Then you successfully deployed and tested it. Finally, you created a virtual cube using the two base cubes from your model.
Name: Sharonne Ayers Email: [email protected] TCW Adobe Connect 2021/02/17
Uni t 8 Model a v i r tua l cube
© Copyright IBM Corp. 2012, 2016 8-26 Course materials may not be reproduced in whole or in part without the prior written permission of IBM.
© Copyright IBM Corporation 2016Model a virtual cube
Demonstration 2
Publish a virtual cube and test it in a report
Demonstration 2: Publish a virtual cube and test it in a report
Name: Sharonne Ayers Email: [email protected] TCW Adobe Connect 2021/02/17
Uni t 8 Model a v i r tua l cube
© Copyright IBM Corp. 2012, 2016 8-27 Course materials may not be reproduced in whole or in part without the prior written permission of IBM.
Demonstration 2: Publish a virtual cube and test it in a report
Purpose: You want to publish your virtual cube and test it by using it as a data source for a small report to show the base cubes that contain measures at different grains. Finally, you want to view all the cubes in IBM Cognos Administration Query Service to show that they are available and running.
Task 1. Validate and publish the Sales vs Targets virtual cube.
1. In IBM Cognos Cube Designer, in the Project Explorer, right-click the Sales vs Targets virtual cube, and then click Validate.
2. In the Project Explorer, right-click the Sales vs Targets virtual cube, and then click Publish.
3. Expand Additional Options, select the Select all options check box, and then click Browse.
4. Click My Folders, click OK, and then on the Publish window, click OK. 5. On the Deploy Results window, click OK.
Task 2. Test the virtual cube by using it as a data source for a report.
1. Open a Web browser, navigate to http://vclassbase:9300/bi/v1/disp, and then authenticate as admin/Education1.
2. Click My content, point to the Sales vs Targets package and click the ellipsis, and then click Create report.
3. Double-click List. 4. At the top, click Page views, and then click Page preview.
This will allow you to see data as you build the report. 5. Click Data, and in the Source pane, expand the Time dimension and the Order
Date_H hierarchy, and then drag the Year level to the list.
Name: Sharonne Ayers Email: [email protected] TCW Adobe Connect 2021/02/17
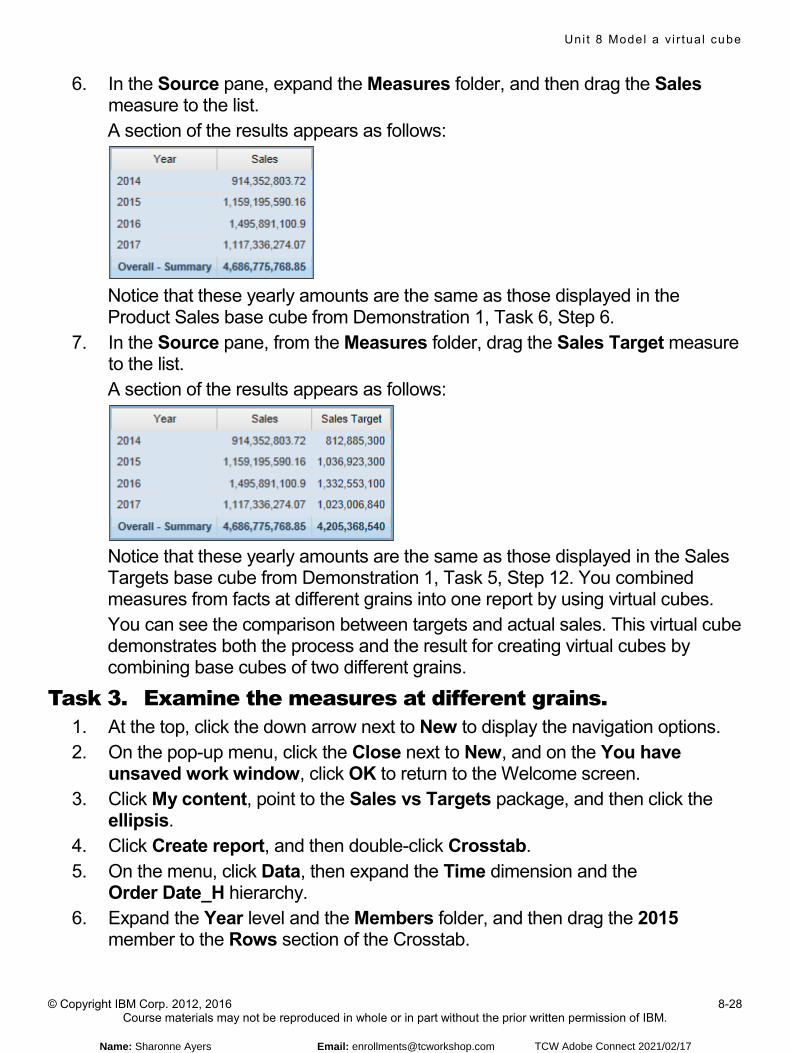
Uni t 8 Model a v i r tua l cube
© Copyright IBM Corp. 2012, 2016 8-28 Course materials may not be reproduced in whole or in part without the prior written permission of IBM.
6. In the Source pane, expand the Measures folder, and then drag the Sales measure to the list. A section of the results appears as follows:
Notice that these yearly amounts are the same as those displayed in the Product Sales base cube from Demonstration 1, Task 6, Step 6.
7. In the Source pane, from the Measures folder, drag the Sales Target measure to the list. A section of the results appears as follows:
Notice that these yearly amounts are the same as those displayed in the Sales Targets base cube from Demonstration 1, Task 5, Step 12. You combined measures from facts at different grains into one report by using virtual cubes. You can see the comparison between targets and actual sales. This virtual cube demonstrates both the process and the result for creating virtual cubes by combining base cubes of two different grains.
Task 3. Examine the measures at different grains. 1. At the top, click the down arrow next to New to display the navigation options. 2. On the pop-up menu, click the Close next to New, and on the You have
unsaved work window, click OK to return to the Welcome screen. 3. Click My content, point to the Sales vs Targets package, and then click the
ellipsis. 4. Click Create report, and then double-click Crosstab. 5. On the menu, click Data, then expand the Time dimension and the
Order Date_H hierarchy. 6. Expand the Year level and the Members folder, and then drag the 2015
member to the Rows section of the Crosstab.
Name: Sharonne Ayers Email: [email protected] TCW Adobe Connect 2021/02/17
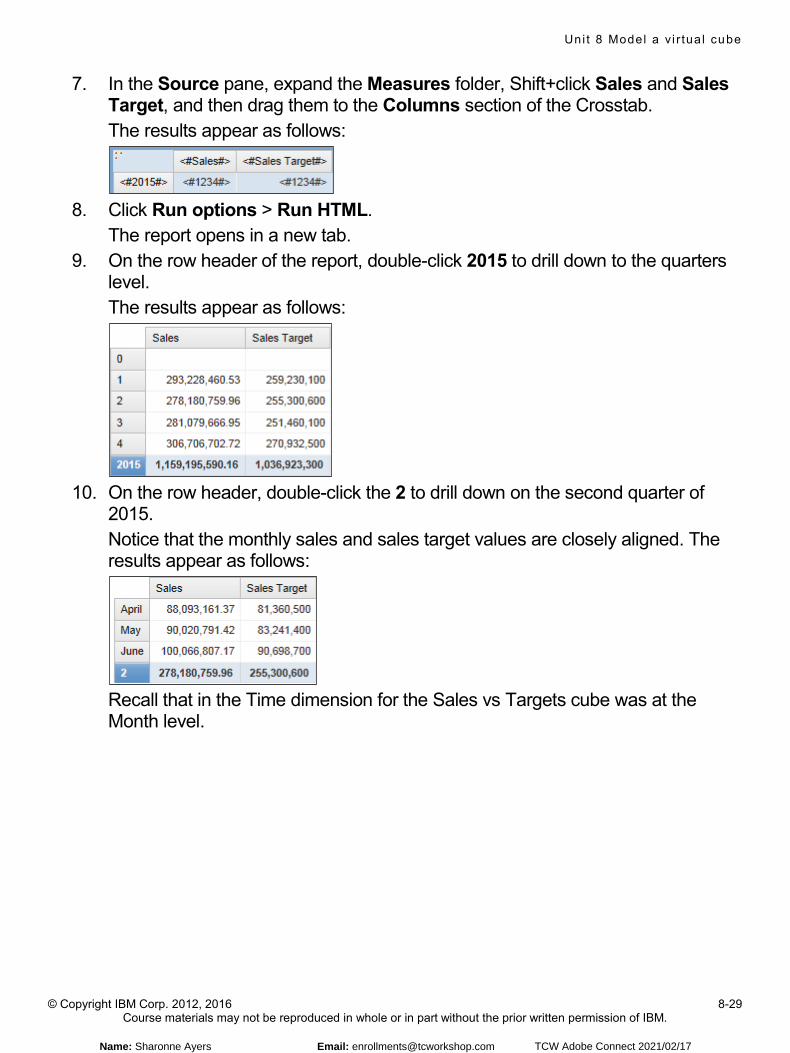
Uni t 8 Model a v i r tua l cube
© Copyright IBM Corp. 2012, 2016 8-29 Course materials may not be reproduced in whole or in part without the prior written permission of IBM.
7. In the Source pane, expand the Measures folder, Shift+click Sales and Sales Target, and then drag them to the Columns section of the Crosstab. The results appear as follows:
8. Click Run options > Run HTML.
The report opens in a new tab. 9. On the row header of the report, double-click 2015 to drill down to the quarters
level. The results appear as follows:
10. On the row header, double-click the 2 to drill down on the second quarter of
2015. Notice that the monthly sales and sales target values are closely aligned. The results appear as follows:
Recall that in the Time dimension for the Sales vs Targets cube was at the Month level.
Name: Sharonne Ayers Email: [email protected] TCW Adobe Connect 2021/02/17
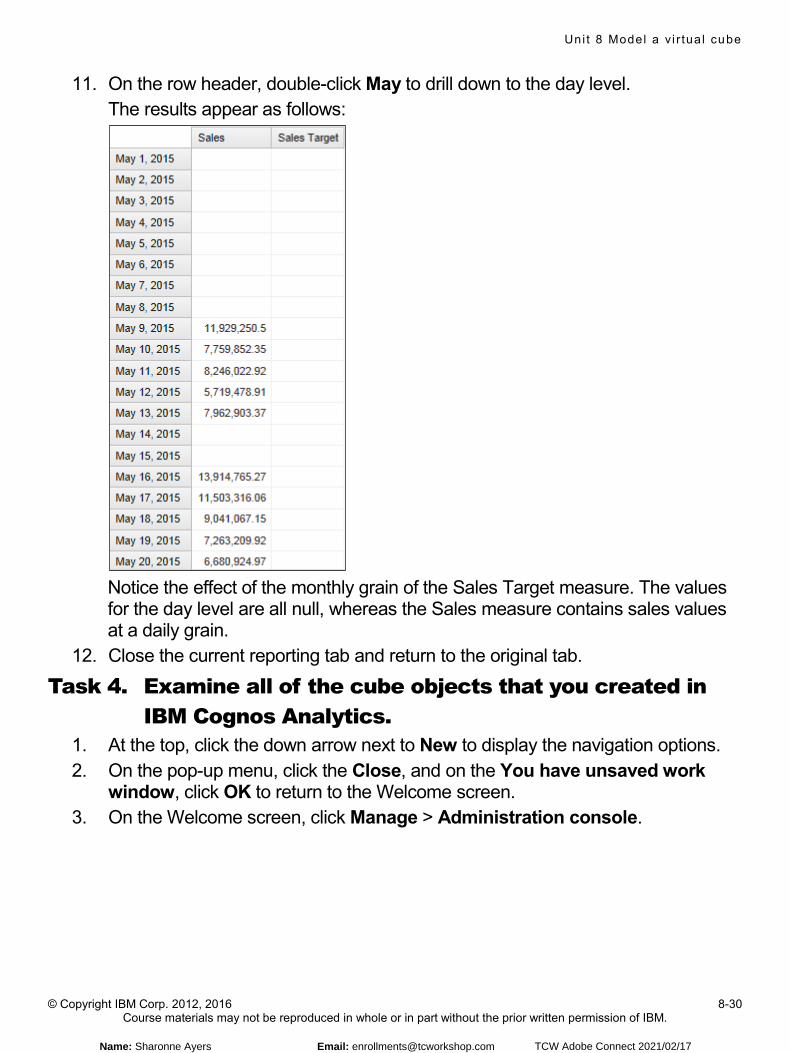
Uni t 8 Model a v i r tua l cube
© Copyright IBM Corp. 2012, 2016 8-30 Course materials may not be reproduced in whole or in part without the prior written permission of IBM.
11. On the row header, double-click May to drill down to the day level. The results appear as follows:
Notice the effect of the monthly grain of the Sales Target measure. The values for the day level are all null, whereas the Sales measure contains sales values at a daily grain.
12. Close the current reporting tab and return to the original tab.
Task 4. Examine all of the cube objects that you created in IBM Cognos Analytics.
1. At the top, click the down arrow next to New to display the navigation options. 2. On the pop-up menu, click the Close, and on the You have unsaved work
window, click OK to return to the Welcome screen. 3. On the Welcome screen, click Manage > Administration console.
Name: Sharonne Ayers Email: [email protected] TCW Adobe Connect 2021/02/17
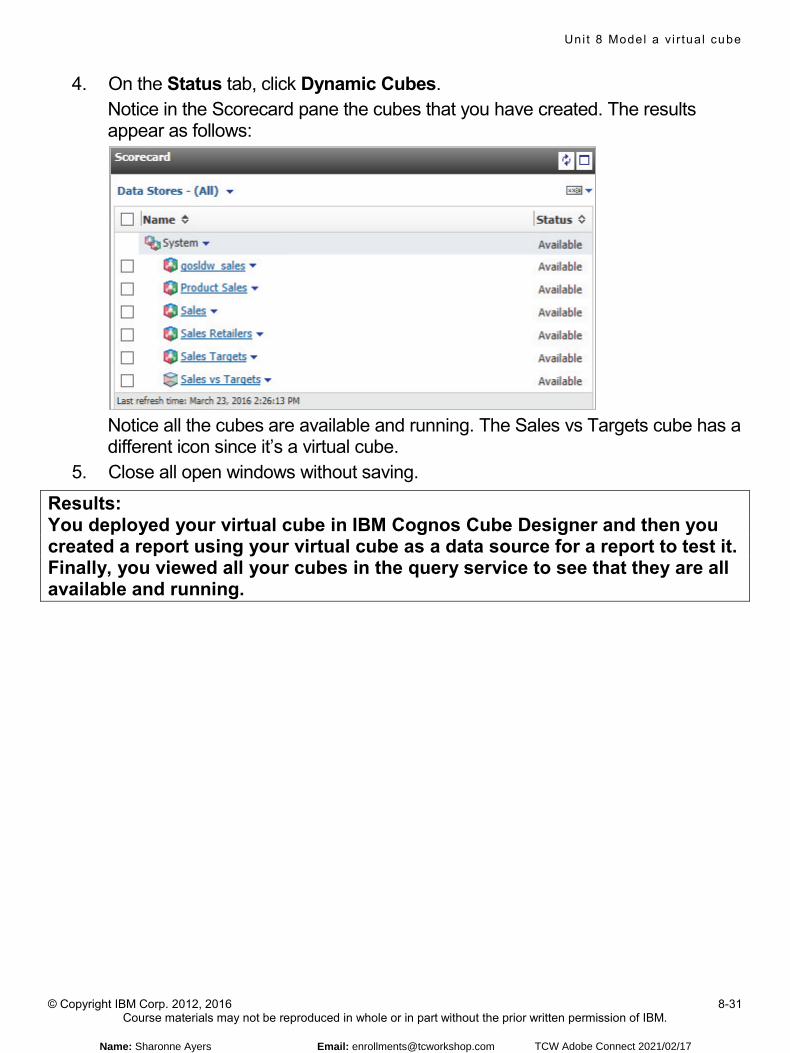
Uni t 8 Model a v i r tua l cube
© Copyright IBM Corp. 2012, 2016 8-31 Course materials may not be reproduced in whole or in part without the prior written permission of IBM.
4. On the Status tab, click Dynamic Cubes. Notice in the Scorecard pane the cubes that you have created. The results appear as follows:
Notice all the cubes are available and running. The Sales vs Targets cube has a different icon since it’s a virtual cube.
5. Close all open windows without saving.
Results: You deployed your virtual cube in IBM Cognos Cube Designer and then you created a report using your virtual cube as a data source for a report to test it. Finally, you viewed all your cubes in the query service to see that they are all available and running.
Name: Sharonne Ayers Email: [email protected] TCW Adobe Connect 2021/02/17
Introduction to IBM Cognos Analytics
© Copyright IBM Corporation 2016Course materials may not be reproduced in whole or in part without the written permission of IBM.
Introduction to IBM Cognos Analytics
IBM Cognos Analytics (v11.0)
Name: Sharonne Ayers Email: [email protected] TCW Adobe Connect 2021/02/17

Appendix A In t roduct ion to IBM Cognos Analyt ics
© Copyright IBM Corp. 2012, 2016 A-2 Course materials may not be reproduced in whole or in part without the prior written permission of IBM.
Name: Sharonne Ayers Email: [email protected] TCW Adobe Connect 2021/02/17
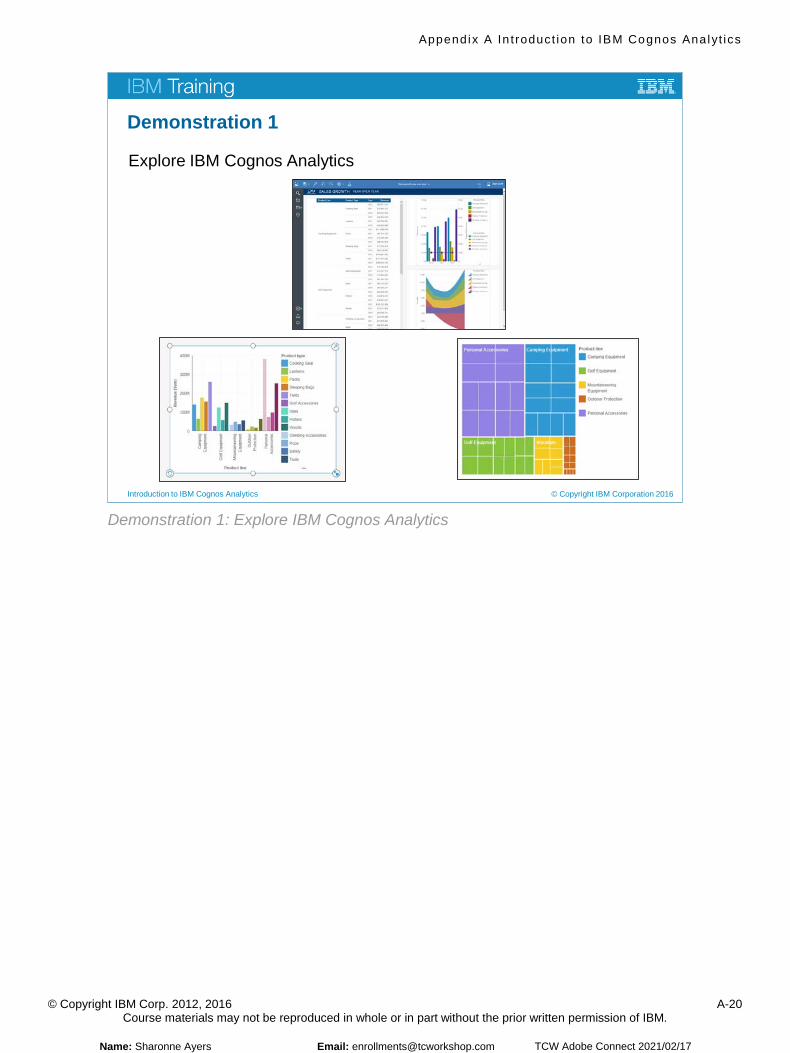
Appendix A In t roduct ion to IBM Cognos Analyt ics
© Copyright IBM Corp. 2012, 2016 A-20 Course materials may not be reproduced in whole or in part without the prior written permission of IBM.
© Copyright IBM Corporation 2016Introduction to IBM Cognos Analytics
Demonstration 1
Explore IBM Cognos Analytics
Demonstration 1: Explore IBM Cognos Analytics
Name: Sharonne Ayers Email: [email protected] TCW Adobe Connect 2021/02/17
Appendix A In t roduct ion to IBM Cognos Analyt ics
© Copyright IBM Corp. 2012, 2016 A-21 Course materials may not be reproduced in whole or in part without the prior written permission of IBM.
Demonstration 1: Explore IBM Cognos Analytics Purpose: You will obtain a high-level view of how IBM Cognos Analytics works by navigating through the system and tracing the lifecycle of a data item, from its appearance in a report to its existence in an underlying data source. You will take on different roles including a(n): - Consumer who runs reports or performs analysis to answer
business questions - Author who creates reports using various data items from a
metadata package - Data Modeler who imports data from the underlying data source, models it,
and publishes a metadata package to make it available for Authors - Administrator who creates and manages data source connections You will conclude by identifying how the data item from the report appears as a column in the underlying data source. Before performing demonstrations in this unit, on the taskbar, click Services, and then ensure that the following services are started: • Apache Directory Server - default (start this service first, if it is not already started) • DB2 - DB2COPY1 - DB2 • DB2DAS -DB2DAS00 • Lotus Domino Server (CProgramFilesx86IBMLotusDominodata) Server: localhost User/Password: scottb/Education1 Packages: Go Data Warehouse (query), Go Data Warehouse (analysis) Folders: Sales and Marketing (query) Namespace: Sales (query) Task 1. Run a report from the IBM Cognos Portal.
1. Open a web browser, and then navigate to http://vclassbase:9300/bi. 2. Log on as scottb/Education1.
The Welcome page appears. Security is currently set in this environment and you have logged on as a member of the Consumers role. The interface displays only functionality that is available to a member of the Consumers role. As a Consumer, you have the ability to navigate to and run reports, and to create dashboards and Data Modules. You will view report content in the IBM Cognos Portal.
Name: Sharonne Ayers Email: [email protected] TCW Adobe Connect 2021/02/17

Appendix A In t roduct ion to IBM Cognos Analyt ics
© Copyright IBM Corp. 2012, 2016 A-22 Course materials may not be reproduced in whole or in part without the prior written permission of IBM.
3. Click Search. The search panel appears. You are searching for a report titled Total Revenue by Country_DQ.
4. Type total revenue. The search results appear.
5. Click Total Revenue by Country_DQ. You would like to save this search for future use.
6. Click Save search . The search is saved.
7. Click Clear . Under Saved searches, you can now see the search you saved. You could open the report directly from the search results, but instead, you will navigate to the report manually.
8. Click Team content, and then navigate to Samples_DQ > Models > GO Data Warehouse (query) > Report Studio Report Samples.
9. Click Total Revenue by Country_DQ. The underlying data source is queried for data, and the report opens in IBM Cognos Analytics. A section of the results appears as follows:
This report contains queried data. You will now create a dashboard.
Name: Sharonne Ayers Email: [email protected] TCW Adobe Connect 2021/02/17
Appendix A In t roduct ion to IBM Cognos Analyt ics
© Copyright IBM Corp. 2012, 2016 A-23 Course materials may not be reproduced in whole or in part without the prior written permission of IBM.
Task 2. Upload a personal file and create a dashboard in IBM Cognos Analytics.
1. On the Side panel, click Upload files . 2. In the Choose File to Upload dialog, browse to
C:\Training\B6063\Start Files\AppendixA. 3. Click SampleFile_GOSales.xls, and then click Open.
The system will take a few moments to load the file. A progress bar indicates the status of the upload. When it's finished, you will see a preview of the data, such as Retailer country, Order method type, Retailer type, and so on.
4. On the Select the columns that will be visible screen, click OK to select all of them.
5. On the Side panel, click New , and then click Dashboard . 6. Under Select a template, click Freeform, and then click OK.
7. Click Sources .
8. Next to Selected sources, click Add a source . Because you are creating a dashboard, you are only able to access uploaded data files and Data Modules. You do not have access to use packages.
9. In the Open dialog, navigate to My content, click SampleFile_GOSales.xls, and then click Open. The data is loaded and is ready to use in your dashboard.
10. Click Product type, Ctrl+click Product line, and then Ctrl+click Revenue. Each entry is highlighted with a bar to the left of the entry, and the text of each item is bolded, to show that it is part of the current selection.
Name: Sharonne Ayers Email: [email protected] TCW Adobe Connect 2021/02/17
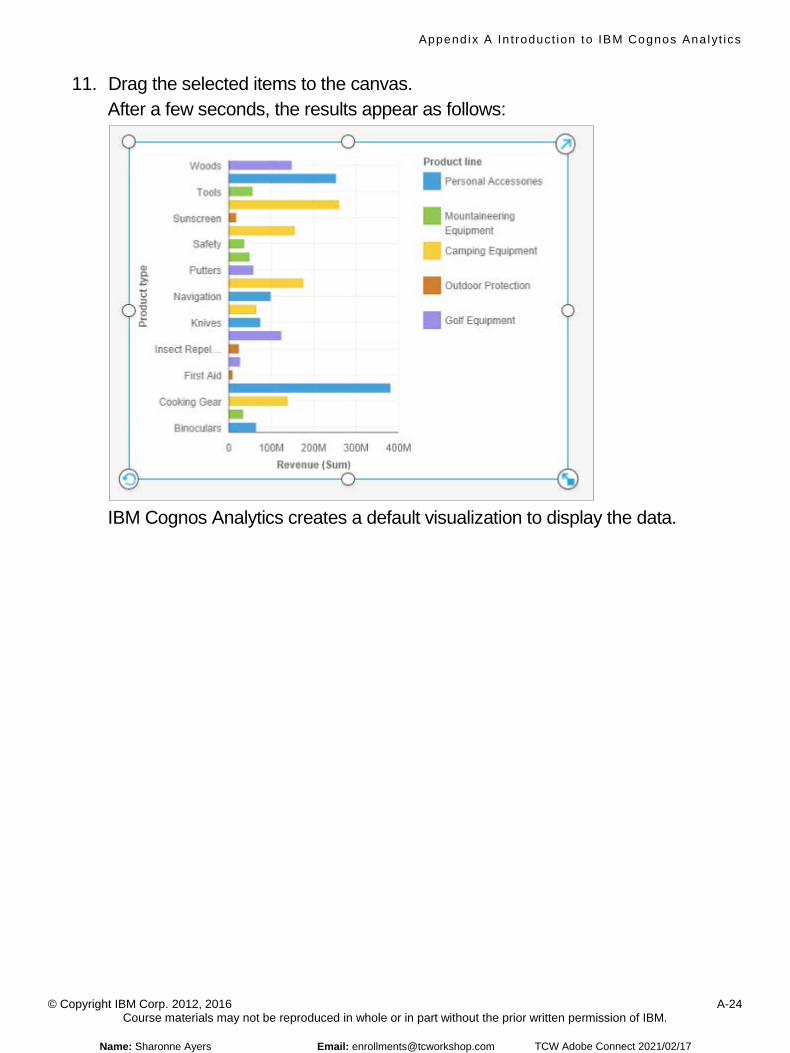
Appendix A In t roduct ion to IBM Cognos Analyt ics
© Copyright IBM Corp. 2012, 2016 A-24 Course materials may not be reproduced in whole or in part without the prior written permission of IBM.
11. Drag the selected items to the canvas. After a few seconds, the results appear as follows:
IBM Cognos Analytics creates a default visualization to display the data.
Name: Sharonne Ayers Email: [email protected] TCW Adobe Connect 2021/02/17
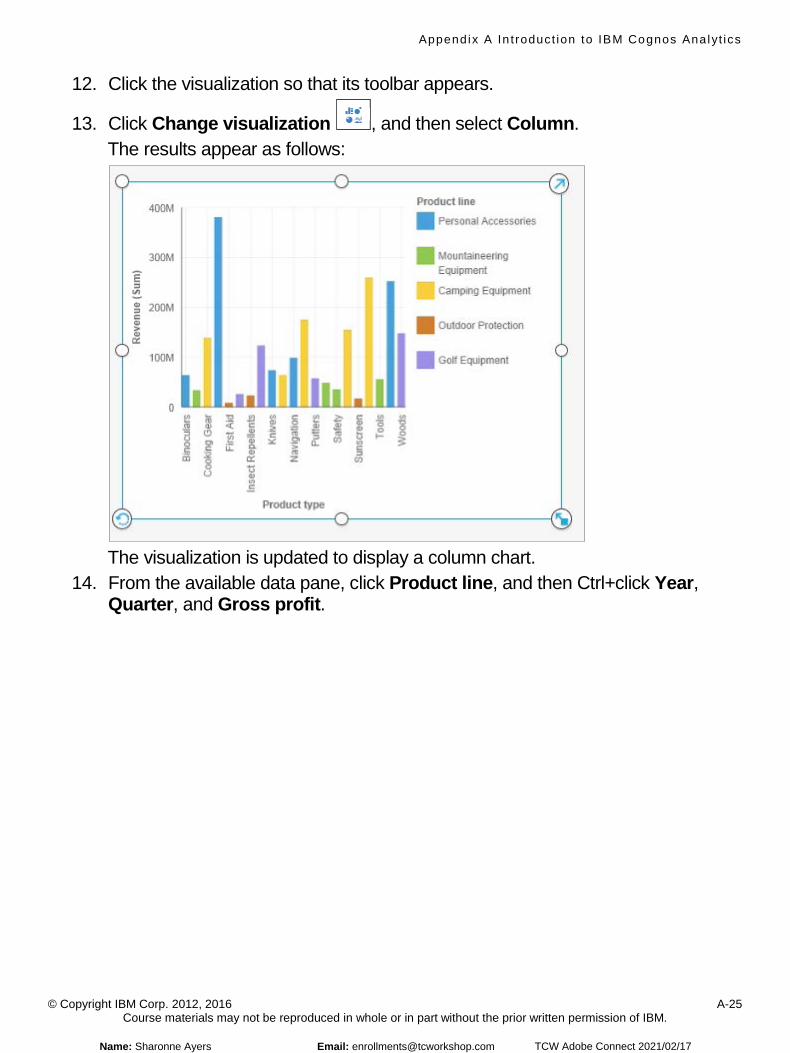
Appendix A In t roduct ion to IBM Cognos Analyt ics
© Copyright IBM Corp. 2012, 2016 A-25 Course materials may not be reproduced in whole or in part without the prior written permission of IBM.
12. Click the visualization so that its toolbar appears.
13. Click Change visualization , and then select Column. The results appear as follows:
The visualization is updated to display a column chart.
14. From the available data pane, click Product line, and then Ctrl+click Year, Quarter, and Gross profit.
Name: Sharonne Ayers Email: [email protected] TCW Adobe Connect 2021/02/17
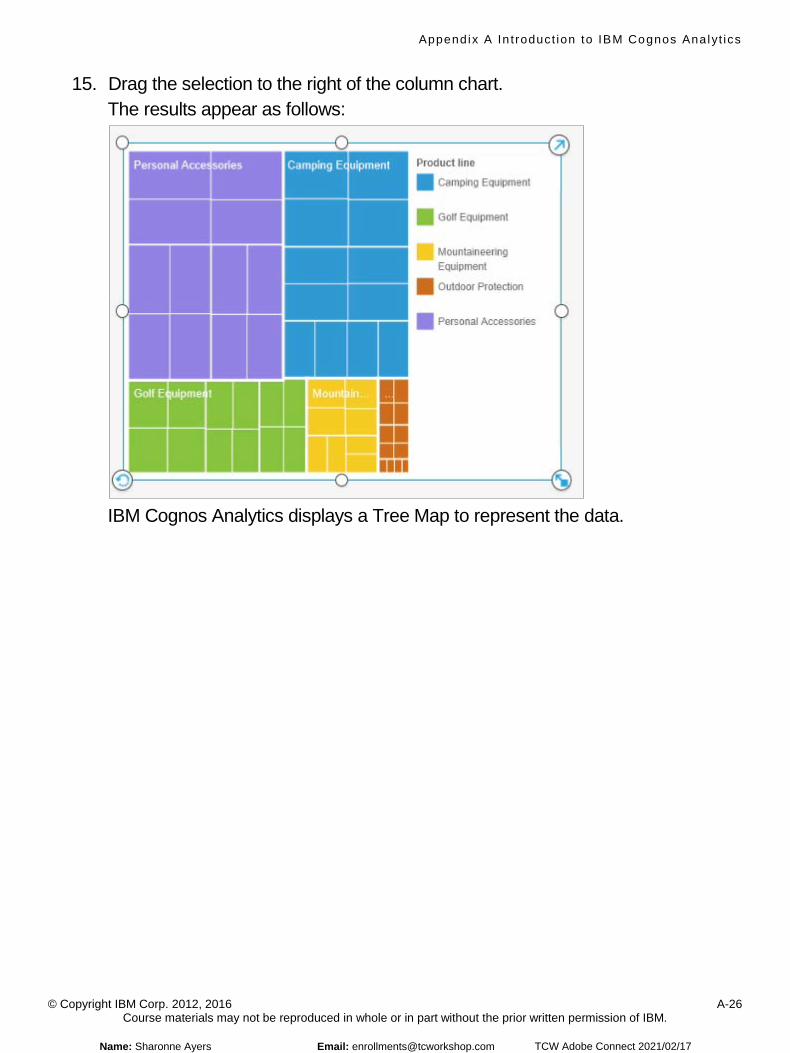
Appendix A In t roduct ion to IBM Cognos Analyt ics
© Copyright IBM Corp. 2012, 2016 A-26 Course materials may not be reproduced in whole or in part without the prior written permission of IBM.
15. Drag the selection to the right of the column chart. The results appear as follows:
IBM Cognos Analytics displays a Tree Map to represent the data.
Name: Sharonne Ayers Email: [email protected] TCW Adobe Connect 2021/02/17
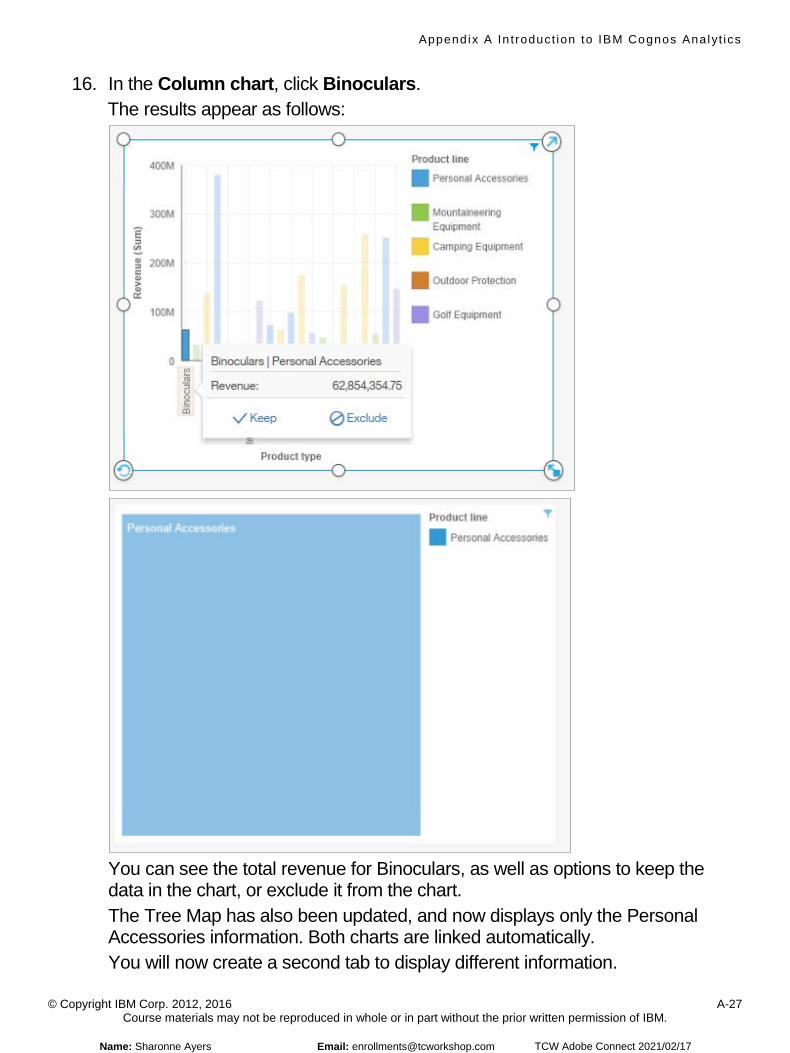
Appendix A In t roduct ion to IBM Cognos Analyt ics
© Copyright IBM Corp. 2012, 2016 A-27 Course materials may not be reproduced in whole or in part without the prior written permission of IBM.
16. In the Column chart, click Binoculars. The results appear as follows:
You can see the total revenue for Binoculars, as well as options to keep the data in the chart, or exclude it from the chart. The Tree Map has also been updated, and now displays only the Personal Accessories information. Both charts are linked automatically. You will now create a second tab to display different information.
Name: Sharonne Ayers Email: [email protected] TCW Adobe Connect 2021/02/17
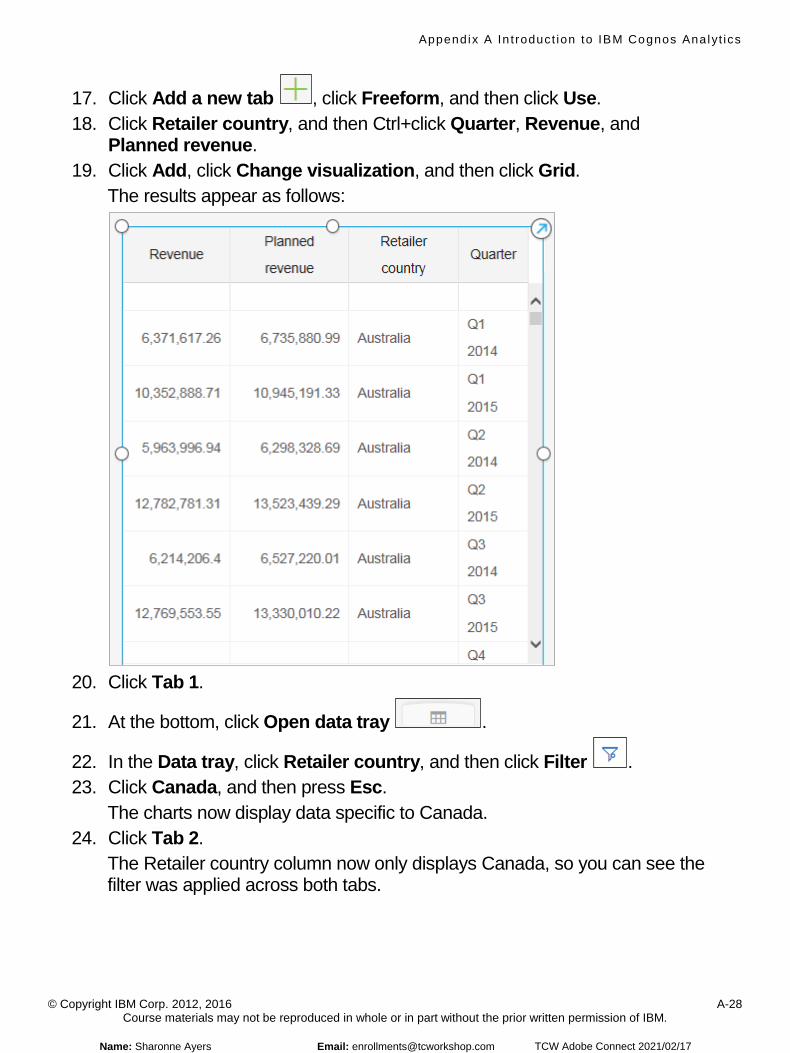
Appendix A In t roduct ion to IBM Cognos Analyt ics
© Copyright IBM Corp. 2012, 2016 A-28 Course materials may not be reproduced in whole or in part without the prior written permission of IBM.
17. Click Add a new tab , click Freeform, and then click Use. 18. Click Retailer country, and then Ctrl+click Quarter, Revenue, and
Planned revenue. 19. Click Add, click Change visualization, and then click Grid.
The results appear as follows:
20. Click Tab 1.
21. At the bottom, click Open data tray .
22. In the Data tray, click Retailer country, and then click Filter . 23. Click Canada, and then press Esc.
The charts now display data specific to Canada. 24. Click Tab 2.
The Retailer country column now only displays Canada, so you can see the filter was applied across both tabs.
Name: Sharonne Ayers Email: [email protected] TCW Adobe Connect 2021/02/17
Appendix A In t roduct ion to IBM Cognos Analyt ics
© Copyright IBM Corp. 2012, 2016 A-29 Course materials may not be reproduced in whole or in part without the prior written permission of IBM.
25. Click the arrow beside New dashboard*, and then click Remove beside Total Revenue by Country_DQ and New dashboard*.
26. Click OK to continue without saving. You will now examine the report you ran in the previous task using Reporting.
Task 3. Examine a report using Reporting. Note that while you are able to edit an existing report in Reporting, you will not be able to save it as a member of the Consumers role. You will now log in as Frank Bretton, a member of the Authors role.
1. In the top-right, click Bart Scott , and then click Sign out. 2. Log on as brettonf/Education1.
The Welcome page appears. Security is currently set in this environment and you have logged on as a member of the Authors role. The interface displays only functionality that is available to a member of the Authors role. As an Author, you have the additional ability to create and save reports.
3. Click Team content, and then navigate to Samples_DQ > Models > GO Data Warehouse (query) > Report Studio Report Samples.
4. Click Total Revenue by Country_DQ.
5. On the Toolbar, click Edit . The icons and buttons on the page update to reflect a Reporting context.
6. On the Toolbar, click Page views , and then click Page structure. 7. Expand Page - Page 1, and then expand the rest of the hierarchy.
The report includes a hierarchical object structure, beginning with a Page object, which includes Page Header, Page Body, and Page Footer objects. The Page Body hierarchy includes Table objects, which in turn include Table row objects, which in turn includes Table cell objects, and so on.
8. On the Toolbar, click Page views, and then click Page design. 9. At the bottom of the report, double-click <%AsOfDate()%>.
The Report expression dialog box opens showing the AsOfDate() expression. AsOfDate() is an embedded report function within the Reporting expression editor, which can be used to return and display the execution date for the report.
10. Click Cancel, and then repeat step 9 for <%PageNumber()%> and <%AsOfTime()%>. PageNumber() returns the current page number. AsOfTime() returns the report execution time.
Name: Sharonne Ayers Email: [email protected] TCW Adobe Connect 2021/02/17
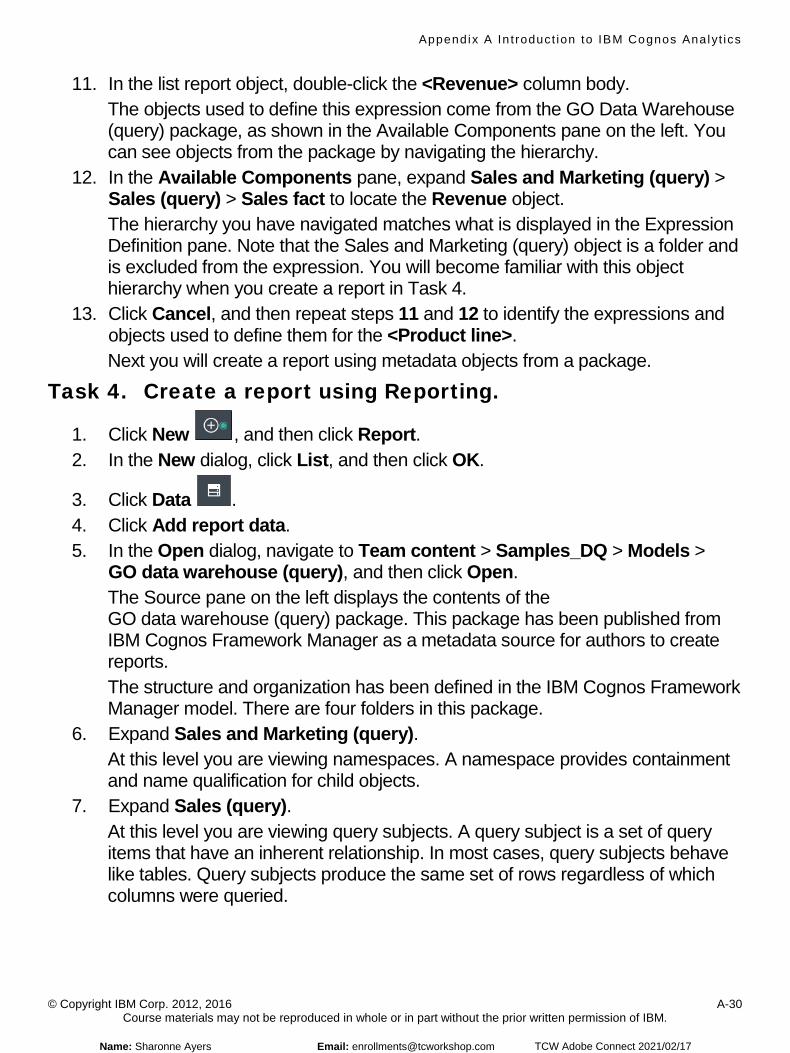
Appendix A In t roduct ion to IBM Cognos Analyt ics
© Copyright IBM Corp. 2012, 2016 A-30 Course materials may not be reproduced in whole or in part without the prior written permission of IBM.
11. In the list report object, double-click the <Revenue> column body. The objects used to define this expression come from the GO Data Warehouse (query) package, as shown in the Available Components pane on the left. You can see objects from the package by navigating the hierarchy.
12. In the Available Components pane, expand Sales and Marketing (query) > Sales (query) > Sales fact to locate the Revenue object. The hierarchy you have navigated matches what is displayed in the Expression Definition pane. Note that the Sales and Marketing (query) object is a folder and is excluded from the expression. You will become familiar with this object hierarchy when you create a report in Task 4.
13. Click Cancel, and then repeat steps 11 and 12 to identify the expressions and objects used to define them for the <Product line>. Next you will create a report using metadata objects from a package.
Task 4. Create a report using Reporting.
1. Click New , and then click Report. 2. In the New dialog, click List, and then click OK.
3. Click Data . 4. Click Add report data. 5. In the Open dialog, navigate to Team content > Samples_DQ > Models >
GO data warehouse (query), and then click Open. The Source pane on the left displays the contents of the GO data warehouse (query) package. This package has been published from IBM Cognos Framework Manager as a metadata source for authors to create reports. The structure and organization has been defined in the IBM Cognos Framework Manager model. There are four folders in this package.
6. Expand Sales and Marketing (query). At this level you are viewing namespaces. A namespace provides containment and name qualification for child objects.
7. Expand Sales (query). At this level you are viewing query subjects. A query subject is a set of query items that have an inherent relationship. In most cases, query subjects behave like tables. Query subjects produce the same set of rows regardless of which columns were queried.
Name: Sharonne Ayers Email: [email protected] TCW Adobe Connect 2021/02/17
Appendix A In t roduct ion to IBM Cognos Analyt ics
© Copyright IBM Corp. 2012, 2016 A-31 Course materials may not be reproduced in whole or in part without the prior written permission of IBM.
8. Expand Sales fact. At this level you are viewing query items. A query item represents a single characteristic, such as the date that a product was introduced. Query items are contained in query subjects or dimensions (if using a dimensional data source). For example, a query subject that references an entire table contains query items that represent each column in the table.
9. Drag the following items into the list object: • Product line (from Products) • Product type (from Products) • Revenue (from Sales fact) The results appear as follows:
10. From the Toolbar, click Run options . 11. Click Run HTML.
The report runs in a separate tab. 12. Close IBM Cognos Analytics without saving the report.
Next you will take on the role of a modeler/developer to identify how the objects from the package, including the Revenue query item, are made available to authors to create their reports.
Task 5. Examine a model in IBM Cognos Framework Manager. 1. From the Start menu, click All Programs >
IBM Cognos Framework Manager > IBM Cognos Framework Manager. 2. Click Open a project, and then open great_outdoors_warehouse_dq.cpf
from C:\Program Filesa\IBM\cognos\samples\webcontent\samples\ models\great_outdoors_warehouse_dq.
3. Log on as admin/Education1. In the current security environment, Admin Person is a member of the System Administrators role, and by default, has access to the entire IBM Cognos Analytics system, including IBM Cognos Framework Manager. You will examine what was published from IBM Cognos Framework Manager.
Name: Sharonne Ayers Email: [email protected] TCW Adobe Connect 2021/02/17
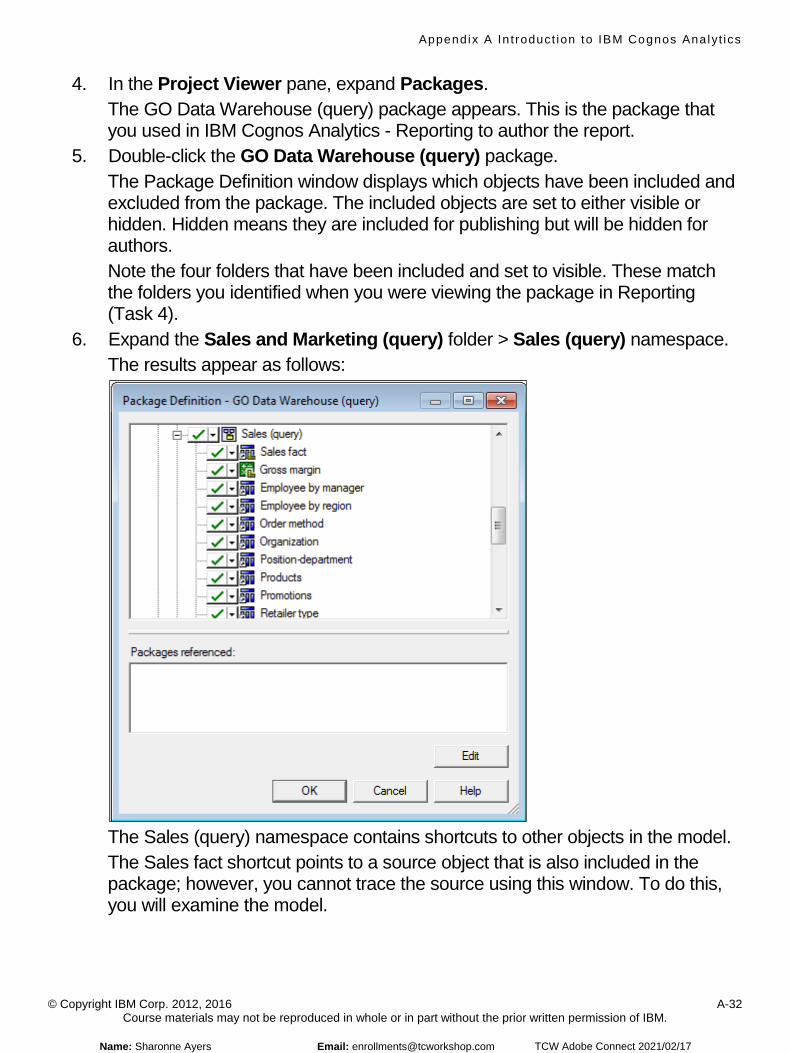
Appendix A In t roduct ion to IBM Cognos Analyt ics
© Copyright IBM Corp. 2012, 2016 A-32 Course materials may not be reproduced in whole or in part without the prior written permission of IBM.
4. In the Project Viewer pane, expand Packages. The GO Data Warehouse (query) package appears. This is the package that you used in IBM Cognos Analytics - Reporting to author the report.
5. Double-click the GO Data Warehouse (query) package. The Package Definition window displays which objects have been included and excluded from the package. The included objects are set to either visible or hidden. Hidden means they are included for publishing but will be hidden for authors. Note the four folders that have been included and set to visible. These match the folders you identified when you were viewing the package in Reporting (Task 4).
6. Expand the Sales and Marketing (query) folder > Sales (query) namespace. The results appear as follows:
The Sales (query) namespace contains shortcuts to other objects in the model. The Sales fact shortcut points to a source object that is also included in the package; however, you cannot trace the source using this window. To do this, you will examine the model.
Name: Sharonne Ayers Email: [email protected] TCW Adobe Connect 2021/02/17
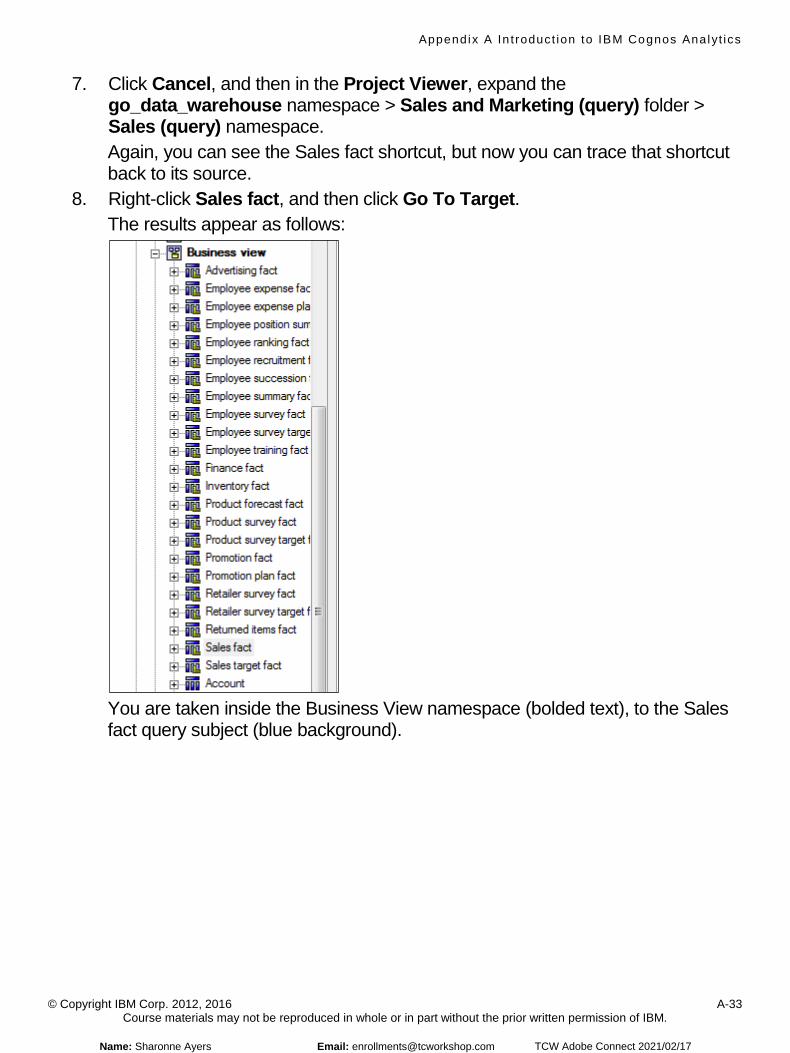
Appendix A In t roduct ion to IBM Cognos Analyt ics
© Copyright IBM Corp. 2012, 2016 A-33 Course materials may not be reproduced in whole or in part without the prior written permission of IBM.
7. Click Cancel, and then in the Project Viewer, expand the go_data_warehouse namespace > Sales and Marketing (query) folder > Sales (query) namespace. Again, you can see the Sales fact shortcut, but now you can trace that shortcut back to its source.
8. Right-click Sales fact, and then click Go To Target. The results appear as follows:
You are taken inside the Business View namespace (bolded text), to the Sales fact query subject (blue background).
Name: Sharonne Ayers Email: [email protected] TCW Adobe Connect 2021/02/17
Appendix A In t roduct ion to IBM Cognos Analyt ics
© Copyright IBM Corp. 2012, 2016 A-34 Course materials may not be reproduced in whole or in part without the prior written permission of IBM.
9. Expand Sales fact. This query subject includes the Revenue query item. Without going into detail on the structure of this model, you should note that, as a proven practice, this sample model has been organized to include multiple namespaces. The Database View namespace is used to contain query subjects and query items that have been imported directly from the data source. The Business View namespace is used to contain query subjects and query items on which various modeling tasks have been performed, such as: • combining query items from multiple query subjects • creating calculated query items • creating model filters and query item filters • modifying and creating relationships between query subjects • setting properties of various query subjects and query items Objects that will be made available to authors are typically kept outside of these namespaces, for example the Sales and Marketing (query) folder. The Sales and Marketing (query) folder contains only shortcuts to objects elsewhere in the model. Some of those objects, contained elsewhere in the model, have been included in the package. In the Package Definition, you noted that some objects were made hidden, including the Business View namespace. In Cognos Analytics, when the author creates the report and uses the Revenue item, they are using a shortcut to a hidden object in the package. In this case, it is the Revenue query item, from the Sales fact query subject, in the Business View namespace. You will now identify the source for the Revenue query item from the Sales fact query subject.
Name: Sharonne Ayers Email: [email protected] TCW Adobe Connect 2021/02/17

Appendix A In t roduct ion to IBM Cognos Analyt ics
© Copyright IBM Corp. 2012, 2016 A-35 Course materials may not be reproduced in whole or in part without the prior written permission of IBM.
10. Double-click the Sales fact query subject. This is a model query subject. Model query subjects can be used to create a more abstract, business-oriented view of a data source. For example, you can add business objects such as calculations and filters and combine query items from other query subjects, including other model query subjects. The Measures pane displays the measures and their source that make up this model query subject, including the Revenue measure. Also note that there are two calculated items: Product cost, and Planned revenue. For Revenue, there are two items to note: • the source is SLS_SALES_FACT.SALE_TOTAL. • the name is Revenue, indicating that the item was renamed from
SALE_TOTAL From this, you can conclude that Revenue is sourced from SALE_TOTAL. To locate this object, you can search for it in the model.
11. Click Cancel, and then in the Tools pane on the right, click the Search tab. 12. Search for SALE_TOTAL using the go_data_warehouse model as the scope.
Tip: Use the Search options button to define your search. 13. Click the first instance that contains SALE_TOTAL.
Objects in the Project Viewer pane expand, and you can see the SALE_TOTAL query item is located at go_data_warehouse > Database view > Sales and marketing data > SLS_SALES_FACT.
14. Double-click SLS_SALES_FACT. This is a data source query subject. Data source query subjects directly reference data in a single data source. IBM Cognos Framework Manager automatically creates a relational data source query subject for each table and view that you import into your model. It includes an SQL statement that will, at runtime, retrieve all the columns from the table. You will test this behavior and in turn locate the SALE_TOTAL column and its values.
15. Click the Test tab, at the bottom click Test Sample, and then in the Test results window, scroll to the right to locate SALE_TOTAL. SALE_TOTAL is returned as a column.
Name: Sharonne Ayers Email: [email protected] TCW Adobe Connect 2021/02/17
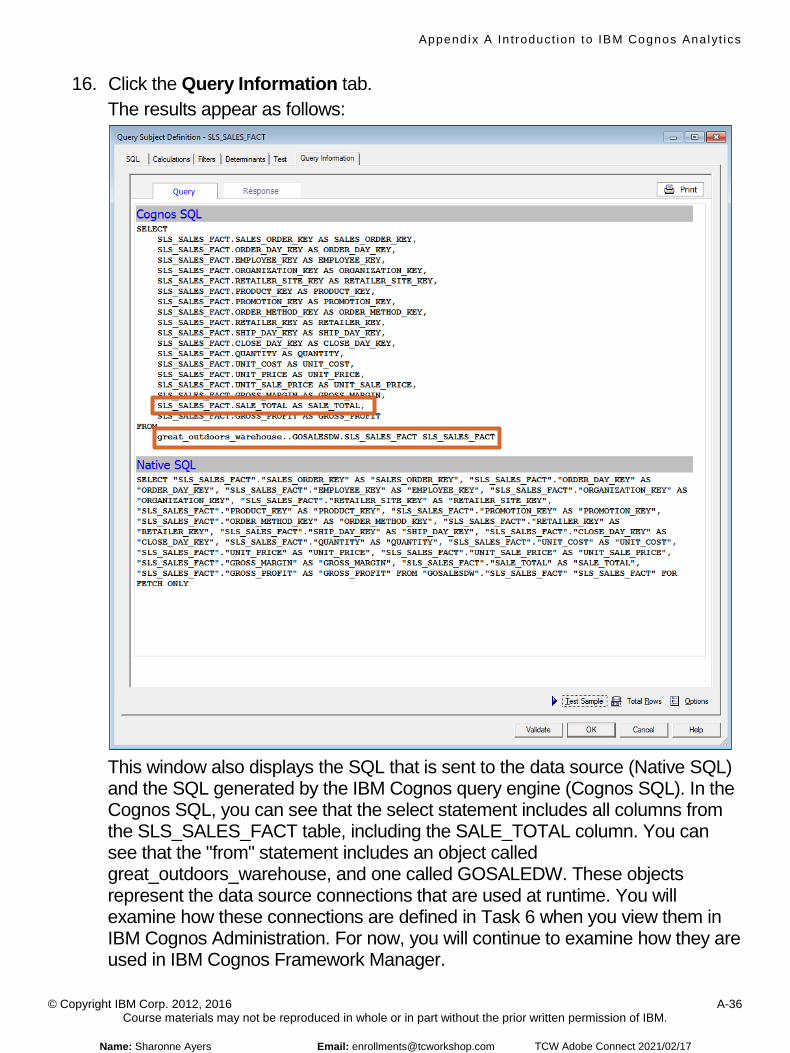
Appendix A In t roduct ion to IBM Cognos Analyt ics
© Copyright IBM Corp. 2012, 2016 A-36 Course materials may not be reproduced in whole or in part without the prior written permission of IBM.
16. Click the Query Information tab. The results appear as follows:
This window also displays the SQL that is sent to the data source (Native SQL) and the SQL generated by the IBM Cognos query engine (Cognos SQL). In the Cognos SQL, you can see that the select statement includes all columns from the SLS_SALES_FACT table, including the SALE_TOTAL column. You can see that the "from" statement includes an object called great_outdoors_warehouse, and one called GOSALEDW. These objects represent the data source connections that are used at runtime. You will examine how these connections are defined in Task 6 when you view them in IBM Cognos Administration. For now, you will continue to examine how they are used in IBM Cognos Framework Manager.
Name: Sharonne Ayers Email: [email protected] TCW Adobe Connect 2021/02/17
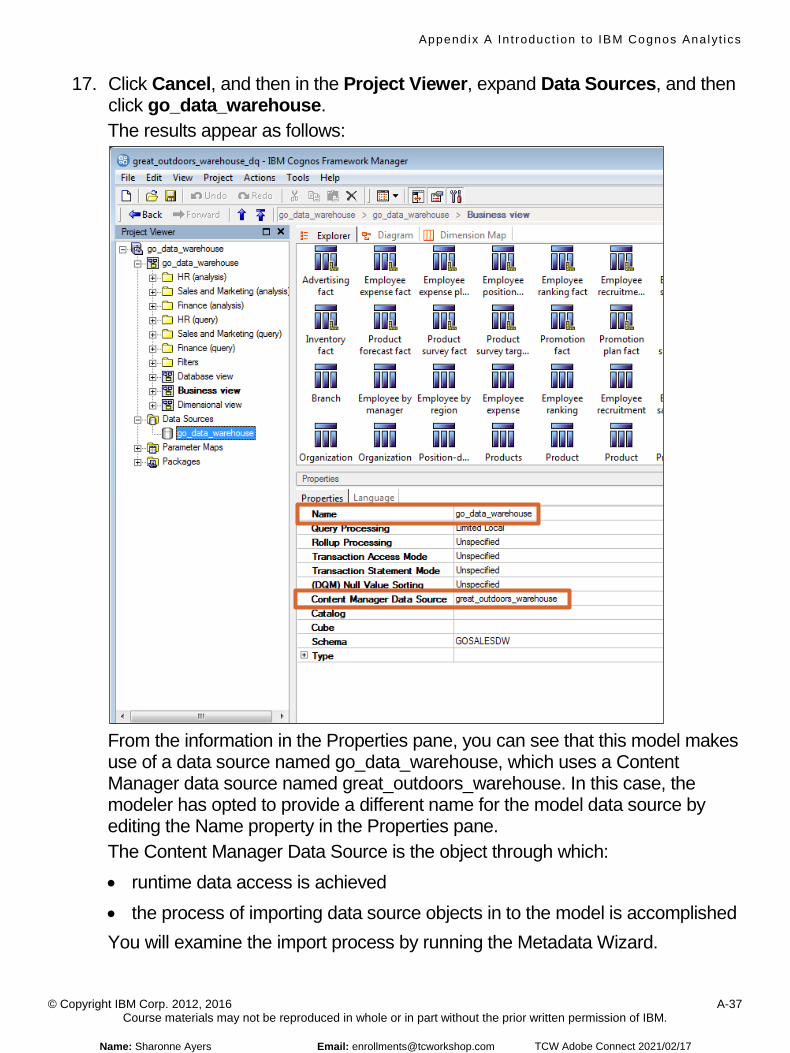
Appendix A In t roduct ion to IBM Cognos Analyt ics
© Copyright IBM Corp. 2012, 2016 A-37 Course materials may not be reproduced in whole or in part without the prior written permission of IBM.
17. Click Cancel, and then in the Project Viewer, expand Data Sources, and then click go_data_warehouse. The results appear as follows:
From the information in the Properties pane, you can see that this model makes use of a data source named go_data_warehouse, which uses a Content Manager data source named great_outdoors_warehouse. In this case, the modeler has opted to provide a different name for the model data source by editing the Name property in the Properties pane. The Content Manager Data Source is the object through which: • runtime data access is achieved • the process of importing data source objects in to the model is accomplished You will examine the import process by running the Metadata Wizard.
Name: Sharonne Ayers Email: [email protected] TCW Adobe Connect 2021/02/17
Appendix A In t roduct ion to IBM Cognos Analyt ics
© Copyright IBM Corp. 2012, 2016 A-38 Course materials may not be reproduced in whole or in part without the prior written permission of IBM.
18. In the Project Viewer, right-click Database view, and then click Run Metadata Wizard. You can import from a wide range of data source types.
19. Leave Data Sources selected, and then click Next. There are currently two or three data sources to choose from to perform the import. Clicking the New button will let you create a new data source provided you have the appropriate access rights to perform this action. One of the data sources is named great_outdoors_warehouse, and is the data source that was previously used to import objects in to this model. The name also matches the Content Manager data source name identified at step 16.
20. Click great_outdoors_warehouse, and then click Next. This data source points to a set of child data source objects, one of them being GOSALESDW. This name matches the object name identified when examining the SQL statement in step 16.
21. Expand GOSALESDW > Tables. This data source object includes a set of tables, which can be imported into the model. Included in this set is the SLS_SALES_FACT table.
22. Expand SLS_SALES_FACT. This table includes a set of columns, which can be imported into the model. Included in this set is the SALE_TOTAL column.
23. Click Cancel, and then close IBM Cognos Framework Manager without saving the project. Up to this point you have identified how the Revenue query item: • data values appear in existing reports • is used in a new report created in IBM Cognos Analytics • is made available to authors in a package that is published from IBM Cognos
Framework Manager • is sourced and modeled in the IBM Cognos Framework Manager model • is imported into the IBM Cognos Framework model as the SALE_TOTAL
column
Task 6. Examine data sources in IBM Cognos Analytics. You will now take on the role of the administrator to examine how data source connections are defined in IBM Cognos Administration.
1. Open a web browser, and then navigate to http://vclassbase:9300/bi. 2. Log on as admin/Education1. 3. On the Side panel, click Manage.
Name: Sharonne Ayers Email: [email protected] TCW Adobe Connect 2021/02/17

Appendix A In t roduct ion to IBM Cognos Analyt ics
© Copyright IBM Corp. 2012, 2016 A-39 Course materials may not be reproduced in whole or in part without the prior written permission of IBM.
4. Click Administration console. IBM Cognos Administration is the portal that allows you to monitor and administer the IBM Cognos Analytics system including servers, security, capabilities, data source connections, and the deployment of content. In the current security environment, Admin is a member of the Directory Administrators role, which by default provides access to the Directory pages of IBM Cognos Administration, including the ability to create and manage data sources.
5. Click the Configuration tab. On the left, the first node selected is Data Source Connections. Here you can administer existing data sources and create new ones. Note: The New button on the toolbar provides the same user interface experience for creating a new data source that is available in IBM Cognos Framework Manager in the Metadata Wizard. Existing data sources display; these are the same data sources that appeared when you ran the Metadata Wizard in IBM Cognos Framework Manager, at Task 5, steps 18 and 19. There may be additional data sources in view based on the work you have previously completed in this Dynamic Cubes course.
6. Click the great_outdoors_warehouse data source. This data source includes a single data source connection named great_outdoors_warehouse. Note: You can have multiple data source connections for a single data source. For example, if you have multiple databases with exactly the same structure (but different data), you can create one data source with multiple connections. The data source connection identifies which database you want to connect to.
7. Under Actions, click Set properties - great_outdoors_warehouse , and then click the Connection tab. This connection is configured to connect to a DB2 database. There are many types available for creating connections.
8. Beside the Connection string box, click Edit the connection string . The connection is to a database named GS_DB, and under Signon, a signon has been configured for this connection. You will now examine the signon.
Name: Sharonne Ayers Email: [email protected] TCW Adobe Connect 2021/02/17
Appendix A In t roduct ion to IBM Cognos Analyt ics
© Copyright IBM Corp. 2012, 2016 A-40 Course materials may not be reproduced in whole or in part without the prior written permission of IBM.
9. Click Cancel twice, and then click the great_outdoors_warehouseconnection.This connection includes a single signon named great_outdoors_warehouse.The database signon identifies the user's rights in the database. You can havemultiple database signons that have access to different tables. Within thedatabase, you can create sets of tables with different owners or schemas, andthen provide access to these with the appropriate signon.
10. Under Actions, click Set properties - great_outdoors_warehouse, click theSignon tab, and then click Edit the signon.This signon is configured to connect to the GOSALESDW schema using thecredentials of the GOSALESDW user. The GOSALESDW schema is the objectreferenced in the generated SQL when you examined it in IBM CognosFramework Manager.
11. Close the web browser, closing all tabs if prompted.You have identified how the connection is made to the underlying data source.Next, you will examine the required data source objects as they appear in IBMDB2.
Task 7. Examine underlying data source objects. 1. From the Start menu, navigate to All Programs>IBM Data Studio>Data
Studio 4.1.0.0 Client.2. Click OK to close the Workspace Launcher.3. From the Administration Explorer pane, expand localhost > 50000, and then
double-click GS_DB [DB2 Alias].4. In the Properties for GS_DB window, on the General tab, in the User name
field type db2admin, and then in the Password field type Education1.5. Click the Save password check box, and then click OK.6. Double-click and expand GS_DB.
Notice in the Properties pane at the bottom on the right that the GS_DBdatabase connection is active and folders are displayed. This is the databaseidentified at Task 6, step 6.
Name: Sharonne Ayers Email: [email protected] TCW Adobe Connect 2021/02/17
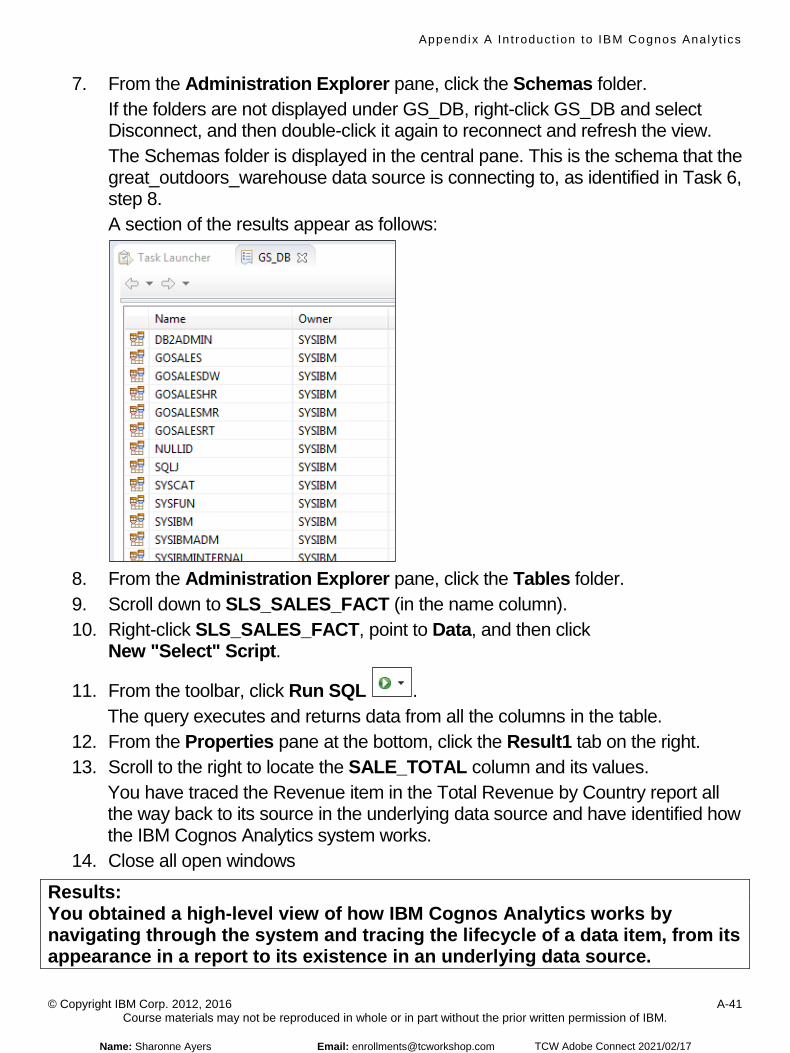
Appendix A In t roduct ion to IBM Cognos Analyt ics
© Copyright IBM Corp. 2012, 2016 A-41 Course materials may not be reproduced in whole or in part without the prior written permission of IBM.
7. From the Administration Explorer pane, click the Schemas folder. If the folders are not displayed under GS_DB, right-click GS_DB and select Disconnect, and then double-click it again to reconnect and refresh the view. The Schemas folder is displayed in the central pane. This is the schema that the great_outdoors_warehouse data source is connecting to, as identified in Task 6, step 8. A section of the results appear as follows:
8. From the Administration Explorer pane, click the Tables folder. 9. Scroll down to SLS_SALES_FACT (in the name column). 10. Right-click SLS_SALES_FACT, point to Data, and then click
New "Select" Script.
11. From the toolbar, click Run SQL . The query executes and returns data from all the columns in the table.
12. From the Properties pane at the bottom, click the Result1 tab on the right. 13. Scroll to the right to locate the SALE_TOTAL column and its values.
You have traced the Revenue item in the Total Revenue by Country report all the way back to its source in the underlying data source and have identified how the IBM Cognos Analytics system works.
14. Close all open windows
Results: You obtained a high-level view of how IBM Cognos Analytics works by navigating through the system and tracing the lifecycle of a data item, from its appearance in a report to its existence in an underlying data source.
Name: Sharonne Ayers Email: [email protected] TCW Adobe Connect 2021/02/17

Thank you for taking a class with us.
We look forward to working with you again soon.
Powered by TCPDF (www.tcpdf.org)Name: Sharonne Ayers Email: [email protected] TCW Adobe Connect 2021/02/17
Related Documents